Trip Generation Characteristics of Free-Standing … · Table 2. Trip generation for free-standing...
4
Trip Generation Characteristics of Free-Standing Discount Superstores FREE-STANDING DI$COUNT SUPERSTORES HAVE GAINED IN POPULARITY BECAUSE OF THEIR CONVENIENCE, COMBINING GENERAL RETAIL MERCHANDISE, FULL- SERVICE GROCERY DEPARTMENTS AND OTHER SPECIALTY SHOPS AT DISCOUNT RATES. THIS STUDY SHOWED A P.M. PEAK-HOUR TRIP GENERATION RATE OF 5.50, SUBSTANTIALLY HIGHER THAN THE STANDARD liE FREE-STANDING DISCOUNT SUPERSTORE P.M. PEAK- HOUR RATE OF 3.87. BY GEORGIENA M. VIVIAN 30 IN THE PAST DECADE, THE NUM- ber of proposed free-standing discount superstores has increased throughout the United States. These stores have contin- ued to gain in popularity because of their convenience, combining general retail merchandise, full-service grocery depart- ments and other specialty shops, such as pharmacies and photo processing, at dis- count rates. Due to this popularity, many localities are growing concerned over the impact of these stores on their communities and infrastructure system. Regarding traffic impacts, an important issue has been raised concerning whether the published Insti- tute of Transportation Engineers (ITE) trip generation rates for fi-ee-standing dis- count superstores are accurate for super- stores that are larger than the average facilitiesdocumented in Trip Generation. This feature provides a summary of a trip generation study prepared for a major discount superstore company located throughout the United States by looking at traffic conditions related to five free- standing discount superstores. INTRODUCTION Trip generation for traffic impact analy- ses typically is conducted using trip genera- tion rates published by ITE. For most retail land uses, traffic impacts are focused on the p.m. peak-hour of adjacent street traffic to determine the needed infrastruc- ture improvements surrounding the store. In the case of free-standing discount superstores, the published trip generation rates are based on sur- veys conducted dur- ing the 1990s and 2000 throughout the United States. It is believed that larger superstores may generate at different rates. It should be noted that: only 10 stores were sur- veyed for the ITE rate; the average size of the stores surveyed in determining the I1'E rate was 161,000 square feet, although many of today's free-standing discount superstores have more than 200,000 square feet (213,210 for pur- poses of this study); and free-standing discount superstores intuitively should have a higher trip generation rate than free-standing discount stores, which by definition do not contain a full-service grocery store but have most of the other amenities of the superstore. This study was undertaken to provide additional information regarding the issues noted above. The principal ques- tion to be addressed in the study was whether today's free-standing discount superstores with sizes greater than 200,000 square feet have different trip generation characteristics than the free- standing discount superstores averaging 161,000 square feet, which were sources of data for ITE Land Use Code 813. The current 1TE category used for a free- standing discount superstore is Land Use Code 813. Discount superstores are free-stand- ing stores with off-street parking. They offer a variety of customer services and centralized cashiering and contain a full- service grocery department under the same roof that shares entrances and exits with the discount superstore area. They typically maintain long store hours, seven days a week. The stores included in this land use often are the only ones on the site, but they also can be found in mutual operation with a related or unrelated garden center and/or service station. They sometimes are found as separate parcels within a retail complex with their own dedicated parking area. L1nd Use Code 815 (free-standing discount store) is a related use. Table 1 depicts the ITE published average daily weekday rate of traffic and the p.m. peak-hour rate of adjacent street traffic for a free-standing discount super- store per 1,000 square feet of gross floor area (GFA). Per the discussion, l;lble 1 ITE JOURNAL / AUGUST 2006
Transcript of Trip Generation Characteristics of Free-Standing … · Table 2. Trip generation for free-standing...
Trip Generation Characteristics of
Free-Standing Discount Superstores
FREE-STANDING DI$COUNT
SUPERSTORES HAVE
GAINED IN POPULARITY
BECAUSE OF THEIR
CONVENIENCE, COMBINING
GENERAL RETAIL
MERCHANDISE, FULL-
SERVICE GROCERY
DEPARTMENTS AND OTHER
SPECIALTY SHOPS AT
DISCOUNT RATES. THIS
STUDY SHOWED A P.M.
PEAK-HOUR TRIP
GENERATION RATE OF 5.50,
SUBSTANTIALLY HIGHER
THAN THE STANDARD liE
FREE-STANDING DISCOUNT
SUPERSTORE P.M. PEAK-
HOUR RATE OF 3.87.
BY GEORGIENA M. VIVIAN
30
IN THE PAST DECADE, THE NUM
ber of proposed free-standing discountsuperstores has increased throughout theUnited States. These stores have contin
ued to gain in popularity because of theirconvenience, combining general retailmerchandise, full-service grocery departments and other specialty shops, such aspharmacies and photo processing, at discount rates.
Due to this popularity, many localitiesare growing concerned over the impact ofthese stores on their communities and
infrastructure system. Regarding trafficimpacts, an important issue has been raisedconcerning whether the published Institute of Transportation Engineers (ITE)trip generation rates for fi-ee-standing discount superstores are accurate for superstores that are larger than the averagefacilitiesdocumented in Trip Generation.
This feature provides a summary of atrip generation study prepared for a majordiscount superstore company locatedthroughout the United States by lookingat traffic conditions related to five free
standing discount superstores.
INTRODUCTION
Trip generation for traffic impact analyses typically is conducted using trip generation rates published by ITE. For mostretail land uses, traffic impacts are focusedon the p.m. peak-hour of adjacent streettraffic to determine the needed infrastruc
ture improvements surrounding the store.In the case of free-standing discount
superstores, the published trip generationrates are based on sur
veys conducted dur
ing the 1990s and2000 throughout the United States.
It is believed that larger superstoresmay generate at different rates. It shouldbe noted that: only 10 stores were surveyed for the ITE rate; the average size ofthe stores surveyed in determining theI1'E rate was 161,000 square feet,
although many of today's free-standingdiscount superstores have more than200,000 square feet (213,210 for purposes of this study); and free-standingdiscount superstores intuitively shouldhave a higher trip generation rate thanfree-standing discount stores, which bydefinition do not contain a full-service
grocery store but have most of the otheramenities of the superstore.
This study was undertaken to provideadditional information regarding theissues noted above. The principal question to be addressed in the study waswhether today's free-standing discountsuperstores with sizes greater than200,000 square feet have different tripgeneration characteristics than the freestanding discount superstores averaging161,000 square feet, which were sourcesof data for ITE Land Use Code 813. The
current 1TE category used for a freestanding discount superstore is Land UseCode 813.
Discount superstores are free-standing stores with off-street parking. Theyoffer a variety of customer services andcentralized cashiering and contain a fullservice grocery department under thesame roof that shares entrances and exits
with the discount superstore area. Theytypically maintain long store hours,seven days a week.
The stores included in this land use
often are the only ones on the site, but theyalso can be found in mutual operationwith a related or unrelated garden centerand/or servicestation. They sometimes arefound as separate parcels within a retailcomplex with their own dedicated parkingarea. L1nd Use Code 815 (free-standingdiscount store) is a related use.
Table 1 depicts the ITE publishedaverage daily weekday rate of traffic andthe p.m. peak-hour rate of adjacent streettraffic for a free-standing discount superstore per 1,000 square feet of gross floorarea (GFA). Per the discussion, l;lble 1
ITE JOURNAL / AUGUST 2006

Table 1. ITE Trip Generation, 7th Edition, Volume 3." '
",. ,
Comparison of published trip generation rates
lYE Free-Standing
"
IT~ Free~StandingDiscount Superstore
Discount StorelYE Shopping Center
(Land Use Code 813)
(Land Use Code ~ 15)(Land Use Code 820)
Number of studies
1047407
Average 1,000 square161
115379feet of CFA
Average weekday tripgeneration rate
49.2156.0242.94
Average p.m. peak-hour trip generation rate per3.87
5.063.751,000 square feet, peak
hour of adjacent street traffic
also includes the tate for Land Use Code
815 for comparison.In addition to the use of the free-stand
ing discount superstore, often when part ofa larger retail development, traffic impactanalysis will' be conducted using the ITErate for Land Use Code 820 (shoppingcenter). For discussion purposes, the shopping center rate also is included in Table 1.
METHODOLOGY
This study included five stores in thestates of Oklahoma and Texas that fit the
ITE definition of free-standing discountsuperstore to estimate their peak-hour tripgeneration. Field review of all locationsincluded a sketch-level drawing of the siteplan, including the driveways to becounted at each location.
Each building's square footage wasattained and calculated either by siteplans obtained from each local jurisdiction in which the superstore was located,by a measuring wheel during field review,or by contact with the store. The squarefootage of the garden center and tire andlube shop were included in the squarefootage calculations.
Staff were positioned at the drivewayopenings and traffic counts at each of thefacilities were conducted on two typicalweekdays (Tuesday, Wednesday and/orThursday) from 4:00 p.m. to 6:00 p.m.The first weekday count was taken inJuly 2003 and the second in October2003. It should be noted that no
inclement weather occurred during eitherseason of the traffic counts. The peak
hour of adjacent traffic was determined
ITE JOURNAL I AUGUST 2006
to be from 4:30 p.m. to 5:30 p.m. andwas used for analysis purposes.
SITE SELECTION
'As defined in ITE's Trip Generation,
7th Edition, free-standing discountsuperstore locations chosen for studyhad dedicated parking, provided generalmerchandise a'nd a grocery store andoperated seven days a week. In addition,it was decided to include only storeswith a size of 200,000 square feet orgreater. Each location is described below,including the type of services (in addition to general merchandise) provided atthat superstore location.
Garden Center/GroceryiPharmacylPhotoCenter/Portrait Studio/Tire and Lube
The GFA totals 210,945 with the garden center and tire and lube shop andcurrently is on the site with no otherdevelopments. Six driveways werecounted for the analysis.
Garden Center/Gas Station/Grocery/
Pharmacy/Photo Center/Portrait Studio/Tire and Lube
The superstore site totals 209,115square feet with the garden center and tireand lube shop. The building has a driveway entrance from a gas station located atthe southwest corner of the property. Foranalysis purposes, the traffic entering inand out of the driveway connecting thegas station and superstore parking lot wascounted and, therefore, the gas station wasexcluded from the analysis. A total of fourdriveways were counted for analysis.
Garden Center/Gas Station/Grocery/
McDonald's/Pharmacy/Photo Center/Portrait Studio/Tire and Lube
The building totals 204,000 squarefeet with the garden center and tire andlube shop and has an additional fourpump gas station of 225 square feet. Forpurposes of this study, the gas station'ssquare footage was not included in theanalysis. Six driveway entrances to theparking lot were counted for the analysis.
Garden Center/Grocery/McDonald's/
Pharmacy/Photo Center/PortraitStudio/Tire and Lube/Vision Center
The superstore site totals 209,000square feet with the garden center andtire and lube shop. Four driveways werecounted for analysis. '
Garden Center/Gas Station/Grocery/
Pharmacy/Photo Center/PortraitStudio/Tire and Lube/Vision Center
The superstore totals 233,000 squarefeet with the garden center and tire andlube shop. Five di'iveways were counted,including a driveway entrance betweenthe parking area for the superstore andanother retail store with a separate driveway entrance.
TRIP GENERATION ANALYSIS
Trip generation was conducted byutilizing the average peak-hour (4:30p.m. to 5:30 p.m.) counts and the squarefootage of each free-standing discountsuperstore to determine the trips per1,000 square feet during the p.m. peakhour. Furthermore, the average trafficturning in and out of the superstore driveways each was divided by total trafficto determine the p.m. peak hour in andout percentages.
The two days of traffic counts (Julyand October 2003) were summarized for
each of the five locations. The averagerate of the two weekday counts for p.m.peak hour traffic and the in and out percentages are calculated in Table 2. Inaddition, Table 3 utilizes the ITE fitted
curve equation for the free-standing discount superstore.
LIMITATIONS OF STUDY
Although this study was conductedusing standards that comply with ITE
31
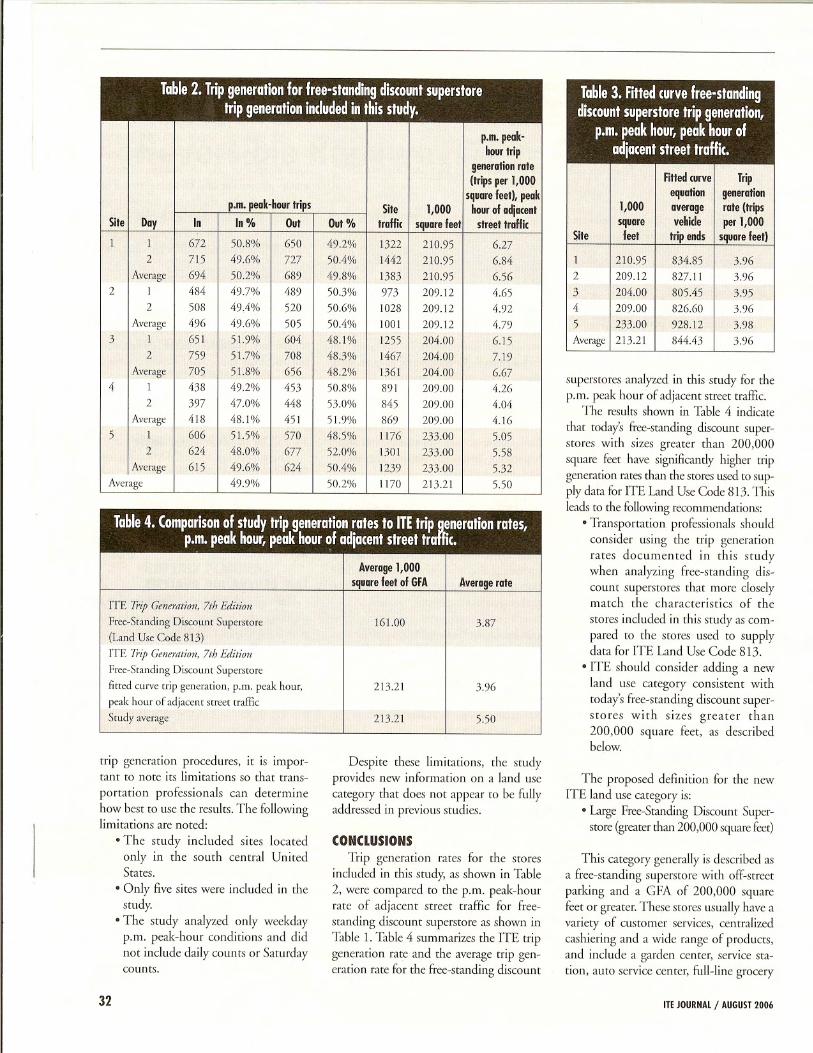
Table 2. Trip generation for free-standing discount superstoretrip generation included in this study ..p.m. peak-
hour tripgeneration rate(trips per 1,000p.m. peak-hour trips
square feet), peak
Site
1,000hour of adjacentSite
Day InIn%OutOut %trafficsquare feetstreet traffic
1
167250.8%65049.2<7\'1322210.956.272
71549.6%72750.4%1442210.956.84
Average
69450.2%68949.8%1383210.956.562
I48449.7%48950.3%973209.124.652
50849.4%52050.6%1028209.124.92
Average
49649.6%50550.4%1001209.124.793
I65151.9%60448.1%1255204.006.152
75951.7%70848.3%1467204.007.19
Average
70551.8%65648.2%1361204.006.674
143849.2%-15350.8%891209.00,j,z62
39747.0%44853.0%845209.004.04
Average
418-18.]%-15151.9%869209.004.165
I60651.5%57048.5%1176233.005.052
62448.0%67752.0%1301233.005.58
Average
61549.6%62450.4%1239233.005.32
Average
49.9%50.2%1170213.215.50
Table 4. Comparison of study trip generation rates to ITEtrip »eneration rates,p.m. peak hour, pea~hour ~f adjacent street tra ic.Average 1,000
square feet of GFA
Average rate
[TE Trip Generation, 7th ECfitionFree-Standing Discount Superstore
] 61.003.87(Land Use Code 813) ITE Trip Generation, 7th EditionFree-Standing Discount Superstoretined curve trip generation, p.m. peak hour,
213.213.96
peak hour of adjacent street trafflc Study average
213.215.50
Table 3. Fitted curve free-standing
discount superstore trip generation,
p.m. peak hour, peak hour of
adjacent street traffic.
Fitted curveTrip
equation
generation
1,000 I
averagerate (trips
square
vehicleper 1,000
Site
feettrip endssquare feet)
1
210.95834.853.962
209.12827.113.96
3
204.00805.453.954
209.00826.603.96
5
233.00928.123.98
Average 213.21
844.433.96
superstores analyzed in this study for thep.m. peak hour of adjacent street traffic.
The results shown in Tlble 4 indicate
that today's fj'ee-standing discount superstores with sizes greater than 200,000square feet have significantly higher tripgeneration rates than the stores used to supply data for ITE bnd Use Code 813. Thisleads to the following recommendations:
• Transportation professionals shouldconsider using the trip generationrates documented in this studywhen analyzing free-standing discount superstores that more closelymatch the characteristics of the
stores included in this study as compared to the stores used to supplydata for ITE Land Use Code 813.
• ITE should consider adding a newland use category consistent withtoday's free-standing discount superstores with sizes greater than200,000 square feet, as describedbelow.
trip generation procedures, it is important to note its limitations so that trans
portation professionals can determinehow best to use the results. The followinglimitations are noted:
• The study included sites locatedonly in the south central UnitedStates.
• Only five sites were included in thestudy.
• The study analyzed only weekdayp.m. peak-hour conditions and didnot include daily counts or Saturdaycounts.
32
Despite these limitations, the studyprovides new information on a land usecategory that does not appear to be fullyaddressed in previous studies .
CONCLUSIONS
Trip generation rates for the storesincluded in this study, as shown in Table2, were compared to the p.m. peak-hourrate of adjacent street traffic for freestanding discount superstore as shown in
Table 1. Table 4 summarizes the ITE tripgeneration rate and the average trip generation rate for the free-standing discount
The proposed definition for the newITE land use category is:
• brge Free-Standing Discount Superstore (greaterthan 200,000 squarefeet)
This category generally is described asa free-standing superstore with off-streetparking and a CFA of 200,000 squarefeet or greater. These stores usually have avariety of customer services, centralizedcashiering and a wide range of products,and include a garden center, service station, auto service center, full-line grocery
ITE JOURNAL / AUGUST 2006

Institute ofTransportation Engineersstore and, often, a f1st-food restaurant
(all inclusive in the CFA).
These stores typically are open 24
hours, seven days a week and often arestand-alone £1cilities, but also can be found
in mutual operation with other retail
store(s). Typically, the discount superstore
will maintain its own dedicated parking
when part of a larger shopping center.
It is recommended that the square
footage used for this category include any
garden centers, tire and lube shops, inter
nal restaurants and external gas station.
This recommendation is made to provide
a common basis for comparison that is'
based on total square footage.
As mentioned previously, the ITE trip
generation rate for a shopping center is
frequently used to develop trip rates for
free-standing discount superstore loca
tions that share parking with other unre
lated retail stores. When preparing traffic
impact assessments, this issue should be
looked at closely because the currently
accepted ITE trip generation rate using
the average rate for a shopping center
during the p.m. peak hour of adjacenttraffic is 3.75, as identified in T1ble 1.•
GEORGIENA M.
VIVIAN
is vice president of
VRPA Technologies
Inc., which she ftunded
in 1988. She has more
than 35 years of experi
ence in transportation
planning and financing, congestion management,
traffic engineering, environmental assessment and
community outret/ch. Specific experience includes
preparation of regional and local transportation
pltlns and programs and Llssociatedenvironmen
tal documents; peer review and development of
tnrfJic impact studies; LIndpreparation of 1/2
percent sales tax plans and impact fie programs
jilr transportation improvements.
Advertise
your
company
productsand
services by
placing abanner ad
on the ITE
Web site!
Placing a banner ad is agreat way to reach ITE's
more than 16,000 membersand other Web site guests.
Target Your Market
When you place a section banner ad onthe ITE Web site, you choose whereyour advertisement is placed. If you arehiring a new employee you may want toplace your banner ad within theEmployment Center. Have a new product line you're looking to promote?Look no further than the TechnicalInformation section.
Increase Your Exposure
Vertical banners are displayed on theleft side of the screen within the navi
gation bar. This means your ad will beseen on almost every page of the ITEWeb sit~! Only one advertiser uses thedesignated space at a time, and thereare only two vertical spaces available.Ads are placed in the order that theyare received.
Please visit www.ite.org/marketing/bannerads.asp
for ad specifications. For availability, please contact
Christina Garneski, Marketing Sales Manager, at
+1 202-289-0222 ext. 128 or [email protected].
Visit www.ite.org/marketing/bannerads.aspto download an order form today!
lIE JOURNAL / AUGUST 2006 37