Trican IR Presentation June 2021 FINAL
18
INVESTOR PRESENTATION June 2021
Transcript of Trican IR Presentation June 2021 FINAL

INVESTOR PRESENTATIONJune 2021

FORWARD LOOKING STATEMENTS
This document contains statements that constitute forward-looking statements within the meaning of applicablesecurities legislation. These forward-looking statements include, among others, the Company’s prospects, expectedrevenues, expenses, profits, expected developments and strategies for its operations, and other expectations, beliefs,plans, goals, objectives, assumptions, information and statements about possible future events, conditions, results ofoperations or performance. These forward-looking statements are identified by their use of terms and phrases suchas “anticipate,” “achieve”, “achievable,” “believe,” “estimate,” “expect,” “intend”, “plan”, “planned”, and other similarterms and phrases. Forward-looking statements are based on current expectations, estimates, projections andassumptions that involve a number of risks and uncertainties, which could cause actual results to differ materially fromthose anticipated. These risks and uncertainties include: fluctuating prices for crude oil and natural gas; changes indrilling activity; general global economic, political and business conditions; weather conditions; regulatory changes;and availability of products, qualified personnel, manufacturing capacity and raw materials. If any of theseuncertainties materialize, or if assumptions are incorrect, actual results may vary materially from those expected.
2

Trican is a leading Canadian energy services company, servicing wells in western Canada for more than 24 years
Our goal is to generate industry leading returns in an environmentally and socially responsible manner
Provide specialized products and services using equipment required for the exploration and development of oil and gas reserves
Trican service lines cover 60% to 70% of a typical new well capital cost
WHO WE ARE
3
Drilling Cycle
Full Cycle Technical Expertise
Completion Cycle
Production Cycle
• Engineering Support• Reservoir Expertise• Laboratory
Services
• Cementing Services • Fracturing
• Coil Tubing
• Coil Tubing• Acidizing• Chemical Services• Remedial
Cementing
CUSTOMER

OUR STRATEGIC PRIORITIES
Achieve top quartile ROICin our sector
- Maintain market leading position in Fracturing and Cementing service lines- Expand coil tubing
Activate parked equipment (if return hurdles can be met)
- Adapt our business approach, integrating ESG to improve valueDifferentiate with new technologies to reduce our environmental impactBuild strong community relationships in the areas we operate
- Return value to shareholders through share buyback program- Sell excess and permanently stranded capital equipment, return funds
to the balance sheet
- Reduce costs for ourselves and our clients through efficiency improvements and scale
Strengthen Existing
Business
ESG
Share-holder Return
Cost Control & Efficiency
Gains
4

WESTERN CANADIAN SEDIMENTARY BASIN FOCUS
Horn River Shale
Montney Shale
Bakken Shale
Cardium Tight Oil
Viking Tight Oil
Lower Shaunavon
Tight Oil
GRANDE PRAIRIEWHITECOURT
HINTON
FORT ST. JOHN
NISKU
RED DEER
BROOKSESTEVAN
British Columbia Alberta Saskatchewan
Deep Basin
Duvernay Shale
CALGARY
Manitoba
Spearfish
MEDICINE HAT
5
Market Leading Positions Canadian market leader in fracturing
services (crewed HHP)
Canadian market leader in cementing services (based on rig count)
Supporting service lines: coil tubing, nitrogen, acid
Trican service line offerings cover approximately 60% to 70% of resource well AFE costs

Hydraulic Fracturing
72%
Cementing18%
Coil Services9%
Other1%
DIVERSIFIED SERVICE LINES
Market Leading Positions Canadian market leader in fracturing
services (based on horsepower)
Canadian market leader in cementing services (based on drilling rigs serviced)
Supporting service lines: coiled tubing, nitrogen and acid
2020 Revenues: Business Unit Breakdown
6

FINANCIAL STRENGTH & RESILIENCY
Strong Financial Position Strong free cash flow generation capability:
• Q1 2021: $21 million (2020: $13 million)• Can fund capital program as well as share buybacks
Low financial leverage:• March 31, 2021: $22.6 million of cash, no bank debt• Clean balance sheet puts us in a strong position to
take advantage of attractive opportunities
Monetizing stranded capital by selling permanently idled assets
• Since 2017, sold $80 million of excess property and equipment at values approximating net book value
• Sold software business in Q1 2021 for cash proceeds of $6.5 million
Positive non-cash working capital of ~ $70 million at March 31, 2021
7
$
$100
$200
$300
$400
$500
$600
$700
$800
-
0.10
0.20
0.30
0.40
0.50
0.60
Q1/
15Q
2/15
Q3/
15Q
4/15
Q1/
16Q
2/16
Q3/
16Q
4/16
Q1/
17Q
2/17
Q3/
17Q
4/17
Q1/
18Q
2/18
Q3/
18Q
4/18
Q1/
19Q
2/19
Q3/
19Q
4/19
Q1/
20Q
2/20
Q3/
20Q
4/20
Q1/
21
Tota
l Deb
t (m
illion
s)
Deb
t / T
angi
ble
Cap
ital
Debt / Tangible Capital
Total Debt (RHS) Debt / Tangible Capital

RETURNING MONEY TO SHAREHOLDERS
Since 2006, Trican has returned over $422 million to shareholders
Invested over $195 million repurchasing more than 27% of the Company’s shares since October 2017
NCIB has been renewed for 2021
8
$-
$50,000
$100,000
$150,000
$200,000
$250,000
$300,000
$350,000
$400,000
$450,000
$-
$20,000
$40,000
$60,000
$80,000
$100,000
$120,000
2006 2008 2010 2012 2014 2016 2018 2020
Cum
ulat
ive
Annu
al
Dividends and Share Repurchases: 2006-2021 ($000's)
Cumulative Dividend (RHS)
Cumulative NCIB (RHS)
Total Annual (LHS)
Total Cumulative (RHS)

RESPONSIBLY IMPROVING EFFICIENCY IN CANADA
9
Reducing our Environmental Impact and Improving Efficiency Trican is committed to becoming an ESG leader in
the WCSB and will issue its first sustainability report in Q3 2021
Recently announced 30,000 HHP Tier 4 fleet, displaces up to 85% of diesel fuel with cleaner burning natural gas, which reduces on site emissions and tanker truck traffic on local roads
Large natural gas dual fuel fleet (~ 170,000 HHP) helps reduce well costs and emissions
Introducing new technology to reduce tractors on location, reduce on site idling, and implementing equipment monitoring technology that will reduce repairs and extend equipment life

RESPONSIBLY IMPROVING EFFICIENCY IN CANADA
10
Reducing our Environmental Impact and Improving Efficiency Fracturing:
• High volume products delivered through bulk logistics, reducing transportation and handling by 50%
• Development of friction reducers that maintain performance in 100% produced water
• Reduced water consumption through use of high viscosity friction reducers to allow for higher sand concentrations
• Introduction of nano surfactants to improve water flowback
Cementing products:• Reduced use of carbon intensive cementitious materials through recycling and alternatives• Provide solutions to mitigate surface casing vent flows
These developments reduce our environmental footprint and reduce costs for our customers
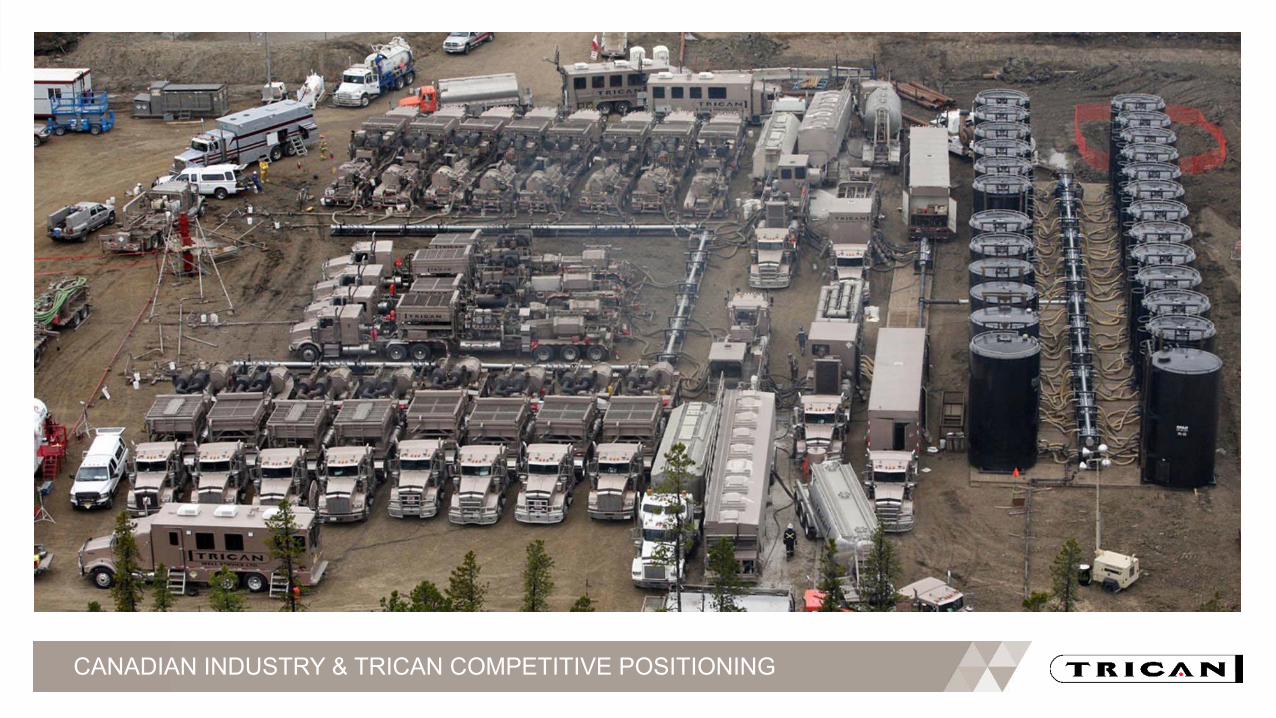
CANADIAN INDUSTRY & TRICAN COMPETITIVE POSITIONING

AVAILABLE CAPACITY
12
Service Line Total Equipment
Active,Manned
Idled
Fracturing (HHP) 569,900 280,000(6 fleets)
289,900(8 fleets)
Cementing (trucks) 49 21 28
Coil Tubing (units) 25 6 19
Existing idle equipment provides opportunity for incremental returns upon a market recovery• Substantial leverage on existing infrastructure
and fixed cost structure upon recovery
• Assets are well-maintained and not scavenged
• Can be activated by adding staff with little capital
• Approximately 8 fracturing fleets parked

CANADIAN INDUSTRY - INCREASED WELL SERVICE INTENSITY
Estimate current fleet supply would be fully utilized with less than 6,000 wells Continue to see an increase in well service intensity as pumping hours per day and proppant volumes per
day continue to increase Proppant placed has increased from 0.6 tonnes / meter in 2014 to 1.9 tonnes / meter in 2020 Increases in service intensity result in more equipment required per well
• Significant ESG benefit resulting from increased well intensity and corresponding reduced well counts
Source: GeoLogic. ~ 1,200 wells currently captured for 2020 Source: Industry reports and internal estimates
13
510 594
878 1,080
1,298
1,570 1,696
1,896
- 200 400 600 800
1,000 1,200 1,400 1,600 1,800 2,000
2013 2014 2015 2016 2017 2018 2019 2020
WCSB – Tonnes / Well
10,853 10,924
5,376 3,963
6,959 6,648
4,810
2,963 3,604 4,114
-
2,000
4,000
6,000
8,000
10,000
12,000
2013 2014 2015 2016 2017 2018 2019 2020E 2021E 2022E
WCSB - Wells Drilled

FRACTURING COMPETITIVE LANDSCAPE
14
* Smaller crews may not be suitable for higher intensity playsSource: Company reports and internal estimates
Canadian competitive landscape more consolidated than the U.S. market
Expect an increase in active crewed fleets through the first half of 2021
Larger crew sizes from increased concentration of Montney / Deep Basin / Duvernay completions
CANADIAN CAPACITY Q1 2021
Hydraulic Horsepower (HHP)
Capacity Active Crewed
Fleets
Trican 569,900 280,000 6
Competitor A 275,000 202,000 4
Competitor B 282,500 200,000 4
Competitor C 170,000 50,000 1
Competitor D 250,000 160,000 3
Competitor E 175,000 150,000 3
Competitor F* 100,000 100,000 3
Competitor G* 75,000 75,000 4
1,897,400 1,217,000 28

WELL SERVICES
Cement: Cement operations track very closely with
drilling rig activity
Longer laterals have increased cement requirements
Historically generated positive return on capital despite recent market challenges
Coil: Adjusting business to current market
20 more units to add back into the market with little to no capital investment required
15
Source: Rig Locator, JuneWarren-Nickle’s Energy Group
-
100
200
300
400
500
600
700
2010 2011 2012 2013 2014 2015 2016 2017 2018 2019 2020 2021
Average Canadian Rig Count
12 Month Avg. 60 Day Avg.

ALIGNING COST STRUCTURE TO NEW CANADIAN MARKET
Lean, efficient organization:• Reduced fixed personnel costs by over 55%
since Q1/20
• Parked half of our active equipment
• Lowered capital spending to essential maintenance capital: estimated to be 3% to 5% of revenue in 2021
• Closely monitoring market conditions in 2021 and will adjust the size of operations and our cost structure to ensure positive operating cash flow
16

ENVIRONMENT, SOCIAL AND GOVERNANCE
Safety
Our frontline workers face dangers that are not typical in most office workplace environments; therefore, it is imperative we remain committed to safety.
A common measure for our safety performance is Lost Time Injury Rate (LTIR).
Trican has not accrued a Lost Time Injury since December of 2019.
Robust COVID safety protocols and response plan in place.
People Development
Since 2017 we have invested over 200,000 hours of training time into our people.
Providing a safe and productive work environment that results in quality service means training our people.
Majority of our operational people are trained as Class 1 driver trainers.
Trican’s driver trainer program has allowed us to maintain our driver trainer status despite significantly increased regulations.
Environment
Trican and its customers adhere to strict environmental policies and regulations.
Trican has product offerings to reduce freshwater consumption while not impacting well productivity.
Trican has the largest fleet of dual fuel fracturing pumps and is continuing to invest in more technology such as tractorless operations, idle reduction and equipment monitoring technology that will reduce repairs and extend equipment life.
Our primary focus areas are:
17

INVESTMENT SUMMARY
RET
UR
NS
• ROIC and capital discipline, focused on shareholder returns
• Operating efficiencies will drive free cash flow and profitability
• Adapting our business, integrating ESG to improve stakeholder valueST
REN
GTH
• Largest Canadian pressure pumping company with broad service offering
• Strong customer service, resulting in loyal customer base
• Low debt positions allow Trican to withstand near-term weakness
• Strong asset coverage OPP
OR
TUN
ITY • Equipment capacity
for incremental returns upon a market recovery
• Financial position for opportunistic differentiation to improve returns
• Minimal customer growth required to balance market
18