TREVI – Finanziaria Industriale S.p.A. · PDF fileTREVI – Finanziaria Industriale...
192
TREVI – Finanziaria Industriale S.p.A. Financial Statements and Consolidated Financial Statements at 31 December 2016 TREVI – Finanziaria Industriale S.p.A. Registered Office Cesena (Forlì-Cesena) – Via Larga 201 – Italy Share capital Euro 82,391,632.50 fully paid-up Forlì – Cesena Chamber of Commerce Business Register no. 201,271 Tax code, VAT no. and Forlì – Cesena Business Registry: 01547370401 Website: www.trevifin.com
Transcript of TREVI – Finanziaria Industriale S.p.A. · PDF fileTREVI – Finanziaria Industriale...
TREVI – Finanziaria Industriale S.p.A. Financial Statements and Consolidated Financial Statements at
31 December 2016
TREVI – Finanziaria Industriale S.p.A. Registered Office Cesena (Forlì-Cesena) – Via Larga 201 – Italy
Share capital Euro 82,391,632.50 fully paid-up Forlì – Cesena Chamber of Commerce Business Register no. 201,271
Tax code, VAT no. and Forlì – Cesena Business Registry: 01547370401 Website: www.trevifin.com
2
CONTENTS
KEY FINANCIAL FIGURES OF THE GROUP Board of Directors’ Report on Operations for the Consolidated and Parent Company Financial Statements. CONSOLIDATED FINANCIAL STATEMENTS AT 31 DECEMBER 20 16 Consolidated Statement of Financial Position, Consolidated Income Statement, Consolidated Statement of Comprehensive Income, Consolidated Statement of Changes in Net Equity, Consolidated Statement of Cash Flows Explanatory Notes to the Consolidated Financial Statements Appendices to the Explanatory Notes to the Consolidated Financial Statements Independent Auditors’ Report pursuant to Articles 14 and 16 of Legislative Decree 27.1.2010, no.39 Report of the Board of Statutory Auditors pursuant to Article 153 of Legislative Decree no. 58/1998 and of Article 2429 paragraph 3 of the Italian Civil Code. FINANCIAL STATEMENTS AT 31 DECEMBER 2016
Statement of Financial Position, Income Statement, Statement of Comprehensive Income, Statement of Changes in Net Equity, Statement of Cash Flows Explanatory Notes to the Financial Statements Independent Auditors’ Report pursuant to Articles 14 and 16 of Legislative Decree 27.1.2010, no.39
3
MEMBERS OF THE CORPORATE BODIES CHAIRMAN Davide Trevisani EXECUTIVE DEPUTY CHAIRMAN Gianluigi Trevisani DEPUTY CHAIRMAN Cesare Trevisani MANAGING DIRECTOR Stefano Trevisani BOARD OF DIRECTORS Marta Dassù (Non-executive and independent director) Umberto della Sala (Non-executive and independent director) Cristina Finocchi Mahne (Non-executive and independent director) Monica Mondardini (Non-executive and independent director) Guido Rivolta (Non-executive director) Rita Rolli (Non-executive and independent director) Simone Trevisani (Executive director) BOARD OF STATUTORY AUDITORS Standing Statutory Auditors Milena Motta (Chairperson) Adolfo Leonardi Giancarlo Poletti
Supplementary Statutory Auditors Marta Maggi Stefano Leardini
OTHER CORPORATE BODIES Director responsible for the internal control system and risk management Gianluigi Trevisani Risk Management Committee Monica Mondardini (Chairperson) Cristina Finocchi Mahne Rita Rolli
Committee to oversee the Organisational Model Luca Moretti (Chairperson and internal member) Floriana Francesconi Enzo Spisni
Director of Administration, Finance and Control Daniele Forti Appointed Manager responsible for the preparation of company accounts by the Board of Directors on 14 May 2007 Lead Independent Director Monica Mondardini Audit Firm Reconta Ernst &Young S.p.A. (Appointed on 29 April 2008 and until the Shareholders’ Meeting to approve the Financial Statements at 31 December 2016)
4
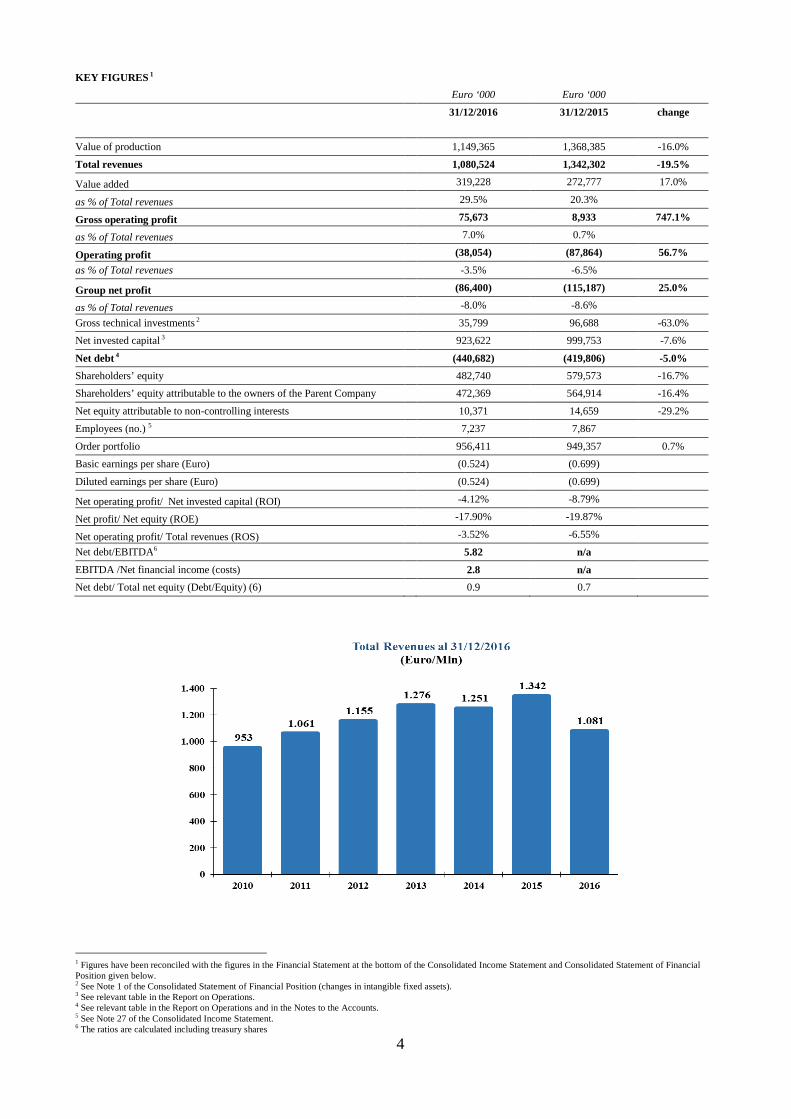
KEY FIGURES 1
Euro ‘000 Euro ‘000
31/12/2016 31/12/2015 change
Value of production 1,149,365 1,368,385 -16.0%
Total revenues 1,080,524 1,342,302 -19.5%
Value added 319,228 272,777 17.0%
as % of Total revenues 29.5% 20.3%
Gross operating profit 75,673 8,933 747.1%
as % of Total revenues 7.0% 0.7%
Operating profit (38,054) (87,864) 56.7%
as % of Total revenues -3.5% -6.5%
Group net profit (86,400) (115,187) 25.0%
as % of Total revenues -8.0% -8.6%
Gross technical investments 2 35,799 96,688 -63.0%
Net invested capital 3 923,622 999,753 -7.6%
Net debt 4 (440,682) (419,806) -5.0%
Shareholders’ equity 482,740 579,573 -16.7%
Shareholders’ equity attributable to the owners of the Parent Company 472,369 564,914 -16.4%
Net equity attributable to non-controlling interests 10,371 14,659 -29.2%
Employees (no.) 5 7,237 7,867
Order portfolio 956,411 949,357 0.7%
Basic earnings per share (Euro) (0.524) (0.699)
Diluted earnings per share (Euro) (0.524) (0.699)
Net operating profit/ Net invested capital (ROI) -4.12% -8.79%
Net profit/ Net equity (ROE) -17.90% -19.87%
Net operating profit/ Total revenues (ROS) -3.52% -6.55%
Net debt/EBITDA6 5.82 n/a EBITDA /Net financial income (costs) 2.8 n/a
Net debt/ Total net equity (Debt/Equity) (6) 0.9 0.7
1 Figures have been reconciled with the figures in the Financial Statement at the bottom of the Consolidated Income Statement and Consolidated Statement of Financial Position given below. 2 See Note 1 of the Consolidated Statement of Financial Position (changes in intangible fixed assets). 3 See relevant table in the Report on Operations. 4 See relevant table in the Report on Operations and in the Notes to the Accounts. 5 See Note 27 of the Consolidated Income Statement. 6 The ratios are calculated including treasury shares
5
BOARD OF DIRECTORS’ REPORT ON OPERATIONS FOR THE CO NSOLIDATED AND
PARENT COMPANY FINANCIAL STATEMENTS AT 31 DECEMBER 2016
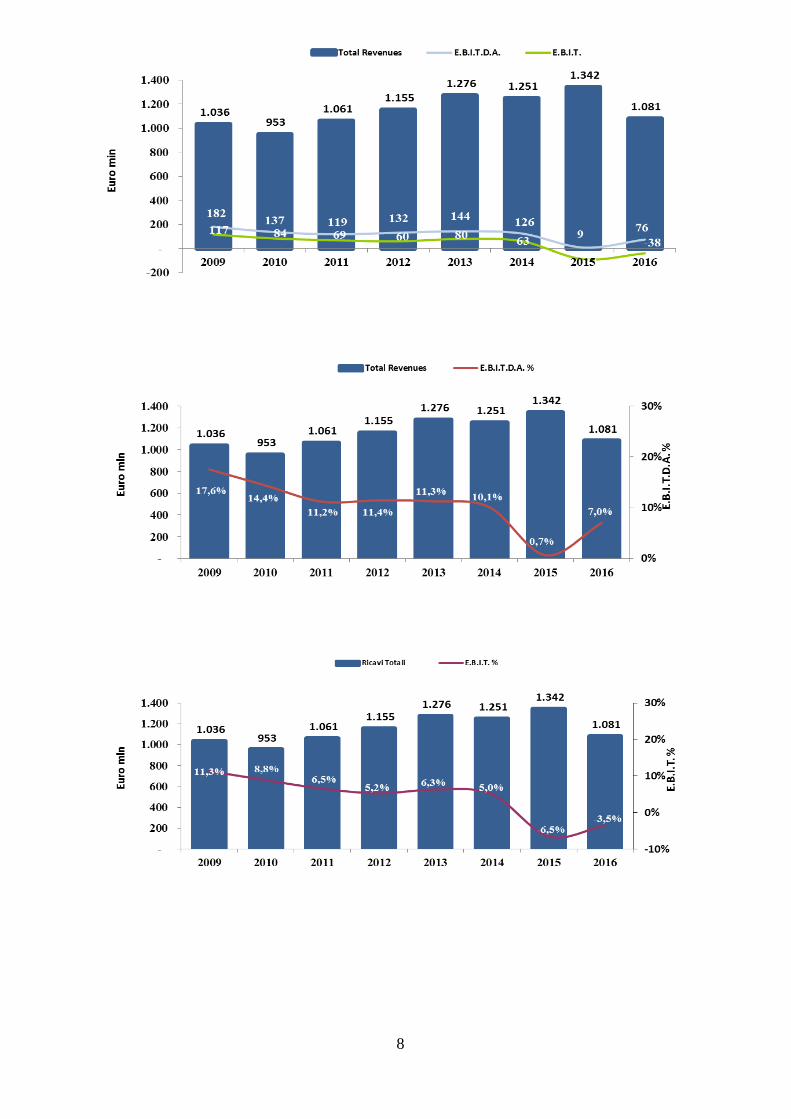
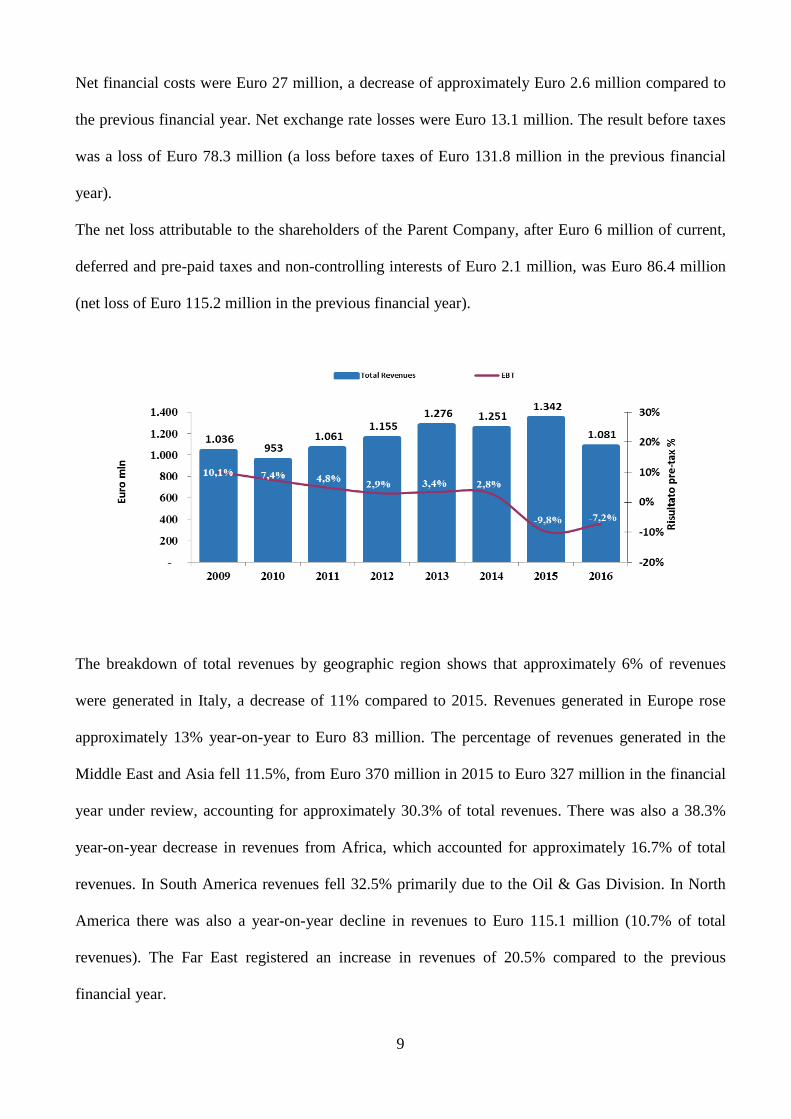
Dear shareholders, In the 2016 financial year, consolidated revenues were approximately Euro 1,080 million with the
Special Foundations Division accounting for approximately 76% of total revenues and the Oil & Gas
Division decreasing to approximately 24% of revenues.
The order portfolio was almost unchanged compared to the end of the previous financial year at
approximately Euro 960 million (+0.7%), of which 80% is due to be completed in 2017.
EBITDA was Euro 75.7 million, a margin of 7% of total revenues (Euro 8.9 million in 2015). The
Group net result was a loss of Euro 86.4 million (a loss of Euro 115 million in 2015). Net debt was
almost unchanged compared to 2015 (+5%).
Following a broadly positive first semester that closed with Group financial ratios that were highly
satisfactory, in the second semester there was a significant decrease in the order portfolio of the Oil
& Gas Division. The continued negative performance of the global energy sector in 2016 forced oil
companies to reschedule their investments in research and exploration and also in extraction from
existing oil fields.
However, by year-end, there were concrete signs that the oil price would stabilise, particularly in the
second half of 2017, which increased expectations of a recovery in the long-term. This was
confirmed by Drillmec winning an important contract to supply its technologically advanced and
highly efficient oil rigs to Bolivia. A cost reduction programme is being implemented not only in the
Oil & Gas sector but across the Group that is aimed at ensuring it remains ready and adaptable to
tackle new and important contracts.
Although there continues to be no signs of recovery in the domestic construction market, the Group,
which for years has had its main focus in markets outside Europe, finalised contracts for several
important projects in the USA and in the Middle East, the largest of which was for the repairs to the
Mosul Dam in Iraq. This is a highly technological project given the logistical challenges involved
6
and the sensitivity of the area in which it is located. However, it is an affirmation of the experience,
capability and adaptibility of TREVI in facing highly complex engineering challenges – the practical
demonstration of which was the unanimous approval won by TREVI from the three countries
involved in the contract: Italy, Iraq and the United States.
Our task remains that of ensuruing both operating segments achieve solid profitability and balanced
growth while respecting risk and financial ratios and, at the same time, ensuring an improvement in
the Group’s worldwide execution ability.
7
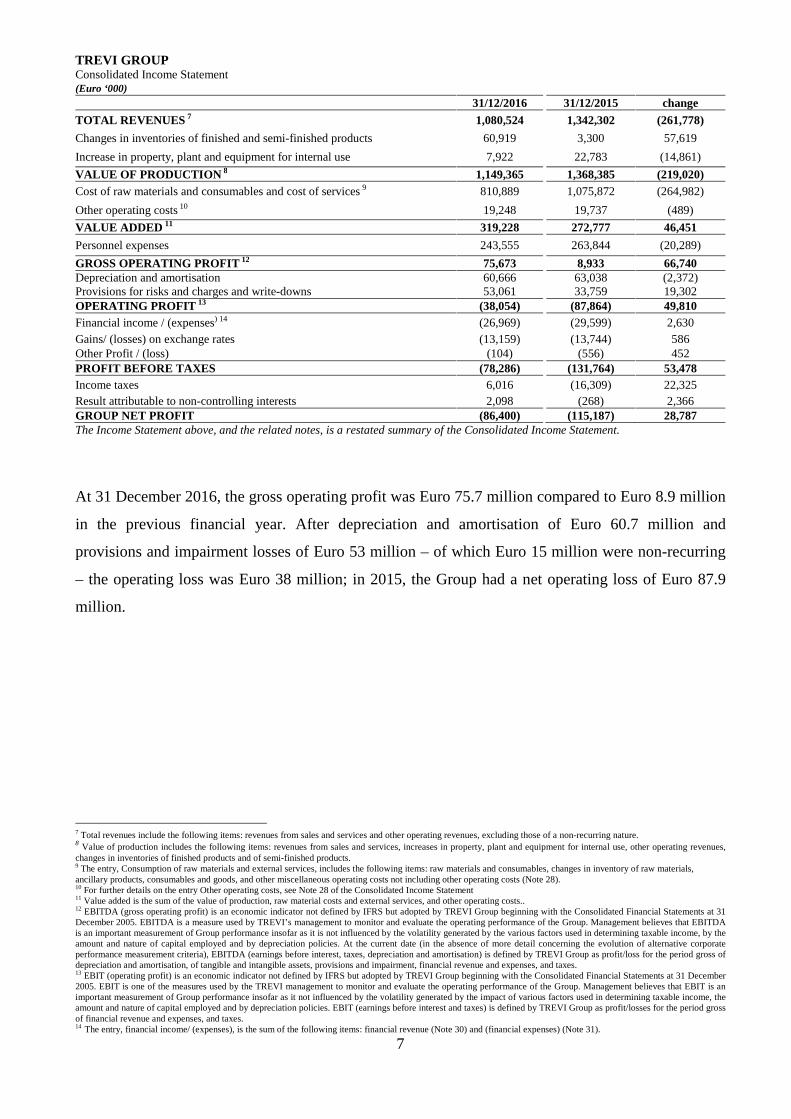
TREVI GROUP Consolidated Income Statement (Euro ‘000) 31/12/2016 31/12/2015 change TOTAL REVENUES 7 1,080,524 1,342,302 (261,778)
Changes in inventories of finished and semi-finished products 60,919 3,300 57,619
Increase in property, plant and equipment for internal use 7,922 22,783 (14,861)
VALUE OF PRODUCTION 8 1,149,365 1,368,385 (219,020) Cost of raw materials and consumables and cost of services 9 810,889 1,075,872 (264,982)
Other operating costs 10 19,248 19,737 (489)
VALUE ADDED 11 319,228 272,777 46,451
Personnel expenses 243,555 263,844 (20,289)
GROSS OPERATING PROFIT 12 75,673 8,933 66,740 Depreciation and amortisation 60,666 63,038 (2,372) Provisions for risks and charges and write-downs 53,061 33,759 19,302 OPERATING PROFIT 13 (38,054) (87,864) 49,810 Financial income / (expenses) 14 (26,969) (29,599) 2,630 Gains/ (losses) on exchange rates (13,159) (13,744) 586 Other Profit / (loss) (104) (556) 452 PROFIT BEFORE TAXES (78,286) (131,764) 53,478 Income taxes 6,016 (16,309) 22,325 Result attributable to non-controlling interests 2,098 (268) 2,366 GROUP NET PROFIT (86,400) (115,187) 28,787 The Income Statement above, and the related notes, is a restated summary of the Consolidated Income Statement.
At 31 December 2016, the gross operating profit was Euro 75.7 million compared to Euro 8.9 million
in the previous financial year. After depreciation and amortisation of Euro 60.7 million and
provisions and impairment losses of Euro 53 million – of which Euro 15 million were non-recurring
– the operating loss was Euro 38 million; in 2015, the Group had a net operating loss of Euro 87.9
million.
7 Total revenues include the following items: revenues from sales and services and other operating revenues, excluding those of a non-recurring nature. 8 Value of production includes the following items: revenues from sales and services, increases in property, plant and equipment for internal use, other operating revenues, changes in inventories of finished products and of semi-finished products. 9 The entry, Consumption of raw materials and external services, includes the following items: raw materials and consumables, changes in inventory of raw materials, ancillary products, consumables and goods, and other miscellaneous operating costs not including other operating costs (Note 28). 10 For further details on the entry Other operating costs, see Note 28 of the Consolidated Income Statement 11 Value added is the sum of the value of production, raw material costs and external services, and other operating costs.. 12 EBITDA (gross operating profit) is an economic indicator not defined by IFRS but adopted by TREVI Group beginning with the Consolidated Financial Statements at 31 December 2005. EBITDA is a measure used by TREVI’s management to monitor and evaluate the operating performance of the Group. Management believes that EBITDA is an important measurement of Group performance insofar as it is not influenced by the volatility generated by the various factors used in determining taxable income, by the amount and nature of capital employed and by depreciation policies. At the current date (in the absence of more detail concerning the evolution of alternative corporate performance measurement criteria), EBITDA (earnings before interest, taxes, depreciation and amortisation) is defined by TREVI Group as profit/loss for the period gross of depreciation and amortisation, of tangible and intangible assets, provisions and impairment, financial revenue and expenses, and taxes. 13 EBIT (operating profit) is an economic indicator not defined by IFRS but adopted by TREVI Group beginning with the Consolidated Financial Statements at 31 December 2005. EBIT is one of the measures used by the TREVI management to monitor and evaluate the operating performance of the Group. Management believes that EBIT is an important measurement of Group performance insofar as it not influenced by the volatility generated by the impact of various factors used in determining taxable income, the amount and nature of capital employed and by depreciation policies. EBIT (earnings before interest and taxes) is defined by TREVI Group as profit/losses for the period gross of financial revenue and expenses, and taxes. 14 The entry, financial income/ (expenses), is the sum of the following items: financial revenue (Note 30) and (financial expenses) (Note 31).
8
9
Net financial costs were Euro 27 million, a decrease of approximately Euro 2.6 million compared to
the previous financial year. Net exchange rate losses were Euro 13.1 million. The result before taxes
was a loss of Euro 78.3 million (a loss before taxes of Euro 131.8 million in the previous financial
year).
The net loss attributable to the shareholders of the Parent Company, after Euro 6 million of current,
deferred and pre-paid taxes and non-controlling interests of Euro 2.1 million, was Euro 86.4 million
(net loss of Euro 115.2 million in the previous financial year).
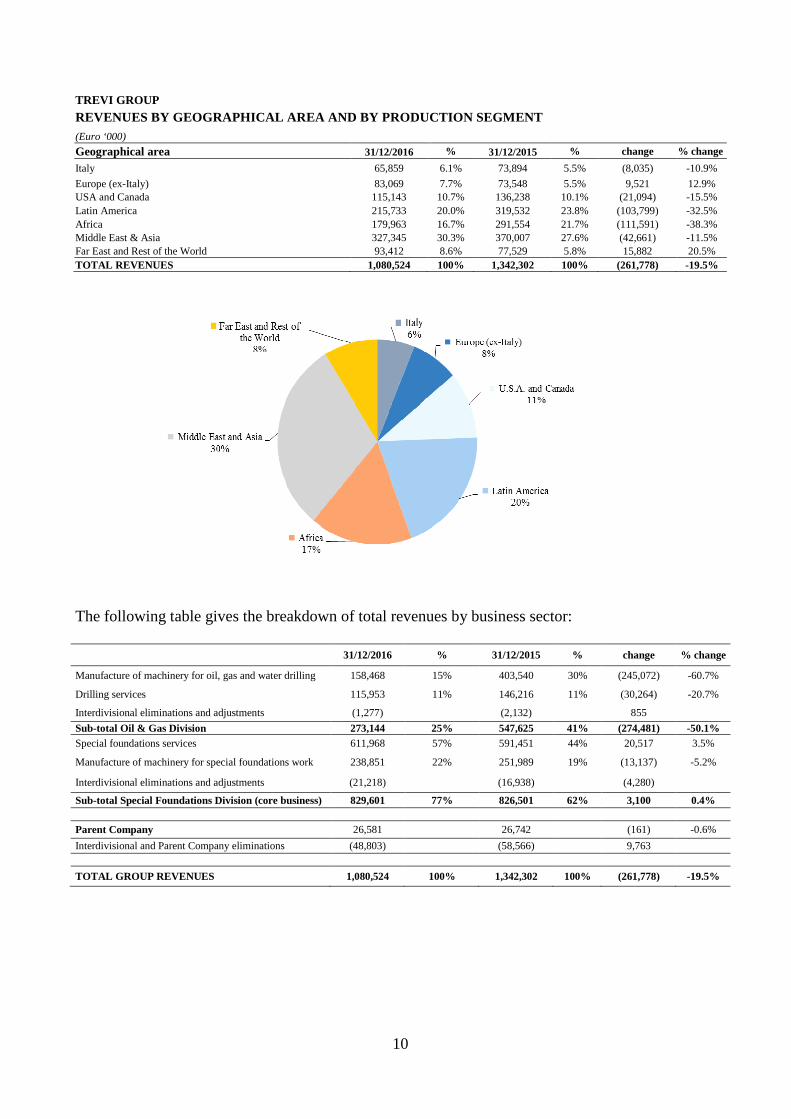
The breakdown of total revenues by geographic region shows that approximately 6% of revenues
were generated in Italy, a decrease of 11% compared to 2015. Revenues generated in Europe rose
approximately 13% year-on-year to Euro 83 million. The percentage of revenues generated in the
Middle East and Asia fell 11.5%, from Euro 370 million in 2015 to Euro 327 million in the financial
year under review, accounting for approximately 30.3% of total revenues. There was also a 38.3%
year-on-year decrease in revenues from Africa, which accounted for approximately 16.7% of total
revenues. In South America revenues fell 32.5% primarily due to the Oil & Gas Division. In North
America there was also a year-on-year decline in revenues to Euro 115.1 million (10.7% of total
revenues). The Far East registered an increase in revenues of 20.5% compared to the previous
financial year.
10
TREVI GROUP
REVENUES BY GEOGRAPHICAL AREA AND BY PRODUCTION SEG MENT
(Euro ‘000)
Geographical area 31/12/2016 % 31/12/2015 % change % change
Italy 65,859 6.1% 73,894 5.5% (8,035) -10.9%
Europe (ex-Italy) 83,069 7.7% 73,548 5.5% 9,521 12.9% USA and Canada 115,143 10.7% 136,238 10.1% (21,094) -15.5% Latin America 215,733 20.0% 319,532 23.8% (103,799) -32.5% Africa 179,963 16.7% 291,554 21.7% (111,591) -38.3% Middle East & Asia 327,345 30.3% 370,007 27.6% (42,661) -11.5% Far East and Rest of the World 93,412 8.6% 77,529 5.8% 15,882 20.5% TOTAL REVENUES 1,080,524 100% 1,342,302 100% (261,778) -19.5%
The following table gives the breakdown of total revenues by business sector:
31/12/2016 % 31/12/2015 % change % change
Manufacture of machinery for oil, gas and water drilling 158,468 15% 403,540 30% (245,072) -60.7%
Drilling services 115,953 11% 146,216 11% (30,264) -20.7%
Interdivisional eliminations and adjustments (1,277) (2,132) 855
Sub-total Oil & Gas Division 273,144 25% 547,625 41% (274,481) -50.1% Special foundations services 611,968 57% 591,451 44% 20,517 3.5%
Manufacture of machinery for special foundations work 238,851 22% 251,989 19% (13,137) -5.2%
Interdivisional eliminations and adjustments (21,218) (16,938) (4,280)
Sub-total Special Foundations Division (core business) 829,601 77% 826,501 62% 3,100 0.4% Parent Company 26,581 26,742 (161) -0.6%
Interdivisional and Parent Company eliminations (48,803) (58,566) 9,763
TOTAL GROUP REVENUES 1,080,524 100% 1,342,302 100% (261,778) -19.5%
11
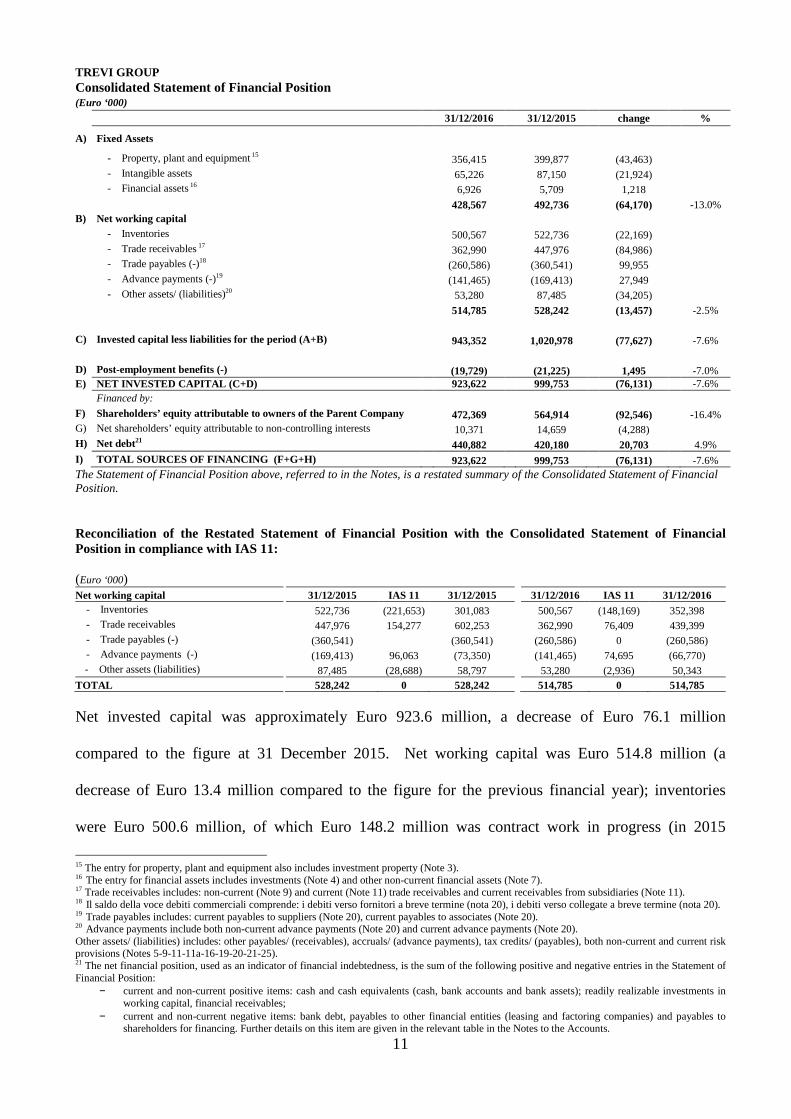
TREVI GROUP Consolidated Statement of Financial Position (Euro ‘000)
31/12/2016 31/12/2015 change %
A) Fixed Assets
- Property, plant and equipment 15 356,415 399,877 (43,463) - Intangible assets 65,226 87,150 (21,924) - Financial assets 16 6,926 5,709 1,218 428,567 492,736 (64,170) -13.0% B) Net working capital
- Inventories 500,567 522,736 (22,169) - Trade receivables 17 362,990 447,976 (84,986) - Trade payables (-)18 (260,586) (360,541) 99,955 - Advance payments (-)19 (141,465) (169,413) 27,949 - Other assets/ (liabilities)20 53,280 87,485 (34,205) 514,785 528,242 (13,457) -2.5% C) Invested capital less liabilities for the period (A+B) 943,352 1,020,978 (77,627) -7.6% D) Post-employment benefits (-) (19,729) (21,225) 1,495 -7.0% E) NET INVESTED CAPITAL (C+D) 923,622 999,753 (76,131) -7.6% Financed by:
F) Shareholders’ equity attributable to owners of the Parent Company 472,369 564,914 (92,546) -16.4% G) Net shareholders’ equity attributable to non-controlling interests 10,371 14,659 (4,288) H) Net debt21 440,882 420,180 20,703 4.9% I) TOTAL SOURCES OF FINANCING (F+G+H) 923,622 999,753 (76,131) -7.6% The Statement of Financial Position above, referred to in the Notes, is a restated summary of the Consolidated Statement of Financial Position. Reconciliation of the Restated Statement of Financial Position with the Consolidated Statement of Financial Position in compliance with IAS 11: (Euro ‘000) Net working capital 31/12/2015 IAS 11 31/12/2015 31/12/2016 IAS 11 31/12/2016 - Inventories 522,736 (221,653) 301,083 500,567 (148,169) 352,398 - Trade receivables 447,976 154,277 602,253 362,990 76,409 439,399 - Trade payables (-) (360,541) (360,541) (260,586) 0 (260,586) - Advance payments (-) (169,413) 96,063 (73,350) (141,465) 74,695 (66,770)
- Other assets (liabilities) 87,485 (28,688) 58,797 53,280 (2,936) 50,343 TOTAL 528,242 0 528,242 514,785 0 514,785
Net invested capital was approximately Euro 923.6 million, a decrease of Euro 76.1 million
compared to the figure at 31 December 2015. Net working capital was Euro 514.8 million (a
decrease of Euro 13.4 million compared to the figure for the previous financial year); inventories
were Euro 500.6 million, of which Euro 148.2 million was contract work in progress (in 2015
15 The entry for property, plant and equipment also includes investment property (Note 3). 16 The entry for financial assets includes investments (Note 4) and other non-current financial assets (Note 7).
17 Trade receivables includes: non-current (Note 9) and current (Note 11) trade receivables and current receivables from subsidiaries (Note 11). 18 Il saldo della voce debiti commerciali comprende: i debiti verso fornitori a breve termine (nota 20), i debiti verso collegate a breve termine (nota 20).
19 Trade payables includes: current payables to suppliers (Note 20), current payables to associates (Note 20).
20 Advance payments include both non-current advance payments (Note 20) and current advance payments (Note 20).
Other assets/ (liabilities) includes: other payables/ (receivables), accruals/ (advance payments), tax credits/ (payables), both non-current and current risk provisions (Notes 5-9-11-11a-16-19-20-21-25). 21 The net financial position, used as an indicator of financial indebtedness, is the sum of the following positive and negative entries in the Statement of Financial Position:
− current and non-current positive items: cash and cash equivalents (cash, bank accounts and bank assets); readily realizable investments in working capital, financial receivables;
− current and non-current negative items: bank debt, payables to other financial entities (leasing and factoring companies) and payables to shareholders for financing. Further details on this item are given in the relevant table in the Notes to the Accounts.
12
contract work in progress was Euro 221.6 million). Property, plant and equipment totalled Euro 428.5
million (-13%). Group net equity decreased by approximately Euro 92.5 million (-16.4%).
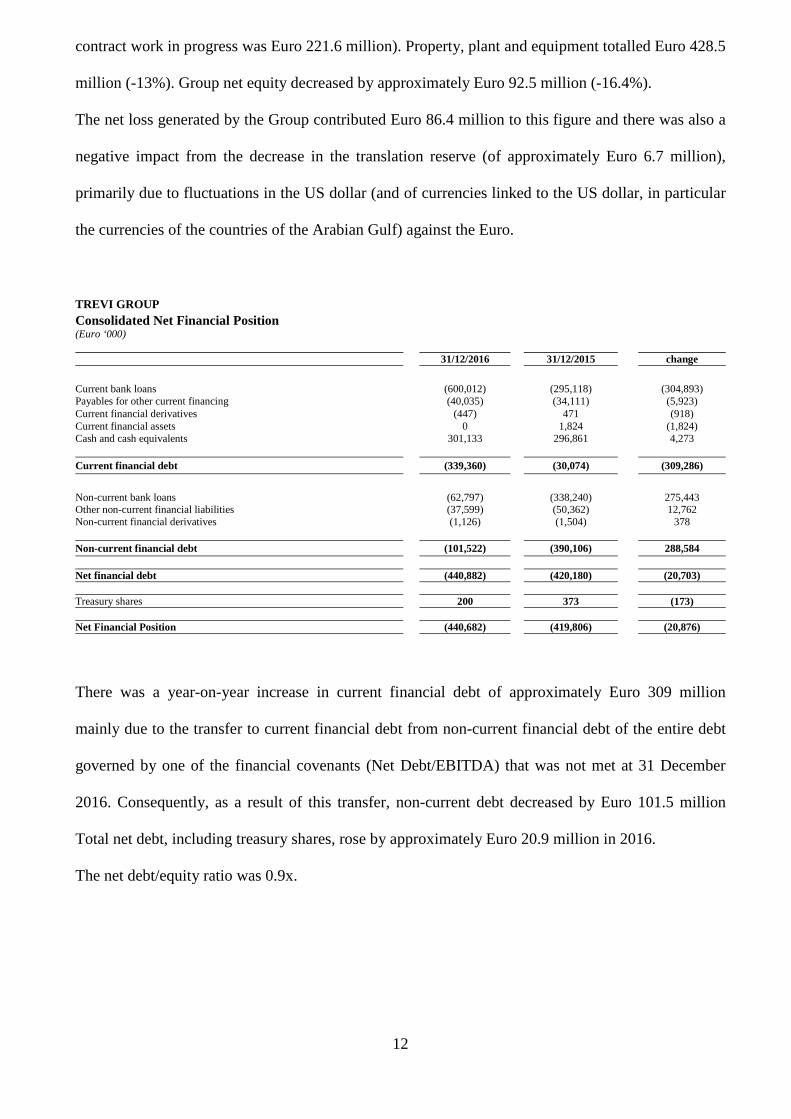
The net loss generated by the Group contributed Euro 86.4 million to this figure and there was also a
negative impact from the decrease in the translation reserve (of approximately Euro 6.7 million),
primarily due to fluctuations in the US dollar (and of currencies linked to the US dollar, in particular
the currencies of the countries of the Arabian Gulf) against the Euro.
TREVI GROUP Consolidated Net Financial Position (Euro ‘000)
31/12/2016 31/12/2015 change
Current bank loans (600,012) (295,118) (304,893) Payables for other current financing (40,035) (34,111) (5,923) Current financial derivatives (447) 471 (918) Current financial assets 0 1,824 (1,824) Cash and cash equivalents 301,133 296,861 4,273
Current financial debt (339,360) (30,074) (309,286)
Non-current bank loans (62,797) (338,240) 275,443 Other non-current financial liabilities (37,599) (50,362) 12,762 Non-current financial derivatives (1,126) (1,504) 378 Non-current financial debt (101,522) (390,106) 288,584 Net financial debt (440,882) (420,180) (20,703) Treasury shares 200 373 (173) Net Financial Position (440,682) (419,806) (20,876)
There was a year-on-year increase in current financial debt of approximately Euro 309 million
mainly due to the transfer to current financial debt from non-current financial debt of the entire debt
governed by one of the financial covenants (Net Debt/EBITDA) that was not met at 31 December
2016. Consequently, as a result of this transfer, non-current debt decreased by Euro 101.5 million
Total net debt, including treasury shares, rose by approximately Euro 20.9 million in 2016.
The net debt/equity ratio was 0.9x.
13
Free Cash Flow 22 was Euro 22.6 million (Euro 2 million in 2015) and was affected by Euro 13.4
million of changes in net working capital and by approximately Euro 7.4 million of investments in
tangible and intangible assets net of exchange rate translation effects.
Investments
Gross investments in property, plant and equipment by the TREVI Group were approximately Euro
33 million in the 2016 financial year and were for the acquisition of plant and machinery for the Oil
& Gas and Special Foundations Divisions.
The most significant investments were those made in the Middle East and Latin America.
Divestments totalled approximately Euro 18 million net of depreciation. Depreciation and
amortisation of property, plant and equipment totalled Euro 50 million. At 31 December 2016, the
net value of property, plant and equipment was Euro 356.4 million (approximately Euro 400 million
at 31 December 2015) including Euro 9.9 million of negative translation differences caused by the
difference between historic exchange rates and those prevailing at 31 December 2016.
Research and Development
The research and development efforts of Drillmec concentrated on bringing to market a range of
innovative products that focused on automation and also a range of accessories and services that
would generate considerably higher average profitability than that realised on the sale of single units
of plant and equipment.
The research and development activities of Drillmec in 2016 - in addition to executing orders
acquired - also had the following objectives:
1. To develop new MPD (managing pressure drilling) technologies and applications for HOD
(heart of drilling) in oil and geothermal drilling;
2. To review the range of mud pumps in order to reduce production costs and develop new
proprietary technologies, in particular for the FE mud pumps;
22 Free Cash Flow is not defined by the IFRS but has been used by the TREVI Group since the Consolidated Financial Statements at 31 December 2005;
it is a Statement of Financial Position indicator calculated by subtracting the taxes of the period, provisions, depreciation and amortisation, changes in
net working capital and gross investments for the period from the EBIT for the financial period.
14
3. To develop 4.0 software for resident technologies and for IoT (Internet of things) technologies
together with other Group companies;
4. To develop a 1500 HP package for shale gas.
As regards the first point, during the financial year under review several patents that had been
registered in periods prior to 2016 were granted and field tests were carried out.
As regards the second point, various technical and economic feasibility studies were carried out on
design concepts for pump products and new equipment for motopumps (electric and diesel) and
development started on a proprietary design for a rapid change FE mud pump so as to avoid
purchasing products from third parties, for example, the pumps manufactured by P-Quip and/or
South West.
As regards the third point, development of software to obtain and manage drilling data and for
maintenance that is linked to inventories of spare parts is at an advanced stage. The resident software
is called Rig Eye and is called DMS for the IoT part that has been developed for Cloud application.
The research and development activity of Soilmec in 2016 had the following objectives:
1. To manage, promote and protect the intellectual property and know-how of the company;
2. To analyse new technologies and carry out technical reviews of existing technologies;
3. To develop 2.0 electrical plant for the existing equipment range.
As regards the first point, several new patents were registered in 2016 that cover the technological
areas that are of major interest to the company. Several patents that had already been registered prior
to 2016 were granted during the year.
As regards the second point, several technical and economic feasibility studies were carried out on
new equipment and on highly innovative technical solutions.
15
SECTOR REVIEW
Parent Company performance
The 2016 Financial Statements, prepared by the Parent Company in accordance with IAS/IFRS
accounting standards, showed revenues from sales and services of Euro 23.457 million (a decrease
of Euro 0.395 million compared to the figure of Euro 23.852 million in the previous financial year);
other revenues of Euro 3.124 million (an increase of Euro 0.235 million compared to the figure of
Euro 2.890 million in the preceding year); financial income of Euro 18.252 million (a decrease of
Euro 0.916 million compared to the figure of Euro 19.168 million in the preceding year); and
impairment losses on financial assets of Euro 119.854 million. The net loss for the year was Euro
113.287 million (a decrease of Euro 120.553 million compared to the net profit of Euro 7.266
million in the 2015 financial year) and mainly impairment charges on financial assets as detailed
below in this Report.
In addition to plant and equipment hire, the activities carried out by the Parent Company on behalf
of subsidiaries included planning, research and development, operational and administrative
management support, human resources and personnel services, IT services and corporate integrated
management software, management of Group communications, investment management and
financing agreements with subsidiaries.
In the 2016 financial year, there was no income from subsidiaries (Euro 0.328 million in 2015) and
there was a decrease in interest on loans given by the Company to subsidiaries (Euro 18.247 million
in the 2016 financial year compared to Euro 18.836 million in 2015); loans to subsidiaries carry
interest rates in line with market rates.
Net exchange rate gains in 2016 were Euro 1.178 million compared to Euro 2.484 million in the
previous financial year. The exchange rate gains were mainly unrealised gains and it was therefore
decided to make a provision, in compliance with the accounting standards and enacted law, net of the
provision made in the previous financial year, to a reserve that cannot be distributed until the gains
are realised, as described in the Report on Operations.
16
There was also a decrease in the total tax payable by the Company; the loss pre-tax of Euro 110.97
million in 2016 compared to a profit pre-tax of Euro 10.74 million in the previous financial year.
There were no significant investments in property, plant and equipment in the financial period under
review.
During 2016, the Company made advance payments of Euro 45.000 million for a share capital
increase of Drillmec S.p.A. and of Euro 100 million for Trevi Energy S.p.A. However, in the last
quarter of 2016, the Company generated impairment losses by adjusting the carrying value of
financial assets to its share of the accounting net equity of these investments. The new value was
considered to be the fair value of these investments given their future outlook as incorporated in the
2017-2021 Group Business Plan approved by the Board of Directors of TREVI- Finanziaria
Industriale S.p.A. on 3 March 2017. The aforementioned value adjustments were: i) Euro 111.781
million for Drillmec S.p.A. and ii) Euro 8.073 million for Trevi Energy S.p.A. for a total of Euro
119.854 million (the difference between the historic costs of the investments and the net carrying
value of the percentage of net equity held in each subsidiary).
The Extraordinary Shareholders’ Meeting of 13 May 2016 approved the amendments to Article 25 of
the Articles of Association (composition of the administrative body) that increased the maximum
number of members of the Board of Directors from eleven to thirteen.
The Shareholders’ Meeting of 13 May 2016 also approved the allocation of the entire profit for the
2015 financial year to reserves and the proposal that there been no dividend distributed. The profit
was allocated as follows:
• 5% or Euro 363,309 to the legal reserve;
• Euro 4,033,228 to the translation reserve to ensure that this reserve covered unrealised gains on
exchange rates;
• Euro 2,869,642 to the extraordinary reserve.
The same Shareholders’ Meeting of 13 May 2016 also:
• approved the proposal of the Board of Directors that the plan to purchase and sell up to a
17
maximum of 2,500,000 treasury shares be extended. This authority was not exercised in 2016;
• appointed Marta Dassù to the Board of Directors, pursuant to Article 2386 of the Italian Civil
Code, until the approval of the Financial Statements at 31 December 2017;
• approved maintaining the current composition of the Board of Directors with eleven Directors
and postponing to a future occasion any decision to increase the number of members of the
Board of Directors to more than eleven Directors;
• approved the appointment of the Board of Statutory Auditors for the 2016 – 2017 – 2018
financial years and their members: Milena Motta (Chairperson), Adolfo Leonardi and Giancarlo
Poletti (Standing Statutory Auditors), Marta Maggi and Stefano Leardini (Supplementary
Statutory Auditors); it also approved remuneration of Euro 40,000 for the Chairperson and Euro
30,000 for each of the Standing Statutory Auditors;
• approved, pursuant to and in compliance with Article 114-bis of the Consolidated Finance Act,
and agreed the reasons for adopting a share incentive scheme to be called the “2016 Stock Grant
Plan” for certain employees and executives with specific responsibilities in the Company and its
subsidiaries. Under the Plan a maximum of 500,000 shares of the Company would be allocated
under the terms, conditions and activation mechanisms described in the information document
attached to the Report of the Board of Directors. Given approval of this proposal, the Board of
Directors meeting on 29 July 2016 decided to allocate free of charge a total of 444,841 rights to a
similar number of shares in the Company under the terms and conditions of the 2016 Stock
Grant Plan; the beneficiaries were permanent employees and executives with specific roles
within the Company and its subsidiaries in accordance with Article 2359 of the Italian Civil
Code.
As regards the memorandum accounts, it should be noted that guarantees given to credit institutions
for non-current loans and for commercial guarantees received are centralised in the Parent Company
and totalled Euro 618.513 million at 31 December 2016, compared to Euro 505.493 million at 31
December 2015, an increase of Euro 113.020 million due to the use of non-current credit lines by
some of the subsidiaries.
18
Guarantees given to insurance companies totalled Euro 15.163 million at 31 December 2016,
compared to Euro 37.501 million in the previous financial year, a decrease of Euro 22.337 million;
these guarantees are reduced in proportion to the amount of work still outstanding and are primarily
given for projects in the USA.
The Explanatory Notes to the Financial Statements of TREVI - Finanziaria Industriale S.p.A.
provide detailed information on individual entries in the Financial Statements.
The table at the end of this section provides a reconciliation of the results for the period and the net
equity of the Group with the figures of the Parent Company (DEM/6064293 of 28 July 2006).
Further details regarding the composition of the Board of Directors and the Board of Statutory
Auditors is given in other sections of these Financial Statements and in the Report on Corporate
Governance.
It should also be noted that in 2016 and in 2017, prior to the approval of the present Report, the
organisation and management of the Company was strengthened and details of this are given in the
Report on Corporate Governance and Ownership Structure; specifically, a Risk Management
department was set up and the new role of Central Director was created. This office is held by Mr
Marco Andreasi.
Lastly, given the negative performance of the Oil & Gas Division, which had a material effect on the
Consolidated Financial Statements and the economic and financial figures for the second semester
2016 and for the full-year 2016, meant that the Company was unable to respect one of the financial
covenants based on the consolidated figures at 31 December 2016 in the loan agreements (the Net
Debt/ EBITDA ratio) and two of the financial covenants in the terms and conditions of the Euro 50
million bond loan (the Net Debt/ EBITDA ratio and the EBITDA/ Net financial costs ratio); further
information on this subject is provided in the section on General Presentation Criteria in the Notes to
the Accounts.
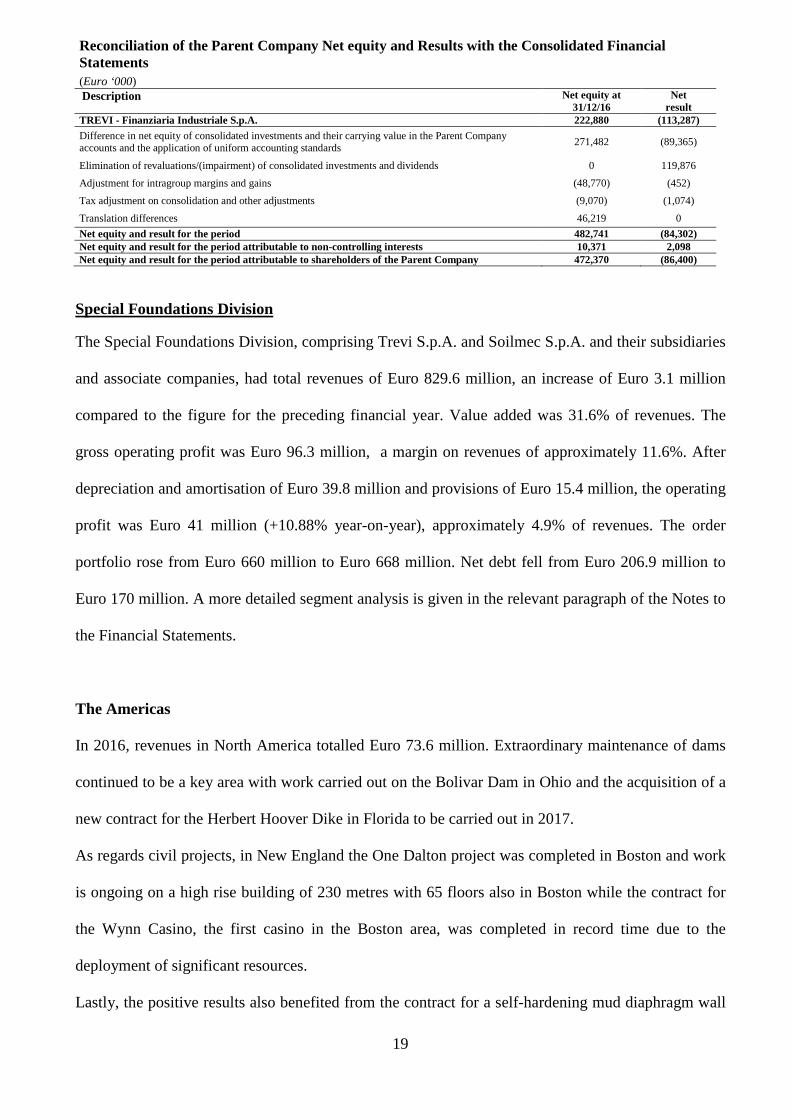
The table below gives the reconciliation of Parent Company net equity and results with the
consolidated net equity and results:
19
Reconciliation of the Parent Company Net equity and Results with the Consolidated Financial Statements (Euro ‘000) Description Net equity at
31/12/16 Net
result TREVI - Finanziaria Industriale S.p.A. 222,880 (113,287)
Difference in net equity of consolidated investments and their carrying value in the Parent Company accounts and the application of uniform accounting standards
271,482 (89,365)
Elimination of revaluations/(impairment) of consolidated investments and dividends 0 119,876
Adjustment for intragroup margins and gains (48,770) (452)
Tax adjustment on consolidation and other adjustments (9,070) (1,074)
Translation differences 46,219 0
Net equity and result for the period 482,741 (84,302) Net equity and result for the period attributable to non-controlling interests 10,371 2,098 Net equity and result for the period attributable to shareholders of the Parent Company 472,370 (86,400)
Special Foundations Division
The Special Foundations Division, comprising Trevi S.p.A. and Soilmec S.p.A. and their subsidiaries
and associate companies, had total revenues of Euro 829.6 million, an increase of Euro 3.1 million
compared to the figure for the preceding financial year. Value added was 31.6% of revenues. The
gross operating profit was Euro 96.3 million, a margin on revenues of approximately 11.6%. After
depreciation and amortisation of Euro 39.8 million and provisions of Euro 15.4 million, the operating
profit was Euro 41 million (+10.88% year-on-year), approximately 4.9% of revenues. The order
portfolio rose from Euro 660 million to Euro 668 million. Net debt fell from Euro 206.9 million to
Euro 170 million. A more detailed segment analysis is given in the relevant paragraph of the Notes to
the Financial Statements.
The Americas
In 2016, revenues in North America totalled Euro 73.6 million. Extraordinary maintenance of dams
continued to be a key area with work carried out on the Bolivar Dam in Ohio and the acquisition of a
new contract for the Herbert Hoover Dike in Florida to be carried out in 2017.
As regards civil projects, in New England the One Dalton project was completed in Boston and work
is ongoing on a high rise building of 230 metres with 65 floors also in Boston while the contract for
the Wynn Casino, the first casino in the Boston area, was completed in record time due to the
deployment of significant resources.
Lastly, the positive results also benefited from the contract for a self-hardening mud diaphragm wall
20
on the Lower Wood River in Illinois; this work involved constructing plastic diaphragm walls to
stabilise and impermeabilise faults along the banks of the Mississippi River and Wood River Creek.
The order backlog at the end of the financial year was sufficient to cover most of 2017 while the
current marketing initiatives and the policies of the new US administration give cause for hope that
new contracts will be received.
In Latin America, the Trevi division executed contracts in Argentina, Venezuela, Colombia and
Panama for a total of approximately Euro 61.2 million. In Argentina, two contracts covering Lots 1
and Lot 3 of an environmental project in Buenos Aires (the Riachuelo hydraulic reclamation project)
are in their final phases.
During the financial year under review, contracts were also won and are now being executed for
harbour infrastructure along the Paranà River and on the Atlantic coast for the major cereals
exporters in Argentina. Work was completed on the Rosario electricity generating plant and on
electric cable infrastructure in the province of Chaco.
In Panama, the Trevi division was involved in the final phases of the consolidation and foundation
work for the Tercer Juego de Esclusas of the new Panama Canal, which was inaugurated last year. It
is also constructing special foundations for Line 2 of the Metro and for Port Rodman on the Pacific
Ocean end of the canal.
In Colombia the two main projects underway are the Pedregal Business Center in Bogota and the
foundations for the Pumarejo Bridge at Barranquilla on the River Magdalena on behalf of the Spanish
company, Sacyr. The latter contract is for foundations on sunken piles for the longest bridge in
Colombia (2.28 km). Work is also continuing on some important civil projects in Bogota that include
the Colmedica building and El Eden shopping centre.
Despite the difficult macroeconomic and political problems of Venezuela, work continued in oil
industry infrastructure with the expansion of the Puerto la Cruz refinery and on a high quality
residential project in Caracas.
Considerable marketing was carried out in Chile and Peru where some important contracts were
21
actively pursued and it is hoped these will be finalised in 2017.
Europe
Work was carried out in Norway on behalf of OHL on transport infrastructure. Marketing activity,
together with investments aimed at winning business in North and Central Europe, should result in
orders in 2017.
Italy
Although 2016 could be considered a very negative year for the construction sector in Italy, the
Division managed to carry out some important contracts.
In addition to the Oil Dock in the Port of Naples that was concluded with good technical results at the
start of this year, it is worth noting the contract to repair the Lungarno Torreggiani in Florence, which
demonstrated the commitment, dedication, know-how and ability of the Division to carry out
complex works in a very short amount of time. It won recognition not just from the public authorities
but from the citizens affected by the works.
Work also continued on the dry dock for ships of up to 150,000 deadweight tonnage (dwt) in the Port
of Palermo whilst some medium-size contracts, for example, that for the new production facility of
Orogel in Cesena and the Immacolatella pier in the Port of Naples, were completed.
A positive note is provided by the size of the order portfolio, which, in addition to the contracts that
have been completed and are mentioned above, includes the contract for the Pagliari pier in the Port
of La Spezia, the work on the high speed railway hub in Florence and other contracts acquired at the
end of the 2016 financial year, for example, that with Syndial in Malcontenta Porto Marghera and
that with the Tiliaventum consortium on the Tagliamento River in Friuli Venezia Giulia.
Africa
The Trevi division had 2016 revenues of approximately Euro 109 million in Africa.
In Nigeria, an important contract for a fertiliser plant for Dangote, a leading local company, was
completed. Moreover, despite the crisis engulfing the country, activity continued on residential,
22
commercial and hotel construction and in structures and support work for the oil industry (the dock
works at Port Harcourt).
In Algeria, the Group continued to be active in several sectors in 2016. The most important was the
infrastructure work on the metro system. The Group has been the undisputed leader in this sector in
Algeria since 2004 and has worked on all the main lines. In 2015 it won contracts for all the
foundation work on the “MC1 Ain Naja – Baraky” and the “MC2 El Harrach – Aéreoport” stretches
of the network that are still being carried out.
These two stretches cover almost 12 km and will have 11 stations, 13 ventilation shafts, and one
viaduct. The work, which began in 2015 and will continue until 2019, is expected to generate strong
revenues and profitability.
Work also continued on the motorway network in Algeria (the Tizi Ouzou motorway and the East-
West motorway).
In Egypt work progressed on the support works for the motorway tunnels under the Suez Canal.
The Trevi Division was also active in Mozambique where it carried out requalification work on dams
and also drilled water wells.
Middle East, Asia and Oceania
The Trevi division generated revenues of approximately Euro 284 million in the Middle East in 2016.
In the United Arab Emirates, work began on the special foundations for a high rise building designed
by Foster + Partners and called ICD Brookfield Place that is one of the most important property
projects currently under construction in Dubai. In addition to this contract, there are also those in the
Arabian Gulf for the Tiara United Towers, Mediclinic Hospital and two high rise buildings in Muscat
in Oman.
Moreover, in the financial year under review, a government contract was acquired for a property
development in Abu Dhabi: the contract, won in consortium with a European company, involves
geological studies and the treatment and improvements to the solidity of the ground. Work began in
2016 and will continue throughout 2017.
23
This project is in addition to other contracts in the United Arab Emirates and in Kuwait, Qatar and
Oman in the sectors of motorway networks, maritime infrastructure, underground systems and
commercial buildings.
In Saudi Arabia, work is ongoing on the foundations of several stretches of the Riyadh metro system.
In the Philippines, the special foundations of a 14 kilometre, six-lane, urban motorway in Metro
Manila were constructed.
In Turkey, the Division is laying the special foundations for the Galata Cruise Terminal, a modern
complex for commercial activity that includes residential property and a luxury hotel, which will be
part of the tourist facilities on the Bosphorus. The Port of Istanbul (known as the Galata Port) is a
passenger terminal for cruise ships that stretches from the Galata Bridge on the Golden Horn to the
Salipazari quarter on the European side of the Bosphorus passing through the Karaköy district.
In 2016, the Division won the important repair contract for the Mosul Dam as was widely reported in
the national and international media.
The contract worth Euro 273 million is under the auspices of the Iraqi Ministry of Water Resources
(MoWR). Personnel and resources were immediately mobilised as this significant project requires
intense drilling and injecting of concrete mixes to consolidate the foundations of the dam, as well as
repair and maintenance of the bottom spillway galleries that have been damaged. The initial
mobilisation will include specialist training courses for technicians and local personnel in the use of
Soilmec drilling equipment.
The presence of an Italian military contingent and local security forces will guarantee the safety of
the over 450 technicians and personnel of Trevi. The work will be ongoing throughout 2017.
The Division also carried out contracts in New Zealand and won a contract in Australia for the metro
connecting Perth to the airport; this latter contract is the first that the Division has done in Australia
and should open up interesting growth opportunities in the local market.
Soilmec Division
2016 proved a highly successful year for Soilmec. Despite the slight fall in total revenues (-5% year-
24
on-year), strong revenues were generated in Asia and the Far East due to the subsidiaries in China,
Japan and Australia. In Europe, there were excellent results from the UK branch whilst revenues in
France experienced a slight decrease year-on-year. The results obtained in the Middle East in 2015
were consolidated. There was a small decrease in revenues from Egypt that was compensated by the
performance in the Turkish and Gulf markets. However, the US branches failed to build on their
performance in 2015. The strong focus on variable costs with a reduction in costs and an increase in
production efficiency resulted in a significant improvement in operating profitability compared to the
2015 financial year. Net debt was substantially unchanged compared to the previous financial year.
Oil & Gas Division
This division had 2016 revenues of Euro 273.1 million compared to Euro 547.6 million in the
previous financial year, a year-on-year decrease of 50%.
It had a gross operating loss of Euro 23.9 million compared to a gross operating loss of Euro 77.6
million in the previous financial year. The operating loss was Euro 79.6 million (an operating loss of
Euro 124 million in 2015) and net debt increased by approximately Euro 73 million to Euro 331.8
million. The order portfolio was substantially unchanged at Euro 290 million.
Drillmec Division
Drillmec had total revenues of approximately Euro 158.6 million in 2016 compared to Euro 403.5
million in the preceding financial year (-60.7%).
In 2016, the company continued to work on the contracts acquired in Algeria, Taiwan and India. The
persistent low oil price penalised revenues, which came in lower than those of the budget. The
decrease in revenues, combined with profitability that struggled to reach forecast levels, also
reflected strong competitive pressure.
In 2016, the Division continued to research and introduce new product lines, components and
specialist services that should help support and improve future profitability even on lower volume
sales.
25
Although no radical change is expected in the performance of the Oil & Gas market, there were some
encouraging signals from order inflows in the last part of 2016 and the first months of 2017.
There has been growing demand for on-shore plant and equipment in the USA, Argentina, the Middle
East, Russia and North Africa. A contract was signed in Tunisia to supply one HH102 and one G75
rig for geo-resource research, which should be followed by a contract to supply a third G75 plant.
There are also strong prospects that the Tunisian market will take one of two 2000 HP plants for deep
well drilling. In Russia, the increased interest in Drillmec’s Top Drive product range was confirmed
when a third contract was signed to supply three HTD250 drills in addition to the previous two
supplied, which brings to six the TDs under contract. This could lead to interesting developments in
this market that is considered strategic in the near future. The Divisions’s leadership position in this
market for workover equipment and rigs is confirmed by the over Euro 10 million of contracts
currently underway. A contract was signed in Oman to supply a sixth MR6000WO plant in addition
to the five already supplied. Lastly, an important contract was won in Bolivia to supply three
complete 2000 – 3000HP land rigs, which is the largest on-shore contract signed in recent times by
the Division. In the off-shore sector, the strong relationship with a client in Uzbekistan could lead to
an interesting contract with an international client for the potential supply of a modular package,
similar to that supplied in Mexico, to be used in the Caspian Sea. The negotiations are at an early
stage but Drillmec’s technical proposal has met with significant interest from the client and could
lead in the near future to a request for a quote. In Indonesia, there was a positive conclusion to an
important contract for an off-shore workover rig with a value of USD 21 million; this contract was
won from the same client who postponed until 2018 a contract signed in 2016 for an off-shore drill
rig. Lastly, an engineering report was completed for a client in Argentina who wants to agree a
purchase contract for an HH55 off-shore rig worth approximately USD 30 million in the near future.
The recently created Services Business Unit is demonstrating the validity of this strategy and is
signing the first certification and refurbishing contracts in various parts of the Middle East and North
Africa, as well as increasing its training services. The revenues of the first quarter 2017 and the order
portfolio (approximately Euro 10 million) make it probable that the target revenues of Euro 25-30
26
million in the services sector for the whole of 2017 will be met. Much will depend on signing
agreements with companies for the maintenance of plant and equipment they already own.
There are also interesting developments involving a client in Oman that have resulted in a contract
worth approximately Euro 1.3 million to supply pumps and services to several local companies. This
region, where there are more than 30 rigs built by Drillmec in the recent past, offers interesting
prospects of work on equipment with periodic certification that is expiring and which requires
extraordinary maintenance.
The continuous HoD (Heart of Drilling – continuous circulation system) for oil wells met with
significant technical success in the trials carried out with Shell. However, the contractual strength of
the leading companies (Schlumberger, WDI, Halliburton, Nabors, etc.) in this sector has required a
review of the strategy and led towards a diversified business model. There are some interesting
contacts with a leading Oil & Gas services company that may bear fruit in the 2017 financial year.
The 2016 order portfolio only partly covers the budget revenues for 2017. However, it is hoped that
some of the contracts where negotiations are well advanced will be signed to give continuity to the
production commitment and ensure that the revenues in the budget are met.
Petreven
The 2016 macroeconomic environment continued to be negative. The oil price, having reached a low
for the last thirteen years of less that USD 30 per barrel in the first months of 2016, continued to be
weakened by structural imbalances in the market aggravated by over supply and by uncertainties for
growth in energy demand. To support prices and protect the oil industry, the Opec countries decided
to cut production. Opec also increased its forecast for demand maintaining that low prices would
mean higher consumption even though this was not supported by economic growth. The outlook
remains uncertain and any significant recovery is postponed to later this year or beyond.
The extended crisis, longer than had initially been expected, and the ongoing weakness of the oil
price resulted in a profound change in market conditions a sharp reduction in the main economic and
financial performance of the Division compared to previous years. This and the reduction in the
27
order portfolio, which nevertheless offers good visibility, continues to put pressure on margins and
results. The Division is attempting to regain profitability by using its competitive advantages: strong
relations with clients, an avant-garde fleet and a structured approach to project execution. A new
model for project risk management has been implemented, which, through an appropriate process for
risk identification, risk measurement, management and monitoring should lead to the division
meeting its pre-set targets.
Operating activities
The Division is currently operating in South America on behalf of the leading oil majors and national
oil companies. It has seventeen operational rigs in the following countries: eleven in Argentina, two
in Venezuela, one in Chile, two in Peru and one in Colombia. It is also using a rig belonging to a
third-party in Chile. The operating activities had an average rig capacity utilisation of 69% (74% in
2015) and 205 wells were drilled. Revenues fell 20% year-on-year. Argentina is the country that
generated most revenues with approximately USD 80 million (63% of revenues), followed by
Venezuela and Chile.
The order portfolio was USD 81 million and covers almost all the forecast revenues for 2017. New
orders acquired totalled USD 84 million.
Argentina
Argentina is the market that generates most revenues: 63% of revenues from this segment. Work was
carried out for the leading companies using eight rigs and one workover rig (two in the Santa Cruz
region, two in the Rio Gallego region and five in the Neuquen region). Contracts ended (one in May
and one in September) for two rigs operating in Argentina. Operations were marked by strong trade
union unrest that slowed drilling operations and put some plants into extended stand by. The average
capacity utilisation of the rigs was 82% (89% in 2015) and 150 wells were drilled.
Peru
Work in the Talara province was completed in May 2016 but restarted in August with the use of two
28
drill rigs on behalf of different companies. The average capacity utilisation of the rigs was 50% (68%
in 2015) and 35 wells were drilled.
Venezuela
In Venezuela, work continued with two drill rigs in the municipality of Maturin. The average
capacity utilisation of the rigs was 100% (the same as 2015) and 11 wells were drilled.
Chile
In Chile, geothermal drilling activity continued in the Antofagasta Region while that in the
Magallanes Region was completed and two drill rigs were subsequently transferred to Argentina.
The average capacity utilisation of the rigs was 41% (37% in 2015) and nine wells were drilled.
TREVI Energy S.p.A.
The establishment and growth of this company, active in the sector of renewable energy, reflects
TREVI Group’s desire to adapt some of the technologies already developed and tested in its special
foundations and drilling businesses to this sector and to develop new specific and innovative
technological systems for a sector that is expected to have strong future growth.
As part of the development of the wind energy sector, research and innovation has focused not just
on the off-shore sector but also the on-shore sector with feasibility studies for an on-shore plant in
Sardinia (Porto Torres) with nominal installed capacity of 36 MW.
In the financial year under review, in accordance with enacted law, the administrative process begun
in previous years continued in order to obtain specific authorisations (state concessions, single
European authorisation and environmental impact assessments (VIA)) to develop off-shore wind
farms in Southern Italy and on-shore wind farms in Sardinia.
This activity has concentrated on the following sites :
• Porto Torres (on-shore site): leases have been signed to rent land on which five wind turbines
will be installed with total generating capacity of 15 MW. The approval that was expected to
29
be given in the first half of 2016 was rejected by the Region of Sardinia and the sums
capitalised over the years were written down to zero.
• Chieuti (an off-shore site with total capacity of 150 MW) and Manfredonia (an off-shore site
with total capacity of 195 MW): following the refusal by the Prime Minister’s Office for the
requested authorisation on 14 February 2014, an appeal was launched in the Regional
Administrative Court (TAR) of Rome. Given the uncertain outcome of this process, since
2013 prudent provisions for future risks have been made for an amount equal to the sums
already invested in the project. The 2016 Financial Statements included a provision for future
risks that equalled the investments made in 2016.
• In 2016, the authorisation process began for two new off-shore wind farms. The first is
located near Lesina Marina (Foggia) and is for 60 wind turbines with total capacity of 198
MW. The second is near Margherita di Savoia and is for 50 wind turbines with total capacity
of 165 MW.
The project to produce a prototype 3 MW wind turbine has been completed and the Company is
awaiting developments on the above authorisations before moving to the next phase of the prototype
and then eventually to industrial manufacturing.
Group related-party transactions with non-consolidated subsidiaries, associates and controlling
companies, companies controlled by the latter and with other related parties
TREVI – Finanziaria Industriale S.p.A. has limited relations with Sofitre S.r.l. (see Note 35 of the
Notes to the Financial Statements), a company controlled 100% by the Trevisani family, and with the
companies it controls, which are mainly involved in the construction and management of car parks,
including T Power S.p.A., which is controlled by Trevi Holding SE. In the accounting period under
review, for the TREVI Group this relationship gave rise to revenues of Euro 1.656 million, costs of
Euro 0.062 million and, at 31 December 2016, receivables of Euro 2.781 million and payables of
Euro 0.045 million.
30
Transactions with related companies are done at normal market conditions. There are no financial or
capital relations with the parent company Trevi Holding SE and any relations with non-consolidated
subsidiaries and associate companies, described in Note 35 to the Consolidated Financial Statements,
are not material.
Risks and uncertainties
Exchange rate and interest rate risk
Due to its international structure, the Group is subject to market risks from exchange rate and interest
rate fluctuations. It has a policy for covering financial risks, which includes fixed term currency
contracts and financing and hedging in foreign currencies to cover expected cash flows at pre-
established rates. Detailed information on the transactions to hedge exchange rates and the valuation
criteria adopted for these is given in the Notes to the Financial Statements.
Credit risk
The sector and geographical diversification of the Group means that it has no significant
concentration of credit risk. Where possible, the Group demands suitable guarantees and sets up ad
hoc procedures for constant monitoring of trade receivables.
Liquidity risk The Group aims to maintain a balance between liquidity demand and supply using suitable bank
financing. In particular, the Group has signed long-term financing agreements aimed at covering its
investment programme and business development.
Risks pertaining to business activities abroad
The Group is exposed to the typical risks of doing business internationally; these include risks
pertaining to local political and economic instability and risks related to changes in the macro-
31
economic, fiscal and legislative environments. Identifying new initiatives for the Group in foreign
countries is always preceded by a careful appraisal of such risks, which are then constantly
monitored. It should be stressed that the activities of the Group are concentrated mainly in countries
covered by international insurance or where bilateral agreements exist between the Italian
government and the local government.
Use of estimates
The Special Foundations segment of the Group and the Drillmec division operate with contracts
where payment is determined at the time the contract is awarded. Any higher costs that the Group
incurs and/or suffers in executing these contracts must be met by the Group but may be recouped
from the client according to laws and/or terms and conditions contractually agreed. Consequently, the
margins made on such contracts may vary from the original estimates that were carefully made for
each contract based on the long-term experience the Group has acquired over the years with similar
contracts in both the Special Foundations and Oil & Gas sectors.
Risks pertaining to fluctuations in the cost of raw materials
Fluctuations, in some cases significant, in the costs of some raw materials can lead to an increase in
production costs, which, however, the Group tends to offset by a diversified supply policy,
framework agreements with strategic suppliers, and contractual clauses for revising prices. It should
also be mentioned that sales of drill rigs are subject to the investment policies of leading oil
nationals/private companies, which are themselves influenced by the trend in the oil price.
Personnel
32
The Group has always focused on personnel management; employee retention is encouraged by a
high degree of involvement, by remuneration and an incentive system, continuous and specific
training, the attention paid to the work environment and, for expatriate employees, a focus on the
living conditions not only of the employee but wherever possible of the entire family.
Given the business of the Group, personnel training is done through a dedicated structure called the
TREVI Academy, through “on the job” training and through specific training courses; the work
environment is free of conflict.
Further details are given in the Report on Remuneration, prepared in compliance with Article 123-ter
of Legislative Decree of 24 February 1998 no. 58 and available as required by enacted law at the
registered office of the Company, at Borsa Italiana S.p.A. and on the Company website
www.trevifin.com.
Environmental awareness and occupational health and safety
Environmental awareness and occupational health and safety have always been among the top
priorities of the Group. The Group constantly strives to maintain a safe work environment and to
provide personnel, according to their roles, with all the equipment necessary to avoid any risk or
danger to their persons. The Group production facilities, offices and operating systems adhere to the
required safety standards. The Group also acts in a way that preserves and protects the environment,
in compliance with existing environmental legislation, as well as the rules and procedures that the
Group itself has prepared. Lastly, security systems are used to guard Company property and, in
particular, all forms of inventory.
Corporate Social Responsibility
The TREVI Group considers sustainability to be an integral part of its business as it represents a
guarantee of long-term growth and value creation through the effective involvement of all
stakeholders.
33
In order to adhere to the Principles of Sustainability, the TREVI Group has chosen to adopt a
Corporate Social Responsibility programme that is continually updated, monitored and agreed on by
persons of all levels of responsibility.
The nature, type and complexity of the Group businesses have always necessitated a particular focus
on the environmental and social aspects of executing a project.
Furthermore, the profile of the countries and regions in which the Group operates means it has
always had a distinctive approach to sustainability in order to contribute to the socio-economic
development of the regions in which it is present through an effective strategy of local content that
focuses mainly on local employment.
There are numerous examples of collaborations and joint ventures in which the Group is involved
that demonstrate its exceptional adaptability to various local cultures and its considerable skill in
project managing important contracts.
Another strong point of the Group regarding local content is the ever-increasing diversity of its
employees – a pool of young talent from a multitude of countries whose professionalism grows with
that of TREVI on the various projects in which they are involved, either in their own countries or
abroad, and wherever there are support structures like engineering and logistics centres for
warehousing of construction and worksite equipment.
The call to behave responsibly and with integrity, contained in the Code of Ethics, and the reference
to value creation is embedded in the corporate mission statement: "The mission of the TREVI Group
is to design, manufacture and offer innovative technologies and services for all types of foundations
engineering projects".
The Social Responsibility model adopted and which guides the Company policies reflects these
principles and may be described as follows:
• Provide accurate and transparent reports to stakeholders not only on the financial performance
but also on the social, cultural and environmental results of the Company’s activities.
34
• Contribute to the development of communities in which it is present through investments in
cultural, sporting, educational and social initiatives.
• Devote increasing attention to the environment through a programme that monitors and helps
reduce the environmental impact of its businesses.
• Contribute to the wellbeing of employees not only in the workplace but also, in the case of
expatriates, by focusing on living conditions and logistics regarding families and the
education of children.
Social projects supported by TREVI Group include:
• Iraq “Restarting in Erbil”. Support given to the nursery “Casa del bambino” that houses
over 130 children on the outskirts of Erbil.
• Romagna Solidale, a non-profit organisation (Italy): membership fee and project support
• Caritas: donation
• Romagna Iniziative (a consortium to promote youth sport, art and culture in the region):
membership fee and project support
• Support given to the Nuova Famiglia for healthcare projects for able and disabled persons
(Italy)
• RiminiForMutoko: donation to the association of volunteers working in Zimbabwe
• Italian Home for Children, Boston (USA): donation
• “Planeta Amor” Foundation: educational and nutritional support for infants and
adolescents with HIV/AIDS
• Asociación Trabajo y Persona of Caracas, Venezuela: donation
• Support given to the Jardín Nuestra Señora del Valle Orphanage in Argentina
• Support given to the Merendero GabyMar project in Argentina
• Support given to youth sporting activities (Basketball Cesena, Cesena Volleyball, Rugby
Cesena)
35
• Various donations to orphanages and local schools in the Philippines
These donations demonstrate the focus and involvement of the Group in daily life and the Company’s
ability to integrate the social dimension into its business activities.
Business outlook
The Group has prepared a 2017-2021 Business Plan with help of an international consultant. The
Plan was approved by the Board of Directors at its meeting on 3 March 2017.
Internal Dealing
In 2016, nine internal dealing notifications were made by: Trevi Holding SE (seven), CDP Equity
S.p.A. and FSI Investimenti S.p.A.
All the notifications were deposited with Borsa Italiana and are available on its website and on the
Company website, www.trevifin.com under the investor relations section in a sub-section for internal
dealing notifications and in the subs-section for communications on the purchase of treasury shares
by the Company.
Other information
In accordance with Consob communication of 28 July 2006 no. DEM/6064293, it is stated that, in
2016, the TREVI Group did not carry out any atypical and/or unusual transactions, as defined in the
Communication.
Significant events after the end of the reporting period:
Details of events subsequent to the end of the reporting period are given in Note 38 of the Notes to
the Financial Statements.
Report on Corporate Governance and on the Company’s Ownership Structure
At its meeting on 14 November 2016, the Board of Directors approved the adoption of the Self-
regulatory Code of Conduct for Listed Companies issued by the Committee for Corporate
36
Governance – Borsa Italiana S.p.A. in July 2015.
To fulfil the requirements of Article 123-bis of the Consolidated Finance Act, the Company has
prepared a Report on Corporate Governance and Ownership Structure, which has been made publicly
available at the same time as the present Financial Statements at the registered office of the
Company, at Borsa Italiana and on the Company website www.trevifin.com in the Investor Relations
– Corporate Governance section, which contains all the documentation relating to the corporate
governance of the Company; this Report has been deposited in Borsa Italiana S.p.A. and in the
centralised storage mechanism E Market Storage (www.emarketstorage.it), as required by the Rules.
At its meeting on 12 April 2017, the Board of Directors approved the Report for the 2016 financial
year, which follows the indications given by Borsa Italiana S.p.A. in the Format per la Relazione sul
Governo Societario e gli Assetti Proprietari, 6th edition – January 2017.
Report on Remuneration
To comply with regulatory requirements and to give shareholders further information for an
understanding of the Company, a Report on Remuneration has been prepared in compliance with
Article 123-ter of the Consolidated Finance Act, which has been made publicly available at the same
time as the present Financial Statements at the registered office of the Company, at Borsa Italiana and
on the Company website www.trevifin.com in the Investor Relations – Corporate Governance
section; this communication has been deposited in Borsa Italiana S.p.A. and in the authorised storage
mechanism, E Market Storage (www.emarketstorage.it), as required by the Rules.
The Report on Remuneration was approved by the Board of Directors at its meeting on 12 April 2017
and complies with the indications of Consob Resolution no. 18049 of 23 December 2011, published
in the Gazzetta Ufficiale no. 303 on 30 December 2011.
37
ADDITIONAL INFORMATION
SHARE CAPITAL
The issued and fully paid-up share capital of TREVI – Finanziaria Industriale S.p.A. at 31 December
2016 was Euro 82,391,632.50 comprising 164,783,265 ordinary shares each of nominal value Euro
0.50.
The company is controlled by Trevi Holding SE, which is 51% controlled by I.F.I.T. S.r.l. According
to data held by Consob at 31 December 2016, Trevi Holding SE owns 54,328,717 ordinary shares,
equal to 32.97% of the share capital.
At 31 December 2016 (according to Consob data) shareholders, other than the majority shareholder,
registered as having a shareholding in excess of 3% of the share capital were FSI Investimenti S.p.A.
with 16.852% and Polaris Capital Management LLC (USA) with a shareholding of 10.0072%.
During 2016, CDP Equity S.p.A. (previously Fondo Strategico S.p.A.) sold to FSI Investimenti
S.p.A. (both companies belonging to Cassa Depositi e Prestiti S.p.A., which, in turn, is controlled by
the Ministry of Economy and Finance (Ministero dell’Economia e delle Finanze)) its shareholding of
8.426%.
Treasury shares or shares and investments in controlling shareholders
At 31 December 2016 and at the date of these Financial Statements, the Company held 204,000
treasury shares, equal to 0.124% of the share capital; during the 2016 financial year, the Company
did not exercise the buy-back mandate given it by the Shareholders’ Meeting.
The Company does not own, directly or indirectly through any subsidiaries, shares and/or
shareholdings in the controlling shareholder, Trevi Holding SE.
Branches
Since March 2004, the Company has had a branch in Venezuela for the activities of the consortium
of Trevi S.p.A. (50%) - TREVI – Finanziaria Industriale S.p.A. (45%) - SC Sembenelli S.r.l. (5%),
which won the contract from CADAFE in Venezuela for the repair of the Borde Seco Dam. The
38
branch is not operational.
Procedures for Related-party Transactions
With the approval of the Committee for Related-party Transactions, all of whose members are
independent Directors, the Board of Directors meeting of 16 October 2014 updated the Procedures
for Related-party Transactions, prepared in compliance with Consob Rule no. 17221/2010 and
subsequent amendments and additions, previously approved on 26 November 2010; these procedures
are expected to be updated during the 2017 financial year.
The Committee for Related-party Transactions in office at 31 December 2016 and at the date of these
Financial Statements was appointed by the Board of Directors on 15 January 2015 and is made up of
the following independent and non-executive Directors:
- Rita Rolli (Chairperson)
- Cristina Finocchi Mahne
- Monica Mondardini
The Procedures for Related-party Transactions of the Company are available on the Company
website www.trevifin.com.
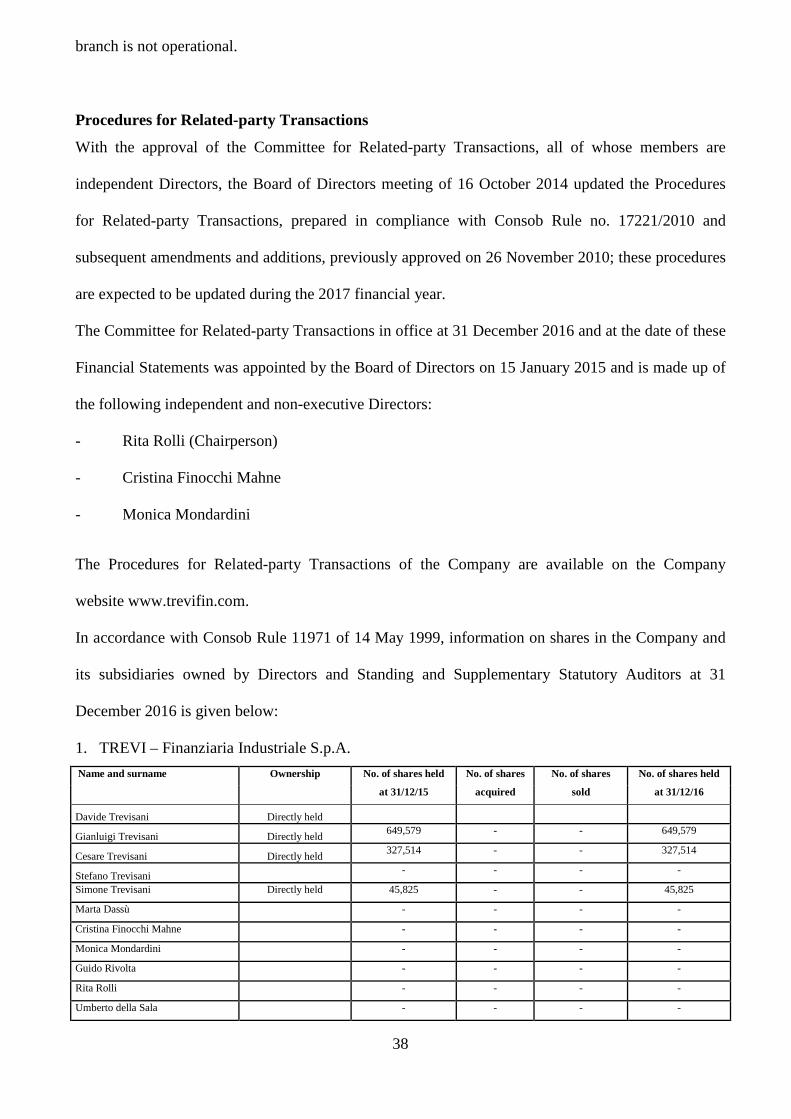
In accordance with Consob Rule 11971 of 14 May 1999, information on shares in the Company and
its subsidiaries owned by Directors and Standing and Supplementary Statutory Auditors at 31
December 2016 is given below:
1. TREVI – Finanziaria Industriale S.p.A.
Name and surname Ownership No. of shares held No. of shares No. of shares No. of shares held
at 31/12/15 acquired sold at 31/12/16
Davide Trevisani Directly held
Gianluigi Trevisani Directly held 649,579 - - 649,579
Cesare Trevisani Directly held 327,514 - - 327,514
Stefano Trevisani - - - -
Simone Trevisani Directly held 45,825 - - 45,825
Marta Dassù - - - -
Cristina Finocchi Mahne - - - -
Monica Mondardini - - - -
Guido Rivolta
- - - -
Rita Rolli
- - - -
Umberto della Sala - - - -
39
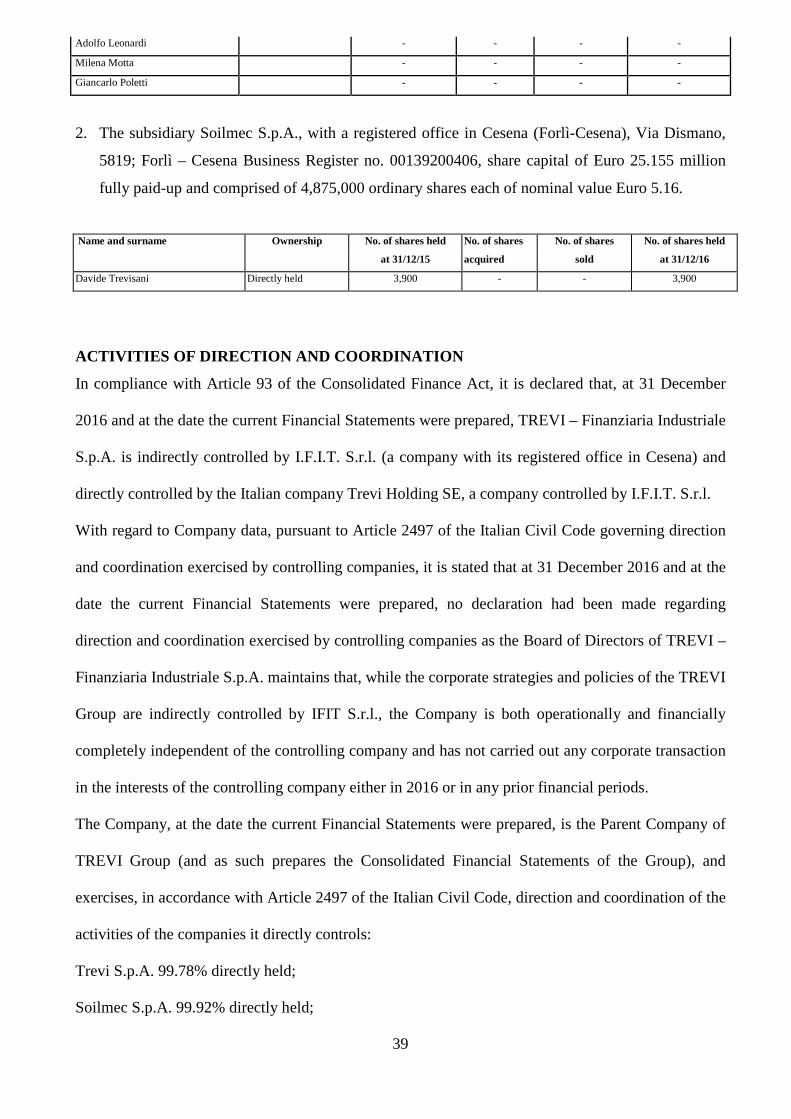
Adolfo Leonardi
- - - -
Milena Motta
- - - -
Giancarlo Poletti - - - -
2. The subsidiary Soilmec S.p.A., with a registered office in Cesena (Forlì-Cesena), Via Dismano,
5819; Forlì – Cesena Business Register no. 00139200406, share capital of Euro 25.155 million
fully paid-up and comprised of 4,875,000 ordinary shares each of nominal value Euro 5.16.
Name and surname Ownership No. of shares held No. of shares No. of shares No. of shares held
at 31/12/15 acquired sold at 31/12/16
Davide Trevisani Directly held 3,900 - - 3,900
ACTIVITIES OF DIRECTION AND COORDINATION
In compliance with Article 93 of the Consolidated Finance Act, it is declared that, at 31 December
2016 and at the date the current Financial Statements were prepared, TREVI – Finanziaria Industriale
S.p.A. is indirectly controlled by I.F.I.T. S.r.l. (a company with its registered office in Cesena) and
directly controlled by the Italian company Trevi Holding SE, a company controlled by I.F.I.T. S.r.l.
With regard to Company data, pursuant to Article 2497 of the Italian Civil Code governing direction
and coordination exercised by controlling companies, it is stated that at 31 December 2016 and at the
date the current Financial Statements were prepared, no declaration had been made regarding
direction and coordination exercised by controlling companies as the Board of Directors of TREVI –
Finanziaria Industriale S.p.A. maintains that, while the corporate strategies and policies of the TREVI
Group are indirectly controlled by IFIT S.r.l., the Company is both operationally and financially
completely independent of the controlling company and has not carried out any corporate transaction
in the interests of the controlling company either in 2016 or in any prior financial periods.
The Company, at the date the current Financial Statements were prepared, is the Parent Company of
TREVI Group (and as such prepares the Consolidated Financial Statements of the Group), and
exercises, in accordance with Article 2497 of the Italian Civil Code, direction and coordination of the
activities of the companies it directly controls:
Trevi S.p.A. 99.78% directly held;
Soilmec S.p.A. 99.92% directly held;
40
Drillmec S.p.A. 98.25% directly held; (1.75% held by Soilmec S.p.A.);
R.C.T. S.r.l. 99.78% indirectly held (100% held by Trevi S.p.A.);
Trevi Energy S.p.A 100 % directly held as a single shareholder company;
Petreven S.p.A. 78.38% directly held (21.62% held by Trevi S.p.A.);
PSM S.p.A. 99.95% indirectly held (70% held by Soilmec S.p.A. and 30% by Drillmec S.p.A.);
Immobiliare SIAB S.r.l. 100 % directly held as a single shareholder company.
Proposed allocation of the result for the period
The Board of Directors proposes that you:
• approve each and every part and in its entirety the Preliminary Financial Statements at 31
December 2016 as proposed and reported above;
• having acknowledged that the 2016 financial year generated positive results from ordinary
operations, as described in the Notes to the Financial Statements, but having adjusted the value
of its financial assets, the shareholdings in Drillmec S.p.A. and Trevi Energy S.p.A., following
the impairment of these assets for a total of Euro 119.854 million, had a net loss for the period of
Euro 113,286,637, we propose that you approve the use of the share premium reserve to cover
the losses for the period.
The Shareholders’ Meeting to approve the Financial Statements at 31 December 2016 has been
convened, with the favourable opinion of the Board of Statutory Auditors and in accordance with
Article 2364 paragraph 2 and Article 13 of the Company Articles of Association, within 180 days of
the end of the reporting period. The Company, which is required to prepare Consolidated Financial
Statements, is permitted more time than the normal period of 120 days from the end of the reporting
period in order that it can examine the year-end accounts of the companies that it consolidates.
42
CONSOLIDATED FINANCIAL STATEMENTS
AT 31 DECEMBER 2016
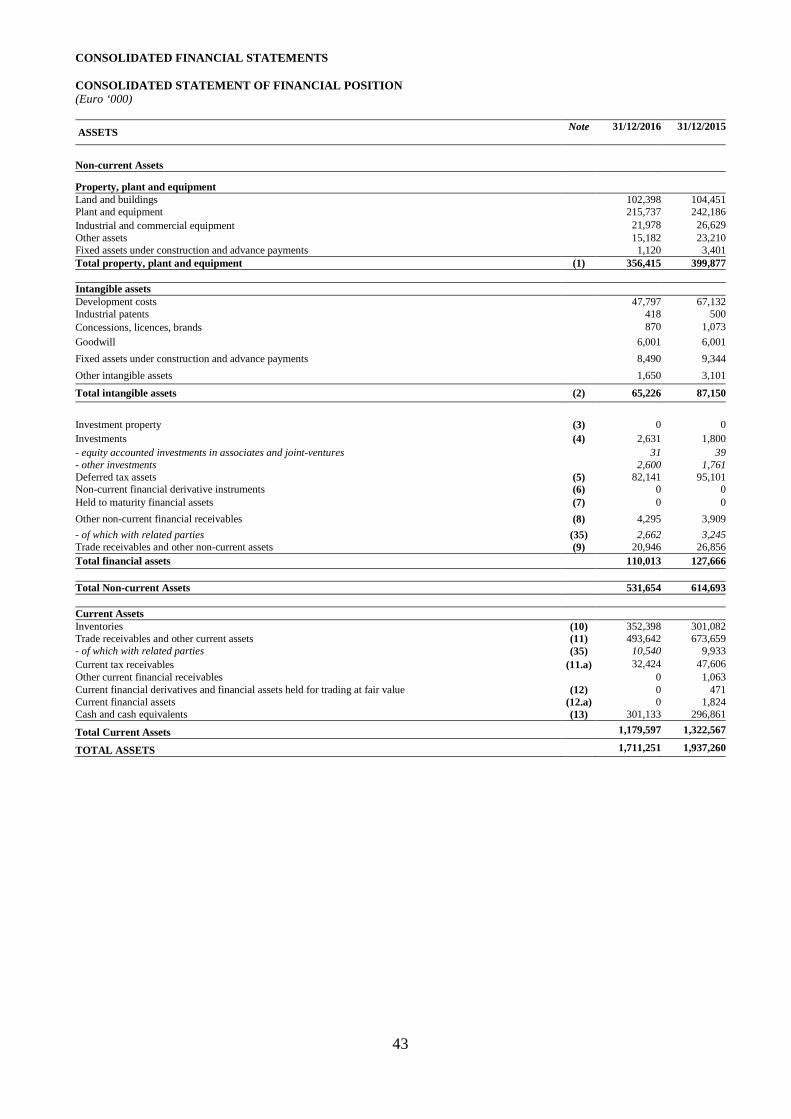
43
CONSOLIDATED FINANCIAL STATEMENTS
CONSOLIDATED STATEMENT OF FINANCIAL POSITION (Euro ‘000)
ASSETS Note
31/12/2016 31/12/2015
Non-current Assets
Property, plant and equipment
Land and buildings 102,398 104,451Plant and equipment 215,737 242,186Industrial and commercial equipment 21,978 26,629Other assets 15,182 23,210Fixed assets under construction and advance payments 1,120 3,401Total property, plant and equipment (1) 356,415 399,877 Intangible assets Development costs 47,797 67,132Industrial patents 418 500Concessions, licences, brands 870 1,073
Goodwill 6,001 6,001
Fixed assets under construction and advance payments 8,490 9,344
Other intangible assets 1,650 3,101
Total intangible assets (2) 65,226 87,150
Investment property (3) 0 0Investments (4) 2,631 1,800- equity accounted investments in associates and joint-ventures 31 39- other investments 2,600 1,761Deferred tax assets (5) 82,141 95,101Non-current financial derivative instruments (6) 0 0Held to maturity financial assets (7) 0 0
Other non-current financial receivables (8) 4,295 3,909
- of which with related parties (35) 2,662 3,245Trade receivables and other non-current assets (9) 20,946 26,856Total financial assets 110,013 127,666 Total Non-current Assets 531,654 614,693 Current Assets Inventories (10) 352,398 301,082Trade receivables and other current assets (11) 493,642 673,659- of which with related parties (35) 10,540 9,933Current tax receivables (11.a) 32,424 47,606Other current financial receivables 0 1,063Current financial derivatives and financial assets held for trading at fair value (12) 0 471Current financial assets (12.a) 0 1,824Cash and cash equivalents (13) 301,133 296,861
Total Current Assets 1,179,597 1,322,567
TOTAL ASSETS 1,711,251 1,937,260
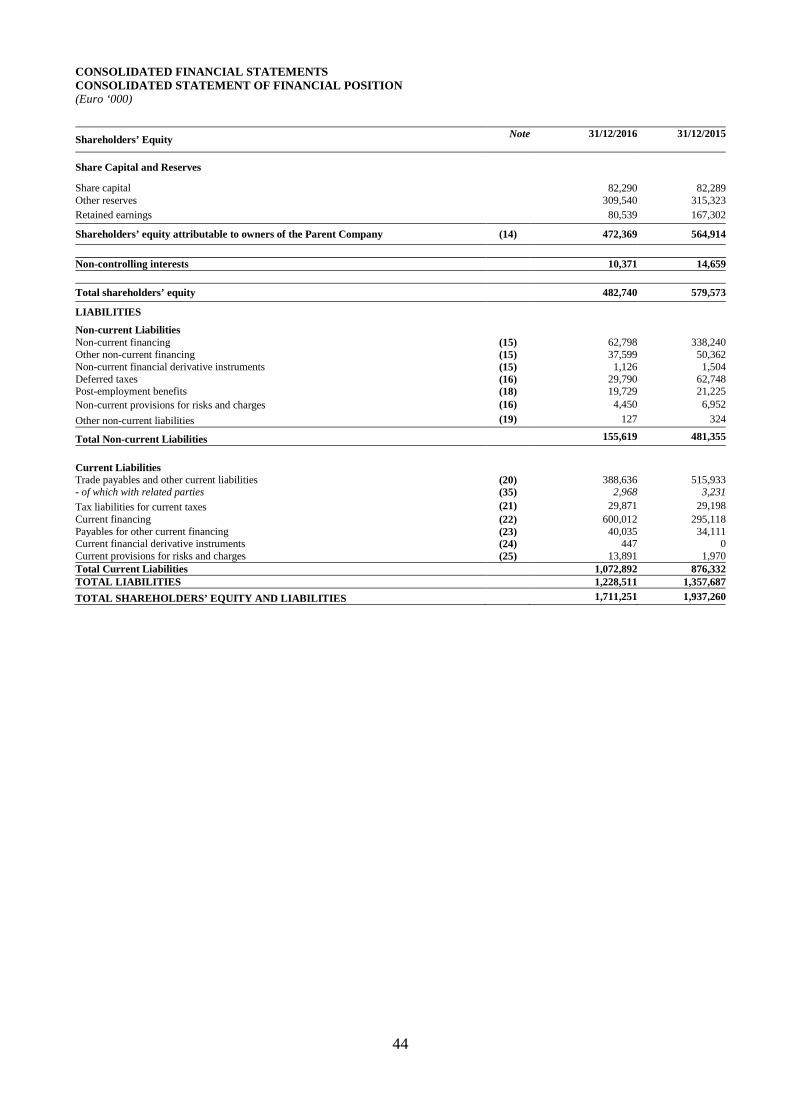
44
CONSOLIDATED FINANCIAL STATEMENTS CONSOLIDATED STATEMENT OF FINANCIAL POSITION (Euro ‘000)
Shareholders’ Equity Note 31/12/2016
31/12/2015
Share Capital and Reserves
Share capital 82,290 82,289Other reserves 309,540 315,323Retained earnings 80,539 167,302
Shareholders’ equity attributable to owners of the Parent Company (14) 472,369 564,914
Non-controlling interests 10,371 14,659
Total shareholders’ equity 482,740 579,573
LIABILITIES
Non-current Liabilities
Non-current financing (15) 62,798 338,240Other non-current financing (15) 37,599 50,362Non-current financial derivative instruments (15) 1,126 1,504Deferred taxes (16) 29,790 62,748Post-employment benefits (18) 19,729 21,225Non-current provisions for risks and charges (16) 4,450 6,952
Other non-current liabilities (19) 127 324
Total Non-current Liabilities 155,619 481,355
Current Liabilities Trade payables and other current liabilities (20) 388,636 515,933- of which with related parties (35) 2,968 3,231
Tax liabilities for current taxes (21) 29,871 29,198Current financing (22) 600,012 295,118Payables for other current financing (23) 40,035 34,111Current financial derivative instruments (24) 447 0Current provisions for risks and charges (25) 13,891 1,970Total Current Liabilities 1,072,892 876,332TOTAL LIABILITIES 1,228,511 1,357,687
TOTAL SHAREHOLDERS’ EQUITY AND LIABILITIES 1,711,251 1,937,260
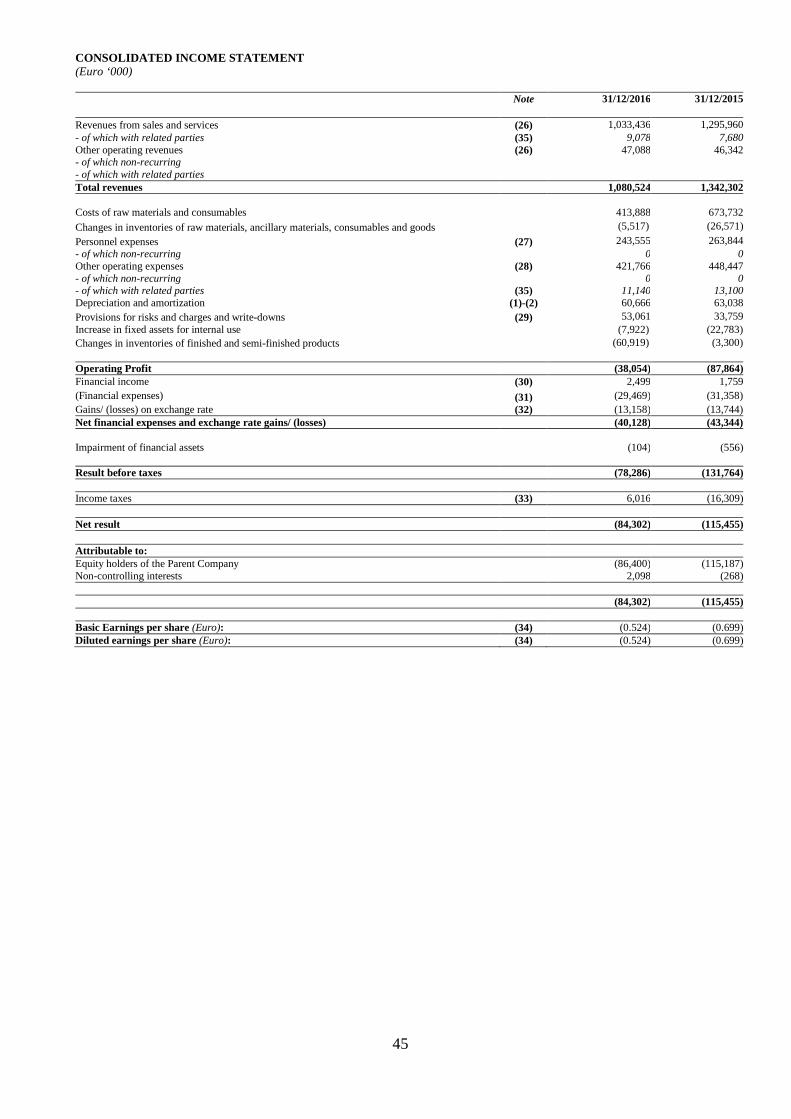
45
CONSOLIDATED INCOME STATEMENT (Euro ‘000)
Note 31/12/2016 31/12/2015
Revenues from sales and services (26) 1,033,436 1,295,960- of which with related parties (35) 9,078 7,680Other operating revenues (26) 47,088 46,342- of which non-recurring - of which with related parties Total revenues 1,080,524 1,342,302 Costs of raw materials and consumables 413,888 673,732
Changes in inventories of raw materials, ancillary materials, consumables and goods (5,517) (26,571)
Personnel expenses (27) 243,555 263,844- of which non-recurring 0 0Other operating expenses (28) 421,766 448,447- of which non-recurring 0 0- of which with related parties (35) 11,140 13,100Depreciation and amortization (1)-(2) 60,666 63,038Provisions for risks and charges and write-downs (29) 53,061 33,759Increase in fixed assets for internal use (7,922) (22,783) Changes in inventories of finished and semi-finished products (60,919) (3,300) Operating Profit (38,054) (87,864)Financial income (30) 2,499 1,759(Financial expenses) (31) (29,469) (31,358) Gains/ (losses) on exchange rate (32) (13,158) (13,744) Net financial expenses and exchange rate gains/ (losses) (40,128) (43,344) Impairment of financial assets (104) (556) Result before taxes (78,286) (131,764) Income taxes (33) 6,016 (16,309) Net result (84,302) (115,455) Attributable to: Equity holders of the Parent Company (86,400) (115,187)Non-controlling interests 2,098 (268) (84,302) (115,455) Basic Earnings per share (Euro): (34) (0.524) (0.699)Diluted earnings per share (Euro): (34) (0.524) (0.699)
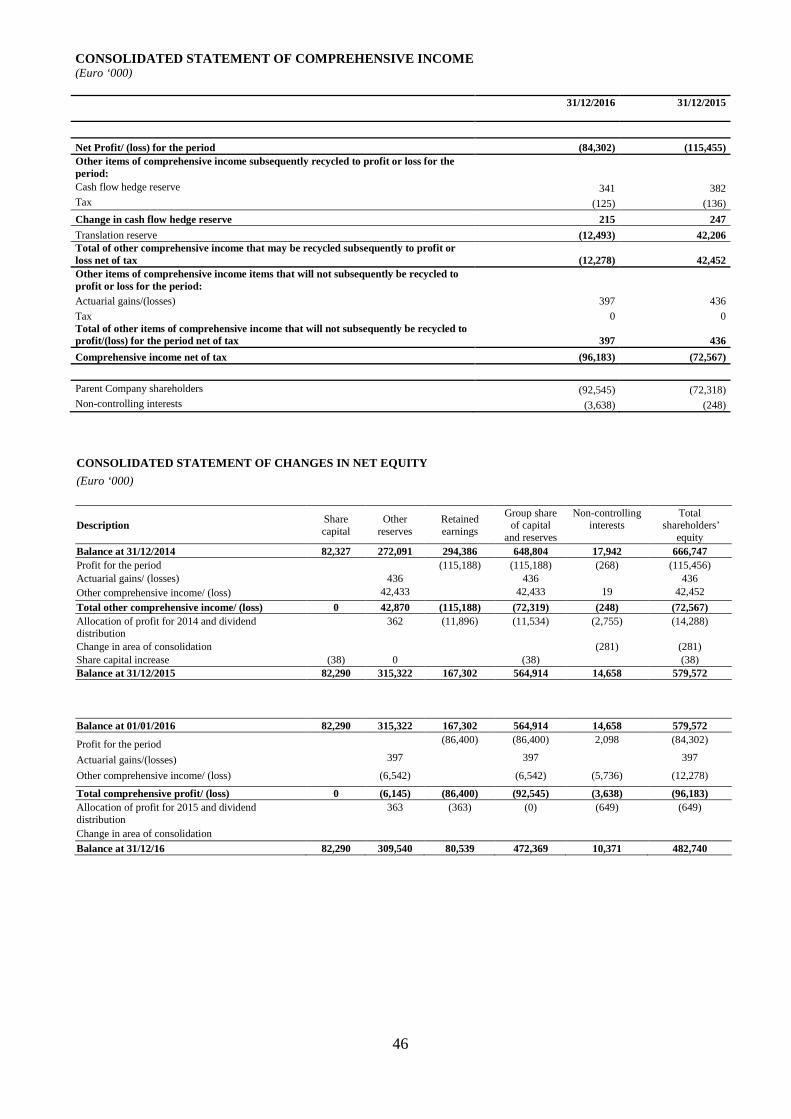
46
CONSOLIDATED STATEMENT OF COMPREHENSIVE INCOME (Euro ‘000)
31/12/2016
31/12/2015
Net Profit/ (loss) for the period (84,302) (115,455) Other items of comprehensive income subsequently recycled to profit or loss for the period: Cash flow hedge reserve 341 382 Tax (125) (136)
Change in cash flow hedge reserve 215 247
Translation reserve (12,493) 42,206 Total of other comprehensive income that may be recycled subsequently to profit or loss net of tax (12,278) 42,452 Other items of comprehensive income items that will not subsequently be recycled to profit or loss for the period: Actuarial gains/(losses) 397 436
Tax 0 0 Total of other items of comprehensive income that will not subsequently be recycled to profit/(loss) for the period net of tax 397 436
Comprehensive income net of tax (96,183) (72,567)
Parent Company shareholders (92,545) (72,318) Non-controlling interests (3,638) (248)
CONSOLIDATED STATEMENT OF CHANGES IN NET EQUITY (Euro ‘000)
Description Share capital
Other reserves
Retained earnings
Group share of capital
and reserves
Non-controlling interests
Total shareholders’
equity Balance at 31/12/2014 82,327 272,091 294,386 648,804 17,942 666,747 Profit for the period (115,188) (115,188) (268) (115,456) Actuarial gains/ (losses) 436 436 436 Other comprehensive income/ (loss) 42,433 42,433 19 42,452
Total other comprehensive income/ (loss) 0 42,870 (115,188) (72,319) (248) (72,567) Allocation of profit for 2014 and dividend distribution
362 (11,896) (11,534) (2,755) (14,288)
Change in area of consolidation (281) (281) Share capital increase (38) 0 (38) (38) Balance at 31/12/2015 82,290 315,322 167,302 564,914 14,658 579,572
Balance at 01/01/2016 82,290 315,322 167,302 564,914 14,658 579,572
Profit for the period (86,400) (86,400) 2,098 (84,302)
Actuarial gains/(losses) 397 397 397
Other comprehensive income/ (loss) (6,542) (6,542) (5,736) (12,278)
Total comprehensive profit/ (loss) 0 (6,145) (86,400) (92,545) (3,638) (96,183) Allocation of profit for 2015 and dividend distribution
363 (363) (0) (649) (649)
Change in area of consolidation
Balance at 31/12/16 82,290 309,540 80,539 472,369 10,371 482,740
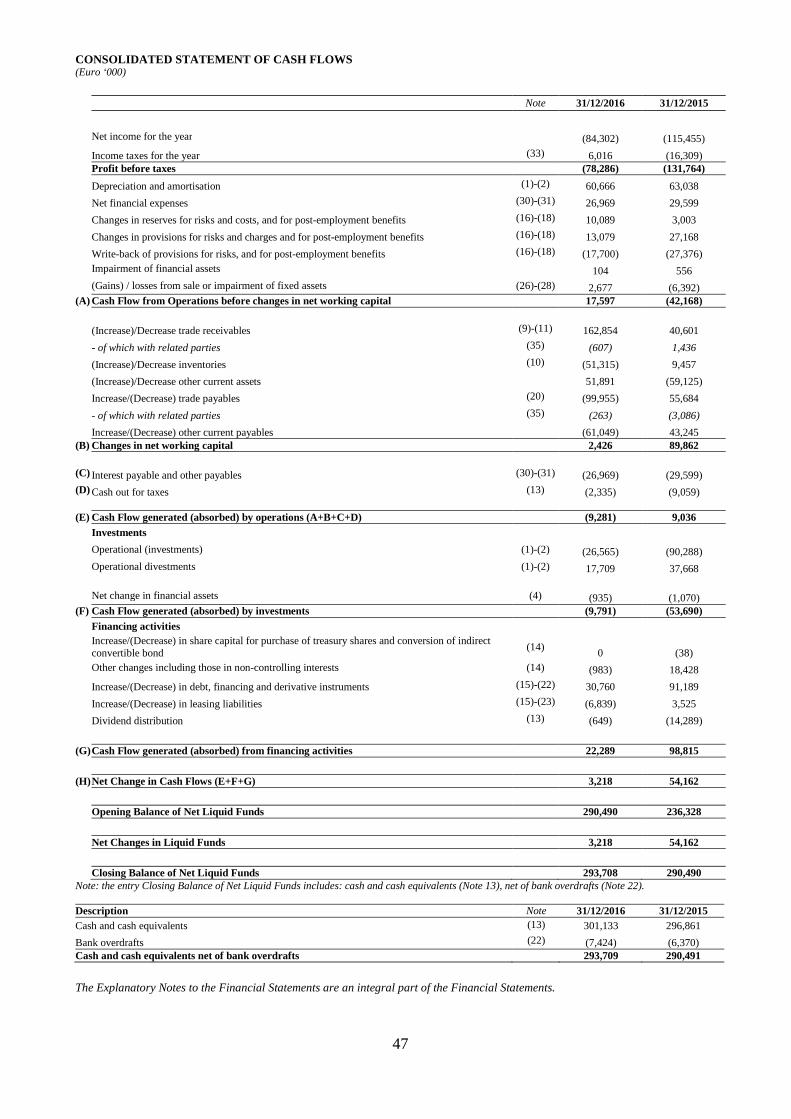
47
CONSOLIDATED STATEMENT OF CASH FLOWS (Euro ‘000) Note 31/12/2016 31/12/2015
Net income for the year (84,302) (115,455) Income taxes for the year (33) 6,016 (16,309) Profit before taxes (78,286) (131,764) Depreciation and amortisation (1)-(2) 60,666 63,038 Net financial expenses (30)-(31) 26,969 29,599 Changes in reserves for risks and costs, and for post-employment benefits (16)-(18) 10,089 3,003 Changes in provisions for risks and charges and for post-employment benefits (16)-(18) 13,079 27,168 Write-back of provisions for risks, and for post-employment benefits (16)-(18) (17,700) (27,376) Impairment of financial assets 104 556 (Gains) / losses from sale or impairment of fixed assets (26)-(28) 2,677 (6,392) (A) Cash Flow from Operations before changes in net working capital 17,597 (42,168) (Increase)/Decrease trade receivables (9)-(11) 162,854 40,601 - of which with related parties (35) (607) 1,436 (Increase)/Decrease inventories (10) (51,315) 9,457 (Increase)/Decrease other current assets 51,891 (59,125) Increase/(Decrease) trade payables (20) (99,955) 55,684 - of which with related parties (35) (263) (3,086) Increase/(Decrease) other current payables (61,049) 43,245 (B) Changes in net working capital 2,426 89,862 (C) Interest payable and other payables (30)-(31) (26,969) (29,599) (D) Cash out for taxes (13) (2,335) (9,059) (E) Cash Flow generated (absorbed) by operations (A+B+C+D) (9,281) 9,036 Investments Operational (investments) (1)-(2) (26,565) (90,288) Operational divestments (1)-(2) 17,709 37,668 Net change in financial assets (4) (935) (1,070) (F) Cash Flow generated (absorbed) by investments (9,791) (53,690) Financing activities
Increase/(Decrease) in share capital for purchase of treasury shares and conversion of indirect convertible bond
(14) 0 (38)
Other changes including those in non-controlling interests (14) (983) 18,428 Increase/(Decrease) in debt, financing and derivative instruments (15)-(22) 30,760 91,189 Increase/(Decrease) in leasing liabilities (15)-(23) (6,839) 3,525 Dividend distribution (13) (649) (14,289) (G) Cash Flow generated (absorbed) from financing activities 22,289 98,815 (H) Net Change in Cash Flows (E+F+G) 3,218 54,162 Opening Balance of Net Liquid Funds 290,490 236,328 Net Changes in Liquid Funds 3,218 54,162 Closing Balance of Net Liquid Funds 293,708 290,490 Note: the entry Closing Balance of Net Liquid Funds includes: cash and cash equivalents (Note 13), net of bank overdrafts (Note 22).
Description Note 31/12/2016 31/12/2015 Cash and cash equivalents (13) 301,133 296,861
Bank overdrafts (22) (7,424) (6,370) Cash and cash equivalents net of bank overdrafts 293,709 290,491
The Explanatory Notes to the Financial Statements are an integral part of the Financial Statements.
48
NOTES TO THE 2016 CONSOLIDATED FINANCIAL STATEMENTS
(Tables in Euro ‘000)
Introduction
TREVI - Finanziaria Industriale S.p.A. (the “Company”) and its subsidiaries (the “TREVI Group” or
“the Group”) operates in the two following sectors:
• Foundation engineering services for civil works and infrastructure projects and construction of
equipment for special foundations (“Special Foundations – (the Core Business)”);
• Construction of drill rigs for the extraction of hydrocarbons and water exploration and oil drilling
services (“Oil & Gas”).
These businesses are organised within the four main companies of the Group:
• Trevi S.p.A., which heads the sector of foundation engineering;
• Petreven S.p.A., which operates in the drilling sector providing oil drilling services;
• Soilmec S.p.A., which heads the Division manufacturing and marketing plant and equipment for
foundation engineering;
• Drillmec S.p.A., which manufactures and sells drilling equipment for the extraction of hydrocarbons
and water exploration.
TREVI – Finanziaria Industriale S.p.A is controlled by Trevi Holding SE which, in turn, is controlled by
I.F.I.T. S.r.l.. TREVI – Finanziaria Industriale S.p.A. has been listed on the Milan stock exchange since July
1999.
General presentation criteria
These Financial Statements were approved and authorised to be made public by the Board of Directors on 12
April 2017. The Shareholders’ Meeting has the power to alter the Financial Statements as proposed by the
Board of Directors.
The 2016 Consolidated Financial Statements have been prepared and presented in compliance with the
International Financial Reporting Standards (“IFRS”) issued by the International Accounting Standards Board
(IASB) and adopted by the European Commission and by the provisions of Article 9 of Legislative Decree no.
38/2005. By IFRS it is intended to include also all the International Accounting Standards (IAS) that have
been reviewed and all the interpretations of the International Financial Reporting Interpretations Committee
(IFRIC), previously known as the Standing Interpretations Committee (SIC). The Financial Statements are
prepared using historic cost except for financial derivatives, which are recognised at fair value.
The Consolidated Financial Statements of the TREVI Group have been prepared on a going concern basis
although the Group reported for the full-year 2016: i) a loss of Euro 86.4 million, linked, as described above
in the Directors’ Report on Operations, to the unforeseeable performance of the Brent oil price, which caused
the results of the Oil & Gas Division to be below estimates and ii) net debt of Euro 441 million due, in part, to
the circumstances under point i) above but also to significant delays in the receipt of some orders and interim
payments on contracts already in the order portfolio at 31 December 2016.
49
As a consequence of the non-recurring circumstances described above that had a material effect on the
economic and financial results of the second semester and on the full-year results, the Group failed to meet one
of the financial covenants of its bank loans at 31 December 2016, specifically the Net Debt/EBITDA ratio, and
also the two financial covenants of the Euro 50 million bond loan, the Net Debt/ EBITDA and EBITDA/Net
Financial Costs ratios.
The Directors of TREVI - Finanziaria Industriale S.p.A.:
• At 31 December 2016, reclassified as current debt the sum total of all the loans for which the financial
covenants had not been met;
• Asked the lender banks from 16 January 2017 to accept the Company request that the failure to meet
one of the financial covenants (Net Debt/ EBITDA) should not be considered a significant event under
the loan agreements and that this ratio be measured on 31 December 2017;
• Convened the Bondholders’ Meeting on 10 March 2017 where the request of the Company for a
waiver was approved under the provisions of Article 12 paragraphs (vii) and (viii) of the terms and
conditions of the bond and amended the terms and conditions under paragraph (ii) of the bond as
described in the text published on the Company website on 8 February 2017. The effective
implementation of the resolutions approved by the Bondholders’ Meeting was subject to the condition
that the Company be granted waivers, by 20 April 2017, on the financial covenants at 31 December
2016 under its bank loans covering a minimum of 75% of the residual amount of these loans.
With regard to Debt totalling approximately Euro 212 million that is part of the loans subject to the one
financial covenant that was not met, at the date of these Financial Statements and Consolidated Financial
Statements of TREVI - Finanziaria Industriale S.p.A.:
• waivers had been received from all the banks involved;
• the Board of Directors at its extraordinary meeting on today’s date ascertained that the suspensive
condition approved by the Bondholders’ Meeting had been met and approved the resolution of the
Bondholders’ Meeting.
The Directors applied the accounting standards for companies operating on a going concern basis when
deciding if the Company could be considered a going concern and based this on:
a) the feasibility of the 2017-2021 Group Business Plan approved by the Board of Directors taking into
consideration the negotiations with the banks that led to the waiver letters being issued and the negotiations
with the same banks to ensure the financial means of implementing the Business Plan;
b) the reasonableness of the assumptions underlying the 2017-2021 Business Plan that, albeit challenging,
should be attainable by the four Group Divisions i) the actions implemented and/or scheduled to be
implemented by the Group management, ii) current available evidence on revenue cover provided by the order
portfolio and iii) the past performance of each Division;
c) obtaining letters of waiver from all the banks for all the existing loans that declare that the failure to meet
one of the financial covenants (Net Debt/EBITDA) should not be considered a significant event and that this
ratio will be measured again on 31 December 2017, which made effective the resolution approved by the
Bondholders’ Meeting of 10 March 2017.
50
The Board of Directors authorised the Chairman and the Managing Director to release the information that the
waivers from the banks had been obtained.
The Consolidated Financial Statements give comparative information for the preceding financial year.
Financial Statement accounts and tables
The Consolidated Income Statement uses aggregated costs as this classification is deemed more useful for
understanding the results of the Group.
The Consolidated Statement of Comprehensive Income includes the result for the period and changes in net
equity other than transactions with shareholders.
The Statement of Financial Position is classified using the operating cycle of the Company to make the
distinction between current and non-current items. On this basis, assets and liabilities are considered current if
it is assumed that they will be realized or settled within a normal operating cycle of the Group and within
twelve months of the end of the reporting period.
The Consolidated Statement of Cash Flows is prepared using the indirect method to determine financial flows
deriving from financial or investment activities.
In preparing the Consolidated Financial Statements, the Parent Company and the Italian and foreign
subsidiaries have prepared their income statements, statements of financial position and cash flow data using
IAS/IFRS, adjusting the figures prepared using locally enacted regulations. The reporting packages of
subsidiaries, associates and joint ventures are available at the registered office of TREVI - Finanziaria
Industriale S.p.A.
Consolidation criteria
The Consolidated Financial Statements include the Financial Statements of TREVI - Finanziaria Industriale
S.p.A and its subsidiaries at 31 December 2016.
Subsidiaries:
Control of a company is obtained when both power and variable returns are present and derive from its
involvement with the investee and when the investor has the power to direct the activities that significantly
influence returns.
Under IFRS 10, companies are investees if and only if the Parent Company:
• has power over the investee (or has valid rights that give it the current ability to direct the activities of
the investee)
• is exposed or has rights to variable returns from its involvement with the investee; and
• can use its power over the investee to affect the returns.
When the Group holds less than 50% of the voting rights (or similar rights) it must consider all the relevant
facts and circumstances to establish if it controls the investee.
The Group assesses whether control of an investee entity exists if the facts and circumstances indicate that
there has been a change in one or more of the three criteria that define the existence of control.
51
The financial statements of all the subsidiaries have the same year-end accounting date as the Parent
Company, TREVI - Finanziaria Industriale S.p.A.
The accounts of subsidiaries are consolidated using the line by line method from the time that control is
acquired until such time as this control is relinquished. Line by line consolidation requires that the assets and
liabilities, as well as the costs and revenues of the entities to be consolidated, are fully consolidated,
attributing the share of the investments in net equity and the result for the period to the relevant entries of the
Statement of Financial Position, Income Statement and Statement of Comprehensive Income.
Under IFRS 10, the total loss (including the profit/loss for the period) is attributed to the shareholders of the
controlling entity and non-controlling interests also when the net equity attributable to non-controlling
interests is negative.
The reciprocal debit/credit and cost/revenue relationships for companies within the area of consolidation and
the effects of all significant transactions among these companies are eliminated. Unrealised profits with third
parties deriving from intergroup transactions, including those from a valuation of inventories at the end of the
reporting period, are eliminated.
The carrying value of the investments in each subsidiary is eliminated for the corresponding amount of net
equity of each of the subsidiaries including any eventual fair value adjustments for impairment at the date
control was acquired. Goodwill at the acquisition date is calculated as described below and is recognised in
intangible assets whilst any “profit from a bargain purchase (or negative goodwill)” is recognised in profit or
loss.
Under IFRS 10, the partial disposal of an investment in a subsidiary while control is retained is accounted for
as an equity transaction. In these circumstances, the carrying value of the increased or decreased investment is
adjusted to reflect the change of the investment in the subsidiary. Any difference between the value adjusted
for non-controlling interests and the fair value of the acquisition price paid or received is recognised directly
in equity and attributed to the shareholders of the Parent Company. On the loss of control of a business it:
• derecognises the assets (including any goodwill) and liabilities of the subsidiary according to their
carrying values on the date that control is lost
• derecognises the carrying amount of any non-controlling interests in the former subsidiary on the date
that control is lost (including any other item of other comprehensive income attributable to it)
• recognises the fair value of any consideration received as a result of the transaction, the event or
circumstances that determined the loss of control
• recognises, if the transaction that resulted in the loss of control involves a distribution of shares of the
subsidiary to owners in their capacity as owners, that distribution
• recognises any investment retained in the former subsidiary at its fair value on the date control is lost
• reclassifies in profit or loss for the year, or to retained earnings if required under other IFRSs, the
share of the investor previously recognised in other comprehensive income;
• recognises the gain or loss associated with the loss of control attributable to the former controlling
interest.
52
Associate companies:
Associate companies are those in which the Group exercises significant influence. Significant influence is
when it can influence the financial and management policies of the associate without having control or joint
control over it. It is deemed to have significant influence when it holds an important share (between 20% and
50%) of the voting rights in the Shareholders’ Meeting of a company.
Investments in associates are consolidated using the equity method in accordance with IAS 28 – Investments
in Associates and Joint Ventures.
The investment is initially recognised at cost and subsequently at cost adjusted for the changes in the share of
net equity of the investor in the investment.
The Group’s share of the profits or losses of associated companies, following acquisition of the shareholdings
in associate companies, is recognized in profit or loss for the period.
Unrealised gains or losses from transactions with associates are eliminated to the extent of the Group’s
interest in the associate.
Having applied the equity method of accounting, the Group evaluates if it is necessary to recognise an
impairment of its investment in the associate company. At the end of every reporting period, the Group
measures if there is any objective evidence that an investment in an associate company is impaired. The
Group calculates the impairment as the difference between the recoverable amount of an investment in an
associate and its carrying value and recognises any difference in profit or loss under the entry, profit/loss from
associates.
Use of the equity method ceases from the date that significant influence ceases and the residual amount of the
investment is recognised at fair value. The difference between the sum of the proceeds received and any
retained interest and the carrying amount of the associate at the date significant influence is lost is recognised
in profit or loss.
Joint Ventures:
IFRS 11 – Joint Arrangements defines joint control as the contractually agreed sharing of control of an
arrangement, which exists only when decisions about the relevant activities require the unanimous consent of
the parties sharing control. A joint venture is a joint arrangement whereby the parties that have joint control of
the arrangement have rights to the net assets of the arrangement. Under IFRS 11, a joint venturer recognises
its interest in a joint venture as an investment and accounts for that investment using the equity method in
accordance with IAS 28 - Investments in Associates and Joint Ventures.
Translation into Euro of the financial statements of foreign companies:
The Consolidated Financial Statements are in Euro, which is the functional and presentation currency of the
Parent Company.
The financial statements of foreign companies that are consolidated are converted into Euro applying the
current exchange rate method, which requires the use of exchange rates prevailing at the year-end for assets
and liabilities and the average exchange rates for the financial period for the income statements. Exchange
rate differences deriving from the translation of the opening net equity at the exchange rate prevailing at the
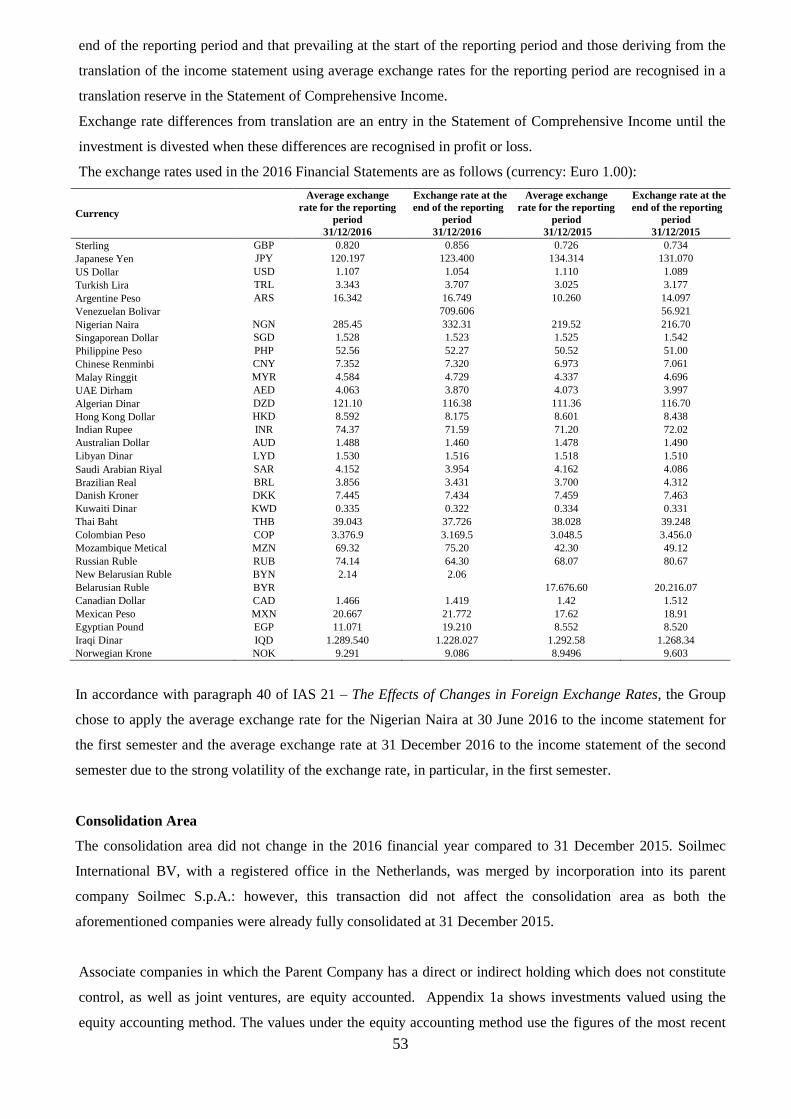
53
end of the reporting period and that prevailing at the start of the reporting period and those deriving from the
translation of the income statement using average exchange rates for the reporting period are recognised in a
translation reserve in the Statement of Comprehensive Income.
Exchange rate differences from translation are an entry in the Statement of Comprehensive Income until the
investment is divested when these differences are recognised in profit or loss.
The exchange rates used in the 2016 Financial Statements are as follows (currency: Euro 1.00):
Currency
Average exchange rate for the reporting
period 31/12/2016
Exchange rate at the end of the reporting
period 31/12/2016
Average exchange rate for the reporting
period 31/12/2015
Exchange rate at the end of the reporting
period 31/12/2015
Sterling GBP 0.820 0.856 0.726 0.734 Japanese Yen JPY 120.197 123.400 134.314 131.070 US Dollar USD 1.107 1.054 1.110 1.089 Turkish Lira TRL 3.343 3.707 3.025 3.177 Argentine Peso ARS 16.342 16.749 10.260 14.097 Venezuelan Bolivar
709.606
56.921 Nigerian Naira NGN 285.45 332.31 219.52 216.70 Singaporean Dollar SGD 1.528 1.523 1.525 1.542 Philippine Peso PHP 52.56 52.27 50.52 51.00 Chinese Renminbi CNY 7.352 7.320 6.973 7.061 Malay Ringgit MYR 4.584 4.729 4.337 4.696 UAE Dirham AED 4.063 3.870 4.073 3.997 Algerian Dinar DZD 121.10 116.38 111.36 116.70 Hong Kong Dollar HKD 8.592 8.175 8.601 8.438 Indian Rupee INR 74.37 71.59 71.20 72.02 Australian Dollar AUD 1.488 1.460 1.478 1.490 Libyan Dinar LYD 1.530 1.516 1.518 1.510 Saudi Arabian Riyal SAR 4.152 3.954 4.162 4.086 Brazilian Real BRL 3.856 3.431 3.700 4.312 Danish Kroner DKK 7.445 7.434 7.459 7.463 Kuwaiti Dinar KWD 0.335 0.322 0.334 0.331 Thai Baht THB 39.043 37.726 38.028 39.248 Colombian Peso COP 3.376.9 3.169.5 3.048.5 3.456.0 Mozambique Metical MZN 69.32 75.20 42.30 49.12 Russian Ruble RUB 74.14 64.30 68.07 80.67 New Belarusian Ruble BYN 2.14 2.06
Belarusian Ruble BYR
17.676.60 20.216.07
Canadian Dollar CAD 1.466 1.419 1.42 1.512 Mexican Peso MXN 20.667 21.772 17.62 18.91 Egyptian Pound EGP 11.071 19.210 8.552 8.520 Iraqi Dinar IQD 1.289.540 1.228.027 1.292.58 1.268.34 Norwegian Krone NOK 9.291 9.086 8.9496 9.603
In accordance with paragraph 40 of IAS 21 – The Effects of Changes in Foreign Exchange Rates, the Group
chose to apply the average exchange rate for the Nigerian Naira at 30 June 2016 to the income statement for
the first semester and the average exchange rate at 31 December 2016 to the income statement of the second
semester due to the strong volatility of the exchange rate, in particular, in the first semester.
Consolidation Area
The consolidation area did not change in the 2016 financial year compared to 31 December 2015. Soilmec
International BV, with a registered office in the Netherlands, was merged by incorporation into its parent
company Soilmec S.p.A.: however, this transaction did not affect the consolidation area as both the
aforementioned companies were already fully consolidated at 31 December 2015.
Associate companies in which the Parent Company has a direct or indirect holding which does not constitute
control, as well as joint ventures, are equity accounted. Appendix 1a shows investments valued using the
equity accounting method. The values under the equity accounting method use the figures of the most recent
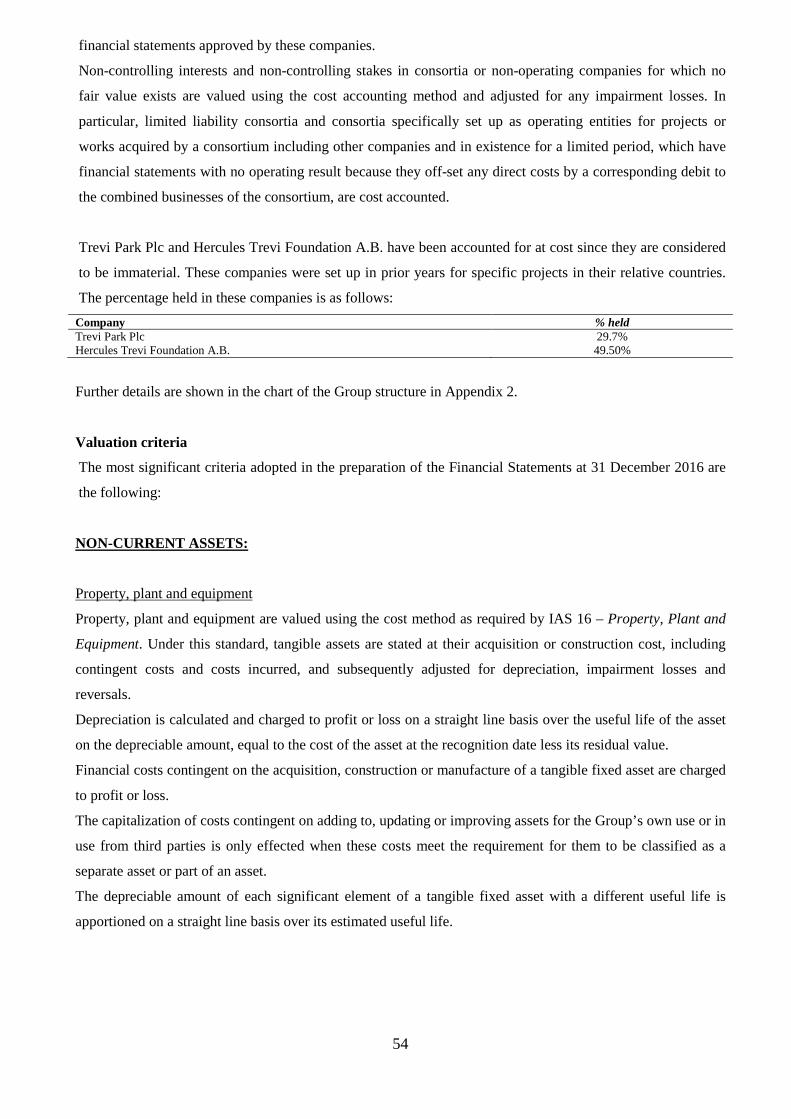
54
financial statements approved by these companies.
Non-controlling interests and non-controlling stakes in consortia or non-operating companies for which no
fair value exists are valued using the cost accounting method and adjusted for any impairment losses. In
particular, limited liability consortia and consortia specifically set up as operating entities for projects or
works acquired by a consortium including other companies and in existence for a limited period, which have
financial statements with no operating result because they off-set any direct costs by a corresponding debit to
the combined businesses of the consortium, are cost accounted.
Trevi Park Plc and Hercules Trevi Foundation A.B. have been accounted for at cost since they are considered
to be immaterial. These companies were set up in prior years for specific projects in their relative countries.
The percentage held in these companies is as follows:
Company % held Trevi Park Plc 29.7% Hercules Trevi Foundation A.B. 49.50%
Further details are shown in the chart of the Group structure in Appendix 2.
Valuation criteria
The most significant criteria adopted in the preparation of the Financial Statements at 31 December 2016 are
the following:
NON-CURRENT ASSETS:
Property, plant and equipment
Property, plant and equipment are valued using the cost method as required by IAS 16 – Property, Plant and
Equipment. Under this standard, tangible assets are stated at their acquisition or construction cost, including
contingent costs and costs incurred, and subsequently adjusted for depreciation, impairment losses and
reversals.
Depreciation is calculated and charged to profit or loss on a straight line basis over the useful life of the asset
on the depreciable amount, equal to the cost of the asset at the recognition date less its residual value.
Financial costs contingent on the acquisition, construction or manufacture of a tangible fixed asset are charged
to profit or loss.
The capitalization of costs contingent on adding to, updating or improving assets for the Group’s own use or in
use from third parties is only effected when these costs meet the requirement for them to be classified as a
separate asset or part of an asset.
The depreciable amount of each significant element of a tangible fixed asset with a different useful life is
apportioned on a straight line basis over its estimated useful life.
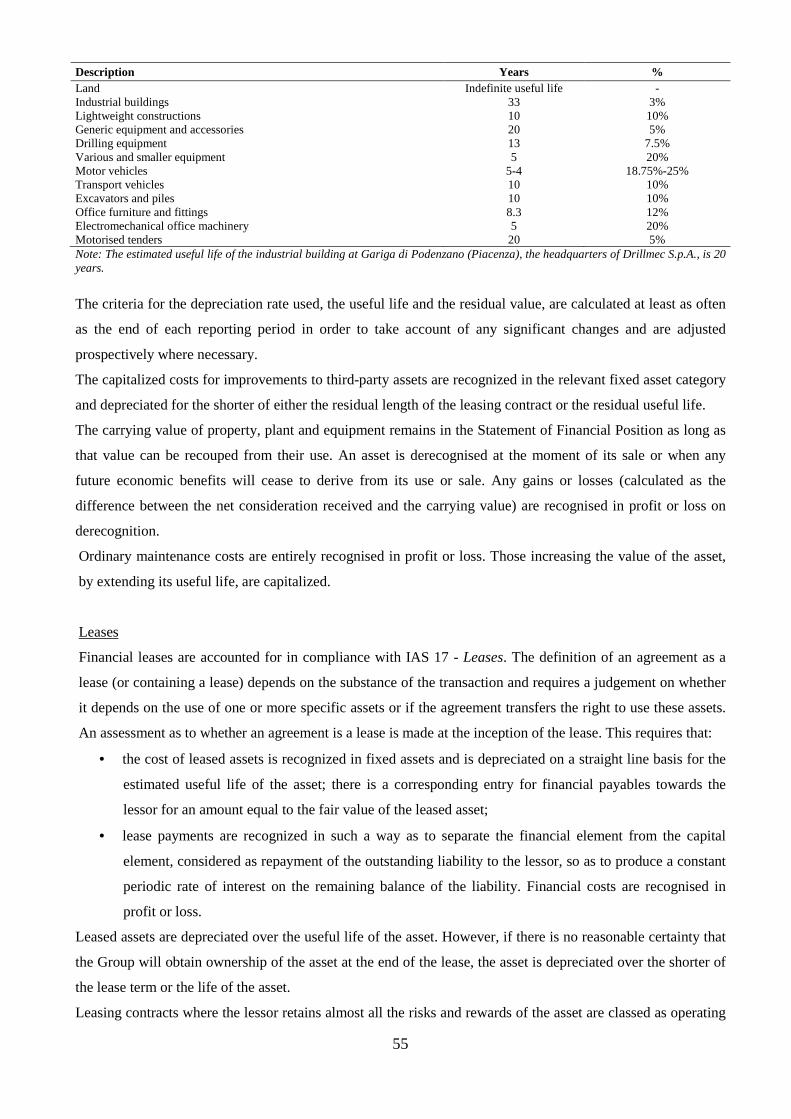
55
Description Years % Land Indefinite useful life - Industrial buildings 33 3% Lightweight constructions 10 10% Generic equipment and accessories 20 5% Drilling equipment 13 7.5% Various and smaller equipment 5 20% Motor vehicles 5-4 18.75%-25% Transport vehicles 10 10% Excavators and piles 10 10% Office furniture and fittings 8.3 12% Electromechanical office machinery 5 20% Motorised tenders 20 5% Note: The estimated useful life of the industrial building at Gariga di Podenzano (Piacenza), the headquarters of Drillmec S.p.A., is 20 years.
The criteria for the depreciation rate used, the useful life and the residual value, are calculated at least as often
as the end of each reporting period in order to take account of any significant changes and are adjusted
prospectively where necessary.
The capitalized costs for improvements to third-party assets are recognized in the relevant fixed asset category
and depreciated for the shorter of either the residual length of the leasing contract or the residual useful life.
The carrying value of property, plant and equipment remains in the Statement of Financial Position as long as
that value can be recouped from their use. An asset is derecognised at the moment of its sale or when any
future economic benefits will cease to derive from its use or sale. Any gains or losses (calculated as the
difference between the net consideration received and the carrying value) are recognised in profit or loss on
derecognition.
Ordinary maintenance costs are entirely recognised in profit or loss. Those increasing the value of the asset,
by extending its useful life, are capitalized.
Leases
Financial leases are accounted for in compliance with IAS 17 - Leases. The definition of an agreement as a
lease (or containing a lease) depends on the substance of the transaction and requires a judgement on whether
it depends on the use of one or more specific assets or if the agreement transfers the right to use these assets.
An assessment as to whether an agreement is a lease is made at the inception of the lease. This requires that:
• the cost of leased assets is recognized in fixed assets and is depreciated on a straight line basis for the
estimated useful life of the asset; there is a corresponding entry for financial payables towards the
lessor for an amount equal to the fair value of the leased asset;
• lease payments are recognized in such a way as to separate the financial element from the capital
element, considered as repayment of the outstanding liability to the lessor, so as to produce a constant
periodic rate of interest on the remaining balance of the liability. Financial costs are recognised in
profit or loss.
Leased assets are depreciated over the useful life of the asset. However, if there is no reasonable certainty that
the Group will obtain ownership of the asset at the end of the lease, the asset is depreciated over the shorter of
the lease term or the life of the asset.
Leasing contracts where the lessor retains almost all the risks and rewards of the asset are classed as operating
56
leases and the lease payments are recognised as an expense in profit or loss over the lease term on a straight-
line basis.
Leasing contracts where the lessor retains almost all the risks and rewards of the asset are classed as operating
leases.
Business combinations
Business combinations are recognised using the acquisition method whereby the transaction cost of a business
combination is valued at fair value, (calculated as the fair value of the assets transferred and liabilities assumed
by the Group at the date of acquisition and of any equity instruments issued in exchange for control of the
acquired entity and the value of non-controlling interests in the entity acquired). All other costs directly
associated with the transaction are immediately expensed in profit or loss.
The fair value of the identifiable assets acquired and the liabilities assumed are measured at fair value at the
acquisition date; the following entries are excluded and are measured in accordance with the relevant
accounting standard:
• deferred tax liabilities and deferred tax assets;
• assets and liabilities for employee benefits;
• share-based payment for the acquired entity or payment with Group shares issued in exchange for
contracts of the acquired entity;
• held for sale assets and discontinued operations.
Goodwill is the difference between the cost of the acquisition, the net equity attributable to non-controlling
interests and the fair value of any previously held equity interest in the entity and the acquiring enterprise’s
fair value of the identifiable assets acquired less the liabilities assumed. If the difference between the net of the
acquisition-date amounts of the identifiable assets acquired and the liabilities assumed exceeds the
consideration transferred for the business combination, the amount of any non-controlling interest and the
acquisition-date fair value of any previously held equity interest in the acquiree, the excess sum is
immediately recognised in profit or loss as income from the transaction.
Non-controlling interests are measured at the transaction date using either the fair value of the non-
controlling interests or the proportionate interest of the fair value of net identifiable assets of the entity
acquired. The method used is decided on a transaction by transaction basis.
Any contingent considerations in the business combination contract are valued at fair value on the acquisition
date and included in the consideration transferred for the business combination in order to measure goodwill.
Subsequent adjustments to this fair value that are considered a measurement period adjustment are made
against goodwill. Adjustments to fair value that are measurement period adjustments are those arising
from additional information that affects the facts and circumstances as they existed at the acquisition date
obtained during the measurement period (which cannot exceed twelve months from the date of the business
combination).
When a business acquisition is achieved in stages (step acquisition) any previously held equity interest is
measured at fair value at the date of obtaining control and any resulting adjustments are recognised in
57
profit or loss. A previously held interest recognised in other profit or loss is treated as if the acquirer had
disposed of its previously held interest.
If the initial accounting for a business combination can be determined only provisionally by the end of the first
reporting period, the Group uses provisional values in the Consolidated Financial Statements for those entries
where determination is impossible. There is a measurement period adjustment in the fair value if additional
information is obtained after the acquisition date that affects the facts or circumstances as they existed at the
acquisition date which, if known, would have had an effect on the values of the liabilities and assets recognised
at that date.
Business combinations from before 1 January 2010 are recognised under the previous version of IFRS 3.
Goodwill
Goodwill arising on a business combination is recognised at cost on the date of acquisition as described in the
preceding section. Goodwill is not amortised but is subject to impairment testing at least annually and more
frequently if there is any evidence of impairment. In order to test for impairment, goodwill acquired in a
business combination is allocated at the acquisition date to the Group cash generating units that will benefit
from the synergies of the combination irrespective of whether other assets or liabilities of the acquiree are
assigned to those cash generating units. After initial recognition, goodwill is measured at cost less any
impairment stemming from the impairment tests.
At the disposal date of part or of an entire investment for which there was goodwill at the acquisition date, the
capital gain or loss on disposal takes account of the residual value of the goodwill.
Intangible assets
Intangible assets acquired or produced internally are recognized at the cost of acquisition or production when
it is probable that use of the asset will produce future economic benefits and when the cost of acquiring or
producing the asset can be reliably determined. These assets are valued at acquisition or production cost.
Those intangible assets having a finite useful life are depreciated on a straight line basis over the estimated
useful life of the assets as follows:
− Development costs:
Research costs are recognized in profit or loss at the time they are incurred. Development costs that are
required by IAS 38 – Intangible Assets to be classified as an asset (when there is the technical capacity, the
intention and capability, the availability of necessary resources to complete the asset for use or sale, or the
ability exists to make a reliable assessment of the attributable development costs) are usually depreciated over
five years on the basis of their estimated future useful life from the moment such assets are available for
economic use. The useful life is assessed and modified if there is any estimated change in its future usefulness.
− Industrial patents, use of intellectual property, concessions, licences and brands:
These are valued at cost net of accumulated depreciation, calculated on a straight line basis for the duration of
the useful life barring any significant impairment. The criteria for depreciation, useful life and residual value
58
are examined and measured at least as often as the end of each financial year in order to take account of any
significant changes.
Intangible assets with an indefinite useful life are not amortised but are subject, at least annually, to an
impairment test, both as an individual asset and as part of a cash generating unit. The useful life of an
intangible asset that is not being amortised is reviewed at the end of each reporting period to determine
whether events and circumstances continue to support an indefinite useful life assessment for the asset. If they
do not, the change in the useful life assessment from indefinite to finite is accounted for as a change in an
accounting estimate.
Any gains or losses on derecognition of an intangible asset are calculated as the difference between the net
consideration received and the carrying value and are recognised in profit or loss in the reporting period in
which the intangible asset is derecognized.
Impairment
The Group tests goodwill and other intangible assets (including capitalised development costs) for impairment
at least annually at the end of the reporting period, or more often if there is any evidence that an asset has been
impaired. The recoverable value of tangible assets (land and buildings, plant and machinery, industrial and
commercial equipment, other fixed assets under construction) are tested for impairment any time there is an
indication that an asset has been impaired and at least annually.
If there is evidence of impairment, the carrying value of the asset is reduced to the recoverable value.
Intangible assets with an indefinite life are tested for impairment at least annually at the end of the reporting
period, or more often if there is any evidence that an asset has been impaired.
When the recoverable value of a single asset cannot be measured, the Group estimates the recoverable value of
the cash-generating unit to which it belongs.
The recoverable amount of the asset is assessed by comparing the carrying value with the higher of the net
selling price of the asset and its value in use. The value in use is the discounted present value of future cash
flows, pre-tax, using a pre-tax discount rate that reflects the time value of money represented by the current
market risk-free rate of interest and the uncertainty inherent in the asset. Impairment is recognised when
carrying value exceeds the recoverable value.
With the exception of goodwill, when the impairment of an asset no longer exists or decreases, the carrying
value of the asset or cash-generating unit is reinstated only up to the new estimate of recoverable value. The
reinstated value cannot exceed the value that would have been measured if there had been no impairment.
Reversal of an impairment loss is recognised immediately in profit or loss.
Investment property
This item in the Statement of Financial Position includes fixed assets which under IAS 40 - Investment
Property are not considered essential to the business activities of the company.
Such assets include property held to earn rental or for capital appreciation when the cost of the property can be
reliably measured and the future economic benefits associated with it will flow to the business; the cost is
depreciated on the basis of the estimated future economic life of the asset.
59
Financial assets
In compliance with IAS 39 – Financial Instruments: Recogntion and Measurement, financial assets are
designated under the following categories:
• Held-to-maturity investments: investments in financial assets with fixed maturities and determinable or
fixed payments which the Group has the intention and capacity to hold to maturity;
• Available-for-sale financial assets: financial assets other than those in the preceding paragraph or
those designated as such from the start.
• Loans and receivables: these are non-derivative financial assets with fixed or determinable payments
that are not quoted in an active market.
• Financial assets at fair value through profit or loss: this category includes both held for trading assets
and assets designated on initial recognition as assets to be measured at fair value with fair value
changes in profit or loss. Held for trading assets are financial assets acquired or held for the purpose of
selling in the short-term or for which there is a recent pattern of short-term profit taking. All
derivatives, except those designated as hedging instruments under IAS 39, are held for trading
financial assets.
The Group decides the designation of the financial assets at the moment of acquisition; the initial recognition
is the fair value at the acquisition date, including transaction costs; for purchase or sale date, the settlement
date of the transaction is intended.
After initial recognition, the financial assets at fair value through profit and loss and the available-for-sale
financial assets are measured at fair value. Gains or losses deriving from variations in the fair values of the
financial assets at fair value through profit and loss are recognized in profit or loss in the financial year they
occur. The unrealised gains or losses deriving from variations in the fair value of assets designated as financial
assets available for sale are recognized in equity.
Held-to-maturity investments, as well as loans and financial receivables are measured at amortised cost using
the effective interest method net of any persistent impairment loss. The effective interest rate is the rate that
exactly discounts estimated future cash payments or receipts through the expected life of the financial
instrument to the net carrying amount of the financial asset or liability and is recognised as financial income in
profit or loss. Impairment losses are recognised in profit or loss as financial costs.
The fair value of financial assets is measured on the basis of listed offer prices or financial models. The fair
value of unlisted financial assets is estimated using valuation techniques appropriate to the characteristics of
the issuer. Financial assets for which the current value cannot be reliably determined are accounted for at cost
less impairment.
At the end of each reporting period, the presence of any indications that assets may be impaired is assessed
and any losses are charged to profit or loss. Previously recognized impairment losses are reversed if the reason
for the original recognition of the impairment no longer exists.
Treasury shares
In accordance with IAS 32 – Financial Instruments: Presentation, when the Group’s own equity instruments
60
are reacquired, these treasury shares are deducted from equity under the entry treasury shares. Gains or losses
are not recognized in profit or loss on the purchase, sale or cancellation of treasury shares.
Any consideration paid or received, including any transaction costs directly attributable to the capital
transaction, net of any associated tax benefit, is recognized directly as a change in net equity.
The voting rights of treasury shares are cancelled as is their right to dividends. Treasury shares are used to
meet the obligations of any options on shares that are exercised.
Trade receivables, financial receivables and other non-current financial assets
Non-current receivables and other non-current financial assets are initially recognised at fair value and
subsequently valued at amortised cost.
Financial assets either singly or as part of a cash-generating unit are regularly tested for impairment. Any
impairment loss is immediately recognised as an expense in profit or loss.
Investments in other entities
Investments in entities that are not subsidiaries, associates or joint ventures are recognised at the acquisition
date in investments, and valued at cost when the fair value cannot be measured reliably; in this case the cost is
adjusted for any impairment in accordance with IAS 39.
Grants
In accordance with IAS 20 - Accounting for Government Grants and Disclosure of Government Assistance,
grants are recognised, even without a formal confirmation, when there is a reasonable assurance that the
company will adhere to the conditions attached to the grant and that the grant will be received.
The grant is recognized in profit or loss on the basis of the useful life of the benefit for which it is given, by
means of the deferral method in order to deduct the calculated depreciation.
A grant relating to expenses and costs already incurred or for immediate financial support to a company, with
no future related costs, is recognised as income in the period in which it is received.
CURRENT ASSETS
Inventories
Inventories are carried at the lower of purchase cost and net realisable value; any impairment losses accounted
for are reversed if in future financial periods the causes of the impairment no longer exist.
The cost is calculated using the average weighted cost method for raw materials, ancillary materials,
consumables and semi-finished materials and the specific cost for the other categories of inventories.
The net realisable value is the estimated selling price in the ordinary course of business, less the estimated cost
of depreciation and the estimated costs necessary to make the sale.
Contract work in progress
61
A construction contract is defined by IAS 11 - Construction Contracts as a contract specifically negotiated for
the construction of an asset or a group of interrelated assets or interdependent as far as regards their planning,
technology and function or their final use. Contract costs are expensed in the financial year they are incurred.
Contract revenues are recognised in proportion to the stage of completion of contract activity at the end of the
reporting period when the outcome of the contract can be estimated reliably.
When the outcome of a contract cannot be estimated reliably, the revenues are recognised only to the extent
that contract costs incurred are expected to be recoverable.
When it is likely that the total costs of a contract exceed the total revenues of the contract, the total estimated
losses are immediately recognised as a cost.
Contract revenues are recognised in proportion to the stage of completion of contract activity:
• contracts in the Oil & Gas Division and for the longer-term contracts in the Special Foundations –
(Core Business) Division are recognised on a cost-to-cost basis whereby the proportion of contract
costs incurred for work completed by the end of the reporting period to the estimated total contract
costs is calculated;
• for shorter-term contracts in the Special Foundations – (Core Business) Division the percentage of
completion is calculated applying the criteria of “physical measurement” as this approximates to cost-
to-cost.
Contract work in progress is recognised in the Statement of Financial Position as follows:
• the amounts due from contractors is included in assets, under trade receivables and other current
assets, when the costs incurred, plus the related profits (less the related losses) exceed any advances
received;
• the amounts due to contractors is included in liabilities, under trade payables and other current
liabilities, when the advances received exceed the costs incurred plus the related profits (less the
related losses).
Trade receivables and other current assets
Receivables due within normal credit terms or which carry interest at market rates are not discounted but are
recognised at nominal value net of an allowance for doubtful receivables so that their value is in line with the
estimated realisable value.
Receivables are recognised at their estimated realisable value; this value approximates the amortised cost. If
this is expressed in foreign currency, it is translated using the exchange rate at the year-end accounting date.
This item of the Statement of Financial Position also includes the share of costs and revenues spread over two
or more years to reflect the time proportion principle correctly.
Sales of receivables
The Group sells some of its trade and tax receivables through factoring transactions.
Transfers of receivables may be with recourse or without recourse; some without recourse transactions include
deferred payment clauses (for example, payment of a minority part of the acquisition price by the factor is
dependent on total recovery of the receivables), require a guarantee on the part of the seller or imply continued
62
material exposure to the cash flows from the transferred receivables.
This type of transaction does not meet the derecognition requirements under IAS 39 as substantially all the
risks and rewards have not been transferred.
Consequently all receivables sold through factoring agreements that do not meet the requirements for
derecognition under IAS 39 remain in the Statement of Financial Position even if they have been legally
transferred; a financial liability of an equal amount is recognised in the Consolidated Statement of Financial
Position in the entry, liabilities for other financing. All receivables transferred through factoring agreements
that meet the requirements for derecognition under IAS 39, when substantially all the risks and rewards are
transferred, are derecognised from the Statement of Financial Position.
Gains or losses resulting from the sale of receivables are recognised when the assets are derecognised from the
Consolidated Statement of Financial Position.
Impairment of financial assets
At the end of each reporting period, the Group assesses whether a financial asset or group of financial assets is
impaired. A financial asset or group of assets is impaired, and impairment losses are recognised, only if there
is objective evidence as a result of one or more events that occurred after initial recognition and this
impairment event has an impact that may be reliably measured on the estimated future cash flows deriving
from the financial assets or group of assets. Evidence of impairment can come from significant financial
difficulties of the debtor, the inability of a debtor to meet obligations, failure or delays in interest payments or
payment when due, a probability of being subject to bankruptcy procedures or other forms of financial
reorganisation, and from observable data that indicate a measurable decrease in estimated future cash flows
such as changes in the economic environment or conditions linked to financial crises.
Financial assets at amortised cost
If there is any objective evidence that a loan or a receivable carried at amortised cost is impaired, the amount
of the loss is measured as the difference between the carrying value of the asset and the present value of
estimated future cash flows discounted at the effective interest rate of the instrument at initial recognition.
The carrying amount of the asset is reduced by establishing an allowance for impairment losses. The amount
of the loss is recognised in profit or loss. Interest receivable continues to be measured on the lower carrying
value and is calculated by applying the rate used to discount estimated future cash flows when measuring
impairment. Interest receivable is recognised in profit or loss in financial income.
The Group assesses at each end of a reporting period whether there is any objective evidence of impairment;
if, in a subsequent period, the amount of the impairment loss decreases due to an event occurring after the
impairment was originally recognised, the previously recognised impairment loss is reversed
through profit or loss to the extent that the carrying amount of the asset does not exceed the amortised cost at
the date the impairment loss is reversed.
For trade receivables, an impairment allowance is made when there is objective evidence (for example,
evidence that the debtor is insolvent or in significant financial difficulty) that the Group will not receive in full
the amount due under the original agreement. The carrying amount of the receivable is reduced by establishing
63
a related allowance account. Impaired receivables are written off if considered irrecoverable.
Available for sale financial assets
At the end of the reporting period, the Group ascertains if there is any objective evidence of impairment of an
available for sale financial asset or group of financial assets.
For equity instruments classified as available for sale, objective evidence includes a significant or prolonged
reduction in fair value to below cost. The term “significant” is measured with respect to the acquisition cost
and the term “prolonged” is based on the period for which fair value has been lower than acquisition cost.
When a decline in the fair value of the asset has been recognised directly in other comprehensive income and
there is objective evidence that the asset is impaired, the cumulative loss – measured as the difference between
the initial cost and the current fair value – recognised directly in other comprehensive income is removed from
other comprehensive income and recognised in profit or loss.
Subsequent reversals of impairment losses recognised in profit or loss on equity instruments are recognised in
other comprehensive income.
Amortised cost is calculated by also measuring the discount or premium on acquisition and fees and costs as
these are an integral part of the effective interest rate. Amortisation using the effective interest method is
recognised in profit or loss in financial expenses.
Cash and cash equivalents
Cash and cash equivalents are highly liquid short-term investments (with an original maturity of no more than
three months), easily convertible into considerable sums of cash and subject to no significant variation from
fair value.
In the Statement of Cash Flows, cash and cash equivalents include cash and bank accounts, net of bank
overdrafts. In the Statement of Financial Position, bank overdrafts are included in financial debt as part of
current liabilities.
EQUITY AND LIABILITIES:
− Issued share capital
This item is the subscribed and fully paid-up share capital; it is shown at nominal value. The acquisition of
treasury shares, valued at the consideration paid including any related costs, is recognised as a change in
equity and the nominal value of the treasury stock is deducted from shareholders funds whilst the difference
between the purchase cost and the nominal value of the treasury stock is deducted from reserves.
− Share premium reserve:
This item is the excess of the issue price of the shares over their nominal value and this reserve also includes
the difference of the conversion price of bonds to shares.
− Other reserves
64
These include capital reserves with a specific destination within the Parent Company and the adjustments
made on the first-time adoption of IAS/IFRS.
− Retained earnings/ (losses)
This item includes the economic results of prior financial years which have not been distributed or taken to
reserves (in the case of profits) or covered (in the case of losses), and movements from other equity reserves
when the need for which the latter were set up no longer exists. This entry also includes the profit or loss for
the year.
Financial liabilities
Financial liabilities that are subject to IAS 39 are recognised in financial liabilities at fair value through profit
or loss, mortgages or loans or derivatives designated as hedging instruments. The Group decides the
designation of financial liabilities at the moment of purchase.
All financial liabilities are measured at fair value including for mortgages and loans any directly attributable
transaction costs.
The Group financial liabilities include trade payables and other payables, overdrafts, mortgages and loans,
guarantees and financial derivative instruments.
The Group has not recognised any financial liability at fair value through profit or loss.
Loans
These are initially recognised at cost on the acquisition date, which is equal to the fair value of the sum
received net of related costs. Subsequently, financing transactions are valued by the amortised cost method
using the effective interest method. Gains and losses are recognised in profit or loss when the liability is
extinguished, as well as through the amortisation process.
Amortised cost is calculated by also measuring the discount or premium on acquisition and fees and costs as
these are an integral part of the effective interest rate. Amortisation using the effective interest method is
recognised in profit or loss in financial expenses.
Derecognition
A financial liability is derecognised when the obligation specified in the contract has been discharged,
cancelled or has expired. Where there has been an exchange between an existing borrower and lender of debt
instruments with substantially different terms, or there has been a substantial modification of the terms of an
existing financial liability, this transaction is accounted for as an extinguishment of the original financial
liability and the recognition of a new financial liability. A gain or loss from extinguishment of the original
financial liability is recognised in profit or loss.
Derivative instruments
TREVI Group has adopted a Group policy approved by the Board of Directors on 1 February 2008. All
financial instruments are initially measured at fair value on the date the contract is signed and are subsequently
measured at fair value. Derivatives are accounted as financial assets when the fair value is positive and as
65
financial liabilities when the fair value is negative.
The fair value of financial instruments exchanged on an active market is measured at the end of every
reporting period using quoted market prices or broker quotes (bid prices for non-current positions and ask
prices for current positions), with no deduction of transaction costs.
If there is no active market for a financial instrument, fair value is established by using a valuation technique,
which can include:
• the use of recent transactions done at market conditions;
• reference to the current fair value of another instrument that is substantially the same;
• discounted cash flow analysis or other valuation models.
The fair value analysis of derivative instruments and other information on their valuation are given in the
paragraph, supplementary information on financial instruments, in this document.
Under IAS 39 the measurement of variations in the fair value alters according to the designation of the
derivative instrument (trading or hedge) and the nature of the risk covered (Fair Value Hedge or Cash Flow
Hedge).
For those contracts designated as held for trading, changes in fair value are recognised directly in profit or
loss.
For those contracts that are a Fair Value Hedge, changes in fair value of the hedging instrument and of the
hedged item are recognised in profit or loss, independent of the valuation criteria adopted for the latter.
For Cash Flow Hedges, changes in fair value are recognised directly in equity if the hedging instrument is
determined to be an effective hedge whilst the portion determined as ineffective is recognised in profit or loss.
The changes recognised in comprehensive income are recycled to the income statement in the same financial
period or periods in which the hedged asset or liability affects profit or loss.
Purchase or sale of derivative instruments (for trading or hedge) is recognised at the transaction date.
Payables
Payables are recognised at their presumed settlement value, approximately the amortised cost. If expressed in
foreign currency, the values are determined using the exchange rate at the end of the reporting period.
Employee benefits
− Short-term benefits
Short-term employee benefits are charged to profit or loss in the period of service rendered by the employee.
− Defined benefit plans
The Group recognises certain benefits to its employees post-employment (TFR [Staff Termination Fund] for
the Italian companies of the Group and pension benefits for the foreign companies). These benefits fall into
the category of defined benefits, verifiable as to their existence and quantifiable as regards the amount payable
but uncertain as to when payment will be required. Under IAS 19, the liability is valued using the Projected
Unit Credit Method and calculated by independent actuaries. This method calculates the present value of the
defined benefit obligation that an employee will receive at the estimated date when the service rendered by the
employee ceases using actuarial assumptions (for example, the mortality rate, the employee turnover rate) and
66
financial assumptions (for example, the discount rate). The present value of the defined benefit obligation is
calculated annually by an external, independent actuary. Actuarial gains and losses are recognised in full in
profit or loss in the year in which they are realised. The Group has not used the so-called “corridor” method
for recognising actuarial gains and losses.
The Italian Accounting Commission (OIC), with the document approved by the Executive Committee on 26
September 2007, referring to Appendix 1 of the Operating Guide of 2005 for the transition to International
Accounting Standards (IAS/IFRS), has given further indications, in addition to those in the original document,
concerning the calculation and disclosure of the staff termination fund (TFR) of employees of Italian
companies within the Group, following the new provisions of Law 296 of 27 December 2006 (the Finance
Law 2007) and of the relative enactment decree of the Ministry for Employment and Social Security No. 70 of
3 April 2007.
The OIC document does not alter the previous opinion on staff-leaving indemnities matured to 31 December
2006, which remain within the Company and are considered defined benefit plans. However, the new
document asserts that, to comply with IAS 19 for the accounting treatment of settlement or curtailment
changes to the post-employment plan, the staff leaving indemnity matured must be subject to a different
calculation, which results in a significant change due to the absence of the previous actuarial assumptions
concerning salary increases. In other words, the liability for staff-leaving indemnities that remain within the
Company may no longer be modified by subsequent events.
− Defined benefits plans
The Group participates in State defined contribution plans. The contributions paid fulfil the obligations of the
Group towards its employees. The contributions are costs recognised in the period in which the benefit is
earned.
Provisions for potential risks and charges, assets and liabilities
Provisions for risks and charges are probable liabilities where the amount and/or timing of the obligation
derive from a past event and where the fulfilment of that obligation will result in an outflow of financial
resources. Provisions are made exclusively for existing obligations, either legal or implicit, deriving from a
past event where at the date of the Statement of Financial Position a reliable estimate of the amount of the
obligation can be made. The amount provided represents the best estimate of the amount necessary to fulfil
that obligation made at the end of the reporting period. Provisions made are re-assessed at the end of each
accounting period in the year and adjusted to reflect the best current estimate.
Where settlement of the obligation is likely to be beyond the normal credit terms, the amount of the provision
represents the estimated value of the future obligation discounted to its present value.
Potential assets and liabilities are not entered in the Statement of Financial Position; however information is
provided for those of a material amount.
Income tax for the period
67
Current income taxes are determined on the basis of estimated taxable income for the financial year according
to the enacted legislation and at the tax rates payable at the end of the reporting period.
The tax rates and the tax rules used to calculate the tax charge are those enacted or substantively enacted at the
end of the reporting period in the jurisdictions where the Group operates and where it generates taxable
income.
Current taxes for transactions or events outside profit or loss are recognised outside profit or loss in other
comprehensive income consistent with the transaction or event to which they refer.
Deferred taxes are calculated for all temporary differences between the carrying values of assets and liabilities
and the fiscal valuation of assets and liabilities (the liability method). Deferred taxes are calculated using the
tax rates expected to apply when the temporary differences will be realised or settled.
Current and deferred taxes are shown in the Income Statement except where they refer to entries directly
debited or credited to the Statement of Comprehensive Income.
Deferred tax assets are recognised for taxable temporary differences and for carried forward tax losses and
credits if it is considered probable that there will be sufficient taxable profit against which the loss or credit
carryforwards can be utilised.
The carrying value of deferred tax assets is reviewed at the end of each reporting period and reduced to the
extent that it is no longer probable that sufficient taxable profit will be available to allow the benefit of part or
all of the deferred tax asset to be utilised. Deferred tax assets are recognised for deductible timing differences
and for tax assets and liabilities carried forward to the extent that there is likely to be sufficient future taxable
income against which the deductible timing differences and tax assets and liabilities carried forward can be
used.
Guarantees and potential liabilities
These include guarantees and sureties given, as well as goods received on deposit for various reasons. They
are recognised at nominal value.
INCOME STATEMENT:
Revenues and expenses
Revenues are recognised and accounted for to the extent that the economic benefits are probable and the
relative amounts can be reliably estimated. Revenues deriving from the sale of an asset are recognised upon
transfer of the risks of ownership, usually under Incoterms rules.
Revenues for contract work are recognised according to the stage of completion of the contract, as illustrated
above.
Expenses are recognised on a similar basis to revenues and are always recognised on a time-proportion basis.
Financial revenues and expenses Financial revenues and expenses are recognised in profit or loss on a time-proportion basis and using the
68
effective interest method.
The interest on all financial instruments valued at amortised cost and interest-bearing financial assets classified
as available for sale is calculated using the effective interest method, which discounts the expected future cash
inflows expected over the life of a financial instrument or a shorter period if required, compared to the net
carrying value of the financial asset or liability. Interest received is recognised in financial income in profit or
loss.
Dividends
These are recognised in the financial year when the shareholders have the right to receive the payment, usually
the year in which the Shareholders’ Meeting decides on the dividend distribution.
Dividends distributed to shareholders are recognised as a liability in the Financial Statements of the year in
which the distribution is approved by the Shareholders’ Meeting.
Earnings per share
Basic earnings per share is calculated by dividing the share of the Group’s economic result attributable to the
ordinary shareholders by the average weighted number of ordinary shares in issue, excluding any treasury
shares.
Diluted earnings per share is calculated by taking the share of the profit or loss attributable to the shareholders
of the Parent Company and dividing it by the average weighted number of shares in issue, taking into account
all potential dilutive securities.
Translation of items in foreign currencies
Receivables and payables in currencies other than Euro are originally translated into Euro at the historical rates
prevailing at the date of the relative transactions.
Exchange rate differences realised on the payment of receivables or the settlement of payables in foreign
currencies are recognised immediately in profit or loss.
Assets and liabilities in currencies other than Euro, excluding tangible and intangible assets and investments,
are determined using the exchange rate prevailing at the end of the reporting period and any related exchange
rate gains or losses are recognised in profit or loss. Fixed-term currency contracts are used to cover the
fluctuation risk of foreign currencies. The foreign subsidiaries of Trevi S.p.A. prepare accounts in the currency
of the main economic area in which they operate (the functional currency). At the end of the reporting period,
the amounts of the financial statements expressed in local currencies are translated using the exchange rates at
the end of the reporting period published on the website of the Ufficio Italiano Cambi and any differences
arising are recognised in profit or loss.
Comment on accounting estimates
The preparation of the Consolidated Financial Statements requires Management to apply accounting principles
and methodologies that, in some cases, employ complex and subjective valuations and estimates. These are
based on past experience and assumptions, which are always considered reasonable and realistic given the
69
information available at the time. Given the joint document from the Bank of Italy/Consob/Isvap No. 2 of 6
February 2009, it is specified that estimates are based on the most recent information available to management
at the time the Financial Statements were prepared without undermining their reliability.
The application of these estimates and assumptions affects the figures in the Financial Statements - the
Statement of Financial Position, the Income Statement and the Statement of Cash Flows, as well as those
given as additional information. Actual results may differ from these estimates given the uncertainty
surrounding the assumptions and conditions on which the estimates are based.
Listed below are the items of the Financial Statements requiring the greatest degree of subjectivity on the part
of management in establishing estimates and for which any change in the conditions underlying the
assumptions used would have a significant impact on the Consolidated Financial Statements of the Group:
• Impairment of fixed assets;
• Contract work in progress;
• Development costs;
• Deferred tax assets;
• Provisions for credit risks;
• Employee benefits;
• Provisions for risks and charges.
Estimates and assumptions are reviewed periodically and the effects of any changes are recognised in profit or
loss for the period in which the change occurred.
Accounting standards, amendments and interpretations applied from 1 January 2016 or early
application thereof
From the start of 2016, the Group has applied the following new accounting standards, amendments and
interpretations reviewed by the IASB:
The criteria used to prepare the Consolidated Financial Statements are consistent with those used to prepare
the Consolidated Financial Statements of the previous financial year, except for the new standards or
interpretations that are specified below that are applicable from 1 January 2016.
The Group has not chosen early application of any standards, amendments or improvements issued for which
application is not yet mandatory.
New IFRSs, amendments and improvements applicable from 1 January 2016
Some amendments were made to existing Standards in order to clarify certain points:
• Amendments to IFRS 10, IFRS 12 and IAS 28 – Investment Entities: Applying the Consolidation
Exception. The amendments clarify that the exemption from preparing consolidated financial
statements is available to a parent entity that is a subsidiary of an investment entity even if the
investment entity measures all of its subsidiaries at fair value. The amendments to IFRS 10 also state
that a subsidiary that provides services related to the activities of the investment should not be
consolidated if the subsidiary itself is an investment entity. All the other subsidiaries of an investment
entity are measured at fair value.
70
• Amendments to IFRS 11 – Joint Arrangements. The amendment clarifies that where a joint operator
acquires an interest in a joint operation in which the activity of the joint operation constitutes a
business, it must apply all of the principles on business combinations accounting as set out in IFRS 3 -
Business Combinations, and other standards that do not conflict with the guidance in IFRS 11.
• Amendments to IAS 16 – Property, Plant and Equipment and IAS 38 – Intangible Assets on
acceptable methods of depreciation and amortisation. The amendment clarifies the meaning of the
term consumption of the expected future economic benefits embodied in an asset when determining
the appropriate amortisation method for that asset. A revenue-based method is not considered to be an
appropriate manifestation of consumption when revenue reflects a pattern of economic benefits that
are generated from operating a business (of which the asset is part) rather than the economic benefits
that are consumed through use of the asset. It may only be used in very limited circumstances to
amortise intangible assets.
• Amendments to IAS 16 - Property, Plant and Equipment and IAS 41 – Agriculture: Bearer Plants.
The amendments include biological assets that meet the definition of bearer plants (e.g. fruit trees)
that will be subject to all the recognition and measurement requirements in IAS 16 while agricultural
produce growing on bearer plants (e.g. fruit growing on a tree) will remain within the scope of IAS 41.
• Amendments to IAS 27 – Equity Method in Separate Financial Statements. The amendments
eliminate a difference for countries where regulations require entities to present separate financial
statements using the equity method to account for investments in subsidiaries, associates and joint
ventures and allow an entity to use the equity method to account for these investments (IAS 27
amended) or to account for these investments at cost in accordance with IAS 39 or with the new IFRS
9. The same accounting must be applied to each category of investment.
• Amendments to IAS 1 – Presentation of Financial Statements. The amendments clarify the materiality
requirements in IAS 1 and that specific line items in the statement(s) of profit or loss and OCI and the
statement of financial position may be disaggregated. It also clarifies that the share of OCI of
associates and joint ventures accounted for using the equity method must be presented in aggregate as
a single line item and classified between those items that will or will not be subsequently reclassified
to profit or loss.
Adoption of the new standards and amendments described above had no impact on the Consolidated Financial
Statements of the Group.
New accounting standards and amendments not yet applied or early adopted by the Group
The Group is assessing these standards and amendments to ascertain what impact they would have on the
Consolidated Financial Statements but has not chosen early adoption of these amendments. The changes are
summarised below:
IFRS 15 – Revenue from Contracts with Customers (effective for annual periods beginning on or after 1
January 2018). The new standard replaces all existing revenue requirements in IAS 11 – Construction
Contracts, IAS 18 – Revenue, IFRIC 13 – Customer Loyalty Programmes, IFRIC 15 – Agreements for the
71
Construction of Real Estate, IFRIC 18 – Transfers of Assets from Customers and SIC 31 – Revenue – Barter
Transactions Involving Advertising Services. The standard outlines the principles an entity must apply to
measure and recognise revenue from non-financial assets, including gains and losses on disposal of certain
non-financial assets, including property, plant and equipment and intangible assets. The core principle is that
an entity will recognise revenue at an amount that reflects the consideration to which the entity expects to be
entitled in exchange for transferring goods or services to a customer. Guidelines are given to identify a
contract with a customer, the performance obligations in the contract and the transaction price and on how to
recognise revenue when the entity satisfies a performance obligation. It also provides guidance on the
allocation of the transaction price in contracts with multiple performance obligations. The standard also
specifies how to account for the incremental costs of obtaining a contract and the costs directly related to
fulfilling a contract. Application guidance is also given on certain specific areas that include licences,
warranties, rights of return, principle-versus-agent considerations and contract resolutions. The standard must
be applied in full to the current period and either in full to prior periods using a full retrospective or a modified
retrospective approach. In April 2016, the IASB published certain amendments to IFRS 15 that included
clarifications on its application that must also be applied from 1 January 2018.
IFRS 9 – Financial Instruments (effective for annual periods beginning on or after 1 January 2018). The new
standard aims to make it easier for users of the accounts to understand the amount, timing and uncertainty of
future cash flows and replaces the classes of financial instruments under IAS 39 – Financial Instruments:
Recognition and Measurement. All financial instruments are initially measured at fair value plus or minus, in
the case of a financial asset or a financial liability not at fair value through profit or loss (FVTPL), transaction
costs. However, certain trade receivables without a material financial component are initially measured at
transaction price under the new standard IFRS 15 - Revenue from Contracts with Customers. Debt instruments
are subsequently measured on the basis of their contractual cash flows and the business model under which the
debt instruments are held. If a financial asset gives rise to cash flows that are solely payments of principle and
interest it qualifies for amortised cost accounting while if it gives rise to an exchange of financial assets in
addition to cash flows it is recognised at fair value in OCI, and subsequently recycled to profit or loss
(FVOCI). Lastly there is also an option to designate a financial instrument as measured at fair value through
profit or loss on initial recognition (FVO). Equity instruments are generally measured at FVTPL. However,
entities have an irrevocable option on an instrument-by-instrument basis to present changes in the fair value of
non-trading instruments in other comprehensive income (FVOTCI). All other IAS 39 – Financial Instruments:
Recognition and Measurement classification and measurement requirements have been carried forward into
IFRS 9.
The impairment requirements are based on an expected credit loss (ECL) model that replaces the IAS 39
incurred loss model. Lastly, changes have been introduced to hedge accounting. Hedge effectiveness testing is
prospective and will often be qualitative if the risk component is designated as the hedged item and is
separately identifiable and reliably measurable.
IFRS 16 – Leases (effective for annual periods beginning on or after 1 January 2019). The scope of IFRS 16
72
includes leases of all assets, with certain exceptions. A lease is defined as a contract that conveys the right to
use an asset (the underlying asset) for a period of time in exchange for consideration. IFRS 16 requires lessees
to account for all leases under a single on-balance sheet model in a similar way to finance leases under IAS 17
except for leases of “low value” assets (e.g. personal computers) and short-term leases (i.e. leases with a lease
term of 12 months or less). At the commencement date of a lease, a lessee will recognise a liability to make
lease payments and an asset representing the right to use the underlying asset during the lease term. Lessees
are required to recognise separately the interest expense on the lease liability and the depreciation expense on
the right-of-use asset. Lessees will be required to remeasure the lease liability upon the occurrence of certain
events (e.g. a change in the lease term or a change in future lease payments resulting in a change in an index or
rate used to determine those payments) and the amount of remeasurement is taken as an adjustment to the
right-of-use asset. Lessor accounting is substantially unchanged from the current accounting under IAS 17 -
Leases. Application of the standard may be done using a full retrospective or a modified retrospective
approach and early application is permitted but not before an entity applies IFRS 15.
New accounting standards and amendments not yet applied or early adopted by the Group
Amendments to already existing accounting standards have been issued that are effective for annual periods
beginning on or after 1 January 2017 or subsequent financial periods:
• Amendments to IAS 7 – Statement of Cash Flows. The amendment requires entities to provide
disclosures about changes in their liabilities arising from financing activities, including both changes
arising from cash flows and non-cash changes (such as foreign exchange gains or losses).
• Amendments to IAS 12 – Recognition of Deferred Tax Assets for Unrealised Losses. The amendments
clarify that an entity needs to consider whether the tax law restricts the sources of taxable profits
against which it may make deductions on the reversal of that deductible temporary difference.
Furthermore, the amendments provide guidance on how an entity should determine future taxable
profits and explain the circumstances in which taxable profit may include the recovery of some assets
for more than their carrying amount.
• Amendments to IFRS 2 – Classification and Measurement of Share-based Payment Transactions. The
amendments clarify the effects of vesting conditions on the settlement of a cash-settled share-based
transaction. They also clarify the classification of a share-based payment transaction with net
settlement features for withholding tax obligations. Lastly, they outline the accounting where a
modification to the terms and conditions of a share-based payment transaction changes its
classification from cash-settled to equity-settled.
• Amendments to IFRS 4 – Insurance Contracts. The amendments address concerns arising from
implementing the new financial instruments standard IFRS 9 before implementing the new insurance
contracts standard that will replace IFRS 4. The amendments introduce two options for entities issuing
insurance contracts: a temporary exemption for applying IFRS 9 and an overlay approach.
• Amendments to IAS 40 – Investment property. The amendments clarify when assets, including
property under construction or development, should be transferred to, or from, investment properties.
A change in use must be supported by evidence and stipulate that a change in intention by
73
management is not enough to support a transfer.
Improvements to IFRSs
The Annual Improvements to IFRSs is the process used by the IASB to make amendments or improvements to
existing IFRSs, encouraging a constant review of accounting policies by entities using IASs.
In 2014 the IASB published a series of amendments to IFRS (Improvements to IFRSs 2012-2014 Cycle, which
followed the 2009-2011, 2010-2012 and 2011-2013 Cycles). These improvements regarded changes in
methods of disposal under IFRS 5 – Non-current Assets Held for Sale and Discontinued Operations; the
applicability of IFRS 7 – Financial Instruments: Disclosures to condensed interim financial statements; the
use of discount rates under IAS 19 – Employee Benefits; and the disclosure of information “elsewhere in the
interim financial report” under IAS 34 – Interim Financial Reporting. The amendments introduced are
effective for annual periods beginning on or after 1 January 2016.
The most recent cycle of improvements published in December 2016 deleted the short-term exemptions for
first time adopters of IFRS 1 – First-time Adoption of International Financial Reporting Standards; the
measurement at fair value through profit or loss under IAS 28 – Investments in Associates and Joint Ventures;
and provided clarification on the scope of the disclosure requirements under IFRS 12 – Disclosure of Interests
in Other Entities. The amendments to IFRS 1 and IAS 28 are effective for annual periods beginning on or after
1 January 2018 and the amendment to IFRS 12 is effective for annual periods beginning on or after 1 January
2017.
The Group is evaluating the impact of the amendments and interpretations to the accounting standards that
have been approved but have not been applied early or are in the process of being approved by the European
Union. The Group has already begun to assess the possible impact of the application of the new accounting
standards IFRS 9 – Financial Instruments, IFRS 15 - Revenue from Contracts with Customers and IFRS 16 -
Leases on its economic, financial and capital position and on the disclosure required in the Consolidated
Financial Statements. With regard to IFRS 15, analyses done by the Group has identified revenue streams and
an analysis is now being carried out on a sample of contracts for each revenue stream. These analyses will be
extended to the entire Group and, on the basis of the preliminary results (expected to be available by the end
of the first semester at 30 June 2017), the Group will consider which approach to use for its first-time adoption
and will provide the information suggested by the European regulator (ESMA).
RISK MANAGEMENT
Aims, management strategies and identification of financial risks
The Finance Department of the Parent Company and the Finance Directors of each subsidiary manage the
financial risks to which the Group is exposed by following the guidelines of the Treasury Risks Policy of the
Group.
The financial assets of the Group are mainly cash and bank current accounts, trade and other receivables
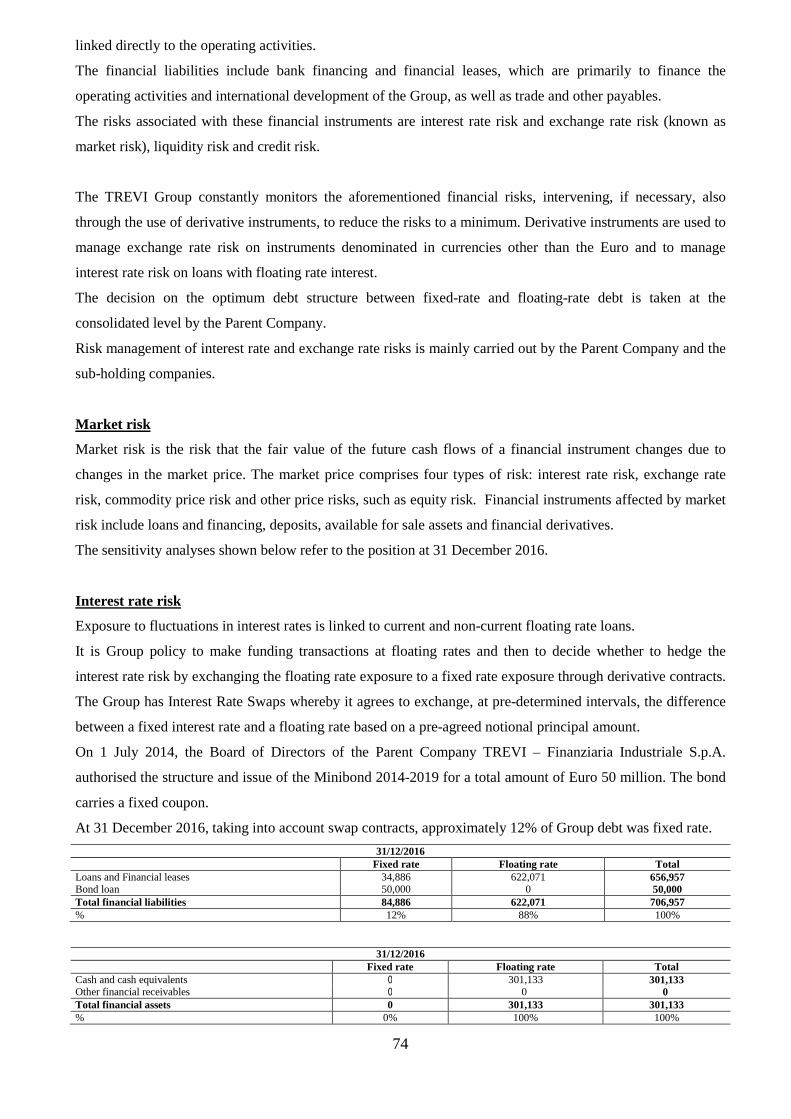
74
linked directly to the operating activities.
The financial liabilities include bank financing and financial leases, which are primarily to finance the
operating activities and international development of the Group, as well as trade and other payables.
The risks associated with these financial instruments are interest rate risk and exchange rate risk (known as
market risk), liquidity risk and credit risk.
The TREVI Group constantly monitors the aforementioned financial risks, intervening, if necessary, also
through the use of derivative instruments, to reduce the risks to a minimum. Derivative instruments are used to
manage exchange rate risk on instruments denominated in currencies other than the Euro and to manage
interest rate risk on loans with floating rate interest.
The decision on the optimum debt structure between fixed-rate and floating-rate debt is taken at the
consolidated level by the Parent Company.
Risk management of interest rate and exchange rate risks is mainly carried out by the Parent Company and the
sub-holding companies.
Market risk
Market risk is the risk that the fair value of the future cash flows of a financial instrument changes due to
changes in the market price. The market price comprises four types of risk: interest rate risk, exchange rate
risk, commodity price risk and other price risks, such as equity risk. Financial instruments affected by market
risk include loans and financing, deposits, available for sale assets and financial derivatives.
The sensitivity analyses shown below refer to the position at 31 December 2016.
Interest rate risk
Exposure to fluctuations in interest rates is linked to current and non-current floating rate loans.
It is Group policy to make funding transactions at floating rates and then to decide whether to hedge the
interest rate risk by exchanging the floating rate exposure to a fixed rate exposure through derivative contracts.
The Group has Interest Rate Swaps whereby it agrees to exchange, at pre-determined intervals, the difference
between a fixed interest rate and a floating rate based on a pre-agreed notional principal amount.
On 1 July 2014, the Board of Directors of the Parent Company TREVI – Finanziaria Industriale S.p.A.
authorised the structure and issue of the Minibond 2014-2019 for a total amount of Euro 50 million. The bond
carries a fixed coupon.
At 31 December 2016, taking into account swap contracts, approximately 12% of Group debt was fixed rate.
31/12/2016
Fixed rate Floating rate Total
Loans and Financial leases 34,886 622,071 656,957 Bond loan 50,000 0 50,000 Total financial liabilities 84,886 622,071 706,957 % 12% 88% 100%
31/12/2016
Fixed rate Floating rate Total
Cash and cash equivalents 0 301,133 301,133 Other financial receivables 0 0 0 Total financial assets 0 301,133 301,133 % 0% 100% 100%
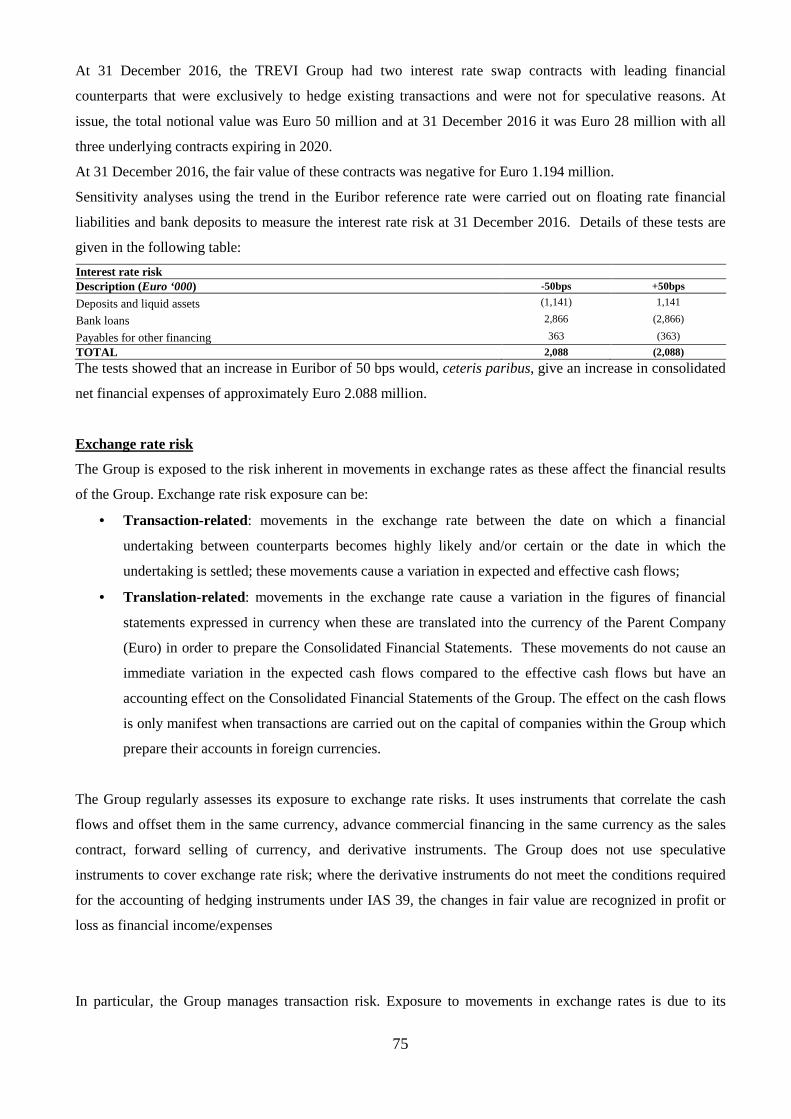
75
At 31 December 2016, the TREVI Group had two interest rate swap contracts with leading financial
counterparts that were exclusively to hedge existing transactions and were not for speculative reasons. At
issue, the total notional value was Euro 50 million and at 31 December 2016 it was Euro 28 million with all
three underlying contracts expiring in 2020.
At 31 December 2016, the fair value of these contracts was negative for Euro 1.194 million.
Sensitivity analyses using the trend in the Euribor reference rate were carried out on floating rate financial
liabilities and bank deposits to measure the interest rate risk at 31 December 2016. Details of these tests are
given in the following table:
Interest rate risk Description (Euro ‘000) -50bps +50bps
Deposits and liquid assets (1,141) 1,141
Bank loans 2,866 (2,866)
Payables for other financing 363 (363)
TOTAL 2,088 (2,088)
The tests showed that an increase in Euribor of 50 bps would, ceteris paribus, give an increase in consolidated
net financial expenses of approximately Euro 2.088 million.
Exchange rate risk
The Group is exposed to the risk inherent in movements in exchange rates as these affect the financial results
of the Group. Exchange rate risk exposure can be:
• Transaction-related: movements in the exchange rate between the date on which a financial
undertaking between counterparts becomes highly likely and/or certain or the date in which the
undertaking is settled; these movements cause a variation in expected and effective cash flows;
• Translation-related: movements in the exchange rate cause a variation in the figures of financial
statements expressed in currency when these are translated into the currency of the Parent Company
(Euro) in order to prepare the Consolidated Financial Statements. These movements do not cause an
immediate variation in the expected cash flows compared to the effective cash flows but have an
accounting effect on the Consolidated Financial Statements of the Group. The effect on the cash flows
is only manifest when transactions are carried out on the capital of companies within the Group which
prepare their accounts in foreign currencies.
The Group regularly assesses its exposure to exchange rate risks. It uses instruments that correlate the cash
flows and offset them in the same currency, advance commercial financing in the same currency as the sales
contract, forward selling of currency, and derivative instruments. The Group does not use speculative
instruments to cover exchange rate risk; where the derivative instruments do not meet the conditions required
for the accounting of hedging instruments under IAS 39, the changes in fair value are recognized in profit or
loss as financial income/expenses
In particular, the Group manages transaction risk. Exposure to movements in exchange rates is due to its
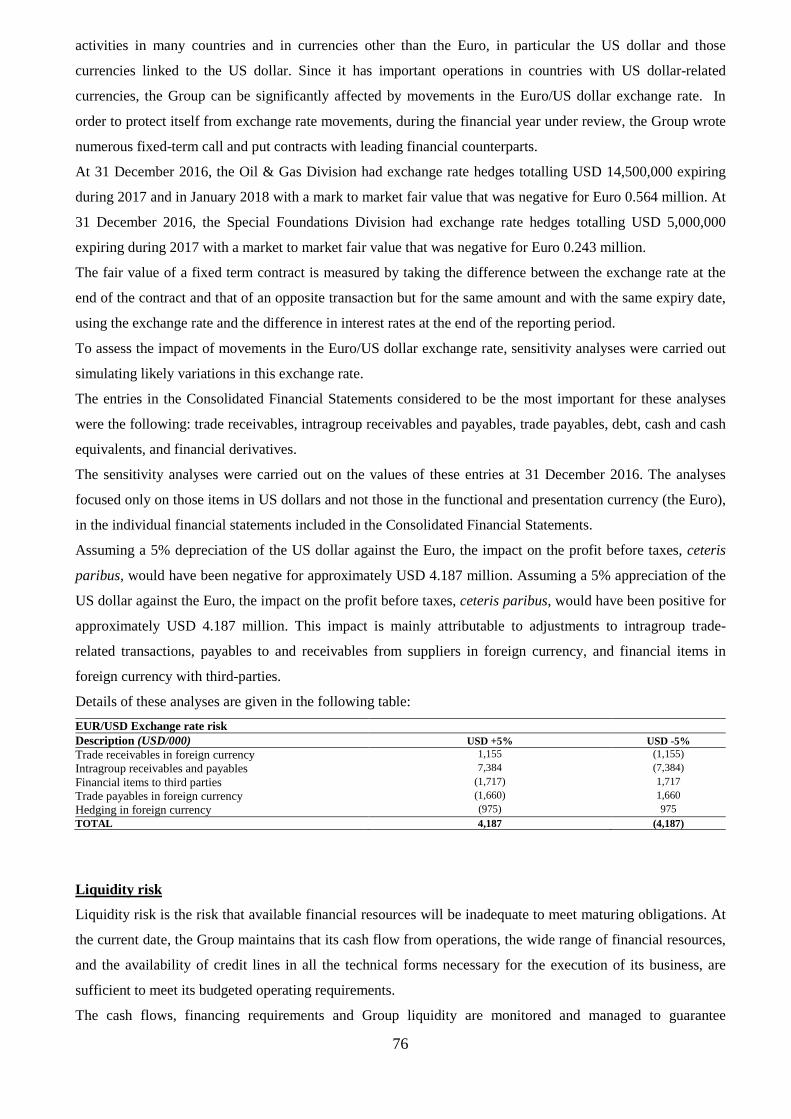
76
activities in many countries and in currencies other than the Euro, in particular the US dollar and those
currencies linked to the US dollar. Since it has important operations in countries with US dollar-related
currencies, the Group can be significantly affected by movements in the Euro/US dollar exchange rate. In
order to protect itself from exchange rate movements, during the financial year under review, the Group wrote
numerous fixed-term call and put contracts with leading financial counterparts.
At 31 December 2016, the Oil & Gas Division had exchange rate hedges totalling USD 14,500,000 expiring
during 2017 and in January 2018 with a mark to market fair value that was negative for Euro 0.564 million. At
31 December 2016, the Special Foundations Division had exchange rate hedges totalling USD 5,000,000
expiring during 2017 with a market to market fair value that was negative for Euro 0.243 million.
The fair value of a fixed term contract is measured by taking the difference between the exchange rate at the
end of the contract and that of an opposite transaction but for the same amount and with the same expiry date,
using the exchange rate and the difference in interest rates at the end of the reporting period.
To assess the impact of movements in the Euro/US dollar exchange rate, sensitivity analyses were carried out
simulating likely variations in this exchange rate.
The entries in the Consolidated Financial Statements considered to be the most important for these analyses
were the following: trade receivables, intragroup receivables and payables, trade payables, debt, cash and cash
equivalents, and financial derivatives.
The sensitivity analyses were carried out on the values of these entries at 31 December 2016. The analyses
focused only on those items in US dollars and not those in the functional and presentation currency (the Euro),
in the individual financial statements included in the Consolidated Financial Statements.
Assuming a 5% depreciation of the US dollar against the Euro, the impact on the profit before taxes, ceteris
paribus, would have been negative for approximately USD 4.187 million. Assuming a 5% appreciation of the
US dollar against the Euro, the impact on the profit before taxes, ceteris paribus, would have been positive for
approximately USD 4.187 million. This impact is mainly attributable to adjustments to intragroup trade-
related transactions, payables to and receivables from suppliers in foreign currency, and financial items in
foreign currency with third-parties.
Details of these analyses are given in the following table:
EUR/USD Exchange rate risk Description (USD/000) USD +5% USD -5% Trade receivables in foreign currency 1,155 (1,155)
Intragroup receivables and payables 7,384 (7,384)
Financial items to third parties (1,717) 1,717
Trade payables in foreign currency (1,660) 1,660
Hedging in foreign currency (975) 975 TOTAL 4,187 (4,187)
Liquidity risk
Liquidity risk is the risk that available financial resources will be inadequate to meet maturing obligations. At
the current date, the Group maintains that its cash flow from operations, the wide range of financial resources,
and the availability of credit lines in all the technical forms necessary for the execution of its business, are
sufficient to meet its budgeted operating requirements.
The cash flows, financing requirements and Group liquidity are monitored and managed to guarantee
77
efficacious and efficient management of financial resources. Current and non-current liquidity requirements
are constantly monitored to guarantee a timely and effective means of finding financial resources or an
appropriate investment of any liquidity.
Group liquidity is dependent on financial flows generated or absorbed by its operations and investments and
by financial flows linked to the settlement of financial payables, income from financial investments and
movements in interest rates.
To ensure that its liquidity risk is sufficiently covered, the Group has committed credit lines arranged with
leading financial counterparts. The Group can also securitize its trade receivables.
In addition to these credit lines and guarantees given, the Group had credit lines with leading financial
institutions in Italy and abroad. The credit lines available to the Group, including factoring, leasing and
guarantees, is approximately Euro 1,800 million at the date of these Financial Statements.
The failure to meet some of the financial covenants based on the consolidated figures at 31 December 2016 to
which its bank loans and the Minibond 2014-2019 were subject, comprised a risk that the acceleration clause
would be triggered on some of the existing non-current loans and that the loans in existence could be revoked
by the banks and restrictions imposed on the use of the funds available to the Company. The Directors believe
that the liquidity risks linked to these events have been contained given that:
• the banks involved and the bondholders at their meeting agreed not to exercise the acceleration clause and
provided the necessary letters of waiver;
• the process implemented by the Group, with the assistance of a leading financial consultant, resulted in
the banks agreeing to support the Group by confirming the existing loans.
It should be noted that during the aforementioned negotiations, the banks did not retract the financial support
given to the Company but maintained the availability and the use of the loans – including those maturing after
31 December 2016, that the Company and Group are currently employing.
The Directors believe that the cash flows from operations in the 2017-2021 Business Plan that has been
prepared and approved, in addition to the significant availability of committed credit lines, are sufficient to
satisfy the financial requirements of the business even taking account of the peaks in net working capital
absorption.
The chart below shows the geographical distribution of liquidity available to the Group at 31 December 2016:
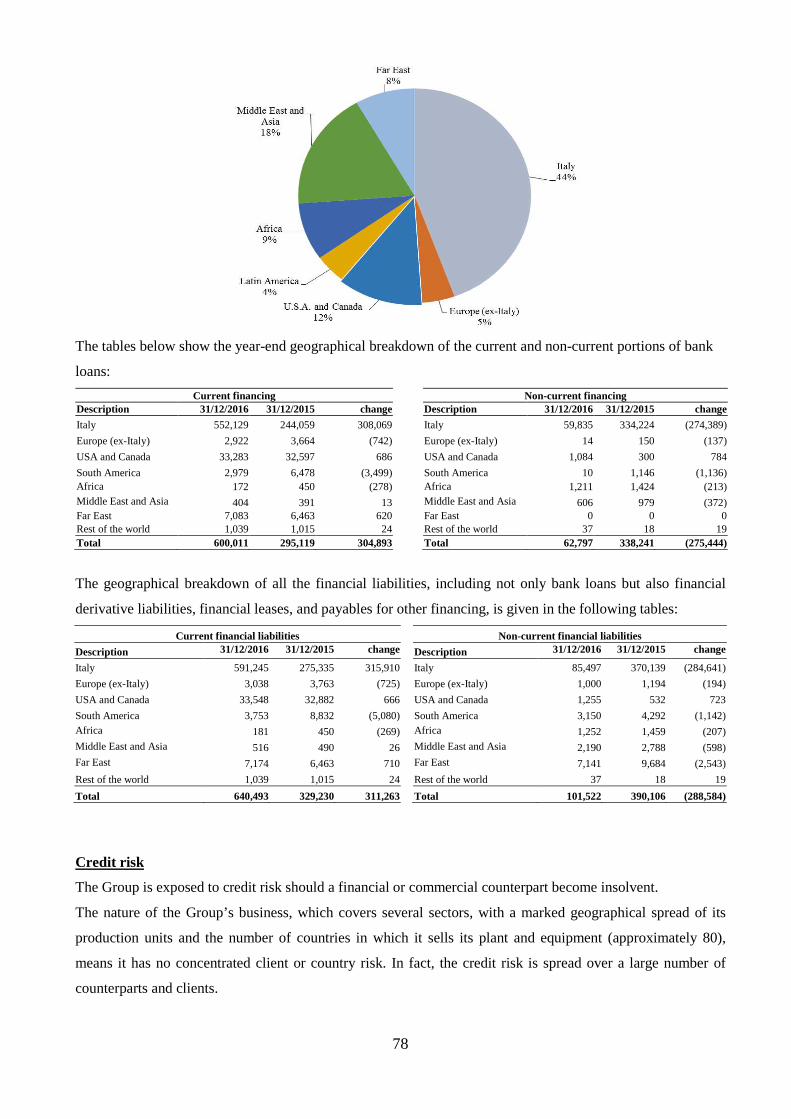
78
The tables below show the year-end geographical breakdown of the current and non-current portions of bank
loans:
Current financing Non-current financing Description 31/12/2016 31/12/2015 change Description 31/12/2016 31/12/2015 change
Italy 552,129 244,059 308,069 Italy 59,835 334,224 (274,389)
Europe (ex-Italy) 2,922 3,664 (742) Europe (ex-Italy) 14 150 (137)
USA and Canada 33,283 32,597 686 USA and Canada 1,084 300 784
South America 2,979 6,478 (3,499) South America 10 1,146 (1,136) Africa 172 450 (278) Africa 1,211 1,424 (213) Middle East and Asia 404 391 13 Middle East and Asia 606 979 (372) Far East 7,083 6,463 620 Far East 0 0 0 Rest of the world 1,039 1,015 24 Rest of the world 37 18 19 Total 600,011 295,119 304,893 Total 62,797 338,241 (275,444)
The geographical breakdown of all the financial liabilities, including not only bank loans but also financial
derivative liabilities, financial leases, and payables for other financing, is given in the following tables:
Current financial liabilities Non-current financial liabilities
Description 31/12/2016 31/12/2015 change Description 31/12/2016 31/12/2015 change
Italy 591,245 275,335 315,910 Italy 85,497 370,139 (284,641)
Europe (ex-Italy) 3,038 3,763 (725) Europe (ex-Italy) 1,000 1,194 (194)
USA and Canada 33,548 32,882 666 USA and Canada 1,255 532 723
South America 3,753 8,832 (5,080) South America 3,150 4,292 (1,142) Africa 181 450 (269) Africa 1,252 1,459 (207) Middle East and Asia 516 490 26 Middle East and Asia 2,190 2,788 (598) Far East 7,174 6,463 710 Far East 7,141 9,684 (2,543)
Rest of the world 1,039 1,015 24 Rest of the world 37 18 19
Total 640,493 329,230 311,263 Total 101,522 390,106 (288,584)
Credit risk
The Group is exposed to credit risk should a financial or commercial counterpart become insolvent.
The nature of the Group’s business, which covers several sectors, with a marked geographical spread of its
production units and the number of countries in which it sells its plant and equipment (approximately 80),
means it has no concentrated client or country risk. In fact, the credit risk is spread over a large number of
counterparts and clients.
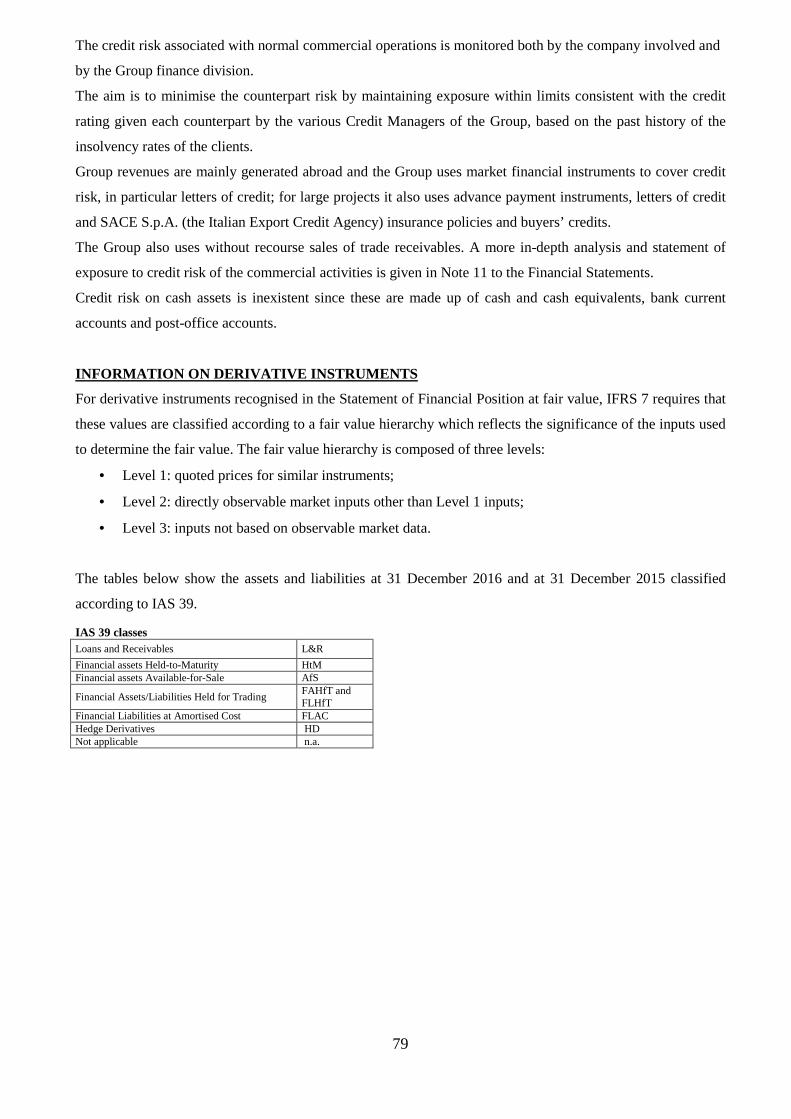
79
The credit risk associated with normal commercial operations is monitored both by the company involved and
by the Group finance division.
The aim is to minimise the counterpart risk by maintaining exposure within limits consistent with the credit
rating given each counterpart by the various Credit Managers of the Group, based on the past history of the
insolvency rates of the clients.
Group revenues are mainly generated abroad and the Group uses market financial instruments to cover credit
risk, in particular letters of credit; for large projects it also uses advance payment instruments, letters of credit
and SACE S.p.A. (the Italian Export Credit Agency) insurance policies and buyers’ credits.
The Group also uses without recourse sales of trade receivables. A more in-depth analysis and statement of
exposure to credit risk of the commercial activities is given in Note 11 to the Financial Statements.
Credit risk on cash assets is inexistent since these are made up of cash and cash equivalents, bank current
accounts and post-office accounts.
INFORMATION ON DERIVATIVE INSTRUMENTS
For derivative instruments recognised in the Statement of Financial Position at fair value, IFRS 7 requires that
these values are classified according to a fair value hierarchy which reflects the significance of the inputs used
to determine the fair value. The fair value hierarchy is composed of three levels:
• Level 1: quoted prices for similar instruments;
• Level 2: directly observable market inputs other than Level 1 inputs;
• Level 3: inputs not based on observable market data.
The tables below show the assets and liabilities at 31 December 2016 and at 31 December 2015 classified
according to IAS 39.
IAS 39 classes
Loans and Receivables L&R
Financial assets Held-to-Maturity HtM Financial assets Available-for-Sale AfS
Financial Assets/Liabilities Held for Trading FAHfT and FLHfT
Financial Liabilities at Amortised Cost FLAC Hedge Derivatives HD Not applicable n.a.
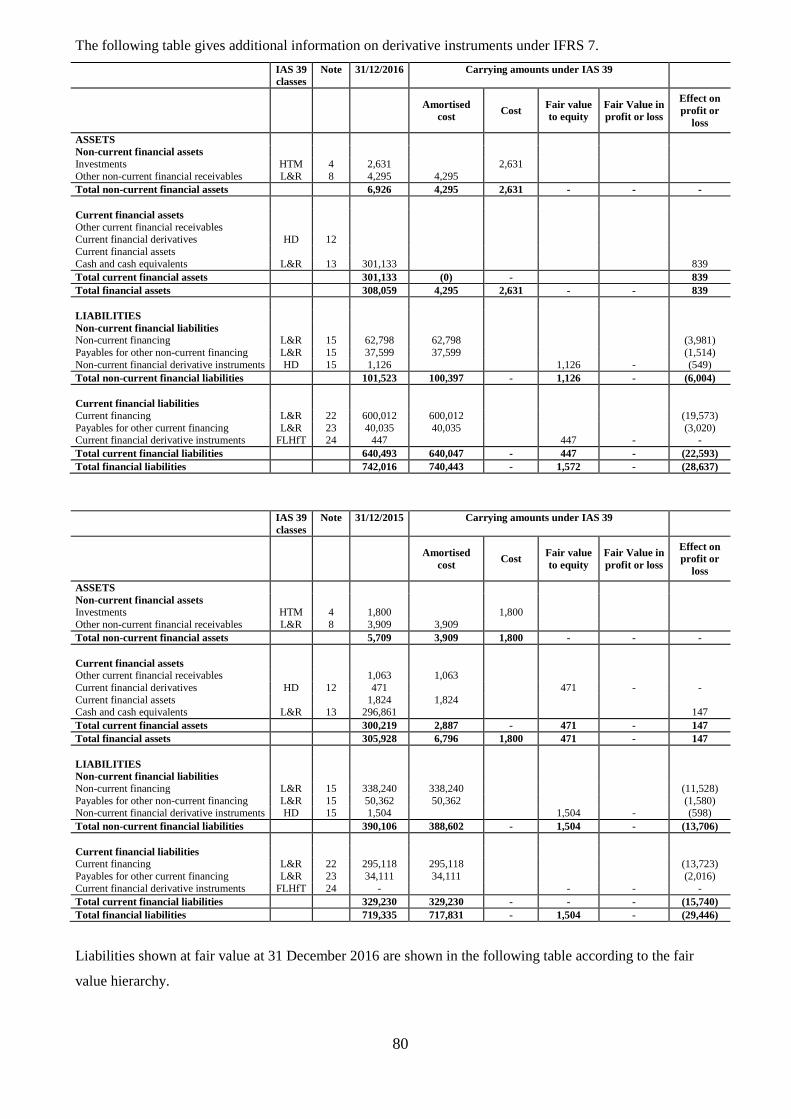
80
The following table gives additional information on derivative instruments under IFRS 7.
IAS 39 classes
Note 31/12/2016 Carrying amounts under IAS 39
Amortised
cost Cost Fair value to equity
Fair Value in profit or loss
Effect on profit or
loss
ASSETS Non-current financial assets Investments HTM 4 2,631 2,631 Other non-current financial receivables L&R 8 4,295 4,295 Total non-current financial assets 6,926 4,295 2,631 - - -
Current financial assets Other current financial receivables Current financial derivatives HD 12 Current financial assets Cash and cash equivalents L&R 13 301,133 839 Total current financial assets 301,133 (0) - 839 Total financial assets 308,059 4,295 2,631 - - 839 LIABILITIES Non-current financial liabilities Non-current financing L&R 15 62,798 62,798 (3,981) Payables for other non-current financing L&R 15 37,599 37,599 (1,514) Non-current financial derivative instruments HD 15 1,126 1,126 - (549) Total non-current financial liabilities 101,523 100,397 - 1,126 - (6,004)
Current financial liabilities Current financing L&R 22 600,012 600,012 (19,573) Payables for other current financing L&R 23 40,035 40,035 (3,020) Current financial derivative instruments FLHfT 24 447 447 - - Total current financial liabilities 640,493 640,047 - 447 - (22,593) Total financial liabilities 742,016 740,443 - 1,572 - (28,637)
IAS 39 classes
Note 31/12/2015 Carrying amounts under IAS 39
Amortised
cost Cost Fair value
to equity Fair Value in profit or loss
Effect on profit or
loss
ASSETS Non-current financial assets Investments HTM 4 1,800 1,800 Other non-current financial receivables L&R 8 3,909 3,909 Total non-current financial assets 5,709 3,909 1,800 - - - Current financial assets Other current financial receivables 1,063 1,063 Current financial derivatives HD 12 471 471 - - Current financial assets 1,824 1,824 Cash and cash equivalents L&R 13 296,861 147 Total current financial assets 300,219 2,887 - 471 - 147 Total financial assets 305,928 6,796 1,800 471 - 147
LIABILITIES Non-current financial liabilities Non-current financing L&R 15 338,240 338,240 (11,528) Payables for other non-current financing L&R 15 50,362 50,362 (1,580) Non-current financial derivative instruments HD 15 1,504 1,504 - (598) Total non-current financial liabilities 390,106 388,602 - 1,504 - (13,706)
Current financial liabilities Current financing L&R 22 295,118 295,118 (13,723) Payables for other current financing L&R 23 34,111 34,111 (2,016) Current financial derivative instruments FLHfT 24 - - - - Total current financial liabilities 329,230 329,230 - - - (15,740) Total financial liabilities 719,335 717,831 - 1,504 - (29,446)
Liabilities shown at fair value at 31 December 2016 are shown in the following table according to the fair
value hierarchy.
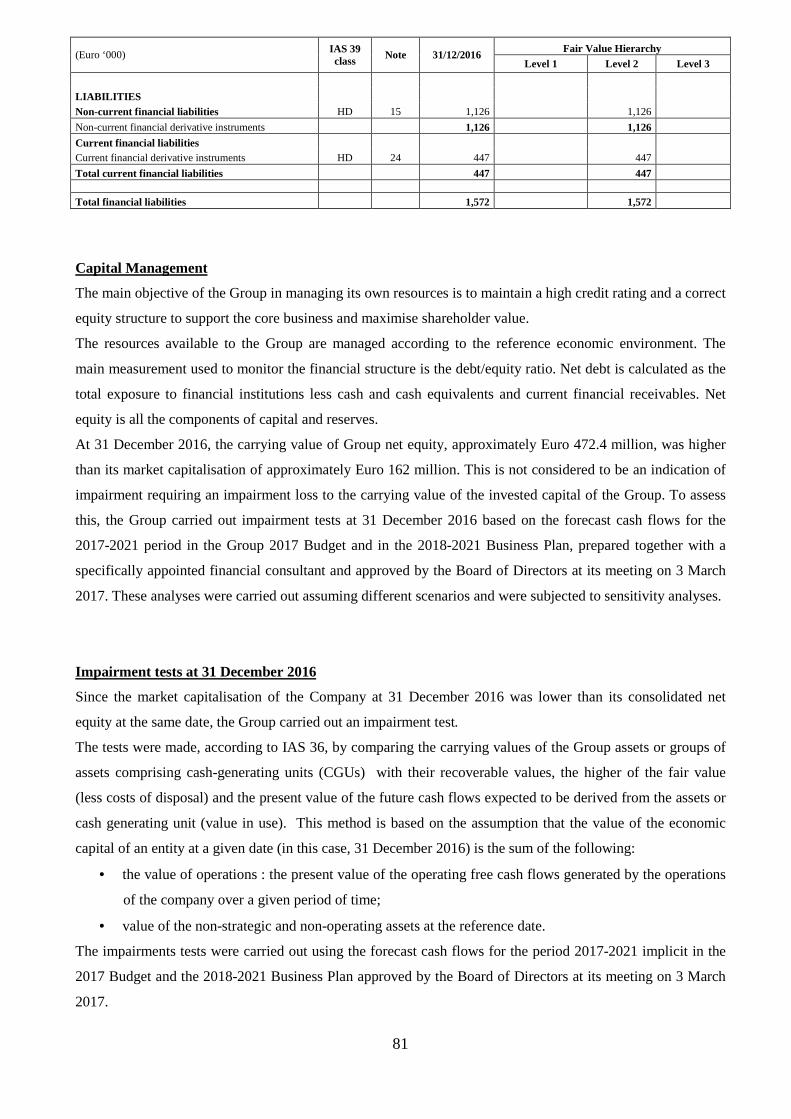
81
(Euro ‘000) IAS 39 class
Note 31/12/2016 Fair Value Hierarchy
Level 1 Level 2 Level 3
LIABILITIES
Non-current financial liabilities HD 15 1,126 1,126
Non-current financial derivative instruments 1,126 1,126
Current financial liabilities Current financial derivative instruments HD 24 447 447
Total current financial liabilities 447 447
Total financial liabilities 1,572 1,572
Capital Management
The main objective of the Group in managing its own resources is to maintain a high credit rating and a correct
equity structure to support the core business and maximise shareholder value.
The resources available to the Group are managed according to the reference economic environment. The
main measurement used to monitor the financial structure is the debt/equity ratio. Net debt is calculated as the
total exposure to financial institutions less cash and cash equivalents and current financial receivables. Net
equity is all the components of capital and reserves.
At 31 December 2016, the carrying value of Group net equity, approximately Euro 472.4 million, was higher
than its market capitalisation of approximately Euro 162 million. This is not considered to be an indication of
impairment requiring an impairment loss to the carrying value of the invested capital of the Group. To assess
this, the Group carried out impairment tests at 31 December 2016 based on the forecast cash flows for the
2017-2021 period in the Group 2017 Budget and in the 2018-2021 Business Plan, prepared together with a
specifically appointed financial consultant and approved by the Board of Directors at its meeting on 3 March
2017. These analyses were carried out assuming different scenarios and were subjected to sensitivity analyses.
Impairment tests at 31 December 2016
Since the market capitalisation of the Company at 31 December 2016 was lower than its consolidated net
equity at the same date, the Group carried out an impairment test.
The tests were made, according to IAS 36, by comparing the carrying values of the Group assets or groups of
assets comprising cash-generating units (CGUs) with their recoverable values, the higher of the fair value
(less costs of disposal) and the present value of the future cash flows expected to be derived from the assets or
cash generating unit (value in use). This method is based on the assumption that the value of the economic
capital of an entity at a given date (in this case, 31 December 2016) is the sum of the following:
• the value of operations : the present value of the operating free cash flows generated by the operations
of the company over a given period of time;
• value of the non-strategic and non-operating assets at the reference date.
The impairments tests were carried out using the forecast cash flows for the period 2017-2021 implicit in the
2017 Budget and the 2018-2021 Business Plan approved by the Board of Directors at its meeting on 3 March
2017.
82
The targets and assumptions in the Group 2017 Budget and in the 2018-2021 Business Plan were determined
by taking account of the historic results from operations and were calculated using the best available
information at the time the estimates were made on future expectations for the reference markets in which the
Group operates.
The aforementioned Budget and financial forecasts include estimates of volumes, investments, operating costs,
margins, industrial and commercial assets and for the trend in the main monetary variables. In particular, the
forecasts for the current financial year are for an increase in profitability in the various business sectors of the
Group based on the management estimates for the underlying variables of the markets in which the Group
operates and the expected performance of the organisational structures of the different Divisions. In the
medium/long-term, the 2018-2021 Business Plan assumes a gradual improvement in the economic
fundamentals of the main operating sectors of the Group and, in particular, that of the Oil & Gas sector.
For the years after 2021, the cash flows were calculated using a terminal value that incorporated:
• the same financial and capital estimates as in the final year for which estimates were prepared;
• a growth rate, g, of 1% in line with the rate used in previous impairment tests.
The operating cash flows, i.e. the available cash flows before repayment of debt and dividend distribution,
calculated using the 2017 Budget and the 2018-2021 Business Plan, were discounted using a UDCF
(Unlevered Discounted Cash Flow) with a WACC (Weighted Average Cost of Capital) of 6.3%, which was
calculated using the Capital Asset Pricing Model (CAPM). The variables in the calculation were the following:
• Risk-free rate: 10-year IRS;
• Market risk premium (MRP): the Damodaran figure (Total Equity Risk Premium based on rating Italy)
that already incorporates country risk was used;
• Beta: a beta of 1.08 was used, in line with the beta used in previous impairment tests by the Group.
The variables in the calculation of the cost of debt were:
- 10-year IRS: the current fixed rate yield was used as described above;
- Spread: the average figure for non-current credit lines, which takes account of the current Group
leverage, was used;
- Tax Rate: the IRES tax rate was used.
The Group carried out impairment tests on the four cash-generating units that correspond to the four Group
operating divisions.
The impairment tests gave no indication of impairment of the carrying value of the consolidated net assets in
the 2016 financial year.
The impairment tests were also carried out assuming a deterioration in the reference context. The management
did sensitivity analyses varying two of the main assumptions:
- a potential increase in the average cost of debt should there be a further request for waivers on the
financial covenants to which the main loans currently available to the Group are subject;
83
- a more penalising non-current debt profile considered sustainable.
The combination of these assumptions under scenarios considered measurable by the management gave a
WACC of 7.5% that was used in the sensitivity analyses done on the impairment tests on Group assets.
Sensitivity analyses by varying the WACC were carried out on the Drillmec CGU as this CGU showed the
greatest variations in value and the most evident signs of impairment.
The results of the Drillmec CGU were subject to sensitivity analyses by:
- applying a percentage reduction in revenues compared to the base assumptions for the period of the
Plan and beyond;
- applying a percentage reduction in the contribution margin of this Division compared to the base
assumptions for the period of the Plan and beyond;
- combining the two scenarios above.
The results of these analyses may be summarised as follows:
- the values obtained by varying the WACC gave signs of impairment exclusively for the Drillmec
Division when the highest WACC of 7.5% was used; this gave the CGU a value that was
approximately Euro 15.0 million lower than its invested capital;
- analyses varying the future revenues and profitability of this Division compared to the base
assumptions gave a similar level of impairment (a value that was approximately Euro 15.0 million
lower); revenues were reduced by between 15% and 20% and the contribution margin by 7% to 9%, or
the two scenarios were combined using reductions that were in the middle of these ranges.
On the basis of other impairment tests on certain specific assets of the Drillmec CGU and, in particular, on
the research and development of recent years, management decided to take impairment losses on items of
the net invested capital of the Drillmec CGU that totalled Euro 15.0 million broken down as follows:
- Euro 10.8 million for research and development projects;
- Euro 4.2 million for receivables from clients.
These were taken to profit or loss net of any relative tax effects.
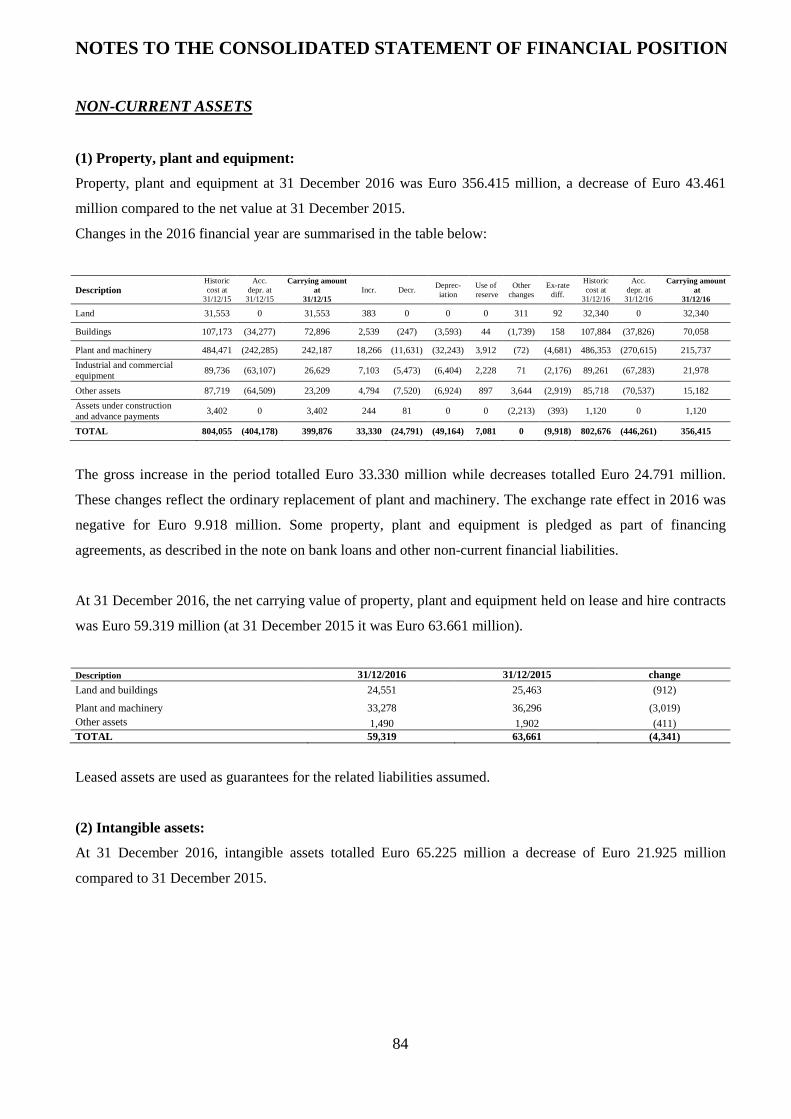
84
NOTES TO THE CONSOLIDATED STATEMENT OF FINANCIAL PO SITION
NON-CURRENT ASSETS
(1) Property, plant and equipment:
Property, plant and equipment at 31 December 2016 was Euro 356.415 million, a decrease of Euro 43.461
million compared to the net value at 31 December 2015.
Changes in the 2016 financial year are summarised in the table below:
Description Historic cost at
31/12/15
Acc. depr. at
31/12/15
Carrying amount at
31/12/15 Incr. Decr.
Deprec- iation
Use of reserve
Other changes
Ex-rate diff.
Historic cost at
31/12/16
Acc. depr. at
31/12/16
Carrying amount at
31/12/16
Land 31,553 0 31,553 383 0 0 0 311 92 32,340 0 32,340
Buildings 107,173 (34,277) 72,896 2,539 (247) (3,593) 44 (1,739) 158 107,884 (37,826) 70,058
Plant and machinery 484,471 (242,285) 242,187 18,266 (11,631) (32,243) 3,912 (72) (4,681) 486,353 (270,615) 215,737
Industrial and commercial equipment
89,736 (63,107) 26,629 7,103 (5,473) (6,404) 2,228 71 (2,176) 89,261 (67,283) 21,978
Other assets 87,719 (64,509) 23,209 4,794 (7,520) (6,924) 897 3,644 (2,919) 85,718 (70,537) 15,182
Assets under construction and advance payments
3,402 0 3,402 244 81 0 0 (2,213) (393) 1,120 0 1,120
TOTAL 804,055 (404,178) 399,876 33,330 (24,791) (49,164) 7,081 0 (9,918) 802,676 (446,261) 356,415
The gross increase in the period totalled Euro 33.330 million while decreases totalled Euro 24.791 million.
These changes reflect the ordinary replacement of plant and machinery. The exchange rate effect in 2016 was
negative for Euro 9.918 million. Some property, plant and equipment is pledged as part of financing
agreements, as described in the note on bank loans and other non-current financial liabilities.
At 31 December 2016, the net carrying value of property, plant and equipment held on lease and hire contracts
was Euro 59.319 million (at 31 December 2015 it was Euro 63.661 million).
Description 31/12/2016 31/12/2015 change Land and buildings 24,551 25,463 (912)
Plant and machinery 33,278 36,296 (3,019) Other assets 1,490 1,902 (411) TOTAL 59,319 63,661 (4,341)
Leased assets are used as guarantees for the related liabilities assumed.
(2) Intangible assets:
At 31 December 2016, intangible assets totalled Euro 65.225 million a decrease of Euro 21.925 million
compared to 31 December 2015.
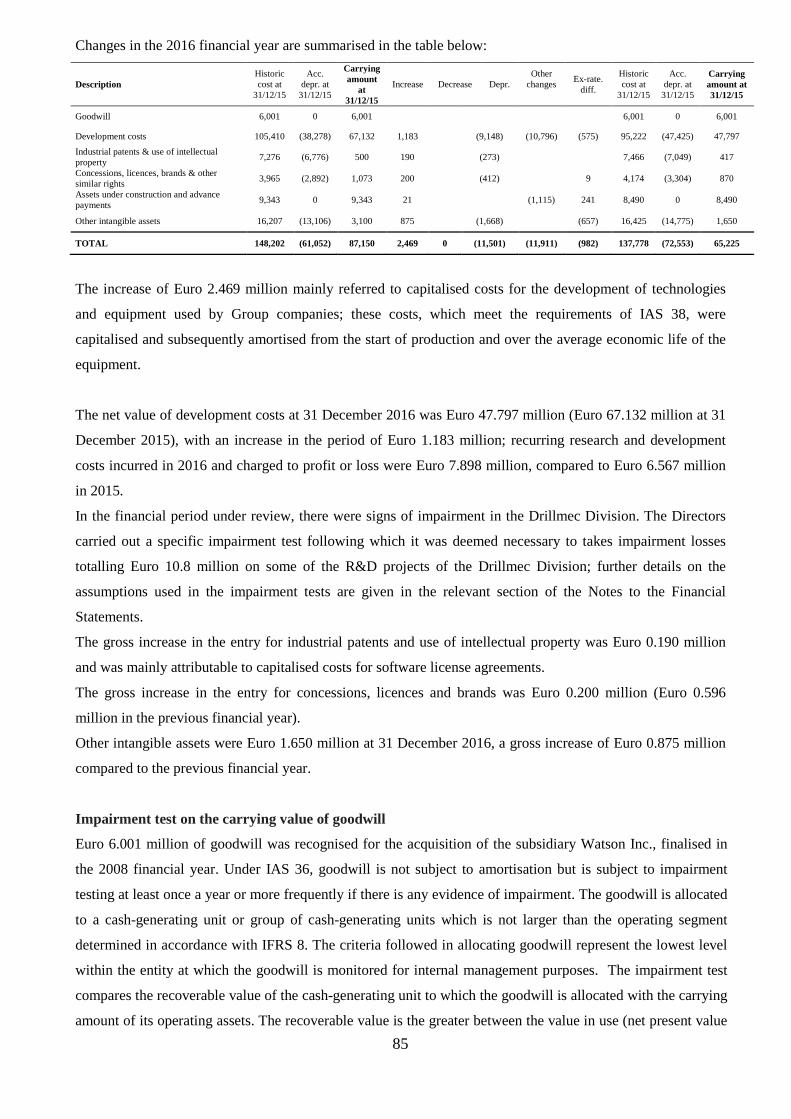
85
Changes in the 2016 financial year are summarised in the table below:
Description Historic cost at
31/12/15
Acc. depr. at 31/12/15
Carrying amount
at 31/12/15
Increase Decrease Depr. Other
changes
Ex-rate. diff.
Historic cost at
31/12/15
Acc. depr. at 31/12/15
Carrying amount at 31/12/15
Goodwill 6,001 0 6,001 6,001 0 6,001
Development costs 105,410 (38,278) 67,132 1,183 (9,148) (10,796) (575) 95,222 (47,425) 47,797
Industrial patents & use of intellectual property
7,276 (6,776) 500 190 (273) 7,466 (7,049) 417
Concessions, licences, brands & other similar rights
3,965 (2,892) 1,073 200 (412) 9 4,174 (3,304) 870
Assets under construction and advance payments
9,343 0 9,343 21 (1,115) 241 8,490 0 8,490
Other intangible assets 16,207 (13,106) 3,100 875 (1,668) (657) 16,425 (14,775) 1,650
TOTAL 148,202 (61,052) 87,150 2,469 0 (11,501) (11,911) (982) 137,778 (72,553) 65,225
The increase of Euro 2.469 million mainly referred to capitalised costs for the development of technologies
and equipment used by Group companies; these costs, which meet the requirements of IAS 38, were
capitalised and subsequently amortised from the start of production and over the average economic life of the
equipment.
The net value of development costs at 31 December 2016 was Euro 47.797 million (Euro 67.132 million at 31
December 2015), with an increase in the period of Euro 1.183 million; recurring research and development
costs incurred in 2016 and charged to profit or loss were Euro 7.898 million, compared to Euro 6.567 million
in 2015.
In the financial period under review, there were signs of impairment in the Drillmec Division. The Directors
carried out a specific impairment test following which it was deemed necessary to takes impairment losses
totalling Euro 10.8 million on some of the R&D projects of the Drillmec Division; further details on the
assumptions used in the impairment tests are given in the relevant section of the Notes to the Financial
Statements.
The gross increase in the entry for industrial patents and use of intellectual property was Euro 0.190 million
and was mainly attributable to capitalised costs for software license agreements.
The gross increase in the entry for concessions, licences and brands was Euro 0.200 million (Euro 0.596
million in the previous financial year).
Other intangible assets were Euro 1.650 million at 31 December 2016, a gross increase of Euro 0.875 million
compared to the previous financial year.
Impairment test on the carrying value of goodwill
Euro 6.001 million of goodwill was recognised for the acquisition of the subsidiary Watson Inc., finalised in
the 2008 financial year. Under IAS 36, goodwill is not subject to amortisation but is subject to impairment
testing at least once a year or more frequently if there is any evidence of impairment. The goodwill is allocated
to a cash-generating unit or group of cash-generating units which is not larger than the operating segment
determined in accordance with IFRS 8. The criteria followed in allocating goodwill represent the lowest level
within the entity at which the goodwill is monitored for internal management purposes. The impairment test
compares the recoverable value of the cash-generating unit to which the goodwill is allocated with the carrying
amount of its operating assets. The recoverable value is the greater between the value in use (net present value
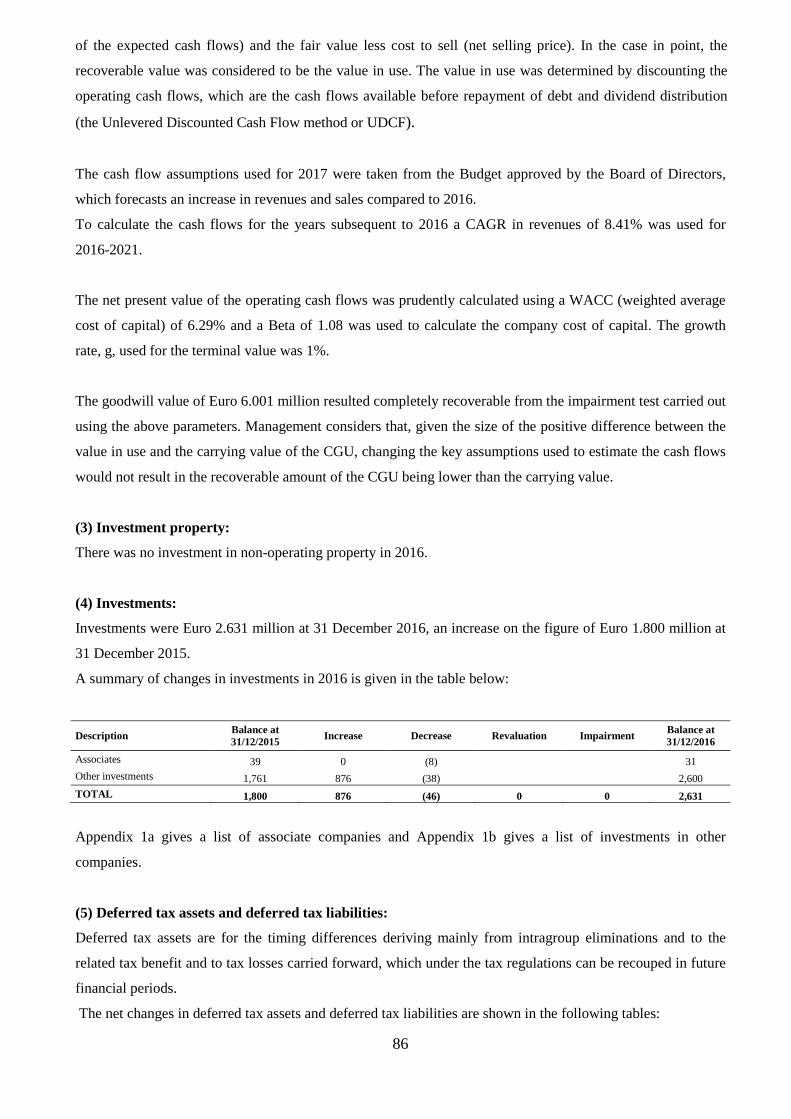
86
of the expected cash flows) and the fair value less cost to sell (net selling price). In the case in point, the
recoverable value was considered to be the value in use. The value in use was determined by discounting the
operating cash flows, which are the cash flows available before repayment of debt and dividend distribution
(the Unlevered Discounted Cash Flow method or UDCF).
The cash flow assumptions used for 2017 were taken from the Budget approved by the Board of Directors,
which forecasts an increase in revenues and sales compared to 2016.
To calculate the cash flows for the years subsequent to 2016 a CAGR in revenues of 8.41% was used for
2016-2021.
The net present value of the operating cash flows was prudently calculated using a WACC (weighted average
cost of capital) of 6.29% and a Beta of 1.08 was used to calculate the company cost of capital. The growth
rate, g, used for the terminal value was 1%.
The goodwill value of Euro 6.001 million resulted completely recoverable from the impairment test carried out
using the above parameters. Management considers that, given the size of the positive difference between the
value in use and the carrying value of the CGU, changing the key assumptions used to estimate the cash flows
would not result in the recoverable amount of the CGU being lower than the carrying value.
(3) Investment property:
There was no investment in non-operating property in 2016.
(4) Investments:
Investments were Euro 2.631 million at 31 December 2016, an increase on the figure of Euro 1.800 million at
31 December 2015.
A summary of changes in investments in 2016 is given in the table below:
Description Balance at 31/12/2015 Increase Decrease Revaluation Impairment Balance at
31/12/2016
Associates 39 0 (8) 31 Other investments 1,761 876 (38) 2,600
TOTAL 1,800 876 (46) 0 0 2,631
Appendix 1a gives a list of associate companies and Appendix 1b gives a list of investments in other
companies.
(5) Deferred tax assets and deferred tax liabilities:
Deferred tax assets are for the timing differences deriving mainly from intragroup eliminations and to the
related tax benefit and to tax losses carried forward, which under the tax regulations can be recouped in future
financial periods.
The net changes in deferred tax assets and deferred tax liabilities are shown in the following tables:
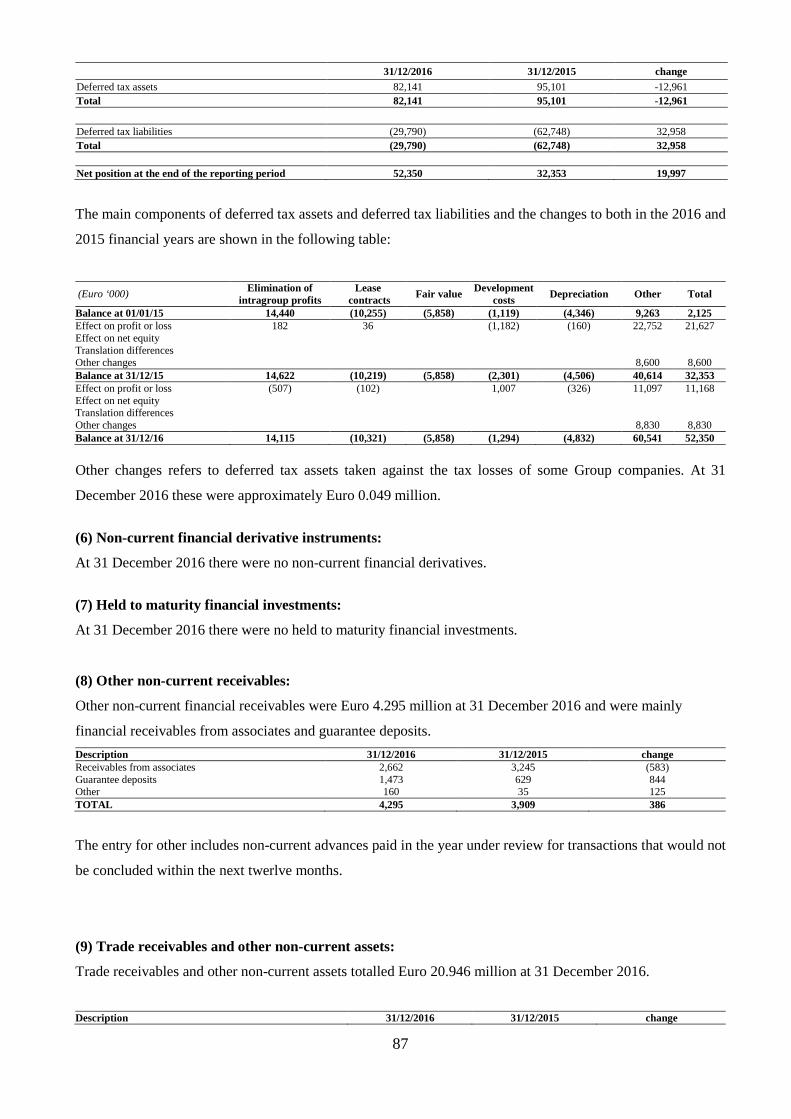
87
31/12/2016 31/12/2015 change Deferred tax assets 82,141 95,101 -12,961 Total 82,141 95,101 -12,961
Deferred tax liabilities (29,790) (62,748) 32,958 Total (29,790) (62,748) 32,958 Net position at the end of the reporting period 52,350 32,353 19,997
The main components of deferred tax assets and deferred tax liabilities and the changes to both in the 2016 and
2015 financial years are shown in the following table:
(Euro ‘000) Elimination of
intragroup profits Lease
contracts Fair value Development
costs Depreciation Other Total
Balance at 01/01/15 14,440 (10,255) (5,858) (1,119) (4,346) 9,263 2,125 Effect on profit or loss 182 36 (1,182) (160) 22,752 21,627 Effect on net equity Translation differences Other changes 8,600 8,600 Balance at 31/12/15 14,622 (10,219) (5,858) (2,301) (4,506) 40,614 32,353 Effect on profit or loss (507) (102) 1,007 (326) 11,097 11,168 Effect on net equity Translation differences Other changes 8,830 8,830 Balance at 31/12/16 14,115 (10,321) (5,858) (1,294) (4,832) 60,541 52,350
Other changes refers to deferred tax assets taken against the tax losses of some Group companies. At 31
December 2016 these were approximately Euro 0.049 million.
(6) Non-current financial derivative instruments:
At 31 December 2016 there were no non-current financial derivatives.
(7) Held to maturity financial investments:
At 31 December 2016 there were no held to maturity financial investments.
(8) Other non-current receivables:
Other non-current financial receivables were Euro 4.295 million at 31 December 2016 and were mainly
financial receivables from associates and guarantee deposits.
Description 31/12/2016 31/12/2015 change Receivables from associates 2,662 3,245 (583) Guarantee deposits 1,473 629 844 Other 160 35 125 TOTAL 4,295 3,909 386
The entry for other includes non-current advances paid in the year under review for transactions that would not
be concluded within the next twerlve months.
(9) Trade receivables and other non-current assets:
Trade receivables and other non-current assets totalled Euro 20.946 million at 31 December 2016.
Description 31/12/2016 31/12/2015 change
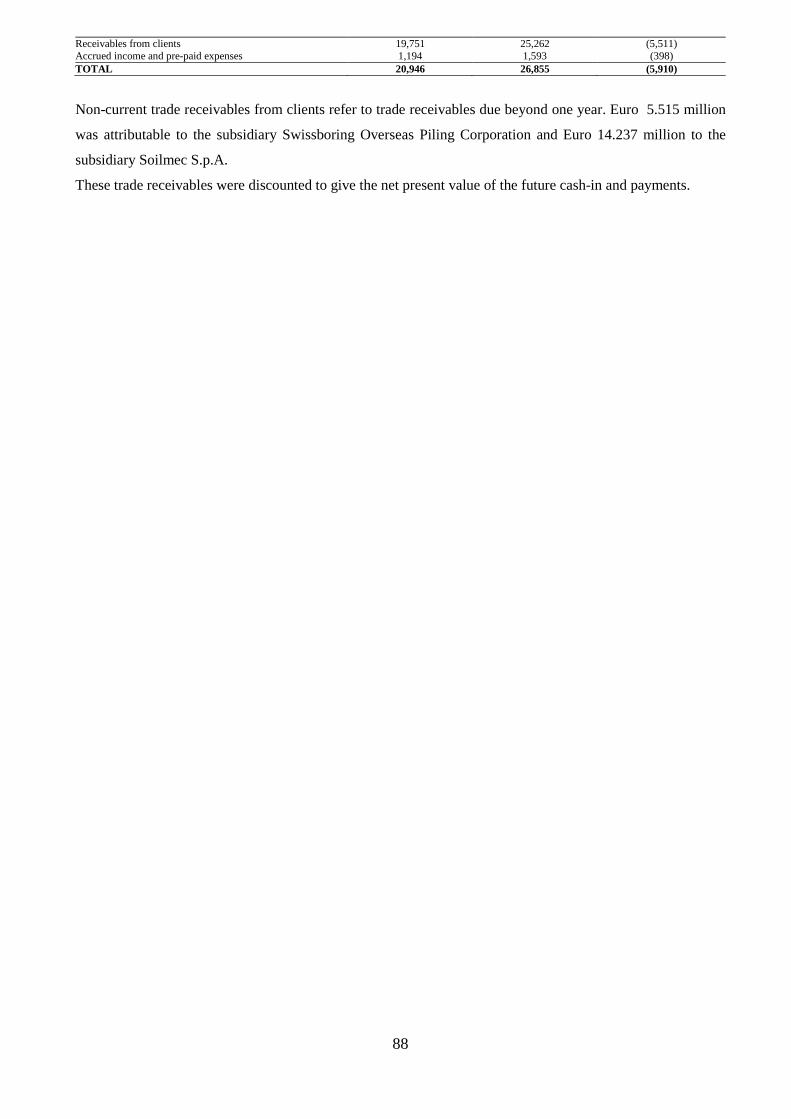
88
Receivables from clients 19,751 25,262 (5,511) Accrued income and pre-paid expenses 1,194 1,593 (398) TOTAL 20,946 26,855 (5,910)
Non-current trade receivables from clients refer to trade receivables due beyond one year. Euro 5.515 million
was attributable to the subsidiary Swissboring Overseas Piling Corporation and Euro 14.237 million to the
subsidiary Soilmec S.p.A.
These trade receivables were discounted to give the net present value of the future cash-in and payments.
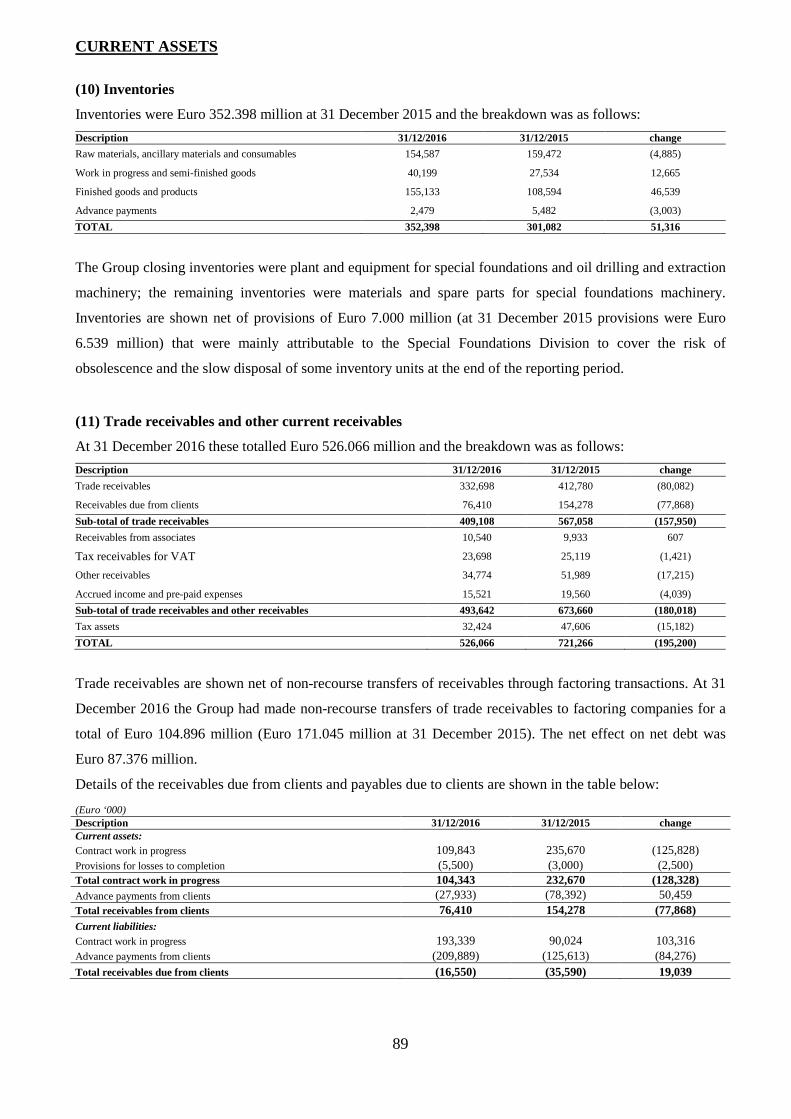
89
CURRENT ASSETS
(10) Inventories
Inventories were Euro 352.398 million at 31 December 2015 and the breakdown was as follows:
Description 31/12/2016 31/12/2015 change
Raw materials, ancillary materials and consumables 154,587 159,472 (4,885)
Work in progress and semi-finished goods 40,199 27,534 12,665
Finished goods and products 155,133 108,594 46,539
Advance payments 2,479 5,482 (3,003)
TOTAL 352,398 301,082 51,316
The Group closing inventories were plant and equipment for special foundations and oil drilling and extraction
machinery; the remaining inventories were materials and spare parts for special foundations machinery.
Inventories are shown net of provisions of Euro 7.000 million (at 31 December 2015 provisions were Euro
6.539 million) that were mainly attributable to the Special Foundations Division to cover the risk of
obsolescence and the slow disposal of some inventory units at the end of the reporting period.
(11) Trade receivables and other current receivables
At 31 December 2016 these totalled Euro 526.066 million and the breakdown was as follows:
Description 31/12/2016 31/12/2015 change
Trade receivables 332,698 412,780 (80,082)
Receivables due from clients 76,410 154,278 (77,868)
Sub-total of trade receivables 409,108 567,058 (157,950)
Receivables from associates 10,540 9,933 607
Tax receivables for VAT 23,698 25,119 (1,421)
Other receivables 34,774 51,989 (17,215)
Accrued income and pre-paid expenses 15,521 19,560 (4,039)
Sub-total of trade receivables and other receivables 493,642 673,660 (180,018)
Tax assets 32,424 47,606 (15,182)
TOTAL 526,066 721,266 (195,200)
Trade receivables are shown net of non-recourse transfers of receivables through factoring transactions. At 31
December 2016 the Group had made non-recourse transfers of trade receivables to factoring companies for a
total of Euro 104.896 million (Euro 171.045 million at 31 December 2015). The net effect on net debt was
Euro 87.376 million.
Details of the receivables due from clients and payables due to clients are shown in the table below:
(Euro ‘000) Description 31/12/2016 31/12/2015 change Current assets:
Contract work in progress 109,843 235,670 (125,828) Provisions for losses to completion (5,500) (3,000) (2,500) Total contract work in progress 104,343 232,670 (128,328) Advance payments from clients (27,933) (78,392) 50,459 Total receivables from clients 76,410 154,278 (77,868) Current liabilities: Contract work in progress 193,339 90,024 103,316 Advance payments from clients (209,889) (125,613) (84,276) Total receivables due from clients (16,550) (35,590) 19,039
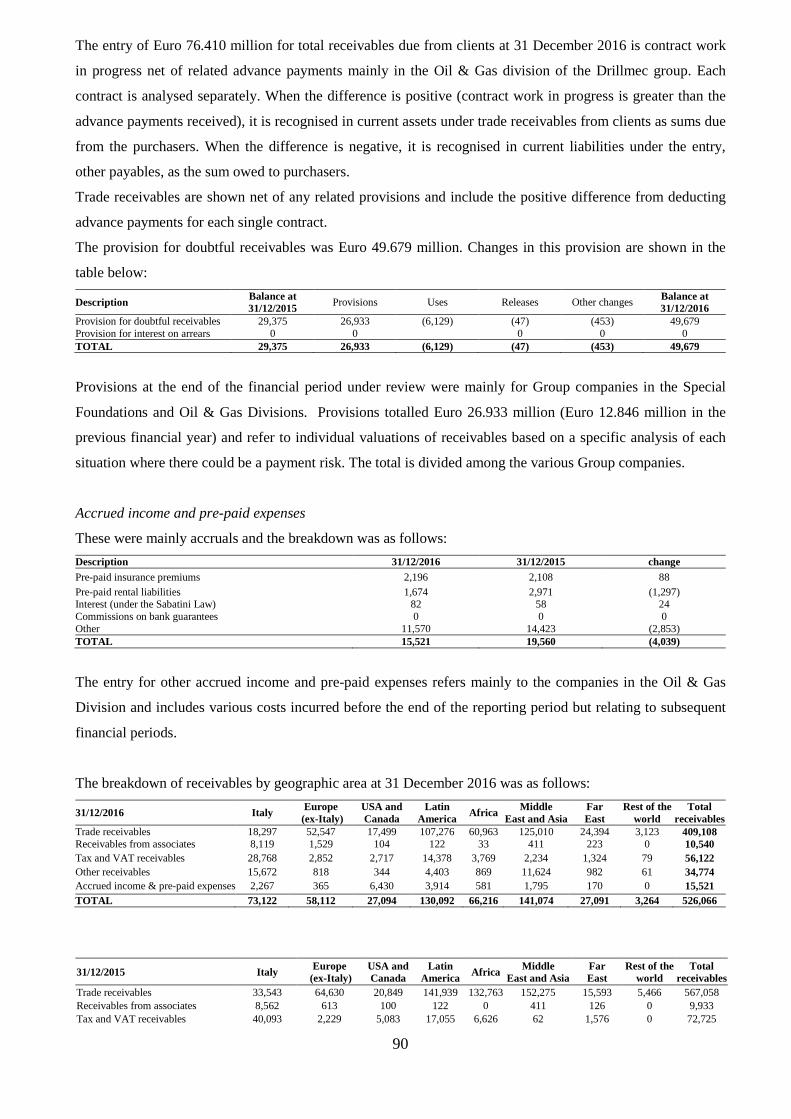
90
The entry of Euro 76.410 million for total receivables due from clients at 31 December 2016 is contract work
in progress net of related advance payments mainly in the Oil & Gas division of the Drillmec group. Each
contract is analysed separately. When the difference is positive (contract work in progress is greater than the
advance payments received), it is recognised in current assets under trade receivables from clients as sums due
from the purchasers. When the difference is negative, it is recognised in current liabilities under the entry,
other payables, as the sum owed to purchasers.
Trade receivables are shown net of any related provisions and include the positive difference from deducting
advance payments for each single contract.
The provision for doubtful receivables was Euro 49.679 million. Changes in this provision are shown in the
table below:
Description Balance at 31/12/2015
Provisions Uses Releases Other changes Balance at 31/12/2016
Provision for doubtful receivables 29,375 26,933 (6,129) (47) (453) 49,679 Provision for interest on arrears 0 0 0 0 0 TOTAL 29,375 26,933 (6,129) (47) (453) 49,679
Provisions at the end of the financial period under review were mainly for Group companies in the Special
Foundations and Oil & Gas Divisions. Provisions totalled Euro 26.933 million (Euro 12.846 million in the
previous financial year) and refer to individual valuations of receivables based on a specific analysis of each
situation where there could be a payment risk. The total is divided among the various Group companies.
Accrued income and pre-paid expenses
These were mainly accruals and the breakdown was as follows:
Description 31/12/2016 31/12/2015 change Pre-paid insurance premiums 2,196 2,108 88 Pre-paid rental liabilities 1,674 2,971 (1,297) Interest (under the Sabatini Law) 82 58 24 Commissions on bank guarantees 0 0 0 Other 11,570 14,423 (2,853) TOTAL 15,521 19,560 (4,039)
The entry for other accrued income and pre-paid expenses refers mainly to the companies in the Oil & Gas
Division and includes various costs incurred before the end of the reporting period but relating to subsequent
financial periods.
The breakdown of receivables by geographic area at 31 December 2016 was as follows:
31/12/2016 Italy Europe (ex-Italy)
USA and Canada
Latin America
Africa Middle East and Asia
Far East
Rest of the world
Total receivables
Trade receivables 18,297 52,547 17,499 107,276 60,963 125,010 24,394 3,123 409,108 Receivables from associates 8,119 1,529 104 122 33 411 223 0 10,540 Tax and VAT receivables 28,768 2,852 2,717 14,378 3,769 2,234 1,324 79 56,122 Other receivables 15,672 818 344 4,403 869 11,624 982 61 34,774 Accrued income & pre-paid expenses 2,267 365 6,430 3,914 581 1,795 170 0 15,521 TOTAL 73,122 58,112 27,094 130,092 66,216 141,074 27,091 3,264 526,066
31/12/2015 Italy Europe (ex-Italy)
USA and Canada
Latin America Africa Middle
East and Asia Far East
Rest of the world
Total receivables
Trade receivables 33,543 64,630 20,849 141,939 132,763 152,275 15,593 5,466 567,058 Receivables from associates 8,562 613 100 122 0 411 126 0 9,933 Tax and VAT receivables 40,093 2,229 5,083 17,055 6,626 62 1,576 0 72,725
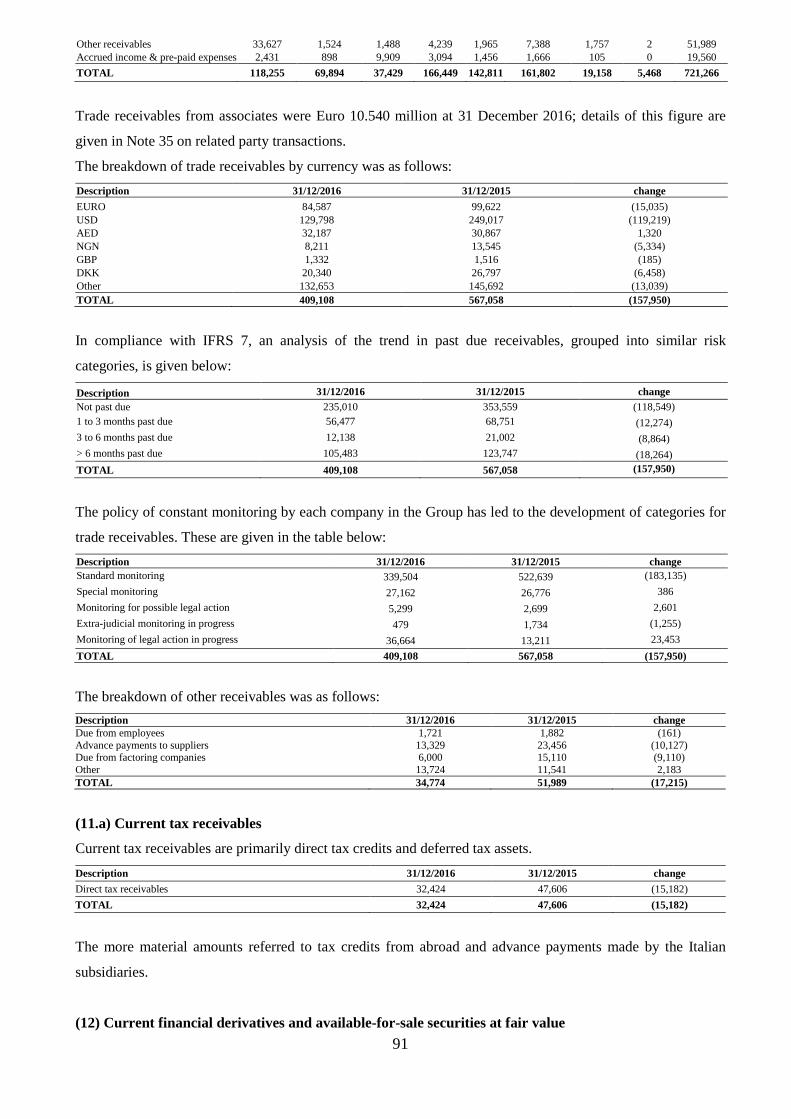
91
Other receivables 33,627 1,524 1,488 4,239 1,965 7,388 1,757 2 51,989 Accrued income & pre-paid expenses 2,431 898 9,909 3,094 1,456 1,666 105 0 19,560
TOTAL 118,255 69,894 37,429 166,449 142,811 161,802 19,158 5,468 721,266
Trade receivables from associates were Euro 10.540 million at 31 December 2016; details of this figure are
given in Note 35 on related party transactions.
The breakdown of trade receivables by currency was as follows:
Description 31/12/2016 31/12/2015 change
EURO 84,587 99,622 (15,035) USD 129,798 249,017 (119,219) AED 32,187 30,867 1,320 NGN 8,211 13,545 (5,334) GBP 1,332 1,516 (185) DKK 20,340 26,797 (6,458) Other 132,653 145,692 (13,039) TOTAL 409,108 567,058 (157,950)
In compliance with IFRS 7, an analysis of the trend in past due receivables, grouped into similar risk
categories, is given below:
Description 31/12/2016 31/12/2015 change Not past due 235,010 353,559 (118,549) 1 to 3 months past due 56,477 68,751 (12,274) 3 to 6 months past due 12,138 21,002 (8,864) > 6 months past due 105,483 123,747 (18,264)
TOTAL 409,108 567,058 (157,950)
The policy of constant monitoring by each company in the Group has led to the development of categories for
trade receivables. These are given in the table below:
Description 31/12/2016 31/12/2015 change Standard monitoring 339,504 522,639 (183,135)
Special monitoring 27,162 26,776 386
Monitoring for possible legal action 5,299 2,699 2,601
Extra-judicial monitoring in progress 479 1,734 (1,255)
Monitoring of legal action in progress 36,664 13,211 23,453
TOTAL 409,108 567,058 (157,950)
The breakdown of other receivables was as follows:
Description 31/12/2016 31/12/2015 change Due from employees 1,721 1,882 (161) Advance payments to suppliers 13,329 23,456 (10,127) Due from factoring companies 6,000 15,110 (9,110) Other 13,724 11,541 2,183 TOTAL 34,774 51,989 (17,215)
(11.a) Current tax receivables
Current tax receivables are primarily direct tax credits and deferred tax assets.
Description 31/12/2016 31/12/2015 change
Direct tax receivables 32,424 47,606 (15,182)
TOTAL 32,424 47,606 (15,182)
The more material amounts referred to tax credits from abroad and advance payments made by the Italian
subsidiaries.
(12) Current financial derivatives and available-for-sale securities at fair value
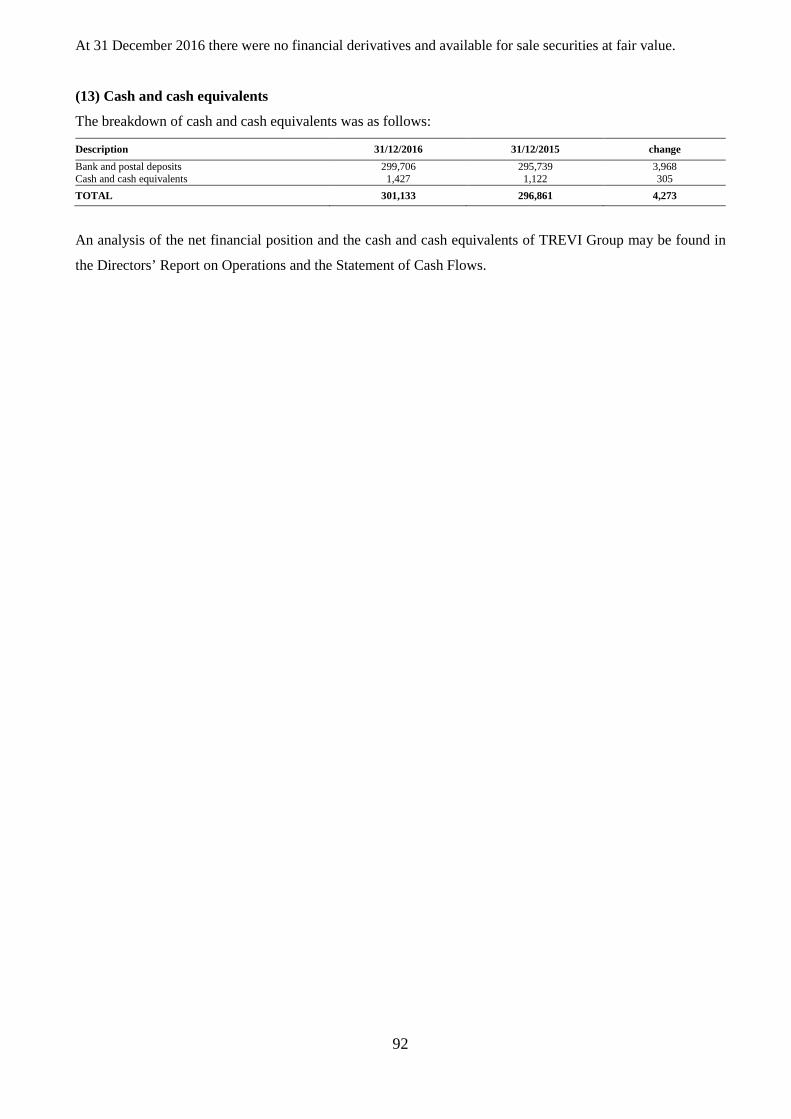
92
At 31 December 2016 there were no financial derivatives and available for sale securities at fair value.
(13) Cash and cash equivalents
The breakdown of cash and cash equivalents was as follows:
Description 31/12/2016 31/12/2015 change
Bank and postal deposits 299,706 295,739 3,968 Cash and cash equivalents 1,427 1,122 305
TOTAL 301,133 296,861 4,273
An analysis of the net financial position and the cash and cash equivalents of TREVI Group may be found in
the Directors’ Report on Operations and the Statement of Cash Flows.
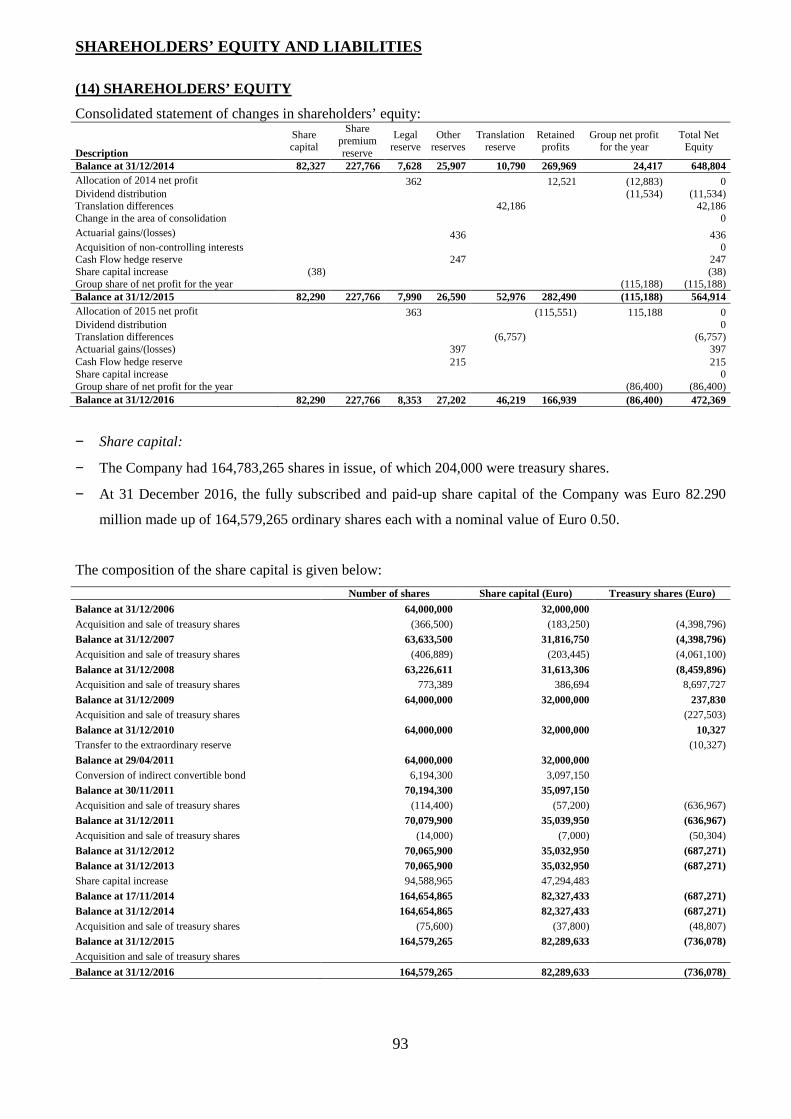
93
SHAREHOLDERS’ EQUITY AND LIABILITIES
(14) SHAREHOLDERS’ EQUITY
Consolidated statement of changes in shareholders’ equity:
Description
Share capital
Share premium reserve
Legal reserve
Other reserves
Translation reserve
Retained profits
Group net profit for the year
Total Net Equity
Balance at 31/12/2014 82,327 227,766 7,628 25,907 10,790 269,969 24,417 648,804 Allocation of 2014 net profit 362 12,521 (12,883) 0 Dividend distribution (11,534) (11,534) Translation differences 42,186 42,186 Change in the area of consolidation 0 Actuarial gains/(losses) 436 436 Acquisition of non-controlling interests 0 Cash Flow hedge reserve 247 247 Share capital increase (38) (38) Group share of net profit for the year (115,188) (115,188) Balance at 31/12/2015 82,290 227,766 7,990 26,590 52,976 282,490 (115,188) 564,914 Allocation of 2015 net profit 363 (115,551) 115,188 0 Dividend distribution 0 Translation differences (6,757) (6,757) Actuarial gains/(losses) 397 397 Cash Flow hedge reserve 215 215 Share capital increase 0 Group share of net profit for the year (86,400) (86,400) Balance at 31/12/2016 82,290 227,766 8,353 27,202 46,219 166,939 (86,400) 472,369
− Share capital:
− The Company had 164,783,265 shares in issue, of which 204,000 were treasury shares.
− At 31 December 2016, the fully subscribed and paid-up share capital of the Company was Euro 82.290
million made up of 164,579,265 ordinary shares each with a nominal value of Euro 0.50.
The composition of the share capital is given below:
Number of shares Share capital (Euro) Treasury shares (Euro)
Balance at 31/12/2006 64,000,000 32,000,000 Acquisition and sale of treasury shares (366,500) (183,250) (4,398,796)
Balance at 31/12/2007 63,633,500 31,816,750 (4,398,796) Acquisition and sale of treasury shares (406,889) (203,445) (4,061,100)
Balance at 31/12/2008 63,226,611 31,613,306 (8,459,896) Acquisition and sale of treasury shares 773,389 386,694 8,697,727
Balance at 31/12/2009 64,000,000 32,000,000 237,830 Acquisition and sale of treasury shares (227,503)
Balance at 31/12/2010 64,000,000 32,000,000 10,327 Transfer to the extraordinary reserve (10,327)
Balance at 29/04/2011 64,000,000 32,000,000 Conversion of indirect convertible bond 6,194,300 3,097,150
Balance at 30/11/2011 70,194,300 35,097,150 Acquisition and sale of treasury shares (114,400) (57,200) (636,967)
Balance at 31/12/2011 70,079,900 35,039,950 (636,967) Acquisition and sale of treasury shares (14,000) (7,000) (50,304)
Balance at 31/12/2012 70,065,900 35,032,950 (687,271) Balance at 31/12/2013 70,065,900 35,032,950 (687,271) Share capital increase 94,588,965 47,294,483
Balance at 17/11/2014 164,654,865 82,327,433 (687,271) Balance at 31/12/2014 164,654,865 82,327,433 (687,271) Acquisition and sale of treasury shares (75,600) (37,800) (48,807)
Balance at 31/12/2015 164,579,265 82,289,633 (736,078) Acquisition and sale of treasury shares
Balance at 31/12/2016 164,579,265 82,289,633 (736,078)
94
− Share premium reserve: At 31 December 2016, the share premium reserve was Euro 227.766 million and was unchanged on the
previous financial year.
− Legal reserve: The legal reserve is the share of the net profit that pursuant to Article 2430 of the Italian Civil Code may not
be distributed as dividends. Compared to the figure at 31 December 2015, the legal reserve increased Euro
0.363 million following the allocation to this reserve of 5% of the profit for the 2015 financial year. At 31
December 2016 this reserve was Euro 8.353 million.
Other reserves:
This entry was made up of the following reserves:
− Fair value reserve: This reserve includes the changes in fair value of financial derivative instruments valued as cash flow hedges
under IAS 39.
− Extraordinary reserve: At 31 December 2016, the extraordinary reserve was Euro 20.147 million, an increase of Euro 6.903 million
compared to the previous financial year.
− IFRS reserve:
The figure of Euro 13.789 million at 31 December 2016 included all the adjustments made for the transition to
IAS/IFRS accounting, which was initially adopted on 1 January 2004.
− Reserve for treasury shares:
The reserve for treasury shares was Euro 0.736 million at 31 December 2016 and was the figure was
unchanged on that at 31 December 2015.
− Currency translation reserve:
This was positive for Euro 46.219 million at 31 December 2016; it reflected the exchange rate differences
deriving from the translation of financial statements prepared in currencies other than the Euro. Movements in
exchange rates in the 2016 financial year compared to the previous financial year, particularly in the US Dollar
against the Euro and the Nigerian Naira against the Euro, resulted in a decrease of Euro 6.757 million in this
reserve.
− Retained earnings: This reserve comprises the profit or loss generated in previous financial years which has not been distributed
as dividends to shareholders; the decrease in the value of this reserve compared to 31 December 2015 was due
to the allocation of the result for the previous financial year to this reserve.
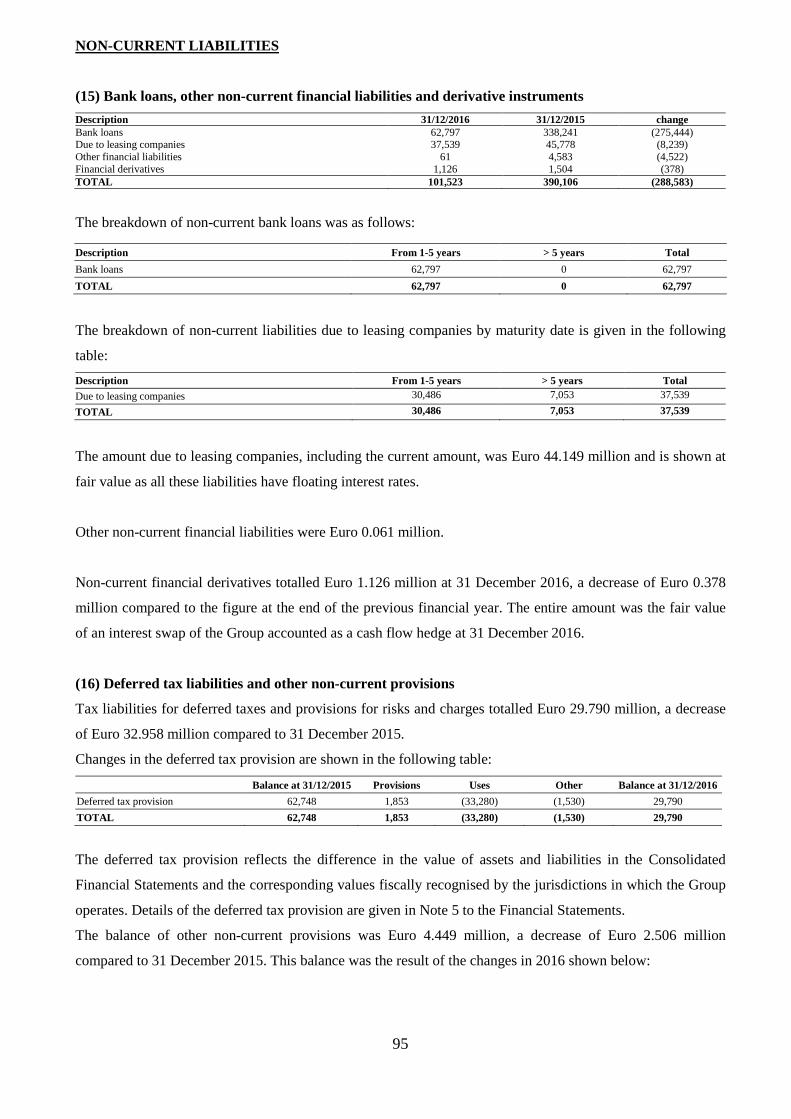
95
NON-CURRENT LIABILITIES
(15) Bank loans, other non-current financial liabilities and derivative instruments
Description 31/12/2016 31/12/2015 change Bank loans 62,797 338,241 (275,444) Due to leasing companies 37,539 45,778 (8,239) Other financial liabilities 61 4,583 (4,522) Financial derivatives 1,126 1,504 (378) TOTAL 101,523 390,106 (288,583)
The breakdown of non-current bank loans was as follows:
The breakdown of non-current liabilities due to leasing companies by maturity date is given in the following
table:
Description From 1-5 years > 5 years Total
Due to leasing companies 30,486 7,053 37,539
TOTAL 30,486 7,053 37,539
The amount due to leasing companies, including the current amount, was Euro 44.149 million and is shown at
fair value as all these liabilities have floating interest rates.
Other non-current financial liabilities were Euro 0.061 million.
Non-current financial derivatives totalled Euro 1.126 million at 31 December 2016, a decrease of Euro 0.378
million compared to the figure at the end of the previous financial year. The entire amount was the fair value
of an interest swap of the Group accounted as a cash flow hedge at 31 December 2016.
(16) Deferred tax liabilities and other non-current provisions
Tax liabilities for deferred taxes and provisions for risks and charges totalled Euro 29.790 million, a decrease
of Euro 32.958 million compared to 31 December 2015.
Changes in the deferred tax provision are shown in the following table:
Balance at 31/12/2015 Provisions Uses Other Balance at 31/12/2016
Deferred tax provision 62,748 1,853 (33,280) (1,530) 29,790
TOTAL 62,748 1,853 (33,280) (1,530) 29,790
The deferred tax provision reflects the difference in the value of assets and liabilities in the Consolidated
Financial Statements and the corresponding values fiscally recognised by the jurisdictions in which the Group
operates. Details of the deferred tax provision are given in Note 5 to the Financial Statements.
The balance of other non-current provisions was Euro 4.449 million, a decrease of Euro 2.506 million
compared to 31 December 2015. This balance was the result of the changes in 2016 shown below:
Description From 1-5 years > 5 years Total
Bank loans 62,797 0 62,797
TOTAL 62,797 0 62,797
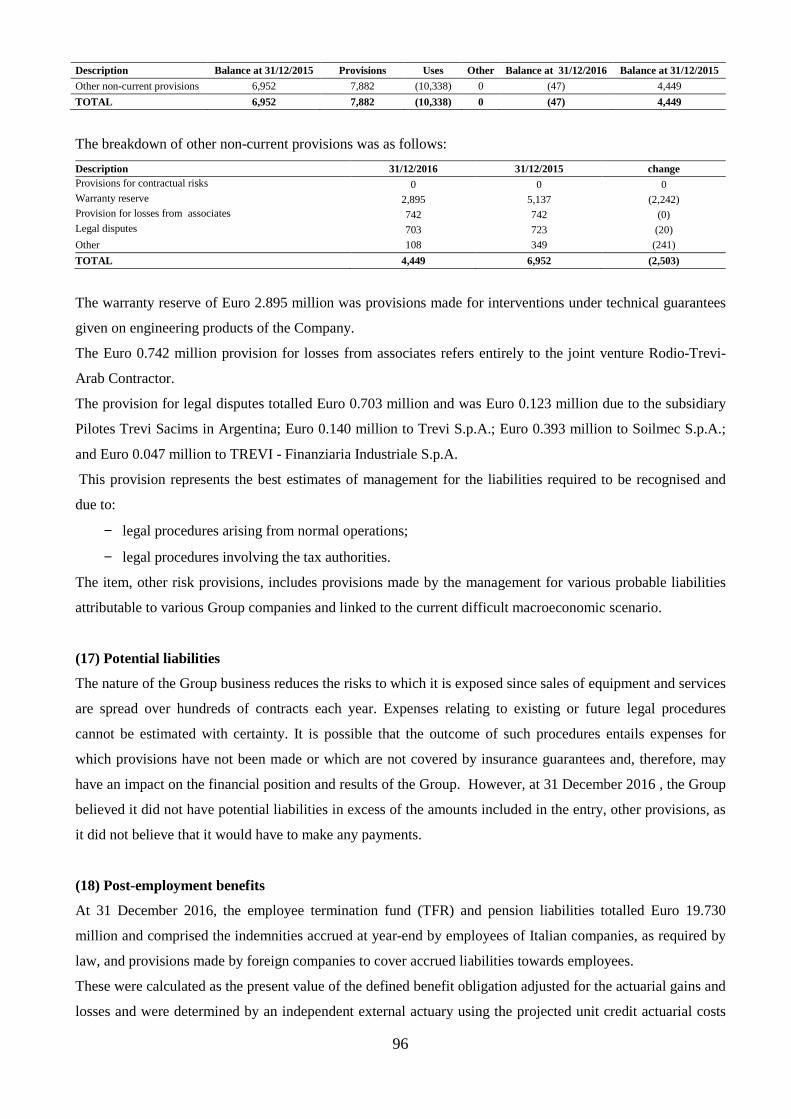
96
Description Balance at 31/12/2015 Provisions Uses Other Balance at 31/12/2016 Balance at 31/12/2015
Other non-current provisions 6,952 7,882 (10,338) 0 (47) 4,449
TOTAL 6,952 7,882 (10,338) 0 (47) 4,449
The breakdown of other non-current provisions was as follows:
Description 31/12/2016 31/12/2015 change Provisions for contractual risks 0 0 0 Warranty reserve 2,895 5,137 (2,242) Provision for losses from associates 742 742 (0) Legal disputes 703 723 (20)
Other 108 349 (241)
TOTAL 4,449 6,952 (2,503)
The warranty reserve of Euro 2.895 million was provisions made for interventions under technical guarantees
given on engineering products of the Company.
The Euro 0.742 million provision for losses from associates refers entirely to the joint venture Rodio-Trevi-
Arab Contractor.
The provision for legal disputes totalled Euro 0.703 million and was Euro 0.123 million due to the subsidiary
Pilotes Trevi Sacims in Argentina; Euro 0.140 million to Trevi S.p.A.; Euro 0.393 million to Soilmec S.p.A.;
and Euro 0.047 million to TREVI - Finanziaria Industriale S.p.A.
This provision represents the best estimates of management for the liabilities required to be recognised and
due to:
− legal procedures arising from normal operations;
− legal procedures involving the tax authorities.
The item, other risk provisions, includes provisions made by the management for various probable liabilities
attributable to various Group companies and linked to the current difficult macroeconomic scenario.
(17) Potential liabilities
The nature of the Group business reduces the risks to which it is exposed since sales of equipment and services
are spread over hundreds of contracts each year. Expenses relating to existing or future legal procedures
cannot be estimated with certainty. It is possible that the outcome of such procedures entails expenses for
which provisions have not been made or which are not covered by insurance guarantees and, therefore, may
have an impact on the financial position and results of the Group. However, at 31 December 2016 , the Group
believed it did not have potential liabilities in excess of the amounts included in the entry, other provisions, as
it did not believe that it would have to make any payments.
(18) Post-employment benefits
At 31 December 2016, the employee termination fund (TFR) and pension liabilities totalled Euro 19.730
million and comprised the indemnities accrued at year-end by employees of Italian companies, as required by
law, and provisions made by foreign companies to cover accrued liabilities towards employees.
These were calculated as the present value of the defined benefit obligation adjusted for the actuarial gains and
losses and were determined by an independent external actuary using the projected unit credit actuarial costs
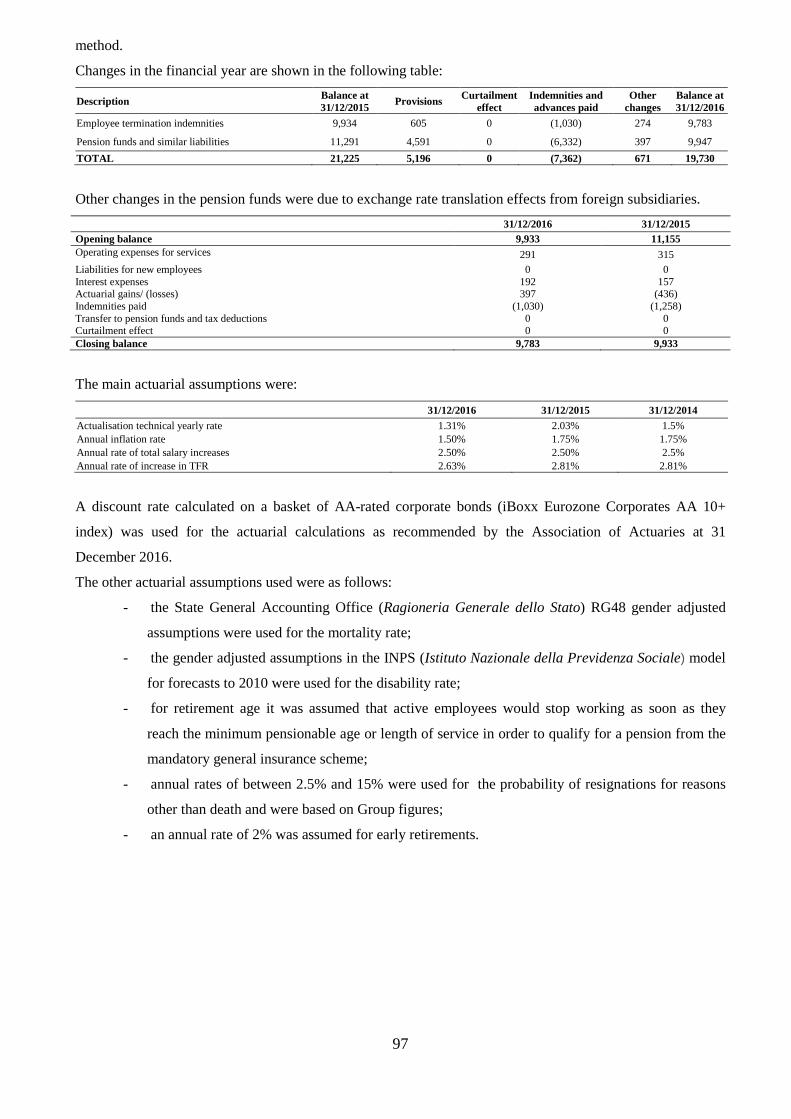
97
method.
Changes in the financial year are shown in the following table:
Description Balance at 31/12/2015
Provisions Curtailment effect
Indemnities and advances paid
Other changes
Balance at 31/12/2016
Employee termination indemnities 9,934 605 0 (1,030) 274 9,783
Pension funds and similar liabilities 11,291 4,591 0 (6,332) 397 9,947
TOTAL 21,225 5,196 0 (7,362) 671 19,730
Other changes in the pension funds were due to exchange rate translation effects from foreign subsidiaries.
31/12/2016 31/12/2015 Opening balance 9,933 11,155 Operating expenses for services 291 315 Liabilities for new employees 0 0 Interest expenses 192 157 Actuarial gains/ (losses) 397 (436) Indemnities paid (1,030) (1,258) Transfer to pension funds and tax deductions 0 0 Curtailment effect 0 0 Closing balance 9,783 9,933
The main actuarial assumptions were:
31/12/2016 31/12/2015 31/12/2014 Actualisation technical yearly rate 1.31% 2.03% 1.5% Annual inflation rate 1.50% 1.75% 1.75% Annual rate of total salary increases 2.50% 2.50% 2.5% Annual rate of increase in TFR 2.63% 2.81% 2.81%
A discount rate calculated on a basket of AA-rated corporate bonds (iBoxx Eurozone Corporates AA 10+
index) was used for the actuarial calculations as recommended by the Association of Actuaries at 31
December 2016.
The other actuarial assumptions used were as follows:
- the State General Accounting Office (Ragioneria Generale dello Stato) RG48 gender adjusted
assumptions were used for the mortality rate;
- the gender adjusted assumptions in the INPS (Istituto Nazionale della Previdenza Sociale) model
for forecasts to 2010 were used for the disability rate;
- for retirement age it was assumed that active employees would stop working as soon as they
reach the minimum pensionable age or length of service in order to qualify for a pension from the
mandatory general insurance scheme;
- annual rates of between 2.5% and 15% were used for the probability of resignations for reasons
other than death and were based on Group figures;
- an annual rate of 2% was assumed for early retirements.
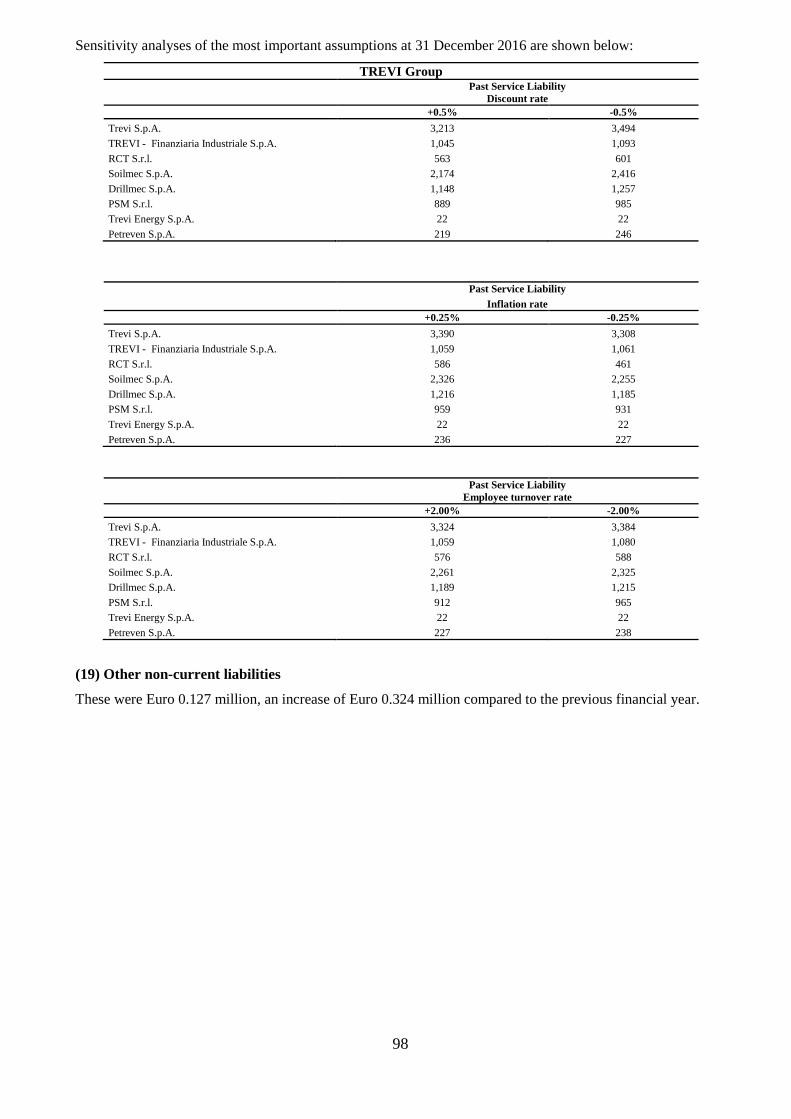
98
Sensitivity analyses of the most important assumptions at 31 December 2016 are shown below:
TREVI Group Past Service Liability Discount rate +0.5% -0.5%
Trevi S.p.A. 3,213 3,494
TREVI - Finanziaria Industriale S.p.A. 1,045 1,093
RCT S.r.l. 563 601
Soilmec S.p.A. 2,174 2,416
Drillmec S.p.A. 1,148 1,257
PSM S.r.l. 889 985
Trevi Energy S.p.A. 22 22
Petreven S.p.A. 219 246
Past Service Liability Inflation rate +0.25% -0.25%
Trevi S.p.A. 3,390 3,308
TREVI - Finanziaria Industriale S.p.A. 1,059 1,061
RCT S.r.l. 586 461
Soilmec S.p.A. 2,326 2,255
Drillmec S.p.A. 1,216 1,185
PSM S.r.l. 959 931
Trevi Energy S.p.A. 22 22
Petreven S.p.A. 236 227
Past Service Liability Employee turnover rate +2.00% -2.00%
Trevi S.p.A. 3,324 3,384
TREVI - Finanziaria Industriale S.p.A. 1,059 1,080
RCT S.r.l. 576 588
Soilmec S.p.A. 2,261 2,325
Drillmec S.p.A. 1,189 1,215
PSM S.r.l. 912 965
Trevi Energy S.p.A. 22 22
Petreven S.p.A. 227 238
(19) Other non-current liabilities
These were Euro 0.127 million, an increase of Euro 0.324 million compared to the previous financial year.
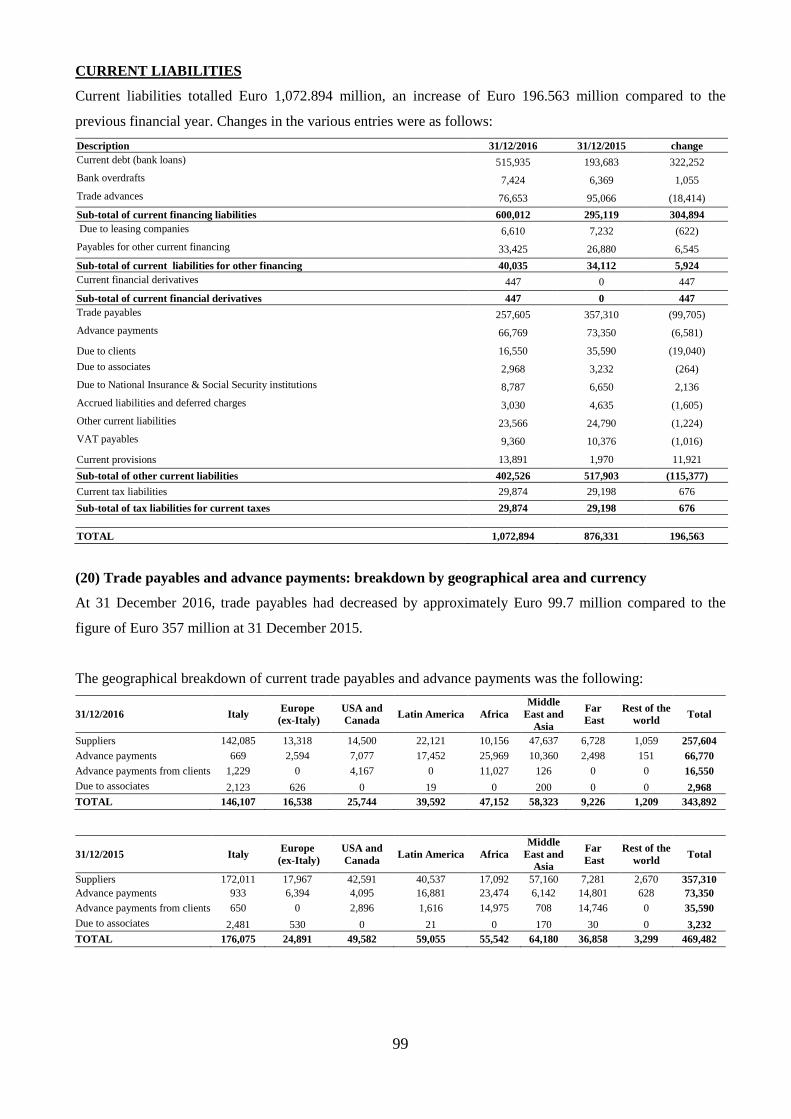
99
CURRENT LIABILITIES
Current liabilities totalled Euro 1,072.894 million, an increase of Euro 196.563 million compared to the
previous financial year. Changes in the various entries were as follows:
Description 31/12/2016 31/12/2015 change Current debt (bank loans) 515,935 193,683 322,252
Bank overdrafts 7,424 6,369 1,055
Trade advances 76,653 95,066 (18,414)
Sub-total of current financing liabilities 600,012 295,119 304,894 Due to leasing companies 6,610 7,232 (622)
Payables for other current financing 33,425 26,880 6,545
Sub-total of current liabilities for other financing 40,035 34,112 5,924 Current financial derivatives 447 0 447
Sub-total of current financial derivatives 447 0 447 Trade payables 257,605 357,310 (99,705)
Advance payments 66,769 73,350 (6,581)
Due to clients 16,550 35,590 (19,040)
Due to associates 2,968 3,232 (264)
Due to National Insurance & Social Security institutions 8,787 6,650 2,136
Accrued liabilities and deferred charges 3,030 4,635 (1,605)
Other current liabilities 23,566 24,790 (1,224)
VAT payables 9,360 10,376 (1,016)
Current provisions 13,891 1,970 11,921
Sub-total of other current liabilities 402,526 517,903 (115,377)
Current tax liabilities 29,874 29,198 676
Sub-total of tax liabilities for current taxes 29,874 29,198 676
TOTAL 1,072,894 876,331 196,563
(20) Trade payables and advance payments: breakdown by geographical area and currency
At 31 December 2016, trade payables had decreased by approximately Euro 99.7 million compared to the
figure of Euro 357 million at 31 December 2015.
The geographical breakdown of current trade payables and advance payments was the following:
31/12/2016 Italy Europe (ex-Italy)
USA and Canada Latin America Africa
Middle East and
Asia
Far East
Rest of the world Total
Suppliers 142,085 13,318 14,500 22,121 10,156 47,637 6,728 1,059 257,604 Advance payments 669 2,594 7,077 17,452 25,969 10,360 2,498 151 66,770 Advance payments from clients 1,229 0 4,167 0 11,027 126 0 0 16,550 Due to associates 2,123 626 0 19 0 200 0 0 2,968 TOTAL 146,107 16,538 25,744 39,592 47,152 58,323 9,226 1,209 343,892
31/12/2015 Italy Europe
(ex-Italy) USA and Canada Latin America Africa
Middle East and
Asia
Far East
Rest of the world Total
Suppliers 172,011 17,967 42,591 40,537 17,092 57,160 7,281 2,670 357,310 Advance payments 933 6,394 4,095 16,881 23,474 6,142 14,801 628 73,350 Advance payments from clients 650 0 2,896 1,616 14,975 708 14,746 0 35,590 Due to associates 2,481 530 0 21 0 170 30 0 3,232 TOTAL 176,075 24,891 49,582 59,055 55,542 64,180 36,858 3,299 469,482
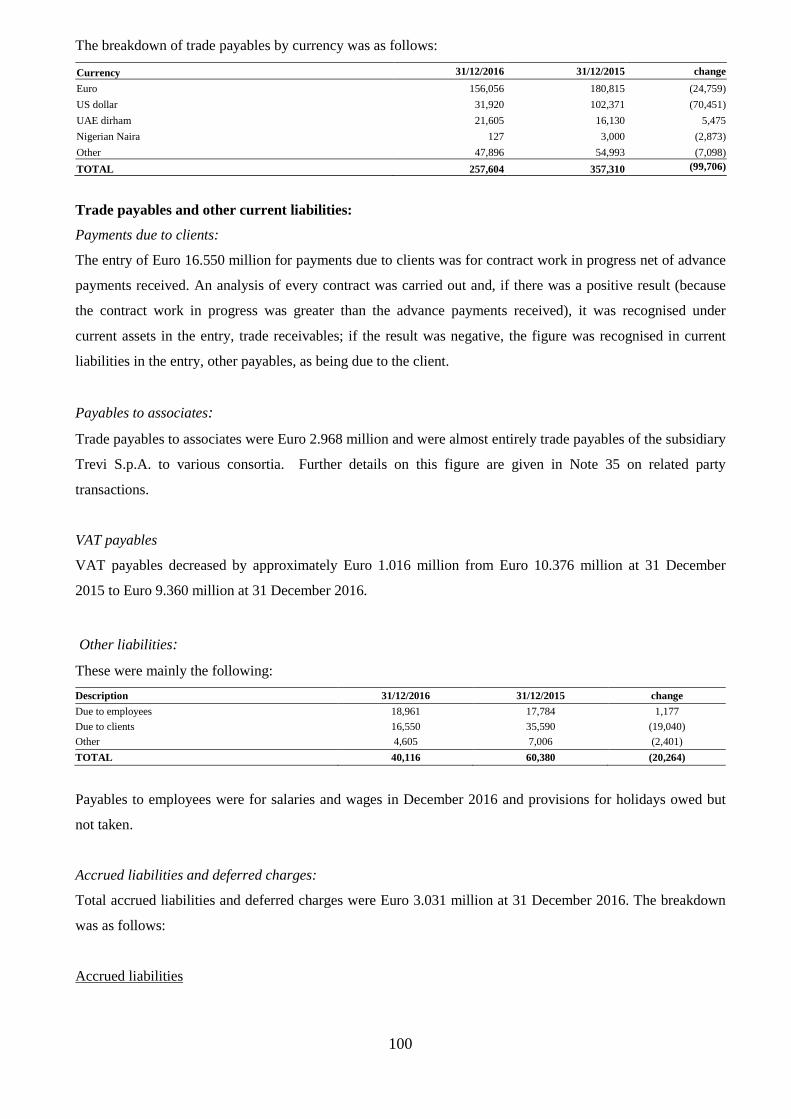
100
The breakdown of trade payables by currency was as follows:
Currency 31/12/2016 31/12/2015 change
Euro 156,056 180,815 (24,759)
US dollar 31,920 102,371 (70,451)
UAE dirham 21,605 16,130 5,475
Nigerian Naira 127 3,000 (2,873)
Other 47,896 54,993 (7,098)
TOTAL 257,604 357,310 (99,706)
Trade payables and other current liabilities:
Payments due to clients:
The entry of Euro 16.550 million for payments due to clients was for contract work in progress net of advance
payments received. An analysis of every contract was carried out and, if there was a positive result (because
the contract work in progress was greater than the advance payments received), it was recognised under
current assets in the entry, trade receivables; if the result was negative, the figure was recognised in current
liabilities in the entry, other payables, as being due to the client.
Payables to associates:
Trade payables to associates were Euro 2.968 million and were almost entirely trade payables of the subsidiary
Trevi S.p.A. to various consortia. Further details on this figure are given in Note 35 on related party
transactions.
VAT payables
VAT payables decreased by approximately Euro 1.016 million from Euro 10.376 million at 31 December
2015 to Euro 9.360 million at 31 December 2016.
Other liabilities:
These were mainly the following:
Description 31/12/2016 31/12/2015 change
Due to employees 18,961 17,784 1,177
Due to clients 16,550 35,590 (19,040)
Other 4,605 7,006 (2,401)
TOTAL 40,116 60,380 (20,264)
Payables to employees were for salaries and wages in December 2016 and provisions for holidays owed but
not taken.
Accrued liabilities and deferred charges:
Total accrued liabilities and deferred charges were Euro 3.031 million at 31 December 2016. The breakdown
was as follows:
Accrued liabilities
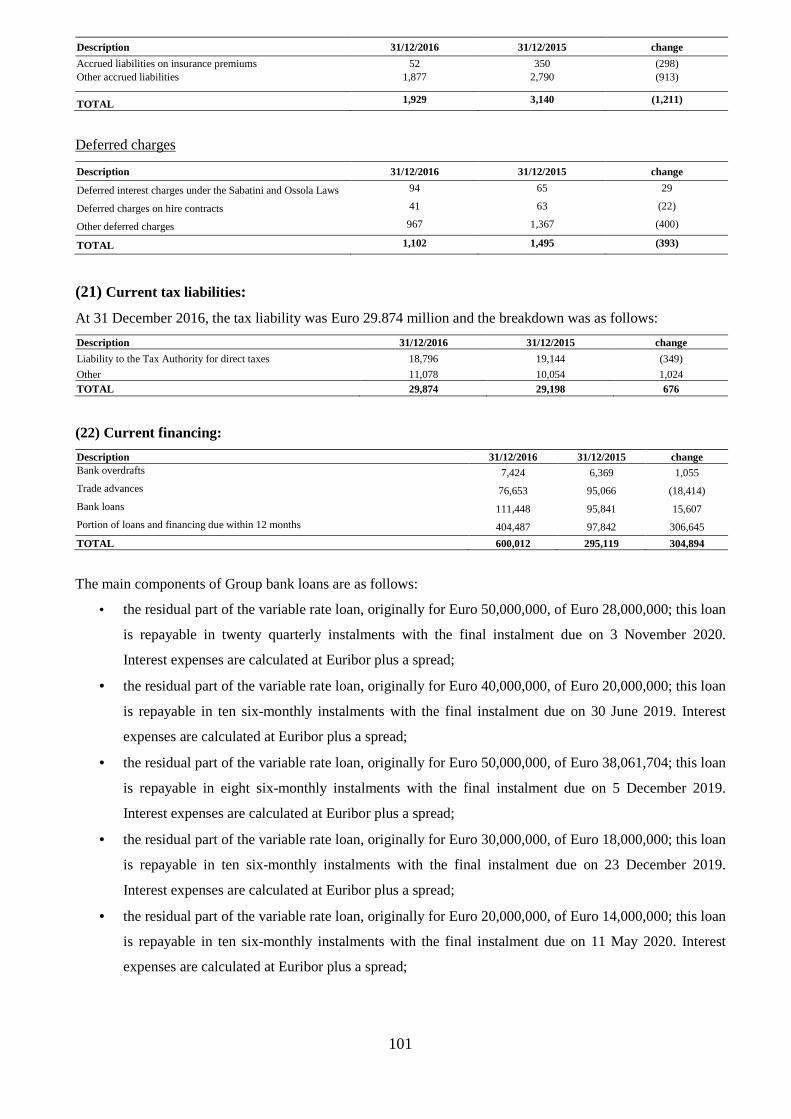
101
Description 31/12/2016 31/12/2015 change
Accrued liabilities on insurance premiums 52 350 (298) Other accrued liabilities 1,877 2,790 (913)
TOTAL 1,929 3,140 (1,211)
Deferred charges
Description 31/12/2016 31/12/2015 change
Deferred interest charges under the Sabatini and Ossola Laws 94 65 29
Deferred charges on hire contracts 41 63 (22)
Other deferred charges 967 1,367 (400)
TOTAL 1,102 1,495 (393)
(21) Current tax liabilities :
At 31 December 2016, the tax liability was Euro 29.874 million and the breakdown was as follows:
Description 31/12/2016 31/12/2015 change
Liability to the Tax Authority for direct taxes 18,796 19,144 (349)
Other 11,078 10,054 1,024 TOTAL 29,874 29,198 676
(22) Current financing:
Description 31/12/2016 31/12/2015 change Bank overdrafts 7,424 6,369 1,055
Trade advances 76,653 95,066 (18,414)
Bank loans 111,448 95,841 15,607
Portion of loans and financing due within 12 months 404,487 97,842 306,645
TOTAL 600,012 295,119 304,894
The main components of Group bank loans are as follows:
• the residual part of the variable rate loan, originally for Euro 50,000,000, of Euro 28,000,000; this loan
is repayable in twenty quarterly instalments with the final instalment due on 3 November 2020.
Interest expenses are calculated at Euribor plus a spread;
• the residual part of the variable rate loan, originally for Euro 40,000,000, of Euro 20,000,000; this loan
is repayable in ten six-monthly instalments with the final instalment due on 30 June 2019. Interest
expenses are calculated at Euribor plus a spread;
• the residual part of the variable rate loan, originally for Euro 50,000,000, of Euro 38,061,704; this loan
is repayable in eight six-monthly instalments with the final instalment due on 5 December 2019.
Interest expenses are calculated at Euribor plus a spread;
• the residual part of the variable rate loan, originally for Euro 30,000,000, of Euro 18,000,000; this loan
is repayable in ten six-monthly instalments with the final instalment due on 23 December 2019.
Interest expenses are calculated at Euribor plus a spread;
• the residual part of the variable rate loan, originally for Euro 20,000,000, of Euro 14,000,000; this loan
is repayable in ten six-monthly instalments with the final instalment due on 11 May 2020. Interest
expenses are calculated at Euribor plus a spread;
102
• the residual part of the variable rate loan, originally for Euro 20,000,000, of Euro 11,552,253; this loan
is repayable in seven six-monthly instalments with the final instalment due on 31 December 2018.
Interest expenses are calculated at Euribor plus a spread;
• the residual part of the variable rate loan, originally for Euro 30,000,000, of Euro 26,250,000; this loan
is repayable in eight six-monthly instalments with the final instalment due on 19 June 2020. Interest
expenses are calculated at Euribor plus a spread;
• the residual part of the variable rate loan, originally for Euro 40,000,000, of Euro 40,000,000; this loan
is repayable in fourteen six-monthly instalments with the final instalment due on 19 June 2025.
Interest expenses are calculated at Euribor plus a spread;
• the residual part of the variable rate loan, originally for Euro 20,000,000, of Euro 15,110,782; this loan
is repayable in eight six-monthly instalments with the final instalment due on 23 July 2019. Interest
expenses are calculated at Euribor plus a spread.
In addition to the financing described above, at 31 December 2016, the TREVI Group had significant loans
totalling Euro 211.6 million repayable in single amounts when the periods of the loans expire; these included
the Minibond 2014-2019.
Some of these loan agreements contain covenants that require adherence to certain financial ratios based on
the Consolidated Financial Statements as follows:
− Net Financial Position / EBITDA: an indicator of indebtedness, calculated as the ratio of net financial
indebtedness to EBITDA;
− Net Financial Position/ Shareholders’ Equity: an indicator of indebtedness, calculated as the ratio of
net financial indebtedness to shareholders’ equity.
The Minibond 2014-2019 carries a further financial covenant in addition to those above which is also
measured on the Consolidated Financial Statements:
− EBITDA/ Net Financial Expenses: an indicator of the weight of interest expenses calculated as the
ratio of EBITDA to net financial expenses.
Should the Company fail to respect these covenants, the loan agreements allow for a cure period; if the
Company’s failure to respect the covenants continues beyond the cure period, the banks that have granted the
loans can call in the loans or renegotiate the terms.
As already described, in the financial year under review all the loans having financial covenants that were not
met at 31 December 2016 were reclassified in current financing. After the year-end reporting date, the banks
provided contractual waivers regarding the measurement of these ratios at 31 December 2016.
Further details are provided in the section on General Presentation Criteria.
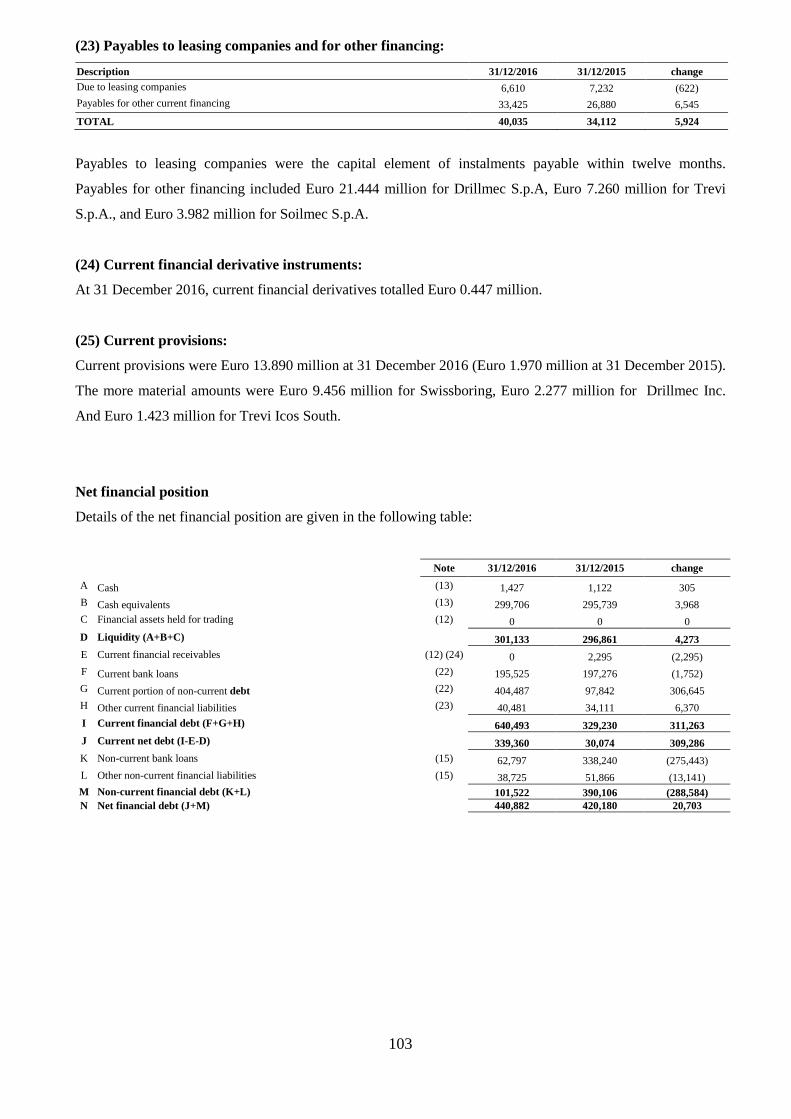
103
(23) Payables to leasing companies and for other financing:
Description 31/12/2016 31/12/2015 change Due to leasing companies 6,610 7,232 (622) Payables for other current financing 33,425 26,880 6,545
TOTAL 40,035 34,112 5,924
Payables to leasing companies were the capital element of instalments payable within twelve months.
Payables for other financing included Euro 21.444 million for Drillmec S.p.A, Euro 7.260 million for Trevi
S.p.A., and Euro 3.982 million for Soilmec S.p.A.
(24) Current financial derivative instruments: At 31 December 2016, current financial derivatives totalled Euro 0.447 million.
(25) Current provisions: Current provisions were Euro 13.890 million at 31 December 2016 (Euro 1.970 million at 31 December 2015).
The more material amounts were Euro 9.456 million for Swissboring, Euro 2.277 million for Drillmec Inc.
And Euro 1.423 million for Trevi Icos South.
Net financial position
Details of the net financial position are given in the following table:
Note 31/12/2016 31/12/2015 change
A Cash (13) 1,427 1,122 305 B Cash equivalents (13) 299,706 295,739 3,968 C Financial assets held for trading (12) 0 0 0
D Liquidity (A+B+C) 301,133 296,861 4,273 E Current financial receivables (12) (24) 0 2,295 (2,295) F Current bank loans (22) 195,525 197,276 (1,752) G Current portion of non-current debt (22) 404,487 97,842 306,645 H Other current financial liabilities (23) 40,481 34,111 6,370
I Current financial debt (F+G+H) 640,493 329,230 311,263 J Current net debt (I-E-D) 339,360 30,074 309,286 K Non-current bank loans (15) 62,797 338,240 (275,443) L Other non-current financial liabilities (15) 38,725 51,866 (13,141) M Non-current financial debt (K+L) 101,522 390,106 (288,584) N Net financial debt (J+M) 440,882 420,180 20,703
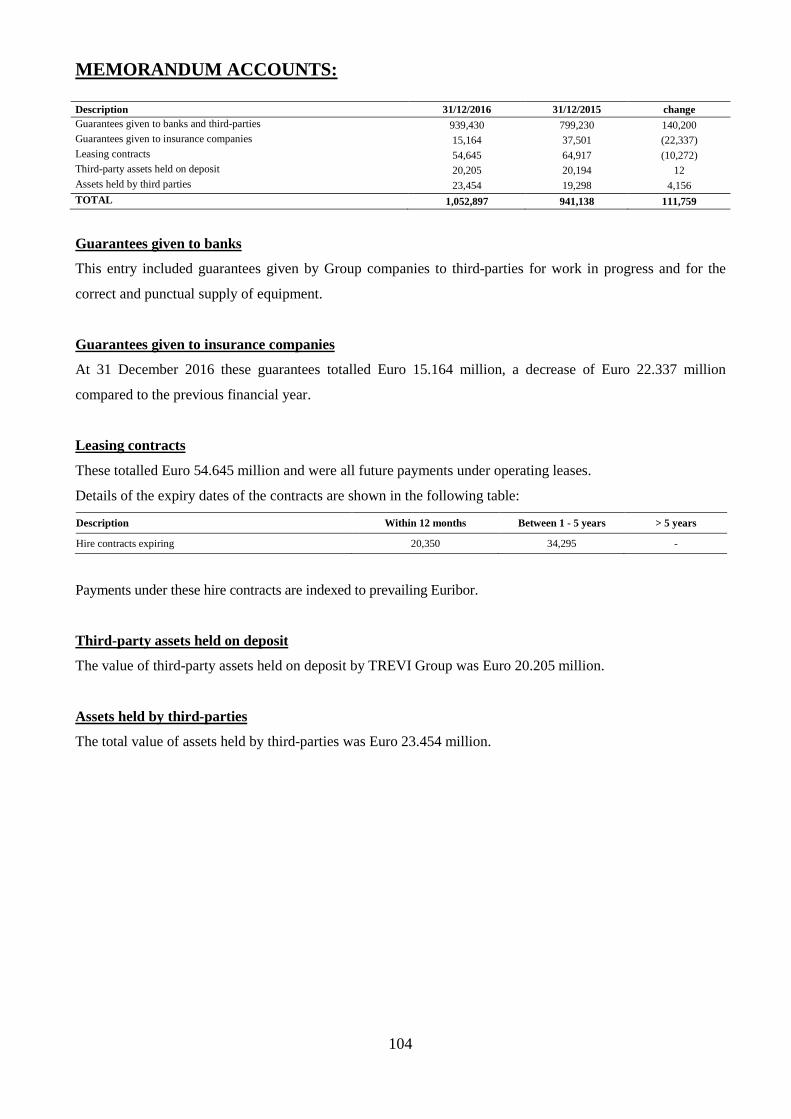
104
MEMORANDUM ACCOUNTS: Description 31/12/2016 31/12/2015 change Guarantees given to banks and third-parties 939,430 799,230 140,200 Guarantees given to insurance companies 15,164 37,501 (22,337) Leasing contracts 54,645 64,917 (10,272) Third-party assets held on deposit 20,205 20,194 12 Assets held by third parties 23,454 19,298 4,156 TOTAL 1,052,897 941,138 111,759
Guarantees given to banks
This entry included guarantees given by Group companies to third-parties for work in progress and for the
correct and punctual supply of equipment.
Guarantees given to insurance companies
At 31 December 2016 these guarantees totalled Euro 15.164 million, a decrease of Euro 22.337 million
compared to the previous financial year.
Leasing contracts
These totalled Euro 54.645 million and were all future payments under operating leases.
Details of the expiry dates of the contracts are shown in the following table:
Description Within 12 months Between 1 - 5 years > 5 years
Hire contracts expiring 20,350 34,295 -
Payments under these hire contracts are indexed to prevailing Euribor.
Third-party assets held on deposit
The value of third-party assets held on deposit by TREVI Group was Euro 20.205 million.
Assets held by third-parties
The total value of assets held by third-parties was Euro 23.454 million.
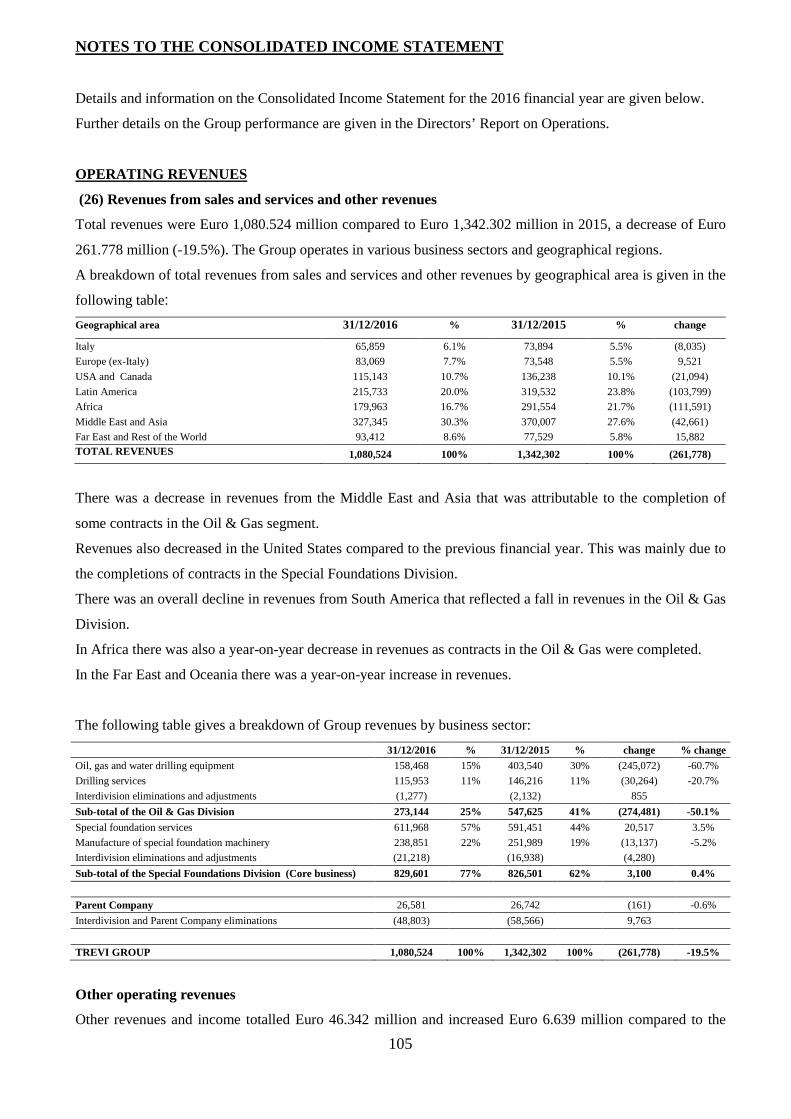
105
NOTES TO THE CONSOLIDATED INCOME STATEMENT
Details and information on the Consolidated Income Statement for the 2016 financial year are given below.
Further details on the Group performance are given in the Directors’ Report on Operations.
OPERATING REVENUES
(26) Revenues from sales and services and other revenues
Total revenues were Euro 1,080.524 million compared to Euro 1,342.302 million in 2015, a decrease of Euro
261.778 million (-19.5%). The Group operates in various business sectors and geographical regions.
A breakdown of total revenues from sales and services and other revenues by geographical area is given in the
following table:
Geographical area 31/12/2016 % 31/12/2015 % change
Italy 65,859 6.1% 73,894 5.5% (8,035)
Europe (ex-Italy) 83,069 7.7% 73,548 5.5% 9,521
USA and Canada 115,143 10.7% 136,238 10.1% (21,094)
Latin America 215,733 20.0% 319,532 23.8% (103,799)
Africa 179,963 16.7% 291,554 21.7% (111,591)
Middle East and Asia 327,345 30.3% 370,007 27.6% (42,661)
Far East and Rest of the World 93,412 8.6% 77,529 5.8% 15,882 TOTAL REVENUES 1,080,524 100% 1,342,302 100% (261,778)
There was a decrease in revenues from the Middle East and Asia that was attributable to the completion of
some contracts in the Oil & Gas segment.
Revenues also decreased in the United States compared to the previous financial year. This was mainly due to
the completions of contracts in the Special Foundations Division.
There was an overall decline in revenues from South America that reflected a fall in revenues in the Oil & Gas
Division.
In Africa there was also a year-on-year decrease in revenues as contracts in the Oil & Gas were completed.
In the Far East and Oceania there was a year-on-year increase in revenues.
The following table gives a breakdown of Group revenues by business sector:
31/12/2016 % 31/12/2015 % change % change
Oil, gas and water drilling equipment 158,468 15% 403,540 30% (245,072) -60.7%
Drilling services 115,953 11% 146,216 11% (30,264) -20.7%
Interdivision eliminations and adjustments (1,277) (2,132) 855
Sub-total of the Oil & Gas Division 273,144 25% 547,625 41% (274,481) -50.1%
Special foundation services 611,968 57% 591,451 44% 20,517 3.5%
Manufacture of special foundation machinery 238,851 22% 251,989 19% (13,137) -5.2%
Interdivision eliminations and adjustments (21,218) (16,938) (4,280)
Sub-total of the Special Foundations Division (Core business) 829,601 77% 826,501 62% 3,100 0.4%
Parent Company 26,581 26,742 (161) -0.6%
Interdivision and Parent Company eliminations (48,803) (58,566) 9,763
TREVI GROUP 1,080,524 100% 1,342,302 100% (261,778) -19.5%
Other operating revenues
Other revenues and income totalled Euro 46.342 million and increased Euro 6.639 million compared to the
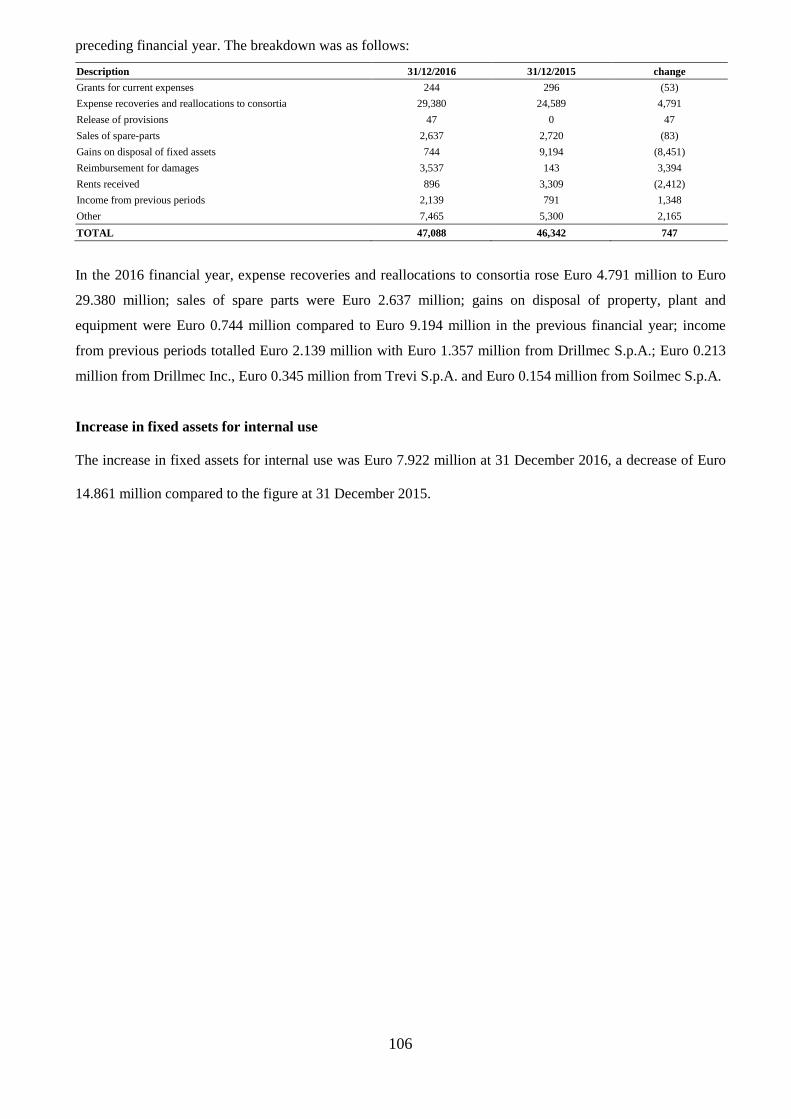
106
preceding financial year. The breakdown was as follows:
Description 31/12/2016 31/12/2015 change
Grants for current expenses 244 296 (53)
Expense recoveries and reallocations to consortia 29,380 24,589 4,791
Release of provisions 47 0 47
Sales of spare-parts 2,637 2,720 (83)
Gains on disposal of fixed assets 744 9,194 (8,451)
Reimbursement for damages 3,537 143 3,394
Rents received 896 3,309 (2,412)
Income from previous periods 2,139 791 1,348
Other 7,465 5,300 2,165
TOTAL 47,088 46,342 747
In the 2016 financial year, expense recoveries and reallocations to consortia rose Euro 4.791 million to Euro
29.380 million; sales of spare parts were Euro 2.637 million; gains on disposal of property, plant and
equipment were Euro 0.744 million compared to Euro 9.194 million in the previous financial year; income
from previous periods totalled Euro 2.139 million with Euro 1.357 million from Drillmec S.p.A.; Euro 0.213
million from Drillmec Inc., Euro 0.345 million from Trevi S.p.A. and Euro 0.154 million from Soilmec S.p.A.
Increase in fixed assets for internal use
The increase in fixed assets for internal use was Euro 7.922 million at 31 December 2016, a decrease of Euro
14.861 million compared to the figure at 31 December 2015.
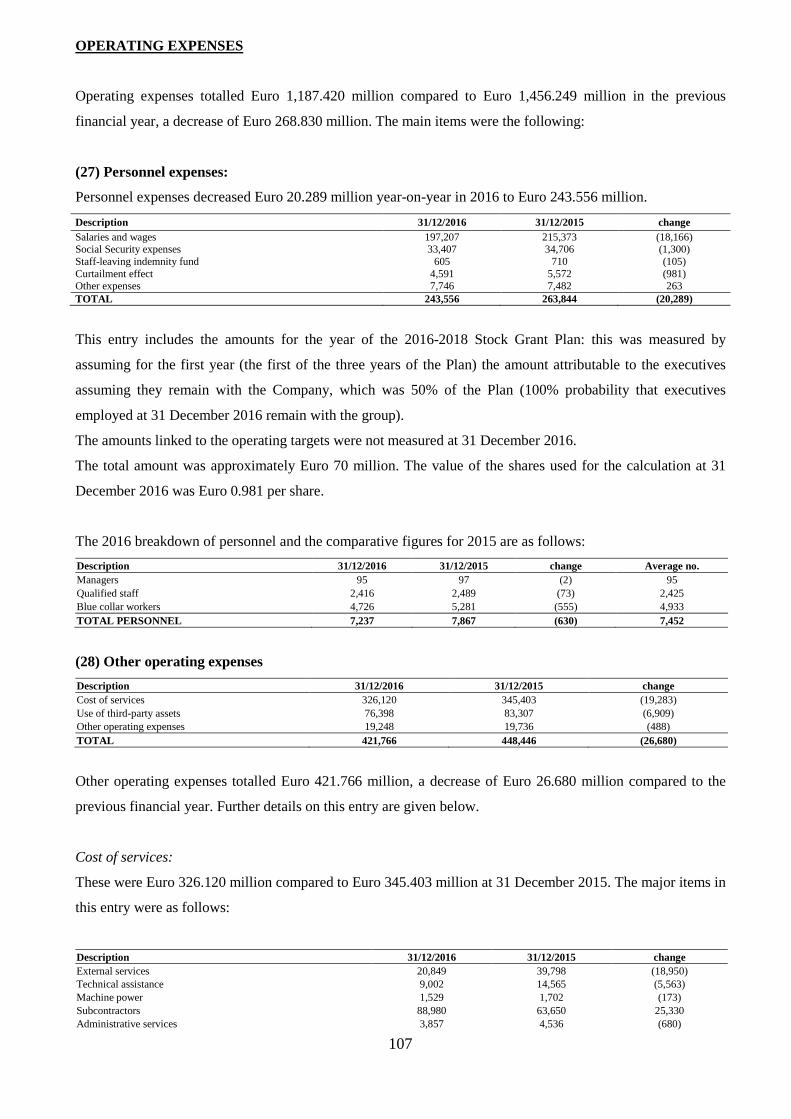
107
OPERATING EXPENSES
Operating expenses totalled Euro 1,187.420 million compared to Euro 1,456.249 million in the previous
financial year, a decrease of Euro 268.830 million. The main items were the following:
(27) Personnel expenses:
Personnel expenses decreased Euro 20.289 million year-on-year in 2016 to Euro 243.556 million.
Description 31/12/2016 31/12/2015 change Salaries and wages 197,207 215,373 (18,166) Social Security expenses 33,407 34,706 (1,300) Staff-leaving indemnity fund 605 710 (105) Curtailment effect 4,591 5,572 (981) Other expenses 7,746 7,482 263 TOTAL 243,556 263,844 (20,289)
This entry includes the amounts for the year of the 2016-2018 Stock Grant Plan: this was measured by
assuming for the first year (the first of the three years of the Plan) the amount attributable to the executives
assuming they remain with the Company, which was 50% of the Plan (100% probability that executives
employed at 31 December 2016 remain with the group).
The amounts linked to the operating targets were not measured at 31 December 2016.
The total amount was approximately Euro 70 million. The value of the shares used for the calculation at 31
December 2016 was Euro 0.981 per share.
The 2016 breakdown of personnel and the comparative figures for 2015 are as follows:
Description 31/12/2016 31/12/2015 change Average no. Managers 95 97 (2) 95 Qualified staff 2,416 2,489 (73) 2,425 Blue collar workers 4,726 5,281 (555) 4,933 TOTAL PERSONNEL 7,237 7,867 (630) 7,452
(28) Other operating expenses
Description 31/12/2016 31/12/2015 change Cost of services 326,120 345,403 (19,283) Use of third-party assets 76,398 83,307 (6,909) Other operating expenses 19,248 19,736 (488) TOTAL 421,766 448,446 (26,680)
Other operating expenses totalled Euro 421.766 million, a decrease of Euro 26.680 million compared to the
previous financial year. Further details on this entry are given below.
Cost of services:
These were Euro 326.120 million compared to Euro 345.403 million at 31 December 2015. The major items in
this entry were as follows:
Description 31/12/2016 31/12/2015 change External services 20,849 39,798 (18,950) Technical assistance 9,002 14,565 (5,563) Machine power 1,529 1,702 (173) Subcontractors 88,980 63,650 25,330 Administrative services 3,857 4,536 (680)
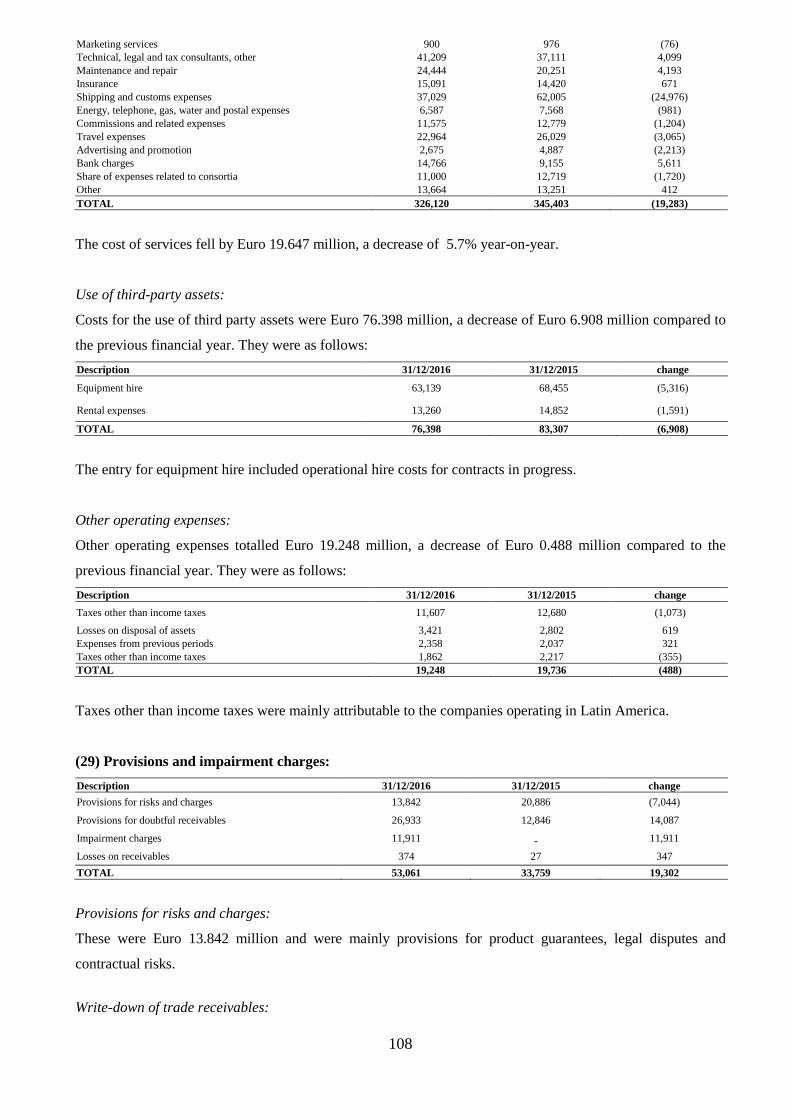
108
Marketing services 900 976 (76) Technical, legal and tax consultants, other 41,209 37,111 4,099 Maintenance and repair 24,444 20,251 4,193 Insurance 15,091 14,420 671 Shipping and customs expenses 37,029 62,005 (24,976) Energy, telephone, gas, water and postal expenses 6,587 7,568 (981) Commissions and related expenses 11,575 12,779 (1,204) Travel expenses 22,964 26,029 (3,065) Advertising and promotion 2,675 4,887 (2,213) Bank charges 14,766 9,155 5,611 Share of expenses related to consortia 11,000 12,719 (1,720) Other 13,664 13,251 412 TOTAL 326,120 345,403 (19,283)
The cost of services fell by Euro 19.647 million, a decrease of 5.7% year-on-year.
Use of third-party assets:
Costs for the use of third party assets were Euro 76.398 million, a decrease of Euro 6.908 million compared to
the previous financial year. They were as follows:
Description 31/12/2016 31/12/2015 change
Equipment hire 63,139 68,455 (5,316)
Rental expenses 13,260 14,852 (1,591)
TOTAL 76,398 83,307 (6,908)
The entry for equipment hire included operational hire costs for contracts in progress.
Other operating expenses:
Other operating expenses totalled Euro 19.248 million, a decrease of Euro 0.488 million compared to the
previous financial year. They were as follows:
Description 31/12/2016 31/12/2015 change
Taxes other than income taxes 11,607 12,680 (1,073)
Losses on disposal of assets 3,421 2,802 619 Expenses from previous periods 2,358 2,037 321 Taxes other than income taxes 1,862 2,217 (355) TOTAL 19,248 19,736 (488)
Taxes other than income taxes were mainly attributable to the companies operating in Latin America.
(29) Provisions and impairment charges:
Description 31/12/2016 31/12/2015 change
Provisions for risks and charges 13,842 20,886 (7,044)
Provisions for doubtful receivables 26,933 12,846 14,087
Impairment charges 11,911 - 11,911
Losses on receivables 374 27 347
TOTAL 53,061 33,759 19,302
Provisions for risks and charges:
These were Euro 13.842 million and were mainly provisions for product guarantees, legal disputes and
contractual risks.
Write-down of trade receivables:
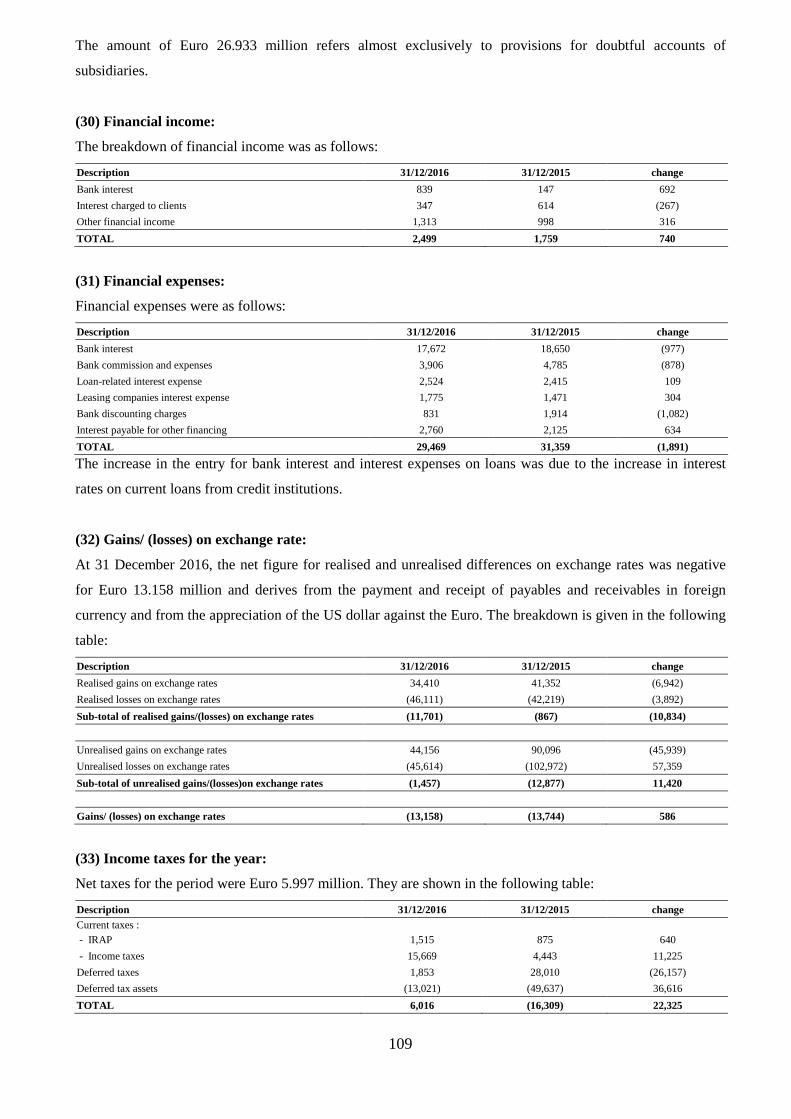
109
The amount of Euro 26.933 million refers almost exclusively to provisions for doubtful accounts of
subsidiaries.
(30) Financial income:
The breakdown of financial income was as follows:
Description 31/12/2016 31/12/2015 change
Bank interest 839 147 692
Interest charged to clients 347 614 (267)
Other financial income 1,313 998 316
TOTAL 2,499 1,759 740
(31) Financial expenses:
Financial expenses were as follows:
Description 31/12/2016 31/12/2015 change
Bank interest 17,672 18,650 (977)
Bank commission and expenses 3,906 4,785 (878)
Loan-related interest expense 2,524 2,415 109
Leasing companies interest expense 1,775 1,471 304
Bank discounting charges 831 1,914 (1,082)
Interest payable for other financing 2,760 2,125 634
TOTAL 29,469 31,359 (1,891)
The increase in the entry for bank interest and interest expenses on loans was due to the increase in interest
rates on current loans from credit institutions.
(32) Gains/ (losses) on exchange rate:
At 31 December 2016, the net figure for realised and unrealised differences on exchange rates was negative
for Euro 13.158 million and derives from the payment and receipt of payables and receivables in foreign
currency and from the appreciation of the US dollar against the Euro. The breakdown is given in the following
table:
Description 31/12/2016 31/12/2015 change
Realised gains on exchange rates 34,410 41,352 (6,942)
Realised losses on exchange rates (46,111) (42,219) (3,892)
Sub-total of realised gains/(losses) on exchange rates (11,701) (867) (10,834)
Unrealised gains on exchange rates 44,156 90,096 (45,939)
Unrealised losses on exchange rates (45,614) (102,972) 57,359
Sub-total of unrealised gains/(losses)on exchange rates (1,457) (12,877) 11,420
Gains/ (losses) on exchange rates (13,158) (13,744) 586
(33) Income taxes for the year:
Net taxes for the period were Euro 5.997 million. They are shown in the following table:
Description 31/12/2016 31/12/2015 change Current taxes : - IRAP 1,515 875 640
- Income taxes 15,669 4,443 11,225
Deferred taxes 1,853 28,010 (26,157)
Deferred tax assets (13,021) (49,637) 36,616
TOTAL 6,016 (16,309) 22,325
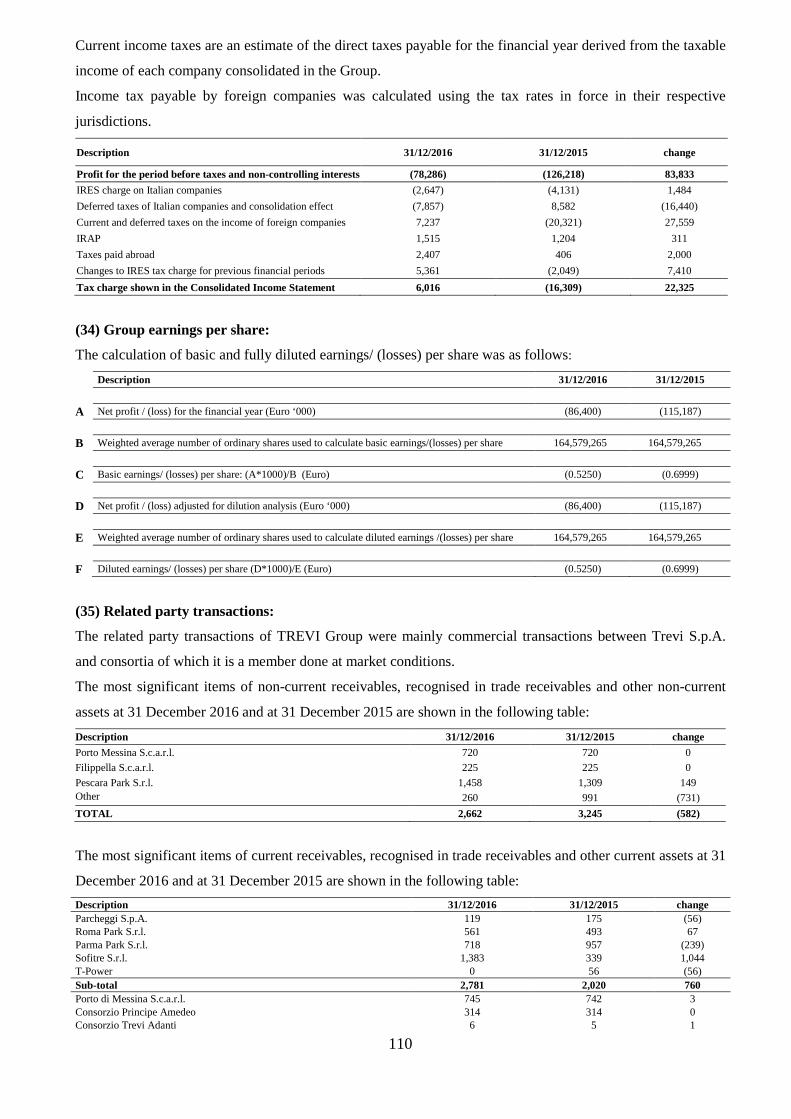
110
Current income taxes are an estimate of the direct taxes payable for the financial year derived from the taxable
income of each company consolidated in the Group.
Income tax payable by foreign companies was calculated using the tax rates in force in their respective
jurisdictions.
Description 31/12/2016 31/12/2015 change
Profit for the period before taxes and non-controlling interests (78,286) (126,218) 83,833
IRES charge on Italian companies (2,647) (4,131) 1,484
Deferred taxes of Italian companies and consolidation effect (7,857) 8,582 (16,440)
Current and deferred taxes on the income of foreign companies 7,237 (20,321) 27,559
IRAP 1,515 1,204 311
Taxes paid abroad 2,407 406 2,000
Changes to IRES tax charge for previous financial periods 5,361 (2,049) 7,410
Tax charge shown in the Consolidated Income Statement 6,016 (16,309) 22,325
(34) Group earnings per share:
The calculation of basic and fully diluted earnings/ (losses) per share was as follows:
Description 31/12/2016 31/12/2015 A Net profit / (loss) for the financial year (Euro ‘000) (86,400) (115,187)
B Weighted average number of ordinary shares used to calculate basic earnings/(losses) per share 164,579,265 164,579,265
C Basic earnings/ (losses) per share: (A*1000)/B (Euro) (0.5250) (0.6999)
D Net profit / (loss) adjusted for dilution analysis (Euro ‘000) (86,400) (115,187)
E Weighted average number of ordinary shares used to calculate diluted earnings /(losses) per share 164,579,265 164,579,265
F Diluted earnings/ (losses) per share (D*1000)/E (Euro) (0.5250) (0.6999)
(35) Related party transactions:
The related party transactions of TREVI Group were mainly commercial transactions between Trevi S.p.A.
and consortia of which it is a member done at market conditions.
The most significant items of non-current receivables, recognised in trade receivables and other non-current
assets at 31 December 2016 and at 31 December 2015 are shown in the following table:
Description 31/12/2016 31/12/2015 change
Porto Messina S.c.a.r.l. 720 720 0
Filippella S.c.a.r.l. 225 225 0
Pescara Park S.r.l. 1,458 1,309 149 Other 260 991 (731)
TOTAL 2,662 3,245 (582)
The most significant items of current receivables, recognised in trade receivables and other current assets at 31
December 2016 and at 31 December 2015 are shown in the following table:
Description 31/12/2016 31/12/2015 change Parcheggi S.p.A. 119 175 (56) Roma Park S.r.l. 561 493 67 Parma Park S.r.l. 718 957 (239) Sofitre S.r.l. 1,383 339 1,044 T-Power 0 56 (56) Sub-total 2,781 2,020 760 Porto di Messina S.c.a.r.l. 745 742 3 Consorzio Principe Amedeo 314 314 0 Consorzio Trevi Adanti 6 5 1
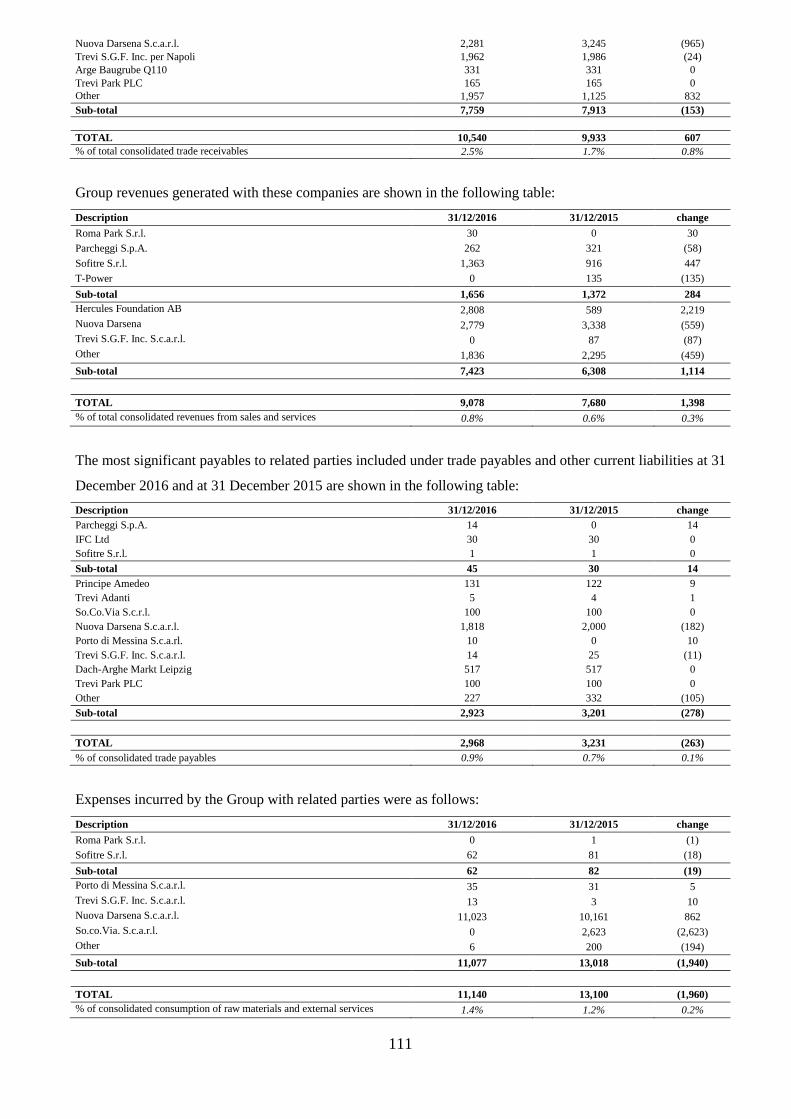
111
Nuova Darsena S.c.a.r.l. 2,281 3,245 (965) Trevi S.G.F. Inc. per Napoli 1,962 1,986 (24) Arge Baugrube Q110 331 331 0 Trevi Park PLC 165 165 0 Other 1,957 1,125 832 Sub-total 7,759 7,913 (153)
TOTAL 10,540 9,933 607 % of total consolidated trade receivables 2.5% 1.7% 0.8%
Group revenues generated with these companies are shown in the following table:
Description 31/12/2016 31/12/2015 change
Roma Park S.r.l. 30 0 30
Parcheggi S.p.A. 262 321 (58)
Sofitre S.r.l. 1,363 916 447
T-Power 0 135 (135)
Sub-total 1,656 1,372 284 Hercules Foundation AB 2,808 589 2,219 Nuova Darsena 2,779 3,338 (559) Trevi S.G.F. Inc. S.c.a.r.l. 0 87 (87) Other 1,836 2,295 (459)
Sub-total 7,423 6,308 1,114
TOTAL 9,078 7,680 1,398 % of total consolidated revenues from sales and services 0.8% 0.6% 0.3%
The most significant payables to related parties included under trade payables and other current liabilities at 31
December 2016 and at 31 December 2015 are shown in the following table:
Description 31/12/2016 31/12/2015 change Parcheggi S.p.A. 14 0 14 IFC Ltd 30 30 0 Sofitre S.r.l. 1 1 0
Sub-total 45 30 14 Principe Amedeo 131 122 9 Trevi Adanti 5 4 1 So.Co.Via S.c.r.l. 100 100 0 Nuova Darsena S.c.a.r.l. 1,818 2,000 (182) Porto di Messina S.c.a.rl. 10 0 10 Trevi S.G.F. Inc. S.c.a.r.l. 14 25 (11) Dach-Arghe Markt Leipzig 517 517 0 Trevi Park PLC 100 100 0 Other 227 332 (105)
Sub-total 2,923 3,201 (278)
TOTAL 2,968 3,231 (263) % of consolidated trade payables 0.9% 0.7% 0.1%
Expenses incurred by the Group with related parties were as follows:
Description 31/12/2016 31/12/2015 change
Roma Park S.r.l. 0 1 (1)
Sofitre S.r.l. 62 81 (18)
Sub-total 62 82 (19) Porto di Messina S.c.a.r.l. 35 31 5 Trevi S.G.F. Inc. S.c.a.r.l. 13 3 10 Nuova Darsena S.c.a.r.l. 11,023 10,161 862 So.co.Via. S.c.a.r.l. 0 2,623 (2,623) Other 6 200 (194)
Sub-total 11,077 13,018 (1,940)
TOTAL 11,140 13,100 (1,960) % of consolidated consumption of raw materials and external services 1.4% 1.2% 0.2%
112
In addition to the information already given on acquisitions made in the reporting period, as the tables above
show, TREVI Group did some small transactions with the companies headed by Sofitre S.r.l., a company
owned 100% by the Trevisani family. The 2016 transactions with the companies that are part of the Sofitre
group (which qualify for recognition because the shareholders controlling both it and TREVI Group are the
Trevisani family) were done at normal market conditions. They are summarised in the table above, which
shows how immaterial they are to the consolidated figures of the Group.
There were no economic transactions between TREVI Group and Trevi Holding SE, the company that controls
TREVI – Finanziaria Industriale S.p.A.
(36) Segment reporting
The Group has identified financial information by business division as the primary segment for disclosure of
further economic and financial information about the Group (segment reporting). This shows the organisation
of the business of the Group and the internal reporting structure since the risks and returns accruing to the
Group are affected by the sectors in which it operates.
The Management monitors the operating results of the business segments separately in order to take decisions
on the allocation of resources and to evaluate their performances. Segment performance is evaluated on
operating profit or loss, which, as shown in the tables below, is calculated differently from the operating profit
or loss shown in the Consolidated Financial Statements.
The Management monitors the revenues by geographical area as the secondary segment information; further
information is provided in the Notes to the Financial Statements.
Segment income statement and statement of financial position figures at 31 December 2016 are provided in
the following tables and further information on the performance of the two divisions is given in the Directors’
Report on Operations.
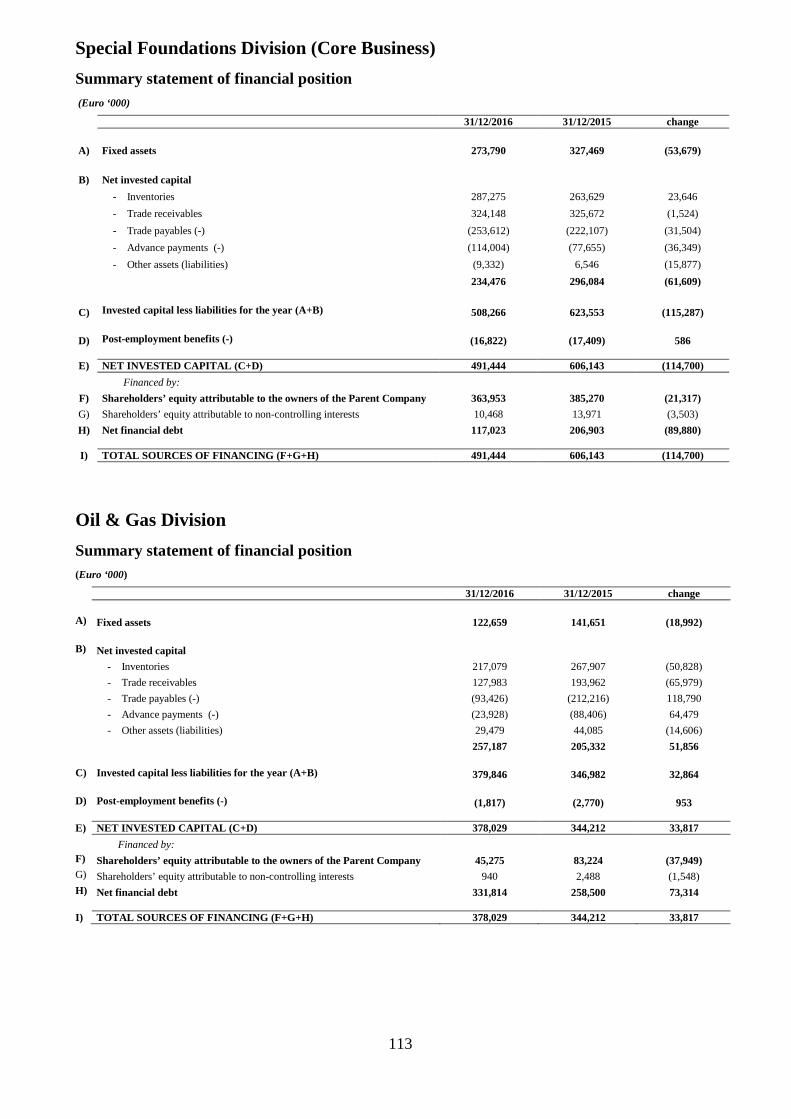
113
Special Foundations Division (Core Business)
Summary statement of financial position (Euro ‘000) 31/12/2016 31/12/2015 change
A) Fixed assets 273,790 327,469 (53,679)
B) Net invested capital
- Inventories 287,275 263,629 23,646
- Trade receivables 324,148 325,672 (1,524)
- Trade payables (-) (253,612) (222,107) (31,504)
- Advance payments (-) (114,004) (77,655) (36,349)
- Other assets (liabilities) (9,332) 6,546 (15,877)
234,476 296,084 (61,609)
C) Invested capital less liabilities for the year (A+B) 508,266 623,553 (115,287)
D) Post-employment benefits (-) (16,822) (17,409) 586
E) NET INVESTED CAPITAL (C+D) 491,444 606,143 (114,700)
Financed by:
F) Shareholders’ equity attributable to the owners of the Parent Company 363,953 385,270 (21,317)
G) Shareholders’ equity attributable to non-controlling interests 10,468 13,971 (3,503)
H) Net financial debt 117,023 206,903 (89,880)
I) TOTAL SOURCES OF FINANCING (F+G+H) 491,444 606,143 (114,700)
Oil & Gas Division
Summary statement of financial position (Euro ‘000)
31/12/2016 31/12/2015 change A) Fixed assets 122,659 141,651 (18,992) B) Net invested capital - Inventories 217,079 267,907 (50,828) - Trade receivables 127,983 193,962 (65,979) - Trade payables (-) (93,426) (212,216) 118,790 - Advance payments (-) (23,928) (88,406) 64,479 - Other assets (liabilities) 29,479 44,085 (14,606) 257,187 205,332 51,856 C) Invested capital less liabilities for the year (A+B) 379,846 346,982 32,864 D) Post-employment benefits (-) (1,817) (2,770) 953 E) NET INVESTED CAPITAL (C+D) 378,029 344,212 33,817 Financed by:
F) Shareholders’ equity attributable to the owners of the Parent Company 45,275 83,224 (37,949) G) Shareholders’ equity attributable to non-controlling interests 940 2,488 (1,548) H) Net financial debt 331,814 258,500 73,314 I) TOTAL SOURCES OF FINANCING (F+G+H) 378,029 344,212 33,817
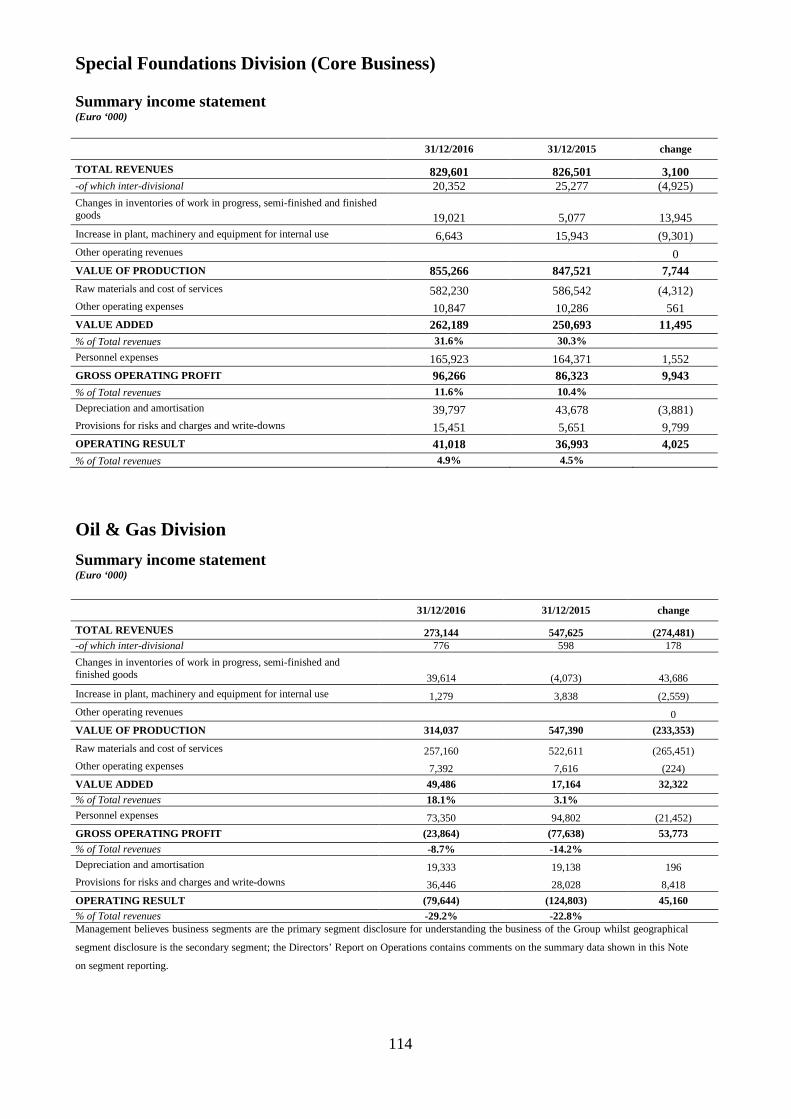
114
Special Foundations Division (Core Business) Summary income statement (Euro ‘000) 31/12/2016 31/12/2015 change
TOTAL REVENUES 829,601 826,501 3,100 -of which inter-divisional 20,352 25,277 (4,925)
Changes in inventories of work in progress, semi-finished and finished goods 19,021 5,077 13,945
Increase in plant, machinery and equipment for internal use 6,643 15,943 (9,301)
Other operating revenues 0
VALUE OF PRODUCTION 855,266 847,521 7,744
Raw materials and cost of services 582,230 586,542 (4,312)
Other operating expenses 10,847 10,286 561
VALUE ADDED 262,189 250,693 11,495 % of Total revenues 31.6% 30.3%
Personnel expenses 165,923 164,371 1,552
GROSS OPERATING PROFIT 96,266 86,323 9,943 % of Total revenues 11.6% 10.4%
Depreciation and amortisation 39,797 43,678 (3,881) Provisions for risks and charges and write-downs 15,451 5,651 9,799
OPERATING RESULT 41,018 36,993 4,025 % of Total revenues 4.9% 4.5%
Oil & Gas Division
Summary income statement (Euro ‘000)
31/12/2016 31/12/2015 change
TOTAL REVENUES 273,144 547,625 (274,481)
-of which inter-divisional 776 598 178
Changes in inventories of work in progress, semi-finished and finished goods 39,614 (4,073) 43,686
Increase in plant, machinery and equipment for internal use 1,279 3,838 (2,559)
Other operating revenues 0
VALUE OF PRODUCTION 314,037 547,390 (233,353)
Raw materials and cost of services 257,160 522,611 (265,451)
Other operating expenses 7,392 7,616 (224)
VALUE ADDED 49,486 17,164 32,322
% of Total revenues 18.1% 3.1%
Personnel expenses 73,350 94,802 (21,452)
GROSS OPERATING PROFIT (23,864) (77,638) 53,773
% of Total revenues -8.7% -14.2%
Depreciation and amortisation 19,333 19,138 196
Provisions for risks and charges and write-downs 36,446 28,028 8,418
OPERATING RESULT (79,644) (124,803) 45,160
% of Total revenues -29.2% -22.8% Management believes business segments are the primary segment disclosure for understanding the business of the Group whilst geographical
segment disclosure is the secondary segment; the Directors’ Report on Operations contains comments on the summary data shown in this Note
on segment reporting.
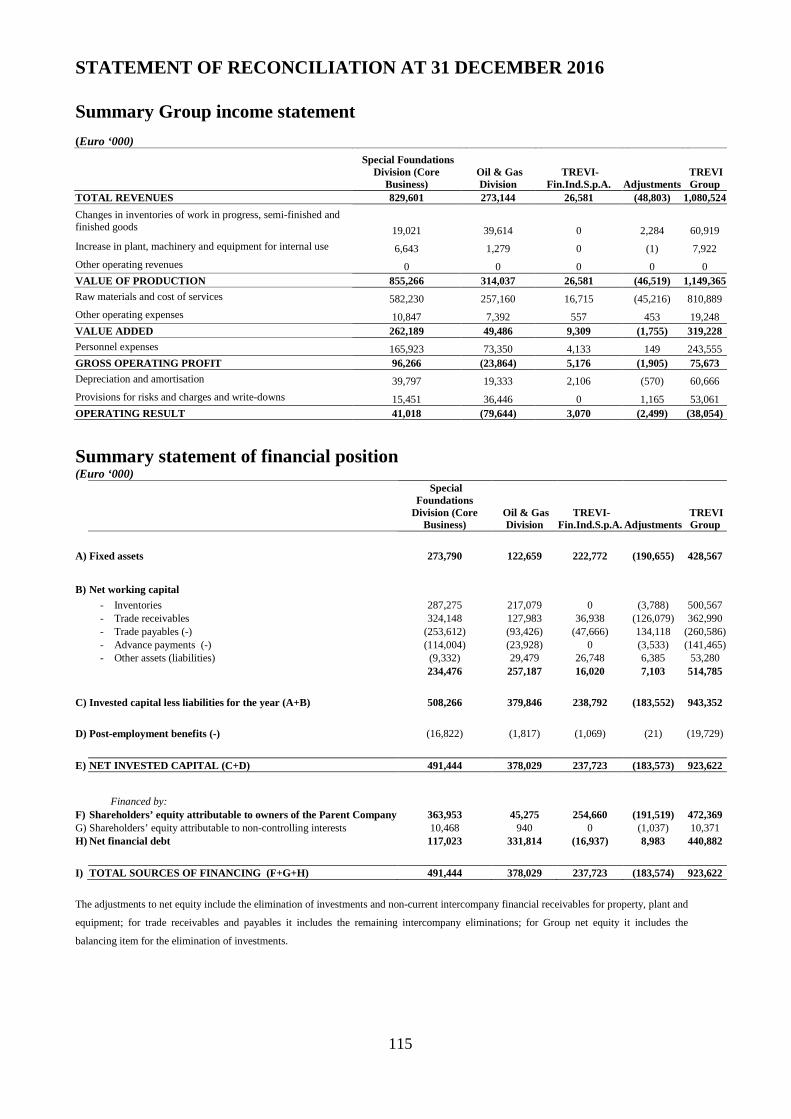
115
STATEMENT OF RECONCILIATION AT 31 DECEMBER 2016
Summary Group income statement
(Euro ‘000)
Special Foundations Division (Core
Business) Oil & Gas Division
TREVI-Fin.Ind.S.p.A.
Adjustments
TREVI Group
TOTAL REVENUES 829,601 273,144 26,581 (48,803) 1,080,524
Changes in inventories of work in progress, semi-finished and finished goods 19,021 39,614 0 2,284 60,919
Increase in plant, machinery and equipment for internal use 6,643 1,279 0 (1) 7,922
Other operating revenues 0 0 0 0 0 VALUE OF PRODUCTION 855,266 314,037 26,581 (46,519) 1,149,365
Raw materials and cost of services 582,230 257,160 16,715 (45,216) 810,889
Other operating expenses 10,847 7,392 557 453 19,248 VALUE ADDED 262,189 49,486 9,309 (1,755) 319,228
Personnel expenses 165,923 73,350 4,133 149 243,555 GROSS OPERATING PROFIT 96,266 (23,864) 5,176 (1,905) 75,673
Depreciation and amortisation 39,797 19,333 2,106 (570) 60,666
Provisions for risks and charges and write-downs 15,451 36,446 0 1,165 53,061 OPERATING RESULT 41,018 (79,644) 3,070 (2,499) (38,054)
Summary statement of financial position (Euro ‘000)
Special Foundations
Division (Core Business)
Oil & Gas Division
TREVI-Fin.Ind.S.p.A.
Adjustments
TREVI Group
A) Fixed assets 273,790 122,659 222,772 (190,655) 428,567
B) Net working capital - Inventories 287,275 217,079 0 (3,788) 500,567 - Trade receivables 324,148 127,983 36,938 (126,079) 362,990 - Trade payables (-) (253,612) (93,426) (47,666) 134,118 (260,586) - Advance payments (-) (114,004) (23,928) 0 (3,533) (141,465) - Other assets (liabilities) (9,332) 29,479 26,748 6,385 53,280 234,476 257,187 16,020 7,103 514,785
C) Invested capital less liabilities for the year (A+B) 508,266 379,846 238,792 (183,552) 943,352 D) Post-employment benefits (-) (16,822) (1,817) (1,069) (21) (19,729)
E) NET INVESTED CAPITAL (C+D) 491,444 378,029 237,723 (183,573) 923,622
Financed by: F) Shareholders’ equity attributable to owners of the Parent Company 363,953 45,275 254,660 (191,519) 472,369 G) Shareholders’ equity attributable to non-controlling interests 10,468 940 0 (1,037) 10,371 H) Net financial debt 117,023 331,814 (16,937) 8,983 440,882
I) TOTAL SOURCES OF FINANCING (F+G+H) 491,444 378,029 237,723 (183,574) 923,622
The adjustments to net equity include the elimination of investments and non-current intercompany financial receivables for property, plant and
equipment; for trade receivables and payables it includes the remaining intercompany eliminations; for Group net equity it includes the
balancing item for the elimination of investments.
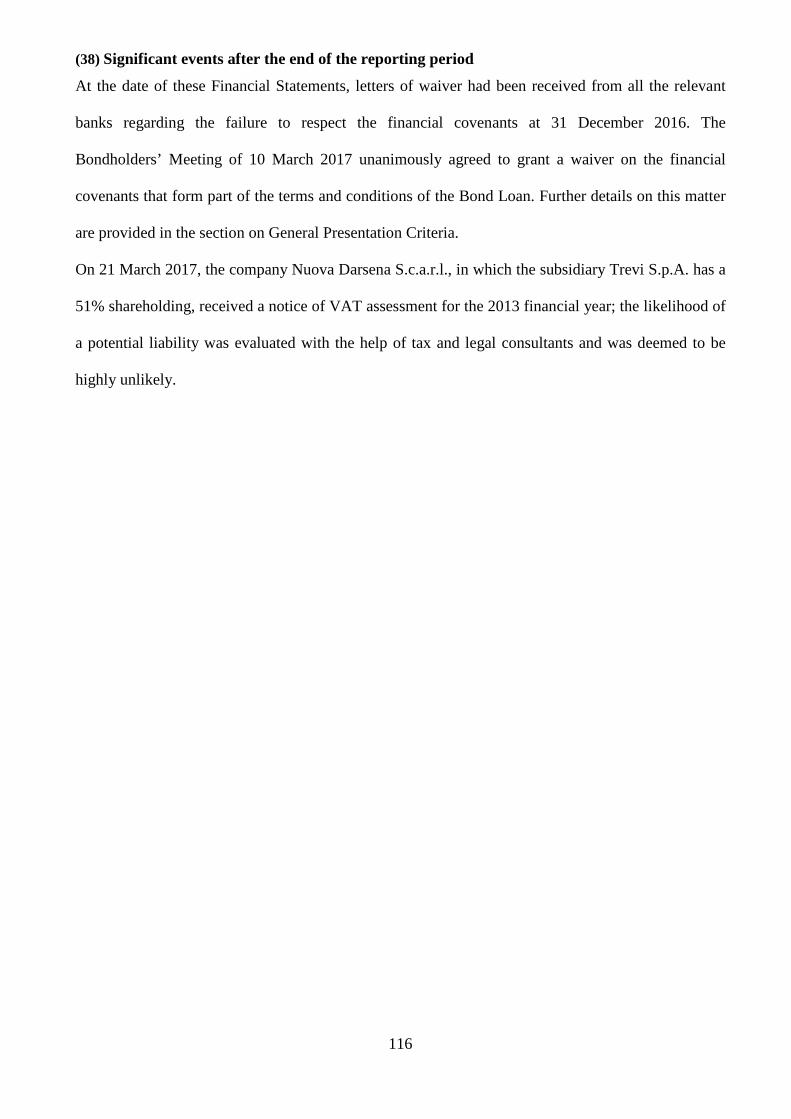
116
(38) Significant events after the end of the reporting period
At the date of these Financial Statements, letters of waiver had been received from all the relevant
banks regarding the failure to respect the financial covenants at 31 December 2016. The
Bondholders’ Meeting of 10 March 2017 unanimously agreed to grant a waiver on the financial
covenants that form part of the terms and conditions of the Bond Loan. Further details on this matter
are provided in the section on General Presentation Criteria.
On 21 March 2017, the company Nuova Darsena S.c.a.r.l., in which the subsidiary Trevi S.p.A. has a
51% shareholding, received a notice of VAT assessment for the 2013 financial year; the likelihood of
a potential liability was evaluated with the help of tax and legal consultants and was deemed to be
highly unlikely.
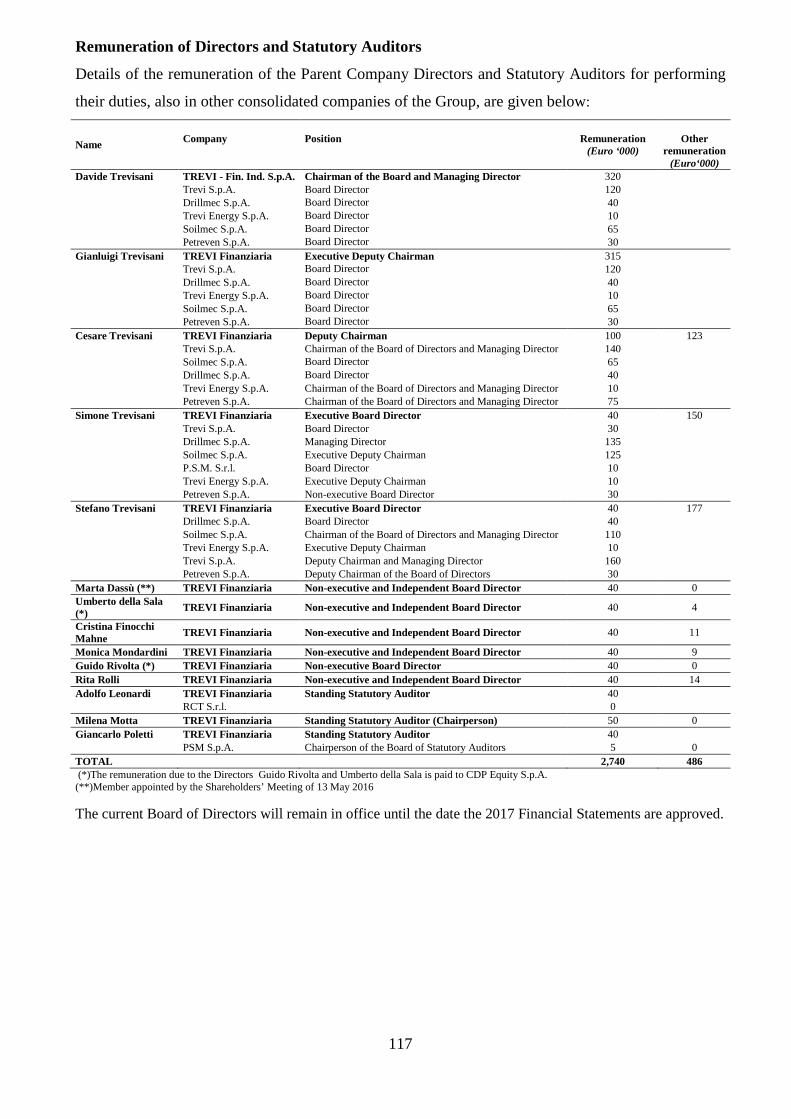
117
Remuneration of Directors and Statutory Auditors
Details of the remuneration of the Parent Company Directors and Statutory Auditors for performing
their duties, also in other consolidated companies of the Group, are given below:
Name
Company
Position
Remuneration
(Euro ‘000)
Other
remuneration (Euro‘000)
Davide Trevisani TREVI - Fin. Ind. S.p.A. Chairman of the Board and Managing Director 320
Trevi S.p.A. Board Director 120
Drillmec S.p.A. Board Director 40
Trevi Energy S.p.A. Board Director 10
Soilmec S.p.A. Board Director 65
Petreven S.p.A. Board Director 30
Gianluigi Trevisani TREVI Finanziaria Executive Deputy Chairman 315
Trevi S.p.A. Board Director 120
Drillmec S.p.A. Board Director 40
Trevi Energy S.p.A. Board Director 10
Soilmec S.p.A. Board Director 65
Petreven S.p.A. Board Director 30
Cesare Trevisani TREVI Finanziaria Deputy Chairman 100 123
Trevi S.p.A. Chairman of the Board of Directors and Managing Director 140
Soilmec S.p.A. Board Director 65
Drillmec S.p.A. Board Director 40
Trevi Energy S.p.A. Chairman of the Board of Directors and Managing Director 10
Petreven S.p.A. Chairman of the Board of Directors and Managing Director 75
Simone Trevisani TREVI Finanziaria Executive Board Director 40 150
Trevi S.p.A. Board Director 30
Drillmec S.p.A. Managing Director 135
Soilmec S.p.A. Executive Deputy Chairman 125
P.S.M. S.r.l. Board Director 10
Trevi Energy S.p.A. Executive Deputy Chairman 10
Petreven S.p.A. Non-executive Board Director 30
Stefano Trevisani TREVI Finanziaria Executive Board Director 40 177 Drillmec S.p.A. Board Director 40
Soilmec S.p.A. Chairman of the Board of Directors and Managing Director 110
Trevi Energy S.p.A. Executive Deputy Chairman 10
Trevi S.p.A. Deputy Chairman and Managing Director 160
Petreven S.p.A. Deputy Chairman of the Board of Directors 30
Marta Dassù (**) TREVI Finanziaria Non-executive and Independent Board Director 40 0 Umberto della Sala (*) TREVI Finanziaria Non-executive and Independent Board Director 40 4
Cristina Finocchi Mahne
TREVI Finanziaria Non-executive and Independent Board Director 40 11
Monica Mondardini TREVI Finanziaria Non-executive and Independent Board Director 40 9 Guido Rivolta (*) TREVI Finanziaria Non-executive Board Director 40 0 Rita Rolli TREVI Finanziaria Non-executive and Independent Board Director 40 14 Adolfo Leonardi TREVI Finanziaria Standing Statutor y Auditor 40
RCT S.r.l.
0
Milena Motta TREVI Finanziaria Standing Statutory Auditor (Chairperson) 50 0 Giancarlo Poletti TREVI Finanziaria Standing Statutory Auditor 40
PSM S.p.A. Chairperson of the Board of Statutory Auditors 5 0 TOTAL 2,740 486 (*)The remuneration due to the Directors Guido Rivolta and Umberto della Sala is paid to CDP Equity S.p.A. (**)Member appointed by the Shareholders’ Meeting of 13 May 2016
The current Board of Directors will remain in office until the date the 2017 Financial Statements are approved.
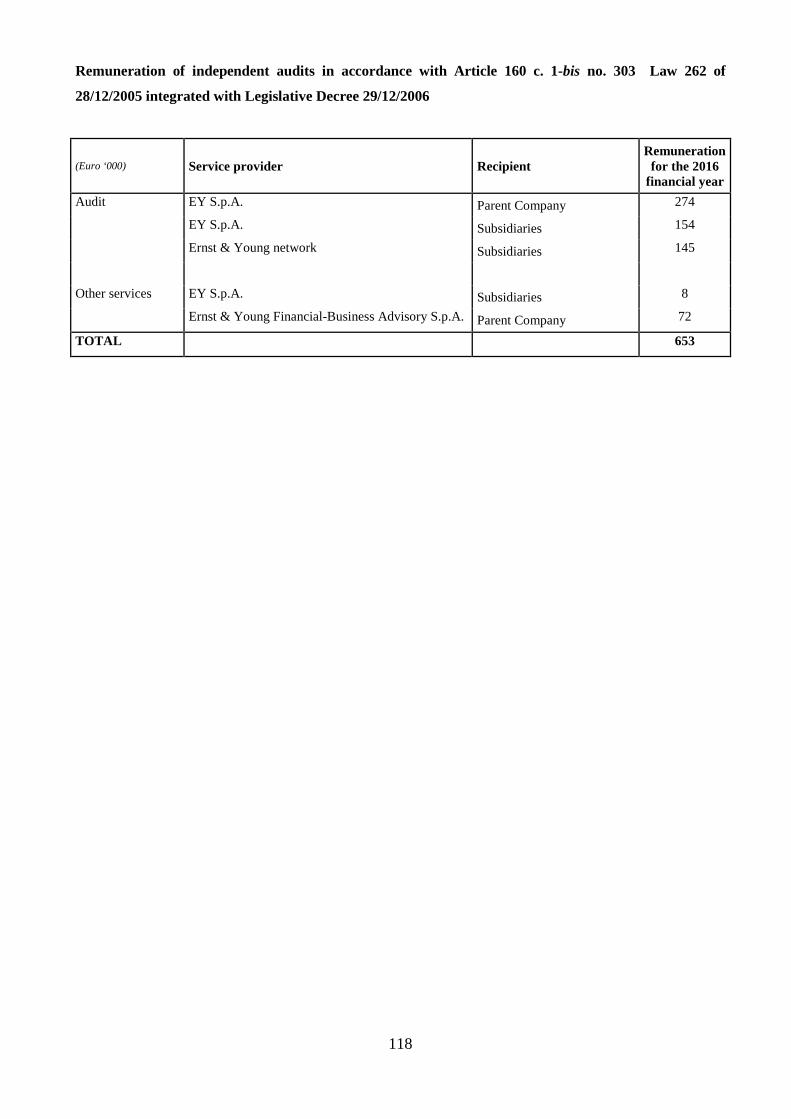
118
Remuneration of independent audits in accordance with Article 160 c. 1-bis no. 303 Law 262 of
28/12/2005 integrated with Legislative Decree 29/12/2006
(Euro ‘000) Service provider Recipient Remuneration for the 2016
financial year
Audit EY S.p.A. Parent Company 274
EY S.p.A. Subsidiaries 154
Ernst & Young network Subsidiaries 145
Other services EY S.p.A. Subsidiaries 8
Ernst & Young Financial-Business Advisory S.p.A. Parent Company 72
TOTAL 653
119
APPENDICES The following appendices supplement the information contained in the Explanatory Notes to the Financial
Statements of which they form an integral part.
1 Companies consolidated in the Financial Statements at 31 December 2016 on a line-by-line basis.
1a Companies consolidated in the Financial Statements at 31 December 2016 using the equity method.
1b Companies and consortia consolidated in the Financial Statements at 31 December 2016 and carried at
cost.
2 Chart of the Group structure.
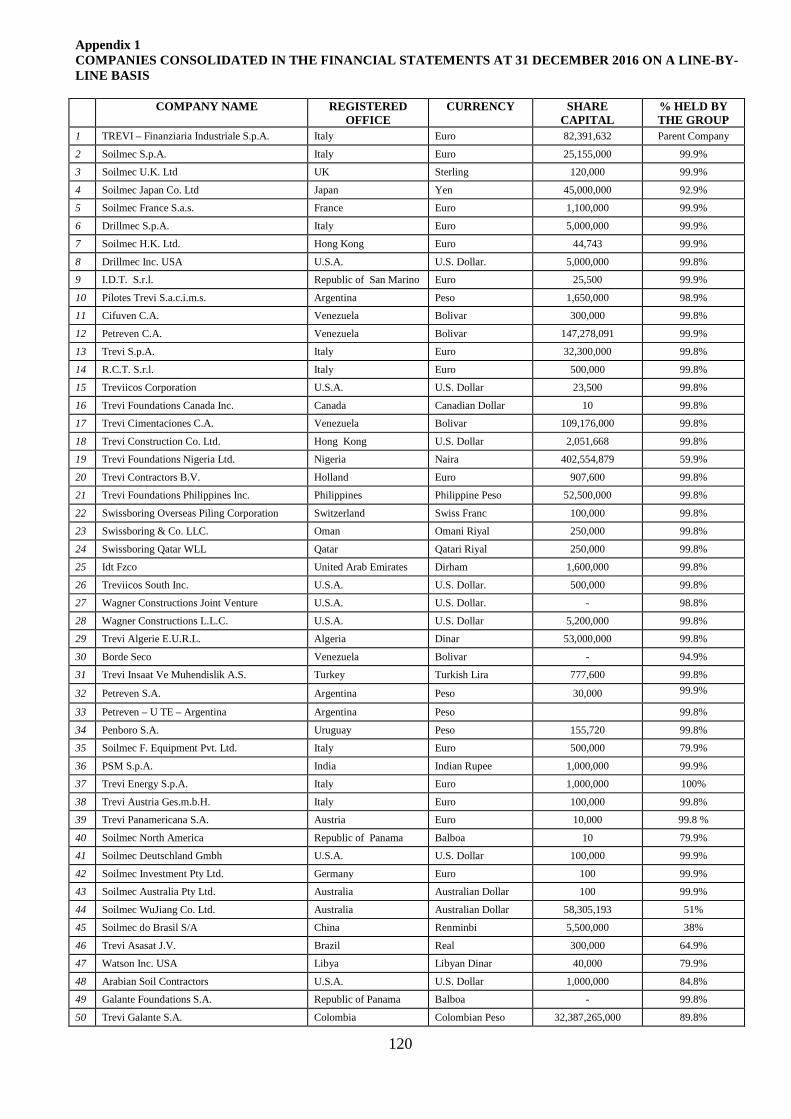
120
Appendix 1 COMPANIES CONSOLIDATED IN THE FINANCIAL STATEMENTS AT 31 DECEMBER 2016 ON A LINE-BY-LINE BASIS COMPANY NAME
REGISTERED
OFFICE CURRENCY SHARE
CAPITAL % HELD BY THE GROUP
1 TREVI – Finanziaria Industriale S.p.A. Italy Euro 82,391,632 Parent Company
2 Soilmec S.p.A. Italy Euro 25,155,000 99.9%
3 Soilmec U.K. Ltd UK Sterling 120,000 99.9%
4 Soilmec Japan Co. Ltd Japan Yen 45,000,000 92.9%
5 Soilmec France S.a.s. France Euro 1,100,000 99.9%
6 Drillmec S.p.A. Italy Euro 5,000,000 99.9%
7 Soilmec H.K. Ltd. Hong Kong Euro 44,743 99.9%
8 Drillmec Inc. USA U.S.A. U.S. Dollar. 5,000,000 99.8%
9 I.D.T. S.r.l. Republic of San Marino Euro 25,500 99.9%
10 Pilotes Trevi S.a.c.i.m.s. Argentina Peso 1,650,000 98.9%
11 Cifuven C.A. Venezuela Bolivar 300,000 99.8%
12 Petreven C.A. Venezuela Bolivar 147,278,091 99.9%
13 Trevi S.p.A. Italy Euro 32,300,000 99.8%
14 R.C.T. S.r.l. Italy Euro 500,000 99.8%
15 Treviicos Corporation U.S.A. U.S. Dollar 23,500 99.8%
16 Trevi Foundations Canada Inc. Canada Canadian Dollar 10 99.8%
17 Trevi Cimentaciones C.A. Venezuela Bolivar 109,176,000 99.8%
18 Trevi Construction Co. Ltd. Hong Kong U.S. Dollar 2,051,668 99.8%
19 Trevi Foundations Nigeria Ltd. Nigeria Naira 402,554,879 59.9%
20 Trevi Contractors B.V. Holland Euro 907,600 99.8%
21 Trevi Foundations Philippines Inc. Philippines Philippine Peso 52,500,000 99.8%
22 Swissboring Overseas Piling Corporation Switzerland Swiss Franc 100,000 99.8%
23 Swissboring & Co. LLC. Oman Omani Riyal 250,000 99.8%
24 Swissboring Qatar WLL Qatar Qatari Riyal 250,000 99.8%
25 Idt Fzco United Arab Emirates Dirham 1,600,000 99.8%
26 Treviicos South Inc. U.S.A. U.S. Dollar. 500,000 99.8%
27 Wagner Constructions Joint Venture U.S.A. U.S. Dollar. - 98.8%
28 Wagner Constructions L.L.C. U.S.A. U.S. Dollar 5,200,000 99.8%
29 Trevi Algerie E.U.R.L. Algeria Dinar 53,000,000 99.8%
30 Borde Seco Venezuela Bolivar - 94.9%
31 Trevi Insaat Ve Muhendislik A.S. Turkey Turkish Lira 777,600 99.8%
32 Petreven S.A. Argentina Peso 30,000 99.9%
33 Petreven – U TE – Argentina Argentina Peso 99.8%
34 Penboro S.A. Uruguay Peso 155,720 99.8%
35 Soilmec F. Equipment Pvt. Ltd. Italy Euro 500,000 79.9%
36 PSM S.p.A. India Indian Rupee 1,000,000 99.9%
37 Trevi Energy S.p.A. Italy Euro 1,000,000 100%
38 Trevi Austria Ges.m.b.H. Italy Euro 100,000 99.8%
39 Trevi Panamericana S.A. Austria Euro 10,000 99.8 %
40 Soilmec North America Republic of Panama Balboa 10 79.9%
41 Soilmec Deutschland Gmbh U.S.A. U.S. Dollar 100,000 99.9%
42 Soilmec Investment Pty Ltd. Germany Euro 100 99.9%
43 Soilmec Australia Pty Ltd. Australia Australian Dollar 100 99.9%
44 Soilmec WuJiang Co. Ltd. Australia Australian Dollar 58,305,193 51%
45 Soilmec do Brasil S/A China Renminbi 5,500,000 38%
46 Trevi Asasat J.V. Brazil Real 300,000 64.9%
47 Watson Inc. USA Libya Libyan Dinar 40,000 79.9%
48 Arabian Soil Contractors U.S.A. U.S. Dollar 1,000,000 84.8%
49 Galante Foundations S.A. Republic of Panama Balboa - 99.8%
50 Trevi Galante S.A. Colombia Colombian Peso 32,387,265,000 89.8%
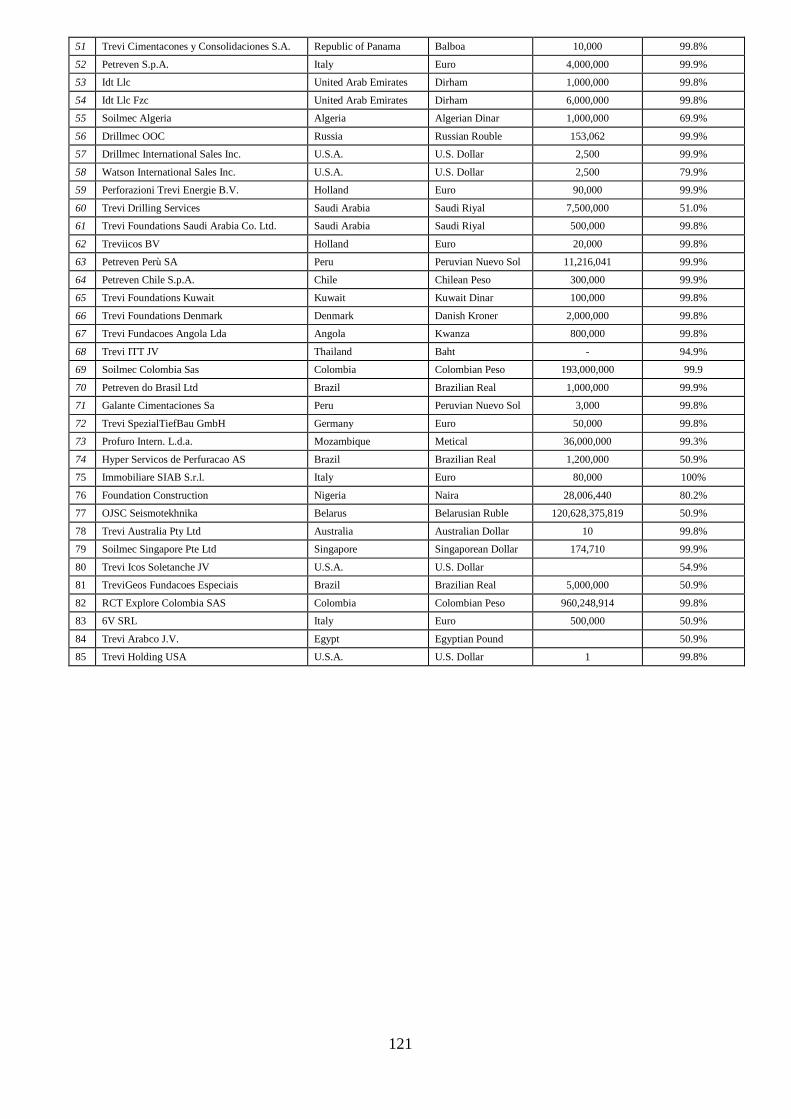
121
51 Trevi Cimentacones y Consolidaciones S.A. Republic of Panama Balboa 10,000 99.8%
52 Petreven S.p.A. Italy Euro 4,000,000 99.9%
53 Idt Llc United Arab Emirates Dirham 1,000,000 99.8%
54 Idt Llc Fzc United Arab Emirates Dirham 6,000,000 99.8%
55 Soilmec Algeria Algeria Algerian Dinar 1,000,000 69.9%
56 Drillmec OOC Russia Russian Rouble 153,062 99.9%
57 Drillmec International Sales Inc. U.S.A. U.S. Dollar 2,500 99.9%
58 Watson International Sales Inc. U.S.A. U.S. Dollar 2,500 79.9%
59 Perforazioni Trevi Energie B.V. Holland Euro 90,000 99.9%
60 Trevi Drilling Services Saudi Arabia Saudi Riyal 7,500,000 51.0%
61 Trevi Foundations Saudi Arabia Co. Ltd. Saudi Arabia Saudi Riyal 500,000 99.8%
62 Treviicos BV Holland Euro 20,000 99.8%
63 Petreven Perù SA Peru Peruvian Nuevo Sol 11,216,041 99.9%
64 Petreven Chile S.p.A. Chile Chilean Peso 300,000 99.9%
65 Trevi Foundations Kuwait Kuwait Kuwait Dinar 100,000 99.8%
66 Trevi Foundations Denmark Denmark Danish Kroner 2,000,000 99.8%
67 Trevi Fundacoes Angola Lda Angola Kwanza 800,000 99.8%
68 Trevi ITT JV Thailand Baht - 94.9%
69 Soilmec Colombia Sas Colombia Colombian Peso 193,000,000 99.9
70 Petreven do Brasil Ltd Brazil Brazilian Real 1,000,000 99.9%
71 Galante Cimentaciones Sa Peru Peruvian Nuevo Sol 3,000 99.8%
72 Trevi SpezialTiefBau GmbH Germany Euro 50,000 99.8%
73 Profuro Intern. L.d.a. Mozambique Metical 36,000,000 99.3%
74 Hyper Servicos de Perfuracao AS Brazil Brazilian Real 1,200,000 50.9%
75 Immobiliare SIAB S.r.l. Italy Euro 80,000 100%
76 Foundation Construction Nigeria Naira 28,006,440 80.2%
77 OJSC Seismotekhnika Belarus Belarusian Ruble 120,628,375,819 50.9%
78 Trevi Australia Pty Ltd Australia Australian Dollar 10 99.8%
79 Soilmec Singapore Pte Ltd Singapore Singaporean Dollar 174,710 99.9%
80 Trevi Icos Soletanche JV U.S.A. U.S. Dollar 54.9%
81 TreviGeos Fundacoes Especiais Brazil Brazilian Real 5,000,000 50.9%
82 RCT Explore Colombia SAS Colombia Colombian Peso 960,248,914 99.8%
83 6V SRL Italy Euro 500,000 50.9%
84 Trevi Arabco J.V. Egypt Egyptian Pound 50.9%
85 Trevi Holding USA U.S.A. U.S. Dollar 1 99.8%
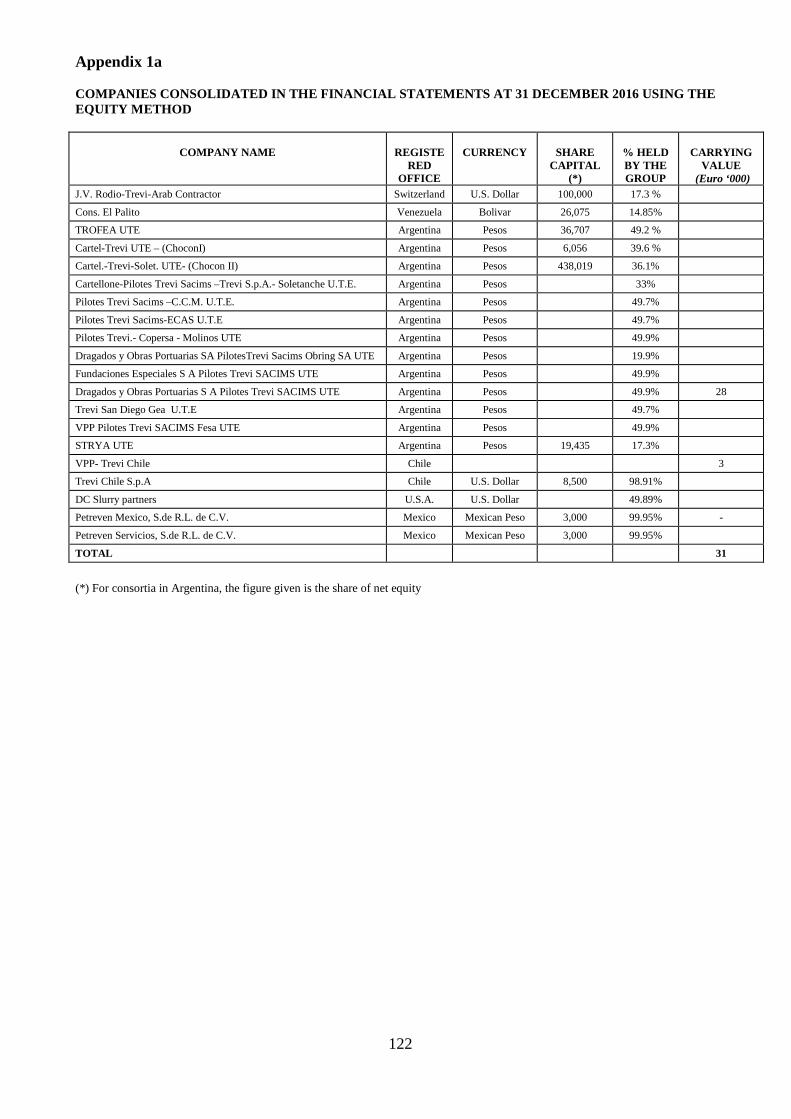
122
Appendix 1a COMPANIES CONSOLIDATED IN THE FINANCIAL STATEMENTS AT 31 DECEMBER 2016 USING THE EQUITY METHOD
COMPANY NAME
REGISTE
RED OFFICE
CURRENCY
SHARE
CAPITAL (*)
% HELD BY THE GROUP
CARRYING
VALUE (Euro ‘000)
J.V. Rodio-Trevi-Arab Contractor Switzerland U.S. Dollar 100,000 17.3 %
Cons. El Palito Venezuela Bolivar 26,075 14.85%
TROFEA UTE Argentina Pesos 36,707 49.2 %
Cartel-Trevi UTE – (ChoconI) Argentina Pesos 6,056 39.6 %
Cartel.-Trevi-Solet. UTE- (Chocon II) Argentina Pesos 438,019 36.1%
Cartellone-Pilotes Trevi Sacims –Trevi S.p.A.- Soletanche U.T.E. Argentina Pesos 33%
Pilotes Trevi Sacims –C.C.M. U.T.E. Argentina Pesos 49.7%
Pilotes Trevi Sacims-ECAS U.T.E Argentina Pesos 49.7%
Pilotes Trevi.- Copersa - Molinos UTE Argentina Pesos 49.9%
Dragados y Obras Portuarias SA PilotesTrevi Sacims Obring SA UTE Argentina Pesos 19.9%
Fundaciones Especiales S A Pilotes Trevi SACIMS UTE Argentina Pesos 49.9%
Dragados y Obras Portuarias S A Pilotes Trevi SACIMS UTE Argentina Pesos 49.9% 28
Trevi San Diego Gea U.T.E Argentina Pesos 49.7%
VPP Pilotes Trevi SACIMS Fesa UTE Argentina Pesos 49.9%
STRYA UTE Argentina Pesos 19,435 17.3%
VPP- Trevi Chile Chile 3
Trevi Chile S.p.A Chile U.S. Dollar 8,500 98.91%
DC Slurry partners U.S.A. U.S. Dollar 49.89%
Petreven Mexico, S.de R.L. de C.V. Mexico Mexican Peso 3,000 99.95% -
Petreven Servicios, S.de R.L. de C.V. Mexico Mexican Peso 3,000 99.95%
TOTAL 31
(*) For consortia in Argentina, the figure given is the share of net equity
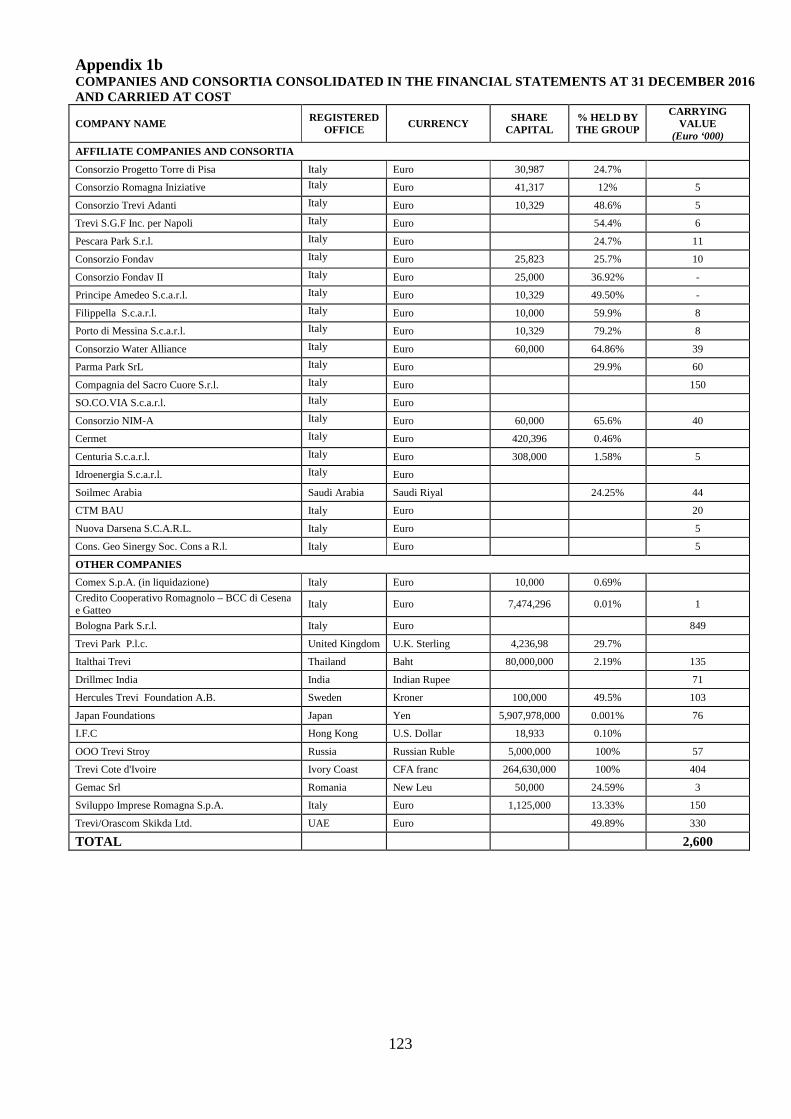
123
Appendix 1b COMPANIES AND CONSORTIA CONSOLIDATED IN THE FINANCI AL STATEMENTS AT 31 DECEMBER 2016 AND CARRIED AT COST
COMPANY NAME REGISTERED
OFFICE CURRENCY SHARE
CAPITAL % HELD BY THE GROUP
CARRYING VALUE
(Euro ‘000)
AFFILIATE COMPANIES AND CONSORTIA
Consorzio Progetto Torre di Pisa Italy Euro 30,987 24.7%
Consorzio Romagna Iniziative Italy Euro 41,317 12% 5
Consorzio Trevi Adanti Italy Euro 10,329 48.6% 5
Trevi S.G.F Inc. per Napoli Italy Euro 54.4% 6
Pescara Park S.r.l. Italy Euro 24.7% 11
Consorzio Fondav Italy Euro 25,823 25.7% 10
Consorzio Fondav II Italy Euro 25,000 36.92% -
Principe Amedeo S.c.a.r.l. Italy Euro 10,329 49.50% -
Filippella S.c.a.r.l. Italy Euro 10,000 59.9% 8
Porto di Messina S.c.a.r.l. Italy Euro 10,329 79.2% 8
Consorzio Water Alliance Italy Euro 60,000 64.86% 39
Parma Park SrL Italy Euro 29.9% 60
Compagnia del Sacro Cuore S.r.l. Italy Euro 150
SO.CO.VIA S.c.a.r.l. Italy Euro
Consorzio NIM-A Italy Euro 60,000 65.6% 40
Cermet Italy Euro 420,396 0.46%
Centuria S.c.a.r.l. Italy Euro 308,000 1.58% 5
Idroenergia S.c.a.r.l. Italy Euro
Soilmec Arabia Saudi Arabia Saudi Riyal 24.25% 44
CTM BAU Italy Euro 20
Nuova Darsena S.C.A.R.L. Italy Euro 5
Cons. Geo Sinergy Soc. Cons a R.l. Italy Euro 5
OTHER COMPANIES
Comex S.p.A. (in liquidazione) Italy Euro 10,000 0.69%
Credito Cooperativo Romagnolo – BCC di Cesena e Gatteo
Italy Euro 7,474,296 0.01% 1
Bologna Park S.r.l. Italy Euro 849
Trevi Park P.l.c. United Kingdom U.K. Sterling 4,236,98 29.7%
Italthai Trevi Thailand Baht 80,000,000 2.19% 135
Drillmec India India Indian Rupee 71
Hercules Trevi Foundation A.B. Sweden Kroner 100,000 49.5% 103
Japan Foundations Japan Yen 5,907,978,000 0.001% 76
I.F.C Hong Kong U.S. Dollar 18,933 0.10%
OOO Trevi Stroy Russia Russian Ruble 5,000,000 100% 57
Trevi Cote d'Ivoire Ivory Coast CFA franc 264,630,000 100% 404
Gemac Srl Romania New Leu 50,000 24.59% 3
Sviluppo Imprese Romagna S.p.A. Italy Euro 1,125,000 13.33% 150
Trevi/Orascom Skikda Ltd. UAE Euro 49.89% 330
TOTAL 2,600
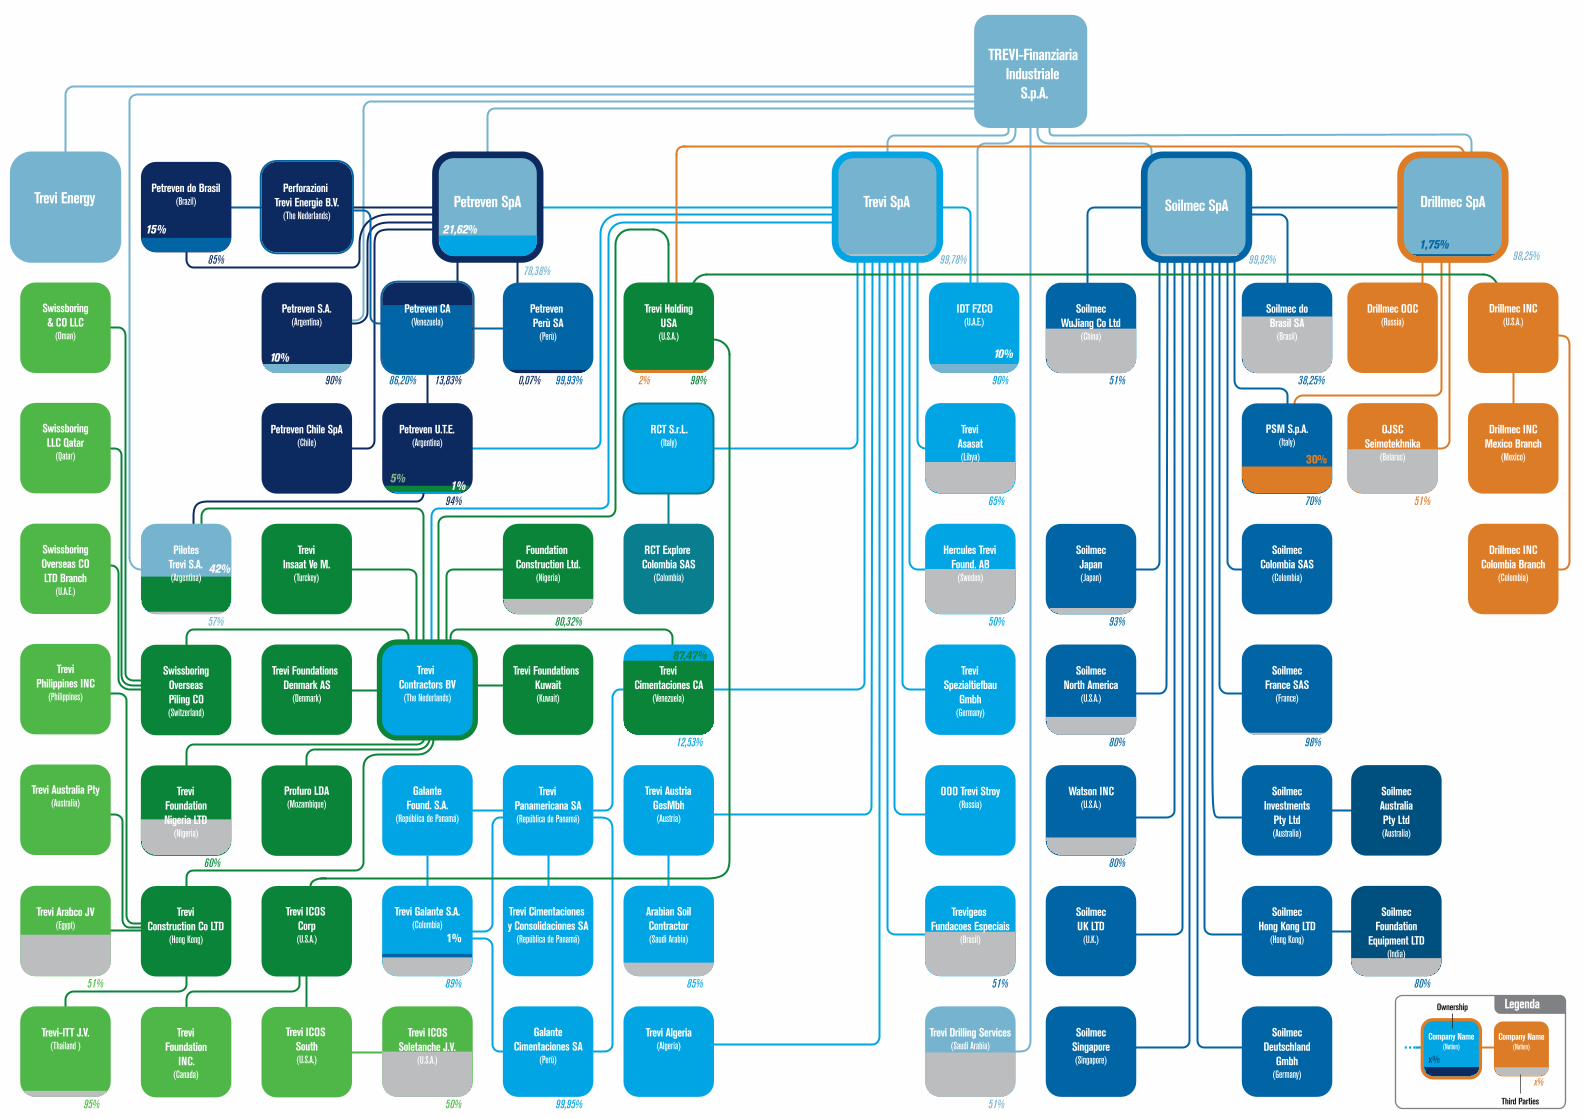
Company Name(Nation)
Ownership
Third Parties
Company Name(Nation)
x%
x%
Trevi SpA Drillmec SpATrevi Energy Soilmec SpAPetreven SpA
TREVI-Finanziaria Industriale
S.p.A.
Soilmec doBrasil SA
(Brasil)
PilotesTrevi S.A.(Argentina)
Petreven U.T.E.(Argentina)
Petreven CA(Venezuela)
Petreven S.A.(Argentina)
Perforazioni Trevi Energie B.V.
(The Nederlands)
Petreven do Brasil(Brazil)
Petreven Chile SpA(Chile)
Petreven Perù SA
(Perù)
SoilmecWuJiang Co Ltd
(China)
PSM S.p.A.(Italy)
Drillmec INC(U.S.A.)
Drillmec INCMexico Branch
(Mexico)
Drillmec INCColombia Branch
(Colombia)
Drillmec OOC(Russia)
OJSCSeimotekhnika
(Belarus)
IDT FZCO(U.A.E.)
SoilmecHong Kong LTD
(Hong Kong)
SoilmecFoundation
Equipment LTD(India)
SoilmecInvestments
Pty Ltd(Australia)
SoilmecAustraliaPty Ltd(Australia)
SoilmecJapan(Japan)
SoilmecUK LTD
(U.K.)
SoilmecDeutschland
Gmbh(Germany)
SoilmecSingapore(Singapore)
SoilmecNorth America
(U.S.A.)
SoilmecFrance SAS
(France)
Watson INC(U.S.A.)
TreviSpezialtiefbau
Gmbh(Germany)
OOO Trevi Stroy(Russia)
Trevigeos Fundacoes Especiais
(Brasil)
RCT Explore Colombia SAS
(Colombia)
Trevi Algeria(Algeria)
Trevi Contractors BV
(The Nederlands)
RCT S.r.L.(Italy)
TreviCimentaciones CA
(Venezuela)
Trevi Cimentaciones y Consolidaciones SA
(República de Panamá)
GalanteCimentaciones SA
(Perù)
TreviInsaat Ve M.
(Turckey)
Foundation Construction Ltd.
(Nigeria)
Trevi Foundations Denmark AS
(Denmark)
SwissboringOverseasPiling CO(Switzerland)
Swissboring& CO LLC
(Oman)
SwissboringLLC Qatar
(Qatar)
Hercules TreviFound. AB
(Sweden)
TreviAsasat(Libya)
Trevi AustriaGesMbh(Austria)
Arabian SoilContractor(Saudi Arabia)
Trevi Drilling Services(Saudi Arabia)
TreviPanamericana SA(República de Panamá)
Trevi Foundations Kuwait(Kuwait)
GalanteFound. S.A.
(República de Panamá)
Trevi Galante S.A.(Colombia)
TreviConstruction Co LTD
(Hong Kong)
TreviPhilippines INC
(Philippines)
Trevi Australia Pty(Australia)
SwissboringOverseas COLTD Branch
(U.A.E.)
Trevi ICOS Corp(U.S.A.)
TreviFoundation
INC.(Canada)
Trevi ICOS South(U.S.A.)
Trevi ICOSSoletanche J.V.
(U.S.A.)
Profuro LDA(Mozambique)
TreviFoundationNigeria LTD
(Nigeria)
30%
10%
1,75%21,62%
78,38%
90%
99,78% 99,92% 98,25%
70%
93%
SoilmecColombia SAS
(Colombia)
80% 98%
80%
65%
50%
51%
51% 80%
51%
51% 38,25%90% 13,83%
94%
57%
60%
80,32%
99,95%
12,53%
85%89%
50%
99,93%
85%
15%
0,07%
10%
42%
5%1%
87,47%
1%
Trevi-ITT J.V.(Thailand )
95%
Trevi Arabco JV(Egypt)
51%
86,20%
Trevi HoldingUSA(U.S.A.)
98%2%


TREVI – Finanziaria Industriale S.p.A.Consolidated financial statements as at 31 December 2016
Independent auditor’s report in accordance with articles 14 and16 of Legislative Decree n. 39, dated 27 January 2010
EY S.p.A.Sede Legale: Via Po, 32 - 00198 RomaCapitale Sociale deliberato Euro 3.250.000,00, sottoscritto e versato Euro 2.950.000,00 i.v.Iscritta alla S.O. del Registro delle Imprese presso la C.C.I.A.A. di RomaCodice fiscale e numero di iscrizione 00434000584 - numero R.E.A. 250904P.IVA 00891231003Iscritta al Registro Revisori Legali al n. 70945 Pubblicato sulla G.U. Suppl. 13 - IV Serie Speciale del 17/2/1998Iscritta all’Albo Speciale delle società di revisioneConsob al progressivo n. 2 delibera n.10831 del 16/7/1997
A member firm of Ernst & Young Global Limited
EY S.p.A.Via Massimo D'Azeglio, 3440123 Bologna
Tel: +39 051 278311Fax: +39 051 236666ey.com
Independent auditor’s report in accordance with articles 14 and 16 oflegislative decree n. 39, dated 27 January 2010(Translation from the original Italian text)
To the Shareholders ofTREVI – Finanziaria Industriale S.p.A.
Report on the consolidated financial statementsWe have audited the accompanying consolidated financial statements of TREVI Group, which comprisethe statement of financial position as at 31 December 2016, the income statement, the statement ofcomprehensive income, the statement of changes in net equity, the statement of cash flows for theyear then ended, and a summary of significant accounting policies and other explanatory notes.
Directors’ responsibility for the consolidated financial statementsThe Directors are responsible for the preparation of these consolidated financial statements that givea true and fair view in accordance with International Financial Reporting Standards as adopted by theEuropean Union as well as with the regulations issued to implement art. 9 of Legislative Decree n. 38,dated 28 February 2005.
Auditor's responsibilityOur responsibility is to express an opinion on these consolidated financial statements based on ouraudit. We conducted our audit in accordance with International Standards on Auditing (ISA Italia)implemented in accordance with article 11 of Legislative Decree n. 39, dated 27 January 2010.Those standards require that we comply with ethical requirements and plan and perform the audit toobtain reasonable assurance about whether the financial statements are free from materialmisstatement.
An audit involves performing procedures to obtain audit evidence about the amounts and disclosuresin the consolidated financial statements. The procedures selected depend on the auditor'sprofessional judgment, including the assessment of the risks of material misstatement of theconsolidated financial statements, whether due to fraud or error. In making those risk assessments,the auditor considers internal control relevant to the entity's preparation of the consolidated financialstatements that give a true and fair view in order to design audit procedures that are appropriate inthe circumstances, but not for the purpose of expressing an opinion on the effectiveness of theentity's internal control. An audit also includes evaluating the appropriateness of accounting policiesused and the reasonableness of accounting estimates made by Directors, as well as evaluating theoverall presentation of the consolidated financial statements.
We believe that the audit evidence we have obtained is sufficient and appropriate to provide a basisfor our audit opinion.
3
OpinionIn our opinion, the consolidated financial statements give a true and fair view of the financial positionof TREVI Group as at 31 December 2016, and of its financial performance and its cash flows for theyear then ended in accordance with International Financial Reporting Standards as adopted by theEuropean Union and with article 9 of Legislative Decree n. 38, dated 28 February 2005.
Report on other legal and regulatory requirementsOpinion on the consistency of the Report on Operations and of specific informationof the Report on Corporate Governance and on the Company’s OwnershipStructure with the consolidated financial statementsWe have performed the procedures required under audit standard SA Italia n. 720B in order toexpress an opinion, as required by law, on the consistency of the Report on Operations and of specificinformation of the Report on Corporate Governance and on the Company’s Ownership Structure asprovided for by article 123-bis, paragraph 4 of Legislative Decree n. 58, dated 24 February 1998,with the consolidated financial statements. The Directors of TREVI – Finanziaria Industriale S.p.A. areresponsible for the preparation of the Report on Operations and of the Report on CorporateGovernance and on the Company’s Ownership Structure in accordance with the applicable laws andregulations. In our opinion the Report on Operations and the specific information of the Report onCorporate Governance and on the Company’s Ownership Structure are consistent with theconsolidated financial statements of TREVI Group as at 31 December 2016.
Bologna, 21 April 2017
EY S.p.A.Signed by: Andrea Nobili, Partner
This report has been translated into the English language solely for the convenience of internationalreaders.
1
TREVI - Finanziaria Industriale S.p.A.
Registered Office Cesena (Forlì-Cesena) – Via Larga 201 – Italy
Share capital Euro 82,391,632.50 fully paid-up
Tax code, VAT no. and Forlì – Cesena Business Registry: 01547370401
Forlì – Cesena Chamber of Commerce Business Register no. 201,271
Website: www.trevifin.com
Report of the Board of Statutory Auditors to the Shareholders’ Meeting called to approve the Financial Statements at 31 December 2016
Dear shareholders,
The present Report is on the activities of the Board of Statutory Auditors in the financial year ended 31 December 2016.
The Board of Statutory Auditors has carried out the supervisory activities required under Article 2403
of the Italian Civil Code and Article 149 of Legislative Decree 58/1998 and as the Committee for Internal
Control and Audit of the Financial Statements also carried out the supervisory activities required under Article 19 of Legislative Decree 39/2010 and subsequent amendments, overseeing adherence to the principles of correct administration and, in particular, the adequacy of the organisational, administrative and accounting systems adopted by the Company and their effective operation, as well as the effective implementation of the relevant enacted corporate governance regulations. It also verified the independence of the independent audit firm. As part of its activities, the Board of Statutory Auditors:
• held eleven meetings during the 2016 financial year and was present at all the Shareholders’ Meetings and at all those of the Board of Directors (nine meetings of the Board of Directors and one Shareholders’ Meeting) and, through the presence of the Chairperson of the Board of Statutory Auditors and/or of other Statutory Auditors was present at the meetings of the Committee for Control and Risks (five meetings), the Committee for Appointments and Remuneration (five meetings) and the Committee for Related-party Transactions (five meetings); the meetings of the Board of Statutory Auditors lasted on average two and a half hours;
• received periodically from the Directors wide-ranging and detailed information on the business performance and on the business outlook, on activities and on the more material economic, financial and capital transactions done by the Company and its subsidiaries, as well as on the progress of strategic activities and projects already underway;
• in compliance with the recommendations of the Self-regulatory Code, the Chairman of the Board of Directors ensured that the Statutory Auditors were provided with adequate knowledge of the operating sectors of the Issuer and of the TREVI Group.
In carrying out its activities, the Board of Statutory Auditors worked with the Committee for Control and Risks and the Internal Audit Department; with these it had a constant exchange of information through its attendance at the meetings of the aforementioned Committee and through joint meetings when the matters on the agenda
2
and the corporate departments involved had interests in common or were part of their relevant responsibilities. At the same time, it also had a constant exchange of information with the Manager responsible for preparing the Company accounts and with the Supervisory Body. Pursuant to Article 153 of Legislative Decree 58/1998 and Article 2459, paragraph 2, of the Italian Civil Code, and taking account of the recommendations of Consob, we declare as follows: 1. On the basis of available information, the Board of Statutory Auditors found no infringements of the
law or of the Articles of Association or transactions that were manifestly imprudent or risky, that gave rise to conflicts of interest or were contrary to the resolutions of the Shareholders’ Meetings or were such as to compromise the integrity of the assets of the Company and its continuity.
2. Significant events in the year under review that had an impact, inter alia, on the organisational structure of the Group were:
- confirmation by the Shareholders’ Meeting of 13 May of the appointment as a Board Director of Ms Marta Dassù, who had been co-opted by the Board; the Board remained comprised of eleven Directors;
- a Risk Management department was set up, the position of Central Director was created and Mr Marco Andreasi was appointed to this position;
- the Internal Audit department was strengthened with the addition of another person; - following the resignation of Mr Daniele Forti as of 30 April 2017, having received the
favourable opinion of the Board of Statutory Auditors, Mr Roberto Carassai was appointed from 30 April 2017 to the position of Manager responsible for the Company accounts with all the relevant powers;
3. the Board of Statutory Auditors acquired information and oversaw, to the extent of their responsibility,
that:
⋅ the company organisation met the criteria of adequacy, efficacy and efficiency for the size and management and operational complexity of the Company and Group;
⋅ that the internal control system met the criteria of adequacy, efficacy and efficiency and that the administrative and accounting system was adequate and reliable and, therefore, able to reflect correctly the affairs of the Company while fully respecting the principles of correct administration; as regards the control system, the Board of Statutory Auditors acknowledges the measures taken by the Company to strengthen it but requests that further improvements be implemented to bring it in line with best practice and that further upgrades are made to meet the complexity of the Group;
⋅ that the instructions given to subsidiaries under Article 114, paragraph 2 of Legislative Decree 58/98 were adequate;
⋅ the audit firm met the criteria of independence. 4. During 2016, the Company carried out no atypical or unusual transactions with third-parties, Group
companies or related parties or transactions that could have a material effect on the economic, capital and financial situation of the Company.
5. The Company provided detailed and timely information in the interim financial statements on intergroup transactions or ordinary related-party transactions in the period under review; we acknowledge that these transactions were carried out in the interests of the Company and in accordance with the Procedure for Related-party Transactions and Consob Regulations and did not give rise to any critical circumstances concerning their suitability and appropriateness as regards the interests of the Company. In 2016, the Board of Directors, following preliminary research by the Committee for Related-party Transactions, analysed one transaction between two companies of TREVI Group for the sale of know-how; The Committee and the Board acknowledged the information provided by the two
3
subsidiaries involved, took expert advice and studied the supporting documentation and acknowledged the company restructuring underlying the transaction and the interests of the two companies involved; the transaction was approved by the Board of Directors.
6. No purchases or disposals of treasury shares were transacted with under the share buy-back/divestment plan approved by the Shareholders’ Meeting of 13 May 2016, having received prior approval from the Board of Statutory Auditors. At 31 December 2016, the Company held a total of 204,000 treasury shares, representing 0.124% of the share capital, for a total value of Euro 736,078. During the financial year 2016, the company did not exercise the mandate conferred on it by the Shareholders’ Meeting.
7. During the course of its periodic reviews, the Board of Statutory Auditors met with the Manager responsible for the Company accounts, the Internal Audit Department and representatives of the independent audit firm, in order to obtain information on the activities carried out and on the control programmes. No data or relevant information emerged from these meetings that needs to be reported. The Board also had a continuous and timely exchange of information with the Committee for Control and Risks regarding fulfilment of their respective duties.
8. With regard to financial information reporting, the Board of Statutory Auditors examined the system for the continuous updating at Group level of the system of accounting and administrative rules and procedures governing the preparation and dissemination of financial information and reports, which satisfy the requirements for the release of the declaration pursuant to Article 154 of Legislative Decree 58/1998. The effective application and reliability of the accounting and administrative procedures was verified by the Manager responsible for the Company accounts, availing himself of the relevant internal structures, through monitoring of the control and corporate Governance areas, as well as the key controls of the most important processes.
9. During its periodic reviews, the Board of Statutory Auditors was constantly informed on the financial situation and on loans received from banks. In particular, the Board of Statutory Auditors was aware that the Group had failed to meet one of the financial covenants at 31 December 2016 in the loan agreements, which was the Net Debt/EBITDA ratio, and two financial covenants under the terms and conditions of the Euro 50 million bond loan (the Net Debt/ EBITDA ratio and the EBITDA/ Net Financial Costs ratio). At the request of the Directors, the banks involved agreed not to consider the failure to meet the aforementioned financial covenant (Net Debt/EBITDA) a significant event under the terms of the loan agreements and agreed that this ratio would be calculated at 31 December 2017; at the date of the Board of Directors meeting to approve the 2016 Preliminary Financial Statements (12 April 2017), the Company had received waivers from all the banks that had given loans subject to covenants. The Bondholders’ Meeting of 10 March 2017 also agreed to the request from the Company for waivers on the two financial covenants that were not met at 31 December 2016; this became effective when the minutes of the extraordinary Board Meeting of 12 April 2017, in which the Board of Directions verified that the suspensive conditions had been met and approved the amendments to the terms and conditions of the bond, were deposited at the Business Registry of Forlì-Cesena on 13 April 2017. Consequently, the Directors reclassified as current financial payables in the Financial Statements at 31 December 2016 all the financial payables governed by the financial covenant that had not been met. The Board of Statutory Auditors, therefore, verified the conditions – indicated analytically in the Report on operations - on the basis of which the Directors considered it appropriate to apply the set of accounting principles for going concern companies basing its assessment that there existed the premise of corporate continuity. During the period, the administrative body also made decisions on the economic-financial support of certain Group companies; in particular, during the period under review, the Company made advance payment of Euro 45.000 million for a capital increase of the subsidiary Drillmec S.p.A. and of Euro 100,000 for a capital increase of Trevi Energy S.p.A..
4
10. With regard to the requirements pursuant to Article 36, paragraph 1 of the Market Regulation (Consob Resolution no. 16191 of 20 October 2007), which apply to subsidiary companies identified by the Company as significant entities according to the system of control governing financial information, the Board of Statutory Auditors confirmed that the information provided by non-EU companies, indicated in the aforementioned regulations, were adequate to ensure the regular provision to the Company and the auditors of the economic, capital and financial data necessary for the preparation of the Consolidated Financial Statements and for the control activities relating to the annual and interim accounts. Specifically, it should be noted, that at 31 December 2016, the companies subject to these requirements are the subsidiaries identified by TREVI – Finanziaria Industriale S.p.A. as significant with regard to the system of controls on financial information.
11. The Board of Statutory Auditors monitored the methodology for the practical application of the recommendations of the Self-regulatory Code for companies listed on the Italian stock exchange, to which the Company adheres, verifying the compliance of TREVI – Finanziaria Industriale S.p.A’s Corporate Governance system to the recommendations of the aforementioned Code and that detailed information was provided for the same in the annual Report on Corporate Governance and Ownership Structure, prepared in accordance with Article 123-bis of the Consolidated Finance Act (TUF) and approved by the Board of Directors on 12 April 2017, taking into account the recommendations in the Borsa Italiana S.p.A. communication entitled Report on Corporate Governance and Ownership Structure 6th edition – January 2017; the report is available on the Company website.
12. The Board of Statutory Auditors verified the correct application of the inspection procedures and criteria adopted by the Board of Directors to evaluate that the requirements for professionalism and independence of its members continued to be met, taking into account the various declarations given, the results of which are described in the Report on Corporate Governance and Ownership Structure prepared in accordance with Article 123-bis of the Consolidated Finance Act. The Board of Statutory Auditors also verified that each of its members were in possession of the required credentials regarding reputation, professionalism and integrity required by the current rules and regulations and those of independence required by the Self-regulatory Code, and that the limitations on the number of positions held was respected.
13. The Board of Statutory Auditors was also informed about the results of the self-assessment of the Board of Directors in 2016 regarding the size and functioning of the Board and its Committees, which was prepared in a way that was consistent with previous assessments, as reported in the meeting of the Board of Directors of 12 April 2017.
14. The Board of Statutory Auditors also ascertained the adequacy of the measures regarding the procedures adopted by the Committee for Appointments and Remuneration (whose meetings were also attended by the Chairperson of the Board of Statutory Auditors and/or its members) to define and apply the Remuneration Policy and to approve the policies regarding the annual and three-year monetary incentive policies (the latter being based on the free allocation of treasury shares of TREVI - Finanziaria Industriale S.p.A.) for executive Directors and executives with strategic responsibilities. The terms of the new short and long term remuneration policies for the 2017 financial year, as approved by the Board of Directors in its meeting of 12 April 2017, again with the prior approval of the Committee for Appointments and Remuneration, are described in the 2017 Report on Remuneration prepared in accordance with Article 123-ter of the Consolidated Finance Act and are available on the website of TREVI – Finanziaria Industriale S.p.A..
15. The Board of Statutory Auditors, together with the Committee for Control and Risks (on certain occasions for specific matters in jointly held meetings) assessed and monitored the adequacy of the Risk Management System through:
⋅ Meetings with the Head of Internal Audit, in order to obtain information on: (i) The results of the 2016 audit aimed at identifying and evaluating the main risks, as indicated by
5
the Internal Control System, of ensuring respect of the laws, procedures and corporate processes, as well as on the implementation of initiatives for the improvement thereof;
(ii) The 2017 audit plan and the 2017 departmental budget, considered by the Committee for Control and Risks to be appropriate to the business risk profile and exposure of the Group;
16. As a result of the verifications carried out and the information received, it emerged that the Control and Risk Management System fully meets the relevant adequacy, efficacy and operational criteria and is appropriate for risk prevention and the effective application of the rules of corporate conduct. In addition, the organisational structure of the said system guarantees the co-ordination of activities between various persons and departments involved, through a continuous flow of information among those involved, and, therefore, there are no matters that need to be brought to the attention of the Shareholders’ Meeting.
17. The Board of Statutory Auditors also took into consideration the results of the Report on matters
fundamental to the 2015 Financial Statements and to the 2016 half-year results issued by the independent audit firm and the plans prepared by the Management that allowed the Committee for Control and Risks and the Board of Directors, while recognising the need for improvement as strongly requested by the Committee for Control and Risks, to conclude that the control system meets the relevant adequacy, efficacy and operational criteria appropriate to the structure of the Group and the nature of the Company’s business.
18. During 2016, the Board of Statutory Auditors had periodical exchanges of information with the Supervisory Body, in order to continuously check on processes to update the Organisational, Management and Control Model in accordance with Legislative Decree 231/2001 (hereinafter “Model 231”), its application and its suitability and efficacy in preventing any responsibility for possible violations of the aforementioned regulation, through the implementation of appropriate precautionary measures and procedures. The results of these activities are detailed in the Supervisory Body’s reports that were periodically provided to the Board of Directors. In general, the Supervisory Body confirmed the adherence to the general structure of Model 231 taking into account the legislative amendments introduced in 2016; it confirmed that the compliance/monitoring activities conducted by the Internal Audit of Risk Assessment 231 and the dissemination of information and internal training by the Company on Model 231 are continuous; and it suggested that the Model be updated in the near future to incorporate the significant changes in organisational reinforcement in the Company.
The Company updated its organisational model at the Board of Directors’ meeting of 29 July 2016 issuing a fourth edition to take account of the new crimes relating to the voluntary disclosure of money laundering (see Law no. 186/2014), crimes regarding the Public Administration, corporate crimes (see Law no. 69/2015) and environmental violations (see Law no. 68/2015). The Supervisory Body also continuously monitored the communication channel set up receive notifications of possible violations of Model 231 but received no notifications.
19. The Board of Statutory Auditors acknowledged the actions taken by the Company to incorporate Sustainability as an integral part of its business to guarantee long-term growth and value creation through the involvement of all stakeholders. To adhere to the Principles of Sustainability it has shaped its activities according to a Corporate Social Responsibility programme that is continuously updated, monitored and shared at all levels of responsibility, which continues the attention it already pays when carrying out its projects to environmental and social factors.
20. The Board of Statutory Auditors periodically met with the representatives of the independent audit firm, EY S.p.A., and received regular information on working plans and verification procedures, on the state of progress of these and related results. No information and/or relevant matters emerged regarding
6
issues or problems with the Board of Statutory Auditors that need be reported. 21. On 21 April 2017, the independent audit firm, EY S.p.A., released its own report in accordance with
Articles 14 and 16 of Legislative Decree no. 39 of 27 January 2010, on the Parent Company and Consolidated Financial Statements for the year ended 31 December 2016 expressing an opinion without qualifications or omissions such as to require additional information to be provided.
22. The Board of Statutory Auditors also monitored the independence of the audit firm pursuant to Article 19 of Legislative Decree 39/2010, verified the nature and amount of the mandates it received from TREVI – Finanziaria Industriale S.p.A. and/or companies of the Group (Italian and foreign, both EU and outside the EU) for services other than the legal audit. Details are given in the Notes to the Consolidated Financial Statements, pursuant to Article 149-duodecies of the Listing Rules that requires the amounts paid to the audit firm be published. A summary of the overall remuneration paid to Reconta Ernst & Young S.p.A. (“EY S.p.A.”) and companies within the same Group, pursuant to Article 160, paragraph 1 no. 303 of Law 262 of 28 December 2006, and to Ernst & Young Financial Business Advisory S.p.A., for the project for the control Model under Law 262/05 is shown in the following table:
(Euro ‘000) Entity providing the service Beneficiary Remuneration
in 2016
Audit EY S.p.A. Parent Company 274
EY S.p.A. Subsidiaries 154
Ernst & Young network Subsidiaries 145
Other services EY S.p.A. Subsidiaries 8
Ernst & Young Financial-Business Advisory S.p.A. Parent Company 72
Total 653
There were no mandates forbidden under Regulation (EU) no. 537/2014 and Legislative Decree of 17 July 2016 no. 135. As regards mandates other than those for audit activities, the Board of Statutory Auditors maintains that the remuneration was adequate for the size and complexity of the tasks involved and were therefore compatible with the mandate for the legal audit of the financial statements and did not result in any anomalies regarding the criteria of independence required of the audit firm responsible for the legal audit of the financial statements.
23. During the financial year under review, the Board of Statutory Auditors also reviewed and discussed with the independent audit firm the legal amendments introduced with the adoption of Regulation (EU) no. 537/2014 and Legislative Decree of 17 July 2016 no. 135 that updated the legal framework for the legal audit of financial statements with particular reference to the limit on remuneration that can be paid to entities responsible for the legal audit for services other than audit services and to the precise definition of the responsibilities of the Committee for internal control and auditing of the financial statements which, under the traditional model for companies, is the Board of Statutory Auditors.
24. The Board of Statutory Auditors, given that the nine-year mandate of the independent audit firm for the legal audit of the financial statements expires at the Shareholders’ Meeting convened to approve the Financial Statements at 31 December 2016, through the Manager responsible for preparing the Company accounts, obtained quotes from three of the “big four” accountancy firms and presented a reasoned proposal to the Board of Directors meeting on 12 April 2017 that the mandate for the legal audit of the
7
accounts for the nine-year period 2017-2025 be given to KPMG S.p.A. on the basis of both the qualitative and quantitative comparative values of the quotes received.
25. The Board of Statutory Auditors declares that it has received no complaints pursuant to Article 2408 of the Italian Civil Code or received petitions of any kind or has made any denunciations under Article 2409, paragraph 7 of the Italian Civil Code.
On the basis of the activities and on the information received, we have found no omissions, censurable acts or irregularities or facts of any significance that need to be reported to the regulatory bodies or included in the present Report. The Board of Statutory Auditors, therefore, is in favour of the approval of the
Financial Statements of TREVI – Finanziaria Industriale S.p.A. at 31 December 2016 and of the proposal from the Board of Directors that the losses for the period under review be covered by using the share premium reserve. Cesena (Forlì-Cesena), 21 April 2017 THE BOARD OF STATUTORY AUDITORS
Signature: Ms Milena Motta (Chairperson)
Signature: Mr Giancarlo Poletti (Standing Statutory Auditor)
Signature: Mr Adolfo Leonardi (Standing Statutory Auditor)
TREVI – Finanziaria Industriale S.p.A.
Financial Statements at 31 December 2016
TREVI – Finanziaria Industriale S.p.A. Registered Office Cesena (Forlì - Cesena) - Via Larga 201 - Italy
Share capital Euro 82,391,632.50 fully paid-up Forlì – Cesena Chamber of Commerce Business Register no. 201,271
Tax code, VAT no. and Forlì – Cesena Business Registry: 01547370401 Website: www.trevifin.com
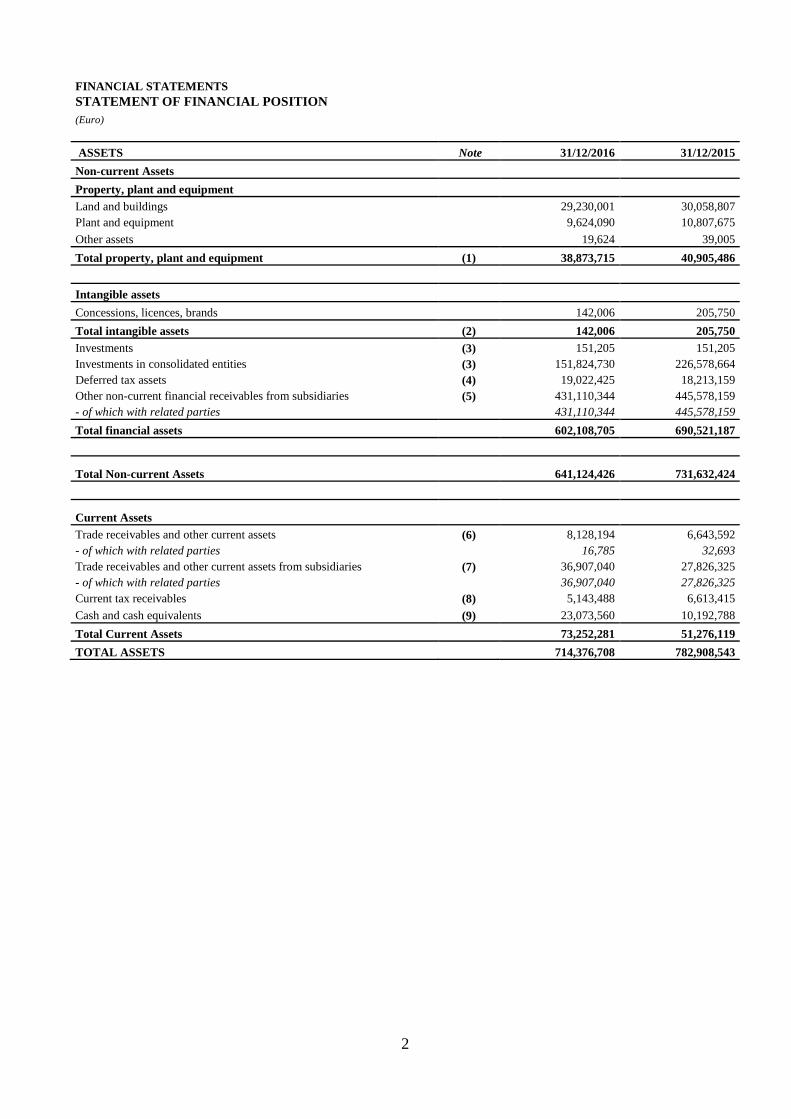
2
FINANCIAL STATEMENTS STATEMENT OF FINANCIAL POSITION (Euro) ASSETS Note 31/12/2016 31/12/2015
Non-current Assets
Property, plant and equipment
Land and buildings 29,230,001 30,058,807 Plant and equipment 9,624,090 10,807,675
Other assets 19,624 39,005
Total property, plant and equipment (1) 38,873,715 40,905,486
Intangible assets
Concessions, licences, brands 142,006 205,750
Total intangible assets (2) 142,006 205,750 Investments (3) 151,205 151,205 Investments in consolidated entities (3) 151,824,730 226,578,664 Deferred tax assets (4) 19,022,425 18,213,159 Other non-current financial receivables from subsidiaries (5) 431,110,344 445,578,159 - of which with related parties 431,110,344 445,578,159
Total financial assets 602,108,705 690,521,187
Total Non-current Assets 641,124,426 731,632,424
Current Assets Trade receivables and other current assets (6) 8,128,194 6,643,592 - of which with related parties 16,785 32,693 Trade receivables and other current assets from subsidiaries (7) 36,907,040 27,826,325 - of which with related parties 36,907,040 27,826,325 Current tax receivables (8) 5,143,488 6,613,415
Cash and cash equivalents (9) 23,073,560 10,192,788
Total Current Assets 73,252,281 51,276,119
TOTAL ASSETS 714,376,708 782,908,543
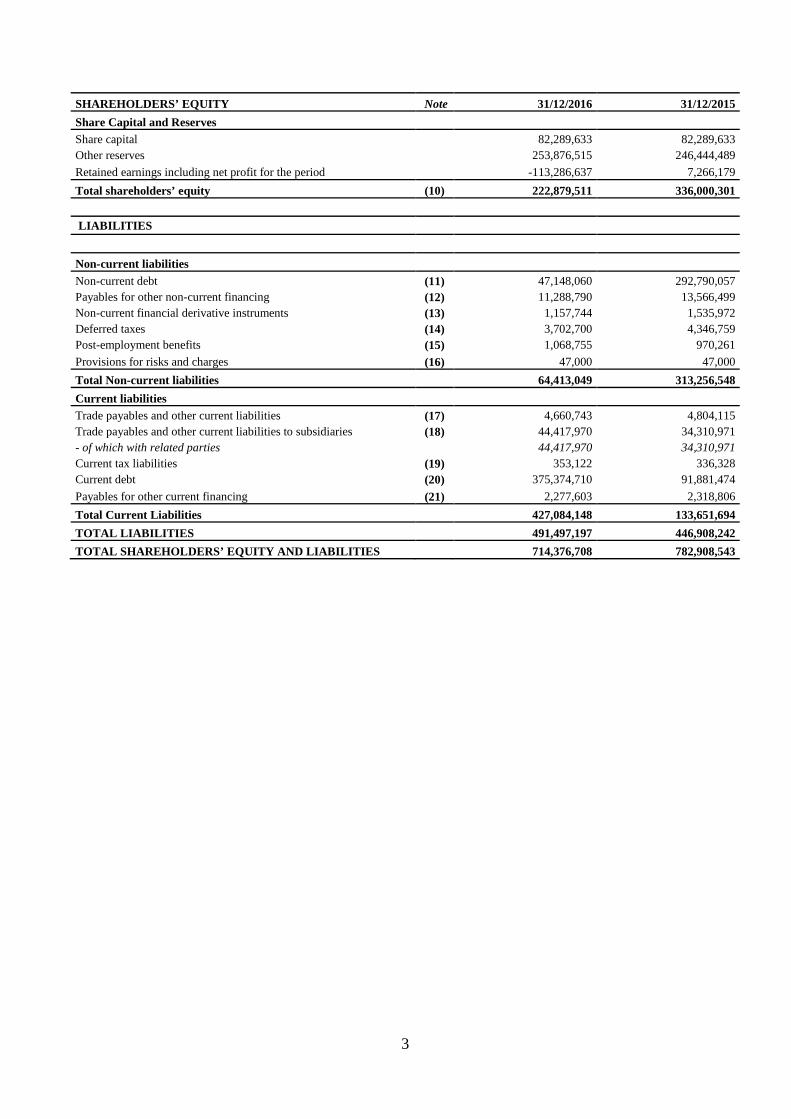
3
SHAREHOLDERS’ EQUITY Note 31/12/2016 31/12/2015
Share Capital and Reserves Share capital 82,289,633 82,289,633 Other reserves 253,876,515 246,444,489
Retained earnings including net profit for the period -113,286,637 7,266,179
Total shareholders’ equity (10) 222,879,511 336,000,301 LIABILITIES
Non-current liabilities
Non-current debt (11) 47,148,060 292,790,057 Payables for other non-current financing (12) 11,288,790 13,566,499 Non-current financial derivative instruments (13) 1,157,744 1,535,972 Deferred taxes (14) 3,702,700 4,346,759 Post-employment benefits (15) 1,068,755 970,261
Provisions for risks and charges (16) 47,000 47,000
Total Non-current liabilities 64,413,049 313,256,548
Current liabilities
Trade payables and other current liabilities (17) 4,660,743 4,804,115 Trade payables and other current liabilities to subsidiaries (18) 44,417,970 34,310,971 - of which with related parties 44,417,970 34,310,971 Current tax liabilities (19) 353,122 336,328 Current debt (20) 375,374,710 91,881,474
Payables for other current financing (21) 2,277,603 2,318,806
Total Current Liabilities 427,084,148 133,651,694
TOTAL LIABILITIES 491,497,197 446,908,242
TOTAL SHAREHOLDERS’ EQUITY AND LIABILITIES 714,376,708 782,908,543
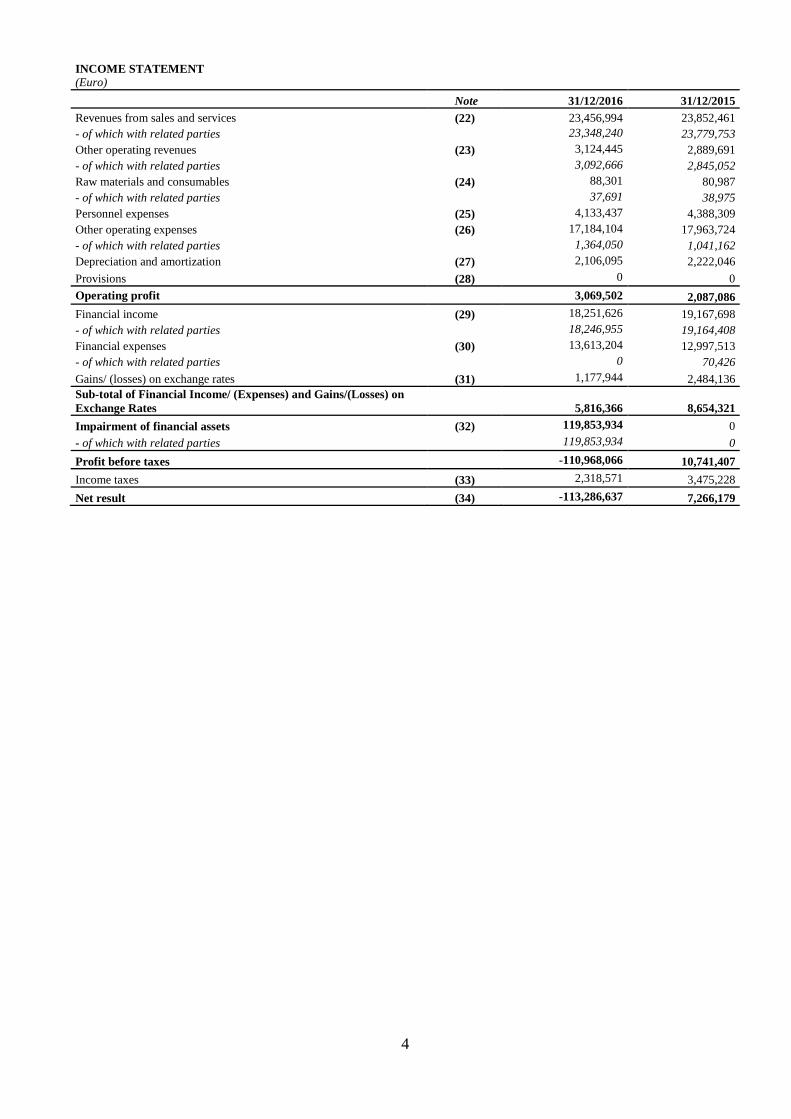
4
INCOME STATEMENT (Euro)
Note 31/12/2016 31/12/2015 Revenues from sales and services (22) 23,456,994 23,852,461 - of which with related parties 23,348,240 23,779,753 Other operating revenues (23) 3,124,445 2,889,691 - of which with related parties 3,092,666 2,845,052 Raw materials and consumables (24) 88,301 80,987 - of which with related parties 37,691 38,975 Personnel expenses (25) 4,133,437 4,388,309 Other operating expenses (26) 17,184,104 17,963,724 - of which with related parties 1,364,050 1,041,162 Depreciation and amortization (27) 2,106,095 2,222,046
Provisions (28) 0 0
Operating profit 3,069,502 2,087,086 Financial income (29) 18,251,626 19,167,698 - of which with related parties 18,246,955 19,164,408 Financial expenses (30) 13,613,204 12,997,513 - of which with related parties 0 70,426
Gains/ (losses) on exchange rates (31) 1,177,944 2,484,136 Sub-total of Financial Income/ (Expenses) and Gains/(Losses) on Exchange Rates
5,816,366 8,654,321
Impairment of financial assets (32) 119,853,934 0
- of which with related parties 119,853,934 0
Profit before taxes -110,968,066 10,741,407
Income taxes (33) 2,318,571 3,475,228
Net result (34) -113,286,637 7,266,179
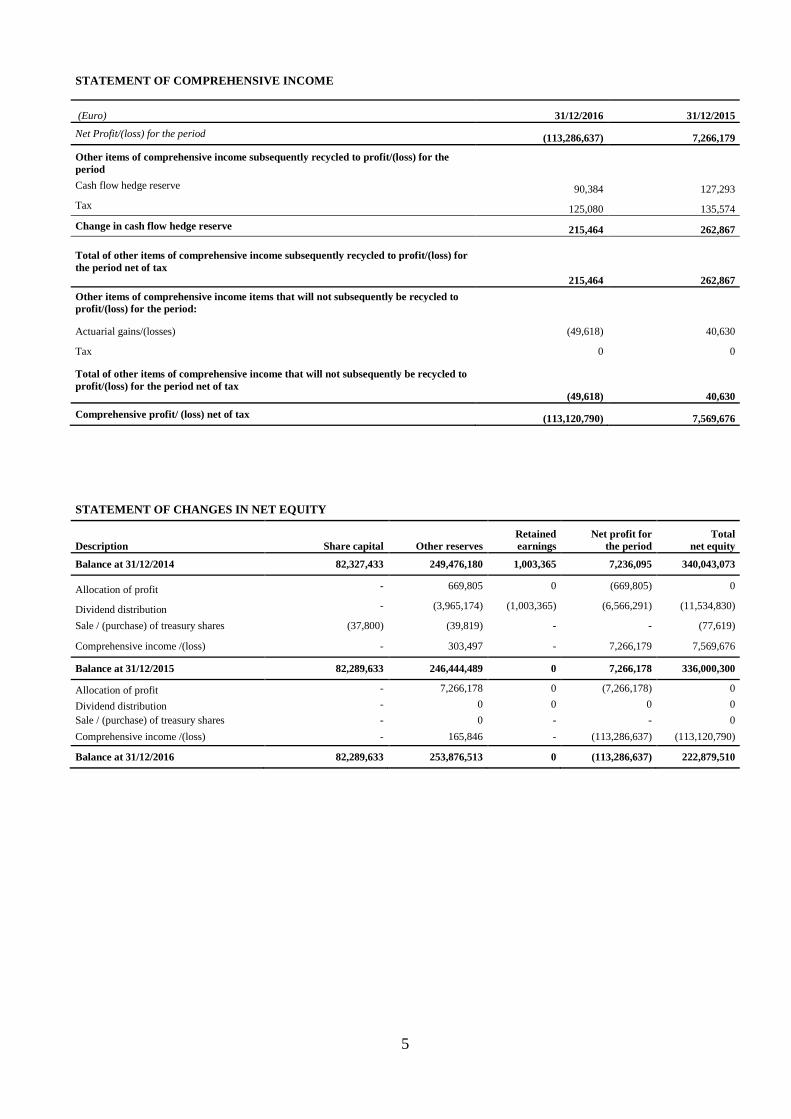
5
STATEMENT OF COMPREHENSIVE INCOME
(Euro) 31/12/2016 31/12/2015
Net Profit/(loss) for the period (113,286,637) 7,266,179
Other items of comprehensive income subsequently recycled to profit/(loss) for the period
Cash flow hedge reserve 90,384 127,293
Tax 125,080 135,574
Change in cash flow hedge reserve 215,464 262,867
Total of other items of comprehensive income subsequently recycled to profit/(loss) for the period net of tax
215,464 262,867
Other items of comprehensive income items that will not subsequently be recycled to profit/(loss) for the period:
Actuarial gains/(losses) (49,618) 40,630
Tax 0 0
Total of other items of comprehensive income that will not subsequently be recycled to profit/(loss) for the period net of tax
(49,618) 40,630
Comprehensive profit/ (loss) net of tax (113,120,790) 7,569,676
STATEMENT OF CHANGES IN NET EQUITY
Description Share capital Other reserves Retained earnings
Net profit for the period
Total net equity
Balance at 31/12/2014 82,327,433 249,476,180 1,003,365 7,236,095 340,043,073
Allocation of profit - 669,805 0 (669,805) 0
Dividend distribution - (3,965,174) (1,003,365) (6,566,291) (11,534,830)
Sale / (purchase) of treasury shares (37,800) (39,819) - - (77,619)
Comprehensive income /(loss) - 303,497 - 7,266,179 7,569,676
Balance at 31/12/2015 82,289,633 246,444,489 0 7,266,178 336,000,300
Allocation of profit - 7,266,178 0 (7,266,178) 0
Dividend distribution - 0 0 0 0
Sale / (purchase) of treasury shares - 0 - - 0
Comprehensive income /(loss) - 165,846 - (113,286,637) (113,120,790)
Balance at 31/12/2016 82,289,633 253,876,513 0 (113,286,637) 222,879,510
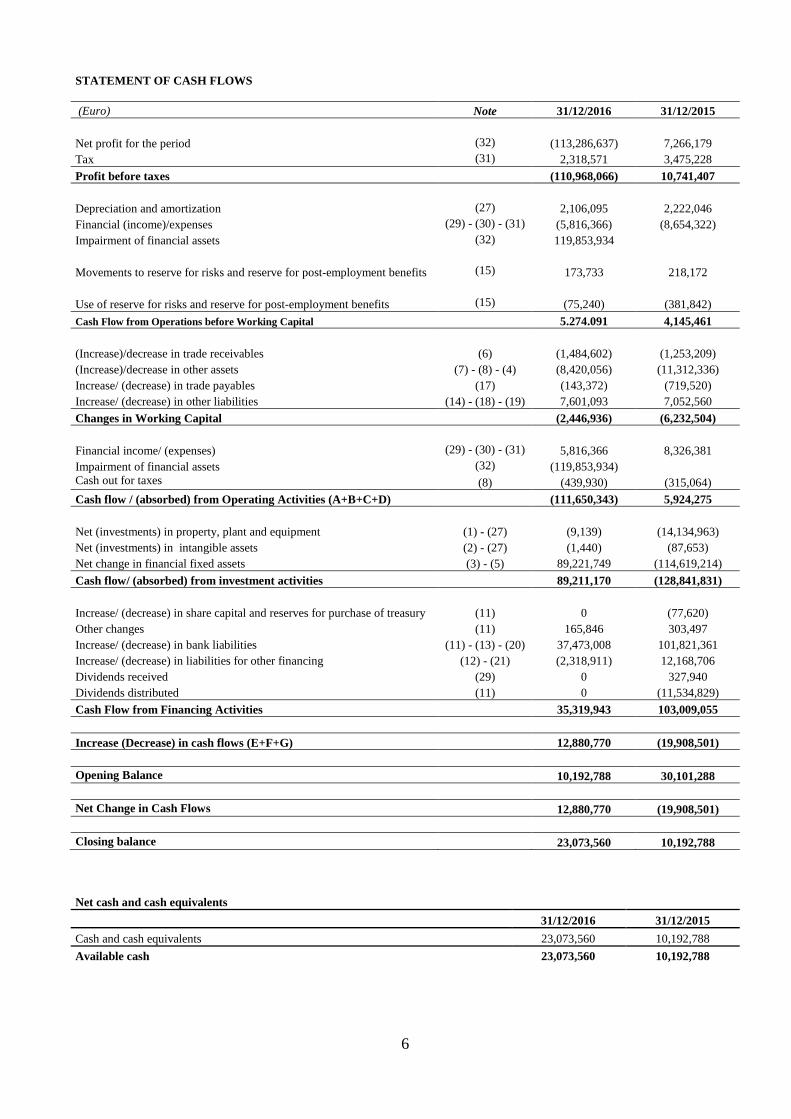
6
STATEMENT OF CASH FLOWS (Euro) Note 31/12/2016 31/12/2015
Net profit for the period (32) (113,286,637) 7,266,179 Tax (31) 2,318,571 3,475,228
Profit before taxes (110,968,066) 10,741,407
Depreciation and amortization (27) 2,106,095 2,222,046 Financial (income)/expenses (29) - (30) - (31) (5,816,366) (8,654,322) Impairment of financial assets (32) 119,853,934
Movements to reserve for risks and reserve for post-employment benefits
(15) 173,733 218,172
Use of reserve for risks and reserve for post-employment benefits
(15) (75,240) (381,842)
Cash Flow from Operations before Working Capital 5.274.091 4,145,461
(Increase)/decrease in trade receivables (6) (1,484,602) (1,253,209) (Increase)/decrease in other assets (7) - (8) - (4) (8,420,056) (11,312,336) Increase/ (decrease) in trade payables (17) (143,372) (719,520) Increase/ (decrease) in other liabilities (14) - (18) - (19) 7,601,093 7,052,560
Changes in Working Capital (2,446,936) (6,232,504)
Financial income/ (expenses) (29) - (30) - (31) 5,816,366 8,326,381 Impairment of financial assets (32) (119,853,934) Cash out for taxes (8) (439,930) (315,064)
Cash flow / (absorbed) from Operating Activities (A+B+C+D) (111,650,343) 5,924,275
Net (investments) in property, plant and equipment (1) - (27) (9,139) (14,134,963) Net (investments) in intangible assets (2) - (27) (1,440) (87,653) Net change in financial fixed assets (3) - (5) 89,221,749 (114,619,214)
Cash flow/ (absorbed) from investment activities 89,211,170 (128,841,831)
Increase/ (decrease) in share capital and reserves for purchase of treasury (11) 0 (77,620) Other changes (11) 165,846 303,497 Increase/ (decrease) in bank liabilities (11) - (13) - (20) 37,473,008 101,821,361 Increase/ (decrease) in liabilities for other financing (12) - (21) (2,318,911) 12,168,706 Dividends received (29) 0 327,940 Dividends distributed (11) 0 (11,534,829)
Cash Flow from Financing Activities 35,319,943 103,009,055
Increase (Decrease) in cash flows (E+F+G) 12,880,770 (19,908,501)
Opening Balance 10,192,788 30,101,288
Net Change in Cash Flows 12,880,770 (19,908,501)
Closing balance 23,073,560 10,192,788
Net cash and cash equivalents
31/12/2016 31/12/2015
Cash and cash equivalents 23,073,560 10,192,788
Available cash 23,073,560 10,192,788
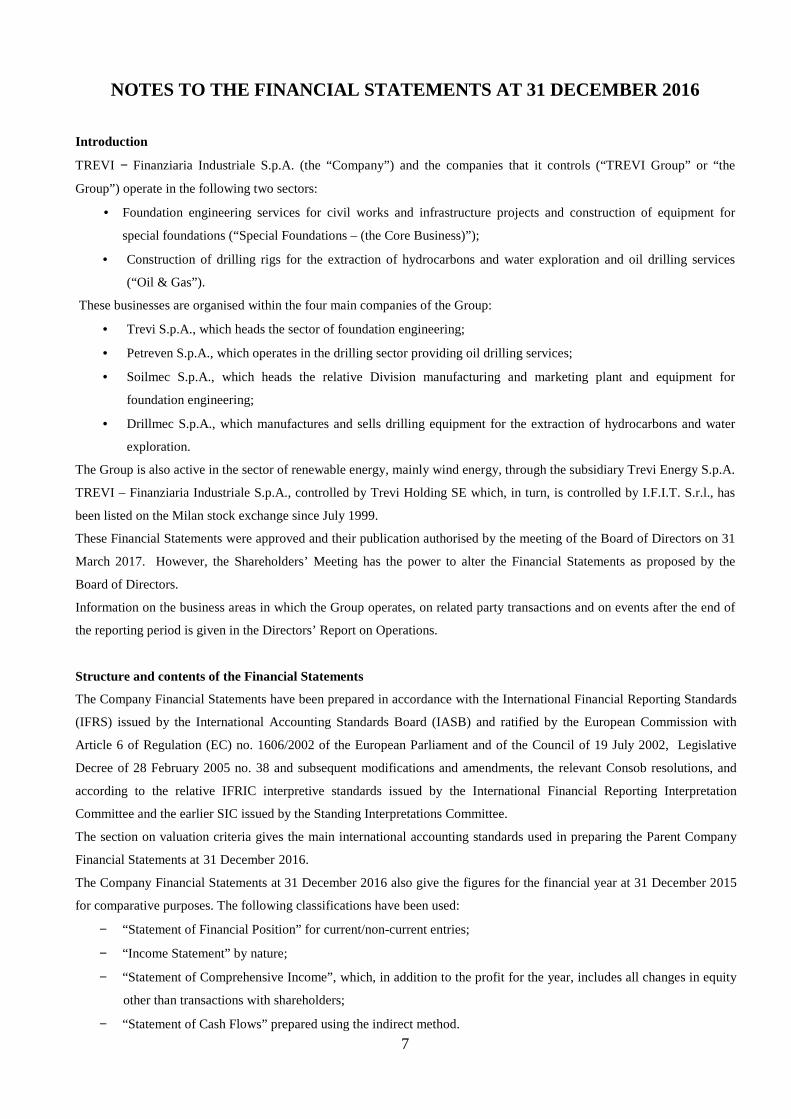
7
NOTES TO THE FINANCIAL STATEMENTS AT 31 DECEMBER 20 16
Introduction
TREVI − Finanziaria Industriale S.p.A. (the “Company”) and the companies that it controls (“TREVI Group” or “the
Group”) operate in the following two sectors:
• Foundation engineering services for civil works and infrastructure projects and construction of equipment for
special foundations (“Special Foundations – (the Core Business)”);
• Construction of drilling rigs for the extraction of hydrocarbons and water exploration and oil drilling services
(“Oil & Gas”).
These businesses are organised within the four main companies of the Group:
• Trevi S.p.A., which heads the sector of foundation engineering;
• Petreven S.p.A., which operates in the drilling sector providing oil drilling services;
• Soilmec S.p.A., which heads the relative Division manufacturing and marketing plant and equipment for
foundation engineering;
• Drillmec S.p.A., which manufactures and sells drilling equipment for the extraction of hydrocarbons and water
exploration.
The Group is also active in the sector of renewable energy, mainly wind energy, through the subsidiary Trevi Energy S.p.A.
TREVI – Finanziaria Industriale S.p.A., controlled by Trevi Holding SE which, in turn, is controlled by I.F.I.T. S.r.l., has
been listed on the Milan stock exchange since July 1999.
These Financial Statements were approved and their publication authorised by the meeting of the Board of Directors on 31
March 2017. However, the Shareholders’ Meeting has the power to alter the Financial Statements as proposed by the
Board of Directors.
Information on the business areas in which the Group operates, on related party transactions and on events after the end of
the reporting period is given in the Directors’ Report on Operations.
Structure and contents of the Financial Statements
The Company Financial Statements have been prepared in accordance with the International Financial Reporting Standards
(IFRS) issued by the International Accounting Standards Board (IASB) and ratified by the European Commission with
Article 6 of Regulation (EC) no. 1606/2002 of the European Parliament and of the Council of 19 July 2002, Legislative
Decree of 28 February 2005 no. 38 and subsequent modifications and amendments, the relevant Consob resolutions, and
according to the relative IFRIC interpretive standards issued by the International Financial Reporting Interpretation
Committee and the earlier SIC issued by the Standing Interpretations Committee.
The section on valuation criteria gives the main international accounting standards used in preparing the Parent Company
Financial Statements at 31 December 2016.
The Company Financial Statements at 31 December 2016 also give the figures for the financial year at 31 December 2015
for comparative purposes. The following classifications have been used:
− “Statement of Financial Position” for current/non-current entries;
− “Income Statement” by nature;
− “Statement of Comprehensive Income”, which, in addition to the profit for the year, includes all changes in equity
other than transactions with shareholders;
− “Statement of Cash Flows” prepared using the indirect method.
8
This classification gives information that best reflects the financial performance and the financial position of the Company.
The functional currency of the Company is the Euro.
Unless otherwise indicated, the tables in the present Financial Statements and the Notes to the Financial Statements are in
Euro units.
Accounting standards
Historical cost accounting has been used for all the assets and liabilities except for available for sale financial assets, held
for trading financial assets, and financial derivative instruments where fair value principles and the assumption of business
continuity have been applied.
Valuation criteria
The preparation of the Financial Statements requires the Directors to make subjective valuations, estimates and
assumptions which affect the values of revenues, costs, assets and liabilities and indications of potential liabilities at the
date of the Financial Statements. The main entries in the Financial Statements that have required the use of estimates are:
• deferred tax assets, in particular as regards the likelihood of them being off-set in the future;
• provisions for doubtful receivables and provisions for risks and costs;
• the main assumptions in the actuarial calculation of the staff-leaving indemnity fund (TFR) are the future
employee turnover rate and the discount rate.
The Financial Statements of the Company at 31 December 2016 have been prepared under the going concern accounting
basis even though the Company reported for the 2016 financial year a net loss of Euro 113.286 million linked to
impairment charges on financial assets..
Due to the non-recurring circumstances described above, the Company failed to meet one of the covenants of its bank loans
at 31 December 2016 and specifically the Net Debt/EBITDA ratio and two of the financial covenants under the terms and
conditions of the Euro 50 million bond loan, which were the Net Debt/ EBITDA and EBITDA/Net Financial Costs ratios.
The Directors of TREVI - Finanziaria Industriale S.p.A.:
• At 31 December 2016, reclassified as current debt the sum total of all the loans for which the financial covenants
had not been met;
• Asked the lender banks from 16 January 2017 to accept the Company request that the failure to meet one of the
financial covenants (Net Debt/ EBITDA) should not be considered a significant event under the loan agreements
and that this ratio be measured on 31 December 2017;
• Convened the Bondholders’ Meeting on 10 March 2017 where the request of the Company for a waiver was
approved under the provisions of Article 12 paragraphs (vii) and (viii) of the terms and conditions of the bond and
amended the terms and conditions under paragraph (ii) of the bond as described in the text published on the
Company website on 8 February 2017. The effective implementation of the resolutions approved by the
Bondholders’ Meeting was subject to the condition that the Company be granted waivers, by 20 April 2017, on the
financial covenants at 31 December 2016 under its bank loans covering a minimum of 75% of the residual amount
of these loans.
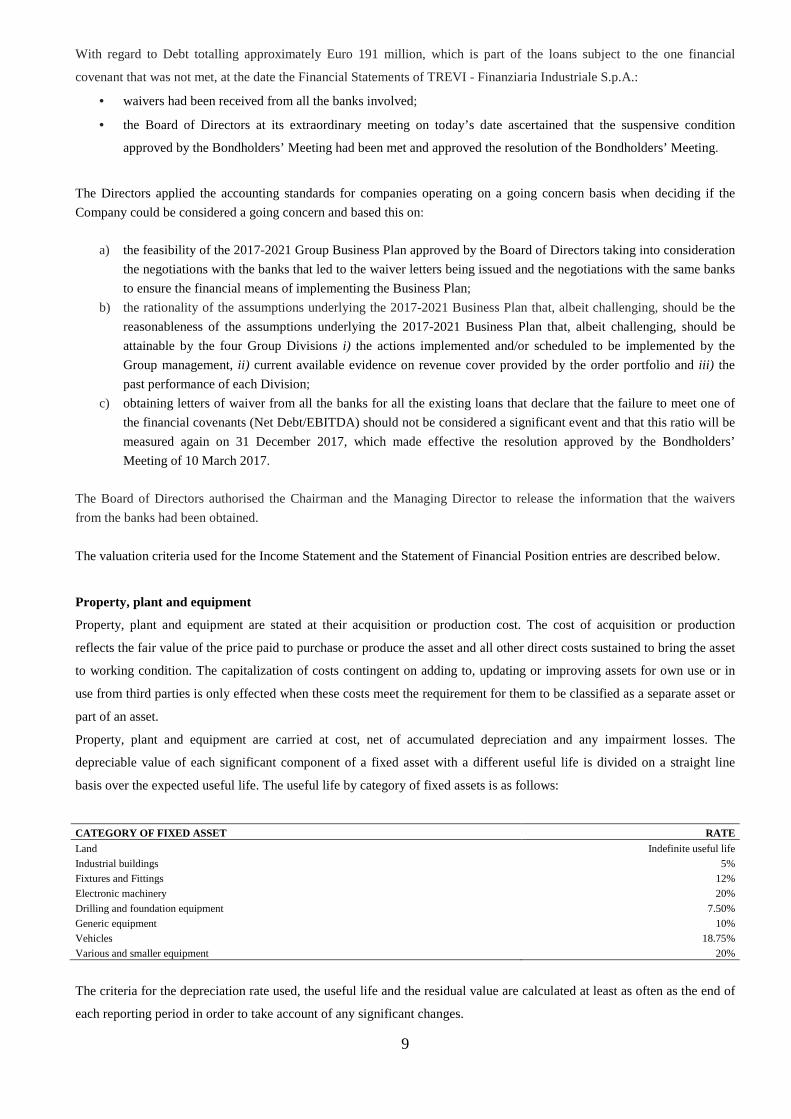
9
With regard to Debt totalling approximately Euro 191 million, which is part of the loans subject to the one financial
covenant that was not met, at the date the Financial Statements of TREVI - Finanziaria Industriale S.p.A.:
• waivers had been received from all the banks involved;
• the Board of Directors at its extraordinary meeting on today’s date ascertained that the suspensive condition
approved by the Bondholders’ Meeting had been met and approved the resolution of the Bondholders’ Meeting.
The Directors applied the accounting standards for companies operating on a going concern basis when deciding if the
Company could be considered a going concern and based this on:
a) the feasibility of the 2017-2021 Group Business Plan approved by the Board of Directors taking into consideration
the negotiations with the banks that led to the waiver letters being issued and the negotiations with the same banks
to ensure the financial means of implementing the Business Plan;
b) the rationality of the assumptions underlying the 2017-2021 Business Plan that, albeit challenging, should be the
reasonableness of the assumptions underlying the 2017-2021 Business Plan that, albeit challenging, should be
attainable by the four Group Divisions i) the actions implemented and/or scheduled to be implemented by the
Group management, ii) current available evidence on revenue cover provided by the order portfolio and iii) the
past performance of each Division;
c) obtaining letters of waiver from all the banks for all the existing loans that declare that the failure to meet one of
the financial covenants (Net Debt/EBITDA) should not be considered a significant event and that this ratio will be
measured again on 31 December 2017, which made effective the resolution approved by the Bondholders’
Meeting of 10 March 2017.
The Board of Directors authorised the Chairman and the Managing Director to release the information that the waivers
from the banks had been obtained.
The valuation criteria used for the Income Statement and the Statement of Financial Position entries are described below.
Property, plant and equipment
Property, plant and equipment are stated at their acquisition or production cost. The cost of acquisition or production
reflects the fair value of the price paid to purchase or produce the asset and all other direct costs sustained to bring the asset
to working condition. The capitalization of costs contingent on adding to, updating or improving assets for own use or in
use from third parties is only effected when these costs meet the requirement for them to be classified as a separate asset or
part of an asset.
Property, plant and equipment are carried at cost, net of accumulated depreciation and any impairment losses. The
depreciable value of each significant component of a fixed asset with a different useful life is divided on a straight line
basis over the expected useful life. The useful life by category of fixed assets is as follows:
CATEGORY OF FIXED ASSET RATE
Land Indefinite useful life
Industrial buildings 5% Fixtures and Fittings 12%
Electronic machinery 20%
Drilling and foundation equipment 7.50%
Generic equipment 10% Vehicles 18.75%
Various and smaller equipment 20%
The criteria for the depreciation rate used, the useful life and the residual value are calculated at least as often as the end of
each reporting period in order to take account of any significant changes.
10
The capitalized costs for improvements to third-party assets are recognised in the relevant fixed asset category and
depreciated for the shorter of either the residual length of the leasing contract or the residual useful life.
The carrying value of property, plant and equipment remains in the Statement of Financial Position as long as that value
can be recouped from their use. If there is any evidence that the net carrying value may not be recoverable, an impairment
test is carried out. Reversal of an impairment loss is only done if the reason for the original recognition of the impairment
no longer exists.
Leasing contracts
Financial leasing contracts are accounted for in accordance with IAS 17 - Leases. This requires that:
• the cost of leased assets is recognised in fixed assets and is depreciated on a straight line basis for the estimated
useful life of the asset; there is a corresponding entry for financial payables towards the lessor for an amount
equal to the fair value of the leased asset;
• lease payments are recognised in such a way as to separate the financial element from the capital element,
considered as repayment of the outstanding liability to the lessor.
Leasing contracts where the lessor retains almost all the risks and rewards of the asset are classed as operating leases and
the lease payments are recognised as an expense in profit or loss over the lease term on a straight line basis.
Intangible assets
Intangible assets are recognised at the cost of acquisition or production. The cost of acquisition is the fair value of the cost
paid for the asset and all other direct costs sustained to bring the asset to working condition.
Other intangible assets, represented by industrial patents, intellectual property rights, concessions, licenses, similar rights,
and software are valued at cost net of accumulated depreciation, calculated on a straight line basis, for the estimated length
of their useful life, five years, barring any significant impairment. The criteria for depreciation, useful life and residual
value are examined and measured at least as often as the end of each reporting period in order to take account of any
significant changes, as required by IAS 38 – Intangible Assets.
Investments in subsidiaries and associates
Subsidiaries are those companies in which TREVI – Finanziaria Industriale S.p.A. has the independent power to exercise
control over the management of the company and to obtain the benefits of its activities. Control is presumed to exist when
the Company holds, directly and indirectly, the majority of the voting rights exercisable in an ordinary shareholders’
meeting, including any potential voting rights deriving from convertible instruments.
Associate companies are those in which TREVI – Finanziaria Industriale S.p.A. exercises significant influence over the
management of the company but where it does not have operating control, including any potential voting rights deriving
from convertible instruments; it is deemed to have significant influence when TREVI – Finanziaria Industriale S.p.A.
holds, directly and indirectly, more than 20% of the voting rights exercisable in an ordinary shareholders’ meeting.
Investments in subsidiaries and associates are valued at acquisition cost reduced by capital distribution or capital reserves
or for impairment following impairment tests. The figures are reversed in subsequent financial years if the reasons for the
impairment no longer exist.
The carrying value of these investments is subject to impairments tests when there is any evidence that the carrying value
may not be recoverable.
Investments in other entities
11
Investments in other smaller entities for which no market values are available are recognised at cost less any eventual
impairment.
Impairment of assets
An asset is impaired when its carrying value is greater than its recoverable amount. At the end of each reporting period the
presence of any evidence that assets may be impaired is assessed. If there is any such evidence, the recoverable amounts are
calculated and any eventual impairment losses recognised in the accounts. For assets not yet available for use and assets
recognised during the current financial year, the impairment test is carried out at least annually independent of the presence
of any indications of impairment.
Financial assets and liabilities
Financial assets are classified as follows:
• Financial assets at fair value through profit or loss: financial assets acquired primarily with the intention of
generating a profit from short-term (not more than three months) price fluctuations or assets designated as such on
initial recognition;
• Held-to-maturity investments: investments in financial assets with fixed maturities and determinable or fixed
payments which the Company has the intention and capacity to hold to maturity;
• Loans and receivables: financial assets with fixed maturities and determinable or fixed payments, not listed on
active markets and different from those designated from initial recognition as financial assets at fair value through
profit and loss or as available for sale financial assets;
• Available-for-sale financial assets: financial assets other than those in the preceding paragraphs or those
designated as such on initial recognition.
The Company decides the designation of the financial assets at the moment of purchase; the initial recognition is the fair
value at the purchase date, including transaction costs; for purchase or sale date, the settlement date of the transaction is
intended.
After initial recognition, the financial assets at fair value through profit and loss and the available-for-sale financial assets
are measured at fair value; the held-to-maturity investments, as well as loans receivable and other financial receivables, are
measured at amortised cost using the effective interest method as required by IAS 39 – Financial Instruments: Recognition
and Measurement.
The gains and losses deriving from changes in fair value of the financial assets at fair value through profit and loss are
recognised in profit or loss. The unrealised gains and losses deriving from changes in the fair value of available for sale
financial assets are recognised in equity.
The fair value of financial assets is measured on the basis of listed offer prices or financial models. The fair value of
unlisted financial assets is estimated using valuation techniques appropriate to the characteristics of the issuer. Financial
assets for which the current value cannot be reliably determined are accounted for at cost less impairment
At the end of each reporting period the presence of any indications that assets may be impaired is assessed and any losses
are recognised in profit or loss.
Financial liabilities are initially recognised at the fair value of the sums raised, net of transaction costs, and subsequently
valued at amortised cost.
Trade receivables, financial receivables and other non-current financial assets
Receivables and other non-current financial assets are initially recognised at fair value and subsequently at amortised cost.
12
Single financial assets or groups of financial assets are regularly subject to impairment test to ascertain if there is any
objective evidence of impairment. If there is any indication of impairment it is recognised in profit or loss for the period.
Trade receivables and other current assets
Receivables due within the credit terms or which carry interest at market rates are not discounted but are recognised at
nominal value net of a provision for doubtful receivables so that their value is in line with their estimated realisable value.
Receivables are recognised at their estimated realisable value: this value approximates to amortised cost. If this is expressed
in foreign currency, it is translated at the exchange rate prevailing at the end of the reporting period.
This entry also includes the share of costs and revenues spread over two or more financial years to reflect the time
proportion principle correctly.
Receivable sales with recourse and those without recourse, which under IAS 39 do not qualify to be excluded from assets
because the relative risks and benefits have not substantially been transferred, remain in the Statement of Financial Position
of the Company even if they have been legally transferred.
Cash and cash equivalents
Cash and cash equivalents are cash, bank current accounts, and highly liquid current financial investments (with an original
maturity of no more than one, two or three months), easily convertible into considerable sums of cash and subject to no
significant variation from fair value.
Cash and cash equivalents are recognised at fair value.
For the Statement of Cash Flows, cash and cash equivalents comprise cash, bank current accounts, and other highly liquid
short-term financial assets with an original maturity of no more than three months, net of bank current account overdrafts.
The latter are included as financial payables in current payables in the Statement of Financial Position.
Shareholders’ equity
• Share capital
This entry is the subscribed and fully paid-up share capital; it is shown at nominal value. The acquisition of treasury stock,
valued at the consideration paid, including any related costs, is recognised as a change in equity and the nominal value of
the treasury stock is deducted from equity whilst the difference between the purchase cost and the nominal value of the
treasury stock is deducted from reserves.
• Treasury shares
Treasury shares are recognised in a specific reserve for the difference between the acquisition cost and the nominal value
deducted from equity. No gain/(loss) is recognised in profit or loss for the purchase, sale, issue or cancellation of treasury
shares.
• Fair value reserve
This entry includes changes in fair value, net of taxes, of items accounted at fair value recognised in equity.
• Other reserves
These comprise capital reserves with a specific destination: the legal reserve, the extraordinary reserve, and the bond
conversion reserve.
• Retained earnings (losses)including the profit (loss) for the period
This includes the part of the financial results of prior years that has not been distributed or taken to reserves and movements
from other equity reserves when the restrictions on these no longer exist. The result for the year is also included in this
entry.
13
Non-current and current financing
This is initially recognised at cost which at the date the financing is received is the fair value of the amount received net of
any transaction costs. Subsequently, financing is valued at amortised cost using the effective interest method.
Employee benefits
Defined benefit plans
The Company pays indemnities on termination of employment to its employees (TFR - staff termination indemnities).
These benefits fall into the category of defined benefits, verifiable as to their existence and quantifiable as regards the
amount payable but uncertain as to when payment will be required. In accordance with IAS 19, the liability is valued using
the projected unit credit method and calculated by independent actuaries. This method calculates the present value of the
defined benefit obligation that an employee will receive at the estimated date when the service rendered by the employee
ceases using actuarial assumptions (e.g. the mortality rate, the turnover rate of personnel) and financial assumptions (e.g.
the discount rate). The present value of the defined benefit obligation is calculated annually by an external, independent
actuary. Actuarial gains and losses are recognised in full in profit or loss in the year in which they are realised. The
Company has not used the so-called corridor method for recognising actuarial gains and losses.
Since 1 January 2007, the Finance Law and other enacted decrees have introduced changes to the rules governing the TFR.
In particular, the employee may choose whether to invest new TFR flows in a pension fund or leave them within the
Company.
A discount rate calculated on a basket of A-rated corporate bonds (iBoxx Eurozone Corporates A 10+ index) was used for
the actuarial calculations as recommended by the Association of Actuaries at 31 December 2016. At 31 December 2015,
the calculation used the iBoxx Eurozone Corporates AA 7 – 10 index.
Provision for risks and charges and assets and liabilities
The provision for risk and charges is for probable liabilities of uncertain amount and/or timing deriving from past events
where meeting the obligation would entail the use of financial resources. Provisions are made exclusively for an existing
obligation, legal or implicit, which requires the use of financial resources and if a reliable estimate of the obligation can be
made. The amount taken as a provision is the best estimate of the necessary cost to meet the obligation at the end of the
reporting period. The provisions made are reassessed at each end of the reporting period and adjusted to the best current
estimate.
Where the financial cost related to the obligation is deferred beyond the normal payment date and the effect of calculating
the net present value is significant, the amount of the provision is the current value of the future expected payments
required to meet the obligation.
Potential assets and liabilities are not recognised in the Statement of Financial Position; however, information is given on
those of a material amount.
Derivative instruments
The Company has adopted a Group Risk Policy. Recognition of changes in fair value differs according to the designation of
the derivative instrument (held for trading or hedge) and the nature of the risk covered (Fair Value Hedge or Cash Flow
Hedge).
For those contracts designated as held for trading, changes in fair value are recognised directly in profit or loss.
For those contracts like a Fair Value Hedge, changes in fair value of the hedging instrument and of the hedged item are
recognised in profit or loss, irrespective of the valuation criteria adopted for the latter.
For Cash Flow Hedges, changes in fair value are recognised directly in equity if the hedging instrument is held to be an
14
effective hedge whilst the portion held to be ineffective is recognised in profit or loss. The changes recognised in equity are
recycled to profit or loss in the same financial period or periods in which the hedged asset or liability affects profit or loss.
Purchase or sale of derivative instruments is recognised at the transaction date.
Revenues and expenses
Revenues are recognised at fair value for the amounts received or expected. Revenues are accounted for to the extent that
the economic benefits are probable and the relative amount, including any related expenses or future expenses, can be
reliably estimated.
Revenues deriving from the sale of an asset are recognised upon transfer of the risks of ownership, normally at the time of
shipping, at the fair value of the amounts received or expected, including any eventual discounts.
Revenues from services are recognised according to the percentage of completion, based on the work carried out.
Expenses are recognised on a similar basis to revenues and always recognised on a time-proportion basis.
Financial income and expenses are recognised in profit or loss on a time-proportion basis and using the effective interest
method.
Dividends are recognised in the financial year when the shareholders have the right to receive the payment.
Taxes
Taxes on profit for the year are calculated as the amount expected to be paid under the enacted tax laws.
Deferred and pre-paid taxes are calculated for the temporary differences between the carrying amounts in the Statement of
Financial Position and the corresponding tax base values and for the amount carried forward of unused tax losses or tax
credits, as long as it is probable that repayment (payment) reduces (increases) the future tax payments compared to the
amount which would have been attested if that repayment (payment) had had no fiscal implications. The fiscal effects of
operations or transactions are recognised either in profit or loss or directly in equity in the same way as the operations or
transactions that gave rise to the tax charge are recognised. Taxes not linked to profit are recognised in other operating
expenses.
From the 2006 financial year to the date of the present Report and renewable every three years, TREVI - Finanziaria
Industriale S.p.A. and almost all its directly and indirectly controlled Italian subsidiaries have chosen to opt for the National
Group Tax Regime under the provisions of Articles 117/129 of the Income Tax Consolidation Act (T.U.I.R.).
TREVI - Finanziaria Industriale S.p.A. acts as the consolidating company and calculates the taxable amount for the group
of companies that opted for the Group Tax Regime; these companies benefit from the possibility of offsetting taxable
income with tax losses carried forward in a single declaration. Each company under the National Group Tax Regime
transfers to the consolidating company the taxable amount (taxable income or tax losses). TREVI - Finanziaria Industriale
S.p.A. recognises a receivable for those companies that have taxable income, which is equal to the amount of IRES to be
paid. For those companies with tax losses, TREVI – Finanziaria Industriale S.p.A. recognises a payable equal to the IRES
amount for the loss, which is offset at the Group level.
Currency
The Financial Statements are prepared in Euro, which is the functional currency of the Parent Company.
Transactions in foreign currency are translated into the functional currency at the exchange rate of the day of the
transaction. Exchange rate gains or losses, deriving from the settlement of these transactions and from the conversion at the
end of the reporting period of financial receivables and payables expressed in foreign currencies, are recognised in profit or
loss.
15
Use of estimates
The preparation of the Consolidated Financial Statements requires Management to apply accounting principles and
methodologies that, in some cases, employ complex and subjective valuations and estimates. These are based on past
experience and assumptions, which are always considered reasonable and realistic given the information available at the
time. In accordance with the joint document of the Bank of Italy/Consob/Isvap No. 2 of 6 February 2009, it is declared that
estimates are based on the most recent information available to management at the time the Financial Statements were
prepared and are not detrimental to the reliability of the Financial Statements.
Use of these estimates and assumptions affects the figures in the Financial Statements - the Statement of Financial Position,
the Income Statement and the Statement of Cash Flows - as well as those given as additional information. Actual results
may differ from these estimates given the uncertainty surrounding the assumptions and conditions on which the estimates
are based.
Listed below are the items of the Financial Statements requiring the greatest degree of subjectivity on the part of
Management in establishing estimates and, for which any change in the conditions underlying the assumptions made,
would have a significant impact on the Consolidated Financial Statements of the Group:
• Impairment of fixed assets;
• Contract work in progress;
• Development costs;
• Deferred tax assets;
• Provisions for doubtful receivables;
• Employee benefits;
• Provisions for risks and charges.
Estimates and assumptions are reviewed periodically and the effects of any changes are recognised in profit or loss in the
period in which the change occurred.
Consolidated Financial Statements
The present Financial Statements, the Consolidated Financial Statements, the Directors’ Report on Operations, the Report
on Corporate Governance and on the Company’s Ownership Structure, the Report on Remuneration and the reports of the
audit firm will be deposited at the registered office of the Company and will be publicly available on the Company website,
www.trevifin.com, at Borsa Italiana S.p.A. and at the Business Registry under the terms prescribed by law.
Accounting standards, amendments and interpretations applied from 1 January 2016 or early application thereof
From the start of 2016, the Company and the Group have applied the following new accounting standards, amendments and
interpretations reviewed by the IASB:
The criteria used to prepare the Statutory Financial Statements are consistent with those used to prepare the Statutory
Financial Statements of the previous financial year, except for the new standards or interpretations that are specified below
that are applicable from 1 January 2016.
the company and the Group have not chosen early application of any standards, amendments or improvements issued for
which application is not yet mandatory.
New IFRSs, amendments and improvements applicable from 1 January 2016
16
Some amendments were made to existing Standards in order to clarify certain points:
› Amendments to IFRS 10, IFRS 12 and IAS 28 – Investment Entities: Applying the Consolidation Exception. The
amendments clarify that the exemption from preparing consolidated financial statements is available to a parent entity that
is a subsidiary of an investment entity even if the investment entity measures all of its subsidiaries at fair value. The
amendments to IFRS 10 also state that a subsidiary that provides services related to the activities of the investment should
not be consolidated if the subsidiary itself is an investment entity. All the other subsidiaries of an investment entity are
measured at fair value.
› Amendments to IFRS 11 – Joint Arrangements. The amendment clarifies that where a joint operator acquires an
interest in a joint operation in which the activity of the joint operation constitutes a business, it must apply all of the
principles on business combinations accounting as set out in IFRS 3 - Business Combinations, and other standards that do
not conflict with the guidance in IFRS 11.
› Amendments to IAS 16 – Property, Plant and Equipment and IAS 38 – Intangible Assets on acceptable methods
of depreciation and amortisation. The amendment clarifies the meaning of the term consumption of the expected future
economic benefits embodied in an asset when determining the appropriate amortisation method for that asset. A revenue-
based method is not considered to be an appropriate manifestation of consumption when revenue reflects a pattern of
economic benefits that are generated from operating a business (of which the asset is part) rather than the economic
benefits that are consumed through use of the asset. It may only be used in very limited circumstances to amortise
intangible assets.
› Amendments to IAS 16 - Property, Plant and Equipment and IAS 41 – Agriculture: Bearer Plants. The
amendments include biological assets that meet the definition of bearer plants (e.g. fruit trees) that will be subject to all the
recognition and measurement requirements in IAS 16 while agricultural produce growing on bearer plants (e.g. fruit
growing on a tree) will remain within the scope of IAS 41.
› Amendments to IAS 27 – Equity Method in Separate Financial Statements. The amendments eliminate a
difference for countries where regulations require entities to present separate financial statements using the equity method
to account for investments in subsidiaries, associates and joint ventures and allow an entity to use the equity method to
account for these investments (IAS 27 amended) or to account for these investments at cost in accordance with IAS 39 or
with the new IFRS 9. The same accounting must be applied to each category of investment.
› Amendments to IAS 1 – Presentation of Financial Statements. The amendments clarify the materiality
requirements in IAS 1 and that specific line items in the statement(s) of profit or loss and OCI and the statement of
financial position may be disaggregated. It also clarifies that the share of OCI of associates and joint ventures accounted
for using the equity method must be presented in aggregate as a single line item and classified between those items that will
or will not be subsequently reclassified to profit or loss.
Adoption of the new standards and amendments described above had no impact on the Statutory Financial Statements.
New accounting standards and amendments not yet applied or early adopted by the Group
The Company and the Group are assessing these standards and amendments to ascertain what impact they would have on
the Financial Statements but has not chosen early adoption of these amendments. The changes are summarised below.
IFRS 15 – Revenue from Contracts with Customers (effective for annual periods beginning on or after 1 January 2018). The
new standard replaces all existing revenue requirements in IAS 11 – Construction Contracts, IAS 18 – Revenue, IFRIC 13
– Customer Loyalty Programmes, IFRIC 15 – Agreements for the Construction of Real Estate, IFRIC 18 – Transfers of
Assets from Customers and SIC 31 – Revenue – Barter Transactions Involving Advertising Services. The standard outlines
17
the principles an entity must apply to measure and recognise revenue from non-financial assets, including gains and losses
on disposal of certain non-financial assets, including property, plant and equipment and intangible assets. The core
principle is that an entity will recognise revenue at an amount that reflects the consideration to which the entity expects to
be entitled in exchange for transferring goods or services to a customer. Guidelines are given to identify a contract with a
customer, the performance obligations in the contract and the transaction price and on how to recognise revenue when the
entity satisfies a performance obligation. It also provides guidance on the allocation of the transaction price in contracts
with multiple performance obligations. The standard also specifies how to account for the incremental costs of obtaining a
contract and the costs directly related to fulfilling a contract. Application guidance is also given on certain specific areas
that include licences, warranties, rights of return, principle-versus-agent considerations and contract resolutions. The
standard must be applied in full to the current period and either in full to prior periods using a full retrospective or a
modified retrospective approach. In April 2016, the IASB published certain amendments to IFRS 15 that included
clarifications on its application that must also be applied from 1 January 2018.
IFRS 9 – Financial Instruments (effective for annual periods beginning on or after 1 January 2018). The new standard aims
to make it easier for users of the accounts to understand the amount, timing and uncertainty of future cash flows and
replaces the classes of financial instruments under IAS 39 – Financial Instruments: Recognition and Measurement. All
financial instruments are initially measured at fair value plus or minus, in the case of a financial asset or a financial liability
not at fair value through profit or loss (FVTPL), transaction costs. However, certain trade receivables without a material
financial component are initially measured at transaction price under the new standard IFRS 15 - Revenue from Contracts
with Customers. Debt instruments are subsequently measured on the basis of their contractual cash flows and the business
model under which the debt instruments are held. If a financial asset gives rise to cash flows that are solely payments of
principle and interest it qualifies for amortised cost accounting while if it gives rise to an exchange of financial assets in
addition to cash flows it is recognised at fair value in OCI, and subsequently recycled to profit or loss (FVOCI). Lastly
there is also an option to designate a financial instrument as measured at fair value through profit or loss on initial
recognition (FVO). Equity instruments are generally measured at FVTPL. However, entities have an irrevocable option on
an instrument-by-instrument basis to present changes in the fair value of non-trading instruments in other comprehensive
income (FVOTCI). All other IAS 39 – Financial Instruments: Recognition and Measurement classification and
measurement requirements have been carried forward into IFRS 9.
The impairment requirements are based on an expected credit loss (ECL) model that replaces the IAS 39 incurred loss
model. Lastly, changes have been introduced to hedge accounting. Hedge effectiveness testing is prospective and will often
be qualitative if the risk component is designated as the hedged item and is separately identifiable and reliably measurable.
IFRS 16 – Leases (effective for annual periods beginning on or after 1 January 2019). The scope of IFRS 16 includes leases
of all assets, with certain exceptions. A lease is defined as a contract that conveys the right to use an asset (the underlying
asset) for a period of time in exchange for consideration. IFRS 16 requires lessees to account for all leases under a single
on-balance sheet model in a similar way to finance leases under IAS 17 except for leases of “low value” assets (e.g.
personal computers) and short-term leases (i.e. leases with a lease term of 12 months or less). At the commencement date
of a lease, a lessee will recognise a liability to make lease payments and an asset representing the right to use the
underlying asset during the lease term. Lessees are required to recognise separately the interest expense on the lease
liability and the depreciation expense on the right-of-use asset. Lessees will be required to remeasure the lease liability
upon the occurrence of certain events (e.g. a change in the lease term or a change in future lease payments resulting in a
change in an index or rate used to determine those payments) and the amount of remeasurement is taken as an adjustment
to the right-of-use asset. Lessor accounting is substantially unchanged from the current accounting under IAS 17 - Leases.
18
Application of the standard may be done using a full retrospective or a modified retrospective approach and early
application is permitted but not before an entity applies IFRS 15.
New accounting standards and amendments not yet applied or early adopted by Company and the Group
Amendments to already existing accounting standards have been issued that are effective for annual periods beginning on
or after 1 January 2017 or subsequent financial periods:
› Amendments to IAS 7 – Statement of Cash Flows. The amendment requires entities to provide disclosures about
changes in their liabilities arising from financing activities, including both changes arising from cash flows and non-cash
changes (such as foreign exchange gains or losses).
› Amendments to IAS 12 – Recognition of Deferred Tax Assets for Unrealised Losses. The amendments clarify that
an entity needs to consider whether the tax law restricts the sources of taxable profits against which it may make deductions
on the reversal of that deductible temporary difference. Furthermore, the amendments provide guidance on how an entity
should determine future taxable profits and explain the circumstances in which taxable profit may include the recovery of
some assets for more than their carrying amount.
› Amendments to IFRS 2 – Classification and Measurement of Share-based Payment Transactions. The
amendments clarify the effects of vesting conditions on the settlement of a cash-settled share-based transaction. They also
clarify the classification of a share-based payment transaction with net settlement features for withholding tax obligations.
Lastly, they outline the accounting where a modification to the terms and conditions of a share-based payment transaction
changes its classification from cash-settled to equity-settled.
› Amendments to IFRS 4 – Insurance Contracts. The amendments address concerns arising from implementing the
new financial instruments standard IFRS 9 before implementing the new insurance contracts standard that will replace
IFRS 4. The amendments introduce two options for entities issuing insurance contracts: a temporary exemption for
applying IFRS 9 and an overlay approach.
› Amendments to IAS 40 – Investment property. The amendments clarify when assets, including property under
construction or development, should be transferred to, or from, investment properties. A change in use must be supported
by evidence and stipulate that a change in intention by management is not enough to support a transfer.
The Annual Improvements to IFRSs is the process used by the IASB to make amendments or improvements to existing
IFRSs, encouraging a constant review of accounting policies by entities using IASs.
In 2014 the IASB published a series of amendments to IFRS (Improvements to IFRSs 2012-2014 Cycle, which followed the
2009-2011, 2010-2012 and 2011-2013 Cycles). These improvements regarded changes in methods of disposal under IFRS
5 – Non-current Assets Held for Sale and Discontinued Operations; the applicability of IFRS 7 – Financial Instruments:
Disclosures to condensed interim financial statements; the use of discount rates under IAS 19 – Employee Benefits; and the
disclosure of information “elsewhere in the interim financial report” under IAS 34 – Interim Financial Reporting. The
amendments introduced are effective for annual periods beginning on or after 1 January 2016.
The most recent cycle of improvements published in December 2016 deleted the short-term exemptions for first time
adopters of IFRS 1 – First-time Adoption of International Financial Reporting Standards; the measurement at fair value
through profit or loss under IAS 28 – Investments in Associates and Joint Ventures; and provided clarification on the scope
of the disclosure requirements under IFRS 12 – Disclosure of Interests in Other Entities. The amendments to IFRS 1 and
IAS 28 are effective for annual periods beginning on or after 1 January 2018 and the amendment to IFRS 12 is effective for
annual periods beginning on or after 1 January 2017.

19
The Group is evaluating the impact of the amendments and interpretations to the accounting standards that have been
approved but have not been applied early or are in the process of being approved by the European Union. The Group has
already begun to assess the possible impact of the application of the new accounting standards IFRS 9 – Financial
Instruments, IFRS 15 - Revenue from Contracts with Customers and IFRS 16 -Leases on its economic, financial and capital
position and on the disclosure required in the Consolidated Financial Statements.
20
Direction and Coordination
In compliance with Article 93 of the Consolidated Finance Law it is declared that at 31 December 2015 and at the date of
these Financial Statements, TREVI – Finanziaria Industriale S.p.A. is indirectly controlled by I.F.I.T. S.r.l. (a company
with its registered office in Cesena) and directly controlled by the Italian company Trevi Holding SE, a company
controlled by I.F.I.T. S.r.l..
In accordance with the corporate information required under Article 2497 of the Italian Civil Code, regarding direction and
coordination exercised by controlling companies, it is stated that, at 31 December 2016 and at the date of these Financial
Statements, the Company has made no declaration regarding any eventual direction or coordination by controlling
companies as the Board of Directors of TREVI – Finanziaria Industriale S.p.A. maintains that, whilst IFIT S.r.l. indirectly
controls the policies and strategies of TREVI Group, the Company is completely independent of its controlling company
as regards its financial and operating activities and did not carry out any corporate transaction in the interests of the
controlling company in 2016 or in prior financial years.
At the date of these Financial Statements, the Company is the Parent Company of the TREVI Group (and as such prepares
the Consolidated Financial Statements of the Group), and exercises, pursuant to Article 2497 of the Italian Civil Code,
direction and coordination of the companies it directly controls:
• Trevi S.p.A. with a direct shareholding of 99.78%;
• Soilmec S.p.A. with a direct shareholding of 99.92%;
• Drillmec S.p.A. with a direct shareholding of 98.25% (1.75% held by Soilmec S.p.A.);
• Petreven S.p.A. with a direct shareholding of 78,38% (21.62% held by Trevi S.p.A.) ;
• R.C.T. S.r.l. with an indirect shareholding of 99.78% (100% held by Trevi S.p.A.);
• Trevi Energy S.p.A with 100% as a single shareholder company;
• PSM S.p.A with an indirect shareholding of 99.95% (70% held by Soilmec S.p.A and 30% by Drillmec S.p.A.);
• Immobiliare SIAB S.r.l. with 100 % as a single shareholder company.
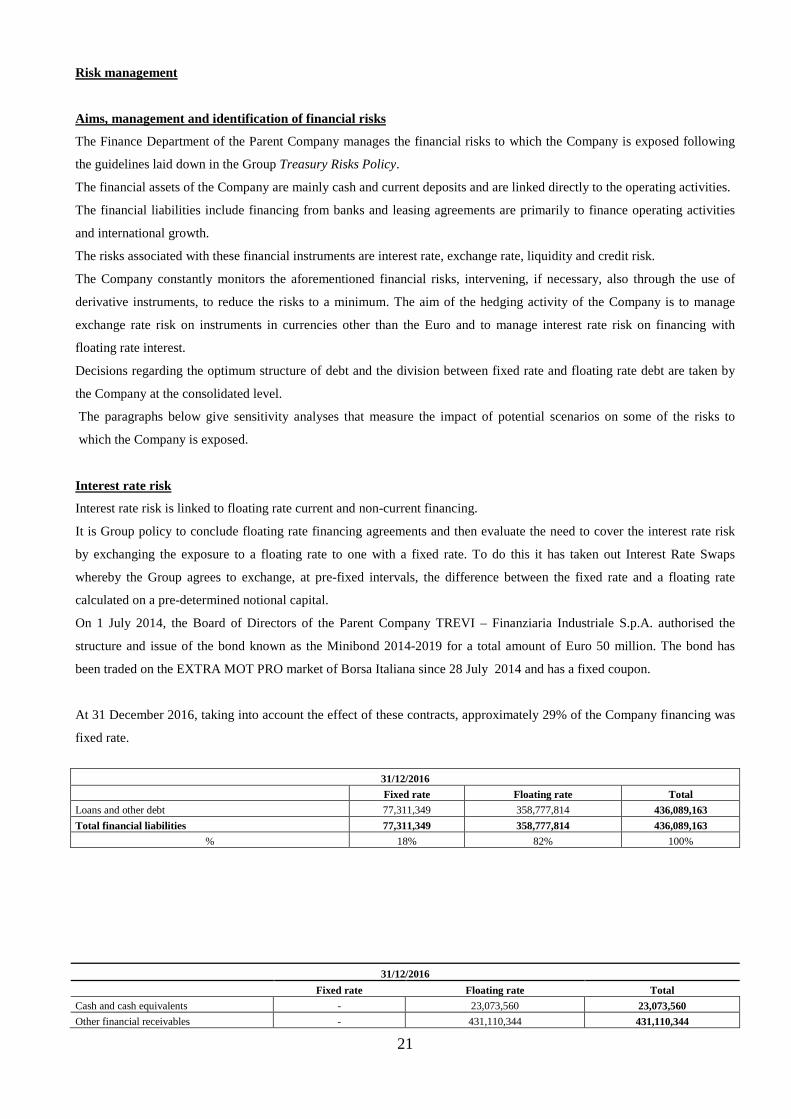
21
Risk management
Aims, management and identification of financial risks
The Finance Department of the Parent Company manages the financial risks to which the Company is exposed following
the guidelines laid down in the Group Treasury Risks Policy.
The financial assets of the Company are mainly cash and current deposits and are linked directly to the operating activities.
The financial liabilities include financing from banks and leasing agreements are primarily to finance operating activities
and international growth.
The risks associated with these financial instruments are interest rate, exchange rate, liquidity and credit risk.
The Company constantly monitors the aforementioned financial risks, intervening, if necessary, also through the use of
derivative instruments, to reduce the risks to a minimum. The aim of the hedging activity of the Company is to manage
exchange rate risk on instruments in currencies other than the Euro and to manage interest rate risk on financing with
floating rate interest.
Decisions regarding the optimum structure of debt and the division between fixed rate and floating rate debt are taken by
the Company at the consolidated level.
The paragraphs below give sensitivity analyses that measure the impact of potential scenarios on some of the risks to
which the Company is exposed.
Interest rate risk
Interest rate risk is linked to floating rate current and non-current financing.
It is Group policy to conclude floating rate financing agreements and then evaluate the need to cover the interest rate risk
by exchanging the exposure to a floating rate to one with a fixed rate. To do this it has taken out Interest Rate Swaps
whereby the Group agrees to exchange, at pre-fixed intervals, the difference between the fixed rate and a floating rate
calculated on a pre-determined notional capital.
On 1 July 2014, the Board of Directors of the Parent Company TREVI – Finanziaria Industriale S.p.A. authorised the
structure and issue of the bond known as the Minibond 2014-2019 for a total amount of Euro 50 million. The bond has
been traded on the EXTRA MOT PRO market of Borsa Italiana since 28 July 2014 and has a fixed coupon.
At 31 December 2016, taking into account the effect of these contracts, approximately 29% of the Company financing was
fixed rate.
31/12/2016
Fixed rate Floating rate Total
Loans and other debt 77,311,349 358,777,814 436,089,163
Total financial liabilities 77,311,349 358,777,814 436,089,163
% 18% 82% 100%
31/12/2016
Fixed rate Floating rate Total
Cash and cash equivalents - 23,073,560 23,073,560
Other financial receivables - 431,110,344 431,110,344
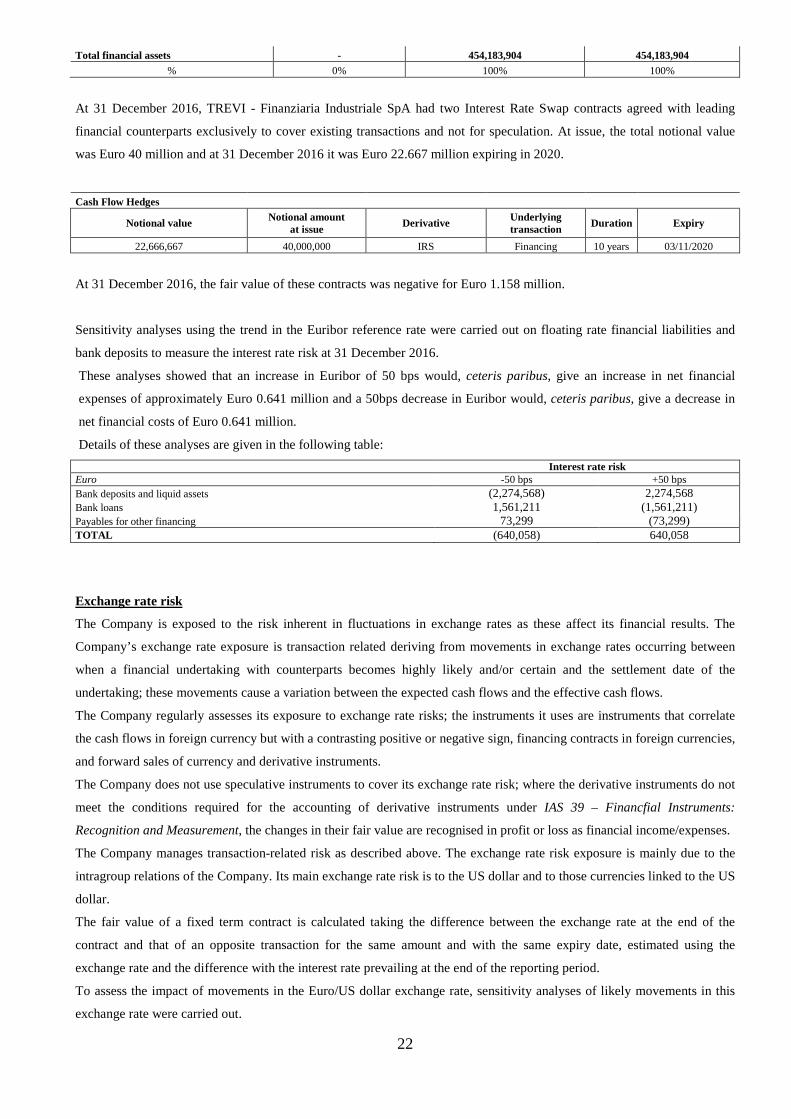
22
Total financial assets - 454,183,904 454,183,904 % 0% 100% 100%
At 31 December 2016, TREVI - Finanziaria Industriale SpA had two Interest Rate Swap contracts agreed with leading
financial counterparts exclusively to cover existing transactions and not for speculation. At issue, the total notional value
was Euro 40 million and at 31 December 2016 it was Euro 22.667 million expiring in 2020.
Cash Flow Hedges
Notional value Notional amount at issue
Derivative Underlying transaction
Duration Expiry
22,666,667 40,000,000 IRS Financing 10 years 03/11/2020
At 31 December 2016, the fair value of these contracts was negative for Euro 1.158 million.
Sensitivity analyses using the trend in the Euribor reference rate were carried out on floating rate financial liabilities and
bank deposits to measure the interest rate risk at 31 December 2016.
These analyses showed that an increase in Euribor of 50 bps would, ceteris paribus, give an increase in net financial
expenses of approximately Euro 0.641 million and a 50bps decrease in Euribor would, ceteris paribus, give a decrease in
net financial costs of Euro 0.641 million.
Details of these analyses are given in the following table:
Interest rate risk Euro -50 bps +50 bps Bank deposits and liquid assets (2,274,568) 2,274,568 Bank loans 1,561,211 (1,561,211) Payables for other financing 73,299 (73,299) TOTAL (640,058) 640,058
Exchange rate risk
The Company is exposed to the risk inherent in fluctuations in exchange rates as these affect its financial results. The
Company’s exchange rate exposure is transaction related deriving from movements in exchange rates occurring between
when a financial undertaking with counterparts becomes highly likely and/or certain and the settlement date of the
undertaking; these movements cause a variation between the expected cash flows and the effective cash flows.
The Company regularly assesses its exposure to exchange rate risks; the instruments it uses are instruments that correlate
the cash flows in foreign currency but with a contrasting positive or negative sign, financing contracts in foreign currencies,
and forward sales of currency and derivative instruments.
The Company does not use speculative instruments to cover its exchange rate risk; where the derivative instruments do not
meet the conditions required for the accounting of derivative instruments under IAS 39 – Financfial Instruments:
Recognition and Measurement, the changes in their fair value are recognised in profit or loss as financial income/expenses.
The Company manages transaction-related risk as described above. The exchange rate risk exposure is mainly due to the
intragroup relations of the Company. Its main exchange rate risk is to the US dollar and to those currencies linked to the US
dollar.
The fair value of a fixed term contract is calculated taking the difference between the exchange rate at the end of the
contract and that of an opposite transaction for the same amount and with the same expiry date, estimated using the
exchange rate and the difference with the interest rate prevailing at the end of the reporting period.
To assess the impact of movements in the Euro/US dollar exchange rate, sensitivity analyses of likely movements in this
exchange rate were carried out.
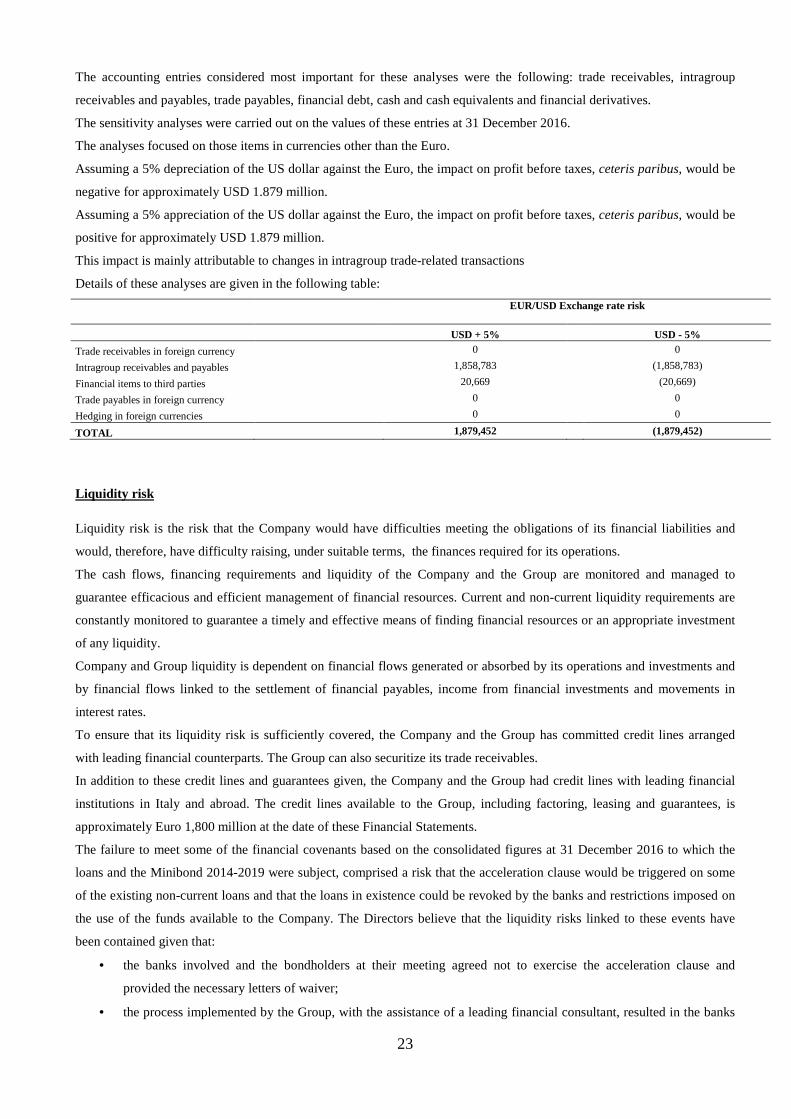
23
The accounting entries considered most important for these analyses were the following: trade receivables, intragroup
receivables and payables, trade payables, financial debt, cash and cash equivalents and financial derivatives.
The sensitivity analyses were carried out on the values of these entries at 31 December 2016.
The analyses focused on those items in currencies other than the Euro.
Assuming a 5% depreciation of the US dollar against the Euro, the impact on profit before taxes, ceteris paribus, would be
negative for approximately USD 1.879 million.
Assuming a 5% appreciation of the US dollar against the Euro, the impact on profit before taxes, ceteris paribus, would be
positive for approximately USD 1.879 million.
This impact is mainly attributable to changes in intragroup trade-related transactions
Details of these analyses are given in the following table:
EUR/USD Exchange rate risk
USD + 5% USD - 5%
Trade receivables in foreign currency 0 0
Intragroup receivables and payables 1,858,783 (1,858,783)
Financial items to third parties 20,669 (20,669)
Trade payables in foreign currency 0 0
Hedging in foreign currencies 0 0
TOTAL 1,879,452 (1,879,452)
Liquidity risk Liquidity risk is the risk that the Company would have difficulties meeting the obligations of its financial liabilities and
would, therefore, have difficulty raising, under suitable terms, the finances required for its operations.
The cash flows, financing requirements and liquidity of the Company and the Group are monitored and managed to
guarantee efficacious and efficient management of financial resources. Current and non-current liquidity requirements are
constantly monitored to guarantee a timely and effective means of finding financial resources or an appropriate investment
of any liquidity.
Company and Group liquidity is dependent on financial flows generated or absorbed by its operations and investments and
by financial flows linked to the settlement of financial payables, income from financial investments and movements in
interest rates.
To ensure that its liquidity risk is sufficiently covered, the Company and the Group has committed credit lines arranged
with leading financial counterparts. The Group can also securitize its trade receivables.
In addition to these credit lines and guarantees given, the Company and the Group had credit lines with leading financial
institutions in Italy and abroad. The credit lines available to the Group, including factoring, leasing and guarantees, is
approximately Euro 1,800 million at the date of these Financial Statements.
The failure to meet some of the financial covenants based on the consolidated figures at 31 December 2016 to which the
loans and the Minibond 2014-2019 were subject, comprised a risk that the acceleration clause would be triggered on some
of the existing non-current loans and that the loans in existence could be revoked by the banks and restrictions imposed on
the use of the funds available to the Company. The Directors believe that the liquidity risks linked to these events have
been contained given that:
• the banks involved and the bondholders at their meeting agreed not to exercise the acceleration clause and
provided the necessary letters of waiver;
• the process implemented by the Group, with the assistance of a leading financial consultant, resulted in the banks
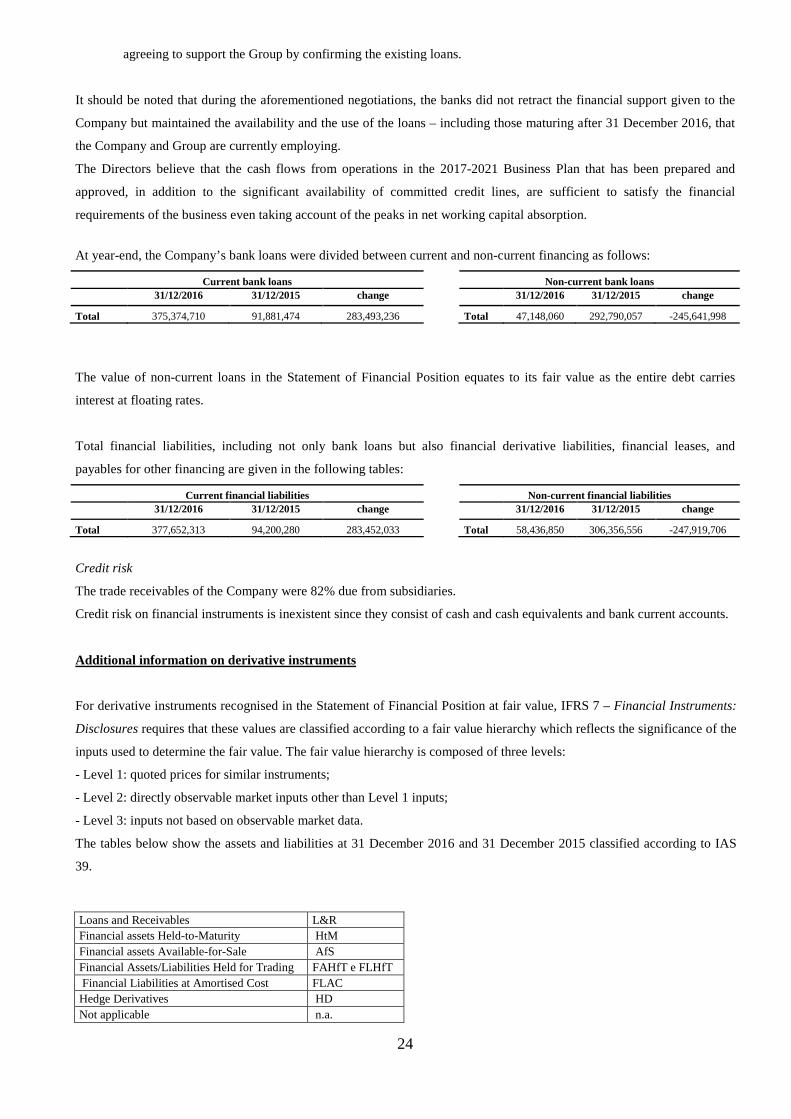
24
agreeing to support the Group by confirming the existing loans.
It should be noted that during the aforementioned negotiations, the banks did not retract the financial support given to the
Company but maintained the availability and the use of the loans – including those maturing after 31 December 2016, that
the Company and Group are currently employing.
The Directors believe that the cash flows from operations in the 2017-2021 Business Plan that has been prepared and
approved, in addition to the significant availability of committed credit lines, are sufficient to satisfy the financial
requirements of the business even taking account of the peaks in net working capital absorption.
At year-end, the Company’s bank loans were divided between current and non-current financing as follows:
Current bank loans Non-current bank loans
31/12/2016 31/12/2015 change 31/12/2016 31/12/2015 change
Total 375,374,710 91,881,474 283,493,236 Total 47,148,060 292,790,057 -245,641,998
The value of non-current loans in the Statement of Financial Position equates to its fair value as the entire debt carries
interest at floating rates.
Total financial liabilities, including not only bank loans but also financial derivative liabilities, financial leases, and
payables for other financing are given in the following tables:
Current financial liabilities Non-current financial liabilities
31/12/2016 31/12/2015 change 31/12/2016 31/12/2015 change
Total 377,652,313 94,200,280 283,452,033 Total 58,436,850 306,356,556 -247,919,706
Credit risk
The trade receivables of the Company were 82% due from subsidiaries.
Credit risk on financial instruments is inexistent since they consist of cash and cash equivalents and bank current accounts.
Additional information on derivative instruments
For derivative instruments recognised in the Statement of Financial Position at fair value, IFRS 7 – Financial Instruments:
Disclosures requires that these values are classified according to a fair value hierarchy which reflects the significance of the
inputs used to determine the fair value. The fair value hierarchy is composed of three levels:
- Level 1: quoted prices for similar instruments;
- Level 2: directly observable market inputs other than Level 1 inputs;
- Level 3: inputs not based on observable market data.
The tables below show the assets and liabilities at 31 December 2016 and 31 December 2015 classified according to IAS
39.
Loans and Receivables L&R Financial assets Held-to-Maturity HtM Financial assets Available-for-Sale AfS Financial Assets/Liabilities Held for Trading FAHfT e FLHfT Financial Liabilities at Amortised Cost FLAC Hedge Derivatives HD Not applicable n.a.
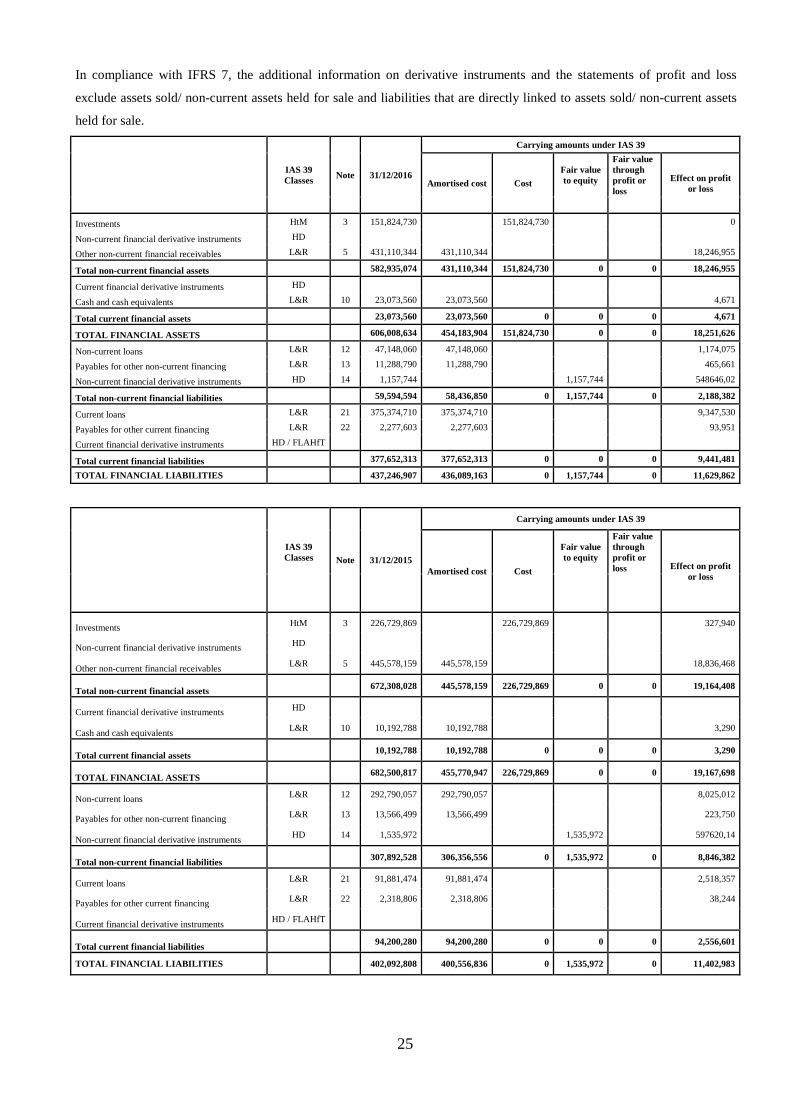
25
In compliance with IFRS 7, the additional information on derivative instruments and the statements of profit and loss
exclude assets sold/ non-current assets held for sale and liabilities that are directly linked to assets sold/ non-current assets
held for sale.
Note 31/12/2016
Carrying amounts under IAS 39
IAS 39 Classes Amortised cost Cost
Fair value to equity
Fair value through profit or loss
Effect on profit or loss
Investments HtM 3 151,824,730 151,824,730 0
Non-current financial derivative instruments HD
Other non-current financial receivables L&R 5 431,110,344 431,110,344 18,246,955
Total non-current financial assets 582,935,074 431,110,344 151,824,730 0 0 18,246,955
Current financial derivative instruments HD
Cash and cash equivalents L&R 10 23,073,560 23,073,560 4,671
Total current financial assets 23,073,560 23,073,560 0 0 0 4,671
TOTAL FINANCIAL ASSETS 606,008,634 454,183,904 151,824,730 0 0 18,251,626
Non-current loans L&R 12 47,148,060 47,148,060 1,174,075
Payables for other non-current financing L&R 13 11,288,790 11,288,790 465,661
Non-current financial derivative instruments HD 14 1,157,744 1,157,744 548646,02
Total non-current financial liabilities 59,594,594 58,436,850 0 1,157,744 0 2,188,382
Current loans L&R 21 375,374,710 375,374,710 9,347,530
Payables for other current financing L&R 22 2,277,603 2,277,603 93,951
Current financial derivative instruments HD / FLAHfT
Total current financial liabilities 377,652,313 377,652,313 0 0 0 9,441,481
TOTAL FINANCIAL LIABILITIES 437,246,907 436,089,163 0 1,157,744 0 11,629,862
Note 31/12/2015
Carrying amounts under IAS 39
IAS 39 Classes
Amortised cost Cost
Fair value to equity
Fair value through profit or loss Effect on profit
or loss
Investments HtM 3 226,729,869 226,729,869 327,940
Non-current financial derivative instruments HD
Other non-current financial receivables L&R 5 445,578,159 445,578,159 18,836,468
Total non-current financial assets 672,308,028 445,578,159 226,729,869 0 0 19,164,408
Current financial derivative instruments HD
Cash and cash equivalents L&R 10 10,192,788 10,192,788 3,290
Total current financial assets 10,192,788 10,192,788 0 0 0 3,290
TOTAL FINANCIAL ASSETS 682,500,817 455,770,947 226,729,869 0 0 19,167,698
Non-current loans L&R 12 292,790,057 292,790,057 8,025,012
Payables for other non-current financing L&R 13 13,566,499 13,566,499 223,750
Non-current financial derivative instruments HD 14 1,535,972 1,535,972 597620,14
Total non-current financial liabilities 307,892,528 306,356,556 0 1,535,972 0 8,846,382
Current loans L&R 21 91,881,474 91,881,474 2,518,357
Payables for other current financing L&R 22 2,318,806 2,318,806 38,244
Current financial derivative instruments HD / FLAHfT
Total current financial liabilities 94,200,280 94,200,280 0 0 0 2,556,601
TOTAL FINANCIAL LIABILITIES 402,092,808 400,556,836 0 1,535,972 0 11,402,983
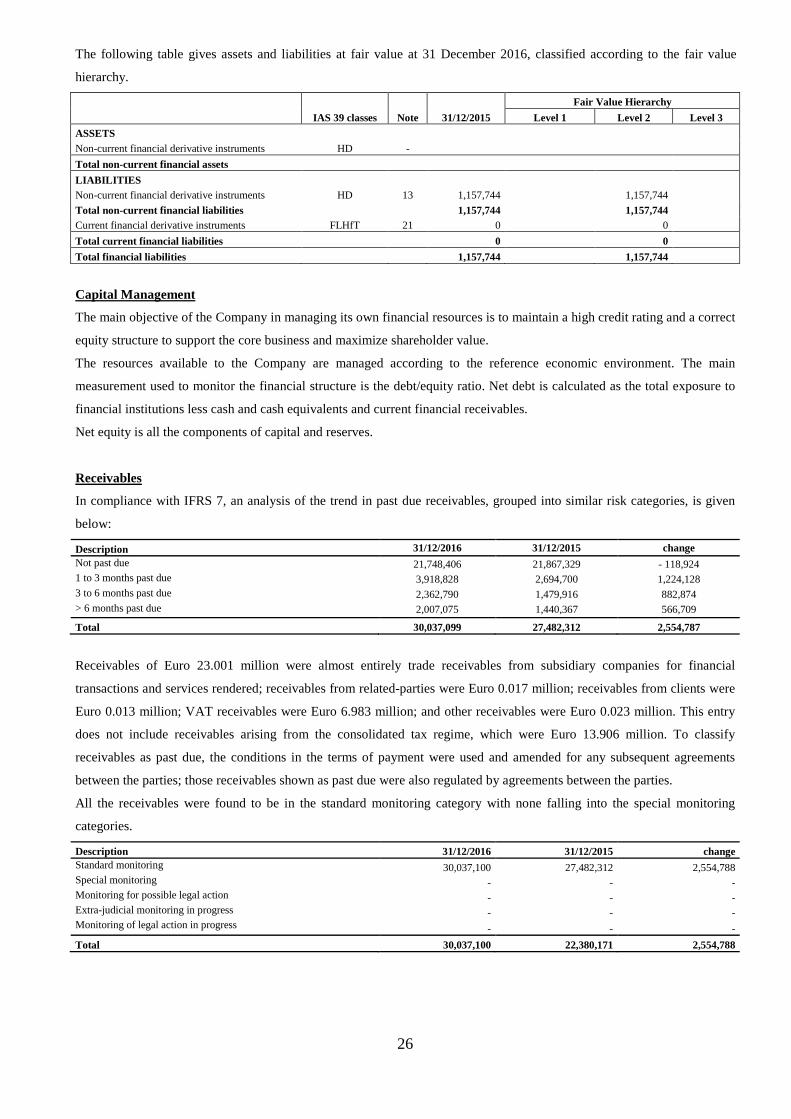
26
The following table gives assets and liabilities at fair value at 31 December 2016, classified according to the fair value
hierarchy.
IAS 39 classes Note 31/12/2015
Fair Value Hierarchy
Level 1 Level 2 Level 3
ASSETS Non-current financial derivative instruments HD -
Total non-current financial assets
LIABILITIES
Non-current financial derivative instruments HD 13 1,157,744 1,157,744
Total non-current financial liabilities 1,157,744 1,157,744 Current financial derivative instruments FLHfT 21 0 0
Total current financial liabilities 0 0
Total financial liabilities 1,157,744 1,157,744
Capital Management
The main objective of the Company in managing its own financial resources is to maintain a high credit rating and a correct
equity structure to support the core business and maximize shareholder value.
The resources available to the Company are managed according to the reference economic environment. The main
measurement used to monitor the financial structure is the debt/equity ratio. Net debt is calculated as the total exposure to
financial institutions less cash and cash equivalents and current financial receivables.
Net equity is all the components of capital and reserves.
Receivables
In compliance with IFRS 7, an analysis of the trend in past due receivables, grouped into similar risk categories, is given
below:
Description 31/12/2016 31/12/2015 change Not past due 21,748,406 21,867,329 - 118,924 1 to 3 months past due 3,918,828 2,694,700 1,224,128 3 to 6 months past due 2,362,790 1,479,916 882,874 > 6 months past due 2,007,075 1,440,367 566,709
Total 30,037,099 27,482,312 2,554,787
Receivables of Euro 23.001 million were almost entirely trade receivables from subsidiary companies for financial
transactions and services rendered; receivables from related-parties were Euro 0.017 million; receivables from clients were
Euro 0.013 million; VAT receivables were Euro 6.983 million; and other receivables were Euro 0.023 million. This entry
does not include receivables arising from the consolidated tax regime, which were Euro 13.906 million. To classify
receivables as past due, the conditions in the terms of payment were used and amended for any subsequent agreements
between the parties; those receivables shown as past due were also regulated by agreements between the parties.
All the receivables were found to be in the standard monitoring category with none falling into the special monitoring
categories.
Description 31/12/2016 31/12/2015 change Standard monitoring 30,037,100 27,482,312 2,554,788 Special monitoring - - - Monitoring for possible legal action - - - Extra-judicial monitoring in progress - - - Monitoring of legal action in progress - - -
Total 30,037,100 22,380,171 2,554,788
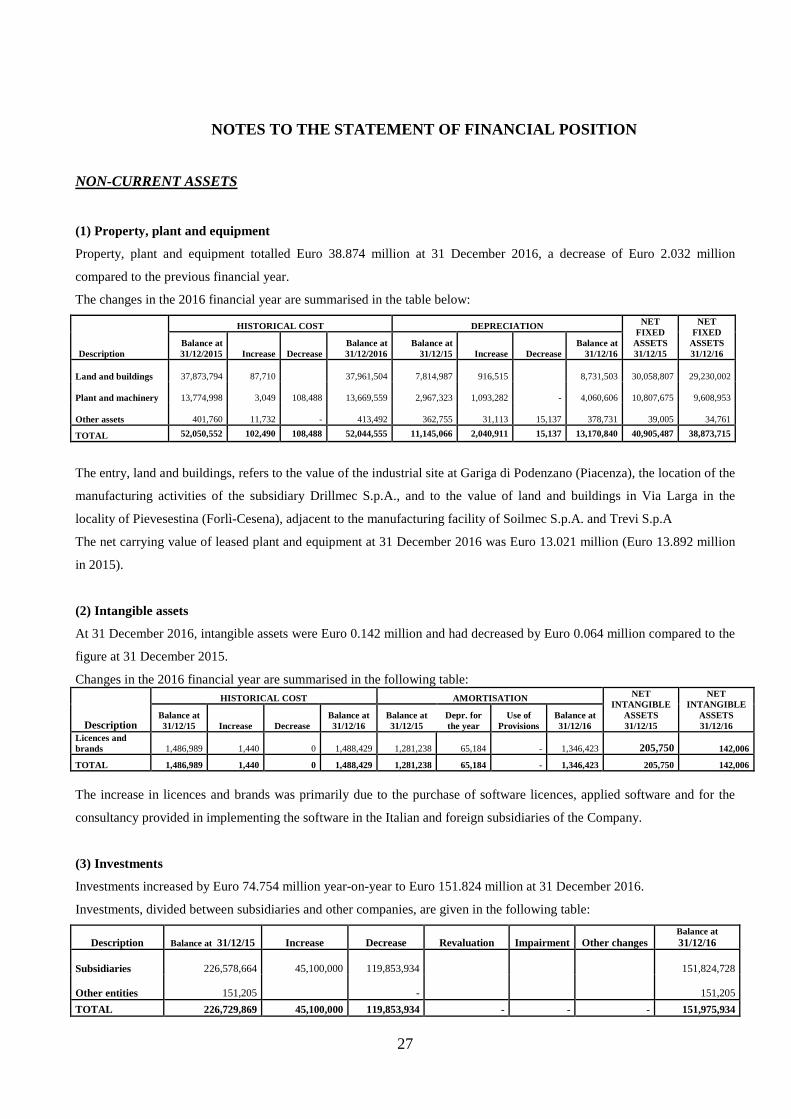
27
NOTES TO THE STATEMENT OF FINANCIAL POSITION
NON-CURRENT ASSETS
(1) Property, plant and equipment
Property, plant and equipment totalled Euro 38.874 million at 31 December 2016, a decrease of Euro 2.032 million
compared to the previous financial year.
The changes in the 2016 financial year are summarised in the table below:
Description
HISTORICAL COST DEPRECIATION NET FIXED
ASSETS 31/12/15
NET FIXED
ASSETS 31/12/16
Balance at 31/12/2015 Increase Decrease
Balance at 31/12/2016
Balance at 31/12/15 Increase Decrease
Balance at 31/12/16
Land and buildings
37,873,794
87,710
37,961,504
7,814,987
916,515
8,731,503
30,058,807
29,230,002
Plant and machinery
13,774,998
3,049
108,488
13,669,559
2,967,323
1,093,282
-
4,060,606
10,807,675
9,608,953
Other assets
401,760
11,732
-
413,492
362,755
31,113
15,137
378,731
39,005
34,761
TOTAL 52,050,552 102,490 108,488 52,044,555 11,145,066 2,040,911 15,137 13,170,840 40,905,487 38,873,715
The entry, land and buildings, refers to the value of the industrial site at Gariga di Podenzano (Piacenza), the location of the
manufacturing activities of the subsidiary Drillmec S.p.A., and to the value of land and buildings in Via Larga in the
locality of Pievesestina (Forlì-Cesena), adjacent to the manufacturing facility of Soilmec S.p.A. and Trevi S.p.A
The net carrying value of leased plant and equipment at 31 December 2016 was Euro 13.021 million (Euro 13.892 million
in 2015).
(2) Intangible assets
At 31 December 2016, intangible assets were Euro 0.142 million and had decreased by Euro 0.064 million compared to the
figure at 31 December 2015.
Changes in the 2016 financial year are summarised in the following table:
Description
HISTORICAL COST AMORTISATION NET INTANGIBLE
ASSETS 31/12/15
NET INTANGIBLE
ASSETS 31/12/16
Balance at 31/12/15 Increase Decrease
Balance at 31/12/16
Balance at 31/12/15
Depr. for the year
Use of Provisions
Balance at 31/12/16
Licences and brands 1,486,989 1,440 0 1,488,429 1,281,238 65,184 - 1,346,423 205,750 142,006
TOTAL 1,486,989 1,440 0 1,488,429 1,281,238 65,184 - 1,346,423 205,750 142,006
The increase in licences and brands was primarily due to the purchase of software licences, applied software and for the
consultancy provided in implementing the software in the Italian and foreign subsidiaries of the Company.
(3) Investments
Investments increased by Euro 74.754 million year-on-year to Euro 151.824 million at 31 December 2016.
Investments, divided between subsidiaries and other companies, are given in the following table:
Description Balance at 31/12/15 Increase Decrease Revaluation Impairment Other changes Balance at 31/12/16
Subsidiaries 226,578,664
45,100,000
119,853,934
151,824,728
Other entities 151,205
-
151,205
TOTAL 226,729,869 45,100,000 119,853,934 - - - 151,975,934
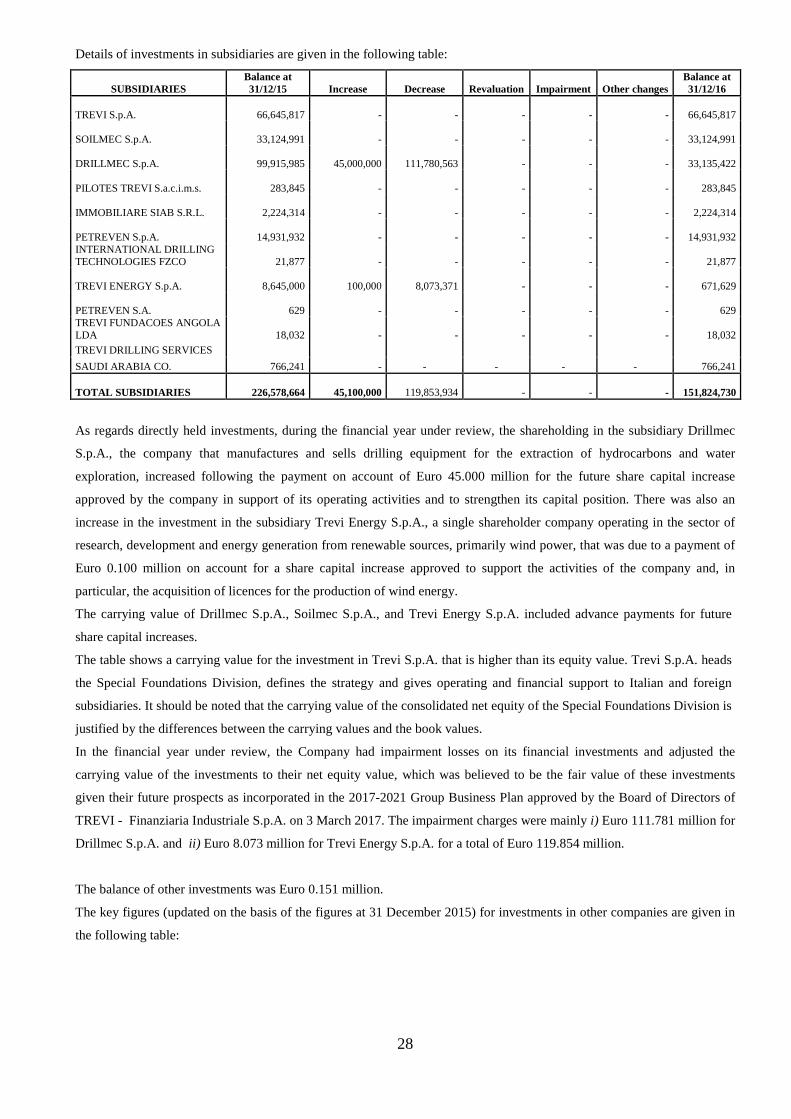
28
Details of investments in subsidiaries are given in the following table:
SUBSIDIARIES Balance at 31/12/15 Increase Decrease Revaluation Impairment Other changes
Balance at 31/12/16
TREVI S.p.A.
66,645,817
-
-
-
-
-
66,645,817
SOILMEC S.p.A.
33,124,991
-
-
-
-
-
33,124,991
DRILLMEC S.p.A.
99,915,985
45,000,000
111,780,563
-
-
-
33,135,422
PILOTES TREVI S.a.c.i.m.s.
283,845
-
-
-
-
-
283,845
IMMOBILIARE SIAB S.R.L.
2,224,314
-
-
-
-
-
2,224,314
PETREVEN S.p.A.
14,931,932
-
-
-
-
-
14,931,932 INTERNATIONAL DRILLING TECHNOLOGIES FZCO
21,877
-
-
-
-
-
21,877
TREVI ENERGY S.p.A.
8,645,000
100,000
8,073,371
-
-
-
671,629
PETREVEN S.A.
629
-
-
-
-
-
629 TREVI FUNDACOES ANGOLA LDA
18,032
-
-
-
-
-
18,032
TREVI DRILLING SERVICES 766,241
-
-
-
-
-
766,241 SAUDI ARABIA CO.
TOTAL SUBSIDIARIES 226,578,664 45,100,000
119,853,934
-
- - 151,824,730
As regards directly held investments, during the financial year under review, the shareholding in the subsidiary Drillmec
S.p.A., the company that manufactures and sells drilling equipment for the extraction of hydrocarbons and water
exploration, increased following the payment on account of Euro 45.000 million for the future share capital increase
approved by the company in support of its operating activities and to strengthen its capital position. There was also an
increase in the investment in the subsidiary Trevi Energy S.p.A., a single shareholder company operating in the sector of
research, development and energy generation from renewable sources, primarily wind power, that was due to a payment of
Euro 0.100 million on account for a share capital increase approved to support the activities of the company and, in
particular, the acquisition of licences for the production of wind energy.
The carrying value of Drillmec S.p.A., Soilmec S.p.A., and Trevi Energy S.p.A. included advance payments for future
share capital increases.
The table shows a carrying value for the investment in Trevi S.p.A. that is higher than its equity value. Trevi S.p.A. heads
the Special Foundations Division, defines the strategy and gives operating and financial support to Italian and foreign
subsidiaries. It should be noted that the carrying value of the consolidated net equity of the Special Foundations Division is
justified by the differences between the carrying values and the book values.
In the financial year under review, the Company had impairment losses on its financial investments and adjusted the
carrying value of the investments to their net equity value, which was believed to be the fair value of these investments
given their future prospects as incorporated in the 2017-2021 Group Business Plan approved by the Board of Directors of
TREVI - Finanziaria Industriale S.p.A. on 3 March 2017. The impairment charges were mainly i) Euro 111.781 million for
Drillmec S.p.A. and ii) Euro 8.073 million for Trevi Energy S.p.A. for a total of Euro 119.854 million.
The balance of other investments was Euro 0.151 million.
The key figures (updated on the basis of the figures at 31 December 2015) for investments in other companies are given in
the following table:
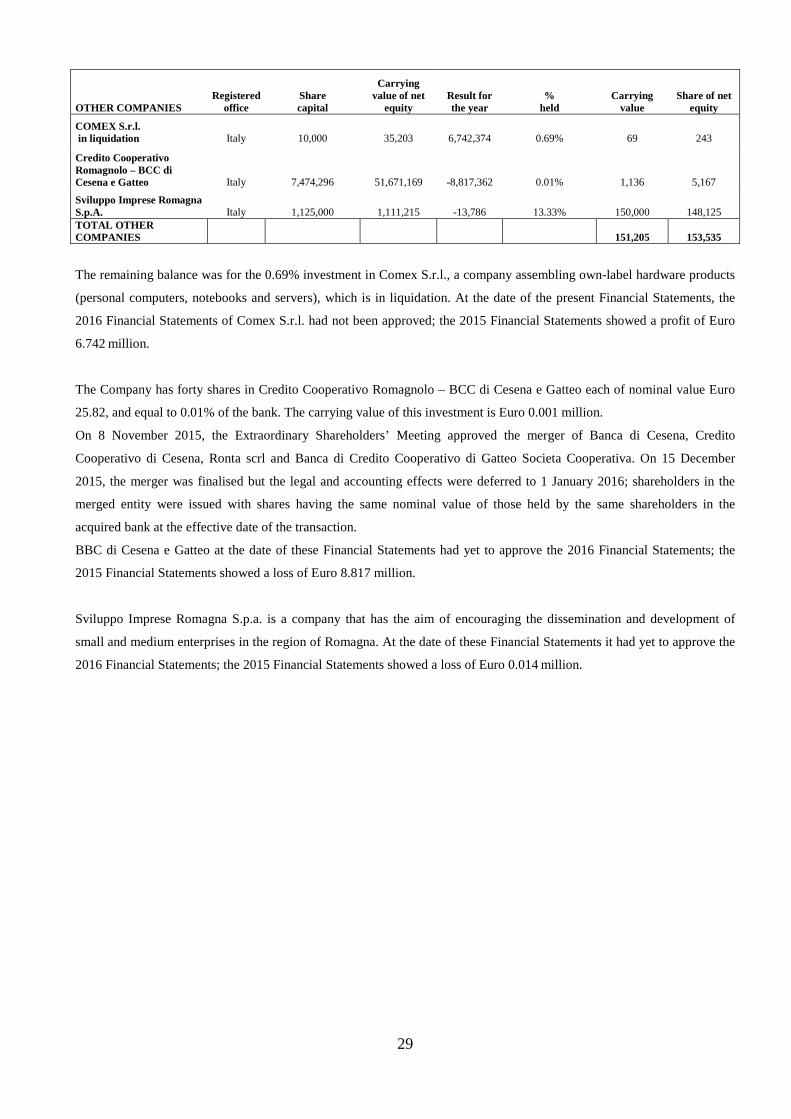
29
OTHER COMPANIES Registered
office Share capital
Carrying value of net
equity Result for the year
% held
Carrying value
Share of net equity
COMEX S.r.l. in liquidation Italy 10,000 35,203 6,742,374 0.69% 69 243
Credito Cooperativo Romagnolo – BCC di Cesena e Gatteo Italy 7,474,296 51,671,169 -8,817,362 0.01% 1,136 5,167
Sviluppo Imprese Romagna S.p.A. Italy 1,125,000 1,111,215 -13,786 13.33% 150,000 148,125 TOTAL OTHER COMPANIES 151,205 153,535
The remaining balance was for the 0.69% investment in Comex S.r.l., a company assembling own-label hardware products
(personal computers, notebooks and servers), which is in liquidation. At the date of the present Financial Statements, the
2016 Financial Statements of Comex S.r.l. had not been approved; the 2015 Financial Statements showed a profit of Euro
6.742 million.
The Company has forty shares in Credito Cooperativo Romagnolo – BCC di Cesena e Gatteo each of nominal value Euro
25.82, and equal to 0.01% of the bank. The carrying value of this investment is Euro 0.001 million.
On 8 November 2015, the Extraordinary Shareholders’ Meeting approved the merger of Banca di Cesena, Credito
Cooperativo di Cesena, Ronta scrl and Banca di Credito Cooperativo di Gatteo Societa Cooperativa. On 15 December
2015, the merger was finalised but the legal and accounting effects were deferred to 1 January 2016; shareholders in the
merged entity were issued with shares having the same nominal value of those held by the same shareholders in the
acquired bank at the effective date of the transaction.
BBC di Cesena e Gatteo at the date of these Financial Statements had yet to approve the 2016 Financial Statements; the
2015 Financial Statements showed a loss of Euro 8.817 million.
Sviluppo Imprese Romagna S.p.a. is a company that has the aim of encouraging the dissemination and development of
small and medium enterprises in the region of Romagna. At the date of these Financial Statements it had yet to approve the
2016 Financial Statements; the 2015 Financial Statements showed a loss of Euro 0.014 million.
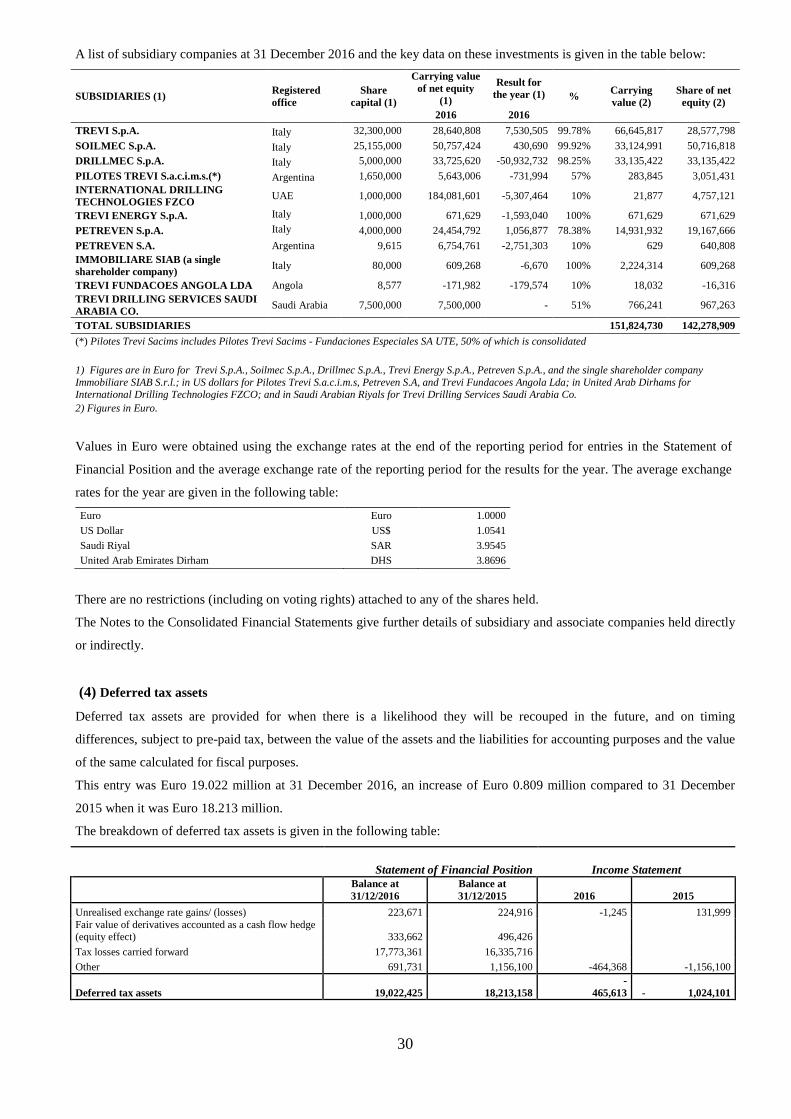
30
A list of subsidiary companies at 31 December 2016 and the key data on these investments is given in the table below:
SUBSIDIARIES (1) Registered office
Share capital (1)
Carrying value of net equity
(1)
Result for the year (1) % Carrying
value (2) Share of net equity (2)
2016 2016
TREVI S.p.A. Italy 32,300,000 28,640,808 7,530,505 99.78% 66,645,817 28,577,798
SOILMEC S.p.A. Italy 25,155,000 50,757,424 430,690 99.92% 33,124,991 50,716,818
DRILLMEC S.p.A. Italy 5,000,000 33,725,620 -50,932,732 98.25% 33,135,422 33,135,422
PILOTES TREVI S.a.c.i.m.s.(*) Argentina 1,650,000 5,643,006 -731,994 57% 283,845 3,051,431 INTERNATIONAL DRILLING TECHNOLOGIES FZCO
UAE 1,000,000 184,081,601 -5,307,464 10% 21,877 4,757,121
TREVI ENERGY S.p.A. Italy 1,000,000 671,629 -1,593,040 100% 671,629 671,629
PETREVEN S.p.A. Italy 4,000,000 24,454,792 1,056,877 78.38% 14,931,932 19,167,666
PETREVEN S.A. Argentina 9,615 6,754,761 -2,751,303 10% 629 640,808 IMMOBILIARE SIAB (a single shareholder company)
Italy 80,000 609,268 -6,670 100% 2,224,314 609,268
TREVI FUNDACOES ANGOLA LDA Angola 8,577 -171,982 -179,574 10% 18,032 -16,316 TREVI DRILLING SERVICES SAUDI ARABIA CO.
Saudi Arabia 7,500,000 7,500,000 - 51% 766,241 967,263
TOTAL SUBSIDIARIES 151,824,730 142,278,909
(*) Pilotes Trevi Sacims includes Pilotes Trevi Sacims - Fundaciones Especiales SA UTE, 50% of which is consolidated
1) Figures are in Euro for Trevi S.p.A., Soilmec S.p.A., Drillmec S.p.A., Trevi Energy S.p.A., Petreven S.p.A., and the single shareholder company Immobiliare SIAB S.r.l.; in US dollars for Pilotes Trevi S.a.c.i.m.s, Petreven S.A, and Trevi Fundacoes Angola Lda; in United Arab Dirhams for International Drilling Technologies FZCO; and in Saudi Arabian Riyals for Trevi Drilling Services Saudi Arabia Co. 2) Figures in Euro.
Values in Euro were obtained using the exchange rates at the end of the reporting period for entries in the Statement of
Financial Position and the average exchange rate of the reporting period for the results for the year. The average exchange
rates for the year are given in the following table:
Euro Euro 1.0000
US Dollar US$ 1.0541
Saudi Riyal SAR 3.9545 United Arab Emirates Dirham DHS 3.8696
There are no restrictions (including on voting rights) attached to any of the shares held.
The Notes to the Consolidated Financial Statements give further details of subsidiary and associate companies held directly
or indirectly.
(4) Deferred tax assets
Deferred tax assets are provided for when there is a likelihood they will be recouped in the future, and on timing
differences, subject to pre-paid tax, between the value of the assets and the liabilities for accounting purposes and the value
of the same calculated for fiscal purposes.
This entry was Euro 19.022 million at 31 December 2016, an increase of Euro 0.809 million compared to 31 December
2015 when it was Euro 18.213 million.
The breakdown of deferred tax assets is given in the following table:
Statement of Financial Position Income Statement
Balance at 31/12/2016
Balance at 31/12/2015
2016
2015
Unrealised exchange rate gains/ (losses) 223,671 224,916 -1,245 131,999 Fair value of derivatives accounted as a cash flow hedge (equity effect) 333,662 496,426
Tax losses carried forward 17,773,361 16,335,716
Other 691,731 1,156,100 -464,368 -1,156,100
Deferred tax assets 19,022,425 18,213,158 -
465,613 - 1,024,101
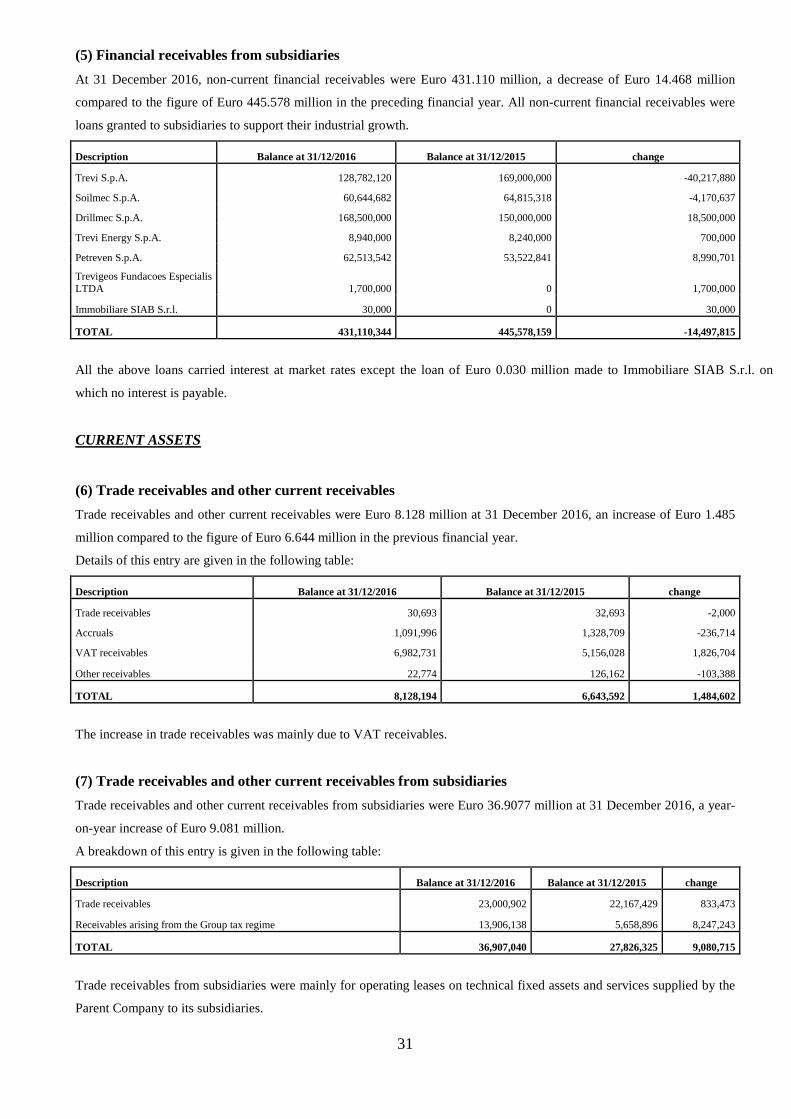
31
(5) Financial receivables from subsidiaries
At 31 December 2016, non-current financial receivables were Euro 431.110 million, a decrease of Euro 14.468 million
compared to the figure of Euro 445.578 million in the preceding financial year. All non-current financial receivables were
loans granted to subsidiaries to support their industrial growth.
Description Balance at 31/12/2016 Balance at 31/12/2015 change
Trevi S.p.A. 128,782,120 169,000,000 -40,217,880
Soilmec S.p.A. 60,644,682 64,815,318 -4,170,637
Drillmec S.p.A. 168,500,000 150,000,000 18,500,000
Trevi Energy S.p.A. 8,940,000 8,240,000 700,000
Petreven S.p.A. 62,513,542 53,522,841 8,990,701
Trevigeos Fundacoes Especialis LTDA 1,700,000 0 1,700,000
Immobiliare SIAB S.r.l. 30,000 0 30,000
TOTAL 431,110,344 445,578,159 -14,497,815
All the above loans carried interest at market rates except the loan of Euro 0.030 million made to Immobiliare SIAB S.r.l. on
which no interest is payable.
CURRENT ASSETS
(6) Trade receivables and other current receivables
Trade receivables and other current receivables were Euro 8.128 million at 31 December 2016, an increase of Euro 1.485
million compared to the figure of Euro 6.644 million in the previous financial year.
Details of this entry are given in the following table:
Description Balance at 31/12/2016 Balance at 31/12/2015 change
Trade receivables 30,693 32,693 -2,000
Accruals 1,091,996 1,328,709 -236,714
VAT receivables 6,982,731 5,156,028 1,826,704
Other receivables 22,774 126,162 -103,388
TOTAL 8,128,194 6,643,592 1,484,602
The increase in trade receivables was mainly due to VAT receivables.
(7) Trade receivables and other current receivables from subsidiaries
Trade receivables and other current receivables from subsidiaries were Euro 36.9077 million at 31 December 2016, a year-
on-year increase of Euro 9.081 million.
A breakdown of this entry is given in the following table:
Description Balance at 31/12/2016 Balance at 31/12/2015 change
Trade receivables 23,000,902 22,167,429 833,473
Receivables arising from the Group tax regime 13,906,138 5,658,896 8,247,243
TOTAL 36,907,040 27,826,325 9,080,715
Trade receivables from subsidiaries were mainly for operating leases on technical fixed assets and services supplied by the
Parent Company to its subsidiaries.
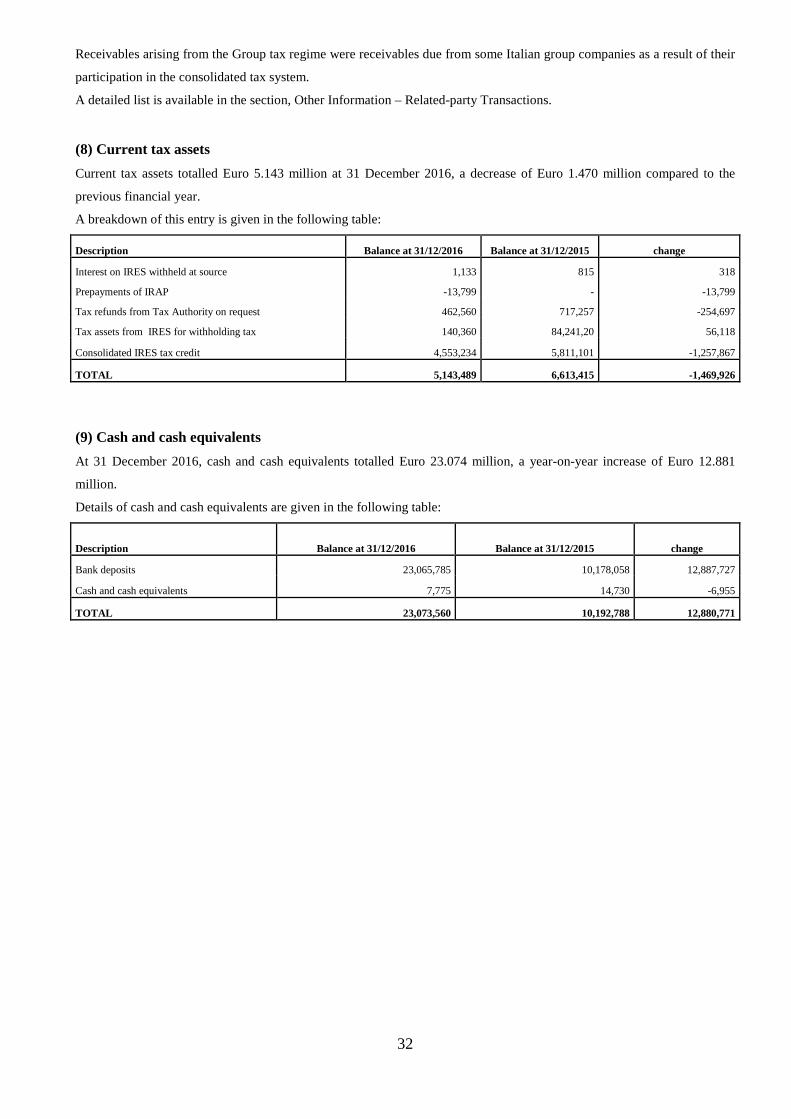
32
Receivables arising from the Group tax regime were receivables due from some Italian group companies as a result of their
participation in the consolidated tax system.
A detailed list is available in the section, Other Information – Related-party Transactions.
(8) Current tax assets
Current tax assets totalled Euro 5.143 million at 31 December 2016, a decrease of Euro 1.470 million compared to the
previous financial year.
A breakdown of this entry is given in the following table:
Description Balance at 31/12/2016 Balance at 31/12/2015 change
Interest on IRES withheld at source 1,133 815 318
Prepayments of IRAP -13,799 - -13,799
Tax refunds from Tax Authority on request 462,560 717,257 -254,697
Tax assets from IRES for withholding tax 140,360 84,241,20 56,118
Consolidated IRES tax credit 4,553,234 5,811,101 -1,257,867
TOTAL 5,143,489 6,613,415 -1,469,926
(9) Cash and cash equivalents
At 31 December 2016, cash and cash equivalents totalled Euro 23.074 million, a year-on-year increase of Euro 12.881
million.
Details of cash and cash equivalents are given in the following table:
Description Balance at 31/12/2016 Balance at 31/12/2015 change
Bank deposits 23,065,785 10,178,058 12,887,727
Cash and cash equivalents 7,775 14,730 -6,955
TOTAL 23,073,560 10,192,788 12,880,771
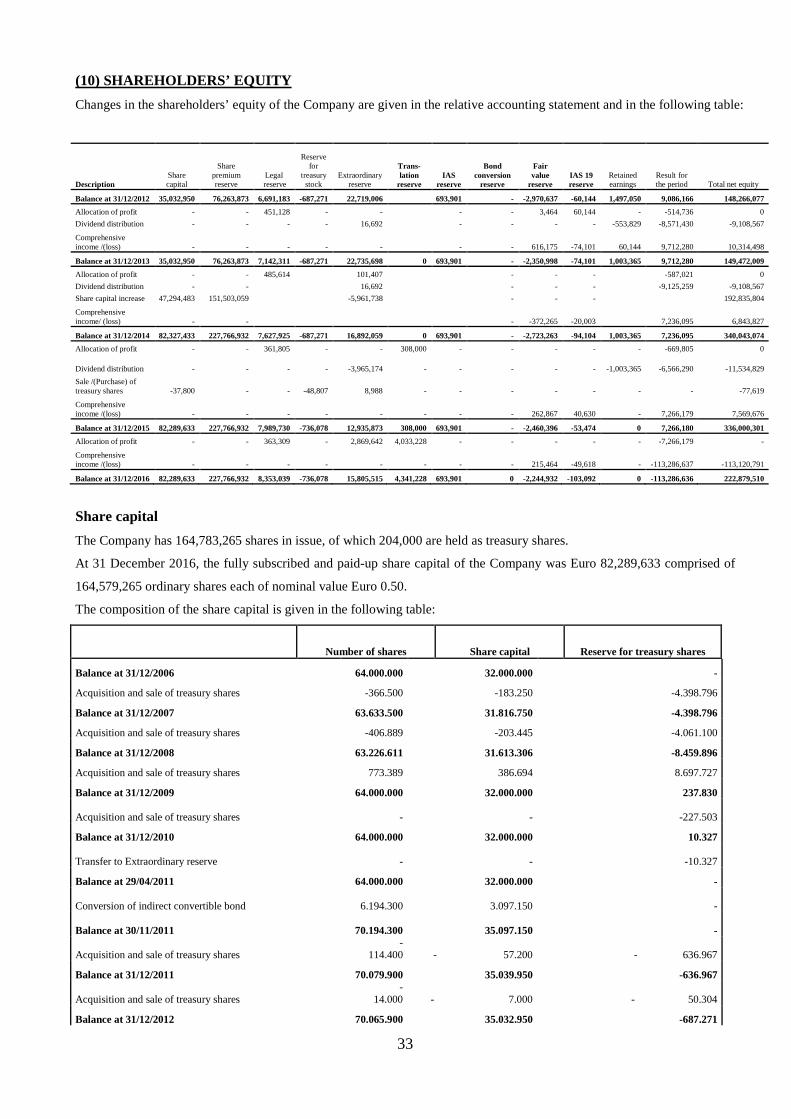
33
(10) SHAREHOLDERS’ EQUITY
Changes in the shareholders’ equity of the Company are given in the relative accounting statement and in the following table:
Description Share capital
Share premium reserve
Legal reserve
Reserve for
treasury stock
Extraordinary reserve
Trans- lation
reserve IAS
reserve
Bond conversion
reserve
Fair value
reserve IAS 19 reserve
Retained earnings
Result for the period Total net equity
Balance at 31/12/2012 35,032,950 76,263,873 6,691,183 -687,271 22,719,006 693,901 - -2,970,637 -60,144 1,497,050 9,086,166 148,266,077
Allocation of profit - - 451,128 - - - - 3,464 60,144 - -514,736 0
Dividend distribution - - - - 16,692 - - - - -553,829 -8,571,430 -9,108,567
Comprehensive income /(loss) - - - - - - - 616,175 -74,101 60,144 9,712,280 10,314,498
Balance at 31/12/2013 35,032,950 76,263,873 7,142,311 -687,271 22,735,698 0 693,901 - -2,350,998 -74,101 1,003,365 9,712,280 149,472,009
Allocation of profit - - 485,614 101,407 - - - -587,021 0
Dividend distribution - - 16,692 - - - -9,125,259 -9,108,567
Share capital increase 47,294,483 151,503,059 -5,961,738 - - - 192,835,804
Comprehensive income/ (loss) - - - -372,265 -20,003 7,236,095 6,843,827
Balance at 31/12/2014 82,327,433 227,766,932 7,627,925 -687,271 16,892,059 0 693,901 - -2,723,263 -94,104 1,003,365 7,236,095 340,043,074
Allocation of profit - - 361,805 - - 308,000 - - - - - -669,805 0
Dividend distribution - - - - -3,965,174 - - - - - -1,003,365 -6,566,290 -11,534,829
Sale /(Purchase) of treasury shares -37,800 - - -48,807 8,988 - - - - - - - -77,619
Comprehensive income /(loss) - - - - - - - - 262,867 40,630 - 7,266,179 7,569,676
Balance at 31/12/2015 82,289,633 227,766,932 7,989,730 -736,078 12,935,873 308,000 693,901 - -2,460,396 -53,474 0 7,266,180 336,000,301
Allocation of profit - - 363,309 - 2,869,642 4,033,228 - - - - - -7,266,179 -
Comprehensive income /(loss) - - - - - - - - 215,464 -49,618 - -113,286,637 -113,120,791
Balance at 31/12/2016 82,289,633 227,766,932 8,353,039 -736,078 15,805,515 4,341,228 693,901 0 -2,244,932 -103,092 0 -113,286,636 222,879,510
Share capital
The Company has 164,783,265 shares in issue, of which 204,000 are held as treasury shares.
At 31 December 2016, the fully subscribed and paid-up share capital of the Company was Euro 82,289,633 comprised of
164,579,265 ordinary shares each of nominal value Euro 0.50.
The composition of the share capital is given in the following table:
Number of shares Share capital Reserve for treasury shares
Balance at 31/12/2006 64.000.000 32.000.000 -
Acquisition and sale of treasury shares -366.500 -183.250 -4.398.796
Balance at 31/12/2007 63.633.500 31.816.750 -4.398.796
Acquisition and sale of treasury shares -406.889 -203.445 -4.061.100
Balance at 31/12/2008 63.226.611 31.613.306 -8.459.896
Acquisition and sale of treasury shares 773.389 386.694 8.697.727
Balance at 31/12/2009 64.000.000 32.000.000 237.830
Acquisition and sale of treasury shares
- - -227.503
Balance at 31/12/2010 64.000.000 32.000.000 10.327
Transfer to Extraordinary reserve
- - -10.327
Balance at 29/04/2011 64.000.000 32.000.000 -
Conversion of indirect convertible bond
6.194.300 3.097.150 -
Balance at 30/11/2011
70.194.300 35.097.150 -
Acquisition and sale of treasury shares -
114.400 - 57.200 - 636.967
Balance at 31/12/2011 70.079.900 35.039.950 -636.967
Acquisition and sale of treasury shares -
14.000 - 7.000 - 50.304
Balance at 31/12/2012 70.065.900 35.032.950 -687.271
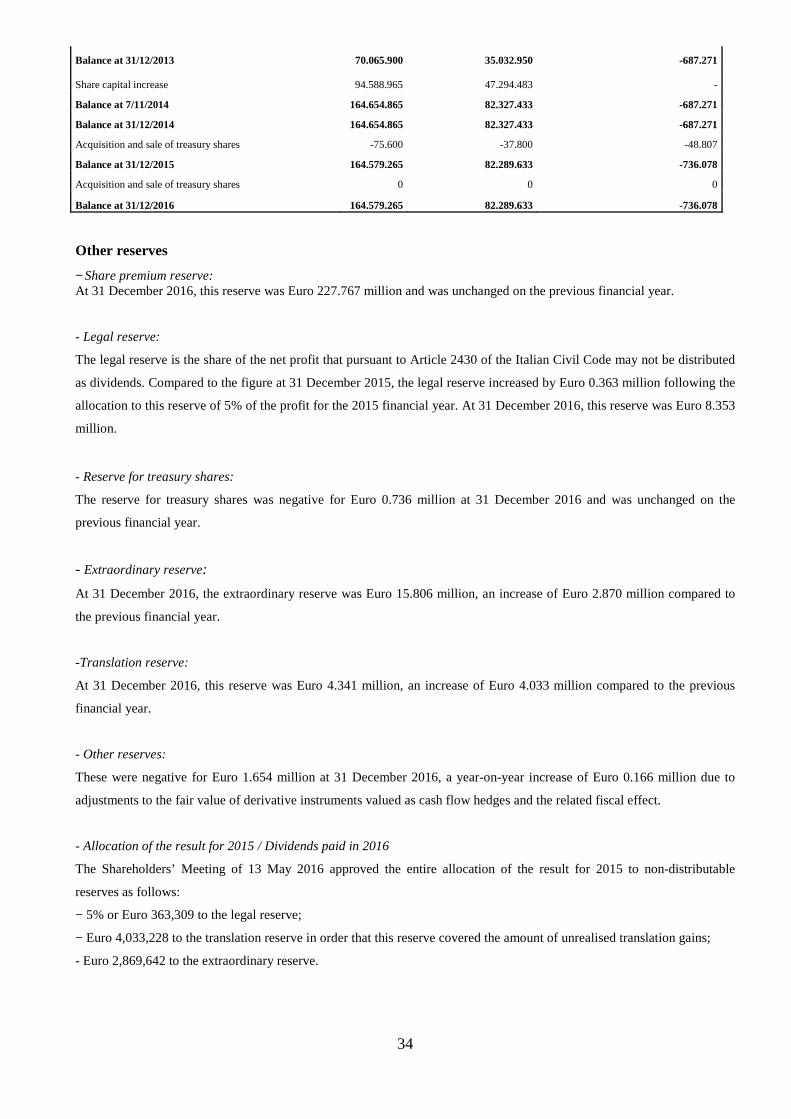
34
Balance at 31/12/2013 70.065.900 35.032.950 -687.271
Share capital increase
94.588.965 47.294.483 -
Balance at 7/11/2014 164.654.865 82.327.433 -687.271
Balance at 31/12/2014 164.654.865 82.327.433 -687.271
Acquisition and sale of treasury shares -75.600 -37.800 -48.807
Balance at 31/12/2015 164.579.265 82.289.633 -736.078
Acquisition and sale of treasury shares 0 0 0
Balance at 31/12/2016 164.579.265 82.289.633 -736.078
Other reserves
− Share premium reserve: At 31 December 2016, this reserve was Euro 227.767 million and was unchanged on the previous financial year.
- Legal reserve:
The legal reserve is the share of the net profit that pursuant to Article 2430 of the Italian Civil Code may not be distributed
as dividends. Compared to the figure at 31 December 2015, the legal reserve increased by Euro 0.363 million following the
allocation to this reserve of 5% of the profit for the 2015 financial year. At 31 December 2016, this reserve was Euro 8.353
million.
- Reserve for treasury shares:
The reserve for treasury shares was negative for Euro 0.736 million at 31 December 2016 and was unchanged on the
previous financial year.
- Extraordinary reserve:
At 31 December 2016, the extraordinary reserve was Euro 15.806 million, an increase of Euro 2.870 million compared to
the previous financial year.
-Translation reserve:
At 31 December 2016, this reserve was Euro 4.341 million, an increase of Euro 4.033 million compared to the previous
financial year.
- Other reserves:
These were negative for Euro 1.654 million at 31 December 2016, a year-on-year increase of Euro 0.166 million due to
adjustments to the fair value of derivative instruments valued as cash flow hedges and the related fiscal effect.
- Allocation of the result for 2015 / Dividends paid in 2016
The Shareholders’ Meeting of 13 May 2016 approved the entire allocation of the result for 2015 to non-distributable
reserves as follows:
− 5% or Euro 363,309 to the legal reserve;
− Euro 4,033,228 to the translation reserve in order that this reserve covered the amount of unrealised translation gains;
- Euro 2,869,642 to the extraordinary reserve.
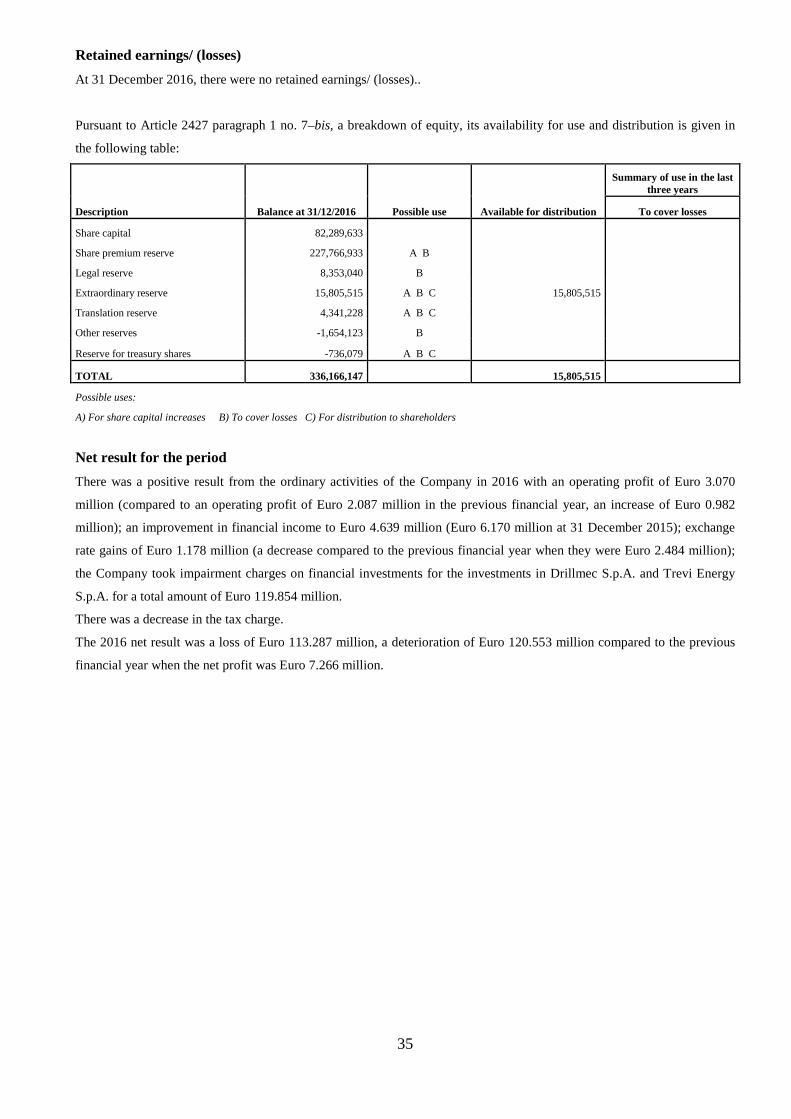
35
Retained earnings/ (losses)
At 31 December 2016, there were no retained earnings/ (losses)..
Pursuant to Article 2427 paragraph 1 no. 7–bis, a breakdown of equity, its availability for use and distribution is given in
the following table:
Description Balance at 31/12/2016 Possible use Available for distribution
Summary of use in the last three years
To cover losses
Share capital 82,289,633
Share premium reserve 227,766,933 A B
Legal reserve 8,353,040 B
Extraordinary reserve 15,805,515 A B C 15,805,515
Translation reserve 4,341,228 A B C
Other reserves -1,654,123 B
Reserve for treasury shares -736,079 A B C
TOTAL 336,166,147 15,805,515
Possible uses:
A) For share capital increases B) To cover losses C) For distribution to shareholders
Net result for the period
There was a positive result from the ordinary activities of the Company in 2016 with an operating profit of Euro 3.070
million (compared to an operating profit of Euro 2.087 million in the previous financial year, an increase of Euro 0.982
million); an improvement in financial income to Euro 4.639 million (Euro 6.170 million at 31 December 2015); exchange
rate gains of Euro 1.178 million (a decrease compared to the previous financial year when they were Euro 2.484 million);
the Company took impairment charges on financial investments for the investments in Drillmec S.p.A. and Trevi Energy
S.p.A. for a total amount of Euro 119.854 million.
There was a decrease in the tax charge.
The 2016 net result was a loss of Euro 113.287 million, a deterioration of Euro 120.553 million compared to the previous
financial year when the net profit was Euro 7.266 million.
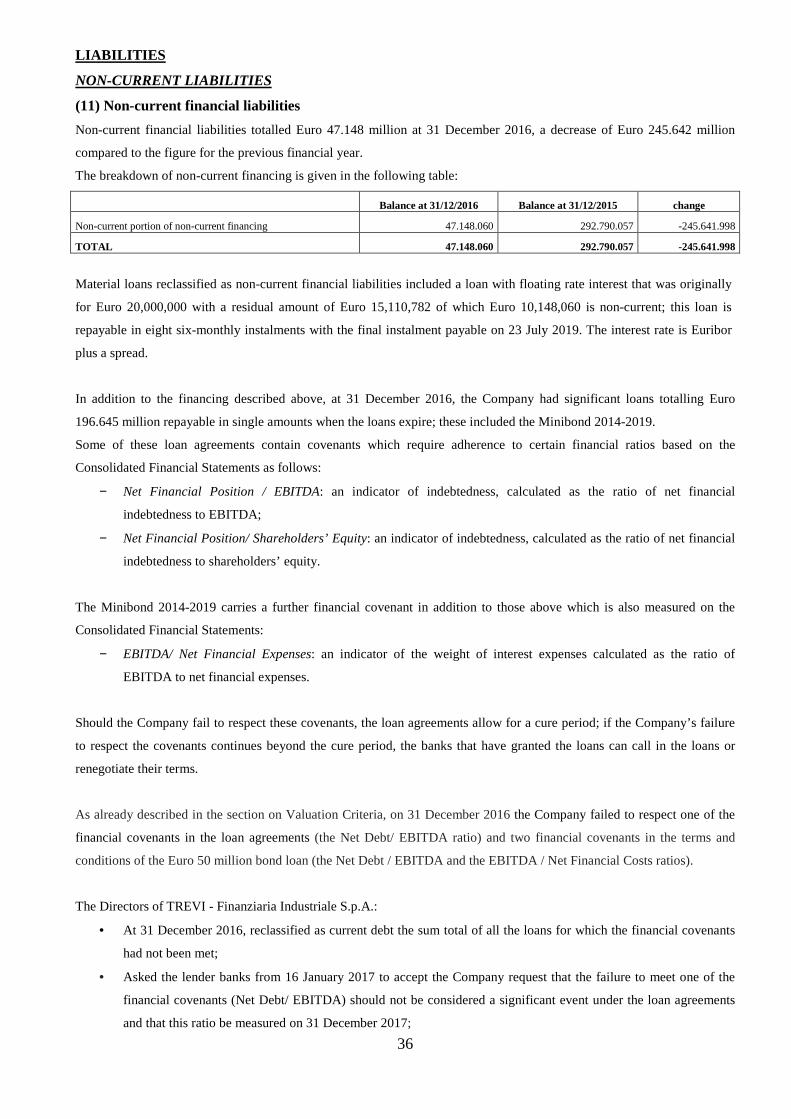
36
LIABILITIES
NON-CURRENT LIABILITIES
(11) Non-current financial liabilities
Non-current financial liabilities totalled Euro 47.148 million at 31 December 2016, a decrease of Euro 245.642 million
compared to the figure for the previous financial year.
The breakdown of non-current financing is given in the following table:
Balance at 31/12/2016 Balance at 31/12/2015 change
Non-current portion of non-current financing 47.148.060 292.790.057 -245.641.998
TOTAL 47.148.060 292.790.057 -245.641.998
Material loans reclassified as non-current financial liabilities included a loan with floating rate interest that was originally
for Euro 20,000,000 with a residual amount of Euro 15,110,782 of which Euro 10,148,060 is non-current; this loan is
repayable in eight six-monthly instalments with the final instalment payable on 23 July 2019. The interest rate is Euribor
plus a spread.
In addition to the financing described above, at 31 December 2016, the Company had significant loans totalling Euro
196.645 million repayable in single amounts when the loans expire; these included the Minibond 2014-2019.
Some of these loan agreements contain covenants which require adherence to certain financial ratios based on the
Consolidated Financial Statements as follows:
− Net Financial Position / EBITDA: an indicator of indebtedness, calculated as the ratio of net financial
indebtedness to EBITDA;
− Net Financial Position/ Shareholders’ Equity: an indicator of indebtedness, calculated as the ratio of net financial
indebtedness to shareholders’ equity.
The Minibond 2014-2019 carries a further financial covenant in addition to those above which is also measured on the
Consolidated Financial Statements:
− EBITDA/ Net Financial Expenses: an indicator of the weight of interest expenses calculated as the ratio of
EBITDA to net financial expenses.
Should the Company fail to respect these covenants, the loan agreements allow for a cure period; if the Company’s failure
to respect the covenants continues beyond the cure period, the banks that have granted the loans can call in the loans or
renegotiate their terms.
As already described in the section on Valuation Criteria, on 31 December 2016 the Company failed to respect one of the
financial covenants in the loan agreements (the Net Debt/ EBITDA ratio) and two financial covenants in the terms and
conditions of the Euro 50 million bond loan (the Net Debt / EBITDA and the EBITDA / Net Financial Costs ratios).
The Directors of TREVI - Finanziaria Industriale S.p.A.:
• At 31 December 2016, reclassified as current debt the sum total of all the loans for which the financial covenants
had not been met;
• Asked the lender banks from 16 January 2017 to accept the Company request that the failure to meet one of the
financial covenants (Net Debt/ EBITDA) should not be considered a significant event under the loan agreements
and that this ratio be measured on 31 December 2017;
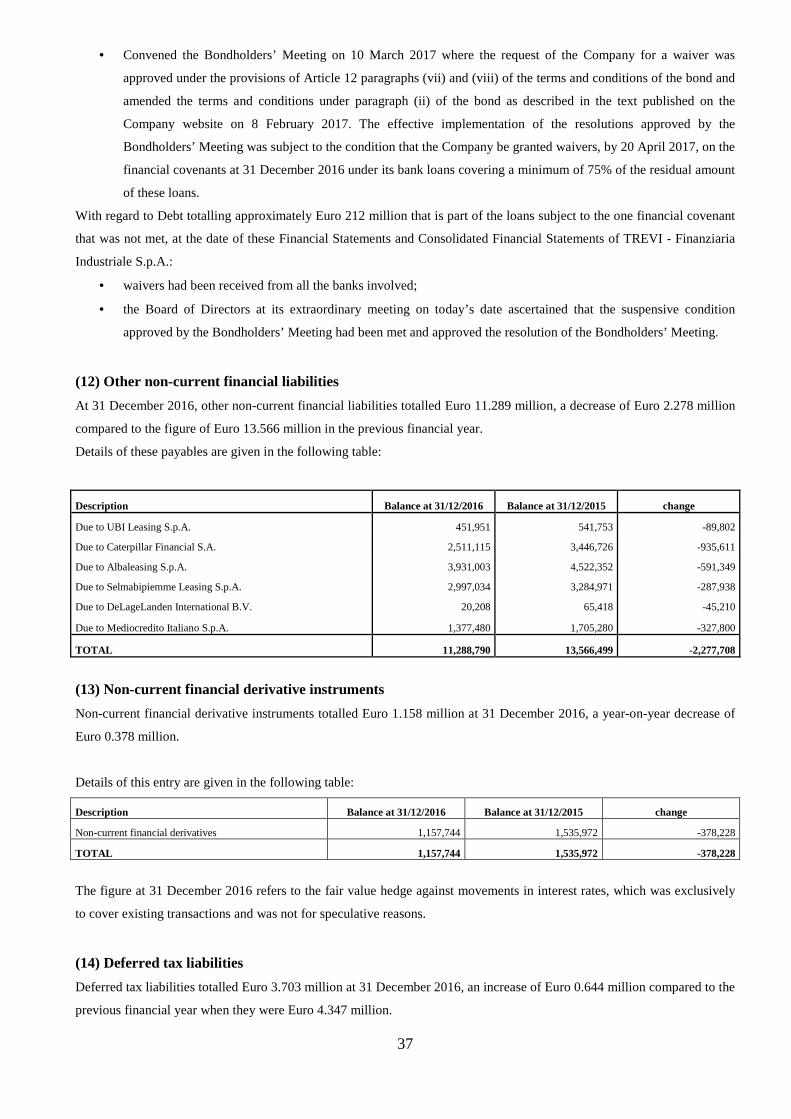
37
• Convened the Bondholders’ Meeting on 10 March 2017 where the request of the Company for a waiver was
approved under the provisions of Article 12 paragraphs (vii) and (viii) of the terms and conditions of the bond and
amended the terms and conditions under paragraph (ii) of the bond as described in the text published on the
Company website on 8 February 2017. The effective implementation of the resolutions approved by the
Bondholders’ Meeting was subject to the condition that the Company be granted waivers, by 20 April 2017, on the
financial covenants at 31 December 2016 under its bank loans covering a minimum of 75% of the residual amount
of these loans.
With regard to Debt totalling approximately Euro 212 million that is part of the loans subject to the one financial covenant
that was not met, at the date of these Financial Statements and Consolidated Financial Statements of TREVI - Finanziaria
Industriale S.p.A.:
• waivers had been received from all the banks involved;
• the Board of Directors at its extraordinary meeting on today’s date ascertained that the suspensive condition
approved by the Bondholders’ Meeting had been met and approved the resolution of the Bondholders’ Meeting.
(12) Other non-current financial liabilities
At 31 December 2016, other non-current financial liabilities totalled Euro 11.289 million, a decrease of Euro 2.278 million
compared to the figure of Euro 13.566 million in the previous financial year.
Details of these payables are given in the following table:
Description Balance at 31/12/2016 Balance at 31/12/2015 change
Due to UBI Leasing S.p.A. 451,951 541,753 -89,802
Due to Caterpillar Financial S.A. 2,511,115 3,446,726 -935,611
Due to Albaleasing S.p.A. 3,931,003 4,522,352 -591,349
Due to Selmabipiemme Leasing S.p.A. 2,997,034 3,284,971 -287,938
Due to DeLageLanden International B.V. 20,208 65,418 -45,210
Due to Mediocredito Italiano S.p.A. 1,377,480 1,705,280 -327,800
TOTAL 11,288,790 13,566,499 -2,277,708
(13) Non-current financial derivative instruments
Non-current financial derivative instruments totalled Euro 1.158 million at 31 December 2016, a year-on-year decrease of
Euro 0.378 million.
Details of this entry are given in the following table:
Description Balance at 31/12/2016 Balance at 31/12/2015 change
Non-current financial derivatives 1,157,744 1,535,972 -378,228
TOTAL 1,157,744 1,535,972 -378,228
The figure at 31 December 2016 refers to the fair value hedge against movements in interest rates, which was exclusively
to cover existing transactions and was not for speculative reasons.
(14) Deferred tax liabilities
Deferred tax liabilities totalled Euro 3.703 million at 31 December 2016, an increase of Euro 0.644 million compared to the
previous financial year when they were Euro 4.347 million.
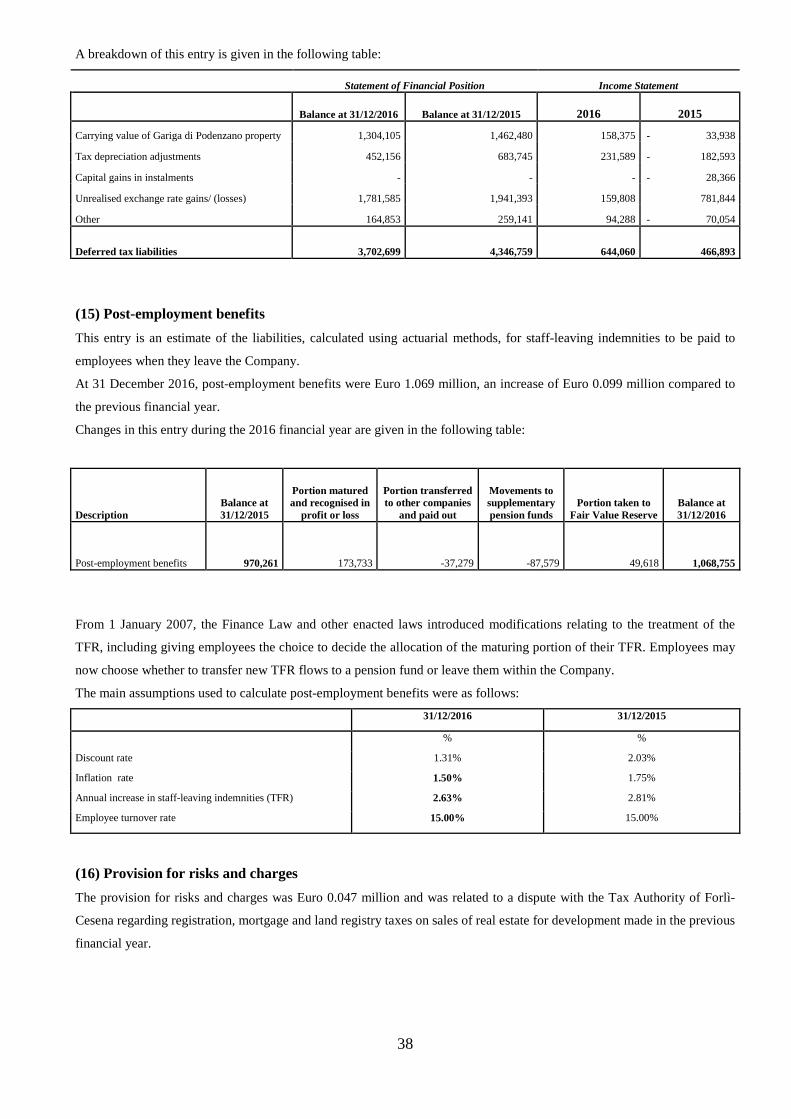
38
A breakdown of this entry is given in the following table:
Statement of Financial Position Income Statement
Balance at 31/12/2016 Balance at 31/12/2015
2016
2015
Carrying value of Gariga di Podenzano property 1,304,105 1,462,480 158,375 - 33,938
Tax depreciation adjustments 452,156 683,745 231,589 - 182,593
Capital gains in instalments - - - - 28,366
Unrealised exchange rate gains/ (losses) 1,781,585 1,941,393 159,808 781,844
Other 164,853 259,141 94,288 - 70,054
Deferred tax liabilities 3,702,699 4,346,759 644,060 466,893
(15) Post-employment benefits
This entry is an estimate of the liabilities, calculated using actuarial methods, for staff-leaving indemnities to be paid to
employees when they leave the Company.
At 31 December 2016, post-employment benefits were Euro 1.069 million, an increase of Euro 0.099 million compared to
the previous financial year.
Changes in this entry during the 2016 financial year are given in the following table:
Description Balance at 31/12/2015
Portion matured and recognised in
profit or loss
Portion transferred to other companies
and paid out
Movements to supplementary pension funds
Portion taken to Fair Value Reserve
Balance at 31/12/2016
Post-employment benefits 970,261 173,733 -37,279 -87,579 49,618 1,068,755
From 1 January 2007, the Finance Law and other enacted laws introduced modifications relating to the treatment of the
TFR, including giving employees the choice to decide the allocation of the maturing portion of their TFR. Employees may
now choose whether to transfer new TFR flows to a pension fund or leave them within the Company.
The main assumptions used to calculate post-employment benefits were as follows:
31/12/2016 31/12/2015
% %
Discount rate 1.31% 2.03%
Inflation rate 1.50% 1.75%
Annual increase in staff-leaving indemnities (TFR) 2.63% 2.81%
Employee turnover rate 15.00% 15.00%
(16) Provision for risks and charges
The provision for risks and charges was Euro 0.047 million and was related to a dispute with the Tax Authority of Forlì-
Cesena regarding registration, mortgage and land registry taxes on sales of real estate for development made in the previous
financial year.
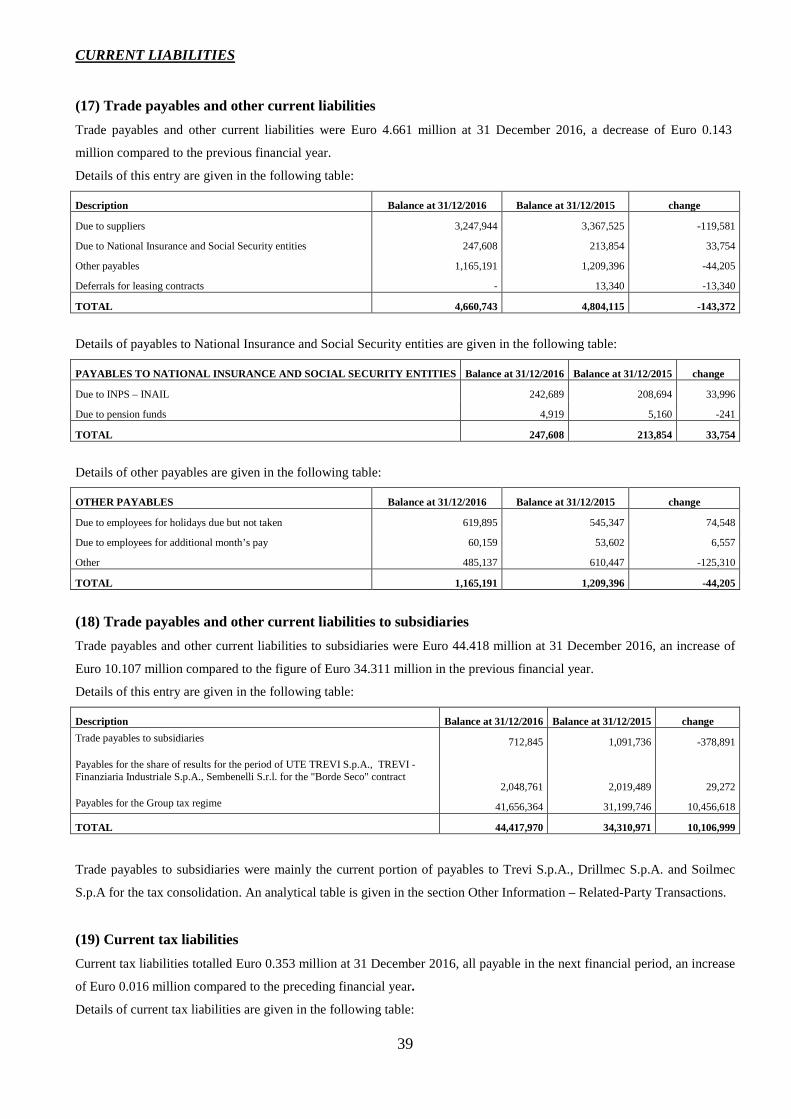
39
CURRENT LIABILITIES
(17) Trade payables and other current liabilities
Trade payables and other current liabilities were Euro 4.661 million at 31 December 2016, a decrease of Euro 0.143
million compared to the previous financial year.
Details of this entry are given in the following table:
Description Balance at 31/12/2016 Balance at 31/12/2015 change
Due to suppliers 3,247,944 3,367,525 -119,581
Due to National Insurance and Social Security entities 247,608 213,854 33,754
Other payables 1,165,191 1,209,396 -44,205
Deferrals for leasing contracts - 13,340 -13,340
TOTAL 4,660,743 4,804,115 -143,372
Details of payables to National Insurance and Social Security entities are given in the following table:
PAYABLES TO NATIONAL INSURANCE AND SOCIAL SECURITY ENTITIES Balance at 31/12/2016 Balance at 31/12/2015 change
Due to INPS – INAIL 242,689 208,694 33,996
Due to pension funds 4,919 5,160 -241
TOTAL 247,608 213,854 33,754
Details of other payables are given in the following table:
OTHER PAYABLES Balance at 31/12/2016 Balance at 31/12/2015 change
Due to employees for holidays due but not taken 619,895 545,347 74,548
Due to employees for additional month’s pay 60,159 53,602 6,557
Other 485,137 610,447 -125,310
TOTAL 1,165,191 1,209,396 -44,205
(18) Trade payables and other current liabilities to subsidiaries
Trade payables and other current liabilities to subsidiaries were Euro 44.418 million at 31 December 2016, an increase of
Euro 10.107 million compared to the figure of Euro 34.311 million in the previous financial year.
Details of this entry are given in the following table:
Description Balance at 31/12/2016 Balance at 31/12/2015 change
Trade payables to subsidiaries 712,845 1,091,736 -378,891
Payables for the share of results for the period of UTE TREVI S.p.A., TREVI - Finanziaria Industriale S.p.A., Sembenelli S.r.l. for the "Borde Seco" contract
2,048,761 2,019,489 29,272
Payables for the Group tax regime 41,656,364 31,199,746 10,456,618
TOTAL 44,417,970 34,310,971 10,106,999
Trade payables to subsidiaries were mainly the current portion of payables to Trevi S.p.A., Drillmec S.p.A. and Soilmec
S.p.A for the tax consolidation. An analytical table is given in the section Other Information – Related-Party Transactions.
(19) Current tax liabilities
Current tax liabilities totalled Euro 0.353 million at 31 December 2016, all payable in the next financial period, an increase
of Euro 0.016 million compared to the preceding financial year.
Details of current tax liabilities are given in the following table:
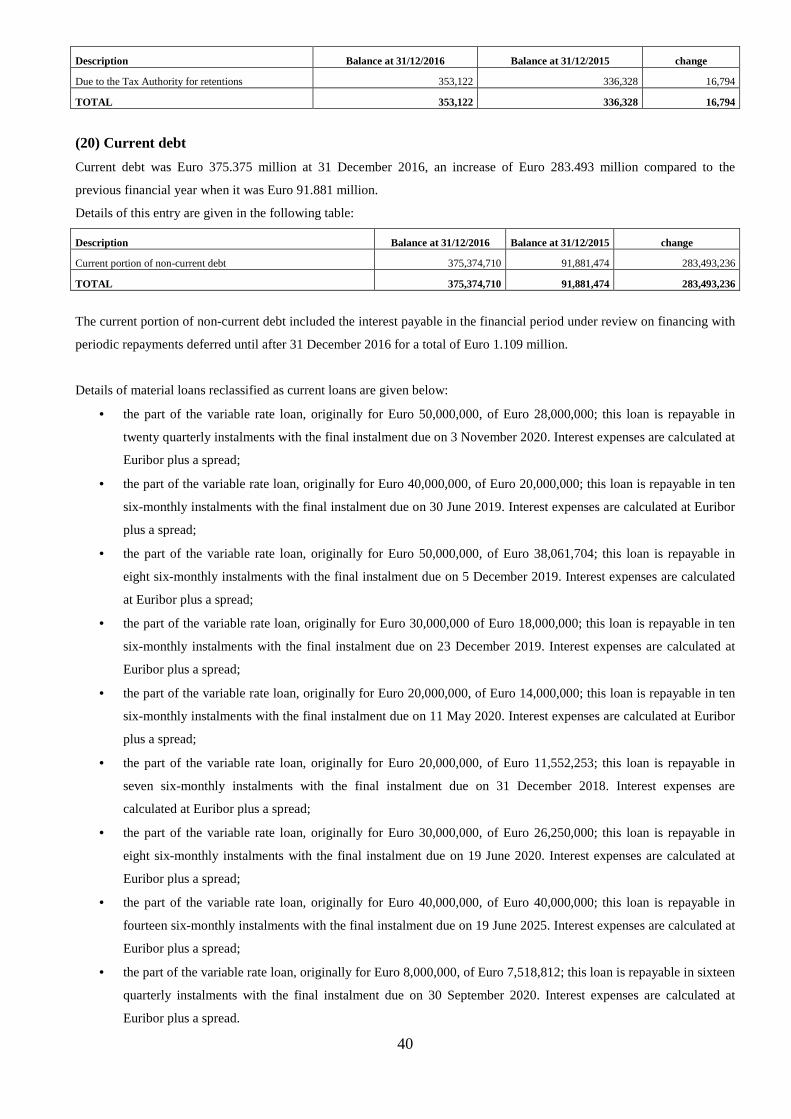
40
Description Balance at 31/12/2016 Balance at 31/12/2015 change
Due to the Tax Authority for retentions 353,122 336,328 16,794
TOTAL 353,122 336,328 16,794
(20) Current debt
Current debt was Euro 375.375 million at 31 December 2016, an increase of Euro 283.493 million compared to the
previous financial year when it was Euro 91.881 million.
Details of this entry are given in the following table:
Description Balance at 31/12/2016 Balance at 31/12/2015 change
Current portion of non-current debt 375,374,710 91,881,474 283,493,236
TOTAL 375,374,710 91,881,474 283,493,236
The current portion of non-current debt included the interest payable in the financial period under review on financing with
periodic repayments deferred until after 31 December 2016 for a total of Euro 1.109 million.
Details of material loans reclassified as current loans are given below:
• the part of the variable rate loan, originally for Euro 50,000,000, of Euro 28,000,000; this loan is repayable in
twenty quarterly instalments with the final instalment due on 3 November 2020. Interest expenses are calculated at
Euribor plus a spread;
• the part of the variable rate loan, originally for Euro 40,000,000, of Euro 20,000,000; this loan is repayable in ten
six-monthly instalments with the final instalment due on 30 June 2019. Interest expenses are calculated at Euribor
plus a spread;
• the part of the variable rate loan, originally for Euro 50,000,000, of Euro 38,061,704; this loan is repayable in
eight six-monthly instalments with the final instalment due on 5 December 2019. Interest expenses are calculated
at Euribor plus a spread;
• the part of the variable rate loan, originally for Euro 30,000,000 of Euro 18,000,000; this loan is repayable in ten
six-monthly instalments with the final instalment due on 23 December 2019. Interest expenses are calculated at
Euribor plus a spread;
• the part of the variable rate loan, originally for Euro 20,000,000, of Euro 14,000,000; this loan is repayable in ten
six-monthly instalments with the final instalment due on 11 May 2020. Interest expenses are calculated at Euribor
plus a spread;
• the part of the variable rate loan, originally for Euro 20,000,000, of Euro 11,552,253; this loan is repayable in
seven six-monthly instalments with the final instalment due on 31 December 2018. Interest expenses are
calculated at Euribor plus a spread;
• the part of the variable rate loan, originally for Euro 30,000,000, of Euro 26,250,000; this loan is repayable in
eight six-monthly instalments with the final instalment due on 19 June 2020. Interest expenses are calculated at
Euribor plus a spread;
• the part of the variable rate loan, originally for Euro 40,000,000, of Euro 40,000,000; this loan is repayable in
fourteen six-monthly instalments with the final instalment due on 19 June 2025. Interest expenses are calculated at
Euribor plus a spread;
• the part of the variable rate loan, originally for Euro 8,000,000, of Euro 7,518,812; this loan is repayable in sixteen
quarterly instalments with the final instalment due on 30 September 2020. Interest expenses are calculated at
Euribor plus a spread.
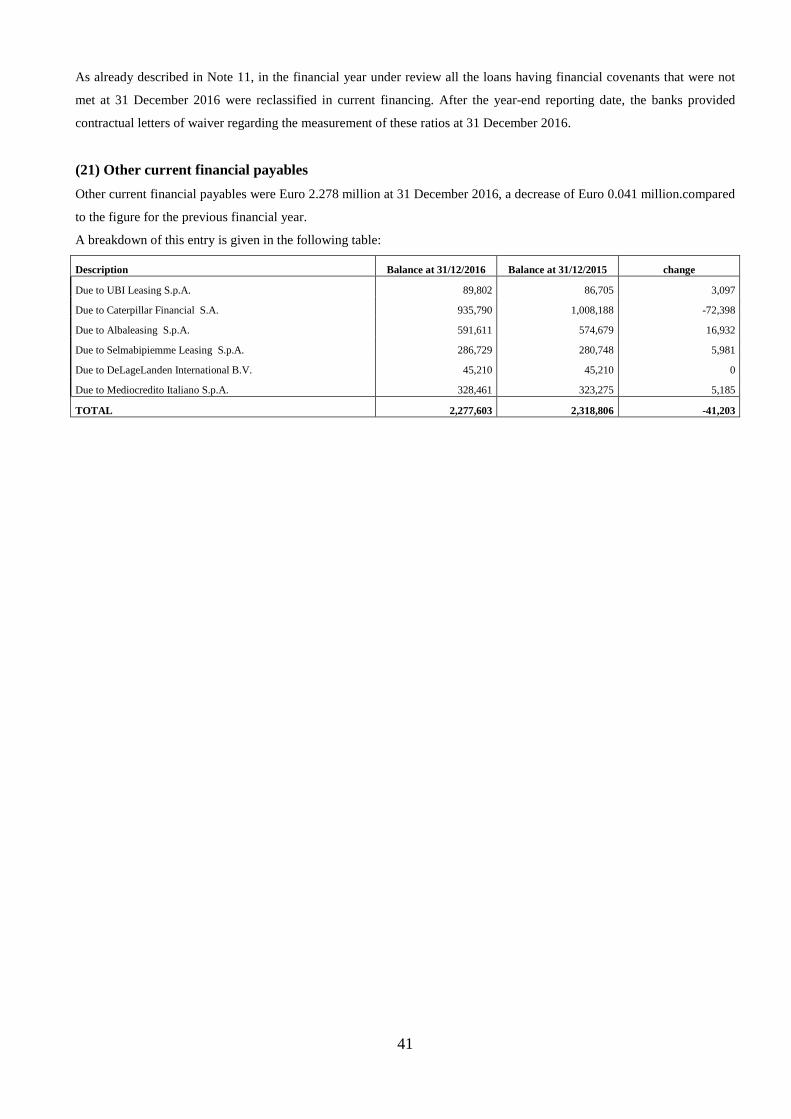
41
As already described in Note 11, in the financial year under review all the loans having financial covenants that were not
met at 31 December 2016 were reclassified in current financing. After the year-end reporting date, the banks provided
contractual letters of waiver regarding the measurement of these ratios at 31 December 2016.
(21) Other current financial payables
Other current financial payables were Euro 2.278 million at 31 December 2016, a decrease of Euro 0.041 million.compared
to the figure for the previous financial year.
A breakdown of this entry is given in the following table:
Description Balance at 31/12/2016 Balance at 31/12/2015 change
Due to UBI Leasing S.p.A. 89,802 86,705 3,097
Due to Caterpillar Financial S.A. 935,790 1,008,188 -72,398
Due to Albaleasing S.p.A. 591,611 574,679 16,932
Due to Selmabipiemme Leasing S.p.A. 286,729 280,748 5,981
Due to DeLageLanden International B.V. 45,210 45,210 0
Due to Mediocredito Italiano S.p.A. 328,461 323,275 5,185
TOTAL 2,277,603 2,318,806 -41,203
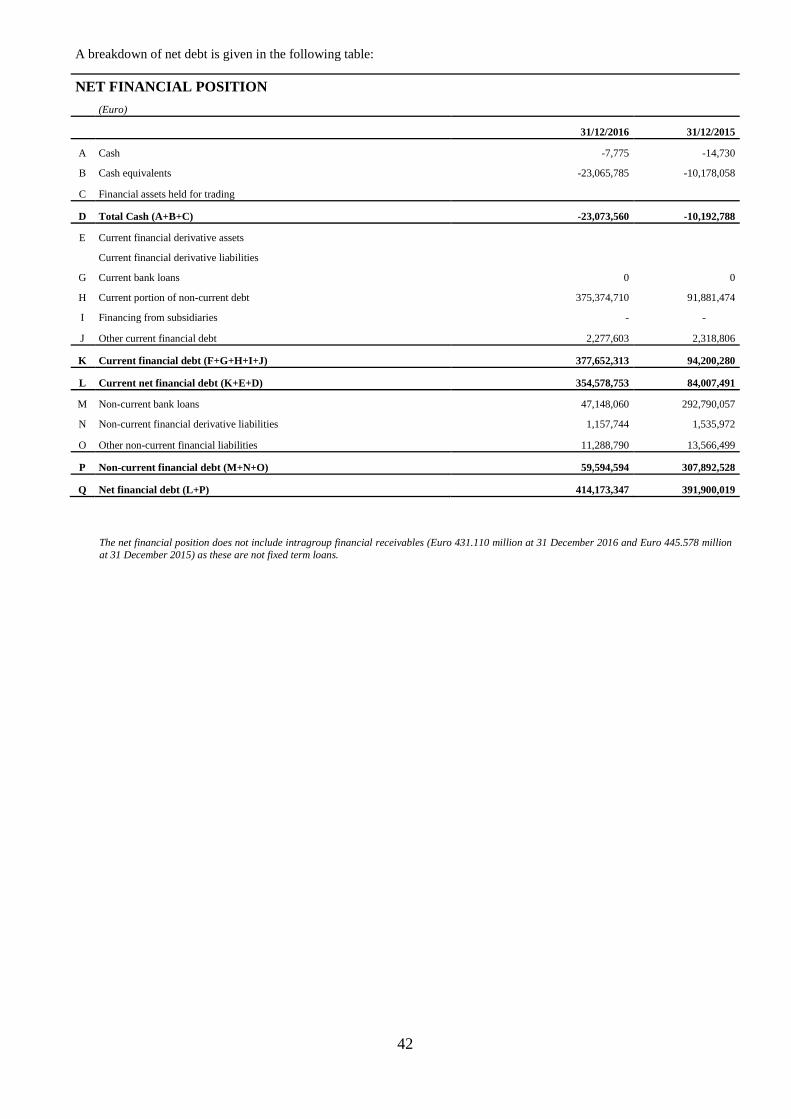
42
A breakdown of net debt is given in the following table:
NET FINANCIAL POSITION (Euro)
31/12/2016 31/12/2015
A Cash -7,775 -14,730
B Cash equivalents -23,065,785 -10,178,058
C Financial assets held for trading
D Total Cash (A+B+C) -23,073,560 -10,192,788
E Current financial derivative assets
Current financial derivative liabilities
G Current bank loans 0 0
H Current portion of non-current debt 375,374,710 91,881,474
I Financing from subsidiaries - -
J Other current financial debt 2,277,603 2,318,806
K Current financial debt (F+G+H+I+J) 377,652,313 94,200,280
L Current net financial debt (K+E+D) 354,578,753 84,007,491
M Non-current bank loans 47,148,060 292,790,057
N Non-current financial derivative liabilities 1,157,744 1,535,972
O Other non-current financial liabilities 11,288,790 13,566,499
P Non-current financial debt (M+N+O) 59,594,594 307,892,528
Q Net financial debt (L+P) 414,173,347 391,900,019
The net financial position does not include intragroup financial receivables (Euro 431.110 million at 31 December 2016 and Euro 445.578 million at 31 December 2015) as these are not fixed term loans.
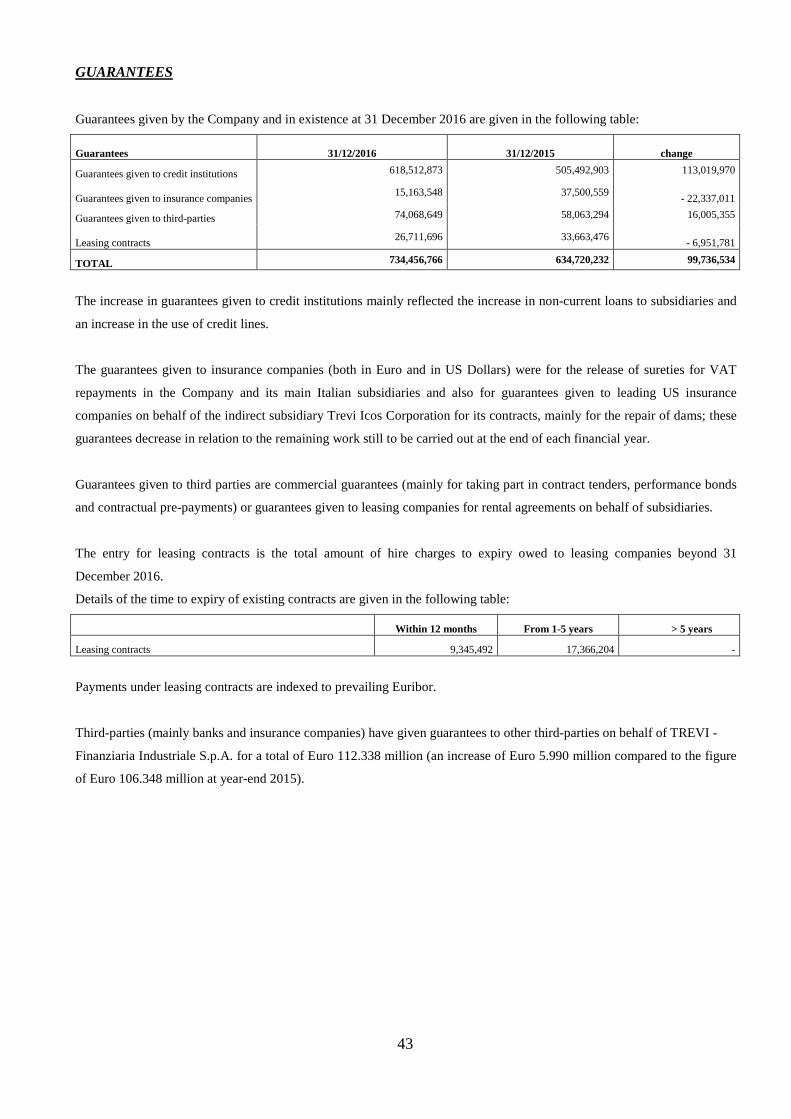
43
GUARANTEES
Guarantees given by the Company and in existence at 31 December 2016 are given in the following table:
Guarantees 31/12/2016
31/12/2015 change
Guarantees given to credit institutions 618,512,873 505,492,903 113,019,970
Guarantees given to insurance companies 15,163,548 37,500,559
- 22,337,011
Guarantees given to third-parties 74,068,649 58,063,294 16,005,355
Leasing contracts 26,711,696 33,663,476
- 6,951,781
TOTAL 734,456,766 634,720,232 99,736,534
The increase in guarantees given to credit institutions mainly reflected the increase in non-current loans to subsidiaries and
an increase in the use of credit lines.
The guarantees given to insurance companies (both in Euro and in US Dollars) were for the release of sureties for VAT
repayments in the Company and its main Italian subsidiaries and also for guarantees given to leading US insurance
companies on behalf of the indirect subsidiary Trevi Icos Corporation for its contracts, mainly for the repair of dams; these
guarantees decrease in relation to the remaining work still to be carried out at the end of each financial year.
Guarantees given to third parties are commercial guarantees (mainly for taking part in contract tenders, performance bonds
and contractual pre-payments) or guarantees given to leasing companies for rental agreements on behalf of subsidiaries.
The entry for leasing contracts is the total amount of hire charges to expiry owed to leasing companies beyond 31
December 2016.
Details of the time to expiry of existing contracts are given in the following table:
Within 12 months From 1-5 years > 5 years
Leasing contracts 9,345,492 17,366,204 -
Payments under leasing contracts are indexed to prevailing Euribor.
Third-parties (mainly banks and insurance companies) have given guarantees to other third-parties on behalf of TREVI -
Finanziaria Industriale S.p.A. for a total of Euro 112.338 million (an increase of Euro 5.990 million compared to the figure
of Euro 106.348 million at year-end 2015).
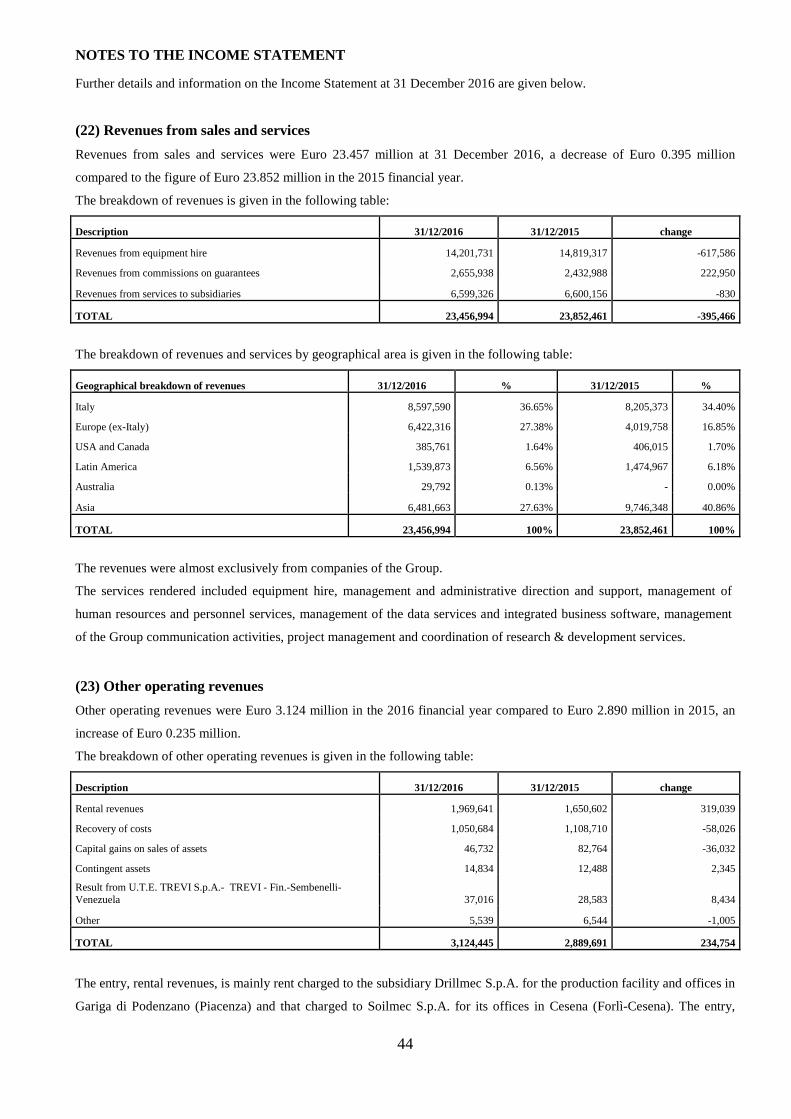
44
NOTES TO THE INCOME STATEMENT
Further details and information on the Income Statement at 31 December 2016 are given below.
(22) Revenues from sales and services
Revenues from sales and services were Euro 23.457 million at 31 December 2016, a decrease of Euro 0.395 million
compared to the figure of Euro 23.852 million in the 2015 financial year.
The breakdown of revenues is given in the following table:
Description 31/12/2016 31/12/2015 change
Revenues from equipment hire 14,201,731 14,819,317 -617,586
Revenues from commissions on guarantees 2,655,938 2,432,988 222,950
Revenues from services to subsidiaries 6,599,326 6,600,156 -830
TOTAL 23,456,994 23,852,461 -395,466
The breakdown of revenues and services by geographical area is given in the following table:
Geographical breakdown of revenues 31/12/2016 % 31/12/2015 %
Italy 8,597,590 36.65% 8,205,373 34.40%
Europe (ex-Italy) 6,422,316 27.38% 4,019,758 16.85%
USA and Canada 385,761 1.64% 406,015 1.70%
Latin America 1,539,873 6.56% 1,474,967 6.18%
Australia 29,792 0.13% - 0.00%
Asia 6,481,663 27.63% 9,746,348 40.86%
TOTAL 23,456,994 100% 23,852,461 100%
The revenues were almost exclusively from companies of the Group.
The services rendered included equipment hire, management and administrative direction and support, management of
human resources and personnel services, management of the data services and integrated business software, management
of the Group communication activities, project management and coordination of research & development services.
(23) Other operating revenues
Other operating revenues were Euro 3.124 million in the 2016 financial year compared to Euro 2.890 million in 2015, an
increase of Euro 0.235 million.
The breakdown of other operating revenues is given in the following table:
Description 31/12/2016 31/12/2015 change
Rental revenues 1,969,641 1,650,602 319,039
Recovery of costs 1,050,684 1,108,710 -58,026
Capital gains on sales of assets 46,732 82,764 -36,032
Contingent assets 14,834 12,488 2,345
Result from U.T.E. TREVI S.p.A.- TREVI - Fin.-Sembenelli- Venezuela 37,016 28,583 8,434
Other 5,539 6,544 -1,005
TOTAL 3,124,445 2,889,691 234,754
The entry, rental revenues, is mainly rent charged to the subsidiary Drillmec S.p.A. for the production facility and offices in
Gariga di Podenzano (Piacenza) and that charged to Soilmec S.p.A. for its offices in Cesena (Forlì-Cesena). The entry,
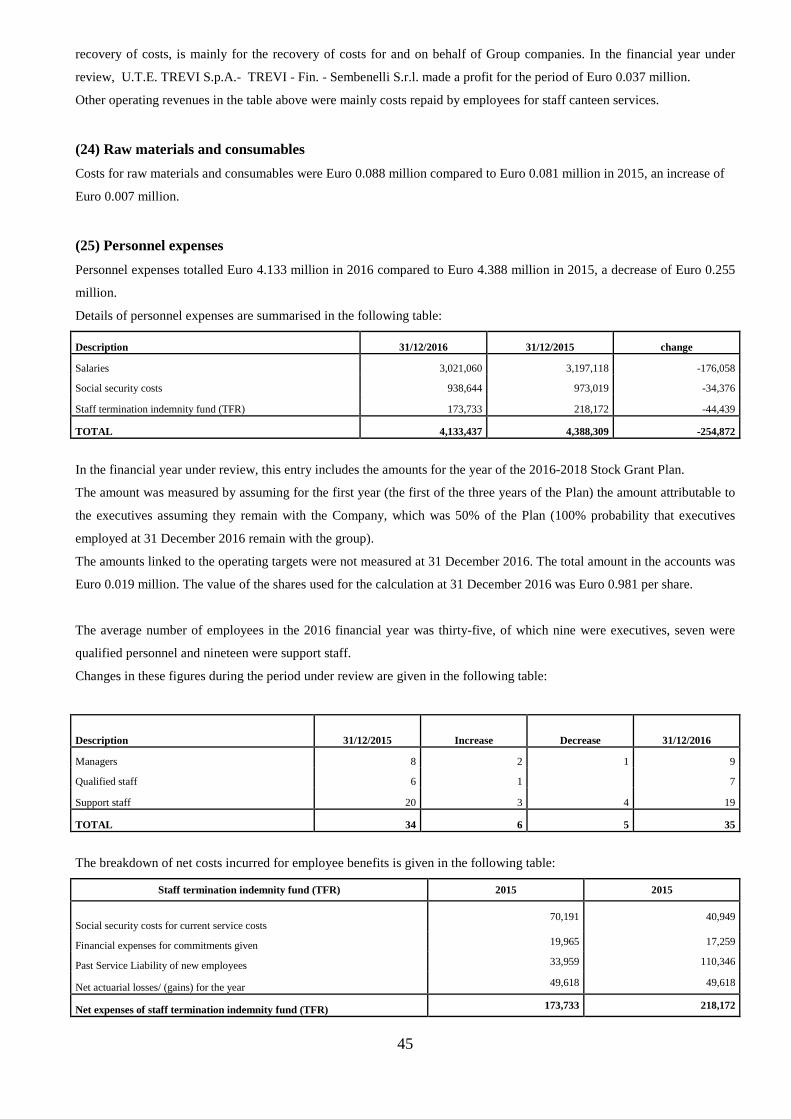
45
recovery of costs, is mainly for the recovery of costs for and on behalf of Group companies. In the financial year under
review, U.T.E. TREVI S.p.A.- TREVI - Fin. - Sembenelli S.r.l. made a profit for the period of Euro 0.037 million.
Other operating revenues in the table above were mainly costs repaid by employees for staff canteen services.
(24) Raw materials and consumables
Costs for raw materials and consumables were Euro 0.088 million compared to Euro 0.081 million in 2015, an increase of
Euro 0.007 million.
(25) Personnel expenses
Personnel expenses totalled Euro 4.133 million in 2016 compared to Euro 4.388 million in 2015, a decrease of Euro 0.255
million.
Details of personnel expenses are summarised in the following table:
Description 31/12/2016 31/12/2015 change
Salaries 3,021,060 3,197,118 -176,058
Social security costs 938,644 973,019 -34,376
Staff termination indemnity fund (TFR) 173,733 218,172 -44,439
TOTAL 4,133,437 4,388,309 -254,872
In the financial year under review, this entry includes the amounts for the year of the 2016-2018 Stock Grant Plan.
The amount was measured by assuming for the first year (the first of the three years of the Plan) the amount attributable to
the executives assuming they remain with the Company, which was 50% of the Plan (100% probability that executives
employed at 31 December 2016 remain with the group).
The amounts linked to the operating targets were not measured at 31 December 2016. The total amount in the accounts was
Euro 0.019 million. The value of the shares used for the calculation at 31 December 2016 was Euro 0.981 per share.
The average number of employees in the 2016 financial year was thirty-five, of which nine were executives, seven were
qualified personnel and nineteen were support staff.
Changes in these figures during the period under review are given in the following table:
Description 31/12/2015 Increase Decrease 31/12/2016
Managers 8 2 1 9
Qualified staff 6 1 7
Support staff 20 3 4 19
TOTAL 34 6 5 35
The breakdown of net costs incurred for employee benefits is given in the following table:
Staff termination indemnity fund (TFR) 2015 2015
Social security costs for current service costs 70,191 40,949
Financial expenses for commitments given 19,965 17,259
Past Service Liability of new employees 33,959 110,346
Net actuarial losses/ (gains) for the year 49,618 49,618
Net expenses of staff termination indemnity fund (TFR) 173,733 218,172
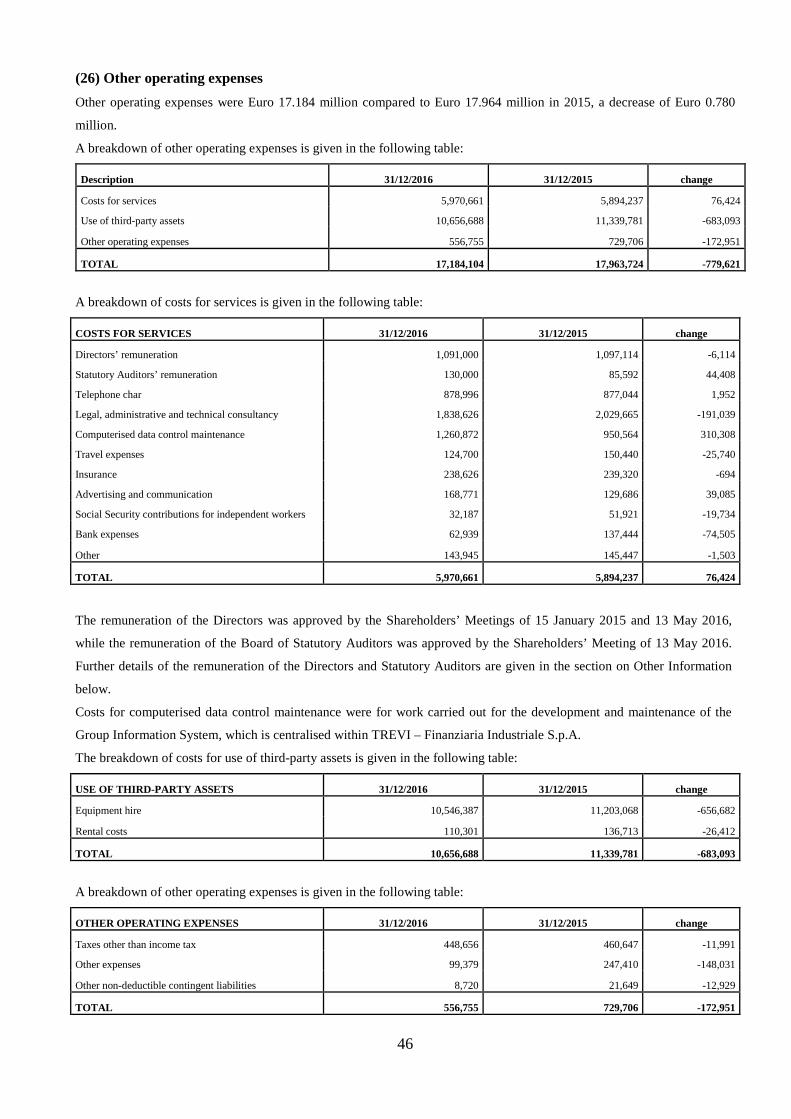
46
(26) Other operating expenses
Other operating expenses were Euro 17.184 million compared to Euro 17.964 million in 2015, a decrease of Euro 0.780
million.
A breakdown of other operating expenses is given in the following table:
Description 31/12/2016 31/12/2015 change
Costs for services 5,970,661 5,894,237 76,424
Use of third-party assets 10,656,688 11,339,781 -683,093
Other operating expenses 556,755 729,706 -172,951
TOTAL 17,184,104 17,963,724 -779,621
A breakdown of costs for services is given in the following table:
COSTS FOR SERVICES 31/12/2016 31/12/2015 change
Directors’ remuneration 1,091,000 1,097,114 -6,114
Statutory Auditors’ remuneration 130,000 85,592 44,408
Telephone char 878,996 877,044 1,952
Legal, administrative and technical consultancy 1,838,626 2,029,665 -191,039
Computerised data control maintenance 1,260,872 950,564 310,308
Travel expenses 124,700 150,440 -25,740
Insurance 238,626 239,320 -694
Advertising and communication 168,771 129,686 39,085
Social Security contributions for independent workers 32,187 51,921 -19,734
Bank expenses 62,939 137,444 -74,505
Other 143,945 145,447 -1,503
TOTAL 5,970,661 5,894,237 76,424
The remuneration of the Directors was approved by the Shareholders’ Meetings of 15 January 2015 and 13 May 2016,
while the remuneration of the Board of Statutory Auditors was approved by the Shareholders’ Meeting of 13 May 2016.
Further details of the remuneration of the Directors and Statutory Auditors are given in the section on Other Information
below.
Costs for computerised data control maintenance were for work carried out for the development and maintenance of the
Group Information System, which is centralised within TREVI – Finanziaria Industriale S.p.A.
The breakdown of costs for use of third-party assets is given in the following table:
USE OF THIRD-PARTY ASSETS 31/12/2016 31/12/2015 change
Equipment hire 10,546,387 11,203,068 -656,682
Rental costs 110,301 136,713 -26,412
TOTAL 10,656,688 11,339,781 -683,093
A breakdown of other operating expenses is given in the following table:
OTHER OPERATING EXPENSES 31/12/2016 31/12/2015 change
Taxes other than income tax 448,656 460,647 -11,991
Other expenses 99,379 247,410 -148,031
Other non-deductible contingent liabilities 8,720 21,649 -12,929
TOTAL 556,755 729,706 -172,951
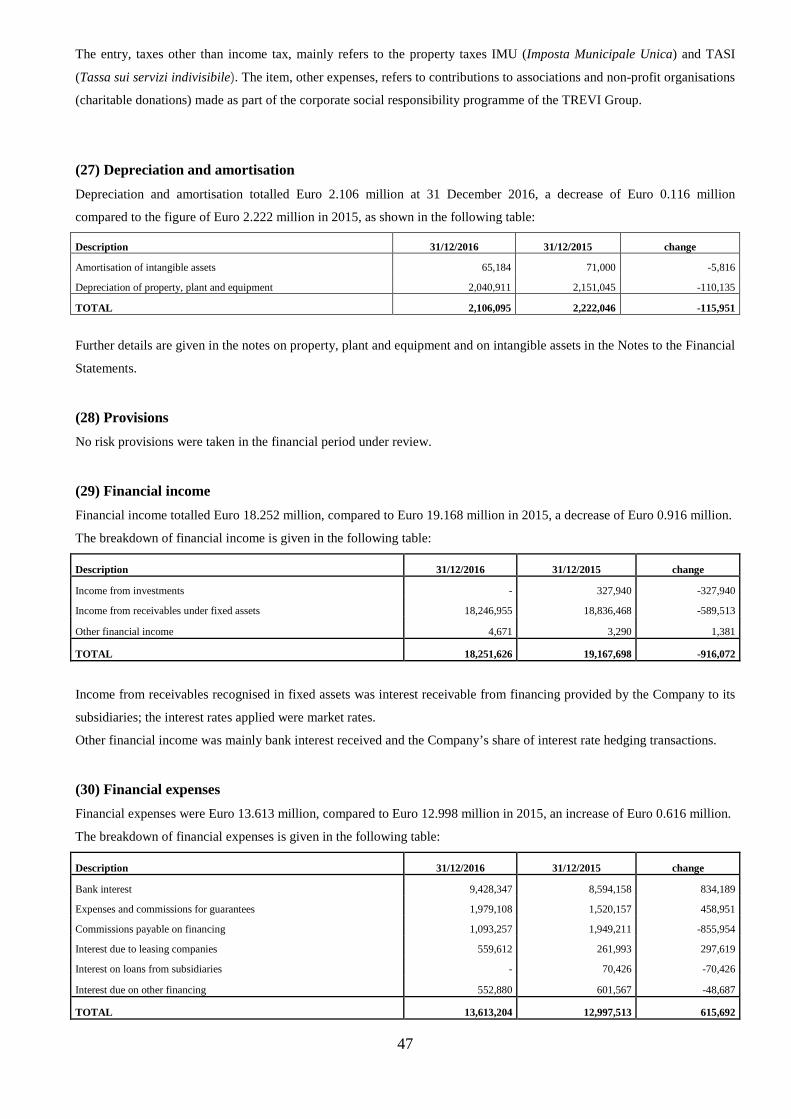
47
The entry, taxes other than income tax, mainly refers to the property taxes IMU (Imposta Municipale Unica) and TASI
(Tassa sui servizi indivisibile). The item, other expenses, refers to contributions to associations and non-profit organisations
(charitable donations) made as part of the corporate social responsibility programme of the TREVI Group.
(27) Depreciation and amortisation
Depreciation and amortisation totalled Euro 2.106 million at 31 December 2016, a decrease of Euro 0.116 million
compared to the figure of Euro 2.222 million in 2015, as shown in the following table:
Description 31/12/2016 31/12/2015 change
Amortisation of intangible assets 65,184 71,000 -5,816
Depreciation of property, plant and equipment 2,040,911 2,151,045 -110,135
TOTAL 2,106,095 2,222,046 -115,951
Further details are given in the notes on property, plant and equipment and on intangible assets in the Notes to the Financial
Statements.
(28) Provisions
No risk provisions were taken in the financial period under review.
(29) Financial income
Financial income totalled Euro 18.252 million, compared to Euro 19.168 million in 2015, a decrease of Euro 0.916 million.
The breakdown of financial income is given in the following table:
Description 31/12/2016 31/12/2015 change
Income from investments - 327,940 -327,940
Income from receivables under fixed assets 18,246,955 18,836,468 -589,513
Other financial income 4,671 3,290 1,381
TOTAL 18,251,626 19,167,698 -916,072
Income from receivables recognised in fixed assets was interest receivable from financing provided by the Company to its
subsidiaries; the interest rates applied were market rates.
Other financial income was mainly bank interest received and the Company’s share of interest rate hedging transactions.
(30) Financial expenses
Financial expenses were Euro 13.613 million, compared to Euro 12.998 million in 2015, an increase of Euro 0.616 million.
The breakdown of financial expenses is given in the following table:
Description 31/12/2016 31/12/2015 change
Bank interest 9,428,347 8,594,158 834,189
Expenses and commissions for guarantees 1,979,108 1,520,157 458,951
Commissions payable on financing 1,093,257 1,949,211 -855,954
Interest due to leasing companies 559,612 261,993 297,619
Interest on loans from subsidiaries - 70,426 -70,426
Interest due on other financing 552,880 601,567 -48,687
TOTAL 13,613,204 12,997,513 615,692
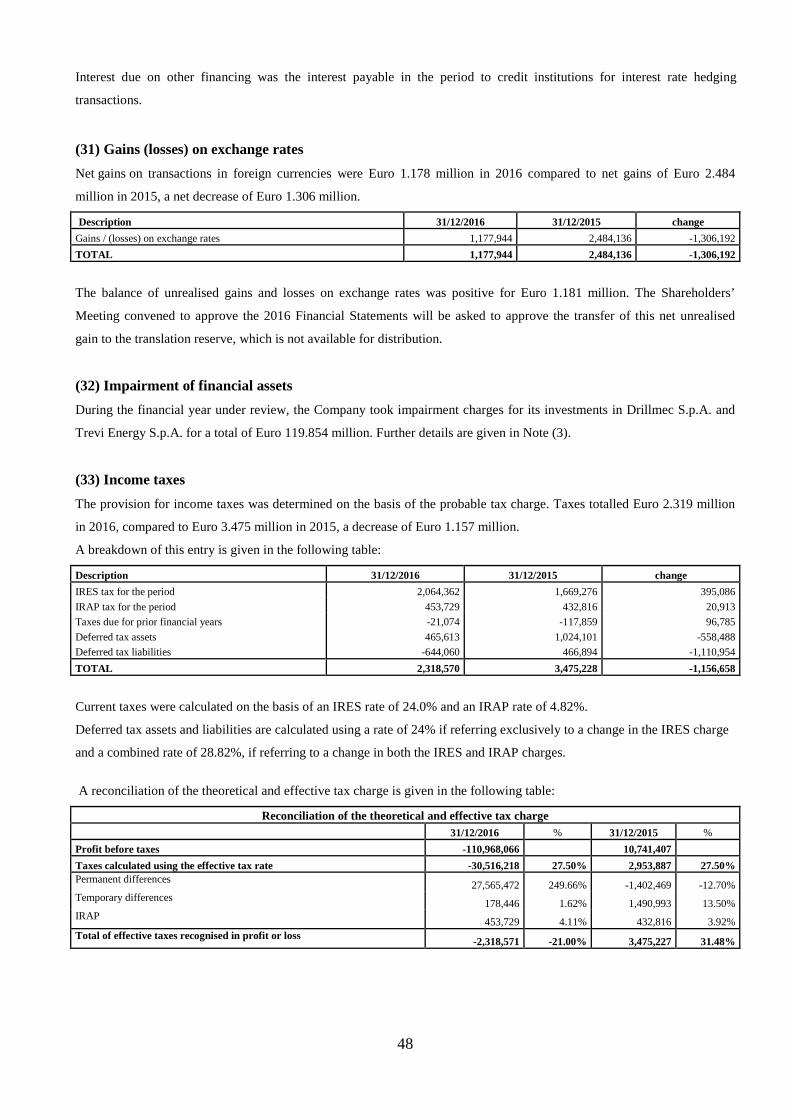
48
Interest due on other financing was the interest payable in the period to credit institutions for interest rate hedging
transactions.
(31) Gains (losses) on exchange rates
Net gains on transactions in foreign currencies were Euro 1.178 million in 2016 compared to net gains of Euro 2.484
million in 2015, a net decrease of Euro 1.306 million.
Description 31/12/2016 31/12/2015 change
Gains / (losses) on exchange rates 1,177,944 2,484,136 -1,306,192
TOTAL 1,177,944 2,484,136 -1,306,192
The balance of unrealised gains and losses on exchange rates was positive for Euro 1.181 million. The Shareholders’
Meeting convened to approve the 2016 Financial Statements will be asked to approve the transfer of this net unrealised
gain to the translation reserve, which is not available for distribution.
(32) Impairment of financial assets
During the financial year under review, the Company took impairment charges for its investments in Drillmec S.p.A. and
Trevi Energy S.p.A. for a total of Euro 119.854 million. Further details are given in Note (3).
(33) Income taxes
The provision for income taxes was determined on the basis of the probable tax charge. Taxes totalled Euro 2.319 million
in 2016, compared to Euro 3.475 million in 2015, a decrease of Euro 1.157 million.
A breakdown of this entry is given in the following table:
Description 31/12/2016 31/12/2015 change
IRES tax for the period 2,064,362 1,669,276 395,086
IRAP tax for the period 453,729 432,816 20,913
Taxes due for prior financial years -21,074 -117,859 96,785
Deferred tax assets 465,613 1,024,101 -558,488
Deferred tax liabilities -644,060 466,894 -1,110,954
TOTAL 2,318,570 3,475,228 -1,156,658
Current taxes were calculated on the basis of an IRES rate of 24.0% and an IRAP rate of 4.82%.
Deferred tax assets and liabilities are calculated using a rate of 24% if referring exclusively to a change in the IRES charge
and a combined rate of 28.82%, if referring to a change in both the IRES and IRAP charges.
A reconciliation of the theoretical and effective tax charge is given in the following table:
Reconciliation of the theoretical and effective tax charge 31/12/2016 % 31/12/2015 %
Profit before taxes -110,968,066 10,741,407
Taxes calculated using the effective tax rate -30,516,218 27.50% 2,953,887 27.50% Permanent differences
27,565,472 249.66% -1,402,469 -12.70% Temporary differences
178,446 1.62% 1,490,993 13.50% IRAP
453,729 4.11% 432,816 3.92% Total of effective taxes recognised in profit or loss -2,318,571 -21.00% 3,475,227 31.48%
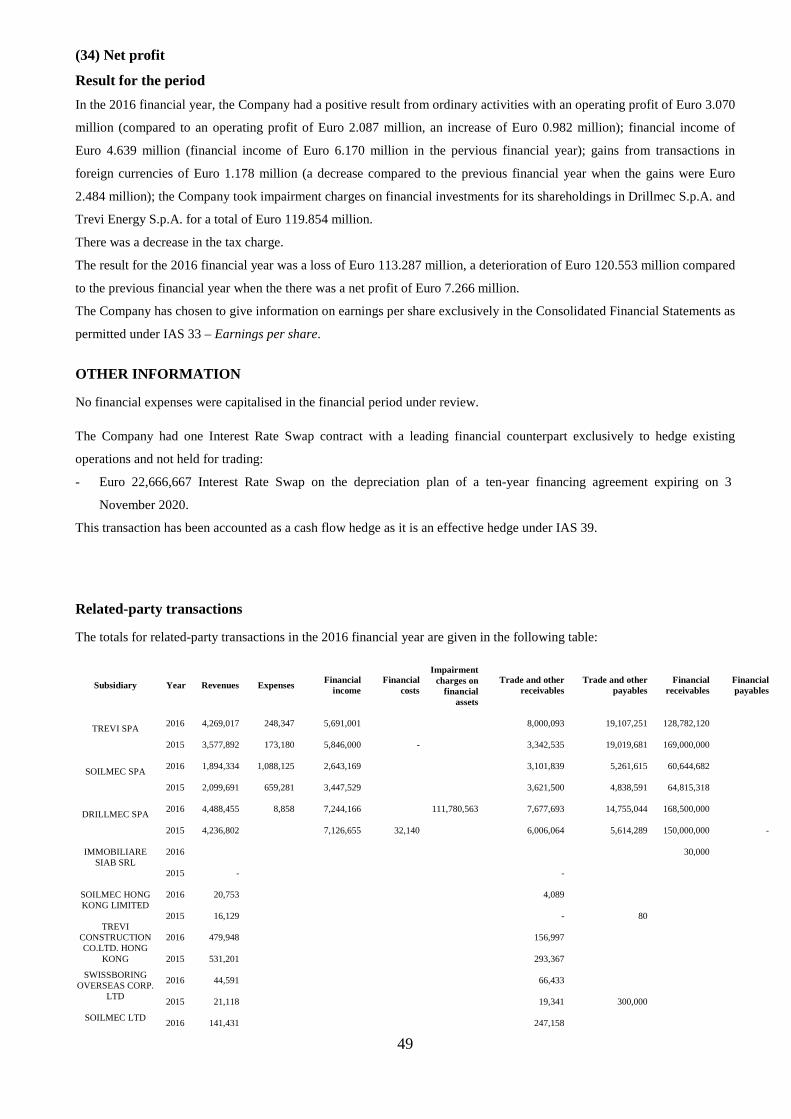
49
(34) Net profit
Result for the period
In the 2016 financial year, the Company had a positive result from ordinary activities with an operating profit of Euro 3.070
million (compared to an operating profit of Euro 2.087 million, an increase of Euro 0.982 million); financial income of
Euro 4.639 million (financial income of Euro 6.170 million in the pervious financial year); gains from transactions in
foreign currencies of Euro 1.178 million (a decrease compared to the previous financial year when the gains were Euro
2.484 million); the Company took impairment charges on financial investments for its shareholdings in Drillmec S.p.A. and
Trevi Energy S.p.A. for a total of Euro 119.854 million.
There was a decrease in the tax charge.
The result for the 2016 financial year was a loss of Euro 113.287 million, a deterioration of Euro 120.553 million compared
to the previous financial year when the there was a net profit of Euro 7.266 million.
The Company has chosen to give information on earnings per share exclusively in the Consolidated Financial Statements as
permitted under IAS 33 – Earnings per share.
OTHER INFORMATION
No financial expenses were capitalised in the financial period under review.
The Company had one Interest Rate Swap contract with a leading financial counterpart exclusively to hedge existing
operations and not held for trading:
- Euro 22,666,667 Interest Rate Swap on the depreciation plan of a ten-year financing agreement expiring on 3
November 2020.
This transaction has been accounted as a cash flow hedge as it is an effective hedge under IAS 39.
Related-party transactions
The totals for related-party transactions in the 2016 financial year are given in the following table:
Subsidiary
Year
Revenues
Expenses
Financial
income
Financial
costs
Impairment
charges on financial
assets
Trade and other
receivables
Trade and other
payables
Financial
receivables
Financial payables
TREVI SPA 2016
4,269,017
248,347
5,691,001
8,000,093
19,107,251
128,782,120
2015
3,577,892
173,180
5,846,000
-
3,342,535
19,019,681
169,000,000
SOILMEC SPA 2016
1,894,334
1,088,125
2,643,169
3,101,839
5,261,615
60,644,682
2015
2,099,691
659,281
3,447,529
3,621,500
4,838,591
64,815,318
DRILLMEC SPA 2016
4,488,455
8,858
7,244,166
111,780,563
7,677,693
14,755,044
168,500,000
2015
4,236,802
7,126,655
32,140
6,006,064
5,614,289
150,000,000
-
IMMOBILIARE SIAB SRL
2016
30,000
2015
-
-
SOILMEC HONG KONG LIMITED
2016
20,753
4,089
2015
16,129
-
80 TREVI
CONSTRUCTION CO.LTD. HONG
KONG
2016
479,948
156,997
2015
531,201
293,367
SWISSBORING OVERSEAS CORP.
LTD
2016
44,591
66,433
2015
21,118
19,341
300,000
SOILMEC LTD 2016
141,431
247,158
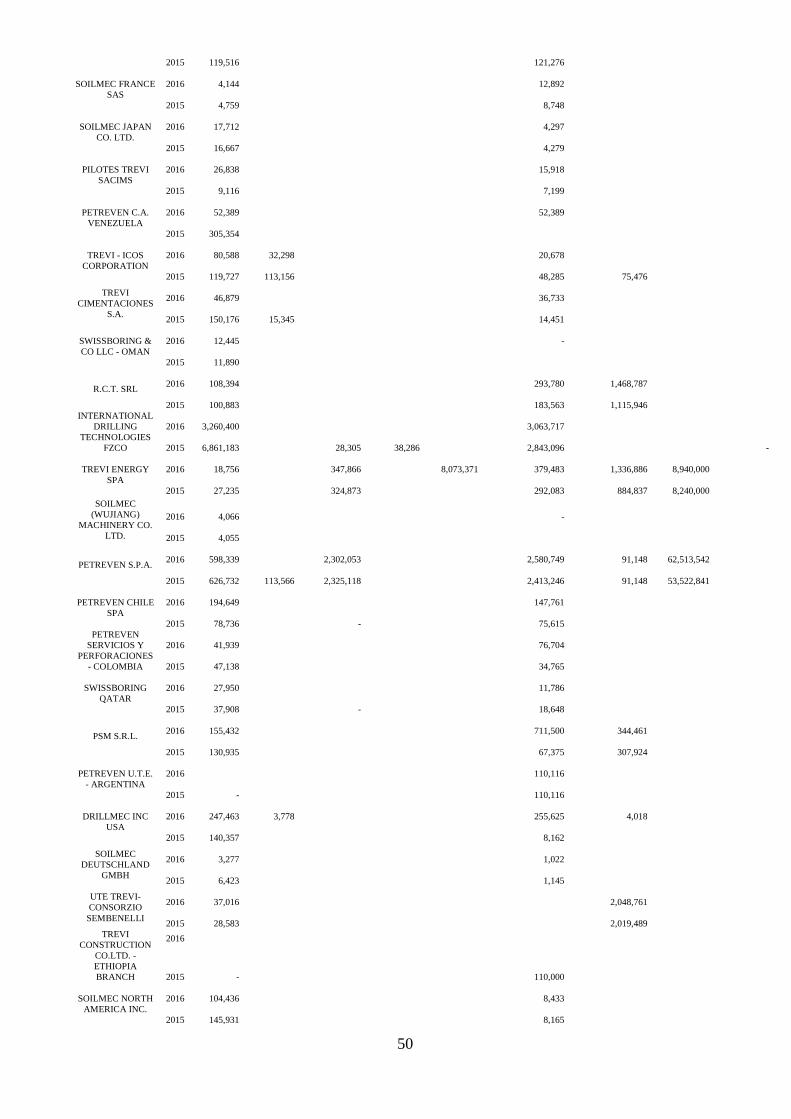
50
2015
119,516
121,276
SOILMEC FRANCE SAS
2016
4,144
12,892
2015
4,759
8,748
SOILMEC JAPAN CO. LTD.
2016
17,712
4,297
2015
16,667
4,279
PILOTES TREVI SACIMS
2016
26,838
15,918
2015
9,116
7,199
PETREVEN C.A. VENEZUELA
2016
52,389
52,389
2015
305,354
TREVI - ICOS CORPORATION
2016
80,588
32,298
20,678
2015
119,727
113,156
48,285
75,476
TREVI CIMENTACIONES
S.A.
2016
46,879
36,733
2015
150,176
15,345
14,451
SWISSBORING & CO LLC - OMAN
2016
12,445
-
2015
11,890
R.C.T. SRL 2016
108,394
293,780
1,468,787
2015
100,883
183,563
1,115,946 INTERNATIONAL
DRILLING TECHNOLOGIES
FZCO
2016
3,260,400
3,063,717
2015
6,861,183
28,305
38,286
2,843,096
-
TREVI ENERGY SPA
2016
18,756
347,866
8,073,371
379,483
1,336,886
8,940,000
2015
27,235
324,873
292,083
884,837
8,240,000
SOILMEC (WUJIANG)
MACHINERY CO. LTD.
2016
4,066
-
2015
4,055
PETREVEN S.P.A. 2016
598,339
2,302,053
2,580,749
91,148
62,513,542
2015
626,732
113,566
2,325,118
2,413,246
91,148
53,522,841
PETREVEN CHILE SPA
2016
194,649
147,761
2015
78,736
-
75,615 PETREVEN
SERVICIOS Y PERFORACIONES
- COLOMBIA
2016
41,939
76,704
2015
47,138
34,765
SWISSBORING QATAR
2016
27,950
11,786
2015
37,908
-
18,648
PSM S.R.L. 2016
155,432
711,500
344,461
2015
130,935
67,375
307,924
PETREVEN U.T.E. - ARGENTINA
2016
110,116
2015
-
110,116
DRILLMEC INC USA
2016
247,463
3,778
255,625
4,018
2015
140,357
8,162
SOILMEC DEUTSCHLAND
GMBH
2016
3,277
1,022
2015
6,423
1,145
UTE TREVI- CONSORZIO SEMBENELLI
2016
37,016
2,048,761
2015
28,583
2,019,489 TREVI
CONSTRUCTION CO.LTD. - ETHIOPIA BRANCH
2016
2015
-
110,000
SOILMEC NORTH AMERICA INC.
2016
104,436
8,433
2015
145,931
8,165
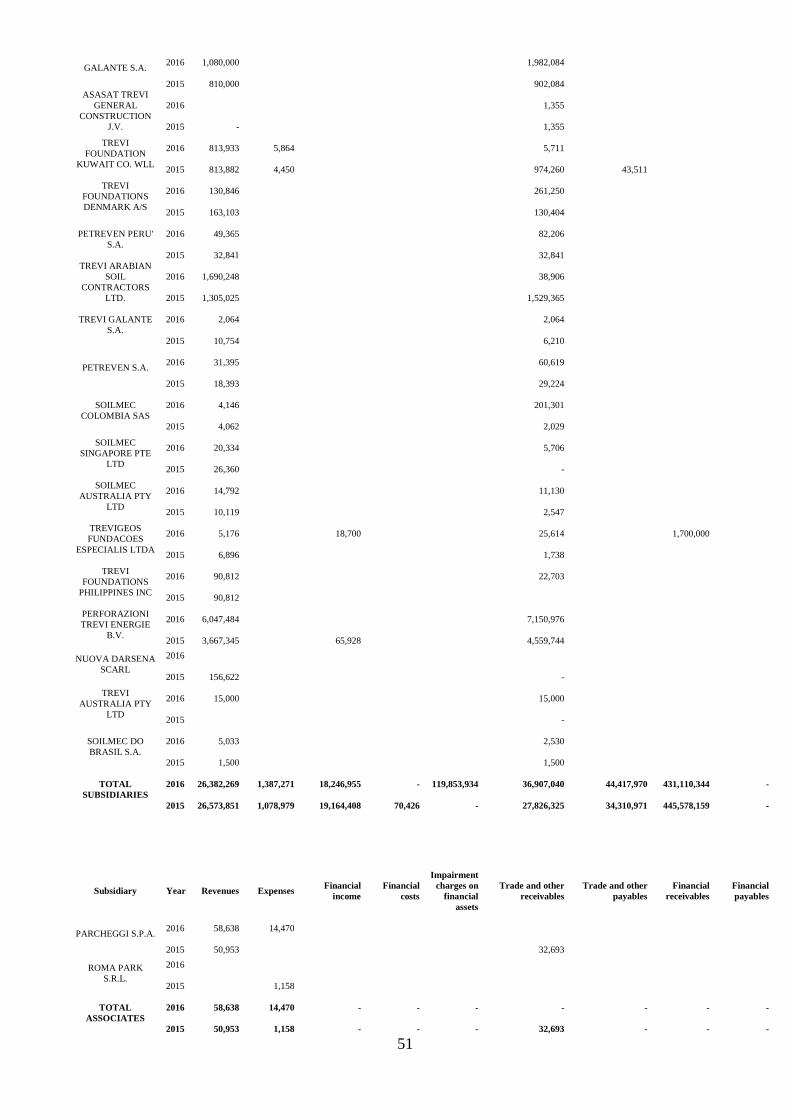
51
GALANTE S.A. 2016
1,080,000
1,982,084
2015
810,000
902,084 ASASAT TREVI
GENERAL CONSTRUCTION
J.V.
2016
1,355
2015
-
1,355
TREVI FOUNDATION
KUWAIT CO. WLL
2016
813,933
5,864
5,711
2015
813,882
4,450
974,260
43,511
TREVI FOUNDATIONS DENMARK A/S
2016
130,846
261,250
2015
163,103
130,404
PETREVEN PERU' S.A.
2016
49,365
82,206
2015
32,841
32,841 TREVI ARABIAN
SOIL CONTRACTORS
LTD.
2016
1,690,248
38,906
2015
1,305,025
1,529,365
TREVI GALANTE S.A.
2016
2,064
2,064
2015
10,754
6,210
PETREVEN S.A. 2016
31,395
60,619
2015
18,393
29,224
SOILMEC COLOMBIA SAS
2016
4,146
201,301
2015
4,062
2,029
SOILMEC SINGAPORE PTE
LTD
2016
20,334
5,706
2015
26,360
-
SOILMEC AUSTRALIA PTY
LTD
2016
14,792
11,130
2015
10,119
2,547
TREVIGEOS FUNDACOES
ESPECIALIS LTDA
2016
5,176
18,700
25,614
1,700,000
2015
6,896
1,738
TREVI FOUNDATIONS
PHILIPPINES INC
2016
90,812
22,703
2015
90,812
PERFORAZIONI TREVI ENERGIE
B.V.
2016
6,047,484
7,150,976
2015
3,667,345
65,928
4,559,744
NUOVA DARSENA SCARL
2016
2015
156,622
-
TREVI AUSTRALIA PTY
LTD
2016
15,000
15,000
2015
-
SOILMEC DO BRASIL S.A.
2016
5,033
2,530
2015
1,500
1,500
TOTAL SUBSIDIARIES
2016
26,382,269
1,387,271
18,246,955
-
119,853,934
36,907,040
44,417,970
431,110,344
-
2015
26,573,851
1,078,979
19,164,408
70,426
-
27,826,325
34,310,971
445,578,159
-
Subsidiary
Year
Revenues
Expenses
Financial
income
Financial
costs
Impairment
charges on financial
assets
Trade and other
receivables
Trade and other
payables
Financial
receivables
Financial payables
PARCHEGGI S.P.A. 2016
58,638
14,470
2015
50,953
32,693
ROMA PARK S.R.L.
2016
2015
1,158
TOTAL ASSOCIATES
2016
58,638
14,470
-
-
-
-
-
-
-
2015
50,953
1,158
-
-
-
32,693
-
-
-
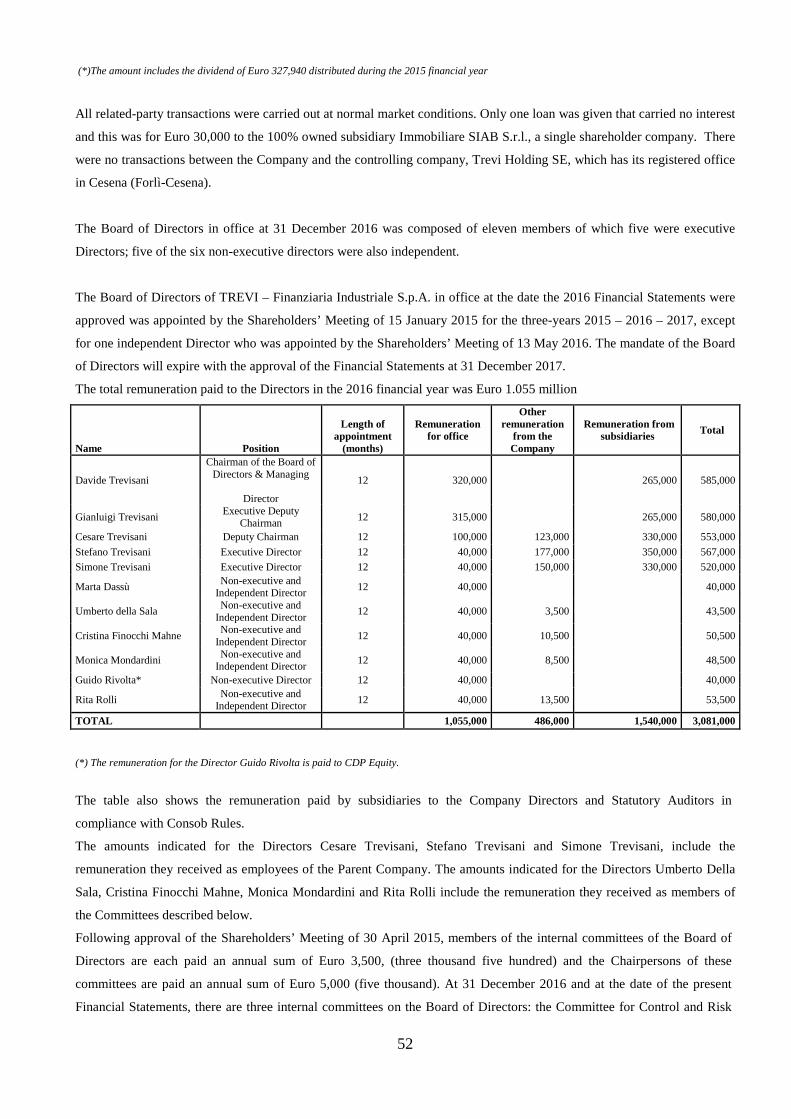
52
(*)The amount includes the dividend of Euro 327,940 distributed during the 2015 financial year
All related-party transactions were carried out at normal market conditions. Only one loan was given that carried no interest
and this was for Euro 30,000 to the 100% owned subsidiary Immobiliare SIAB S.r.l., a single shareholder company. There
were no transactions between the Company and the controlling company, Trevi Holding SE, which has its registered office
in Cesena (Forlì-Cesena).
The Board of Directors in office at 31 December 2016 was composed of eleven members of which five were executive
Directors; five of the six non-executive directors were also independent.
The Board of Directors of TREVI – Finanziaria Industriale S.p.A. in office at the date the 2016 Financial Statements were
approved was appointed by the Shareholders’ Meeting of 15 January 2015 for the three-years 2015 – 2016 – 2017, except
for one independent Director who was appointed by the Shareholders’ Meeting of 13 May 2016. The mandate of the Board
of Directors will expire with the approval of the Financial Statements at 31 December 2017.
The total remuneration paid to the Directors in the 2016 financial year was Euro 1.055 million
Name Position
Length of appointment
(months)
Remuneration for office
Other remuneration
from the Company
Remuneration from subsidiaries Total
Davide Trevisani
Chairman of the Board of Directors & Managing
Director
12 320,000 265,000 585,000
Gianluigi Trevisani Executive Deputy
Chairman 12 315,000 265,000 580,000
Cesare Trevisani Deputy Chairman 12 100,000 123,000 330,000 553,000
Stefano Trevisani Executive Director 12 40,000 177,000 350,000 567,000
Simone Trevisani Executive Director 12 40,000 150,000 330,000 520,000
Marta Dassù Non-executive and
Independent Director 12 40,000 40,000
Umberto della Sala Non-executive and
Independent Director 12 40,000 3,500 43,500
Cristina Finocchi Mahne Non-executive and
Independent Director 12 40,000 10,500 50,500
Monica Mondardini Non-executive and
Independent Director 12 40,000 8,500 48,500
Guido Rivolta* Non-executive Director 12 40,000 40,000
Rita Rolli Non-executive and
Independent Director 12 40,000 13,500 53,500
TOTAL 1,055,000 486,000 1,540,000 3,081,000
(*) The remuneration for the Director Guido Rivolta is paid to CDP Equity.
The table also shows the remuneration paid by subsidiaries to the Company Directors and Statutory Auditors in
compliance with Consob Rules.
The amounts indicated for the Directors Cesare Trevisani, Stefano Trevisani and Simone Trevisani, include the
remuneration they received as employees of the Parent Company. The amounts indicated for the Directors Umberto Della
Sala, Cristina Finocchi Mahne, Monica Mondardini and Rita Rolli include the remuneration they received as members of
the Committees described below.
Following approval of the Shareholders’ Meeting of 30 April 2015, members of the internal committees of the Board of
Directors are each paid an annual sum of Euro 3,500, (three thousand five hundred) and the Chairpersons of these
committees are paid an annual sum of Euro 5,000 (five thousand). At 31 December 2016 and at the date of the present
Financial Statements, there are three internal committees on the Board of Directors: the Committee for Control and Risk
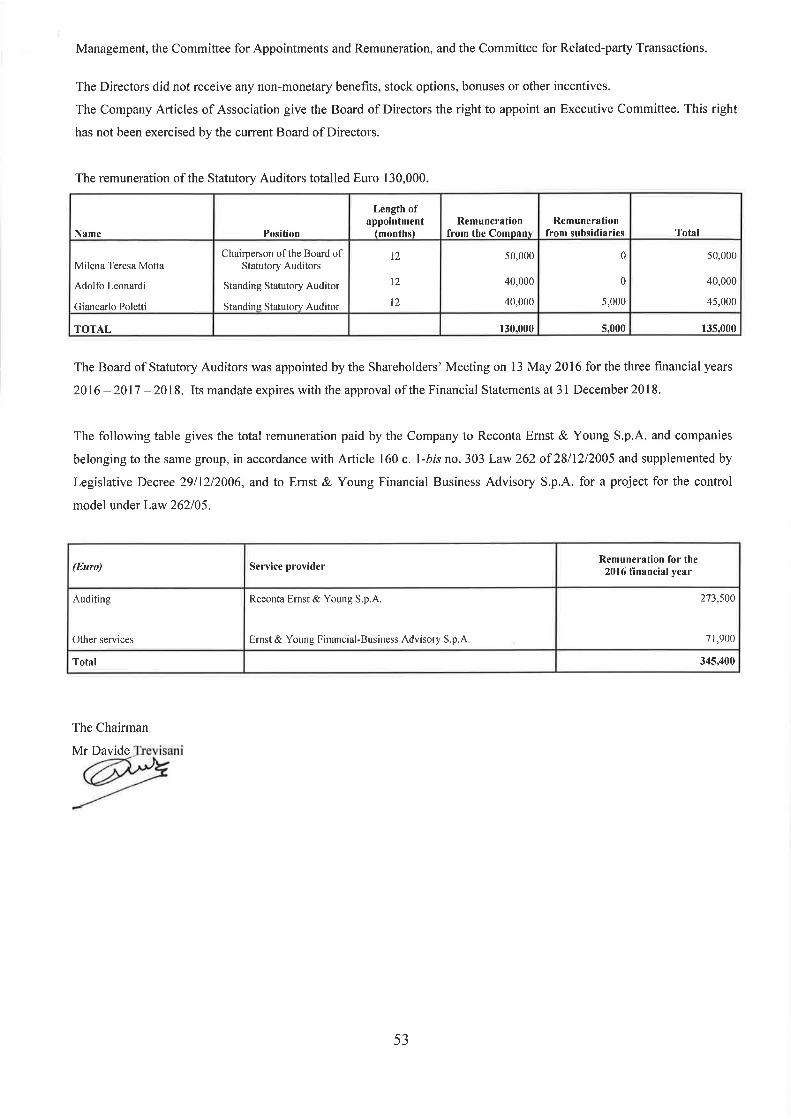

TREVI – Finanziaria Industriale S.p.A.Financial statements as at 31 December 2016
Independent auditor’s report in accordance with articles 14 and16 of Legislative Decree n. 39, dated 27 January 2010
EY S.p.A.Sede Legale: Via Po, 32 - 00198 RomaCapitale Sociale deliberato Euro 3.250.000,00, sottoscritto e versato Euro 2.950.000,00 i.v.Iscritta alla S.O. del Registro delle Imprese presso la C.C.I.A.A. di RomaCodice fiscale e numero di iscrizione 00434000584 - numero R.E.A. 250904P.IVA 00891231003Iscritta al Registro Revisori Legali al n. 70945 Pubblicato sulla G.U. Suppl. 13 - IV Serie Speciale del 17/2/1998Iscritta all’Albo Speciale delle società di revisioneConsob al progressivo n. 2 delibera n.10831 del 16/7/1997
A member firm of Ernst & Young Global Limited
EY S.p.A.Via Massimo D'Azeglio, 3440123 Bologna
Tel: +39 051 278311Fax: +39 051 236666ey.com
Independent auditor’s report in accordance with articles 14 and 16 oflegislative decree n. 39, dated 27 January 2010(Translation from the original Italian text)
To the Shareholders ofTREVI – Finanziaria Industriale S.p.A.
Report on the financial statementsWe have audited the accompanying financial statements of TREVI – Finanziaria Industriale S.p.A.,which comprise the statement of financial position as at 31 December 2016, the income statement,statement of comprehensive income, statement of changes in net equity and statement of cash flowsfor the year then ended, and a summary of significant accounting policies and other explanatorynotes.
Directors’ responsibility for the financial statementsThe Directors of TREVI – Finanziaria Industriale S.p.A. are responsible for the preparation of thesefinancial statements that give a true and fair view in accordance with International FinancialReporting Standards as adopted by the European Union as well as with the regulations issued toimplement art. 9 of Legislative Decree n. 38, dated 28 February 2005.
Auditor's responsibilityOur responsibility is to express an opinion on these financial statements based on our audit. Weconducted our audit in accordance with International Standards on Auditing (ISA Italia) implementedin accordance with article 11 of Legislative Decree n. 39, dated 27 January 2010. Those standardsrequire that we comply with ethical requirements and plan and perform the audit to obtain reasonableassurance about whether the financial statements are free from material misstatement.
An audit involves performing procedures to obtain audit evidence about the amounts and disclosuresin the financial statements. The procedures selected depend on the auditor's professional judgment,including the assessment of the risks of material misstatement of the financial statements, whetherdue to fraud or error. In making those risk assessments, the auditor considers internal control relevantto the entity's preparation of the financial statements that give a true and fair view in order to designaudit procedures that are appropriate in the circumstances, but not for the purpose of expressing anopinion on the effectiveness of the entity's internal control. An audit also includes evaluating theappropriateness of accounting policies used and the reasonableness of accounting estimates made byDirectors, as well as evaluating the overall presentation of the financial statements.
We believe that the audit evidence we have obtained is sufficient and appropriate to provide a basisfor our audit opinion.
3
OpinionIn our opinion, the financial statements give a true and fair view of the financial position of TREVI –Finanziaria Industriale S.p.A. as at 31 December 2016, and of its financial performance and its cashflows for the year then ended in accordance with International Financial Reporting Standards asadopted by the European Union and with article 9 of Legislative Decree n. 38, dated 28 February2005.
Report on other legal and regulatory requirementsOpinion on the consistency of the Report on Operations and of specific informationof the Report on Corporate Governance and on the Company’s OwnershipStructure with the financial statementsWe have performed the procedures required under audit standard SA Italia n. 720B in order toexpress an opinion, as required by law, on the consistency of the Report on Operations and of specificinformation of the Report on Corporate Governance and on the Company’s Ownership Structure asprovided for by article 123-bis, paragraph 4 of Legislative Decree n. 58, dated 24 February 1998,with the financial statements. The Directors of TREVI – Finanziaria Industriale S.p.A. are responsiblefor the preparation of the Report on Operations and of the Report on Corporate Governance and onthe Company’s Ownership Structure in accordance with the applicable laws and regulations. In ouropinion the Report on Operations and the specific information of the Report on Corporate Governanceand on the Company’s Ownership Structure are consistent with the financial statements of TREVI –Finanziaria Industriale S.p.A. as at 31 December 2016.
Bologna, 21 April 2017
EY S.p.A.Signed by: Andrea Nobili, Partner
This report has been translated into the English language solely for the convenience of internationalreaders.