Trends KPIs in the professional services industry 2021 ...
27
Executive summary Trends & KPIs in the professional services industry 2021 industry benchmark
Transcript of Trends KPIs in the professional services industry 2021 ...

Executive
summary
Trends & KPIs in the professional services industry
2021 industry benchmark
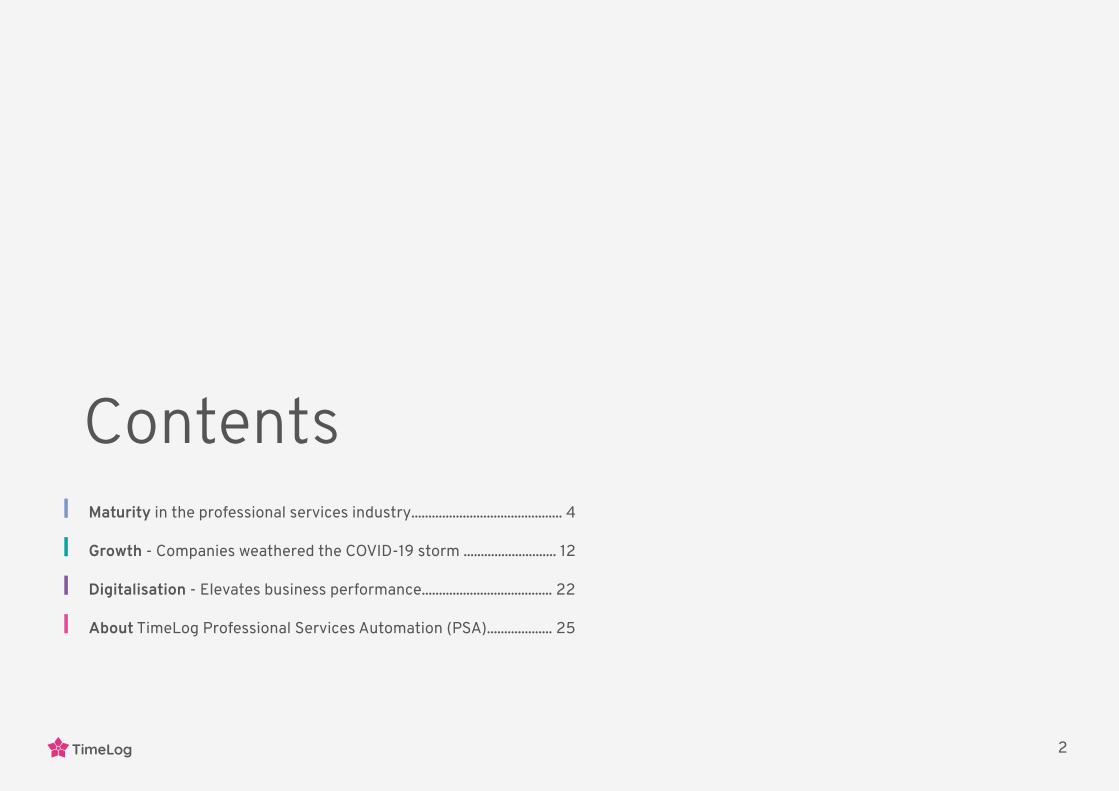
Maturity in the professional services industry............................................ 4
Growth - Companies weathered the COVID-19 storm ........................... 12
Digitalisation - Elevates business performance...................................... 22
About TimeLog Professional Services Automation (PSA)................... 25
Contents
2TimeLog

IntroductionHow does your company perform compared to similar companies within the professional services industry?
SPI Research has analysed and benchmarked companies from North America, Europe and Asia within IT, engineering, architecture, marketing, accounting and other verticals, which sell knowledge and business services rather than products.
The annual Professional Services Maturity Benchmark is recognised as the industry’s most thorough study, and for the 14th year in a row, SPI Research has measured the state of health of the planet’s fastest growing industry: Consultancy and professional services.
The benchmark is based on survey responses from 561 international companies, and the respondents in the survey employ over 300,000 consultants.
SPI Research has analysed their KPIs and now provide insights into the characteristics of the companies that are most successful in translating revenue into profit.
The report reveals that while the most progressive companies were able to withstand the COVID-19 pandemic with average results of 32.0% profit in 2020, the worst performing companies struggled with results at -10.1%.
Among many reasons for this maturity stands out as a decisive factor!
We have combed through the report andhighlighted the most important points and KPIs for you.
Happy reading!Kind regards,Per-Henrik NielsenCEO, TimeLog
3TimeLog

Maturity in the professional services industryOrganisational maturity wins a clear victory over years in service, SPI Research’s benchmark shows.
Mature companies perform significantly better on all parameters essential for the development and operation of a professional services business.
Strong leadership, clear vision and optimised business processes are some of the virtues of a mature service organisation.
These virtues can be attained by both young and seasoned companies, if they are prioritised in the leadership teams.
M Maturity
4TimeLog
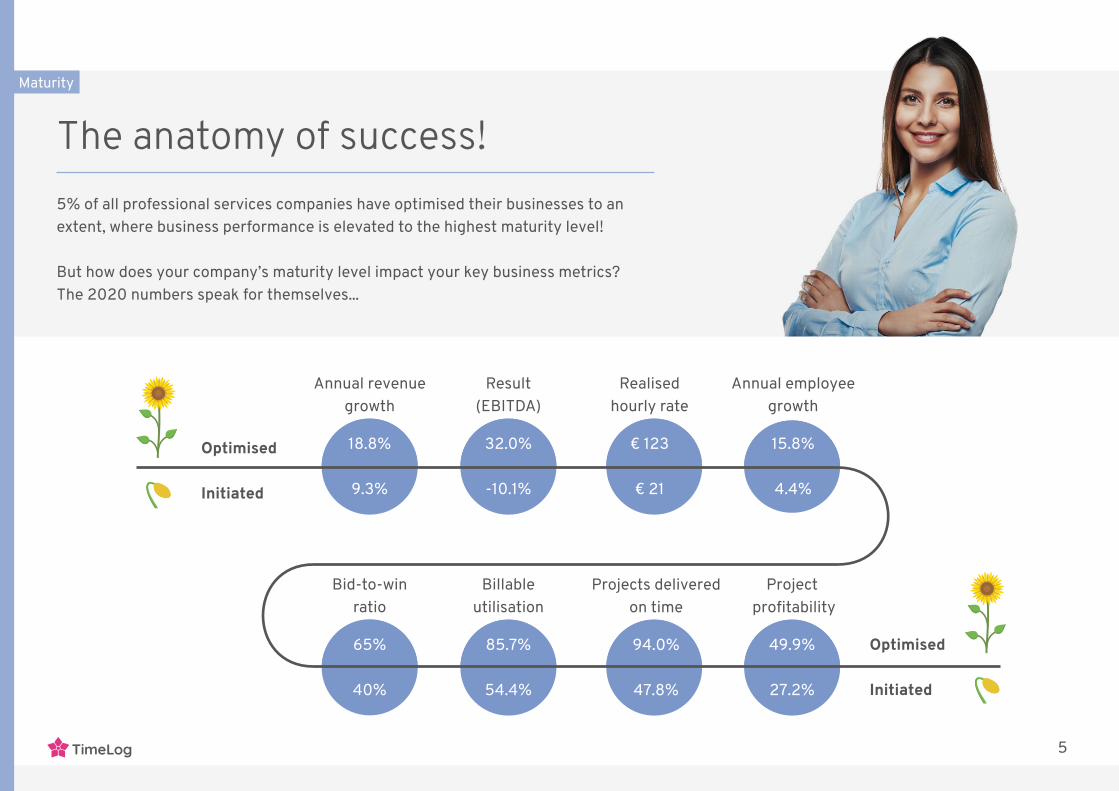
The anatomy of success!5% of all professional services companies have optimised their businesses to an extent, where business performance is elevated to the highest maturity level!
But how does your company’s maturity level impact your key business metrics?The 2020 numbers speak for themselves...
Maturity
Annual revenue growth
18.8%
9.3%
Result (EBITDA)
32.0%
-10.1%
Realised hourly rate
€ 123
€ 21
Annual employee growth
15.8%
4.4%
Bid-to-winratio
65%
40%
Billableutilisation
85.7%
54.4%
Projects delivered on time
94.0%
47.8%
Project profitability
49.9%
27.2%
Optimised
Initiated
Optimised
Initiated
5TimeLog

How do you measure maturity?Key business metrics, degree of optimisation of business processes and ability to deliver on projects are among the areas surveyed in the 2020 Professional Services Maturity Benchmark.
The survey builds on a framework of five pillars with a total of 160 KPIs.
This enables SPI Research to measure and benchmark companies within the professional services industry.
This model has been the leading industry analysis for the past 14 years.
Maturity
?
6TimeLog
Maturity
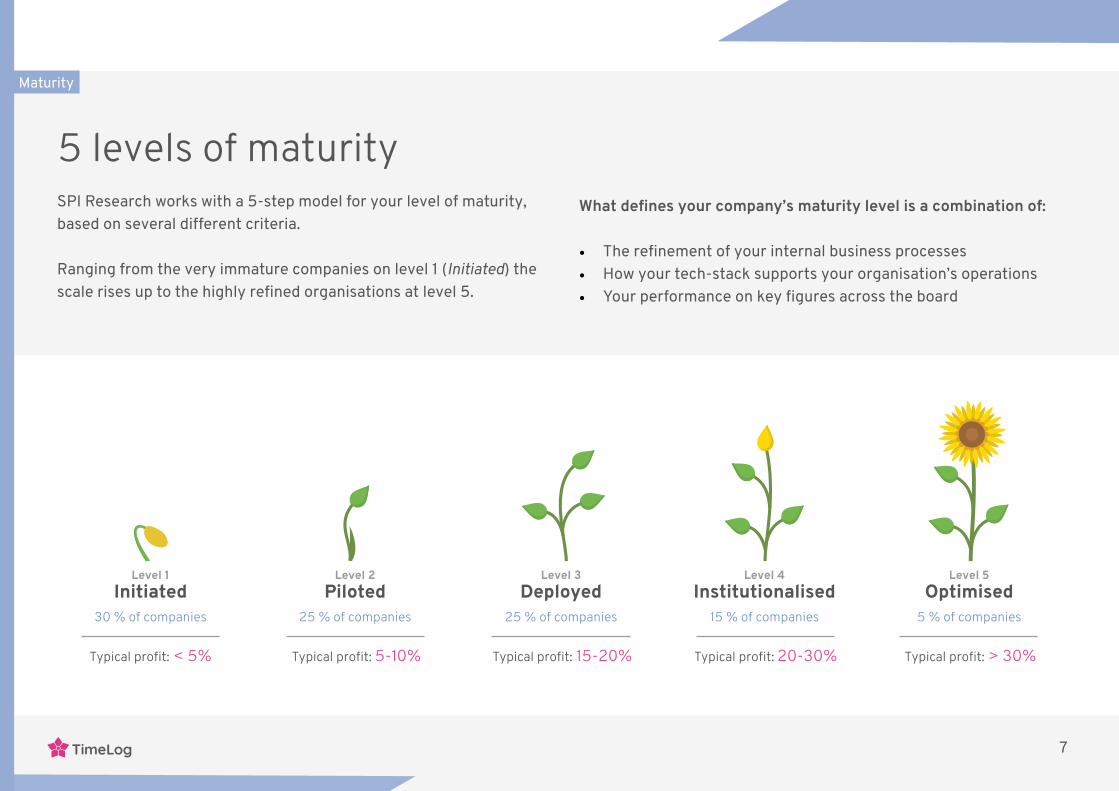
Level 1Initiated
Level 2Piloted
Level 3Deployed
Level 4Institutionalised
Level 5Optimised
30 % of companies
Typical profit: < 5%
25 % of companies
Typical profit: 5-10%
25 % of companies
Typical profit: 15-20%
15 % of companies
Typical profit: 20-30%
5 % of companies
Typical profit: > 30%
5 levels of maturitySPI Research works with a 5-step model for your level of maturity, based on several different criteria.
Ranging from the very immature companies on level 1 (Initiated) the scale rises up to the highly refined organisations at level 5.
What defines your company’s maturity level is a combination of:
• The refinement of your internal business processes• How your tech-stack supports your organisation’s operations• Your performance on key figures across the board
7TimeLog
Maturity
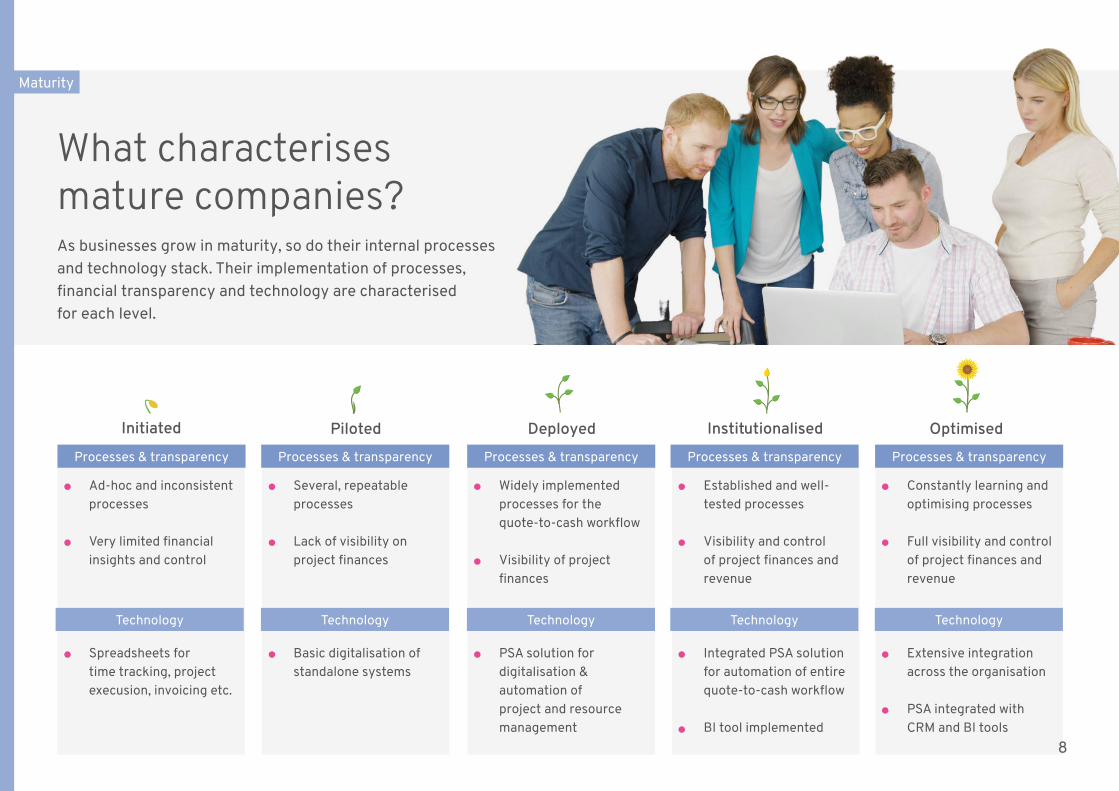
What characterises mature companies?As businesses grow in maturity, so do their internal processes and technology stack. Their implementation of processes, financial transparency and technology are characterised for each level.
• Ad-hoc and inconsistent processes
• Very limited financial insights and control
• Spreadsheets for time tracking, project execusion, invoicing etc.
• Several, repeatable processes
• Lack of visibility on project finances
• Basic digitalisation of standalone systems
• Widely implemented processes for the quote-to-cash workflow
• Visibility of project finances
• PSA solution for digitalisation & automation of project and resource management
• Established and well-tested processes
• Visibility and control of project finances and revenue
• Integrated PSA solution for automation of entire quote-to-cash workflow
• BI tool implemented
• Constantly learning and optimising processes
• Full visibility and control of project finances and revenue
• Extensive integration across the organisation
• PSA integrated with CRM and BI tools
Processes & transparency Processes & transparency Processes & transparency Processes & transparency Processes & transparency
Technology Technology Technology Technology Technology
Initiated Piloted Deployed Institutionalised Optimised
8
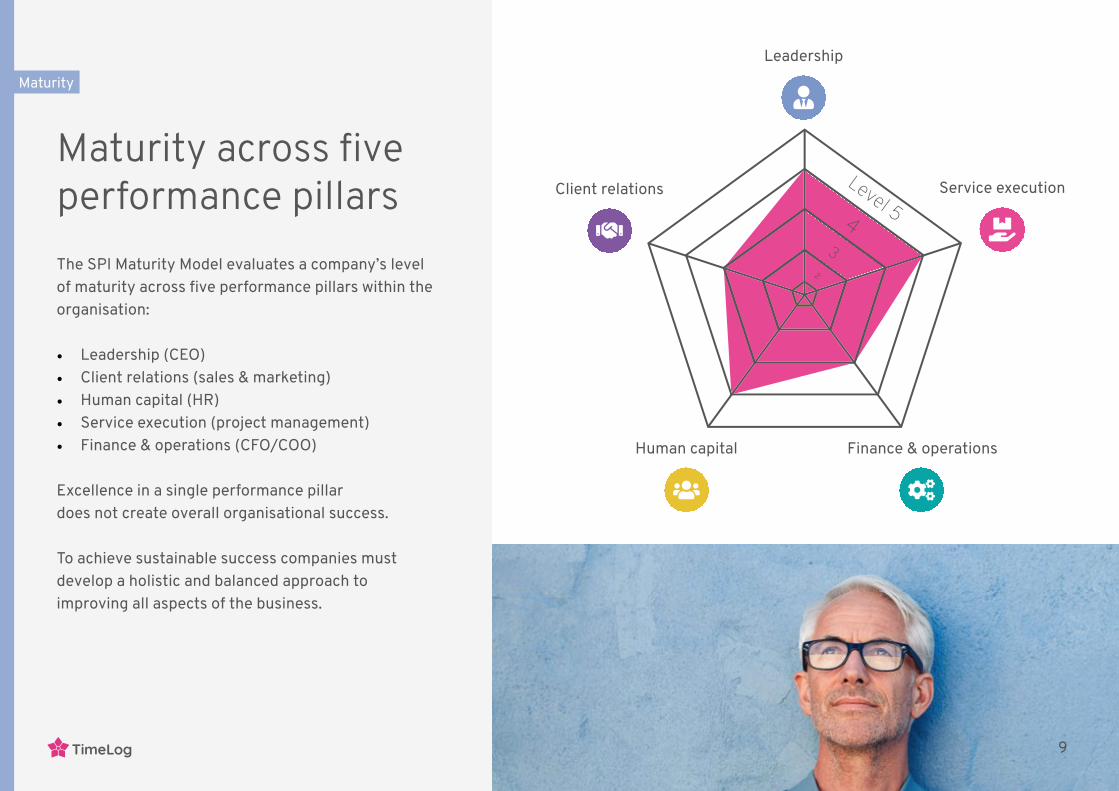
Maturity across five performance pillarsThe SPI Maturity Model evaluates a company’s level of maturity across five performance pillars within the organisation:
• Leadership (CEO)• Client relations (sales & marketing)• Human capital (HR)• Service execution (project management)• Finance & operations (CFO/COO) Excellence in a single performance pillardoes not create overall organisational success.
To achieve sustainable success companies mustdevelop a holistic and balanced approach toimproving all aspects of the business.
Maturity
Leadership
Client relations
Human capital
Service execution
Finance & operations
43
21
Level 5
9TimeLog
Maturity
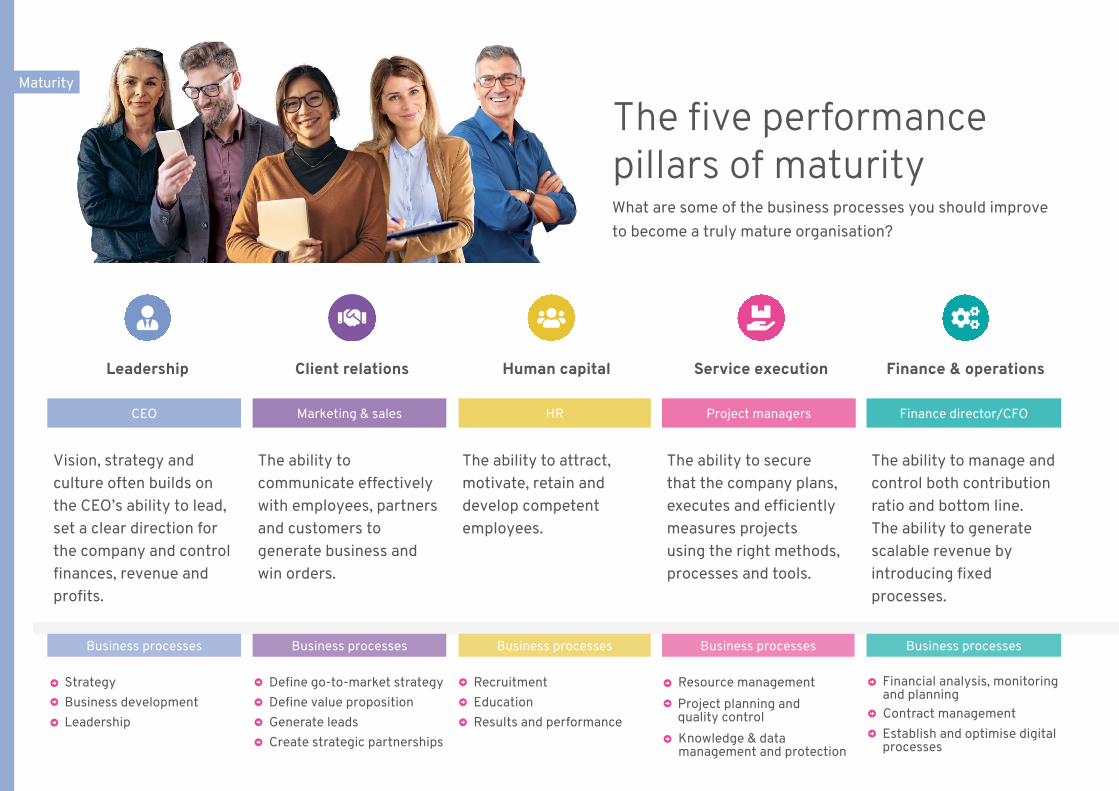
The five performance pillars of maturity What are some of the business processes you should improve to become a truly mature organisation?
Leadership Client relations Human capital Service execution Finance & operations
(CEO) Vision, strategy and culture often builds on the CEO’s ability to lead, set a clear direction for the company and control finances, revenue and profits.
(Marketing & sales)
The ability to communicate effectively with employees, partners and customers to generate business and win orders.
(HR)
The ability to attract, motivate, retain and develop competent employees.
(Project managers)
The ability to secure that the company plans, executes and efficiently measures projects using the right methods, processes and tools.
(Finance director/CFO)
The ability to manage and control both contribution ratio and bottom line. The ability to generate scalable revenue by introducing fixed processes.
StrategyBusiness developmentLeadership
Define go-to-market strategyDefine value propositionGenerate leadsCreate strategic partnerships
RecruitmentEducationResults and performance
Resource management Financial analysis, monitoring and planning
Business processes Business processes Business processes Business processes Business processes
Project planning and quality controlKnowledge & data management and protection
Establish and optimise digital processes
Contract management
CEO Marketing & sales HR Project managers Finance director/CFO
Get your test here
11TimeLog
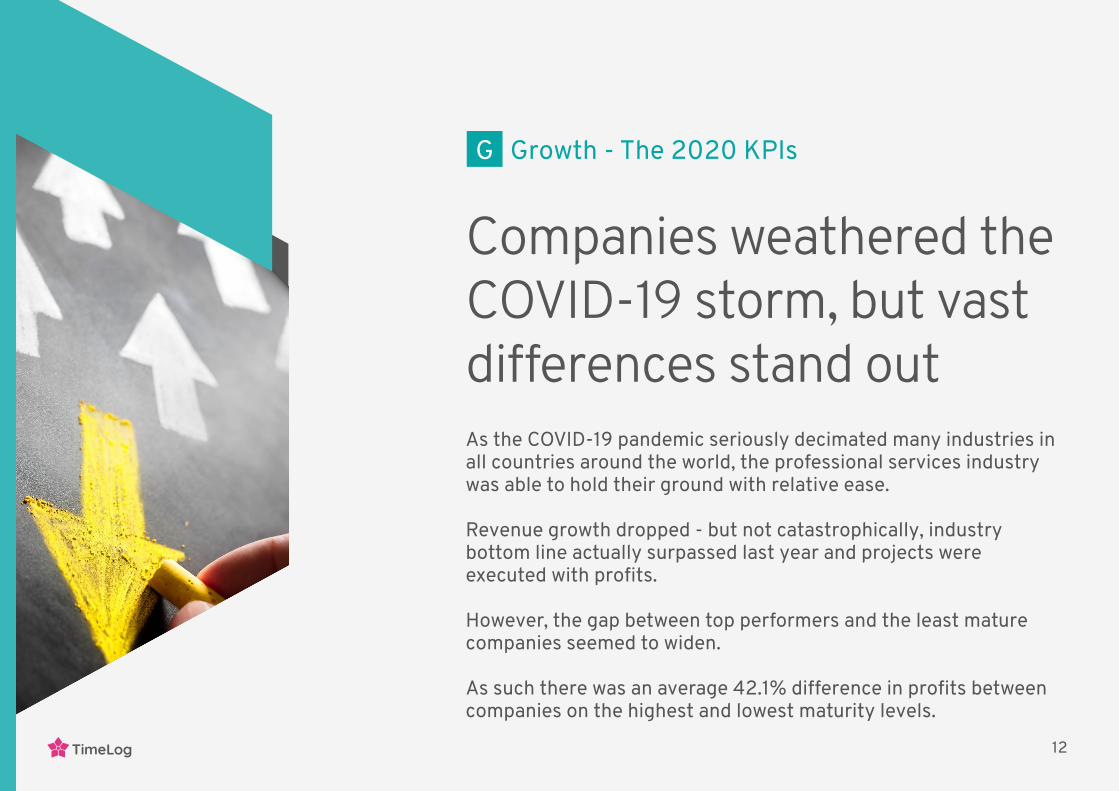
Companies weathered the COVID-19 storm, but vast differences stand out As the COVID-19 pandemic seriously decimated many industries in all countries around the world, the professional services industry was able to hold their ground with relative ease.
Revenue growth dropped - but not catastrophically, industry bottom line actually surpassed last year and projects were executed with profits.
However, the gap between top performers and the least mature companies seemed to widen.
As such there was an average 42.1% difference in profits between companies on the highest and lowest maturity levels.
G Growth - The 2020 KPIs
12TimeLog
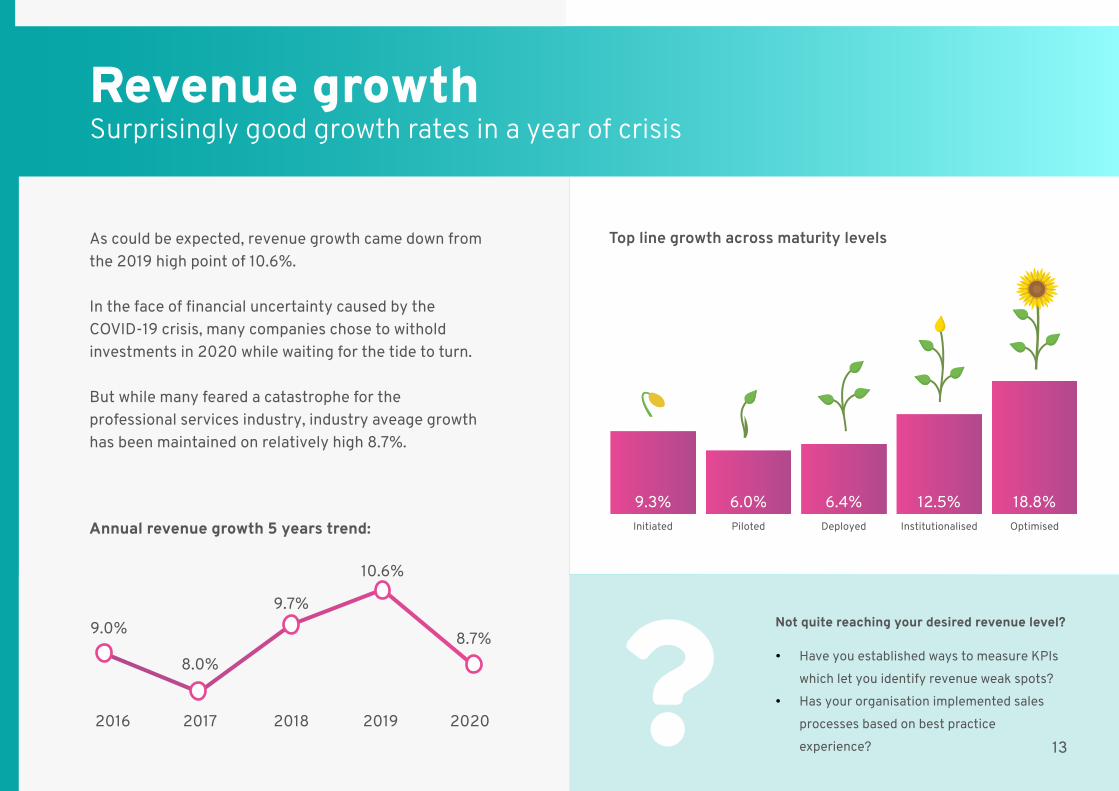
As could be expected, revenue growth came down from the 2019 high point of 10.6%.
In the face of financial uncertainty caused by the COVID-19 crisis, many companies chose to withold investments in 2020 while waiting for the tide to turn.
But while many feared a catastrophe for the professional services industry, industry aveage growth has been maintained on relatively high 8.7%.
Revenue growth Surprisingly good growth rates in a year of crisis
2016
9.0%
8.0%
9.7%
10.6%
8.7%
2017 2019 20202018
Annual revenue growth 5 years trend:
Not quite reaching your desired revenue level?
• Have you established ways to measure KPIs which let you identify revenue weak spots?
• Has your organisation implemented sales processes based on best practice experience?
Top line growth across maturity levels
9.3% 6.0% 6.4% 12.5% 18.8%Initiated Piloted Deployed Institutionalised Optimised
13
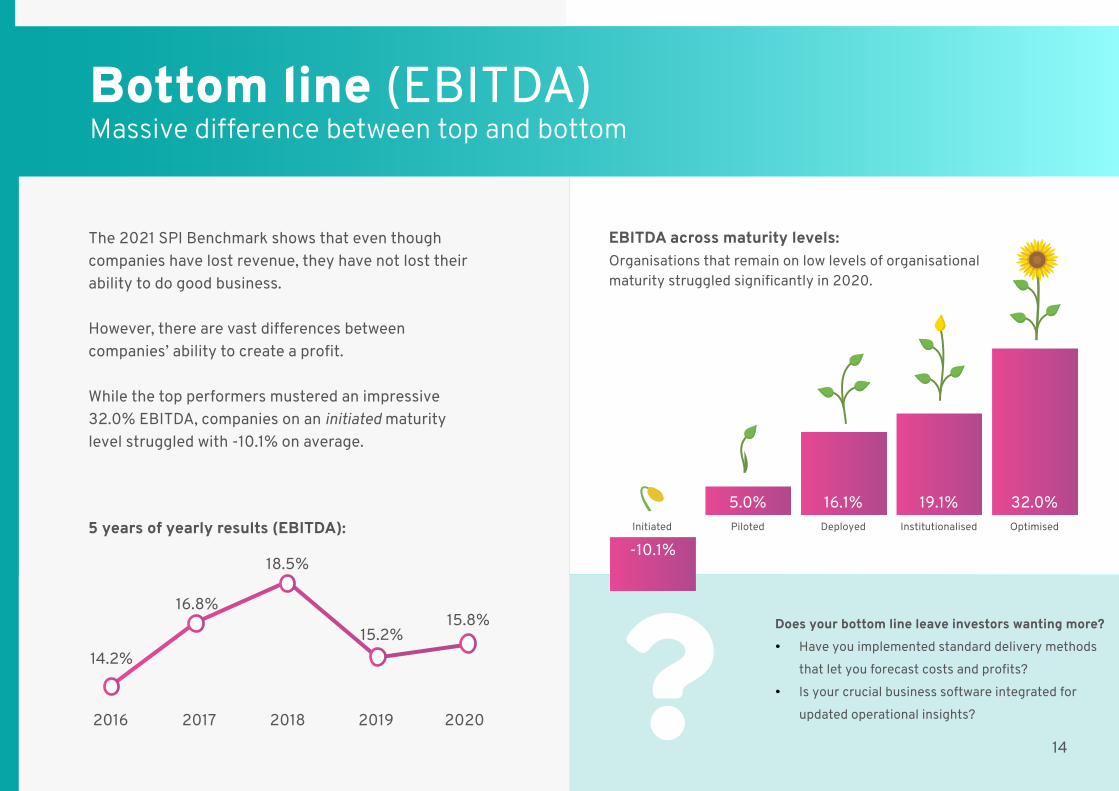
The 2021 SPI Benchmark shows that even though companies have lost revenue, they have not lost their ability to do good business.
However, there are vast differences between companies’ ability to create a profit.
While the top performers mustered an impressive 32.0% EBITDA, companies on an initiated maturity level struggled with -10.1% on average.
Bottom line (EBITDA) Massive difference between top and bottom
Does your bottom line leave investors wanting more? • Have you implemented standard delivery methods
that let you forecast costs and profits? • Is your crucial business software integrated for
updated operational insights?2016
14.2%
16.8%
18.5%
15.2%15.8%
2017 2019 20202018
EBITDA across maturity levels:Organisations that remain on low levels of organisational maturity struggled significantly in 2020.
5.0% 16.1% 19.1% 32.0%Initiated Piloted Deployed Institutionalised Optimised5 years of yearly results (EBITDA):-10.1%
14

In 2020, companies had to adopt remote work solutions for most employees at an unprecedented rate.
In the professional services industry alone, onsite service delivery fell by 29.2% compared to 2017.
But if many feared a slowdown in project execution, the figures show that companies were able to execute projects while tackling the challenges of a remote reality.
Project timeliness Remote work has not delayed project deadlines in 2020
2016
78.1% 79.7%
76.9%
79.3% 79.7%
2017 2019 20202018
Project on-time completion 5 year trend:
Project on-time completion rate across maturity levelsMature companies get the job done on time
47.8% 73.0% 85.2% 91.3% 94.0%Initiated Piloted Deployed Institutionalised Optimised
Having a hard time finishing projects on time? • Do you track time systematically and analyse
data from past projects for your project estimates?
• Do you include completion milestones in your project plans so you know if time is slipping?
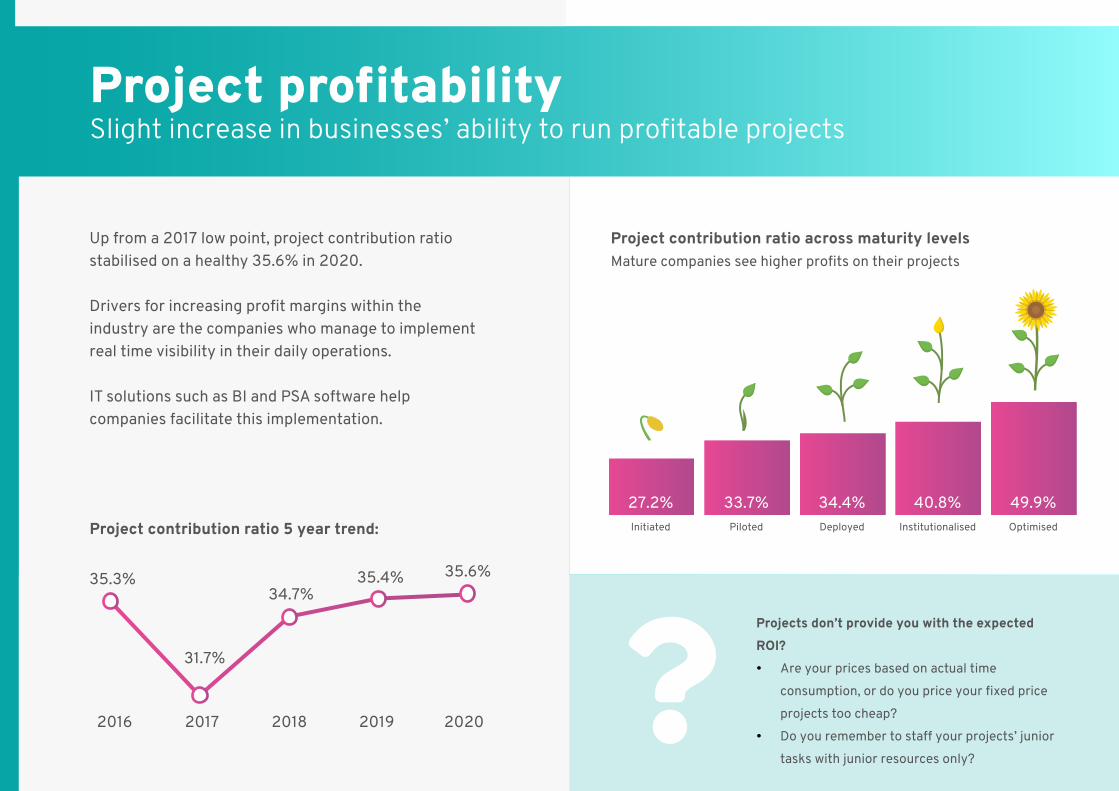
Up from a 2017 low point, project contribution ratio stabilised on a healthy 35.6% in 2020.
Drivers for increasing profit margins within the industry are the companies who manage to implement real time visibility in their daily operations.
IT solutions such as BI and PSA software help companies facilitate this implementation.
Project profitability Slight increase in businesses’ ability to run profitable projects
2016
35.3%
31.7%
34.7%35.4% 35.6%
2017 2019 20202018
Project contribution ratio 5 year trend:
Project contribution ratio across maturity levels Mature companies see higher profits on their projects
27.2% 33.7% 34.4% 40.8% 49.9%Initiated Piloted Deployed Institutionalised Optimised
Projects don’t provide you with the expected ROI? • Are your prices based on actual time
consumption, or do you price your fixed price projects too cheap?
• Do you remember to staff your projects’ junior tasks with junior resources only?
In November 2021, SPI Research will gather data from hundreds of companies within the professional services industry to create the industry’s most comprehensive benchmark.
You can be part of this by signing up for next year’s survey now.
• Get insight into your company’s performance
• Benchmark your company against the competition
• Get into a yearly benchmark routine and start optimising your performance
Sign up now and receive your questionnaire when it’s time to complete the survey.
Want to be a part of the2022 SPI Maturity Benchmark?
Yes, I want to participate innext year’s survey
17
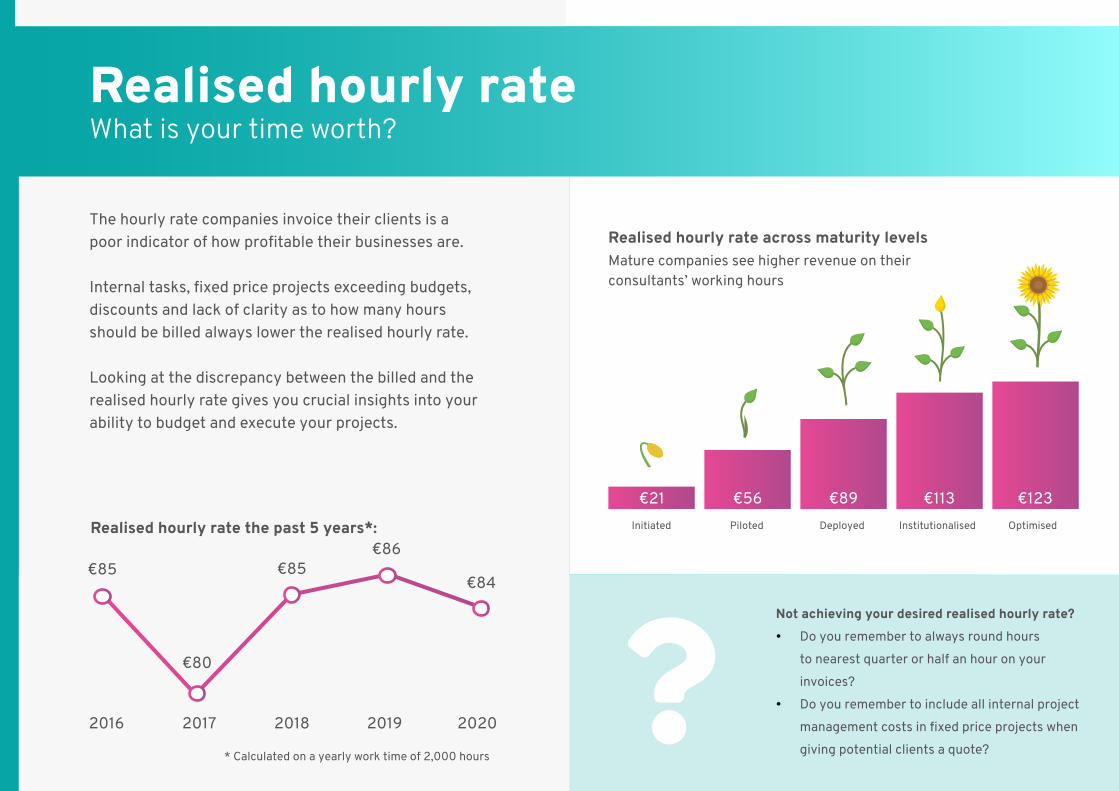
The hourly rate companies invoice their clients is a poor indicator of how profitable their businesses are.
Internal tasks, fixed price projects exceeding budgets, discounts and lack of clarity as to how many hours should be billed always lower the realised hourly rate.
Looking at the discrepancy between the billed and the realised hourly rate gives you crucial insights into your ability to budget and execute your projects.
Realised hourly rate What is your time worth?
2016
€85
€80
€85€86
€84
2017 2019 20202018
Realised hourly rate the past 5 years*:
* Calculated on a yearly work time of 2,000 hours
Realised hourly rate across maturity levels Mature companies see higher revenue on their consultants’ working hours
€21 €56 €89 €113 €123Initiated Piloted Deployed Institutionalised Optimised
Not achieving your desired realised hourly rate? • Do you remember to always round hours
to nearest quarter or half an hour on your invoices?
• Do you remember to include all internal project management costs in fixed price projects when giving potential clients a quote?
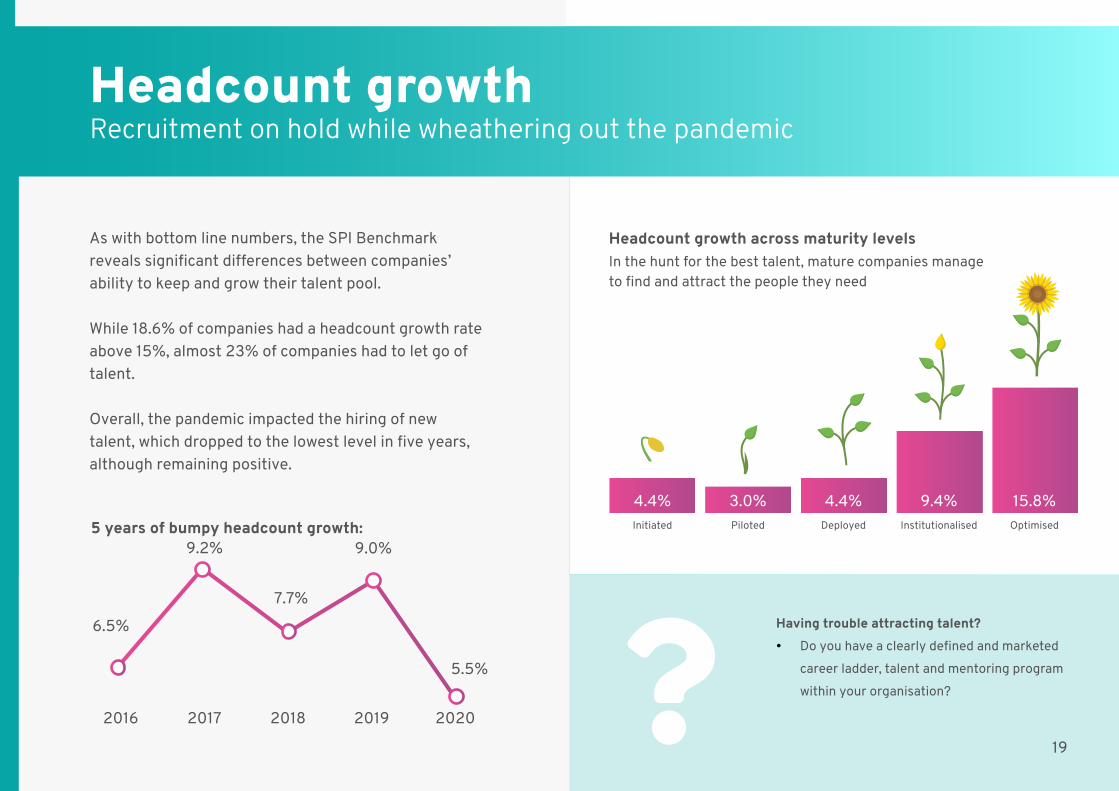
As with bottom line numbers, the SPI Benchmark reveals significant differences between companies’ ability to keep and grow their talent pool.
While 18.6% of companies had a headcount growth rate above 15%, almost 23% of companies had to let go of talent.
Overall, the pandemic impacted the hiring of new talent, which dropped to the lowest level in five years, although remaining positive.
Headcount growth Recruitment on hold while wheathering out the pandemic
5 years of bumpy headcount growth:
Headcount growth across maturity levelsIn the hunt for the best talent, mature companies manage to find and attract the people they need
Having trouble attracting talent? • Do you have a clearly defined and marketed
career ladder, talent and mentoring program within your organisation?
2016
6.5%
9.2%
7.7%
9.0%
5.5%
2017 2019 20202018
4.4% 3.0% 4.4% 9.4% 15.8%Initiated Piloted Deployed Institutionalised Optimised
19
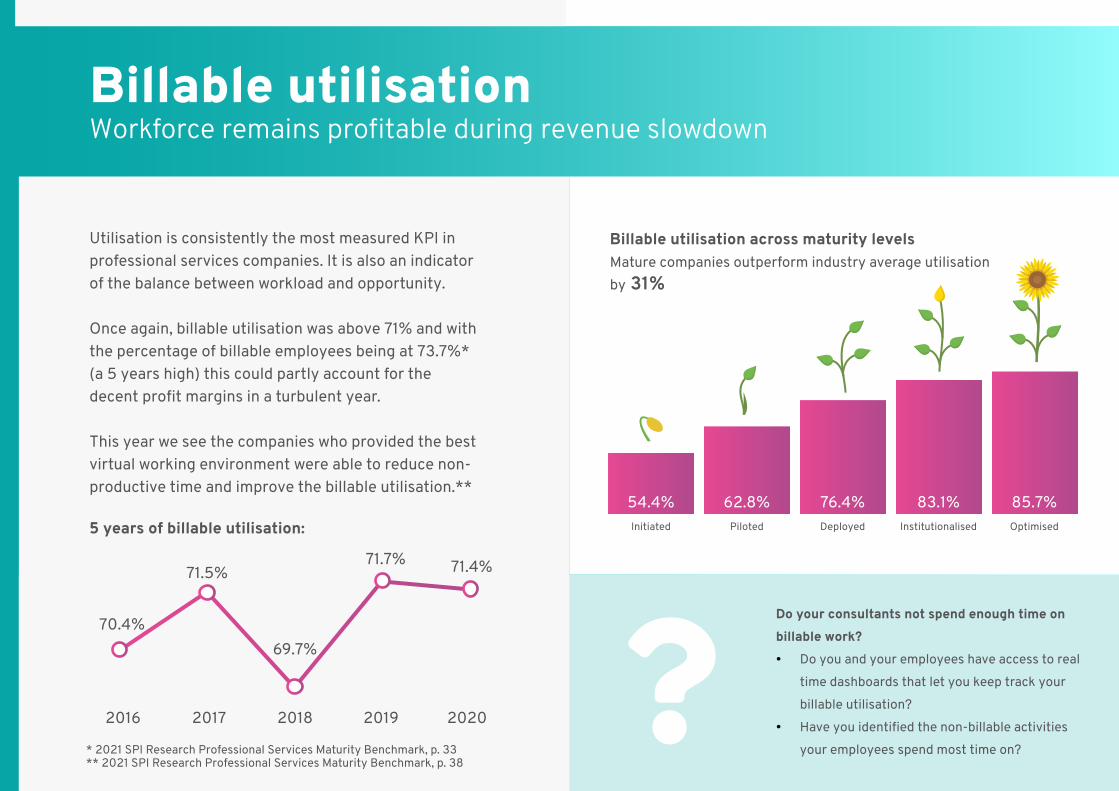
Utilisation is consistently the most measured KPI in professional services companies. It is also an indicator of the balance between workload and opportunity.
Once again, billable utilisation was above 71% and with the percentage of billable employees being at 73.7%* (a 5 years high) this could partly account for the decent profit margins in a turbulent year.
This year we see the companies who provided the best virtual working environment were able to reduce non-productive time and improve the billable utilisation.**
Billable utilisation Workforce remains profitable during revenue slowdown
Billable utilisation across maturity levelsMature companies outperform industry average utilisation by 31%
54.4% 62.8% 76.4% 83.1% 85.7%Initiated Piloted Deployed Institutionalised Optimised
Do your consultants not spend enough time on billable work? • Do you and your employees have access to real
time dashboards that let you keep track your billable utilisation?
• Have you identified the non-billable activities your employees spend most time on?
2016
70.4%
71.5%
69.7%
71.7% 71.4%
2017 2019 20202018
5 years of billable utilisation:
* 2021 SPI Research Professional Services Maturity Benchmark, p. 33** 2021 SPI Research Professional Services Maturity Benchmark, p. 38
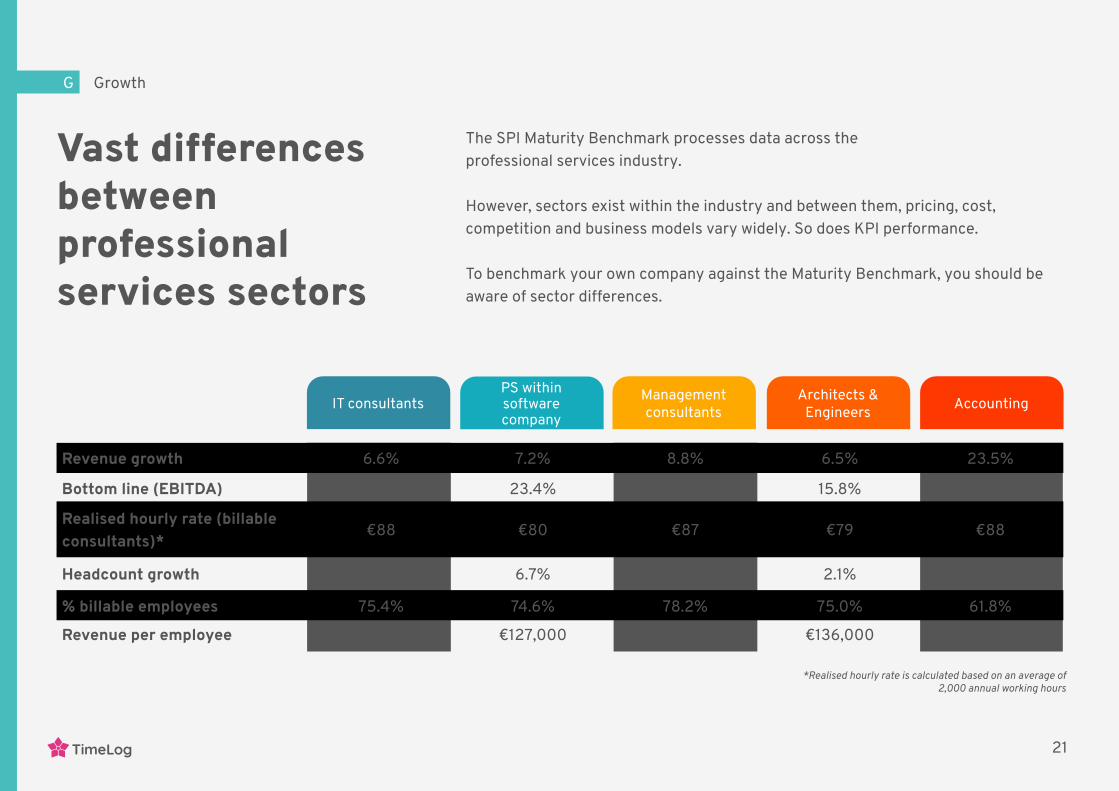
Vast differences between professional services sectors
Revenue growth 6.6% 7.2% 8.8% 6.5% 23.5%
Bottom line (EBITDA) 13.4% 23.4% 10.6% 15.8% 7.8%
Realised hourly rate (billable consultants)*
€88 €80 €87 €79 €88
Headcount growth 4.8% 6.7% 5.9% 2.1% 9.0%
% billable employees 75.4% 74.6% 78.2% 75.0% 61.8%
Revenue per employee €144,000 €127,000 €144,000 €136,000 €145,000
IT consultants PS within software company
Management consultants
Architects & Engineers Accounting
The SPI Maturity Benchmark processes data across the professional services industry.
However, sectors exist within the industry and between them, pricing, cost, competition and business models vary widely. So does KPI performance. To benchmark your own company against the Maturity Benchmark, you should be aware of sector differences.
GrowthG
*Realised hourly rate is calculated based on an average of 2,000 annual working hours
21TimeLog
Digitalisation elevates business performanceMore than any other year, 2020 pushed companies to innovate themselves and step up on all performance parameters to stay in the game.
To stay on top, the best weapon for professional services organisations is to optimise their internal organisational processes and keep their tech stack up to the task of organising remote work.
Over the past 14 years, SPI Research has seen a sharp increase in the use of digital solutions helping companies streamline and automate project management & invoicing, HR & resources, finance & operations as well as analysis & reporting.
They are known as Professional Services Automation (PSA) solutions.
D Digitalisation
22TimeLog

Professional services organisations invest massively in PSA solutions to support and optimise their internal workflows.
This year, 79.5% of all companies in the survey had adopted a PSA solution.
In 2017 this was only 67.3%.
2020 saw a year with extraordinary demands for IT solutions, but also tight budgets, as revenue forecasts remained uncertain throughout the year.
According to Gartner, more companies will strengthen their competitive edge through software investments in 2021, as confidence in growth is expected to return.
Growing digital investments 2021 looks like the year of digitalisation
Companies investing in software for real time insights complete projects faster and achieve much higher profits. • Are your current IT solutions providing you with
the KPIs you need in real time?
2017
€309 billion
€334 billion€382 billion
€389 billion€423 billion
2018 2020 20212019
Source: Gartner 2021
Global software investment forecast
23TimeLog
D Digtalisation
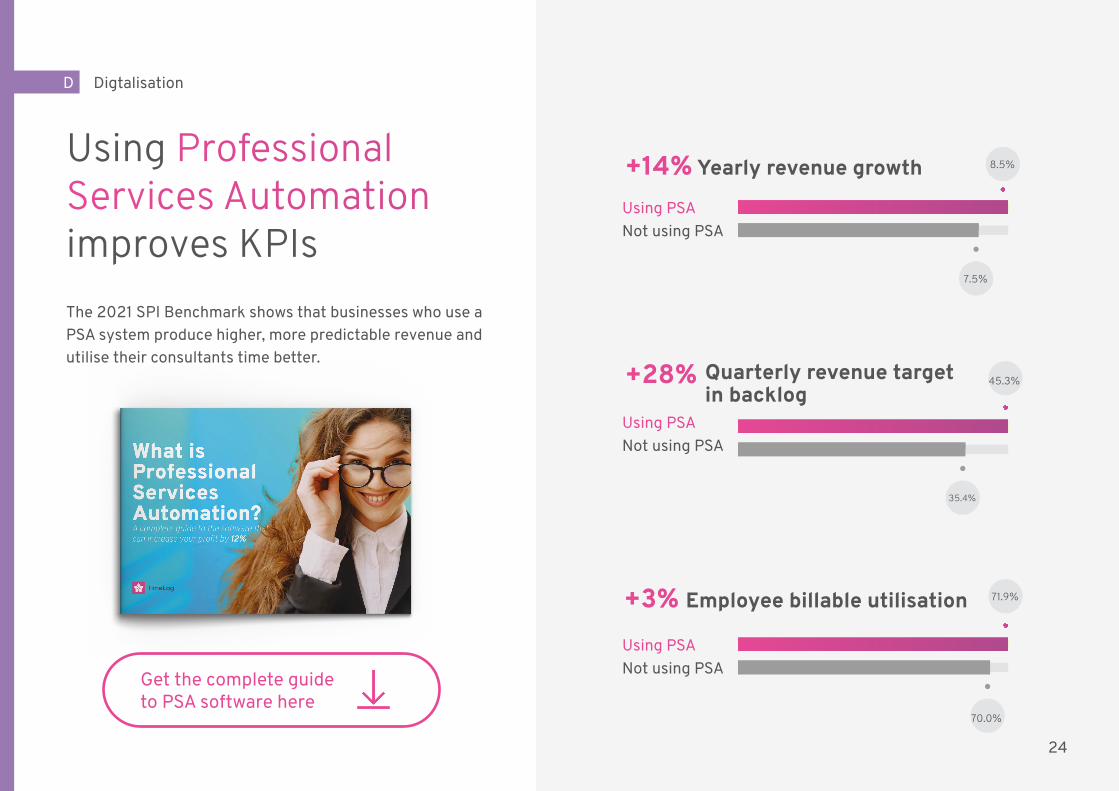
Not using PSAUsing PSA
+14% Yearly revenue growth 8.5%
7.5%
Not using PSAUsing PSA
+3% Employee billable utilisation 71.9%
70.0%
Using Professional Services Automation improves KPIs The 2021 SPI Benchmark shows that businesses who use a PSA system produce higher, more predictable revenue and utilise their consultants time better.
Get the complete guideto PSA software here
Not using PSAUsing PSA
+28% 45.3%
35.4%
Quarterly revenue target in backlog
24
Time to evolve your business? At this point, you have seen how maturity impacts and elevates business performance. Whether it be financial KPIs or operational performance metrics such as project delivery, sales performance or talent management, the companies dedicated to elevating their maturity level come out on top - every time. There is no company that doesn’t want to get better at what they do. There are far fewer companies that will dedicate time and effort into maturing their business from top to bottom. Usually, they don’t know where to start. A good place to start is getting the right tool in your toolbox.
TimeLog PSA supports and helps you evolve your internal business processes. Are you ready?
25TimeLog
TimeLogProfessionalServices Automation
Do you need the right tool to start evolving your business?
TimeLog PSA is built for professional services organisations that want an easy-to-use solution to support and automate essential business processes.
We have developed our solution in collaboration with our users to help you evolve and optimise your processes and achieve better financial KPIs as well as project delivery excellence.
Whether you need to optimise your time & expense tracking, project & resource management or your invoicing & reporting
– we got you covered.
TimeLog
26
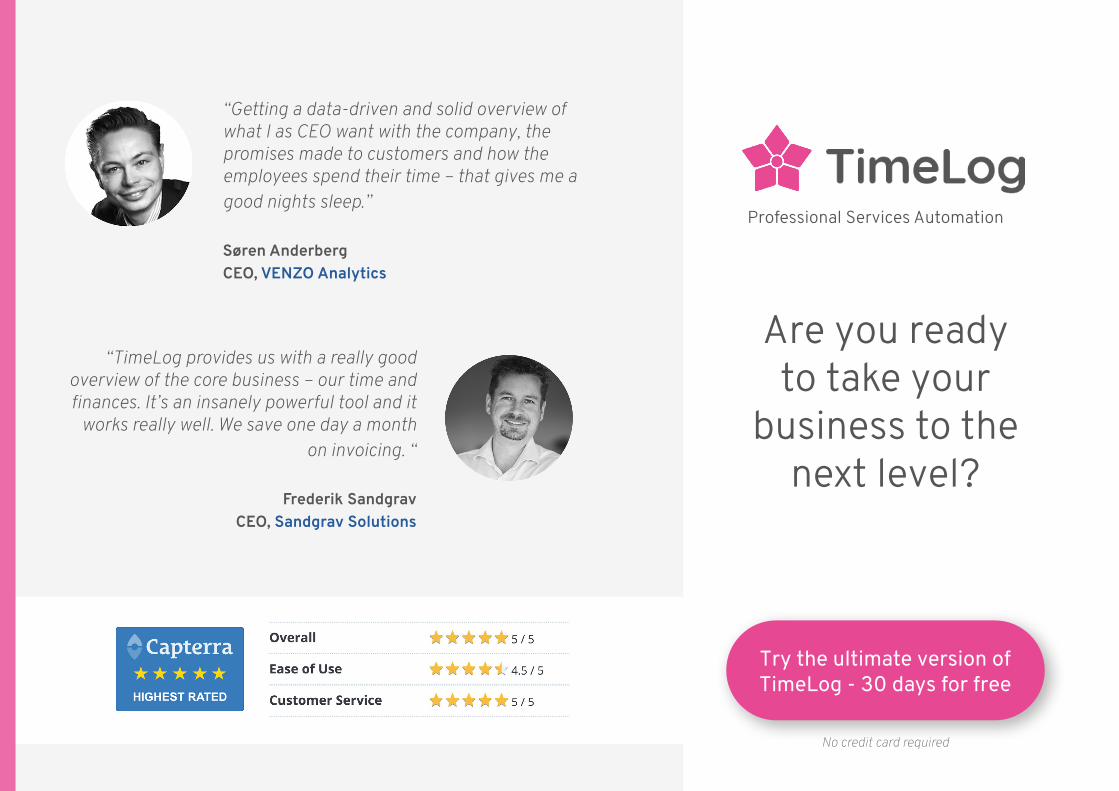
“TimeLog provides us with a really good overview of the core business – our time and finances. It’s an insanely powerful tool and it
works really well. We save one day a month on invoicing. “
Frederik Sandgrav
CEO, Sandgrav Solutions
“Getting a data-driven and solid overview of what I as CEO want with the company, the promises made to customers and how the employees spend their time – that gives me a good nights sleep.” Søren AnderbergCEO, VENZO Analytics
Professional Services Automation
No credit card required
Try the ultimate version of TimeLog - 30 days for free
Are you ready to take your
business to the next level?