Trends in Worksite Marketing - ACSW Worksite Marketing - Weilant.pdf · Trends in Worksite...
24
Trends in Worksite Marketing Michael E. Weilant, FSA, MAAA Actuaries’ Club of the Southwest - Fall Meeting November 10, 2005 – Plano, TX
Transcript of Trends in Worksite Marketing - ACSW Worksite Marketing - Weilant.pdf · Trends in Worksite...
Trends in Worksite Marketing
Michael E. Weilant, FSA, MAAAActuaries’ Club of the Southwest - Fall Meeting
November 10, 2005 – Plano, TX

Worksite Marketing (WSM) Defined
Benefits sold on a voluntary basis to employees of a corporation. The premiums are collected at the workplace (via payroll deduction) and there is no employer contribution towards the premium.

Reasons Employees Purchase WSM Benefits
Why Buy? Strongly AgreePayroll deduction is convenient 62%Payroll deduction helps me to be more disciplined 51%I can sign up for insurance without medical exams 50%More convenient than shopping on my own 43%Better rates/group rates 41%I trust employer to screen carriers and find best products 32%My employer will provide objective info about vol. benefits 32%I will get better customer service from co.’s providing benefits 21%
Source: MetLife Employee Benefits Trend Survey, 2004

Overview of the WSM Industry
In-Force Premiums(In $ Billions)
$7.0 $8.0 $8.8$10.3
$13.3$15.0
$16.6
$6.2
$0
$5
$10
$15
$20
'97 '98 '99 '00 '01 '02 '03 '04
Source: Eastbridge Consulting Group, Inc.
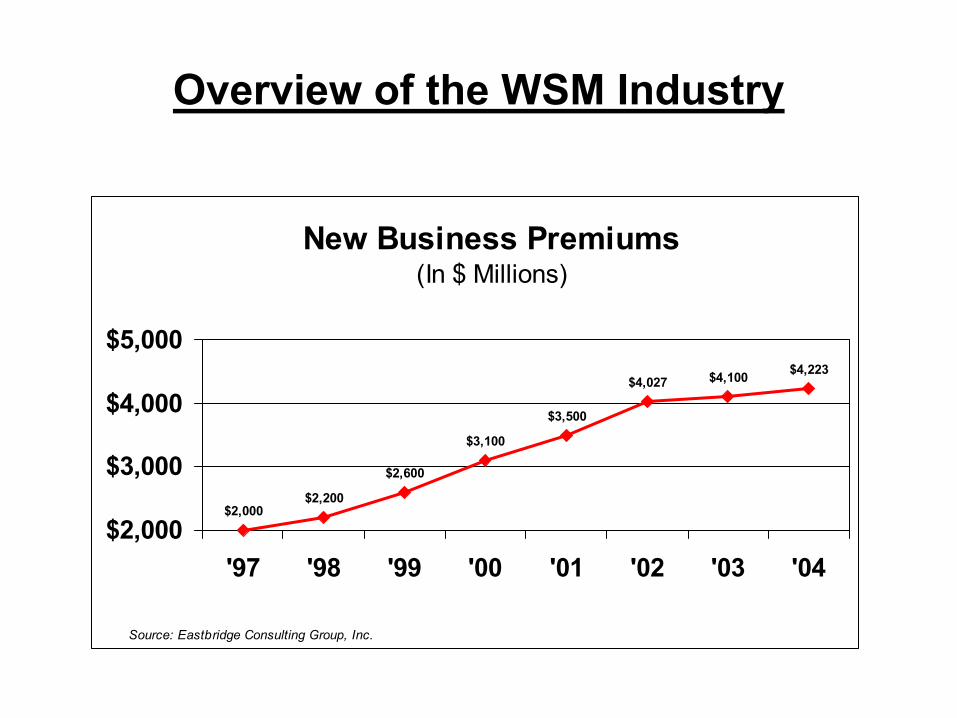
Overview of the WSM Industry
New Business Premiums(In $ Millions)
$2,200
$2,600
$3,100
$3,500
$4,027 $4,100 $4,223
$2,000
$2,000
$3,000
$4,000
$5,000
'97 '98 '99 '00 '01 '02 '03 '04
Source: Eastbridge Consulting Group, Inc.

What Are Consumers Asking For?
• “Medical-Related” products• Dental• Vision• Prescription Drug• Long Term Care (LTC)• Long Term Disability (LTD)
Source: National Underwriter Life & Health; March 28, 2005
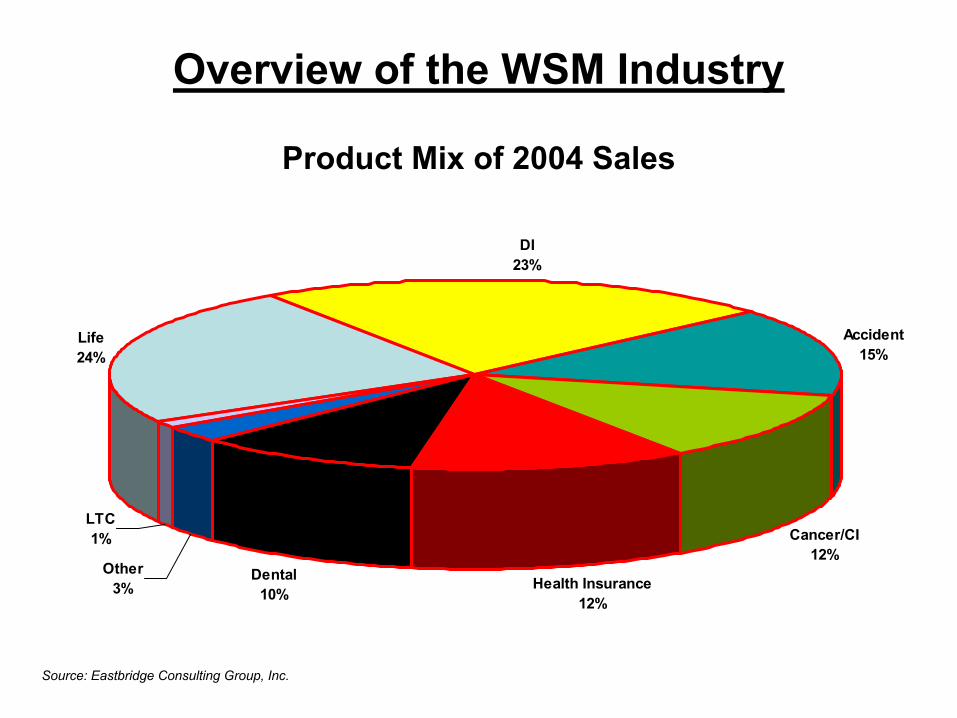
Overview of the WSM Industry
Product Mix of 2004 Sales
DI23%
Accident15%
Cancer/CI12%
Health Insurance12%
Dental10%
Other3%
LTC1%
Life24%
Source: Eastbridge Consulting Group, Inc.
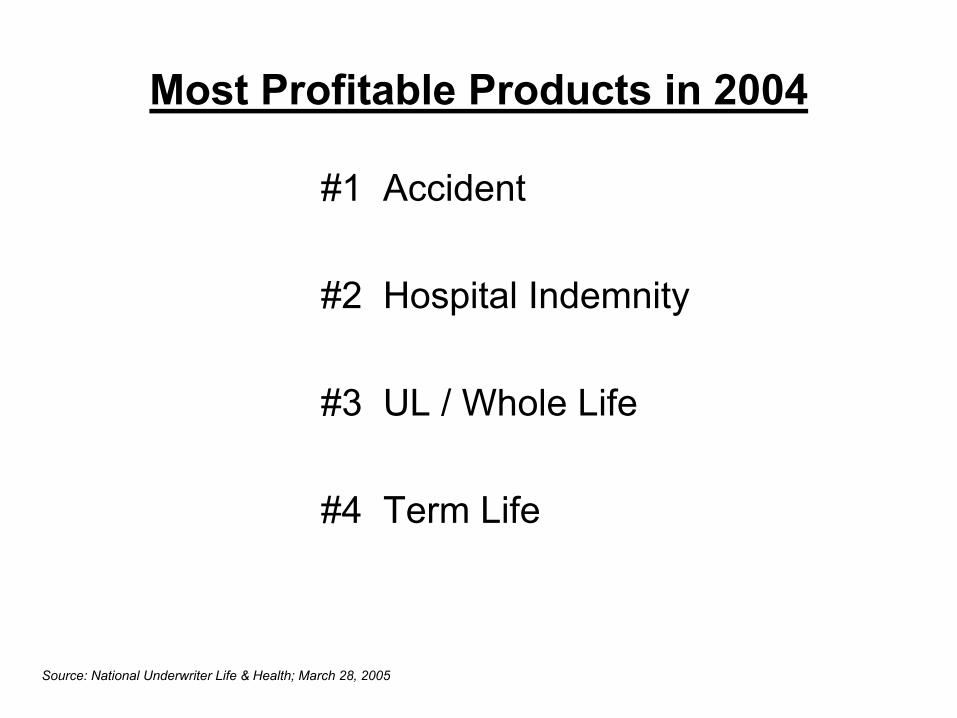
Most Profitable Products in 2004
#1 Accident
#2 Hospital Indemnity
#3 UL / Whole Life
#4 Term Life
Source: National Underwriter Life & Health; March 28, 2005
Life Products vs. Health Products
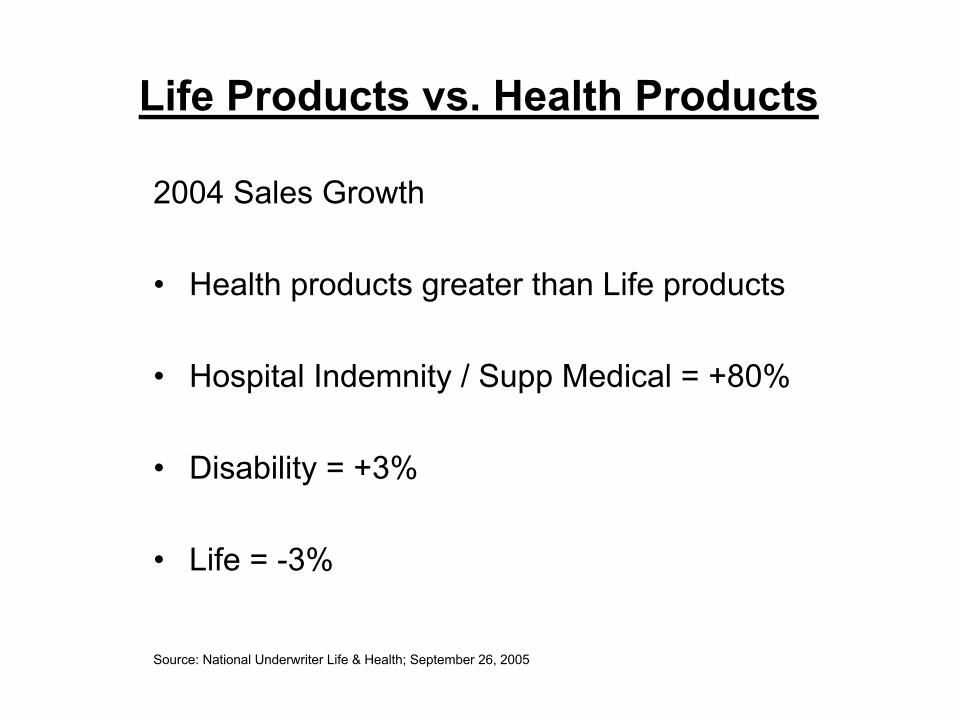
2004 Sales Growth
• Health products greater than Life products
• Hospital Indemnity / Supp Medical = +80%
• Disability = +3%
• Life = -3%
Source: National Underwriter Life & Health; September 26, 2005

Individual Products vs. Group Products
• 2004 New Sales
Group = 40%Individual = 60%
• 2004 Sales Growth
Group = +4%Individual = +1%
Source: National Underwriter Life & Health; September 26, 2005
Individual Products vs. Group Products
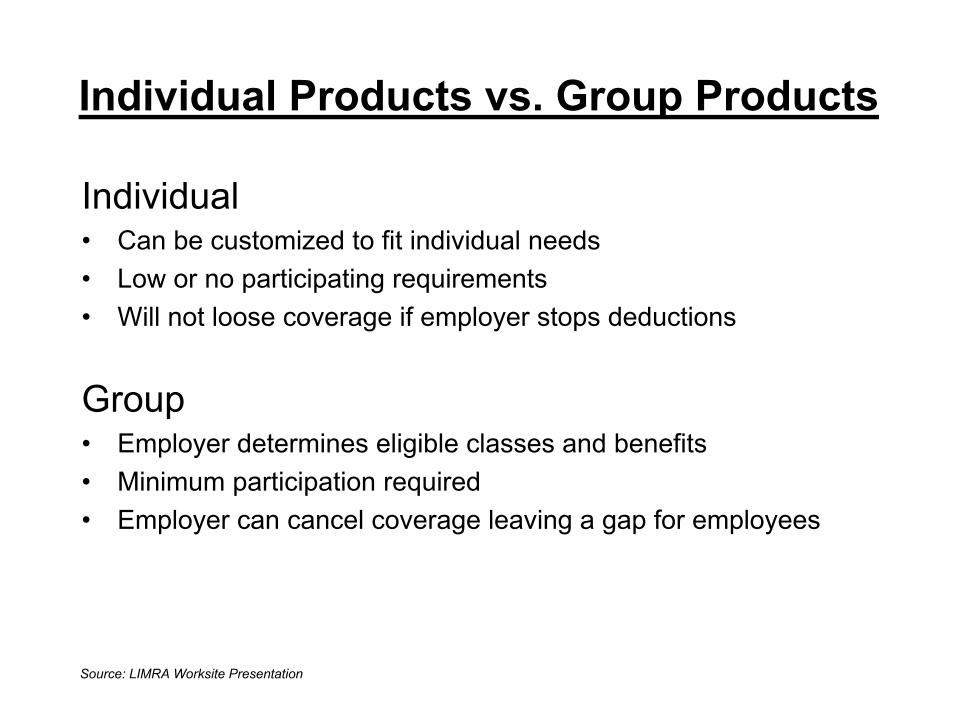
Individual• Can be customized to fit individual needs• Low or no participating requirements• Will not loose coverage if employer stops deductions
Group• Employer determines eligible classes and benefits• Minimum participation required• Employer can cancel coverage leaving a gap for employees
Source: LIMRA Worksite Presentation

Why Some Carriers Use Group Filings
• Ease of filing
• Ease of implementing rate increases
• More simplified pricing approach
Distributors of WSM Sales
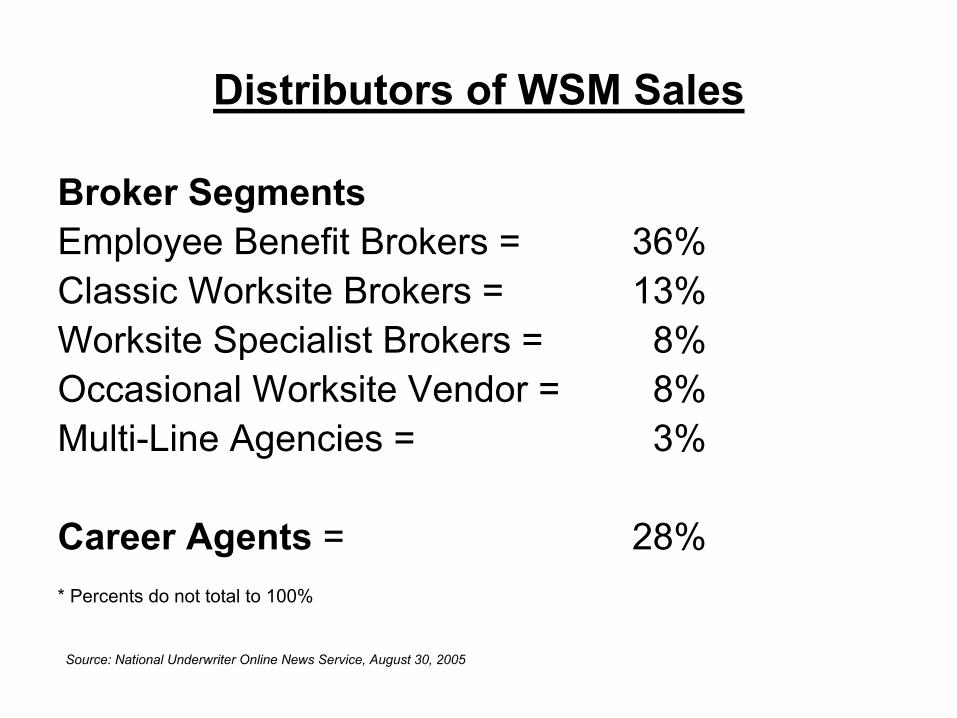
Broker SegmentsEmployee Benefit Brokers = 36%Classic Worksite Brokers = 13%Worksite Specialist Brokers = 8%Occasional Worksite Vendor = 8%Multi-Line Agencies = 3%
Career Agents = 28%* Percents do not total to 100%
Source: National Underwriter Online News Service, August 30, 2005

Winning WSM Sales Tactics
• Earn employer buy-in at all levels
• Set expectations up-front
• Employ effective, multi-faceted communications approaches
• Spend more time educating and less time selling
• Close the loop; get all employees to consider and reply
Source: National Underwriter Life & Health; March 28, 2005

Challenges to WSM Sales
• Discretionary money to spend (not much left due to increasing healthcare cost burden shifted to employees)
• New regulations (e.g. CA mini-med only available if covered under full medical)
Metrics used by WSM Carriers
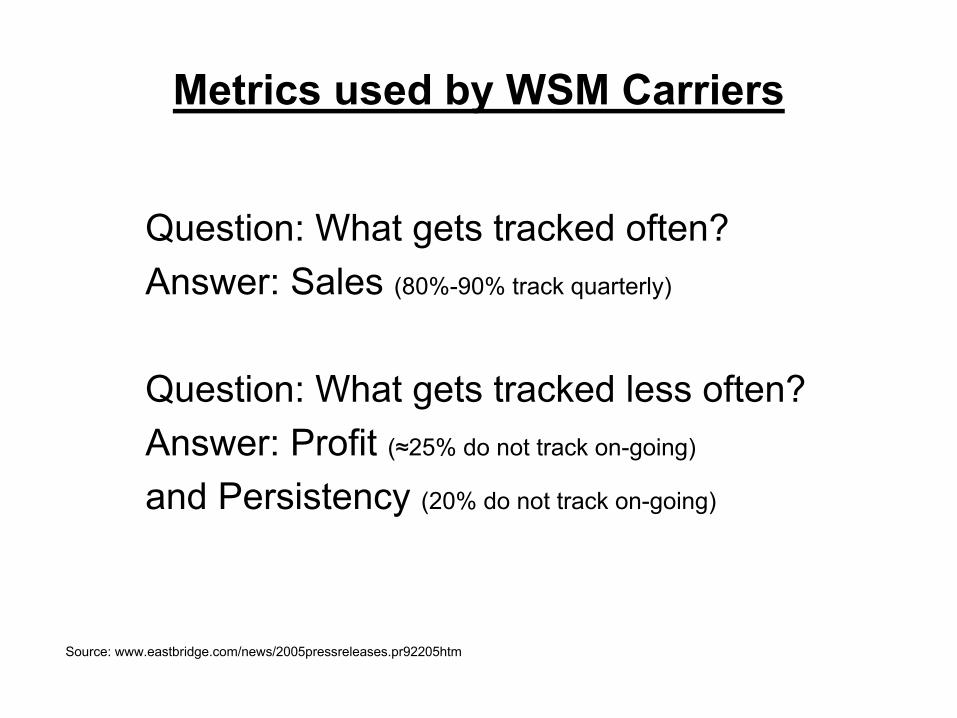
Question: What gets tracked often?Answer: Sales (80%-90% track quarterly)
Question: What gets tracked less often?Answer: Profit (≈25% do not track on-going)
and Persistency (20% do not track on-going)
Source: www.eastbridge.com/news/2005pressreleases.pr92205htm
Largest Challenges Facing WSM Carriers
Profit
Persistency
Source: National Underwriter Life & Health; March 28, 2005
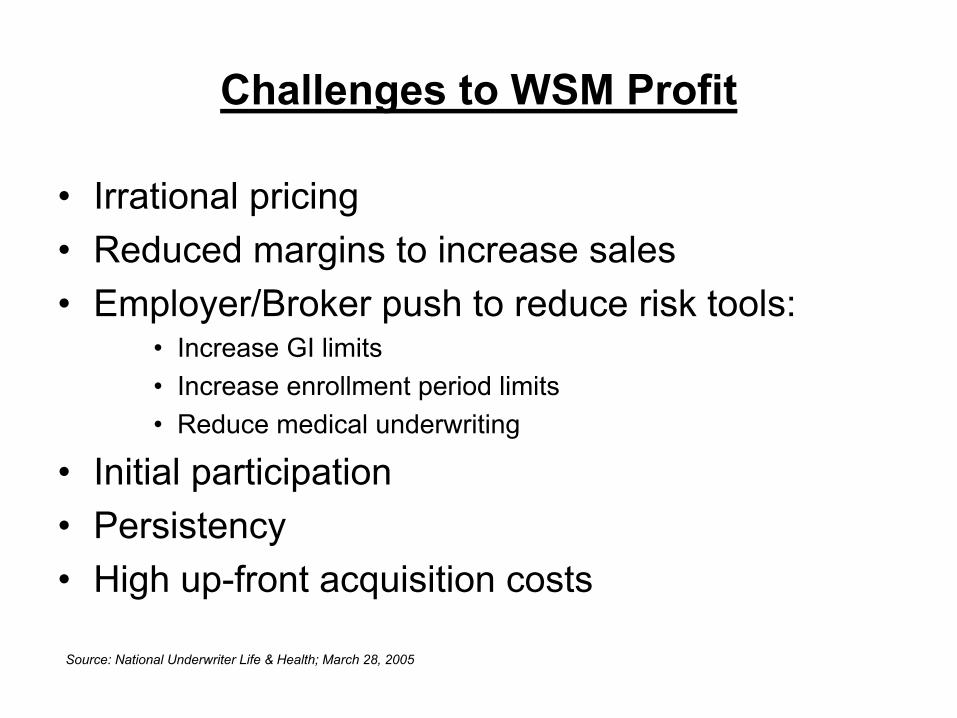
Challenges to WSM Profit
• Irrational pricing• Reduced margins to increase sales• Employer/Broker push to reduce risk tools:
• Increase GI limits• Increase enrollment period limits• Reduce medical underwriting
• Initial participation• Persistency• High up-front acquisition costs
Source: National Underwriter Life & Health; March 28, 2005

Guarantee Issue
• True group usually has GI• WSM usually ties GI to participation• Brokers want GI to get more paying
customers…needed to support high acquisition costs
• GI risk can be mitigated by pre-ex
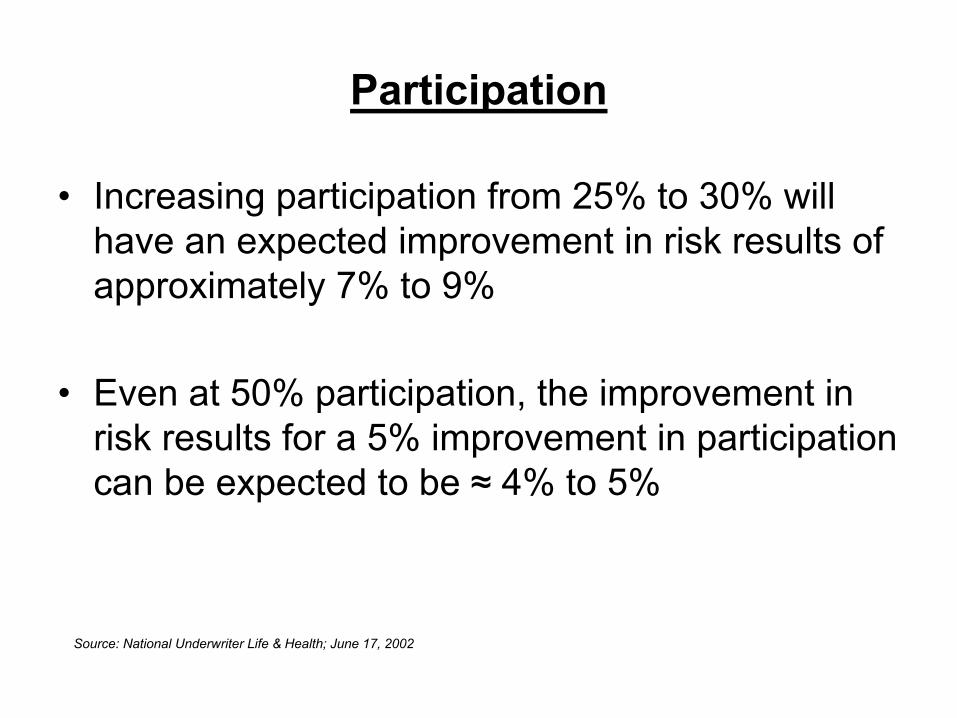
Participation
• Increasing participation from 25% to 30% will have an expected improvement in risk results of approximately 7% to 9%
• Even at 50% participation, the improvement in risk results for a 5% improvement in participation can be expected to be ≈ 4% to 5%
Source: National Underwriter Life & Health; June 17, 2002

Persistency
• 40% to 60% first year lapse rates
• Efforts to maintain customer if they leave their employer
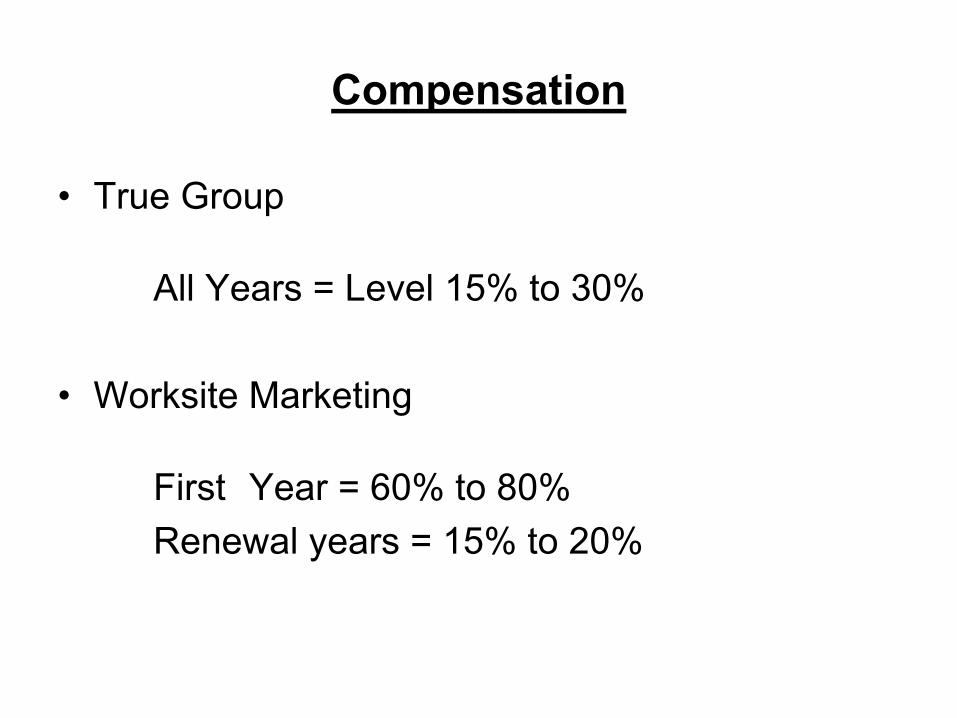
Compensation
• True Group
All Years = Level 15% to 30%
• Worksite Marketing
First Year = 60% to 80%Renewal years = 15% to 20%

Summary
• Continued shift to employee paid benefits
• Strong sales of medical-related products
• Carriers filing WSM products on group chassis
• Carrier focus on tracking/correcting profitability and persistency issues

The End