Trends in on farm biodiversity management in Australia s ... · 4 trens in n farm biiversit...
16
Trends in on farm biodiversity management in Australia’s agricultural industries
-
Upload
truongthien -
Category
Documents
-
view
214 -
download
0
Transcript of Trends in on farm biodiversity management in Australia s ... · 4 trens in n farm biiversit...

Trends in on farm biodiversitymanagement in Australia’s
agricultural industries
TRENDS IN ON FARM BIODIVERSITY MANAGEMENT IN AUSTRALIA’S AGRICULTURAL INDUSTRIESTRENDS IN ON FARM BIODIVERSITY MANAGEMENT IN AUSTRALIA’S AGRICULTURAL INDUSTRIES2 3
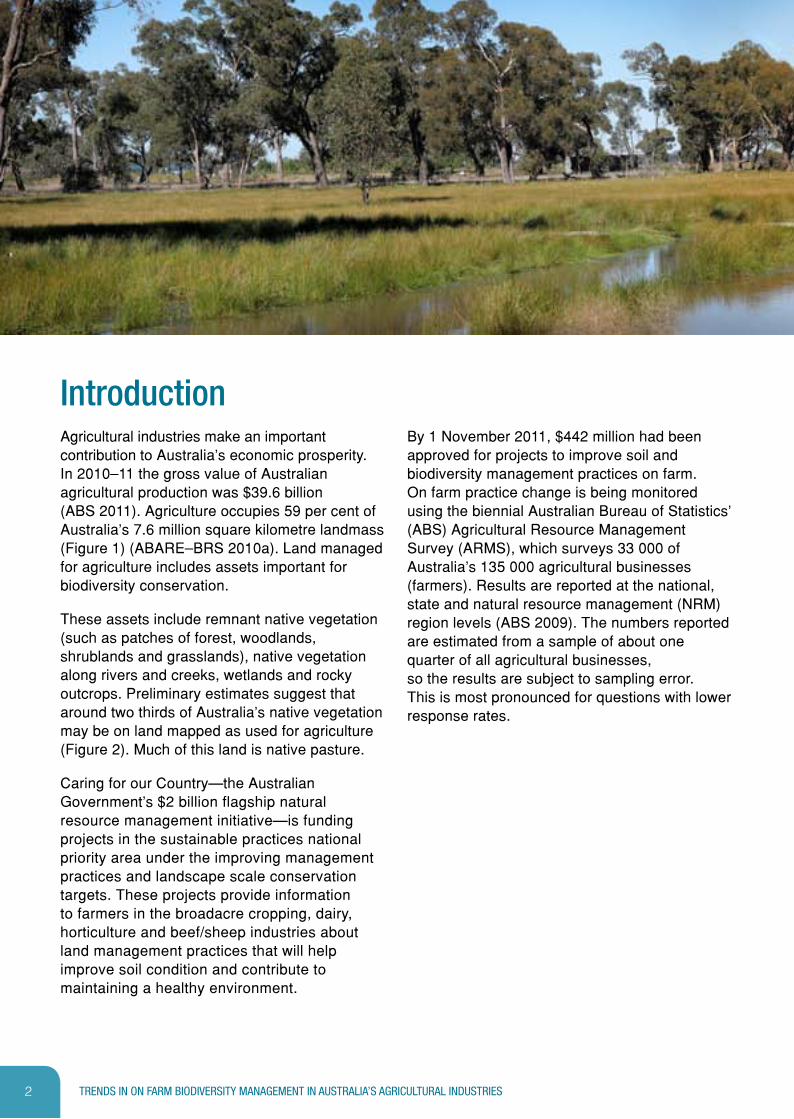
IntroductionAgricultural industries make an important contribution to Australia’s economic prosperity. In 2010–11 the gross value of Australian agricultural production was $39.6 billion (ABS 2011). Agriculture occupies 59 per cent of Australia’s 7.6 million square kilometre landmass (Figure 1) (ABARE–BRS 2010a). Land managed for agriculture includes assets important for biodiversity conservation.
These assets include remnant native vegetation (such as patches of forest, woodlands, shrublands and grasslands), native vegetation along rivers and creeks, wetlands and rocky outcrops. Preliminary estimates suggest that around two thirds of Australia’s native vegetation may be on land mapped as used for agriculture (Figure 2). Much of this land is native pasture.
Caring for our Country—the Australian Government’s $2 billion flagship natural resource management initiative—is funding projects in the sustainable practices national priority area under the improving management practices and landscape scale conservation targets. These projects provide information to farmers in the broadacre cropping, dairy, horticulture and beef/sheep industries about land management practices that will help improve soil condition and contribute to maintaining a healthy environment.
By 1 November 2011, $442 million had been approved for projects to improve soil and biodiversity management practices on farm. On farm practice change is being monitored using the biennial Australian Bureau of Statistics’ (ABS) Agricultural Resource Management Survey (ARMS), which surveys 33 000 of Australia’s 135 000 agricultural businesses (farmers). Results are reported at the national, state and natural resource management (NRM) region levels (ABS 2009). The numbers reported are estimated from a sample of about one quarter of all agricultural businesses, so the results are subject to sampling error. This is most pronounced for questions with lower response rates.
Figure 1. Location of major agricultural land uses in Australia in 2005–06. Sources: ABARE–BRS (2010a), ABARES–BRS (2010b) (horticulture) and 2005–06 Agricultural Census, Australian Bureau of Statistics (mesh blocks containing dairy farms). Note that the areas of dairying and horticulture have been exaggerated for display.
Figure 1

TRENDS IN ON FARM BIODIVERSITY MANAGEMENT IN AUSTRALIA’S AGRICULTURAL INDUSTRIESTRENDS IN ON FARM BIODIVERSITY MANAGEMENT IN AUSTRALIA’S AGRICULTURAL INDUSTRIES2 3
IntroductionAgricultural industries make an important contribution to Australia’s economic prosperity. In 2010–11 the gross value of Australian agricultural production was $39.6 billion (ABS 2011). Agriculture occupies 59 per cent of Australia’s 7.6 million square kilometre landmass (Figure 1) (ABARE–BRS 2010a). Land managed for agriculture includes assets important for biodiversity conservation.
These assets include remnant native vegetation (such as patches of forest, woodlands, shrublands and grasslands), native vegetation along rivers and creeks, wetlands and rocky outcrops. Preliminary estimates suggest that around two thirds of Australia’s native vegetation may be on land mapped as used for agriculture (Figure 2). Much of this land is native pasture.
Caring for our Country—the Australian Government’s $2 billion flagship natural resource management initiative—is funding projects in the sustainable practices national priority area under the improving management practices and landscape scale conservation targets. These projects provide information to farmers in the broadacre cropping, dairy, horticulture and beef/sheep industries about land management practices that will help improve soil condition and contribute to maintaining a healthy environment.
By 1 November 2011, $442 million had been approved for projects to improve soil and biodiversity management practices on farm. On farm practice change is being monitored using the biennial Australian Bureau of Statistics’ (ABS) Agricultural Resource Management Survey (ARMS), which surveys 33 000 of Australia’s 135 000 agricultural businesses (farmers). Results are reported at the national, state and natural resource management (NRM) region levels (ABS 2009). The numbers reported are estimated from a sample of about one quarter of all agricultural businesses, so the results are subject to sampling error. This is most pronounced for questions with lower response rates.
Figure 1. Location of major agricultural land uses in Australia in 2005–06. Sources: ABARE–BRS (2010a), ABARES–BRS (2010b) (horticulture) and 2005–06 Agricultural Census, Australian Bureau of Statistics (mesh blocks containing dairy farms). Note that the areas of dairying and horticulture have been exaggerated for display.
Figure 1

TRENDS IN ON FARM BIODIVERSITY MANAGEMENT IN AUSTRALIA’S AGRICULTURAL INDUSTRIESTRENDS IN ON FARM BIODIVERSITY MANAGEMENT IN AUSTRALIA’S AGRICULTURAL INDUSTRIES4 5
Figure 3. Estimated percentages of agricultural businesses with native vegetation on holdings in 2007–08 and 2009–10.
The area of native vegetation on farmsIn 2009–10, around 65 per cent of agricultural businesses in Australia were estimated as having native vegetation on their holdings (Figure 3). About 74 per cent of businesses with native vegetation provided an estimate of its area; calculated as over 224 million hectares.
The estimated number of agricultural businesses with native vegetation, and the percentage providing estimates of the area of native vegetation was slightly higher in 2007–08, but there was no change in the estimated total area of native vegetation on farms.
Funding has been available from Caring for our Country to encourage farmers to improve the protection and management of native vegetation on farm, including wetlands and vegetation along streams and rivers. This funding has
complemented the activities of state agencies, industry and community groups. Data from the ABS’ 2007–08 and 2009–10 ARMS help track trends in the adoption of biodiversity management practices.
On farm biodiversity management practices
Figure 3
Figure 2. Native vegetation extent for Australia and for states and territories and estimated proportion of this vegetation on areas mapped as being under agricultural land use. Sources: Bureau of Rural Sciences (2010) and Australian Bureau of Agricultural and Resource Economics–Bureau of Rural Sciences (2010b).
Figure 2
According to ABS estimates, in 2009–10 there were 134 553 agricultural businesses (farmers) in Australia, a decrease of 4 per cent since 2007–08. During this time the area managed for agriculture also dropped by 4 per cent to less than 400 million hectares. In 2009–10 the
average age of farmers was 55; on average they had managed their holdings for 23 years and farmed in their local region for 29 years. An estimated 19 per cent of agricultural businesses (25 549) had a Landcare group member.
Agricultural industry profile

TRENDS IN ON FARM BIODIVERSITY MANAGEMENT IN AUSTRALIA’S AGRICULTURAL INDUSTRIESTRENDS IN ON FARM BIODIVERSITY MANAGEMENT IN AUSTRALIA’S AGRICULTURAL INDUSTRIES6 7
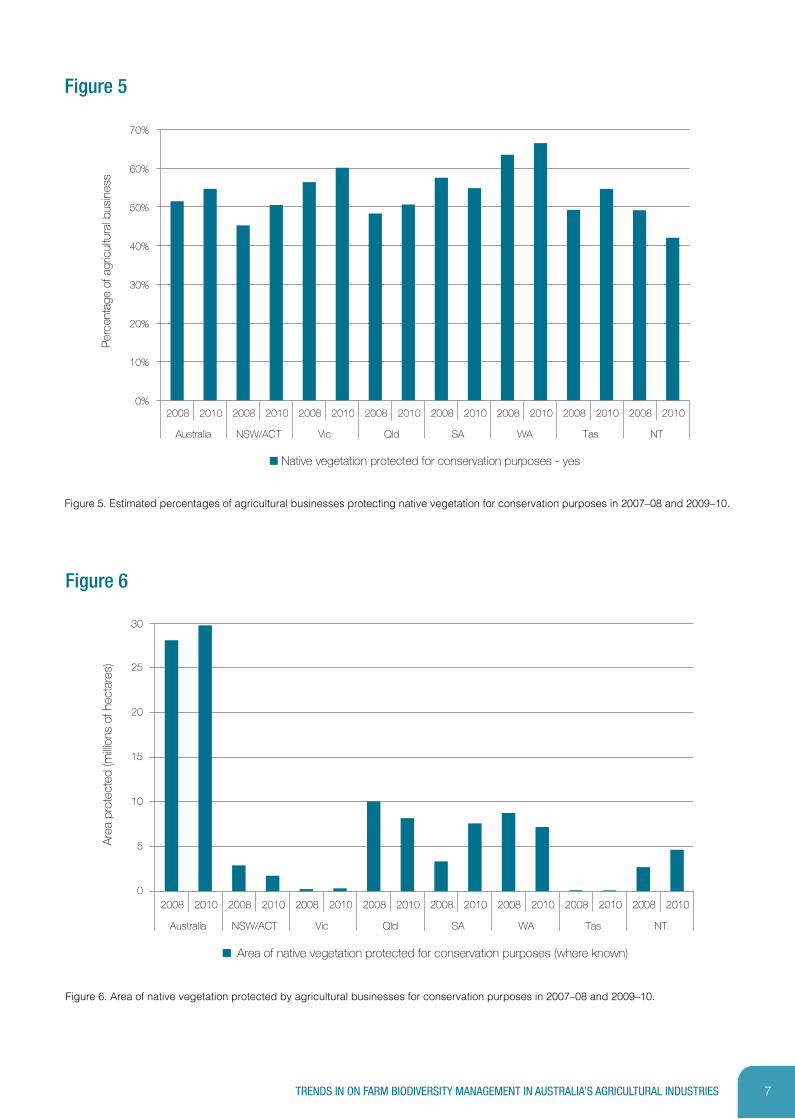
Figure 6. Area of native vegetation protected by agricultural businesses for conservation purposes in 2007–08 and 2009–10.
Figure 5. Estimated percentages of agricultural businesses protecting native vegetation for conservation purposes in 2007–08 and 2009–10.
Figure 5
Figure 6
Protection of native vegetation on farms Of the 65 per cent of agricultural businesses estimated in 2009–10 to have native vegetation on their holdings, 55 per cent protected an estimated almost 30 million hectares of native vegetation for conservation purposes (Figure 5).
Between 2007–08 and 2009–10 there was a 4 per cent increase in the number of agricultural businesses protecting native vegetation on farm for conservation purposes (Figure 5). This resulted in an estimated increase of 2 million hectares in the area protected (Figure 6).
Figure 4. Area of native vegetation estimated on agricultural holdings in the 2007–08 ARMS with the Native Vegetation Extent (2004) dataset (agricultural areas only). (Note that only 78 per cent of those with native vegetation provided an area estimate). It should be noted that native vegetation on smaller holdings not surveyed by ABS was excluded from this analysis. The area of land mapped as Conservation/protected areas (including Indigenous and minimal use classes), is shown for comparative purposes.
Figure 4
The actual area of native vegetation on farms is larger than ABS data suggest; around a quarter of businesses reporting native vegetation did not provide an area estimate. Additionally, smaller rural properties (with an annual estimated value of operation of less than $5000) are not surveyed by the ABS. The ABS’ estimates were compared with the area of native vegetation shown in the Native Vegetation Extent (2004) dataset (BRS
2010) constrained to agricultural areas using the Catchment Scale Land Use data (ABARE–BRS 2010b). Nationally, the ARMS’ estimate of the area of native vegetation on holdings accounted for about 50 per cent of this area (Figure 4). Figure 4 also shows the extent of conservation/protected areas (including Indigenous and minimal land uses) for comparative purposes.
TRENDS IN ON FARM BIODIVERSITY MANAGEMENT IN AUSTRALIA’S AGRICULTURAL INDUSTRIESTRENDS IN ON FARM BIODIVERSITY MANAGEMENT IN AUSTRALIA’S AGRICULTURAL INDUSTRIES6 7
Figure 6. Area of native vegetation protected by agricultural businesses for conservation purposes in 2007–08 and 2009–10.
Figure 5. Estimated percentages of agricultural businesses protecting native vegetation for conservation purposes in 2007–08 and 2009–10.
Figure 5
Figure 6
Protection of native vegetation on farms Of the 65 per cent of agricultural businesses estimated in 2009–10 to have native vegetation on their holdings, 55 per cent protected an estimated almost 30 million hectares of native vegetation for conservation purposes (Figure 5).
Between 2007–08 and 2009–10 there was a 4 per cent increase in the number of agricultural businesses protecting native vegetation on farm for conservation purposes (Figure 5). This resulted in an estimated increase of 2 million hectares in the area protected (Figure 6).
Figure 4. Area of native vegetation estimated on agricultural holdings in the 2007–08 ARMS with the Native Vegetation Extent (2004) dataset (agricultural areas only). (Note that only 78 per cent of those with native vegetation provided an area estimate). It should be noted that native vegetation on smaller holdings not surveyed by ABS was excluded from this analysis. The area of land mapped as Conservation/protected areas (including Indigenous and minimal use classes), is shown for comparative purposes.
Figure 4
The actual area of native vegetation on farms is larger than ABS data suggest; around a quarter of businesses reporting native vegetation did not provide an area estimate. Additionally, smaller rural properties (with an annual estimated value of operation of less than $5000) are not surveyed by the ABS. The ABS’ estimates were compared with the area of native vegetation shown in the Native Vegetation Extent (2004) dataset (BRS
2010) constrained to agricultural areas using the Catchment Scale Land Use data (ABARE–BRS 2010b). Nationally, the ARMS’ estimate of the area of native vegetation on holdings accounted for about 50 per cent of this area (Figure 4). Figure 4 also shows the extent of conservation/protected areas (including Indigenous and minimal land uses) for comparative purposes.
TRENDS IN ON FARM BIODIVERSITY MANAGEMENT IN AUSTRALIA’S AGRICULTURAL INDUSTRIESTRENDS IN ON FARM BIODIVERSITY MANAGEMENT IN AUSTRALIA’S AGRICULTURAL INDUSTRIES8 9
Figure 9. Estimated area of conservation agreements for the protection of native vegetation in 2007–08 and 2009–10.
Figure 9
Figure 8. Estimated percentages of agricultural businesses with conservation agreements for the protection of native vegetation and percentages for those held in perpetuity in 2007–08 and 2009–10.
Figure 8
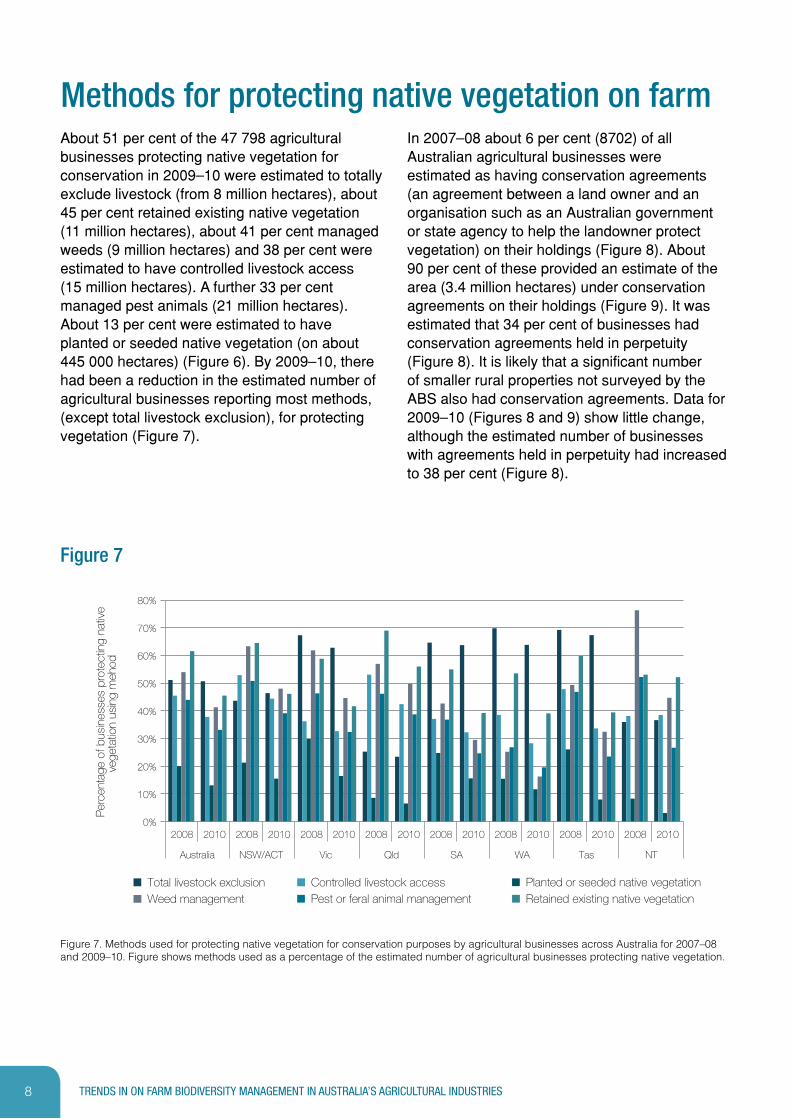
Figure 7. Methods used for protecting native vegetation for conservation purposes by agricultural businesses across Australia for 2007–08 and 2009–10. Figure shows methods used as a percentage of the estimated number of agricultural businesses protecting native vegetation.
Figure 7
Methods for protecting native vegetation on farmIn 2007–08 about 6 per cent (8702) of all Australian agricultural businesses were estimated as having conservation agreements (an agreement between a land owner and an organisation such as an Australian government or state agency to help the landowner protect vegetation) on their holdings (Figure 8). About 90 per cent of these provided an estimate of the area (3.4 million hectares) under conservation agreements on their holdings (Figure 9). It was estimated that 34 per cent of businesses had conservation agreements held in perpetuity (Figure 8). It is likely that a significant number of smaller rural properties not surveyed by the ABS also had conservation agreements. Data for 2009–10 (Figures 8 and 9) show little change, although the estimated number of businesses with agreements held in perpetuity had increased to 38 per cent (Figure 8).
About 51 per cent of the 47 798 agricultural businesses protecting native vegetation for conservation in 2009–10 were estimated to totally exclude livestock (from 8 million hectares), about 45 per cent retained existing native vegetation (11 million hectares), about 41 per cent managed weeds (9 million hectares) and 38 per cent were estimated to have controlled livestock access (15 million hectares). A further 33 per cent managed pest animals (21 million hectares). About 13 per cent were estimated to have planted or seeded native vegetation (on about 445 000 hectares) (Figure 6). By 2009–10, there had been a reduction in the estimated number of agricultural businesses reporting most methods, (except total livestock exclusion), for protecting vegetation (Figure 7).

TRENDS IN ON FARM BIODIVERSITY MANAGEMENT IN AUSTRALIA’S AGRICULTURAL INDUSTRIESTRENDS IN ON FARM BIODIVERSITY MANAGEMENT IN AUSTRALIA’S AGRICULTURAL INDUSTRIES8 9
Figure 9. Estimated area of conservation agreements for the protection of native vegetation in 2007–08 and 2009–10.
Figure 9
Figure 8. Estimated percentages of agricultural businesses with conservation agreements for the protection of native vegetation and percentages for those held in perpetuity in 2007–08 and 2009–10.
Figure 8
Figure 7. Methods used for protecting native vegetation for conservation purposes by agricultural businesses across Australia for 2007–08 and 2009–10. Figure shows methods used as a percentage of the estimated number of agricultural businesses protecting native vegetation.
Figure 7
Methods for protecting native vegetation on farmIn 2007–08 about 6 per cent (8702) of all Australian agricultural businesses were estimated as having conservation agreements (an agreement between a land owner and an organisation such as an Australian government or state agency to help the landowner protect vegetation) on their holdings (Figure 8). About 90 per cent of these provided an estimate of the area (3.4 million hectares) under conservation agreements on their holdings (Figure 9). It was estimated that 34 per cent of businesses had conservation agreements held in perpetuity (Figure 8). It is likely that a significant number of smaller rural properties not surveyed by the ABS also had conservation agreements. Data for 2009–10 (Figures 8 and 9) show little change, although the estimated number of businesses with agreements held in perpetuity had increased to 38 per cent (Figure 8).
About 51 per cent of the 47 798 agricultural businesses protecting native vegetation for conservation in 2009–10 were estimated to totally exclude livestock (from 8 million hectares), about 45 per cent retained existing native vegetation (11 million hectares), about 41 per cent managed weeds (9 million hectares) and 38 per cent were estimated to have controlled livestock access (15 million hectares). A further 33 per cent managed pest animals (21 million hectares). About 13 per cent were estimated to have planted or seeded native vegetation (on about 445 000 hectares) (Figure 6). By 2009–10, there had been a reduction in the estimated number of agricultural businesses reporting most methods, (except total livestock exclusion), for protecting vegetation (Figure 7).

TRENDS IN ON FARM BIODIVERSITY MANAGEMENT IN AUSTRALIA’S AGRICULTURAL INDUSTRIESTRENDS IN ON FARM BIODIVERSITY MANAGEMENT IN AUSTRALIA’S AGRICULTURAL INDUSTRIES10 11
Figure 11. Estimated percentages of agricultural businesses protecting wetlands on holdings for conservation purposes in 2007–08 and 2009–10.
Figure 11
Figure 10. Estimated percentages of agricultural businesses with wetlands on holdings in 2007–08 and 2009–10.
Figure 10
In 2009–10 about 12 per cent of Australia’s agricultural businesses were estimated as having wetlands on their holdings, a small increase in the numbers reported for 2008–09 (Figure 10). Of the 12 per cent reporting wetlands, 57 per cent protected their wetlands for conservation purposes, an increase of 12 per cent since 2007–08 (Figure 11).
In 2009–10 an estimated 43 per cent of agricultural businesses protecting wetlands on holdings retained existing native vegetation (0.7 million hectares) or controlled livestock access (0.6 million hectares). An estimated 41 per cent of agricultural businesses managed
Protection of wetlands weeds (0.3 million hectares) in wetlands, 41 per cent excluded livestock (0.3 million hectares), 30 per cent managed pests or feral animals (0.8 million hectares) and 20 per cent maintained water in wetlands (90 000 hectares), and about 11 per cent planted or seeded native vegetation (13 000 hectares). Figure 12 shows that these estimated percentages were 6 to14 per cent lower than those for 2007–08. The number of businesses using these methods (except for planting/seeding) did increase over the period 2007–08 to 2009–10, but not in proportion to the increased number of businesses protecting wetlands in 2009–10.

TRENDS IN ON FARM BIODIVERSITY MANAGEMENT IN AUSTRALIA’S AGRICULTURAL INDUSTRIESTRENDS IN ON FARM BIODIVERSITY MANAGEMENT IN AUSTRALIA’S AGRICULTURAL INDUSTRIES12 13
Figure 14
Figure 13. Estimated percentages of agricultural businesses with rivers and creeks on holdings in 2007–08 and 2009–10.
Figure 14. Estimated percentages of agricultural businesses protecting rivers and creeks on holdings for conservation purposes in 2007–08 and 2009–10.
Figure 13
Figure 12. Methods used for protecting wetlands for conservation purposes across Australia for 2007–08 and 2009–10. Figure shows methods used as a percentage of the estimated number of agricultural businesses protecting wetlands.
Figure 12
Protection of vegetation along rivers and creeks In 2009–10, 50 per cent of agricultural businesses in Australia were estimated as having rivers or creeks on their holdings (Figure 13). Of this 50 per cent, 55 per cent were protecting creek or riverbank areas (Figure 14). This is an estimated 6 per cent increase in the agricultural businesses protecting creek or riverbank areas since 2007–08 (Figures 13 and 14). There was little change in area reported as protected (almost 2.2 million hectares).
TRENDS IN ON FARM BIODIVERSITY MANAGEMENT IN AUSTRALIA’S AGRICULTURAL INDUSTRIESTRENDS IN ON FARM BIODIVERSITY MANAGEMENT IN AUSTRALIA’S AGRICULTURAL INDUSTRIES14 15
References Australian Bureau of Agricultural and Resource Economics–Bureau of Rural Sciences (2010a), Land Use of Australia 2005–06, Version 4, Department of Agriculture, Fisheries and Forestry, Canberra.
Australian Bureau of Agricultural and Resource Economics–Bureau of Rural Sciences (2010b), Catchment Scale Land Use Mapping for Australia – Update March 2010 dataset, Department of Agriculture, Fisheries and Forestry, Canberra. http://adl.brs.gov.au/anrdl/metadata_files/pa_luausr9abll07611a00.xml
Australian Bureau of Statistics (2011), Value of Agricultural Commodities Produced 2009–10, Australian Bureau of Statistics, Canberra.
Australian Bureau of Statistics (2009), 4627.0, Land Management and Farming in Australia, 2007–08. http://www.abs.gov.au/AUSSTATS/[email protected]/allprimarymainfeatures/C3FC0BDD85E571DBCA2578B50011D983?opendocument.
Bureau of Rural Sciences (2010), Native Vegetation Extent 2004 dataset, Department of Agriculture, Fisheries and Forestry, Canberra. http://www.daff.gov.au/__data/assets/pdf_file/0008/1546892/tech-rpt-veg.pdf
Conclusions Land managed for agriculture includes a significant component of Australia’s biodiversity assets. Estimates from the ABS’ ARMS data indicate that more than half of the agricultural businesses reporting native vegetation or wetlands, rivers and creeks on farm were protecting these resources for conservation purposes. Over the period 2007–08 to 2009–10, the estimated number of businesses protecting these assets increased, by 4 per cent for native vegetation, 12 per cent for wetlands and 6 per cent for rivers and creeks.
These increases were not always reflected in increased percentages of businesses reporting methods used for protection. The 2009–10 ARMS asked respondents to nominate the hectares of
native vegetation, wetlands, rivers and creeks protected through excluding or controlling livestock access, managing weeds or pests, retaining existing vegetation or planting/seeding new native vegetation. The difficulties associated with providing area estimates for these activities may have reduced the number of responses to the questions.
Information about regional level adoption of on farm biodiversity management practices for 2007–08 is available at http://tinyurl.com/89sggbk; regional results from the 2009–10 ARMS will be available for each state and territory later in 2012.
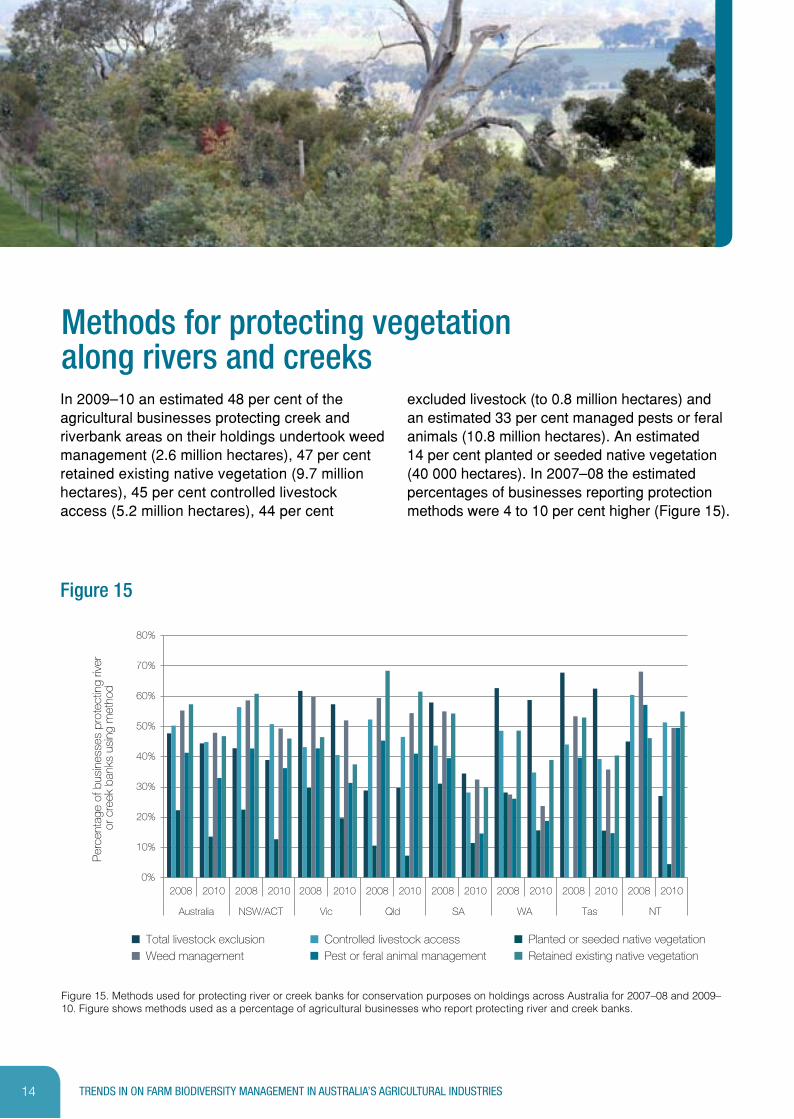
Figure 15. Methods used for protecting river or creek banks for conservation purposes on holdings across Australia for 2007–08 and 2009–10. Figure shows methods used as a percentage of agricultural businesses who report protecting river and creek banks.
Figure 15
Methods for protecting vegetation along rivers and creeks In 2009–10 an estimated 48 per cent of the agricultural businesses protecting creek and riverbank areas on their holdings undertook weed management (2.6 million hectares), 47 per cent retained existing native vegetation (9.7 million hectares), 45 per cent controlled livestock access (5.2 million hectares), 44 per cent
excluded livestock (to 0.8 million hectares) and an estimated 33 per cent managed pests or feral animals (10.8 million hectares). An estimated 14 per cent planted or seeded native vegetation (40 000 hectares). In 2007–08 the estimated percentages of businesses reporting protection methods were 4 to 10 per cent higher (Figure 15).

TRENDS IN ON FARM BIODIVERSITY MANAGEMENT IN AUSTRALIA’S AGRICULTURAL INDUSTRIESTRENDS IN ON FARM BIODIVERSITY MANAGEMENT IN AUSTRALIA’S AGRICULTURAL INDUSTRIES14 15
References Australian Bureau of Agricultural and Resource Economics–Bureau of Rural Sciences (2010a), Land Use of Australia 2005–06, Version 4, Department of Agriculture, Fisheries and Forestry, Canberra.
Australian Bureau of Agricultural and Resource Economics–Bureau of Rural Sciences (2010b), Catchment Scale Land Use Mapping for Australia – Update March 2010 dataset, Department of Agriculture, Fisheries and Forestry, Canberra. http://adl.brs.gov.au/anrdl/metadata_files/pa_luausr9abll07611a00.xml
Australian Bureau of Statistics (2011), Value of Agricultural Commodities Produced 2009–10, Australian Bureau of Statistics, Canberra.
Australian Bureau of Statistics (2009), 4627.0, Land Management and Farming in Australia, 2007–08. http://www.abs.gov.au/AUSSTATS/[email protected]/allprimarymainfeatures/C3FC0BDD85E571DBCA2578B50011D983?opendocument.
Bureau of Rural Sciences (2010), Native Vegetation Extent 2004 dataset, Department of Agriculture, Fisheries and Forestry, Canberra. http://www.daff.gov.au/__data/assets/pdf_file/0008/1546892/tech-rpt-veg.pdf
Conclusions Land managed for agriculture includes a significant component of Australia’s biodiversity assets. Estimates from the ABS’ ARMS data indicate that more than half of the agricultural businesses reporting native vegetation or wetlands, rivers and creeks on farm were protecting these resources for conservation purposes. Over the period 2007–08 to 2009–10, the estimated number of businesses protecting these assets increased, by 4 per cent for native vegetation, 12 per cent for wetlands and 6 per cent for rivers and creeks.
These increases were not always reflected in increased percentages of businesses reporting methods used for protection. The 2009–10 ARMS asked respondents to nominate the hectares of
native vegetation, wetlands, rivers and creeks protected through excluding or controlling livestock access, managing weeds or pests, retaining existing vegetation or planting/seeding new native vegetation. The difficulties associated with providing area estimates for these activities may have reduced the number of responses to the questions.
Information about regional level adoption of on farm biodiversity management practices for 2007–08 is available at http://tinyurl.com/89sggbk; regional results from the 2009–10 ARMS will be available for each state and territory later in 2012.
Figure 15. Methods used for protecting river or creek banks for conservation purposes on holdings across Australia for 2007–08 and 2009–10. Figure shows methods used as a percentage of agricultural businesses who report protecting river and creek banks.
Figure 15
Methods for protecting vegetation along rivers and creeks In 2009–10 an estimated 48 per cent of the agricultural businesses protecting creek and riverbank areas on their holdings undertook weed management (2.6 million hectares), 47 per cent retained existing native vegetation (9.7 million hectares), 45 per cent controlled livestock access (5.2 million hectares), 44 per cent
excluded livestock (to 0.8 million hectares) and an estimated 33 per cent managed pests or feral animals (10.8 million hectares). An estimated 14 per cent planted or seeded native vegetation (40 000 hectares). In 2007–08 the estimated percentages of businesses reporting protection methods were 4 to 10 per cent higher (Figure 15).

TRENDS IN ON FARM BIODIVERSITY MANAGEMENT IN AUSTRALIA’S AGRICULTURAL INDUSTRIES16
This document is provided under a Creative Commons Attribution 3.0 Australia (http://creativecommons.org/licenses/by/3.0/au/) licence. Unless otherwise stated, all images in the publication are copyrighted by their original owners. This publication (and any material sourced from it) should be attributed as: Barson, M., Mewett, J. and Paplinska, J. 2012 Trends in on farm biodiversity management in Australia’s agricultural industries. Caring for our Country Sustainable Practices fact sheet 5. Department of Agriculture, Fisheries and Forestry.