Trends In Nonrenewable Natural-Resource Commodity Prices ... · TRENDS IN NONRENEWABLE...
32
WORKING PAPERS TDS I NONALE NTRAL-RESOUCE COMODIT PRICES: A AYSIS OF T TI DMAIN Margaret E. Slade WORING PAPER NO. 49 March 1982 n B o Eo wn pa a pma ms ce t se dso I c cmt Al d ctine in te ae i te p dan T ioe inorat ote by t COl w a l p o pb r T a I con s for are toe « t at ad d ı ne r t t o oe me o the Bureu of Eonomc o Cmso sf o te Cmson i. Upon ru sngle copie c te p wm b p. Re in publicions to FC Bureu of Eoomic w pa by FC eoo (ote than aowgeent by a mte that be ba aes t sc unpublishe mateials) should be cee w te autor t protet te tttv ccr of te paps. BURU OF ECONOMCS FDER TDE COMSSION WASHGTON, DC 20580
Transcript of Trends In Nonrenewable Natural-Resource Commodity Prices ... · TRENDS IN NONRENEWABLE...
WORKING PAPERS
TRENDS IN NONRENEWABLE NATURAL-RESOURCE COMMODITY
PRICES AN ANALYSIS OF THE TIME DOMAIN
Margaret E Slade
WORKING PAPER NO 49
March 1982
nc Bureau of Ecoaomics working papers are preliminary materials circulated to stimulate discussioo IDd critical comment All data coatained in them are in the pablic domain This iodudes information obtained by the COOlllliH whG as lletome part of public retOrd The analyses IDd cooduions set forth are those laquo the authors and do necsarily reflect tbe tiNs of odler members of the Bureau of Economics other Commissioo staff or the Commission itself Upon request single copies cl the paper wm be provided References in publications to FTC Bureau of Ecooomics working papers by FTC econoolists (other than ackuowledgement by a mter that be bas access to such unpublished materials) should be cleared with the author to protect the tentative character of these papers
BUREAU OF ECONOMICS FEDERAL TRADE COMMISSION
WASHINGTON DC 20580
bull -TRENDS IN NONRENEWABLE NATURAL-RESOURCE COMMOD ITY PR I CES
AN ANALYSIS OF THE T IME DO MA IN
Margaret E Slade
Bureau of Economics
Federal Trade Commission
Washington D C 20580
February 1981
The work reported here was done while I was employed by the us Geological Survey Reston Va I am grateful to Emil Attanasi Donald Hanson David Root David Scheffman and two anonymous referees for reviews of an earlier draft
I INTRODUCTION
The idea that limited natural resources limit economic growth
dates at least as far back as the early 19th century when the
British classical economists particularly Malthus Ricardo and
Mill theorized about the steady-state (no-growth) society
Materials shortages related to World War I I and the Korean War led
to a renewed interest in the sub j ect of natural-resource adequacy
The formation of the us Presidents Materials Policy Commission
(The Paley Commission 1952) as well as the publication of
several theoretical and empirical studies Barnett and Morse
1963 and Potter and Christy 1962 for example) are evidence of
concern at those times with the role of natural resources in
economic growth In the 1970s several events and trends
including the Arab oil embargo the Organization of Petroleum
Exporting Countries (OPEC) price increases and the United
States growing dependence on imports of many minerals led to
another round of presidential commissions and research efforts
attempting to assess natural-resource adequacyl However there
is still no consensus among economists as to whether naturalshy
resource commodities are becoming scarce relative to other factors
of production
One indication of scarcity would be an increase in the real
price of natural-resource commodities In the theoretical literashy
ture of exhaustible resources models are developed that predict
an exponential increase in price net of marginal extraction cost
over time (Hotelling 1931 and Solow 1974 for example) In
-2shy
contrast empirical studies such as that by Barnett and Morse
(1963) have found a relative decline in natural-resource commodshy
ity prices Two recent empirical studies by Barnett (1979) and
Smith (1979) both updates of Barnett and Morse reached different
conclusions from one another Barnett maintained that the origishy
nal Barnett and Morse judgment still holds--there is no sign of an
upturn in either real cost or relative price of the output of the
extractive industries2 whereas Smith concluded that the data are
insufficient to support the hypothesis of no increase in naturalshy
resource scarcity
This paper is an attempt to reconcile the theoretical predicshy
tions of an increase in prices over time with the empirical findshy
ings of falling real prices A model for long-run price moveshy
ments of the nonrenewable natural resource commodities (the minershy
al commodities) when there is exogeneous technical change and
endogenous change in the grade of ores mined is derived that sugshy
gests a U-shaped time path for relative prices The relativeshy
price movements implied by this model are tested for all the ma jor
metals and fuels and the model parameters are found to be
statistically significant for eleven out of twelve commodities
The organization of this paper is as follows In the next
section a theoretical model of price movements for nonrenewable
natural-resource commodities is developed In section I I I the
data are discussed and in section IV the fitted linear and
quadratic trends are presented and analyzed Finally in the last
section conclusions are drawn
-3shy
II LONG-RUN PRICING MODEL
The most frequently proposed indices of natural-resourceshy
commodity scarcity are relative price (the ratio of an extractive-
industry price index to an overall price index) unit cost (labor
or labor plus capital inputs per unit of extractive-industry outshy
put) and rental rate (the marginal value of the resource in the
ground) Several authors (Brown and Fieldl978 Fisherl979 and
Smithl978) have recently addressed the issue of the appropriate
choice of scarcity index Following Fisher and Smith I choose to
3focus on relative price as the appropriate measure
The theoretical model of real-price movements for nonrenewshy
able natural-resource commodities developed here is a modification
of a model due to Schultze (1974) In presenting the model the
following notation will be used Let
Q(t) be at
t e outijut t1me t
of metal in the extractive industry
g(t) be the grade of ore mined at time t4 where grade is ordered by increasing extraction cost so that g lt g implies that it is less costly to produce a unit of metal from ore of grade g than from ore of grade g
B(Q) be the benefit the area under
or willingness to pay the demand curve)
for Q (ie
CQgt) be total extraction cost depends on the
and processing cost Total level of output and the grade
extracted as well cal change in the
as on time industry)
(a measure of technishy
f(g) be the density that the total
of metal for grade amount of metal in
g in the sense the grades betshy
ween g and g + 6g is approximately
f(g)6g g
g g + 6g
and p be the social discount rate
-4shy
The problem is to choose a time path for extraction rates
that will maximize the discounted stream of current and future
benefits minus costs The extraction rate at time t Q(t) is
equal to the rate of change of grade g (where a dot over a
variable denotes its time rate of change) times the density funcshy
tion f(g) (the metal available at that grade) Therefore choosshy
ing an extraction rate is equivalent to choosing the rate of
change of grade We thus wish to maximize
-pt max J00 e [B(Q)-C(Qgt)]dt (1) g 0
subject to the production relationship
Q(t) = g(t)f(g(t)) (2)
This optimal-control problem can be solved by introducing the
costate variable A(t) and forming the Hamiltonian H
(3)
The first-order conditions for an interior maximum of (1) are
-ptH = e [Bf - c f] - A = 0 g 0
or B = P(Q) = + Aeptf (4)CQ
where P(Q) is the inverse demand function and
-pt[B gf shy= C f - C ] (5)A = H e g g Q g
Differentiating (4) with respect to time we obtain
-5shy
fg
-f-
( 4) = p
(9)
(6)
pt A ptp = CQ + Ae + pe -
f
Substituting (5) into 6) we
p =
=
CQ + Pgf
CQ + Pgfshy
f
- c gfQ
f
Pgfshy c
f
ApePt
pt Ae
f2
have
Apeptc + g
+ Apept
f
-
Aeptf g
2f
c + (7)= cQ 3 f f
If we make the simplifying assumption that marginal cost c0 is
is constant for a given grade and state of technology and is an
additive function of its two arguments g and t ie
=c [h (g) + k(t)]Q (8)
ptpt =then p = hg + k hQ + Ape k + Ape ( 9)
f f
Define A by
=A Aeptf (1 0 )
A
that A is- CQ soThen by A the rental rate or the marshy
ginal value of in the ground and (4) andthe resource become
(11)
and P = k + pA 12)
-6shy
= h(g) + k(t) + A
-7-
Price equals marginal extraction cost plus rent and the rate
of change of price is equal to the rate of change of marginal cost
due to changes in technology plus the discount rate times rent
Without technical change prices increase with time because A is
always positive However if the rate of technical change is
sufficiently large so that k is sufficiently negative prices
will fall s If k falls with time but at a decreasing rate
while A increases with time the price path will generally be u-
shaped Figure 1 shows the price path when A and h increse with
time and k falls 6
The copper industry illustrates the historic counterbalancing
influences of improvements in technology and deterioration in ore
quality in determining production cost In the period between
1900 and today the average grade of copper ores mined in the
United States declined from about 5 percent to 0 7 percent (U S
Bureau of Mines 1975) In spite of this decline in grade real
copper price fell until about 1940 The fall in price was made
possible by technological developments in the early part of the
century particularly the advent of large earth-moving equipment
which made possible the strip mining of extremely low-grade ore
bodies and the discovery of froth flotation which made concenshy
tration of low-grade sulfide ores very economical However by
1940 the switch to the new technology had reached its natural
limits and since that time with no fundamentally new techshy
nological development in the industry the decline in grade has
become the dominant factor in determining cost Peterson and
FIGURE 1 MARGINAL-COST AND PRICE PATHS FOR MINERAL COVMODITIES
s
)
s Q)
0
Vl
s ttl
-
0 Cl
A
h(g)
Time
-8shy
Maxwell (1979) document the history of ore grade-technology tradeshy
offs for other metals (silver tin lead zinc and iron) and
claim that these tradeoffs have been much more important than the
discovery of new deposits in the historic determination of metal
prices
Equation 12 although suggesting a U-shaped time path for
relative prices does not specify a specific functional form
Because the slope of the marginal-cost curve is determined by many
factors that differ for each commodity the simplest u-shaped time
path the quadratic was chosen for estimation purposeslO In
section IV fitted quadratic trends for each of eleven metals and
fuels will be compared with linear trends for the same
commodities
I I I D TA SOURCE S
The data consist of annual time series for the period 1870
(or year of earliest available figures) to 19788 for all the major
metals and fuels with the exception of gold9 Prices were
deflated by the us wholesale price index (1967 = 1) and are thus
in 1967-constant dollars For some commodities prices of both
ore and metal are available (bauxite and aluminum for example)
However for consistency metal prices were always used10
Table I lists the eleven commodities the units of measureshy
ments of their prices and the data sources Seven of the eleven
price series were taken form Manthy (1978) These series were
-9 shy
Commodity
TABLE I
DATA SOURCES
Units Source
Al uminum centlb Schurr Metal Statistics
Copper centlb Man thy
Iron Index (1951-53 =100) Man thy
Lead centlb Man thy
Nickel centlb Minerals Yearbook
Silver centoz Schurr Metal Statistics
Tin centlb Metal Statistics
Zinc centlb Man thy
Coal $short ton Man thy
Natural Gas cent10 00 ft3 Man thy
Petroleum $bbl Man thy
-10shy
updated to 1978 whenever possible by using the sources listed in
Manthy (tables MP-3 and MP-6 pp 211-212)
In addition to the eleven commodities of table I linear and
quadratic trends were fitted to the mineral-aggregate price series
constructed by Manthy However the commodities included in
Manthys index are not the same as those shown in table I An
aggregate price index could be constructed from the eleven series
of table I However constructing an aggregate series is a
questionable practice because it entails linking the prices of
commodities that were not produced in the early years of the
period to prices of related commodities (natural gas to petroleum
for example)ll Therefore no attempt was made to aggregate the
prices of the metals and fuels in table I
IV EMP IR I CAL RE SULTS--QUADRATIC AN D LINEAR TREN DS
Tables II and III and figures 2-13 show the fitted linear and
quadratic price trends for the major metals and fuels and the
aggregate commodity the trends are based on the equations
and
(13)
(14)
where
-11shy
Pit is the deflated price of the ith commodity at time t
t is time measured in years (1800=0)
and Uit and Vit are random error terms l2
In the tables t-statistics of the estimated coefficients are
shown in parentheses under the corresponding coefficients
In table I I some of the linear-trend coefficients are posishy
tive whereas others are negative but only seven of the twelve are
statistically significant at the 90 percent level of confidence
Therefore no generalization can be made about natural-resource
scarcity from the linear model In contrast in table I I I the
trend coefficients for all twelve commodities have the same
signs--the coefficients of the linear terms are negative and those
of the quadratic terms are positive--implying the predicted convex
curvature In addition eleven of the twelve quadratic-term
coefficients are significant at the 90 percent confidence level
(lead is the exception) Figures 2-13 show that the fitted linear
models underestimate relative prices in the last years of the
1870 -1978 period for all twelve commodities and that even though
relative prices of some commodities fell during a considerable
part of the last century (note aluminum in particular) prices of
every commodity have passed the minimum points on their u-shaped
curves and have begun to increase
With the exception of lead and zinc the quadratic curvature
for the individual commodities is fairly pronounced However
-12shy
bull 59)
( 4 bull 4 )
59
97
73
TABLE I I
FITTED LINEAR TREN DS
Coef of FtimeCommodity
Aluminum 180 - 95 91 790 73 (-4 6)
Copper 61 - 18 70 244 77 (-2 0)
where Iron 85 13 65 190 80
Lead 14 00 2 51 111 72 ( 1 0)
Nickel -114 1 3 86 386 90 ( 2 bull 6 )
Silver -526 3 7 95 1967 98 ( 96)
97 Tin - 17 76 291 72
Zinc 17 -0 14 0 3 3 6 14 ( -1 1)
13 Coal -13 89 736 (2 6
Natural Gas 97 - 78 84 297 1 0 (-1 8)
Petroleum 1 9 0 14 151 (1 5)
Aggregate 22 - 021 64 181 71 (- 57) Denotes significance at the 99 percent confidence level
Denotes significance at the 95 percent confidence level
Denotes significance at the 90 percent confidence level
a Pl is the auto correlation coefficient of the error term
-13shy
(-33l
354
(-9) ( bull 9)
-84
77
TABLE I I I
F ITTED QUADRATIC TREND S
Coef of Coef of Commodity bo time time2 R2 F P2a
-6s
-19
020563 91 413 64Aluminum (28l 0070165 72 133 68Copper
(-35) (3 bull 2
-44 019 69 110 60 (-48) (48)
Iron
22 -14 00057 52 56 71Lead
(-13) 031 626 86 194 85Nickel (1 5)
-23 Silver 1692 083 96 1157 82 (-76) (7 1)
205 -26 014 149 69Tin (-12) (1 bull 7 )
Zinc 30 -23 00086 06 36 10 (-20 (19)
-4o Coal 26 0017 88 381 92 (-19 (2 bull 3 )
Natural Gas 633 -83 028 88 205 80 (-63) (6 5)
Petroleum 10 -12 00051 60 78 68 (-17) (1 bull 8 )
Aggregate 46 -42 0016 65 91 68 ( -14) (1 3)
a P2 is the auto correlation coefficient of the error term
-14-
- -
FIGURES 2 - 13
History of Deflated Prices and Fitted Linear and Quadratic Trends
for the Major Metals and Fuels
1 5
100
c z gtCgt
a 0
z u
75
so
25
1890 1900
Aluminum
YEAR
c z gt cQ
a
z u
60
1890 1900 1910 1920
Copper
1930 1940 1950 1960 1970
JUR
-16-
gtlt 0 a -
)40
80
1890 1900 1910
Iron
1920 1930 ) 0 1950 1960 1970
YEAR
0 a gt00
alt 0
30
5
Lead
1890 1900 1910 1920 1930 1940 1950 )960 1970
TrAR
-1 7 -
120
100
0 z 80gt0CL
wCL
z 60
40
20 Nickel
1890 1 900 1910 1920 19)1) 1940 1950 1960 1970
ffAI
u z gt0
a Q
z w-
Silver
250
zoo
ISO
100
1890 1900 1910 1920 1931 1940 1950 1960 1970
Ypound1=1 8 --
fEAR - 1 9 -
Q
0
ltlC w
200
ITS
ISO
li 125 ltgt
100
Tin
YEAR
a w0
z w u
30
25
1890 1900 1910 1910 1930
Zinc
19(0 1950 1960 1970
z
a
J
8
1890 1900
Coal
1910 1920 1930 1940 1950 1960 1970
TEAR
1-
z
a
1-z
30
25
20
15
10
5
1890 1900
Natural Gas
1910 1920 1930 1940 1950 1960 1970
tAR
-20-
1900
YEAR
_ w IX
CL
ac
8
7
6
5
1890 1910
Petroleum
1920 1930 1940 1950 1960 1970
30
25
189() 1900 1910
Mineral Aggregate
1920 1930 1940 1950 1960 1970
YIIJ
-2 1-
prices of the aggregate commodity show no marked trend either
linear or quadratic Because the minimum point on the price curve
occurs early in the period for some commodities (tin and coal) and
late in the period for others (aluminum) when the commodities are
aggregated the pronounced curvature disappears Therefore
general conclusions about natural-resource scarcity cannot be
drawn from the aggregate index alone
In his analysis of natural -resource commodity price aggregshy
ates Smith (1979) found that for all four aggregate price series
examined l3 the linear-trend coefficient was unstable over time
In particular for the mineral sector the trend coefficient was
initially negative but increased with time until it became zero
If the correct model for price behavior is nonlinear the slope of
a local linear approximation will vary depending on the time
period chosen And if the correct model is u-shaped the trend
coefficient will be initially negative and will increase with
time as found for the mineral sector Therefore Smiths results
are consistent with those reported here
V I I SUMMARY AND CONCLUS ION S
The analysis of long-run relative-price movements of nonshy
renewable natural-resource commodities revealed that with a
linear model estimated trend coefficients were both positive and
negative in sign and were significant at the 90 percent confishy
dence level in only a little over half of the cases examined
-22shy
Therefore no generalization can be made about natural-resource
scarcity from a linear model In contrast with a quadratic
model fitted trends for prices of all the major metals and fuels
showed the predicted convex curvature--initially falling but
eventually rising--and all but one of the estimated coefficients
of the squared terms were statistically significant at the 90
percent confidence level The fitted linear-trend models undershy
estimate relative prices of all the major metals and fuels in
the last few years of the 1870-1978 period because prices of all
commodities have passed the minimum points on their fitted
U-shaped curves and have begun to increase Therefore if
scarcity is measured by relative prices the evidence indicates
that nonrenewable natural-resource commodities are becoming
scarce l4
An examination of the fitted quadratic price trends reveals
three basic price paths falling stable and rising prices The
first class is best illustrated by aluminum a modern metal that
is very abundant Growth rates for aluminum consumption have been
high as new uses have been found and technological advances
combined with economies of scale have lowered prices over most of
the period considered However even the price of aluminum has
begun to rise in recent years The second class is best illusshy
trated by lead and zinc The rate of growth of consumption of
these metals has not been as high as that of aluminum and techshy
nological advances and grade declines which have both been
-23-
modest have almost exactly offset each other in determining lead
and zinc production costs Finally the third class is best
illustrated by tin an ancient metal with slowly increasing or
declining consumption rates Tin ores were not suitable for froth
flotation (as were the ores of many sulfide minerals) and the
decline in the grade of tin ores mined has been both steady and
siz able Copper and silver in recent years also fall into the
third category l5 We should not think of these categories as
three distinct price paths however but perhaps should consider
them to be different phases in the life cycles of the respective
mineral commodities
The model presented here is very simple and naive It
neglects many important aspects of mineral-industry cost and
pricing such as environmental regulations tax policy market
structure and price controls Nevertheless a clear pattern of
mineral-commodity price movements emerges and useful generalizashy
tions about long-run relative price behavior can be made from this
simple model
-24shy
FOOTNOTE S
1 In the 1970s three commissions dealt with this problem--the
National Commission on Materials Policy (1973) the National
Commission on Supplies and Shortages (1976) and the Nonfuelshy
Minerals Policy Review (1979)
2 Real cost is defined as either labor or labor plus capital
inputs per unit of extractive -industry output relative price is
the ratio of a natural-resource-commodity price index to an overshy
all price index
3 The emphasis here is on metal not ore and metal price is a
better indicator of metal scarcity than is ore value Price is
preferred to unit cost because it reflects user cost (scarcity
rent) as well as extraction and processing cost
4 The words metal and ore are used to distinguish the
resource in the ground from the extracted and processed resource
Ore could be crude petroleum of which there are different
grades
5 If there is a zero demand point (choke point) then even when
marginal extraction cost is zero A is bounded (because A = P - CQ)
In this case there will always be a k sufficiently large in
magnitude so that P will be negative
-25shy
FOOTNOTES (continued)
6 h(g) will always increase with time (since h = hg 0) and
k(t) will never increase In contrast the behavior of is more
complicated (see Hanson 1980 for example)
7 Smith (1 978) experimented with a Box-Cox (1964) transformation
of the dependent variable (price) The Box-Cox transformation
encompasses a linear-trend model with constant absolute price
changes over time and a log-linear-trend model with constant
rates of price change However with the Box-Cox model the slope
of the time path never changes sign the characteristic feature of
the U-shaped curve Johnson Bell and Bennett (1980 ) looked at
percent changes in unit costs over time They used dummy varishy
ables to distinguish between two periods--pre-1957 and post-1 957
However they gave no theoretical justification for the assumpshy
tion that a change in cost trends might take place in that year
rather than in some other year
8 For some commodities data for the last 2 or 3 years of the
period were not available
9 The classification of metals as major follows Peterson and
Maxwell (1979) Gold was eliminated because its price was linked
to the dollar for most of the period under consideration Its
deflated price is thus proportional to the reciprocal of the
deflating index
-26shy
FOOTNOTES (continued)
10 Prices of most ores are not published and many metals are
produced from several ores making the use of ore prices extremely
complicated
11 If following Manthy weights for each commodity are conshy
structed to be proportional to that commoditys 1967 dollar value
of production natural gas and aluminum would receive weights of
0 8 and 06 respectively and for the first 25 years of the
period more than 14 percent of the mineral-aggregate price index
would be derived from commodities that were not produced at that
time
12 The error terms u and v were added to allow for short-run
fluctuations about the long-run trends For all commodities u
and v were found to be first-order serially correlated However
the plotted trends for those commodities with Pl gt 90 (nickel
silver coal and natural gas) are the ordinary-least-squares
estimates uncorrected for serial correlation not those shown in
the tables With a near-explosive model the correction for
serial correlation results in linear-trend coefficients that seem
intuitively implausible
13 The four aggregate price series are aggregates for the
agricultural forestry and mineral sectors and an aggregate of
the three
-27shy
FOOTNOTES (Continued)
14 It might be argued that for the fuels the upward trend in
prices seen in recent years is principally caused by monopoly
power in the petroleum market (the OPEC effect and that for the
metals it is caused by increased energy costs However the
minimum points on the fitted quadratic curves occur prior to 19 73
(the year of the OPEC price increases) for every commodity
tested
15 An analysis of silver-price trends is complicated by
bimetallism in the nineteenth century and by speculation in recent
years that has artificially inflated silver prices It is nevershy
theless interesting to note that the silver-price path is similar
to that of copper a result to be expected because the majority of
silver is produced as a byproduct of copper production
-28shy
Roy
REFERENCE S C ITED
1 American Metal Market Metal Statistics 1979 Fairchild
New York (1 97 9)
2 HJ Barnett and c Morse Scarcity and Growth Johns
Hopkins Baltimore (1 963)
3 H J Barnett Scarcity and growth revisited in Scarcity and
Growth Reconsidered (V K Smith Ed ) Johns Hopkins
Baltimore (1 979)
4 G P E Box and D R Cox An analysis of transformations
J Statis Soc B 211-252 (1 964)
5 GM Brown Jr and B Field Implications of alternative
measures of natural resource scarcity J Political Econ
86 22 9-243 (1 978)
6 AC Fisher On measures of natural resource scarcity in
Scarcity and Growth Reconsidered (VK Smith Ed ) Johns
Hopkins Baltimore (197 9)
7 D A Hanson Increasing extraction costs and resource prices
Some further evidence Bell J Econ 11 335-342 (198 0)
8 H Hotelling The economics of exhaustible resources J
Political Econ 39 137-175 (1 931)
9 MH Johnson FW Bell and J T Bennett Natural resource
scarcity Empirical evidence and public policy J Environ
Econ Manag 7 256-271 (1980)
1 0 R Manthy Natural Resource Commodities-A Century of
Statistics Johns Hopkins Baltimore (1 978)
-29shy
Mining
REFE RENCE S (continued)
11 National Commission on Materials Policy Material Needs and
the Environment Today and Tomorrow US Government Printing
Office Washington (1973 )
12 National Commision on Supplies and Shortages Government and
the Nations Resources US Government Printing Office
Washington (1976)
13 Nonfuels Minerals Policy Review Draft for Public Review and
Comment Washington (1979)
14 N Potter and FT Christy Jr Trends in Natural Resource
Commodities Statistics of Prices Output Consumption
Foreign Trade and Employment in the US 1870-1973 Johns
Hopkins Baltimore (1962)
15 u Peterson and RS Maxwell Historic mineral production and
price trends Engineering 25-34 (1979)
16 Presidents Materials Policy Commission Resources in
Americas Future Vol II us Government Printing Office
Washington (1952)
17 WD Schulze The optimal use of non-renewable resources
The theory of extraction J Environ Econ Manag 1 53 -73
(1974)
18 SH Schurr Historical Statistics of Minerals in the United
States Resources for the Future Washington (1960)
19 VK Smith Measuring natural resource scarcity Theory and
practice J Environ Econ Manag 150-171 (1978)
-3 0shy
RE FERENCE S (continued)
20 V K Smith Natural resource scarcity A statistical
analysis Rev Econ Statis 61 423-427 (1979)
21 R M Solow The Economics of Resources or the Resources of
Economics Amer Econ Rev 64 1-14 (1974)
22 us Bureau of Mines Mineral Facts and Problems U S
Government Printing Office Washington (1975)
23 U S Bureau of Mines Minerals Yearbook U S Government
Printing Office Washington (1882-1976)
-31shy
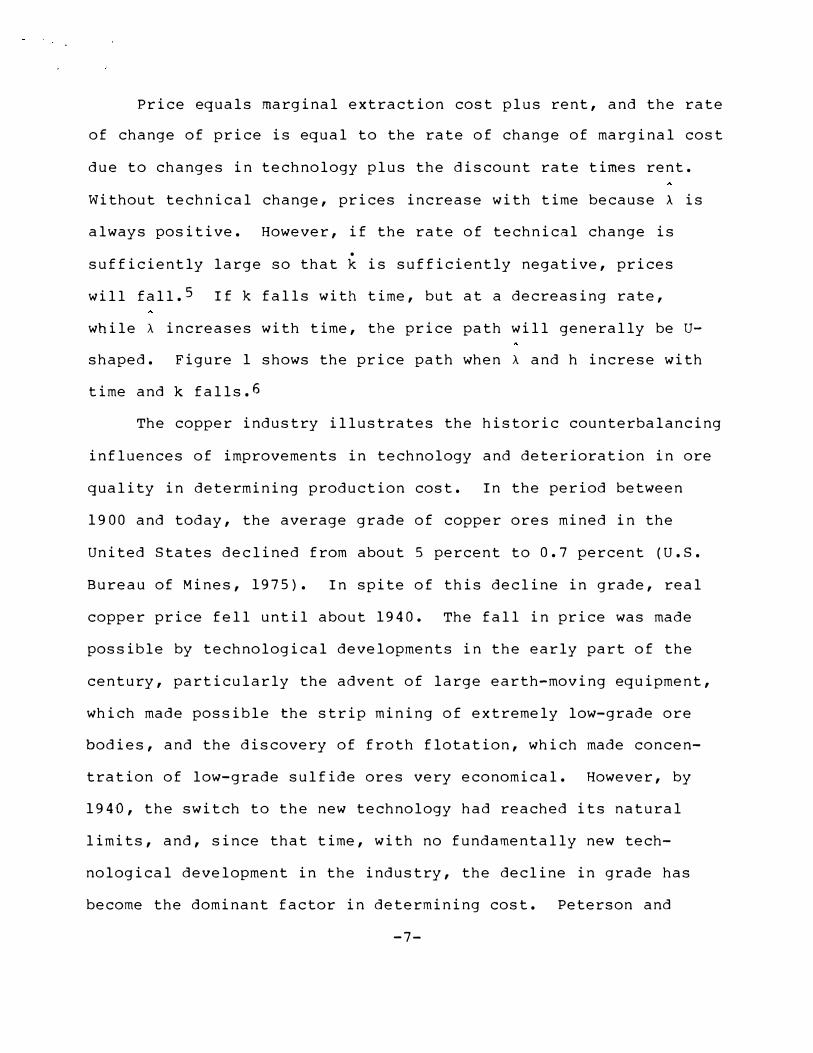
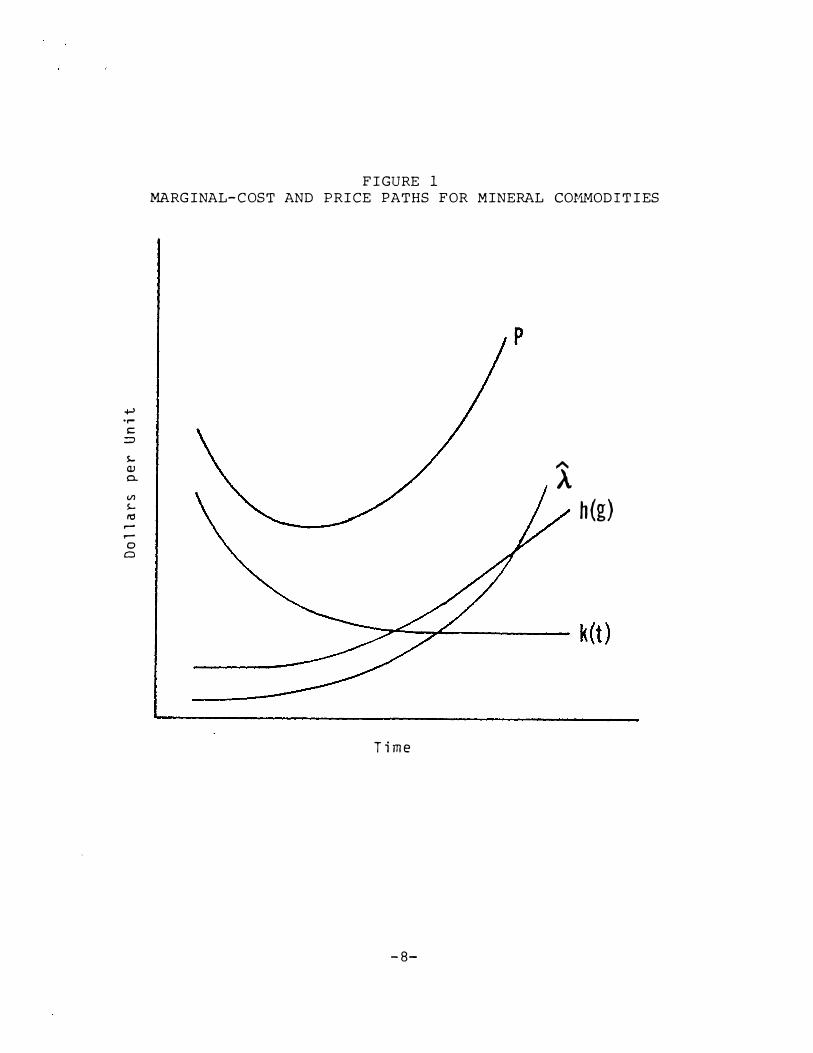
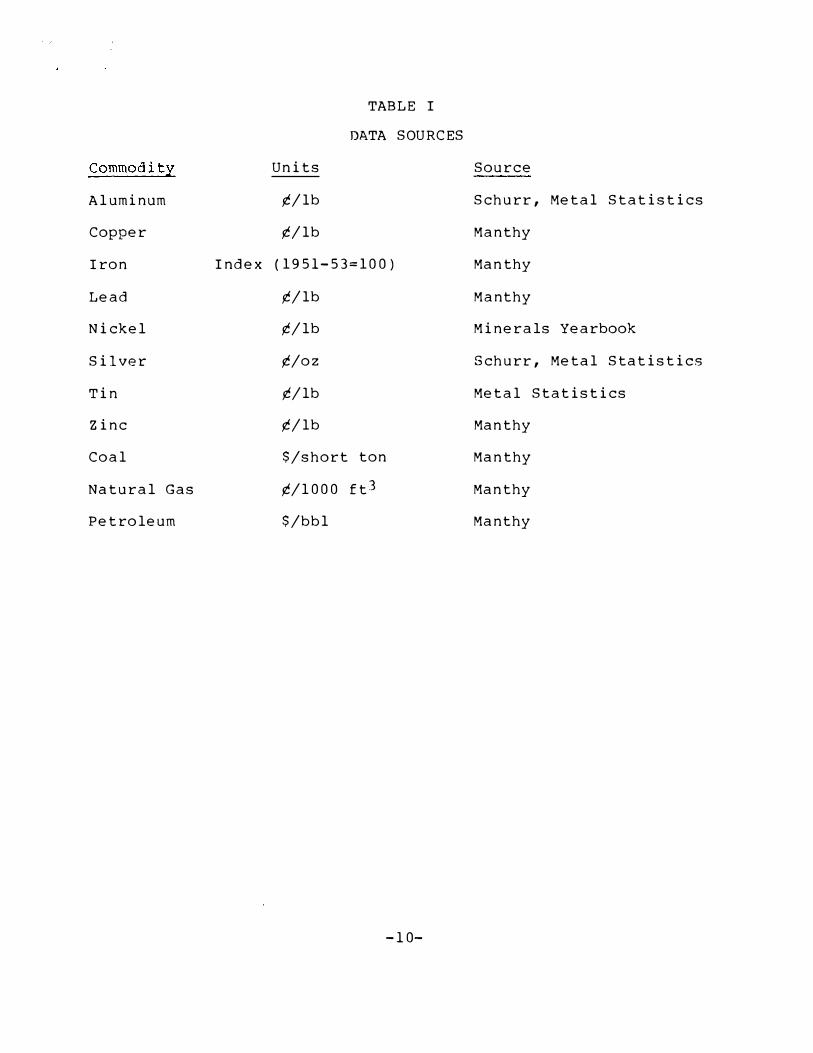
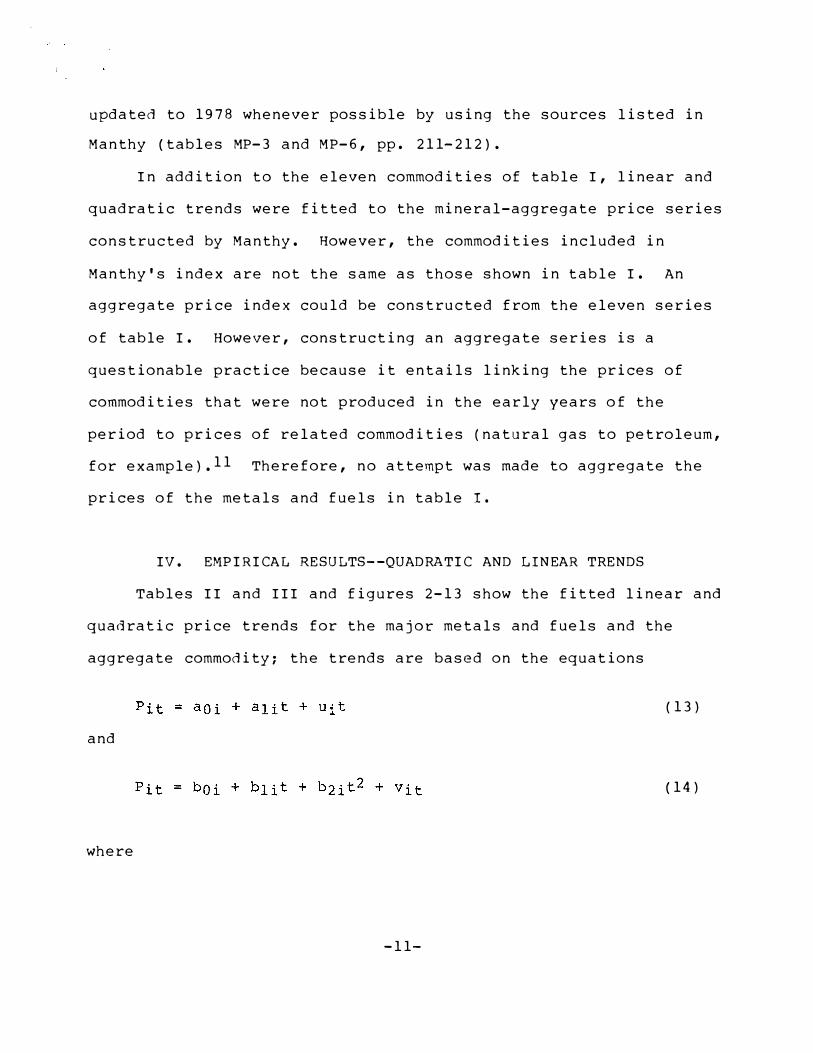
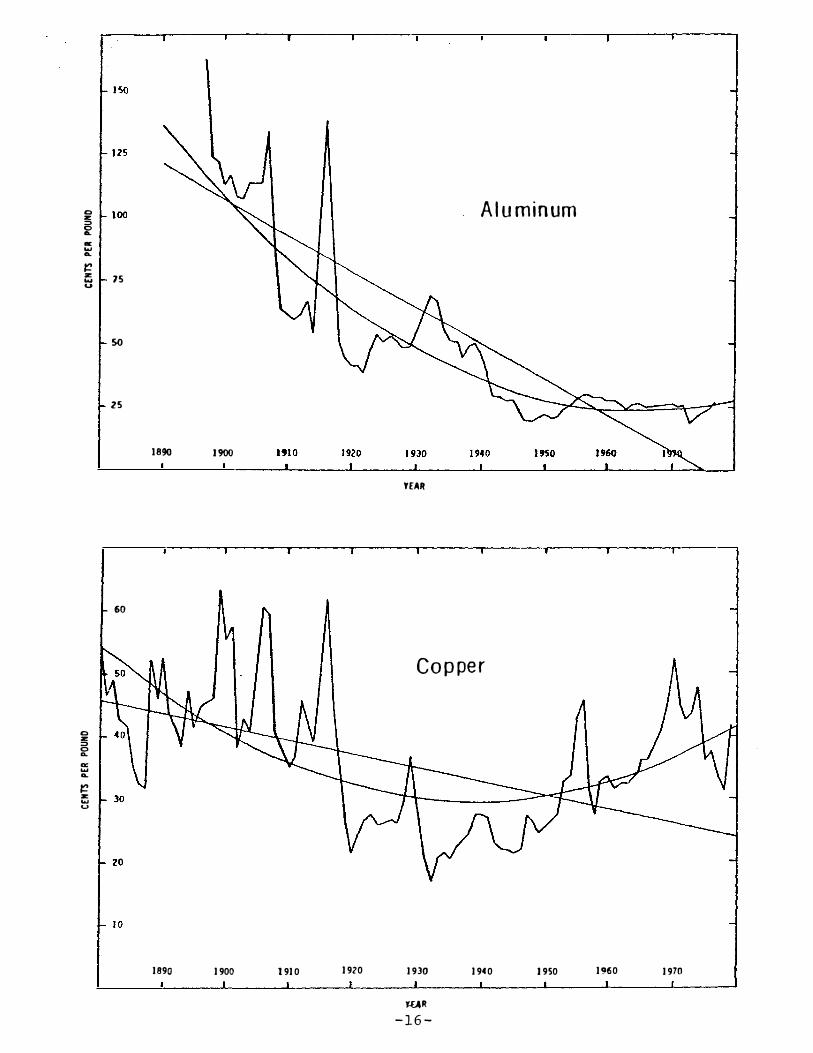
100
c z gtCgt
a 0
z u
75
so
25
1890 1900
Aluminum
YEAR
c z gt cQ
a
z u
60
1890 1900 1910 1920
Copper
1930 1940 1950 1960 1970
JUR
-16-
gtlt 0 a -
)40
80
1890 1900 1910
Iron
1920 1930 ) 0 1950 1960 1970
YEAR
0 a gt00
alt 0
30
5
Lead
1890 1900 1910 1920 1930 1940 1950 )960 1970
TrAR
-1 7 -
120
100
0 z 80gt0CL
wCL
z 60
40
20 Nickel
1890 1 900 1910 1920 19)1) 1940 1950 1960 1970
ffAI
u z gt0
a Q
z w-
Silver
250
zoo
ISO
100
1890 1900 1910 1920 1931 1940 1950 1960 1970
Ypound1=1 8 --
fEAR - 1 9 -
Q
0
ltlC w
200
ITS
ISO
li 125 ltgt
100
Tin
YEAR
a w0
z w u
30
25
1890 1900 1910 1910 1930
Zinc
19(0 1950 1960 1970
z
a
J
8
1890 1900
Coal
1910 1920 1930 1940 1950 1960 1970
TEAR
1-
z
a
1-z
30
25
20
15
10
5
1890 1900
Natural Gas
1910 1920 1930 1940 1950 1960 1970
tAR
-20-
1900
YEAR
_ w IX
CL
ac
8
7
6
5
1890 1910
Petroleum
1920 1930 1940 1950 1960 1970
30
25
189() 1900 1910
Mineral Aggregate
1920 1930 1940 1950 1960 1970
YIIJ
-2 1-
prices of the aggregate commodity show no marked trend either
linear or quadratic Because the minimum point on the price curve
occurs early in the period for some commodities (tin and coal) and
late in the period for others (aluminum) when the commodities are
aggregated the pronounced curvature disappears Therefore
general conclusions about natural-resource scarcity cannot be
drawn from the aggregate index alone
In his analysis of natural -resource commodity price aggregshy
ates Smith (1979) found that for all four aggregate price series
examined l3 the linear-trend coefficient was unstable over time
In particular for the mineral sector the trend coefficient was
initially negative but increased with time until it became zero
If the correct model for price behavior is nonlinear the slope of
a local linear approximation will vary depending on the time
period chosen And if the correct model is u-shaped the trend
coefficient will be initially negative and will increase with
time as found for the mineral sector Therefore Smiths results
are consistent with those reported here
V I I SUMMARY AND CONCLUS ION S
The analysis of long-run relative-price movements of nonshy
renewable natural-resource commodities revealed that with a
linear model estimated trend coefficients were both positive and
negative in sign and were significant at the 90 percent confishy
dence level in only a little over half of the cases examined
-22shy
Therefore no generalization can be made about natural-resource
scarcity from a linear model In contrast with a quadratic
model fitted trends for prices of all the major metals and fuels
showed the predicted convex curvature--initially falling but
eventually rising--and all but one of the estimated coefficients
of the squared terms were statistically significant at the 90
percent confidence level The fitted linear-trend models undershy
estimate relative prices of all the major metals and fuels in
the last few years of the 1870-1978 period because prices of all
commodities have passed the minimum points on their fitted
U-shaped curves and have begun to increase Therefore if
scarcity is measured by relative prices the evidence indicates
that nonrenewable natural-resource commodities are becoming
scarce l4
An examination of the fitted quadratic price trends reveals
three basic price paths falling stable and rising prices The
first class is best illustrated by aluminum a modern metal that
is very abundant Growth rates for aluminum consumption have been
high as new uses have been found and technological advances
combined with economies of scale have lowered prices over most of
the period considered However even the price of aluminum has
begun to rise in recent years The second class is best illusshy
trated by lead and zinc The rate of growth of consumption of
these metals has not been as high as that of aluminum and techshy
nological advances and grade declines which have both been
-23-
modest have almost exactly offset each other in determining lead
and zinc production costs Finally the third class is best
illustrated by tin an ancient metal with slowly increasing or
declining consumption rates Tin ores were not suitable for froth
flotation (as were the ores of many sulfide minerals) and the
decline in the grade of tin ores mined has been both steady and
siz able Copper and silver in recent years also fall into the
third category l5 We should not think of these categories as
three distinct price paths however but perhaps should consider
them to be different phases in the life cycles of the respective
mineral commodities
The model presented here is very simple and naive It
neglects many important aspects of mineral-industry cost and
pricing such as environmental regulations tax policy market
structure and price controls Nevertheless a clear pattern of
mineral-commodity price movements emerges and useful generalizashy
tions about long-run relative price behavior can be made from this
simple model
-24shy
FOOTNOTE S
1 In the 1970s three commissions dealt with this problem--the
National Commission on Materials Policy (1973) the National
Commission on Supplies and Shortages (1976) and the Nonfuelshy
Minerals Policy Review (1979)
2 Real cost is defined as either labor or labor plus capital
inputs per unit of extractive -industry output relative price is
the ratio of a natural-resource-commodity price index to an overshy
all price index
3 The emphasis here is on metal not ore and metal price is a
better indicator of metal scarcity than is ore value Price is
preferred to unit cost because it reflects user cost (scarcity
rent) as well as extraction and processing cost
4 The words metal and ore are used to distinguish the
resource in the ground from the extracted and processed resource
Ore could be crude petroleum of which there are different
grades
5 If there is a zero demand point (choke point) then even when
marginal extraction cost is zero A is bounded (because A = P - CQ)
In this case there will always be a k sufficiently large in
magnitude so that P will be negative
-25shy
FOOTNOTES (continued)
6 h(g) will always increase with time (since h = hg 0) and
k(t) will never increase In contrast the behavior of is more
complicated (see Hanson 1980 for example)
7 Smith (1 978) experimented with a Box-Cox (1964) transformation
of the dependent variable (price) The Box-Cox transformation
encompasses a linear-trend model with constant absolute price
changes over time and a log-linear-trend model with constant
rates of price change However with the Box-Cox model the slope
of the time path never changes sign the characteristic feature of
the U-shaped curve Johnson Bell and Bennett (1980 ) looked at
percent changes in unit costs over time They used dummy varishy
ables to distinguish between two periods--pre-1957 and post-1 957
However they gave no theoretical justification for the assumpshy
tion that a change in cost trends might take place in that year
rather than in some other year
8 For some commodities data for the last 2 or 3 years of the
period were not available
9 The classification of metals as major follows Peterson and
Maxwell (1979) Gold was eliminated because its price was linked
to the dollar for most of the period under consideration Its
deflated price is thus proportional to the reciprocal of the
deflating index
-26shy
FOOTNOTES (continued)
10 Prices of most ores are not published and many metals are
produced from several ores making the use of ore prices extremely
complicated
11 If following Manthy weights for each commodity are conshy
structed to be proportional to that commoditys 1967 dollar value
of production natural gas and aluminum would receive weights of
0 8 and 06 respectively and for the first 25 years of the
period more than 14 percent of the mineral-aggregate price index
would be derived from commodities that were not produced at that
time
12 The error terms u and v were added to allow for short-run
fluctuations about the long-run trends For all commodities u
and v were found to be first-order serially correlated However
the plotted trends for those commodities with Pl gt 90 (nickel
silver coal and natural gas) are the ordinary-least-squares
estimates uncorrected for serial correlation not those shown in
the tables With a near-explosive model the correction for
serial correlation results in linear-trend coefficients that seem
intuitively implausible
13 The four aggregate price series are aggregates for the
agricultural forestry and mineral sectors and an aggregate of
the three
-27shy
FOOTNOTES (Continued)
14 It might be argued that for the fuels the upward trend in
prices seen in recent years is principally caused by monopoly
power in the petroleum market (the OPEC effect and that for the
metals it is caused by increased energy costs However the
minimum points on the fitted quadratic curves occur prior to 19 73
(the year of the OPEC price increases) for every commodity
tested
15 An analysis of silver-price trends is complicated by
bimetallism in the nineteenth century and by speculation in recent
years that has artificially inflated silver prices It is nevershy
theless interesting to note that the silver-price path is similar
to that of copper a result to be expected because the majority of
silver is produced as a byproduct of copper production
-28shy
Roy
REFERENCE S C ITED
1 American Metal Market Metal Statistics 1979 Fairchild
New York (1 97 9)
2 HJ Barnett and c Morse Scarcity and Growth Johns
Hopkins Baltimore (1 963)
3 H J Barnett Scarcity and growth revisited in Scarcity and
Growth Reconsidered (V K Smith Ed ) Johns Hopkins
Baltimore (1 979)
4 G P E Box and D R Cox An analysis of transformations
J Statis Soc B 211-252 (1 964)
5 GM Brown Jr and B Field Implications of alternative
measures of natural resource scarcity J Political Econ
86 22 9-243 (1 978)
6 AC Fisher On measures of natural resource scarcity in
Scarcity and Growth Reconsidered (VK Smith Ed ) Johns
Hopkins Baltimore (197 9)
7 D A Hanson Increasing extraction costs and resource prices
Some further evidence Bell J Econ 11 335-342 (198 0)
8 H Hotelling The economics of exhaustible resources J
Political Econ 39 137-175 (1 931)
9 MH Johnson FW Bell and J T Bennett Natural resource
scarcity Empirical evidence and public policy J Environ
Econ Manag 7 256-271 (1980)
1 0 R Manthy Natural Resource Commodities-A Century of
Statistics Johns Hopkins Baltimore (1 978)
-29shy
Mining
REFE RENCE S (continued)
11 National Commission on Materials Policy Material Needs and
the Environment Today and Tomorrow US Government Printing
Office Washington (1973 )
12 National Commision on Supplies and Shortages Government and
the Nations Resources US Government Printing Office
Washington (1976)
13 Nonfuels Minerals Policy Review Draft for Public Review and
Comment Washington (1979)
14 N Potter and FT Christy Jr Trends in Natural Resource
Commodities Statistics of Prices Output Consumption
Foreign Trade and Employment in the US 1870-1973 Johns
Hopkins Baltimore (1962)
15 u Peterson and RS Maxwell Historic mineral production and
price trends Engineering 25-34 (1979)
16 Presidents Materials Policy Commission Resources in
Americas Future Vol II us Government Printing Office
Washington (1952)
17 WD Schulze The optimal use of non-renewable resources
The theory of extraction J Environ Econ Manag 1 53 -73
(1974)
18 SH Schurr Historical Statistics of Minerals in the United
States Resources for the Future Washington (1960)
19 VK Smith Measuring natural resource scarcity Theory and
practice J Environ Econ Manag 150-171 (1978)
-3 0shy
RE FERENCE S (continued)
20 V K Smith Natural resource scarcity A statistical
analysis Rev Econ Statis 61 423-427 (1979)
21 R M Solow The Economics of Resources or the Resources of
Economics Amer Econ Rev 64 1-14 (1974)
22 us Bureau of Mines Mineral Facts and Problems U S
Government Printing Office Washington (1975)
23 U S Bureau of Mines Minerals Yearbook U S Government
Printing Office Washington (1882-1976)
-31shy
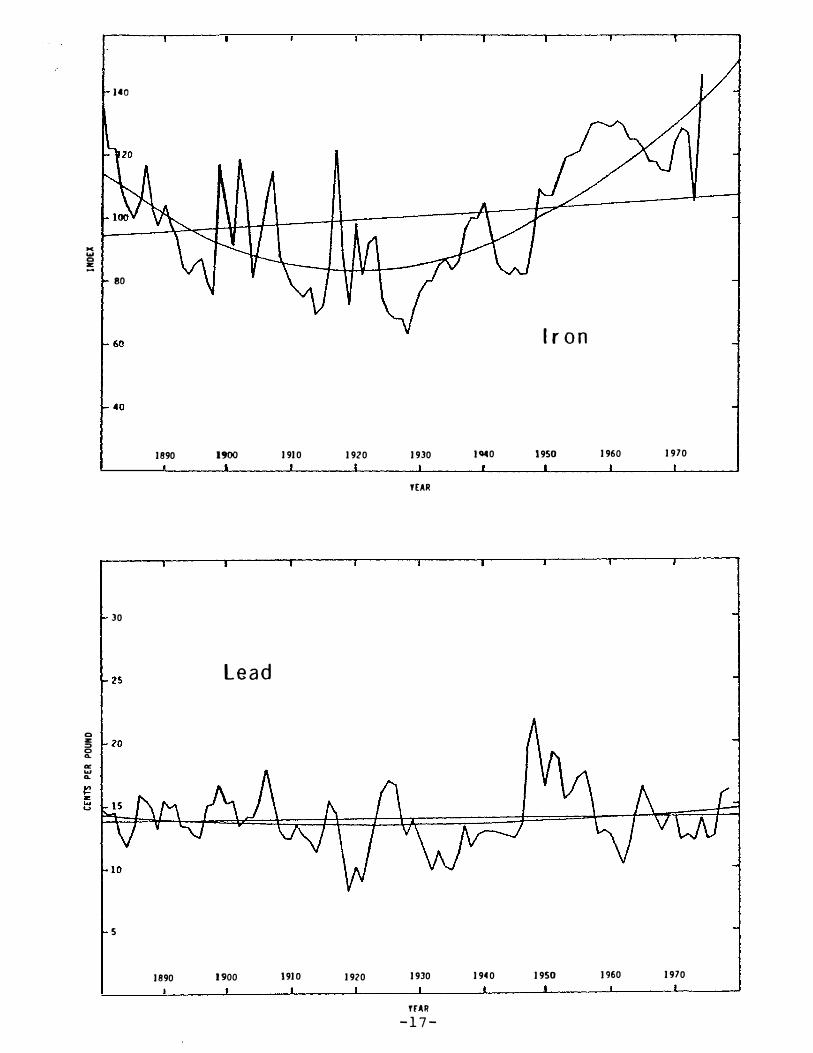
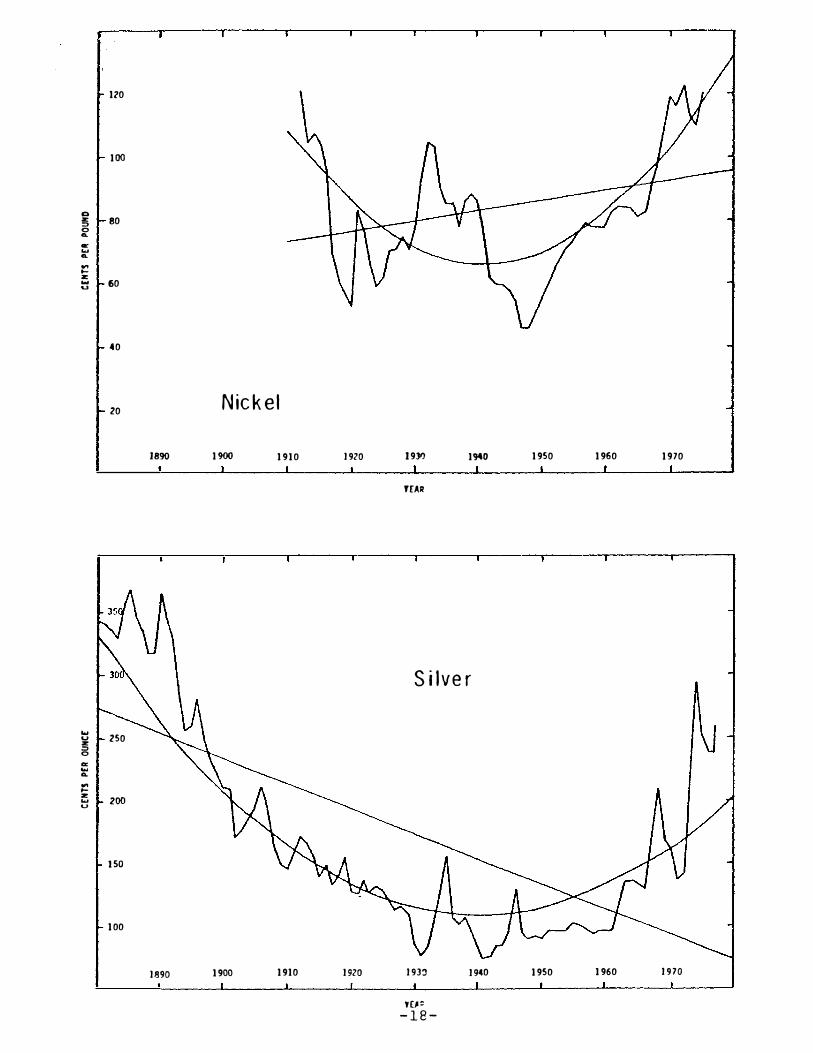
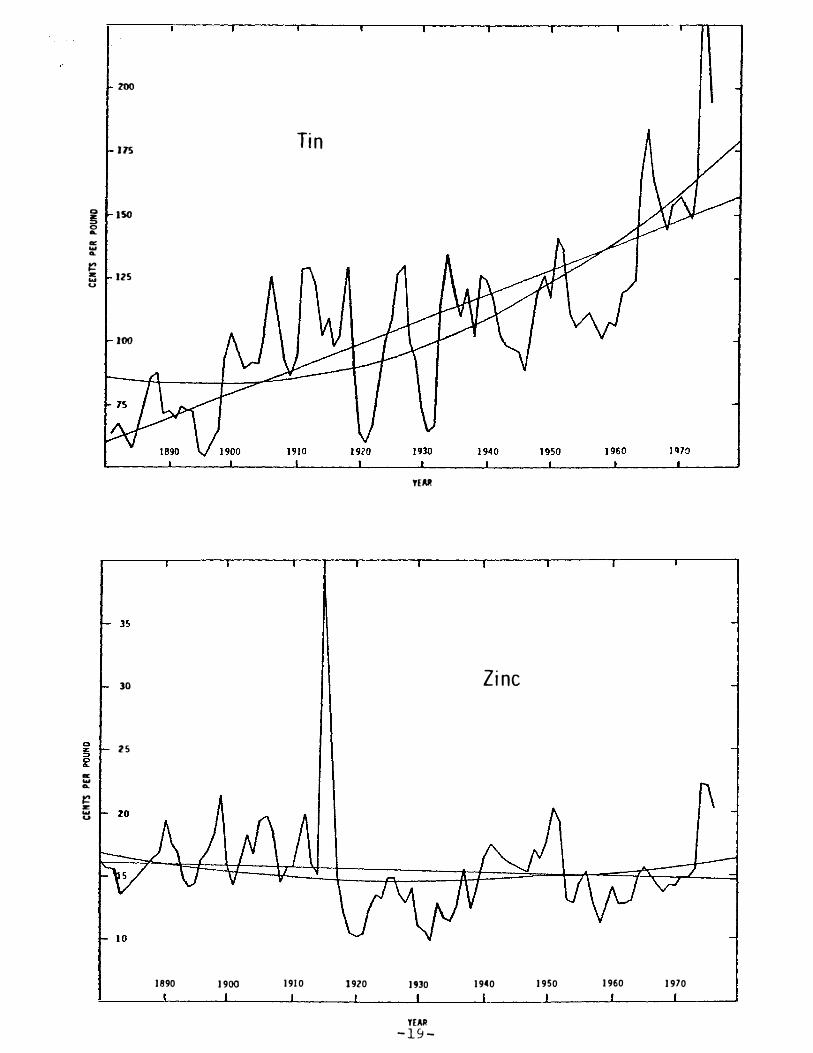
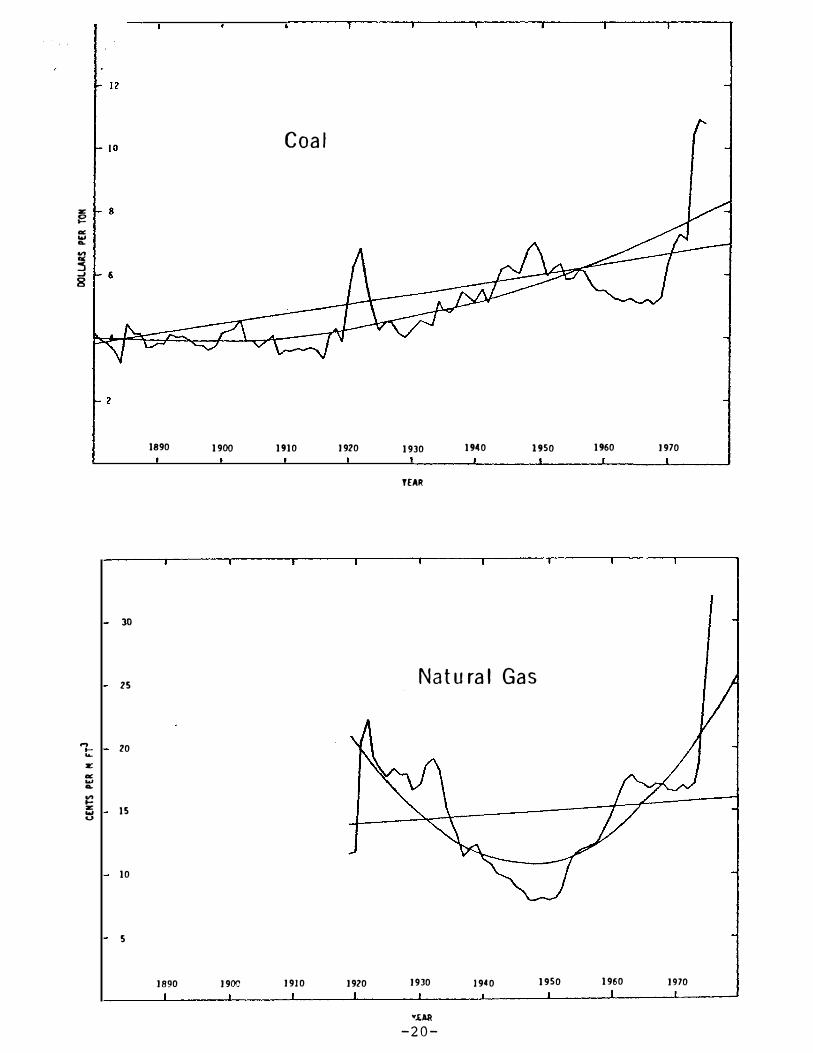
z
a
J
8
1890 1900
Coal
1910 1920 1930 1940 1950 1960 1970
TEAR
1-
z
a
1-z
30
25
20
15
10
5
1890 1900
Natural Gas
1910 1920 1930 1940 1950 1960 1970
tAR
-20-
1900
YEAR
_ w IX
CL
ac
8
7
6
5
1890 1910
Petroleum
1920 1930 1940 1950 1960 1970
30
25
189() 1900 1910
Mineral Aggregate
1920 1930 1940 1950 1960 1970
YIIJ
-2 1-
prices of the aggregate commodity show no marked trend either
linear or quadratic Because the minimum point on the price curve
occurs early in the period for some commodities (tin and coal) and
late in the period for others (aluminum) when the commodities are
aggregated the pronounced curvature disappears Therefore
general conclusions about natural-resource scarcity cannot be
drawn from the aggregate index alone
In his analysis of natural -resource commodity price aggregshy
ates Smith (1979) found that for all four aggregate price series
examined l3 the linear-trend coefficient was unstable over time
In particular for the mineral sector the trend coefficient was
initially negative but increased with time until it became zero
If the correct model for price behavior is nonlinear the slope of
a local linear approximation will vary depending on the time
period chosen And if the correct model is u-shaped the trend
coefficient will be initially negative and will increase with
time as found for the mineral sector Therefore Smiths results
are consistent with those reported here
V I I SUMMARY AND CONCLUS ION S
The analysis of long-run relative-price movements of nonshy
renewable natural-resource commodities revealed that with a
linear model estimated trend coefficients were both positive and
negative in sign and were significant at the 90 percent confishy
dence level in only a little over half of the cases examined
-22shy
Therefore no generalization can be made about natural-resource
scarcity from a linear model In contrast with a quadratic
model fitted trends for prices of all the major metals and fuels
showed the predicted convex curvature--initially falling but
eventually rising--and all but one of the estimated coefficients
of the squared terms were statistically significant at the 90
percent confidence level The fitted linear-trend models undershy
estimate relative prices of all the major metals and fuels in
the last few years of the 1870-1978 period because prices of all
commodities have passed the minimum points on their fitted
U-shaped curves and have begun to increase Therefore if
scarcity is measured by relative prices the evidence indicates
that nonrenewable natural-resource commodities are becoming
scarce l4
An examination of the fitted quadratic price trends reveals
three basic price paths falling stable and rising prices The
first class is best illustrated by aluminum a modern metal that
is very abundant Growth rates for aluminum consumption have been
high as new uses have been found and technological advances
combined with economies of scale have lowered prices over most of
the period considered However even the price of aluminum has
begun to rise in recent years The second class is best illusshy
trated by lead and zinc The rate of growth of consumption of
these metals has not been as high as that of aluminum and techshy
nological advances and grade declines which have both been
-23-
modest have almost exactly offset each other in determining lead
and zinc production costs Finally the third class is best
illustrated by tin an ancient metal with slowly increasing or
declining consumption rates Tin ores were not suitable for froth
flotation (as were the ores of many sulfide minerals) and the
decline in the grade of tin ores mined has been both steady and
siz able Copper and silver in recent years also fall into the
third category l5 We should not think of these categories as
three distinct price paths however but perhaps should consider
them to be different phases in the life cycles of the respective
mineral commodities
The model presented here is very simple and naive It
neglects many important aspects of mineral-industry cost and
pricing such as environmental regulations tax policy market
structure and price controls Nevertheless a clear pattern of
mineral-commodity price movements emerges and useful generalizashy
tions about long-run relative price behavior can be made from this
simple model
-24shy
FOOTNOTE S
1 In the 1970s three commissions dealt with this problem--the
National Commission on Materials Policy (1973) the National
Commission on Supplies and Shortages (1976) and the Nonfuelshy
Minerals Policy Review (1979)
2 Real cost is defined as either labor or labor plus capital
inputs per unit of extractive -industry output relative price is
the ratio of a natural-resource-commodity price index to an overshy
all price index
3 The emphasis here is on metal not ore and metal price is a
better indicator of metal scarcity than is ore value Price is
preferred to unit cost because it reflects user cost (scarcity
rent) as well as extraction and processing cost
4 The words metal and ore are used to distinguish the
resource in the ground from the extracted and processed resource
Ore could be crude petroleum of which there are different
grades
5 If there is a zero demand point (choke point) then even when
marginal extraction cost is zero A is bounded (because A = P - CQ)
In this case there will always be a k sufficiently large in
magnitude so that P will be negative
-25shy
FOOTNOTES (continued)
6 h(g) will always increase with time (since h = hg 0) and
k(t) will never increase In contrast the behavior of is more
complicated (see Hanson 1980 for example)
7 Smith (1 978) experimented with a Box-Cox (1964) transformation
of the dependent variable (price) The Box-Cox transformation
encompasses a linear-trend model with constant absolute price
changes over time and a log-linear-trend model with constant
rates of price change However with the Box-Cox model the slope
of the time path never changes sign the characteristic feature of
the U-shaped curve Johnson Bell and Bennett (1980 ) looked at
percent changes in unit costs over time They used dummy varishy
ables to distinguish between two periods--pre-1957 and post-1 957
However they gave no theoretical justification for the assumpshy
tion that a change in cost trends might take place in that year
rather than in some other year
8 For some commodities data for the last 2 or 3 years of the
period were not available
9 The classification of metals as major follows Peterson and
Maxwell (1979) Gold was eliminated because its price was linked
to the dollar for most of the period under consideration Its
deflated price is thus proportional to the reciprocal of the
deflating index
-26shy
FOOTNOTES (continued)
10 Prices of most ores are not published and many metals are
produced from several ores making the use of ore prices extremely
complicated
11 If following Manthy weights for each commodity are conshy
structed to be proportional to that commoditys 1967 dollar value
of production natural gas and aluminum would receive weights of
0 8 and 06 respectively and for the first 25 years of the
period more than 14 percent of the mineral-aggregate price index
would be derived from commodities that were not produced at that
time
12 The error terms u and v were added to allow for short-run
fluctuations about the long-run trends For all commodities u
and v were found to be first-order serially correlated However
the plotted trends for those commodities with Pl gt 90 (nickel
silver coal and natural gas) are the ordinary-least-squares
estimates uncorrected for serial correlation not those shown in
the tables With a near-explosive model the correction for
serial correlation results in linear-trend coefficients that seem
intuitively implausible
13 The four aggregate price series are aggregates for the
agricultural forestry and mineral sectors and an aggregate of
the three
-27shy
FOOTNOTES (Continued)
14 It might be argued that for the fuels the upward trend in
prices seen in recent years is principally caused by monopoly
power in the petroleum market (the OPEC effect and that for the
metals it is caused by increased energy costs However the
minimum points on the fitted quadratic curves occur prior to 19 73
(the year of the OPEC price increases) for every commodity
tested
15 An analysis of silver-price trends is complicated by
bimetallism in the nineteenth century and by speculation in recent
years that has artificially inflated silver prices It is nevershy
theless interesting to note that the silver-price path is similar
to that of copper a result to be expected because the majority of
silver is produced as a byproduct of copper production
-28shy
Roy
REFERENCE S C ITED
1 American Metal Market Metal Statistics 1979 Fairchild
New York (1 97 9)
2 HJ Barnett and c Morse Scarcity and Growth Johns
Hopkins Baltimore (1 963)
3 H J Barnett Scarcity and growth revisited in Scarcity and
Growth Reconsidered (V K Smith Ed ) Johns Hopkins
Baltimore (1 979)
4 G P E Box and D R Cox An analysis of transformations
J Statis Soc B 211-252 (1 964)
5 GM Brown Jr and B Field Implications of alternative
measures of natural resource scarcity J Political Econ
86 22 9-243 (1 978)
6 AC Fisher On measures of natural resource scarcity in
Scarcity and Growth Reconsidered (VK Smith Ed ) Johns
Hopkins Baltimore (197 9)
7 D A Hanson Increasing extraction costs and resource prices
Some further evidence Bell J Econ 11 335-342 (198 0)
8 H Hotelling The economics of exhaustible resources J
Political Econ 39 137-175 (1 931)
9 MH Johnson FW Bell and J T Bennett Natural resource
scarcity Empirical evidence and public policy J Environ
Econ Manag 7 256-271 (1980)
1 0 R Manthy Natural Resource Commodities-A Century of
Statistics Johns Hopkins Baltimore (1 978)
-29shy
Mining
REFE RENCE S (continued)
11 National Commission on Materials Policy Material Needs and
the Environment Today and Tomorrow US Government Printing
Office Washington (1973 )
12 National Commision on Supplies and Shortages Government and
the Nations Resources US Government Printing Office
Washington (1976)
13 Nonfuels Minerals Policy Review Draft for Public Review and
Comment Washington (1979)
14 N Potter and FT Christy Jr Trends in Natural Resource
Commodities Statistics of Prices Output Consumption
Foreign Trade and Employment in the US 1870-1973 Johns
Hopkins Baltimore (1962)
15 u Peterson and RS Maxwell Historic mineral production and
price trends Engineering 25-34 (1979)
16 Presidents Materials Policy Commission Resources in
Americas Future Vol II us Government Printing Office
Washington (1952)
17 WD Schulze The optimal use of non-renewable resources
The theory of extraction J Environ Econ Manag 1 53 -73
(1974)
18 SH Schurr Historical Statistics of Minerals in the United
States Resources for the Future Washington (1960)
19 VK Smith Measuring natural resource scarcity Theory and
practice J Environ Econ Manag 150-171 (1978)
-3 0shy
RE FERENCE S (continued)
20 V K Smith Natural resource scarcity A statistical
analysis Rev Econ Statis 61 423-427 (1979)
21 R M Solow The Economics of Resources or the Resources of
Economics Amer Econ Rev 64 1-14 (1974)
22 us Bureau of Mines Mineral Facts and Problems U S
Government Printing Office Washington (1975)
23 U S Bureau of Mines Minerals Yearbook U S Government
Printing Office Washington (1882-1976)
-31shy
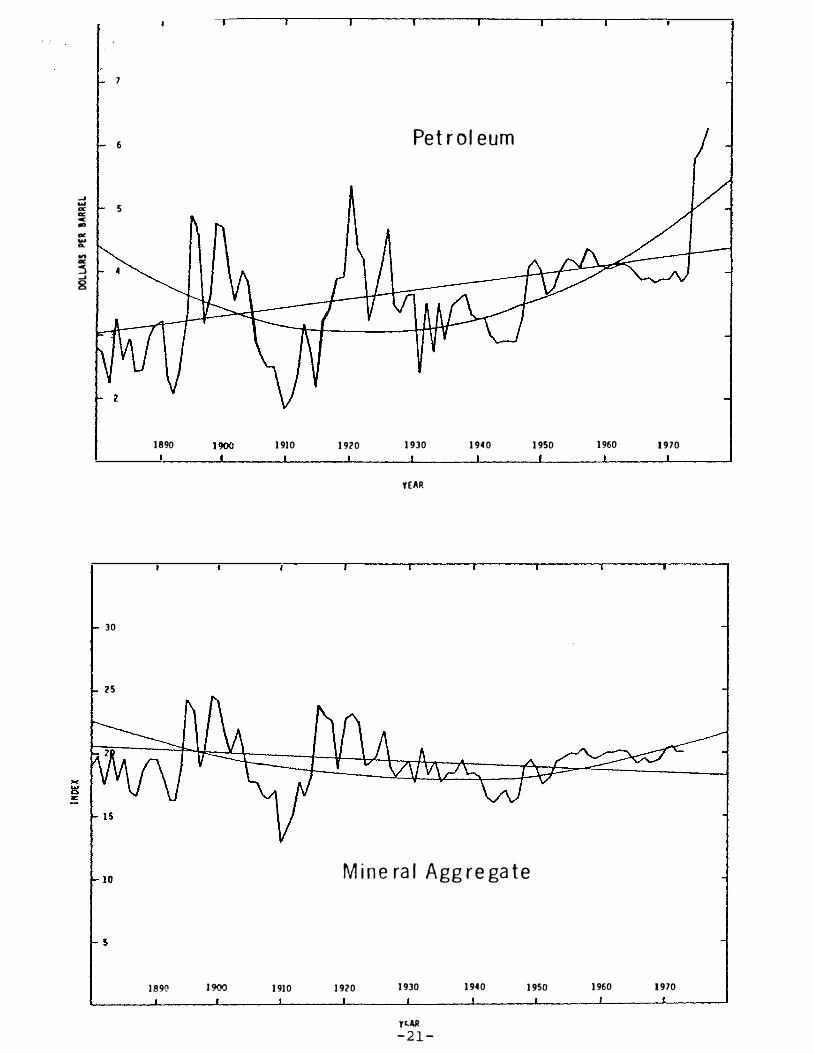
FOOTNOTES (continued)
10 Prices of most ores are not published and many metals are
produced from several ores making the use of ore prices extremely
complicated
11 If following Manthy weights for each commodity are conshy
structed to be proportional to that commoditys 1967 dollar value
of production natural gas and aluminum would receive weights of
0 8 and 06 respectively and for the first 25 years of the
period more than 14 percent of the mineral-aggregate price index
would be derived from commodities that were not produced at that
time
12 The error terms u and v were added to allow for short-run
fluctuations about the long-run trends For all commodities u
and v were found to be first-order serially correlated However
the plotted trends for those commodities with Pl gt 90 (nickel
silver coal and natural gas) are the ordinary-least-squares
estimates uncorrected for serial correlation not those shown in
the tables With a near-explosive model the correction for
serial correlation results in linear-trend coefficients that seem
intuitively implausible
13 The four aggregate price series are aggregates for the
agricultural forestry and mineral sectors and an aggregate of
the three
-27shy
FOOTNOTES (Continued)
14 It might be argued that for the fuels the upward trend in
prices seen in recent years is principally caused by monopoly
power in the petroleum market (the OPEC effect and that for the
metals it is caused by increased energy costs However the
minimum points on the fitted quadratic curves occur prior to 19 73
(the year of the OPEC price increases) for every commodity
tested
15 An analysis of silver-price trends is complicated by
bimetallism in the nineteenth century and by speculation in recent
years that has artificially inflated silver prices It is nevershy
theless interesting to note that the silver-price path is similar
to that of copper a result to be expected because the majority of
silver is produced as a byproduct of copper production
-28shy
Roy
REFERENCE S C ITED
1 American Metal Market Metal Statistics 1979 Fairchild
New York (1 97 9)
2 HJ Barnett and c Morse Scarcity and Growth Johns
Hopkins Baltimore (1 963)
3 H J Barnett Scarcity and growth revisited in Scarcity and
Growth Reconsidered (V K Smith Ed ) Johns Hopkins
Baltimore (1 979)
4 G P E Box and D R Cox An analysis of transformations
J Statis Soc B 211-252 (1 964)
5 GM Brown Jr and B Field Implications of alternative
measures of natural resource scarcity J Political Econ
86 22 9-243 (1 978)
6 AC Fisher On measures of natural resource scarcity in
Scarcity and Growth Reconsidered (VK Smith Ed ) Johns
Hopkins Baltimore (197 9)
7 D A Hanson Increasing extraction costs and resource prices
Some further evidence Bell J Econ 11 335-342 (198 0)
8 H Hotelling The economics of exhaustible resources J
Political Econ 39 137-175 (1 931)
9 MH Johnson FW Bell and J T Bennett Natural resource
scarcity Empirical evidence and public policy J Environ
Econ Manag 7 256-271 (1980)
1 0 R Manthy Natural Resource Commodities-A Century of
Statistics Johns Hopkins Baltimore (1 978)
-29shy
Mining
REFE RENCE S (continued)
11 National Commission on Materials Policy Material Needs and
the Environment Today and Tomorrow US Government Printing
Office Washington (1973 )
12 National Commision on Supplies and Shortages Government and
the Nations Resources US Government Printing Office
Washington (1976)
13 Nonfuels Minerals Policy Review Draft for Public Review and
Comment Washington (1979)
14 N Potter and FT Christy Jr Trends in Natural Resource
Commodities Statistics of Prices Output Consumption
Foreign Trade and Employment in the US 1870-1973 Johns
Hopkins Baltimore (1962)
15 u Peterson and RS Maxwell Historic mineral production and
price trends Engineering 25-34 (1979)
16 Presidents Materials Policy Commission Resources in
Americas Future Vol II us Government Printing Office
Washington (1952)
17 WD Schulze The optimal use of non-renewable resources
The theory of extraction J Environ Econ Manag 1 53 -73
(1974)
18 SH Schurr Historical Statistics of Minerals in the United
States Resources for the Future Washington (1960)
19 VK Smith Measuring natural resource scarcity Theory and
practice J Environ Econ Manag 150-171 (1978)
-3 0shy
RE FERENCE S (continued)
20 V K Smith Natural resource scarcity A statistical
analysis Rev Econ Statis 61 423-427 (1979)
21 R M Solow The Economics of Resources or the Resources of
Economics Amer Econ Rev 64 1-14 (1974)
22 us Bureau of Mines Mineral Facts and Problems U S
Government Printing Office Washington (1975)
23 U S Bureau of Mines Minerals Yearbook U S Government
Printing Office Washington (1882-1976)
-31shy

![Nonrenewable energy[1]](https://static.fdocuments.us/doc/165x107/558c1703d8b42aab558b4626/nonrenewable-energy1.jpg)