Trends in Migration to and from Scotland: an Analysis Can migration keep Scotland’s population...
24
Trends in Migration to and Trends in Migration to and from Scotland: an Analysis from Scotland: an Analysis Can migration keep Scotland’s Can migration keep Scotland’s population above 5 million? population above 5 million? Phil Rees, Daniel Vickers and Phil Rees, Daniel Vickers and Jianhui Jin Jianhui Jin Paper presented at the Third Paper presented at the Third International Population International Population Geographies Conference, 19-21 Geographies Conference, 19-21 June 2006, University of June 2006, University of Liverpool Liverpool
-
date post
21-Dec-2015 -
Category
Documents
-
view
215 -
download
0
Transcript of Trends in Migration to and from Scotland: an Analysis Can migration keep Scotland’s population...

Trends in Migration to and Trends in Migration to and from Scotland: an Analysisfrom Scotland: an Analysis
Can migration keep Scotland’s Can migration keep Scotland’s population above 5 million?population above 5 million?
Phil Rees, Daniel Vickers and Phil Rees, Daniel Vickers and Jianhui JinJianhui Jin
Paper presented at the Third Paper presented at the Third International Population International Population
Geographies Conference, 19-21 Geographies Conference, 19-21 June 2006, University of LiverpoolJune 2006, University of Liverpool

Context and AimsContext and Aims• Part of a project on Part of a project on Describing and Explaining Describing and Explaining
Migration Flows to and from Scotland Migration Flows to and from Scotland for Scottish for Scottish Enterprise (independent agency part of the Scottish Enterprise (independent agency part of the Scottish Executive)Executive), , July 2004 to April 2005 July 2004 to April 2005
• Team: Team: – St. Andrews: Robin Flowerdew, Paul Boyle, Zhiqiang Feng St. Andrews: Robin Flowerdew, Paul Boyle, Zhiqiang Feng
(SIM of 2001 Census migration; individual level analysis using (SIM of 2001 Census migration; individual level analysis using SARs and LFS)SARs and LFS)
– Leeds: Phil Rees, Dan Vickers, Jianhui Jin (time series Leeds: Phil Rees, Dan Vickers, Jianhui Jin (time series analysis)analysis)
– Newcastle: Tony Champion (2001 census migration patterns)Newcastle: Tony Champion (2001 census migration patterns)– Warwick: Anne Green, David Owen (policy comments)Warwick: Anne Green, David Owen (policy comments)
• Aims:Aims:– Reporting on recent migration trends to and from ScotlandReporting on recent migration trends to and from Scotland– Modelling migration to and from Scotland with respect to Modelling migration to and from Scotland with respect to
other factorsother factors– Suggesting policy implications of our findings for ScotlandSuggesting policy implications of our findings for Scotland

Scotland’s population stays above Scotland’s population stays above 5 millions until 2031 in new 5 millions until 2031 in new
projectionsprojections• A new 2004-based projection for the UK published on the 20A new 2004-based projection for the UK published on the 20thth October 2005 October 2005
by the Government Actuary’s Department forecasts higher populations for by the Government Actuary’s Department forecasts higher populations for Scotland than 2003 based projections (see Table below)Scotland than 2003 based projections (see Table below)
• The increase based on higher immigration: The increase based on higher immigration: net migration inflow to UK of +255,000 in 2004-05 (+21,000 in Scotland), reducing to a long-term assumption of +145,000 each year from 2007-08 onwards (+4,000 in Scotland). This compares with an assumed net inflow of +130,000 a year in the previous 2003-based projections. Higher migration based in part of flows from A8 countries and in part on new assumptions about higher labour demand in future, resulting from the retirement of the baby boomers now in the later working ages
Projected population Projected population
(1000s)(1000s)
20112011 20162016 20212021
2003 based2003 based 50345034 50005000 49634963
2004 based2004 based 51205120 51265126 51275127
Scotland's Population 1976-2074
0
1,000
2,000
3,000
4,000
5,000
6,000
1960 1980 2000 2020 2040 2060 2080
Year
Po
p in
100
0s
Series1
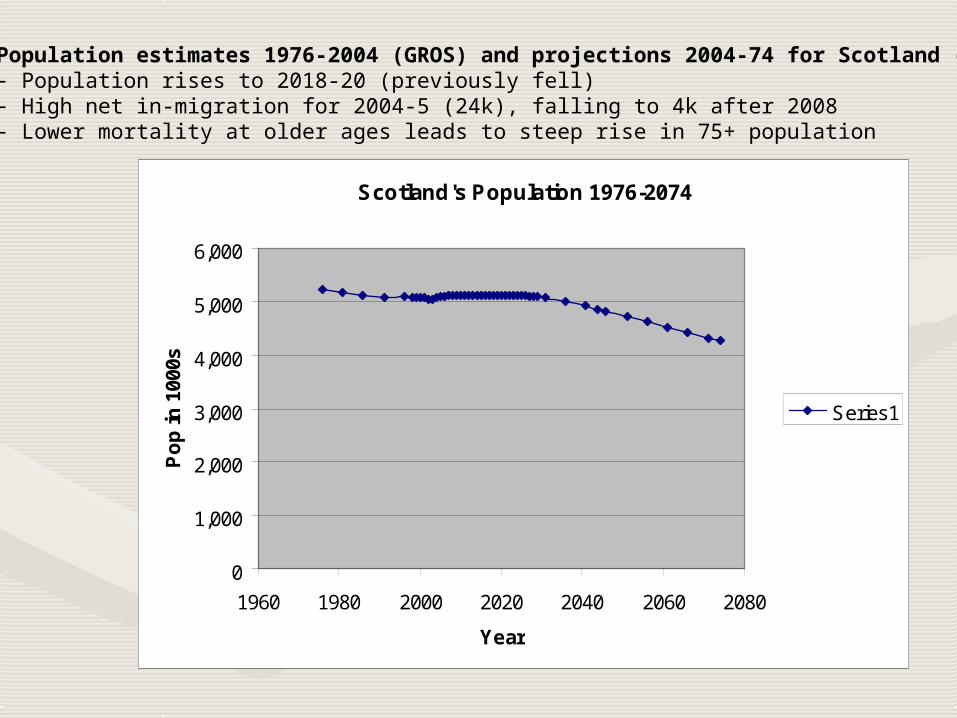
Population estimates 1976-2004 (GROS) and projections 2004-74 for Scotland (GAD)- Population rises to 2018-20 (previously fell)- High net in-migration for 2004-5 (24k), falling to 4k after 2008- Lower mortality at older ages leads to steep rise in 75+ population

Information on Information on migration trendsmigration trends
• Good data series from NHSCR run by GROS Good data series from NHSCR run by GROS on migration flows into and out of Scotland on migration flows into and out of Scotland and its 15 Health Board Areas and its 15 Health Board Areas
• International migration data are available in International migration data are available in the National Statistics Total International the National Statistics Total International Migration series based on the International Migration series based on the International Passenger Survey (ONS), Asylum Seeker Passenger Survey (ONS), Asylum Seeker and Visitor Switcher Statistics (HO), Labour and Visitor Switcher Statistics (HO), Labour Force Survey (ONS, CSO Dublin) but they Force Survey (ONS, CSO Dublin) but they are not regarded as very reliableare not regarded as very reliable

Figure 1.2 Natural change and net migration, 1951-2003
-50
-40
-30
-20
-10
0
10
20
30
40
50Persons ('000s)
Natural Change (births-deaths) Net Migration
Trends in last 50 years
(1) 1950-88: shrinking natural increase and large net migration losses
(2) 1988-90: shift to new regime
(3) 1990-96: fluctuating but rough migration balance and low natural change
(4) 1996-2003: fluctuating migration with natural decrease

Balance, All ages
-20.0
-15.0
-10.0
-5.0
0.0
5.0
10.0
1992 1993 1994 1995 1996 1997 1998 1999 2000 2001 2002
Year
All ages
Scotland’s international migration balance, 1992-2002
2004 based projection total net migration (1000s) assumptions:
2004-5 +21.0
2005-6 +13.5
2006-7 +8.5
2007-8 +4.0
Onwards +4.0
Recent trends in international and total migration have been volatile for Scotland

Scotland: internal migration rates for all ages, persons, 1988-2003
-4.0
-2.0
0.0
2.0
4.0
6.0
8.0
10.0
12.0
14.0
16.0
1988-89
1989-90
1990-91
1991-92
1992-93
1993-94
1994-95
1995-96
1996-97
1997-98
1998-99
1999-00
2000-01
2001-02
2002-03
year
Mig
rati
on
ra
te p
er
10
00
IN-MIGRATION RATES
OUT-MIGRATION RATES
NET MIGRATION RATES
Migration balances between Scotland and the Rest of the UK have swung between negative and positive several times since 1990:1989-1993 net inflow, 1995-7, 1998-2000 net outflow, 2000-03 net inflow

Internal migration to/from Scotland Internal migration to/from Scotland The net inflows have continued in the period 2003-2005 The net inflows have continued in the period 2003-2005
Source: Population Trends 123, Table 8.1)Source: Population Trends 123, Table 8.1)
YearYear Inflow (1000s)Inflow (1000s) Outflow Outflow (1000s)(1000s)
Balance Balance (1000s)(1000s)
20002000 48.848.8 53.353.3 -4.5-4.5
20012001 56.556.5 50.450.4 +6.1+6.1
20022002 52.752.7 48.448.4 +4.3+4.3
20032003 59.859.8 46.446.4 +13.4+13.4
20042004 56.856.8 45.145.1 +11.7+11.7
2005 2005 (est.)(est.)
55.955.9 44.744.7 +11.2+11.2
Trends in internal migration by life course stageTrends in internal migration by life course stage
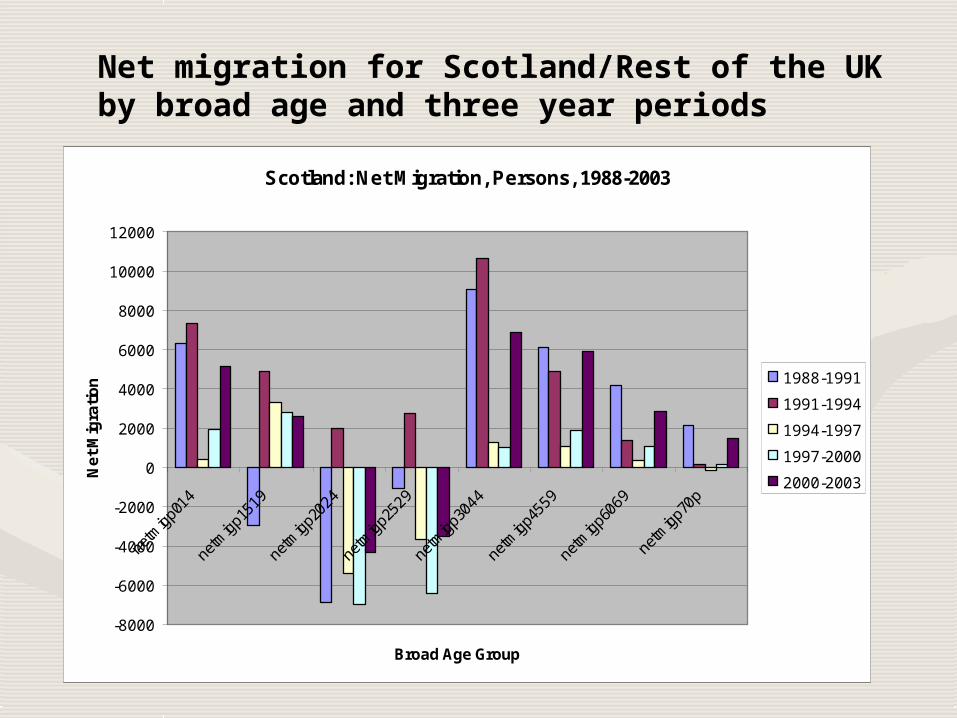
• Since 1990, migration between Scotland and the Rest of Since 1990, migration between Scotland and the Rest of the UK has been in positive balance for the family ages (the UK has been in positive balance for the family ages (0-0-14, 30-4414, 30-44), the later working ages (), the later working ages (45-5945-59) and the ) and the retirement ages (retirement ages (60-69, 70+60-69, 70+) )
• The migration balance for The migration balance for 15-1915-19 year olds has been year olds has been positive though not as high since 1998-99 as before. positive though not as high since 1998-99 as before. Scotland is attractive to students entering Higher Scotland is attractive to students entering Higher Education from elsewhere in the UK.Education from elsewhere in the UK.
• Where Scotland has lost migrants is in the Where Scotland has lost migrants is in the 20-2420-24 and and 25-25-2929 age groups from 1994-95 onwards, following a short age groups from 1994-95 onwards, following a short period, 1989-90 to 1993-94, of gains. Migrants at these period, 1989-90 to 1993-94, of gains. Migrants at these ages are most sensitive to the flux of job opportunities in ages are most sensitive to the flux of job opportunities in different regions: the earlier period saw jobs in short different regions: the earlier period saw jobs in short supply in SE England, whereas the later period saw a supply in SE England, whereas the later period saw a revival in job opportunities. revival in job opportunities.
• The graphs that follow provide the evidence for these The graphs that follow provide the evidence for these findings.findings.
Scotland: Net Migration, Persons, 1988-2003
-8000
-6000
-4000
-2000
0
2000
4000
6000
8000
10000
12000
Broad Age Group
Ne
t M
igra
tio
n 1988-1991
1991-1994
1994-1997
1997-2000
2000-2003
Net migration for Scotland/Rest of the UK by broad age and three year periods

Scotland: Net Migration Rates, Persons, 1988-2003
-10.0
-8.0
-6.0
-4.0
-2.0
0.0
2.0
4.0
6.0
1988-1991 1991-1994 1994-1997 1997-2000 2000-2003
Period
Ne
t m
igra
tio
n r
ate
(/1
00
0) netmigp014rate
netmigp1519rate
netmigp2024rate
netmigp2529rate
netmigp3044rate
netmigp4559rate
netmigp6069rate
netmigp70prate

Trends in international Trends in international migration by life course migration by life course
stagestage• International migrants are more concentrated International migrants are more concentrated
in the 15-44 age range than domestic in the 15-44 age range than domestic migrants.migrants.
• In the 15-24 age group, associated with entry In the 15-24 age group, associated with entry to and study in Higher Education, Scotland to and study in Higher Education, Scotland has usually gained migrants.has usually gained migrants.
• In the age group, 25-44, Scotland has In the age group, 25-44, Scotland has generally lost migrants on balance and also at generally lost migrants on balance and also at other ages.other ages.
• The patterns have been volatile reflecting The patterns have been volatile reflecting both measurement problems and periodic both measurement problems and periodic immigration waves.immigration waves.

Migration trends by region Migration trends by region within Scotlandwithin Scotland
• The graph and maps that follow show the The graph and maps that follow show the variation across Scotland for Health Board variation across Scotland for Health Board Areas for five three year periods.Areas for five three year periods.
• The biggest gainers are Lothian, Highland, The biggest gainers are Lothian, Highland, Grampian and Tayside. In the latter two Grampian and Tayside. In the latter two regions gains reduce sharply over the period, regions gains reduce sharply over the period, reflecting lower labour demand in the reflecting lower labour demand in the offshore oil and gas industry.offshore oil and gas industry.
• The biggest losers are Greater Glasgow, The biggest losers are Greater Glasgow, Argyll and Clyde, Ayrshire and Arran and Argyll and Clyde, Ayrshire and Arran and Lanarkshire, where industrial restructuring Lanarkshire, where industrial restructuring continues.continues.

Net migration from/to RUK, 1988-2003
-6,000
-4,000
-2,000
0
2,000
4,000
6,000
8,000
10,000
Health Board Areas
Net
mig
rati
on
1988-91
1991-94
1994-97
1997-00
2000-03

Net migration (all), 1988-2003
-20000
-15000
-10000
-5000
0
5000
10000
15000
20000
Health Board Areas
Ne
t m
igra
tio
n 1988-1991
1991-1994
1994-1997
1997-2000
2000-2003

1997-1998 1998-1999 1999-2000
2000-2001
2001-2002
2002-2003
Internal migration balance (to/from Rest of UK) for the Heath Board Areas of Scotland, 1997-98 to 2002-03, mid-year to mid-year
Internal migration balance (to/from Rest of UK for the Health Board Areas of Scotland, 1997-2003
Red = migration gains
Blue = migration losses
Intensity = size of net flow
Argyll & Clyde
Greater Glasgow
Lanarkshire
Lothian
Grampian
Highland
Tayside

Clusters of regions with similar Clusters of regions with similar migration behaviourmigration behaviour
• We also summarised the trends across three We also summarised the trends across three dimensions of region, age and time by recognizing dimensions of region, age and time by recognizing three clusters of regions with similar behaviour and three clusters of regions with similar behaviour and three uniques with their own behaviour.three uniques with their own behaviour.
• Group oneGroup one, consisting of Argyll and Clyde, Ayrshire , consisting of Argyll and Clyde, Ayrshire and Arran, Western Isles exhibited strong losses in and Arran, Western Isles exhibited strong losses in ages 15-29 with gains in the other ages.ages 15-29 with gains in the other ages.
• Group twoGroup two, including Borders, Dumfries and Galloway, , including Borders, Dumfries and Galloway, Lanarkshire, Orkney, Shetland, experienced losses at Lanarkshire, Orkney, Shetland, experienced losses at ages 15-24, small gains at ages 25-29 and gains at ages 15-24, small gains at ages 25-29 and gains at other ages.other ages.
• Group threeGroup three, Fife, Forth Valley and Highland, made , Fife, Forth Valley and Highland, made gains in most age groups except ages 20-24. gains in most age groups except ages 20-24.
• The uniquesThe uniques– Lothian, which gained migrants at ages 15-29 but had losses at Lothian, which gained migrants at ages 15-29 but had losses at
other agesother ages– Greater Glasgow, which had gains at ages 15-19 and losses in Greater Glasgow, which had gains at ages 15-19 and losses in
all other age groupsall other age groups– Grampian, which saw losses at ages 20-29 and gains at other Grampian, which saw losses at ages 20-29 and gains at other
ages.ages.
Explanations for the Explanations for the internal migration trendsinternal migration trends
• We fitted a linear regression model to the time series of We fitted a linear regression model to the time series of in- and out-migration rates by broad age for the 1988-in- and out-migration rates by broad age for the 1988-2003 time series2003 time series
• Findings from the regression modelling of migration rates Findings from the regression modelling of migration rates using a set of potential determinants can only be tentative, using a set of potential determinants can only be tentative, given the small number of observations in the time series, given the small number of observations in the time series, which meant that few determinant variable coefficients which meant that few determinant variable coefficients were significant at the 5% level. were significant at the 5% level.
• Cross-sectional variables (measuring Scotland’s socio-Cross-sectional variables (measuring Scotland’s socio-economic position) provide no explanation because all economic position) provide no explanation because all trends are linear (by assumption) and we are trying to trends are linear (by assumption) and we are trying to explain a fluctuating temporal series. explain a fluctuating temporal series.
• The models included three UK time series variables, real The models included three UK time series variables, real disposable income per head (INC), mortgage interest rate disposable income per head (INC), mortgage interest rate (INT) and the annual GDP growth rate (GRO), and two (INT) and the annual GDP growth rate (GRO), and two regional variables, the Scotland unemployment rate (SUN) regional variables, the Scotland unemployment rate (SUN) and the Greater South East unemployment rate (GUN).and the Greater South East unemployment rate (GUN).

In-migration to Scotland
-3
-2
-1
0
1
2
3
INC INT GRO SUN GUN
Determinants
0-14
15-19
20-24
25-29
30-44
45-59
60-69
70+
Immigration
Standardised Beta Coefficients for Determinant Variables: In-migration from RUK by broad age and total immigration

Out-migration from Scotland
-4
-3
-2
-1
0
1
2
3
4
INC INT GRO SUN GUN
Determinant
0-14
15-19
20-24
25-29
30-44
45-59
60-69
70+
Emigration

Implications for policy: Implications for policy: negative trendsnegative trends
• These analyses help identify where Scotland’s migration These analyses help identify where Scotland’s migration trends are positive (helping add to the population) and trends are positive (helping add to the population) and where they are negative (contributing to population loss). where they are negative (contributing to population loss).
• The negative trends are concentrated in the twenties age The negative trends are concentrated in the twenties age range and in the older industrial regions of West Central range and in the older industrial regions of West Central Scotland, although only Greater Glasgow fails to attract Scotland, although only Greater Glasgow fails to attract net in-migrants outside of the 29-29 age range. The net in-migrants outside of the 29-29 age range. The external balance is negative though variable from year to external balance is negative though variable from year to year. Policy is currently being directed towards retention year. Policy is currently being directed towards retention of young people in their twenties after graduation and of young people in their twenties after graduation and towards attracting back to Scotland earlier migrants. towards attracting back to Scotland earlier migrants. Important though those efforts are Scotland should not Important though those efforts are Scotland should not neglect policies to attract older migrants from the Rest of neglect policies to attract older migrants from the Rest of the UK who already show a willingness to come to the UK who already show a willingness to come to Scotland. Scotland.

Implications for policy: Implications for policy: positive trendspositive trends
• The positive trends occur in ages beyond 30 (families, The positive trends occur in ages beyond 30 (families, empty nesters, older workers and retirees) and at ages empty nesters, older workers and retirees) and at ages 15-19. These trends should be encouraged because 15-19. These trends should be encouraged because inward migration will stimulate the demand for services inward migration will stimulate the demand for services and the labour that is needed. and the labour that is needed.
• In recent decades consumption led migration is becoming In recent decades consumption led migration is becoming more important compared with production led migration. more important compared with production led migration. Scotland has some unique assets for attracting migrants Scotland has some unique assets for attracting migrants (space and lower congestion than in England, leisure (space and lower congestion than in England, leisure facilities – golf courses, a landscape attractiveness to facilities – golf courses, a landscape attractiveness to walkers and climbers). Scotland’s capital and historic walkers and climbers). Scotland’s capital and historic towns are attractive to incomers. Scotland’s higher towns are attractive to incomers. Scotland’s higher education system attracts students from England and education system attracts students from England and from overseas in substantial numbers and they contribute from overseas in substantial numbers and they contribute their consumption to the economy and increasingly their their consumption to the economy and increasingly their labour. labour.

ConclusionsConclusions• Scotland wants to attract more migrants and Scotland wants to attract more migrants and
retain them.retain them.• The experience of Ireland (EU Tiger economy) The experience of Ireland (EU Tiger economy)
suggests if you get the economy right, the people suggests if you get the economy right, the people will come.will come.
• Targetting the Scottish diaspora is useful but Targetting the Scottish diaspora is useful but implies attracting older migrants and implies attracting older migrants and encouraging them to bring their capital and skills encouraging them to bring their capital and skills to help develop Scotland’s economy.to help develop Scotland’s economy.
• At current levels net inflows will only postpone At current levels net inflows will only postpone population decline for a few decades. The population decline for a few decades. The consequences of being the UK region with the consequences of being the UK region with the lowest fertility and highest mortality will be lowest fertility and highest mortality will be population decline after 2030.population decline after 2030.