Trends in Media Use - ERICTrends in Media Use VOL. 18 / NO. 1 / SPRING 2008 11 Trends in Media Use...
27
VOL. 18 / NO. 1 / SPRING 2008 11 Trends in Media Use Donald F. Roberts and Ulla G. Foehr Summary American youth are awash in media. They have television sets in their bedrooms, personal computers in their family rooms, and digital music players and cell phones in their backpacks. They spend more time with media than any single activity other than sleeping, with the aver- age American eight- to eighteen-year-old reporting more than six hours of daily media use. The growing phenomenon of “media multitasking”—using several media concurrently—multiplies that figure to eight and a half hours of media exposure daily. Donald Roberts and Ulla Foehr examine how both media use and media exposure vary with demographic factors such as age, race and ethnicity, and household socioeconomic status, and with psychosocial variables such as academic performance and personal adjustment. They note that media exposure begins early, increases until children begin school, drops off briefly, then climbs again to peak at almost eight hours daily among eleven- and twelve-year-olds. Television and video exposure is particularly high among African American youth. Media exposure is nega- tively related to indicators of socioeconomic status, but that relationship may be diminishing. Media exposure is positively related to risk-taking behaviors and is negatively related to person- al adjustment and school performance. Roberts and Foehr also review evidence pointing to the existence of a digital divide—variations in access to personal computers and allied technologies by socioeconomic status and by race and ethnicity. The authors also examine how the recent emergence of digital media such as personal com- puters, video game consoles, and portable music players, as well as the media multitasking phenomenon they facilitate, has increased young people’s exposure to media messages while leaving media use time largely unchanged. Newer media, they point out, are not displacing older media but are being used in concert with them. The authors note which young people are more or less likely to use several media concurrently and which media are more or less likely to be paired with various other media. They argue that one implication of such media multitasking is the need to reconceptualize “media exposure.” www.futureofchildren.org Donald F. Roberts, the Thomas More Storke Professor Emeritus in the Department of Communication at Stanford University, has spent more than thirty years conducting research and writing about youth and media. Ulla G. Foehr is a media research consultant special- izing in children and media use behaviors.
Transcript of Trends in Media Use - ERICTrends in Media Use VOL. 18 / NO. 1 / SPRING 2008 11 Trends in Media Use...
Trends in Media Use
VOL. 18 / NO. 1 / SPRING 2008 11
Trends in Media Use
Donald F. Roberts and Ulla G. Foehr
SummaryAmerican youth are awash in media. They have television sets in their bedrooms, personal computers in their family rooms, and digital music players and cell phones in their backpacks. They spend more time with media than any single activity other than sleeping, with the aver-age American eight- to eighteen-year-old reporting more than six hours of daily media use. The growing phenomenon of “media multitasking”—using several media concurrently—multiplies that figure to eight and a half hours of media exposure daily.
Donald Roberts and Ulla Foehr examine how both media use and media exposure vary with demographic factors such as age, race and ethnicity, and household socioeconomic status, and with psychosocial variables such as academic performance and personal adjustment. They note that media exposure begins early, increases until children begin school, drops off briefly, then climbs again to peak at almost eight hours daily among eleven- and twelve-year-olds. Television and video exposure is particularly high among African American youth. Media exposure is nega-tively related to indicators of socioeconomic status, but that relationship may be diminishing. Media exposure is positively related to risk-taking behaviors and is negatively related to person-al adjustment and school performance. Roberts and Foehr also review evidence pointing to the existence of a digital divide—variations in access to personal computers and allied technologies by socioeconomic status and by race and ethnicity.
The authors also examine how the recent emergence of digital media such as personal com-puters, video game consoles, and portable music players, as well as the media multitasking phenomenon they facilitate, has increased young people’s exposure to media messages while leaving media use time largely unchanged. Newer media, they point out, are not displacing older media but are being used in concert with them. The authors note which young people are more or less likely to use several media concurrently and which media are more or less likely to be paired with various other media. They argue that one implication of such media multitasking is the need to reconceptualize “media exposure.”
www.futureofchildren.org
Donald F. Roberts, the Thomas More Storke Professor Emeritus in the Department of Communication at Stanford University, has spent more than thirty years conducting research and writing about youth and media. Ulla G. Foehr is a media research consultant special-izing in children and media use behaviors.
Donald F. Roberts and Ulla G. Foehr
12 THE FUTURE OF CHILDREN
America’s youth are awash in electronic media. What began as a media stream half a century ago has become a torrent whose strength continues to increase.
Before World War II, mass media available to young people consisted mainly of print (magazines, newspapers, and books), motion pictures (by then, “talkies” had appeared), and radio (by the end of the 1930s, U.S. households averaged slightly more than one radio set apiece). Following the war, televi-sion set distribution went from 0.5 percent of households in 1946 to 55 percent in 1956 and 87 percent in 1960.1 The media flood was just getting started, however. As television’s reach continued to grow—97 percent of U.S. homes had a TV set by 1974, and in 2001 the U.S. Census Bureau estimated that U.S. households averaged 2.4 TV sets apiece—new electronic media began to spring up. Personal computers emerged as consumer products near the end of the 1970s (the Apple II in 1977, the IBM-PC in 1981) and were named Time magazine’s “person of the year” in 1982. Personal computers were swiftly embraced by families with children. These computers had penetrated almost a quarter of homes with children between the ages of three and seventeen years by 1989, 70 percent of such homes by 2001, and 75 percent by 2003. Simi-larly, the Internet, which became available to the general population in the early 1990s, was being used at home by 22 percent of three- to seventeen-year-olds in 1997 and by 63 per-cent in 2003.2 Today, not only are American young people surrounded by media in their homes and schools, but the portability made possible by the increased miniaturization of digital media means that they can remain connected almost anywhere they wish to go. Laptop computers, cell phones, and handheld Internet devices are rapidly becoming basic equipment for today’s teenagers.
Hand-in-hand with the growth in media avail-able to young people has been a change in the content available to them. Today, a sub-stantial part of the media industry is devoted to creating and distributing content specifi-cally aimed at children and adolescents. Tele-vision has moved from family programming, to children’s programs, to complete channels aimed at the youth market. The music indus-try relies on fourteen- to twenty-four-year-old consumers. Youth-oriented interactive games inhabit the TV screen, the computer screen, an array of handheld devices, and cyberspace. The Internet, originally designed as a communication network for the military and scientists, has morphed into the World Wide Web, with a seemingly endless array of destinations, many designed specifically for kids and many more open to, albeit not designed for, them. With so many media and so much content available, it is not surprising that young people devote much of their time to media.
But how much time? To which media? To what kinds of content? Under what condi-tions? The importance of these questions should not be underestimated. Without an accurate mapping of young people’s me-dia exposure, researchers can never fully understand whether and how media affect the lives of children and adolescents. Hun-dreds of studies examining media effects on children (many of which will be examined in other articles in this issue) are based on assumptions about exposure. For example, for children to learn from media content, whether the learning is intended (as with Sesame Street’s efforts to teach numbers and letters or Wikipedia’s online explanations of just about anything) or incidental (as with children acquiring aggressive behaviors from a video game or materialistic values from an unending barrage of advertisements), they
Trends in Media Use
VOL. 18 / NO. 1 / SPRING 2008 13
must be exposed to specific kinds of content under specific conditions. Questions about whether new ways of structuring information influence young people’s information pro-cessing skills begin with assumptions about how much time children spend with different forms of media. Likewise, questions about whether and how the time youth devote to media affects other areas in their lives, such as the time spent doing homework or par-ticipating in after-school activities, depend on accurate measures of that time. In short, almost any question about how media affect young people is predicated on assumptions about media exposure.
Questions about media use and exposure, however, are not easily answered. The first difficulty is measurement issues. There is good reason to question the accuracy both of older children’s self-reports of media exposure and of parental estimates of the time younger children devote to media.3 Second, until recently, relatively few studies have been based on representative samples of U.S. youngsters, making it hard to generalize research findings to the broader population. Third, many studies, even many recent ones, focus primarily on a limited array of media, precluding examinations of “media use” as
opposed to “television use” or “computer use.” Finally, each of these problems is compounded by ongoing changes in the media environment—changes not only in the form and substance of media content, but also and particularly in the speedy emergence and adoption by young people of a variety of new media. For example, cell phones, a relatively rare possession among U.S. adolescents five or six years ago, are rapidly becoming one of teenagers’ favorite new media. In addition, changes in the media environment have made it necessary to differentiate between “media use” and “media exposure.” Estimates of young people’s overall media time that simply sum the amount of exposure to each individu-al medium are no longer valid, if they ever were. Media multitasking—the concurrent use of multiple media—has become the order of the day, one result of which is that young-sters report substantially more hours of being exposed to media content than hours of using media. Such disclaimers notwithstanding, recent research provides a reasonably clear snapshot of what remains, for better or worse, a moving target.
The following examination of U.S. young people’s media use and exposure focuses on children and adolescents ranging in age from birth to eighteen years. We focus primarily on recent studies that have used large, represen-tative samples and gathered information on the full array of media available to young people. For the most part, information concerning younger children (from birth to eight years) comes from three studies con-ducted under the auspices of the Kaiser Family Foundation and is based on parent reports.4 Information on older children (eight to eighteen years) comes primarily from two other Kaiser Family Foundation surveys of representative samples of school-aged children and was obtained through self-administered
With so many media and so much content available, it is not surprising that young people devote much of their time to media. But how much time? To which media? To what kinds of content? Under what conditions?

Donald F. Roberts and Ulla G. Foehr
14 THE FUTURE OF CHILDREN
questionnaires completed in schools and, importantly, from associated time-use diaries completed by children at home.5 In this article we focus on electronic media: television, video players, audio media (radio, tape, and compact
disc players), video games (both console-based and handheld), computers, and, when pos-sible, such new digital media as cell phones, personal digital media players (PDMPs), personal digital assistants, and handheld
Table 1. Household and Personal Media Ownership, by Age of Child
Percent
Share of children of various ages whose households contain media
Type of medium 0–6 years 0–1 years 2–3 years 4–6 years 8–18 years 8–10 years 11–14 years 15–18 years
Television 99 n.a. n.a. n.a. 99 98 100 99
Video player 93 n.a. n.a. n.a. 97 96 99 98
Radio n.a. n.a. n.a. n.a. 97 94 98 99
Audio player n.a. n.a. n.a. n.a. 98 95 99 100
Video game player 50 n.a. n.a. n.a. 83 84 84 81
Computer 78 n.a. n.a. n.a. 86 83 89 86
Cable or satellite n.a. n.a. n.a. n.a. 82 76 86 82
Internet access 69 n.a. n.a. n.a. 74 63 78 80
Instant messaging program n.a. n.a. n.a. n.a. 60 42 63 70
Share of children of various ages whose bedrooms contain media
Type of medium 0–6 years 0–1 years 2–3 years 4–6 years 8–18 years 8–10 years 11–14 years 15–18 years
Television 33 19 29 43 68 69 68 68
Video player 23 12 22 30 54 47 56 56
Radio n.a. n.a. n.a. n.a. 84 74 85 91
Audio player n.a. n.a. n.a. n.a. 86 75 89 92
Video game 10 2 5 18 49 52 52 41
Computer 5 3 3 7 31 23 31 37
Cable or satellite 17 10 12 23 37 32 38 40
Internet access 2 2 1 2 20 10 21 27
Instant messaging program n.a. n.a. n.a. n.a. 18 9 17 27
Share of children of various ages with “their own” media
Type of medium 0–6 years 0–1 years 2–3 years 4–6 years 8–18 years 8–10 years 11–14 years 15–18 years
Cell phone n.a. n.a. n.a. n.a. 39 21 36 56
Portable audio player n.a. n.a. n.a. n.a. 61 35 65 77
PDMP (MP3) n.a. n.a. n.a. n.a. 18 12 20 20
Laptop computer n.a. n.a. n.a. n.a. 12 13 11 15
Handheld video game n.a. n.a. n.a. n.a. 55 66 60 41
Personal digital assistant n.a. n.a. n.a. n.a. 11 9 14 8
Handheld Internet device n.a. n.a. n.a. n.a. 13 7 15 17
Sources: Information on young children from Victoria J. Rideout and Elizabeth Hamel, The Media Family: Electronic Media in the Lives of Infants, Toddlers, Preschoolers, and their Parents (Menlo Park, Calif.: Kaiser Family Foundation, 2006); information on older chil-dren from Donald F. Roberts, Ulla Foehr, and Victoria Rideout, Generation M: Media in the Lives of 8–18-year-olds (Menlo Park, Calif.: Kaiser Family Foundation, 2005). Data are missing for younger children in the first part of the table because subgroup analyses were not reported and, in the second and third part of the table, because particular questions were not asked of young children.
Trends in Media Use
VOL. 18 / NO. 1 / SPRING 2008 15
Internet devices. Except where noted, expo-sure times refer to recreational or leisure media use—that is, exposure to media content not associated with school or homework or with any kind of employment.
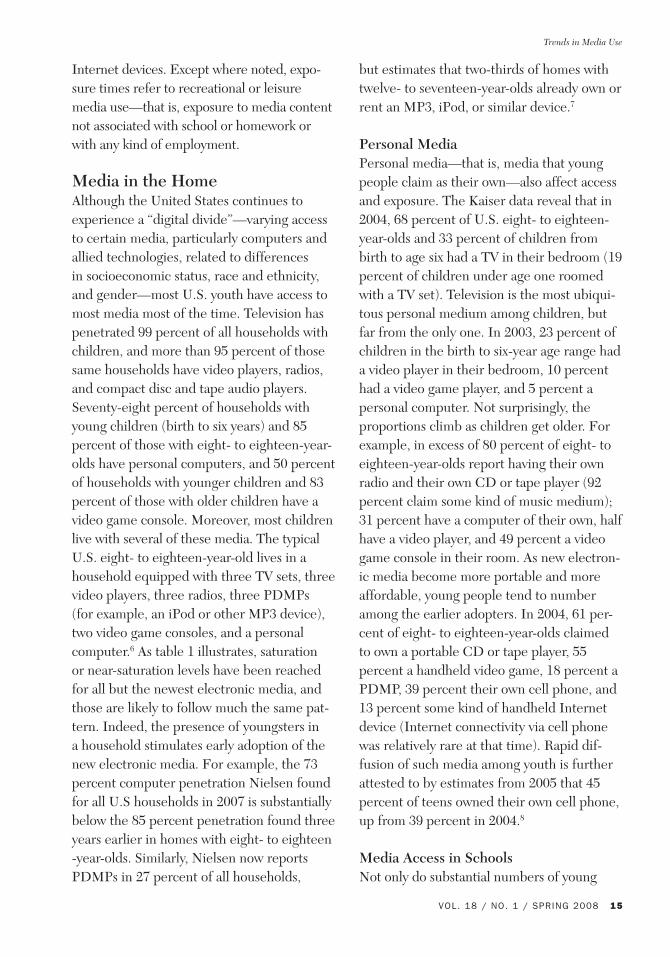
Media in the HomeAlthough the United States continues to experience a “digital divide”—varying access to certain media, particularly computers and allied technologies, related to differences in socioeconomic status, race and ethnicity, and gender—most U.S. youth have access to most media most of the time. Television has penetrated 99 percent of all households with children, and more than 95 percent of those same households have video players, radios, and compact disc and tape audio players. Seventy-eight percent of households with young children (birth to six years) and 85 percent of those with eight- to eighteen-year-olds have personal computers, and 50 percent of households with younger children and 83 percent of those with older children have a video game console. Moreover, most children live with several of these media. The typical U.S. eight- to eighteen-year-old lives in a household equipped with three TV sets, three video players, three radios, three PDMPs (for example, an iPod or other MP3 device), two video game consoles, and a personal computer.6 As table 1 illustrates, saturation or near-saturation levels have been reached for all but the newest electronic media, and those are likely to follow much the same pat-tern. Indeed, the presence of youngsters in a household stimulates early adoption of the new electronic media. For example, the 73 percent computer penetration Nielsen found for all U.S households in 2007 is substantially below the 85 percent penetration found three years earlier in homes with eight- to eighteen -year-olds. Similarly, Nielsen now reports PDMPs in 27 percent of all households,
but estimates that two-thirds of homes with twelve- to seventeen-year-olds already own or rent an MP3, iPod, or similar device.7
Personal MediaPersonal media—that is, media that young people claim as their own—also affect access and exposure. The Kaiser data reveal that in 2004, 68 percent of U.S. eight- to eighteen-year-olds and 33 percent of children from birth to age six had a TV in their bedroom (19 percent of children under age one roomed with a TV set). Television is the most ubiqui-tous personal medium among children, but far from the only one. In 2003, 23 percent of children in the birth to six-year age range had a video player in their bedroom, 10 percent had a video game player, and 5 percent a personal computer. Not surprisingly, the proportions climb as children get older. For example, in excess of 80 percent of eight- to eighteen-year-olds report having their own radio and their own CD or tape player (92 percent claim some kind of music medium); 31 percent have a computer of their own, half have a video player, and 49 percent a video game console in their room. As new electron-ic media become more portable and more affordable, young people tend to number among the earlier adopters. In 2004, 61 per-cent of eight- to eighteen-year-olds claimed to own a portable CD or tape player, 55 percent a handheld video game, 18 percent a PDMP, 39 percent their own cell phone, and 13 percent some kind of handheld Internet device (Internet connectivity via cell phone was relatively rare at that time). Rapid dif-fusion of such media among youth is further attested to by estimates from 2005 that 45 percent of teens owned their own cell phone, up from 39 percent in 2004.8
Media Access in SchoolsNot only do substantial numbers of young
Donald F. Roberts and Ulla G. Foehr
16 THE FUTURE OF CHILDREN
people carry most forms of portable digital media to school with them, most schools in the United States are now “wired.” Although we have found no data pertaining to electron-ic media in preschools and day care centers,9 virtually all public schools have for several decades owned TV sets (the average number of TV sets per public school exceeded twelve by 1994). Recent U.S. Department of Educa-tion data indicate that 100 percent of U.S. public schools had Internet connectivity by 2003, that 93 percent of public school instruc-tional rooms had access by 2003, and that 95 percent of schools with Internet access were using broadband (high-speed) connections in that same year.10 Theoretically, then, it appears that most youngsters have relatively easy access to all but the very newest elec-tronic media.
The Digital DivideThe term “digital divide” came into popular usage during the mid-1990s and originally referred to variations in access (in homes, schools, or other public locations) to personal computers and allied technologies, such as
Internet connections, according to differenc-es in socioeconomic status, race and ethnicity, gender, and geography (rural and urban loca-tion). More recently, as the gap in access to computers has narrowed somewhat, the term has also been applied both to broadband connectivity and to differences in technical support and in how members of different socioeconomic status or ethnic groups use the technology.
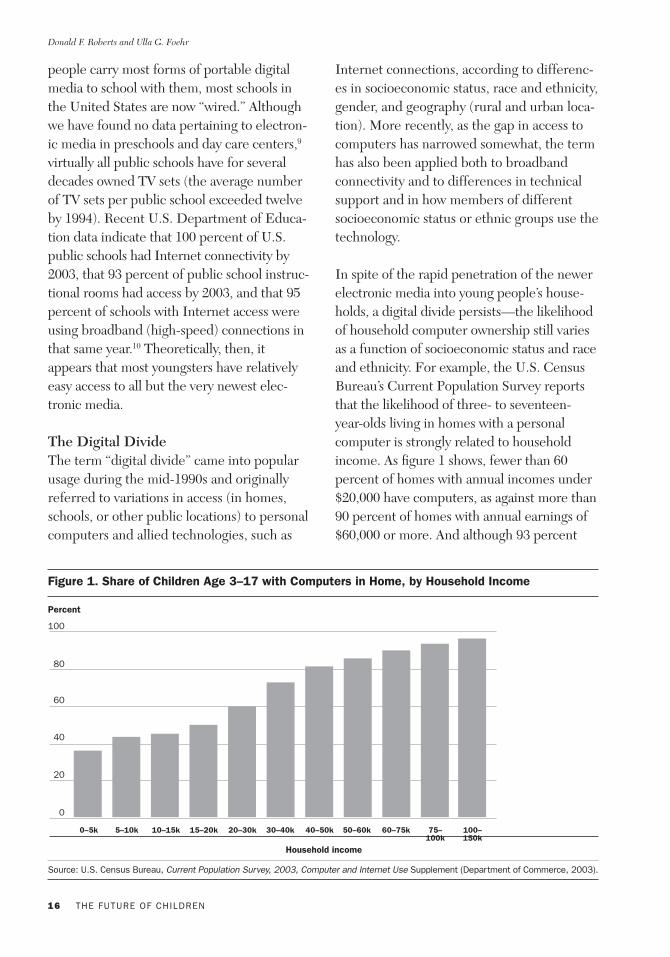
In spite of the rapid penetration of the newer electronic media into young people’s house-holds, a digital divide persists—the likelihood of household computer ownership still varies as a function of socioeconomic status and race and ethnicity. For example, the U.S. Census Bureau’s Current Population Survey reports that the likelihood of three- to seventeen-year-olds living in homes with a personal computer is strongly related to household income. As figure 1 shows, fewer than 60 percent of homes with annual incomes under $20,000 have computers, as against more than 90 percent of homes with annual earnings of $60,000 or more. And although 93 percent
Figure 1. Share of Children Age 3–17 with Computers in Home, by Household Income
Percent
0
20
40
60
100
80
0–5k 5–10k 10–15k 15–20k 20–30k 30–40k 40–50k 50–60k 60–75k 75–100k
100–150k
Source: U.S. Census Bureau, Current Population Survey, 2003, Computer and Internet Use Supplement (Department of Commerce, 2003).
Household income
Trends in Media Use
VOL. 18 / NO. 1 / SPRING 2008 17
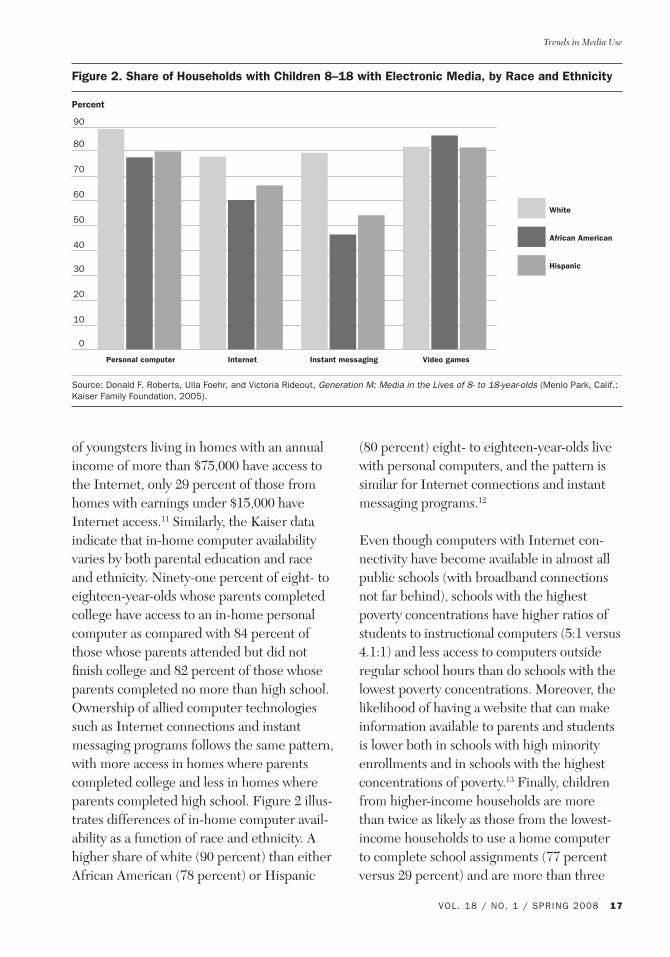
of youngsters living in homes with an annual income of more than $75,000 have access to the Internet, only 29 percent of those from homes with earnings under $15,000 have Internet access.11 Similarly, the Kaiser data indicate that in-home computer availability varies by both parental education and race and ethnicity. Ninety-one percent of eight- to eighteen-year-olds whose parents completed college have access to an in-home personal computer as compared with 84 percent of those whose parents attended but did not finish college and 82 percent of those whose parents completed no more than high school. Ownership of allied computer technologies such as Internet connections and instant messaging programs follows the same pattern, with more access in homes where parents completed college and less in homes where parents completed high school. Figure 2 illus-trates differences of in-home computer avail-ability as a function of race and ethnicity. A higher share of white (90 percent) than either African American (78 percent) or Hispanic
(80 percent) eight- to eighteen-year-olds live with personal computers, and the pattern is similar for Internet connections and instant messaging programs.12
Even though computers with Internet con-nectivity have become available in almost all public schools (with broadband connections not far behind), schools with the highest poverty concentrations have higher ratios of students to instructional computers (5:1 versus 4.1:1) and less access to computers outside regular school hours than do schools with the lowest poverty concentrations. Moreover, the likelihood of having a website that can make information available to parents and students is lower both in schools with high minority enrollments and in schools with the highest concentrations of poverty.13 Finally, children from higher-income households are more than twice as likely as those from the lowest-income households to use a home computer to complete school assignments (77 percent versus 29 percent) and are more than three
Figure 2. Share of Households with Children 8–18 with Electronic Media, by Race and Ethnicity
Percent
0
10
20
30
40
50
60
70
80
90
Personal computer Internet Instant messaging Video games
White
African American
Hispanic
Source: Donald F. Roberts, Ulla Foehr, and Victoria Rideout, Generation M: Media in the Lives of 8- to 18-year-olds (Menlo Park, Calif.: Kaiser Family Foundation, 2005).

Donald F. Roberts and Ulla G. Foehr
18 THE FUTURE OF CHILDREN
times as likely to use a personal computer for word processing or desktop publishing.14
It seems, then, that although in terms of ac-cess to the technology the digital divide has narrowed substantially since the mid-1990s (particularly access within public schools), in terms of the potential benefits of comput-ers and allied technologies for education and economic opportunity, there remains cause for concern.
Overall Media Exposure and UseAlthough some early studies of children’s media exposure report time devoted to each of several different media, we have located no research published before 1999 that esti-mates young people’s “total media exposure” or that differentiates between media expo-sure and media use.15 Asking respondents, particularly children, to estimate their overall “media time” is almost pointless. The mean-
ing of “media” differs from person to person, the wide and increasing array of media to which the term refers makes the task even more difficult, and the fact that young people in particular engage in a great deal of media use as a secondary, even tertiary, activity—the TV may be on as a teenager washes the dishes and argues with a sibling while listen-ing to a PDMP through ear-pods—further impairs recall. It is more accurate to ask youngsters to report time they spend with each individual medium (Yesterday, how much time did you spend using a computer? How much time did you watch TV?). Unfor-tunately, however, overall “media use” is not a straightforward summation of time exposed to each individual medium. To the extent that people “use” several media at the same time, playing a video game while listening to music, the sum of the two exposure estimates will be double the amount of time spent using media. That is, while engaged in one hour of
Table 2. Children’s Average Daily Exposure to Five Electronic Media, Total Media Exposure, and Total Media Use, by Age
Research sample Television Videos and movies
Audio Video games
Computer Total media exposure
Total media use
Children 0–6 years (2005)
Total sample 0:59 0:24 0:48 0:06 0:07 2:24 n.a.
0–1 year 0:34 0:13 0:57 0:00 0:01 1:45 n.a.
2–3 years 1:11 0:32 0:50 0:03 0:05 2:41 n.a.
4–6 years 1:02 0:25 0:41 0:10 0:10 2:28 n.a.
Children 2–7 years (1999)
Total sample 1:59 0:31 0:45 0:08 0:07 3:30 2:56
Children 8–18 years (2004)
Total sample 3:04 1:11 1:44 0:49 1:02 7:50 5:48
8–10 years 3:17 1:24 0:59 1:05 0:37 7:21 5:22
11–14 years 3:16 1:09 1:42 0:52 1:02 8:00 6:00
15–18 years 2:36 1:05 2:24 0:33 1:22 7:59 5:59
Children 8–18 years (1999)
Total sample 3:05 0:59 1:48 0:26 0:27 6:45 5:40
Source: Data on sample of children 0–6 years (2005) from Rideout and Hamel (see table 1); on sample 2–7 years (1999) from Donald F. Roberts and others, Kids and Media at the New Millennium (Menlo Park, Calif.: Kaiser Family Foundation, 1999); on sample 8–18 years (2004) from Roberts, Foehr, and Rideout, Generation M (see table 1); on sample 8–18 years (1999) from Roberts and others, Kids and Media (see above). Because time-use diaries were not obtained for the 2005 sample of young children, total media use estimates are not available for them.

Trends in Media Use
VOL. 18 / NO. 1 / SPRING 2008 19
media use (playing a video game while listen-ing to music) a youngster is exposed to two hours of media content (one hour of video game content, one of music content). The exposure-use distinction has become espe-cially important as new media, particularly the personal computer, have increased the amount of concurrent media use as well as the rate of media multitasking among young people. In what follows, then, “media use” refers to the amount of time young people devote to all media (that is, person hours devoted to using media); “media exposure” refers to media content encountered by young people expressed in units of time (that is, hours of television exposure).16
Table 2 summarizes recent estimates of both media exposure and media use for samples of both younger and older children. Exposure to electronic media starts early and rises quickly. In 2005, children six years and younger averaged 2:24 (two hours and twenty-four minutes) daily exposure to media content. Data on concurrent media use were not col-lected for the birth to six-year-old samples. In 1999, however, parents reported that a national sample of two- to seven-year-olds experienced 3:30 of media exposure while engaged in 2:56 media use. Among older children and adolescents, in 2004, eight- to eighteen-year-olds reported an average of 7:50 of daily electronic media exposure, but packed all that content into just over 5:48 of media use. In other words, approximately 25 percent of the time that eight- to eighteen-year-olds were using media, they used two or more at once—a substantial increase in the proportion of time a similar sample used multiple media concurrently just five years earlier. In 1999, eight- to eighteen-year-olds engaged in media multitasking 17 percent of the time, fitting 6:45 exposure into 5:40 me-dia use. Thus, although total media exposure
increased more than an hour across the five-year span, media use remained remarkably constant (5:40 vs. 5:48). Donald Roberts, Ulla Foehr, and Victoria Rideout conjecture that a ceiling for media use may have been reached, but that the explosion of new media has led to increased exposure because of increases in the proportion of media time that young people use several media concurrently.17
Table 2 provides little support for speculation that newer media, such as computers, the Internet, and video games, are displacing such older media as television. Not only does TV viewing consume almost triple the time given to the next closest media category, but also the next closest category consists of videos and movies—arguably simply another form of “television.” In other words, exposure to a “TV screen” in one form or another accounts for more than half of all young people’s electronic media exposure. Much the same pattern emerges in estimates of children’s media budgets based on calculating the share of total media time each individual youth devotes to each medium, then averaging those proportions. In 1999, eight- to eighteen-year-olds devoted 51 percent of their media time to TV and to videos and movies; in 2004 the proportion was 48 percent. Thus, as table 2 indicates, although total media exposure increased substantially from 1999 to 2004, the increment was due almost completely to increases in time with video games and computers—over the five years, daily video game time went from 0:26 to 0:49, and average daily computer time increased from 0:27 to 1:02.18 Moreover, the additional exposure was almost completely due to increased use of several media simultaneously, not to displacement of older media such as television. In short, total media exposure increased, media multitasking increased, total use remained relatively constant, and there is

Donald F. Roberts and Ulla G. Foehr
20 THE FUTURE OF CHILDREN
little evidence that any medium—but espe-cially television—is being displaced.19
We have located no estimates of the amount of time that young people spend using such new, portable media as cell phones or personal data assistants. However the Pew Internet and American Life Project reports that in 2005 two-thirds of all teenagers with cell phones (at that time 45 percent of all teens) used instant messaging (IM), with half of IM users ex-changing such messages at least once daily.20
Age and Media ExposureExposure to each of the electronic media varies substantially according to a wide array of subgroup characteristics, and as table 2 indicates, age is one of the most important. Parent estimates of young children’s exposure are less than half the total media exposure reported by older youths. There is little question that some of this difference is real.21 But a substantial part of the large difference between exposure levels reported for six- to seven-year-olds in the younger sample and for eight-year-olds in the older sample is likely due to differences in how data were gathered for the two age groups—that is, parent reports and self reports. Not only does a strong “social desirability” bias elicit conservative answers when parents are asked how much time their children devote to such activities as television viewing or video game playing, but the migration of media to children’s bedrooms means that parents fre-quently do not know whether, when, or how much their children listen, view, or click.22 Nevertheless, with these caveats in mind, it seems clear that both television exposure and overall media exposure follow similar, age-related patterns.
Overall media exposure, pictured in figure 3, starts out low and increases fairly rapidly (to
just under five hours daily) until about the time children enter preschool or kindergar-ten. It drops off slightly for a brief period, then climbs to a peak of just over eight hours daily at around eleven to twelve years, followed by a gradual decline (to about seven hours daily) during later adolescence. This age-related, bi-modal pattern (that is, having two distinct peaks) of exposure was noted for television some years ago and, as is also illustrated in table 3, continues to hold for that medium. Indeed, we suspect the con-tinuing dominance of television in children’s media diet is largely responsible for the current pattern for overall media exposure.23 The bi-modal pattern is generally explained as resulting from changes in children’s available time—changes driven primarily by the demands of school and school-related activities. That is, among younger children, TV exposure (indeed, all media exposure) steadily increases during the first four or five years (paralleling increases in available time). At around four to six years, however, children begin school, and the more structured and to some extent television-free school environ-ment means less time is available for media. As young children adapt to the demands of school and begin to have somewhat later bedtimes, TV viewing (and overall media exposure) climbs again. A few years later, however, the change from grade school to middle school brings with it new demands on time—longer school hours, homework, and organized after-school activities, such as sports, clubs, and jobs. The social demands of adolescence, coupled with increased mobility, also cut into media time; given a choice between hanging out with friends or watch-ing TV, for example, a typical sixteen-year-old usually chooses the former.
Age-related exposure patterns, of course, depend on both the medium and the needs

Trends in Media Use
VOL. 18 / NO. 1 / SPRING 2008 21
and interests associated with different age categories. For example, among older youths, exposure to audio media, which is generally synonymous with music exposure, is posi-tively and linearly related to age. As children grow older, they are exposed to more audio media. A similar positive link exists for age and computer time. Conversely, video game playing is negatively related to age. In the case of exposure to audio media, table 2 illustrates that music listening starts out relatively low (less than an hour daily at age eight), but climbs continually from that point, to more than three hours by age eighteen.24 Such a positive relationship is not surprising. Popular music media (radio, recordings) have long ranked among adolescents’ preferred media, and as digitization has made music media more portable, it has become much easier for teenagers to have music whenever they want, wherever they are. Computers follow a similar pattern, but for somewhat differ-ent reasons. Eight- through ten-year-olds report 0:37 daily of nonschool computer use; by eleven to fourteen years the average is
1:02, and among fifteen- to eighteen-year-olds average leisure-related computer time reaches 1:22. We suspect that several factors account for increased computer time among teens. As youngsters grow older they become more adept at using computers, particularly at navigating the Internet, and they find more and more sites relevant to their needs and in-terests. In addition, as computers take on the functions of most other media (young people use them to listen to music, watch movies and film clips, play interactive games, and read the newspaper), it is not surprising that adoles-cents devote more time to them. Perhaps most important, however, is the computer’s emergence as a social networking device, a function that is particularly important to adolescents and to which they are increas-ingly devoting online attention. For example, in 2005, the Pew Internet and American Life Project reported that of the 87 percent of U.S. teens who used the Internet, more than half (55 percent) used online social network-ing sites, and that 55 percent had created a personal profile online.25
Figure 3. Total Media Exposure and Television Exposure, by Age
Hours daily exposure
Source: Donald F. Roberts and Ulla G. Foehr, Kids and Media in America (New York: Cambridge University Press, 2004).
1
Age in years
2
3
4
5
6
7
8
2 3 4 5 6 7 8 9 10 11 12 13 14 15 16 17 18
Total media
Television
Donald F. Roberts and Ulla G. Foehr
22 THE FUTURE OF CHILDREN
As noted, video game exposure is negatively related to age. Eight- through ten-year-olds spend slightly more than an hour a day playing video games (both console-based and handheld combined), but video gaming declines with age to just over half an hour among fifteen- to eighteen-year-olds, a decrease that we suspect is largely accounted for by a steady increase in the number of older youths who play no video games on any given day.
Race and Ethnicity and Media ExposureMedia exposure among young children, especially exposure to screen media such as television, videos, and movies, is related to race and ethnicity. Victoria Rideout and Elizabeth Hamel found that African American children from birth to age six spend signifi-cantly more time with television (1:18 daily) than do either Hispanic children (1:00) or white children (0:53).26 This finding largely replicates a pattern found with a slightly older sample (two- to seven-year-olds) a few years earlier, when African American children
averaged 3:06 daily TV exposure, Hispanic children 2:55, and white children 2:29. With the exception of length of TV exposure, young African American and Hispanic children do not differ in their use of most other media. Young white children spend less time with videos, movies, and video games, and more time than African American children with computers.
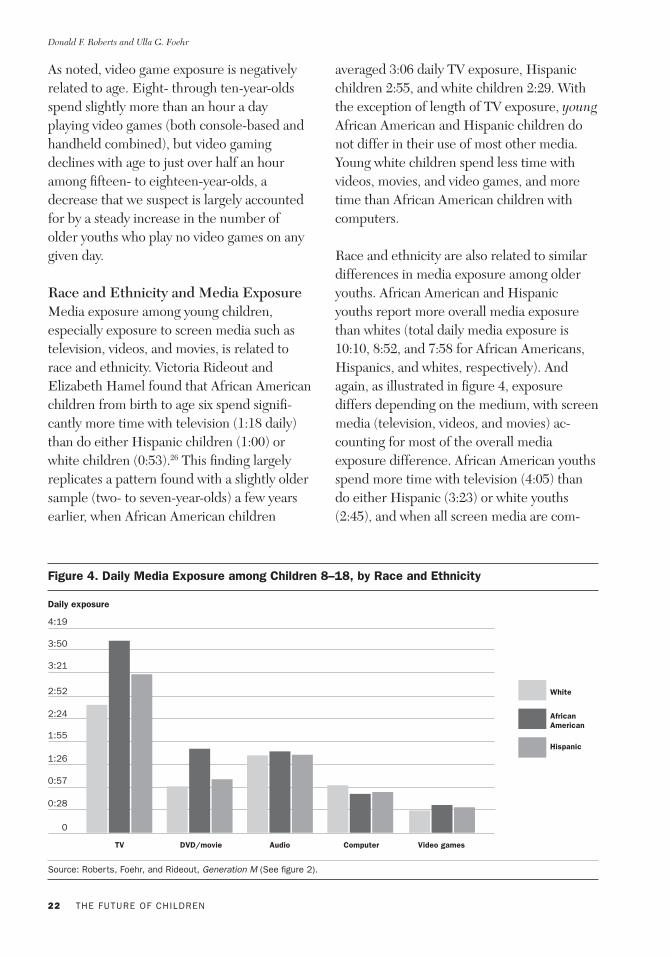
Race and ethnicity are also related to similar differences in media exposure among older youths. African American and Hispanic youths report more overall media exposure than whites (total daily media exposure is 10:10, 8:52, and 7:58 for African Americans, Hispanics, and whites, respectively). And again, as illustrated in figure 4, exposure differs depending on the medium, with screen media (television, videos, and movies) ac-counting for most of the overall media exposure difference. African American youths spend more time with television (4:05) than do either Hispanic (3:23) or white youths (2:45), and when all screen media are com-
Figure 4. Daily Media Exposure among Children 8–18, by Race and Ethnicity
Daily exposure
Source: Roberts, Foehr, and Rideout, Generation M (See figure 2).
0
0:57
0:28
1:55
1:26
2:52
2:24
4:19
3:50
3:21
TV DVD/movie Audio Computer Video games
White
African American
Hispanic
Trends in Media Use
VOL. 18 / NO. 1 / SPRING 2008 23
bined, daily viewing averages 5:53 among African American eight- to eighteen-year-olds, 4:37 among Hispanics, and 3:47 among whites. A similar pattern exists for time devoted to playing interactive games: African American youngsters report the most game playing (0:40 daily), followed by Hispanic youngsters (0:34), then white youngsters (0:30). On the other hand, race and ethnicity are not related to exposure to audio media, and although a significantly higher share of white youths (57 percent) than either African American (44 percent) or Hispanic (47 percent) report using a computer on any given day, the three groups do not differ reliably in the amount of time they use computers. Apparently fewer minority youths use com-puters, but those who do use them for longer periods than do their white counterparts. These relationships between media use and race and ethnicity largely withstand controls for socioeconomic status. It seems then, that African American youths are particularly attracted to screen media, especially televi-sion, and that the use of such media accounts for the lion’s share of the differences attribut-able to race and ethnicity.27
Socioeconomic Status and Media ExposureReports of substantial differences in media exposure as a function of socioeconomic status are common, but recent research indicates that the picture may be changing. Earlier work found both parental education and household income to be negatively related to screen exposure in general and to television exposure in particular,28 a pattern that has been repeated more recently for national samples of both younger and older youths.29 For example, in 2005 children from birth to age six in households earning less than $20,000 a year viewed 0:27 a day more television than children in households earning $75,000 or more, a pattern repeated
for youth with high school graduate and college graduate parents. Similarly, the Kaiser Family Foundation’s 1999 data indicated that two- to eighteen-year-olds from households earning more than $40,000 annually reported significantly less exposure to television, to videos and movies, and to video games, than
did their counterparts from households earning less than $25,000, resulting (not surprisingly) in less overall media exposure. Children whose parents completed no more than high school were exposed to more screen media (especially television) and reported significantly more total media exposure than did their counterparts whose parents had attained higher levels of education.
Recently, however, the picture has become clouded. The Kaiser study found no relation-ship between household income and either screen media exposure or overall media expo-sure among eight- to eighteen-year-olds ques-tioned in 2004.30 Rather, there emerged what social scientists call a curvilinear relationship between level of parent education and both screen exposure and overall media exposure. Youths whose parents completed college reported the most media exposure, those whose parents had some college education reported the least exposure, and those whose parents completed no more than high school
Reports of substantial differences in media exposure as a function of socioeconomic status are common, but recent research indicates that the picture may be changing.
Donald F. Roberts and Ulla G. Foehr
24 THE FUTURE OF CHILDREN
fell in between (but nearer to the group that had completed college). Because the share of youngsters within each parental educa-tion category who used each of the media on any given day did not differ, it appears that although all young people watch screen me-dia, those from the low- and high-education subgroups watch for longer periods on any given day.31
It is unclear why the power of socioeconomic variables to predict exposure to electronic media is waning—or, indeed, whether this one fairly recent finding will be replicated. Nevertheless, it is at least reasonable to speculate that American households have been so inundated by most media for so long that economic barriers to access are no longer a dominant issue; most low-income house-holds have multiple TVs, video game players, and music media. Moreover, social attitudes toward the various media have become more accepting; for example, highly educated par-ents may not be as critical of media content as they once were. Both trends were noted for television almost two decades ago.32
Gender and Media ExposureGender has not been shown to relate to dif-ferences in overall media exposure. However, boys and girls do report differing exposure
to various individual media, although these differences also depend on age. Rideout and Hamel report that among young children, boys spend more daily time than girls with video games (0:09 versus 0:02), computers (0:10 versus 0:06), and screen media overall (1:42 versus 1:30).33 Among older youths, the relationship holds for interactive games (boys, 1:34; girls, 0:40), but there are no gender differences in computer time, though there are gender differences in how young people use computers. Older girls, on the other hand, report more daily exposure than boys to audio media (boys, 1:29; girls, 2:00). The overall result is no gender differences in total media exposure.34
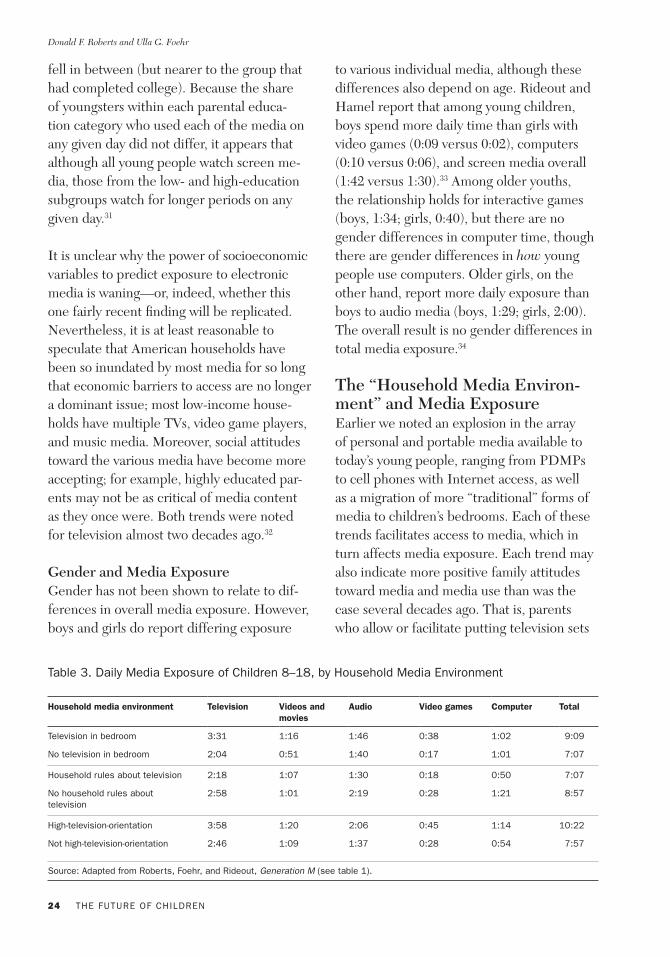
The “Household Media Environ-ment” and Media ExposureEarlier we noted an explosion in the array of personal and portable media available to today’s young people, ranging from PDMPs to cell phones with Internet access, as well as a migration of more “traditional” forms of media to children’s bedrooms. Each of these trends facilitates access to media, which in turn affects media exposure. Each trend may also indicate more positive family attitudes toward media and media use than was the case several decades ago. That is, parents who allow or facilitate putting television sets
Household media environment Television Videos and movies
Audio Video games Computer Total
Television in bedroom 3:31 1:16 1:46 0:38 1:02 9:09
No television in bedroom 2:04 0:51 1:40 0:17 1:01 7:07
Household rules about television 2:18 1:07 1:30 0:18 0:50 7:07
No household rules about television
2:58 1:01 2:19 0:28 1:21 8:57
High-television-orientation 3:58 1:20 2:06 0:45 1:14 10:22
Not high-television-orientation 2:46 1:09 1:37 0:28 0:54 7:57
Source: Adapted from Roberts, Foehr, and Rideout, Generation M (see table 1).
Table 3. Daily Media Exposure of Children 8–18, by Household Media Environment

Trends in Media Use
VOL. 18 / NO. 1 / SPRING 2008 25
or personal computers in their children’s bedrooms, or who acquiesce to or assist their children’s acquisition of portable digital media such as handheld video games or cell phones, are likely to hold more positive at-titudes toward media and media exposure in general. These attitudes, in turn, may affect young people’s media exposure.35
Recent work comparing media exposure times of children and adolescents with and without a television set in their bedroom reveals that easy access substantially increases exposure, even among very young children. One study of children from birth to age six reports that those with a television set in their bedroom watch fifteen minutes more each day, and another pegs the associated increase at thirty minutes.36 As table 3 illustrates, among eight- to eighteen-year-olds, the difference approaches an hour and a half; youths with no TV in their room report 2:04 daily view-ing, while those with a TV claim 3:31 daily viewing. It is also important to note that the predictive power of a bedroom TV set is not limited to television exposure. Victoria Rideout, Elizabeth Vanderwater, and El-len Wartella found that young children with bedroom TVs also spend more time playing video games, and Roberts, Foehr, and Ride-out found that among older youths a bedroom TV predicts more video game playing and more video viewing, the result of which is two hours a day more overall media exposure (see table 3). Researchers find similar patterns of increased exposure when they compare older youths with and without a video game con-sole in their bedroom and with and without a computer in their bedroom.37
That the presence of each of these media—a TV, a video game console, a computer—in a young person’s bedroom predicts exposure to several different media (hence to overall me-
dia exposure) suggests that something more than merely easy access is likely at play. That is, although a TV set in a child’s bedroom certainly makes TV much easier to watch, its location in the bedroom also probably points to more positive or accepting attitudes toward media in general. Some support for this pos-sibility comes from evidence that children in households where parents set rules about TV viewing are exposed less not only to televi-sion, but also to most electronic media (see table 3). Moreover, to the extent that parents try to enforce such media-related rules, the effect is even greater—in homes where the rules are enforced, media exposure is signifi-cantly lower.38
Roberts, Foehr, and Rideout took the “household media environment” idea one step further by identifying “high-television-orientation” households. They classified children and adolescents from homes in which the television was usually on during meals, and was usually on during most of the day even when no one was watching, and in which parents made no attempt to control television viewing as being from high-televi-sion-orientation households and found that a full 25 percent of U.S. eight- to eighteen-year-olds lived in such households. As is clear in table 3, young people from high-television-orientation households report substantially higher exposure to each of the electronic media, resulting in more than two hours more daily total media exposure than reported by youth from households where the television does not assume such a central position. In other words, both easy household access to media and a positive household orientation toward media, especially television, operate to increase the time young people spend with media, hence the number of media messages they encounter.

Donald F. Roberts and Ulla G. Foehr
26 THE FUTURE OF CHILDREN
Psycho-Social Predictors of Media ExposureResearchers have examined several psycho-logical variables related to young people’s me-dia use, including mental ability or academic performance, personal adjustment, and, more recently, sensation-seeking.
Researchers have long noted a negative link between television viewing and various indicators of children’s intellectual abilities, a link fairly consistently supported with mea-sures ranging from IQ and academic achieve-ment test scores to school grades and, more
recently, to children’s self-reported school grades.39 The two Kaiser Family Foundation studies conducted with older youths find much the same pattern. That is, youngsters who reported earning the lowest grades in schools watch significantly more television than do those who earn higher grades.40 The 1999 data also found a moderate negative relationship between self-reported school grades and most other electronic media exposure, resulting in a significant negative link between grades and total media exposure. Somewhat surprisingly, in the 2004 data the negative pattern for other media and for overall media exposure is quite weak; that is, self-reported grades are not strongly linked
with media exposure. Roberts and Foehr speculate that perhaps media have become such an integral part of most U.S. households that differences in exposure once related to academic performance are becoming attenu-ated.41 This possibility receives support from their finding that while there was no change from 1999 to 2004 in total media exposure reported by kids receiving “poor” or “fair” grades, among those who reported “good” grades overall, total media exposure increased by 0:43. That is, the difference in media exposure previously related to school grades was reduced to the point that it is no longer statistically significant. It seems, then, that although young people who achieve high grades continue to spend less time with media, the difference is not nearly as large as has been found in previous research.
Several early studies of children’s televi-sion exposure found a negative link between amount of viewing and what researchers vari-ously label as “personal adjustment,” “social adjustment,” or “contentedness.”42 In both the United States and Great Britain, children who were least secure, who had difficulties making friends, or who experienced some kind of family conflict tended to be among the heaviest users of television. Indeed, the negative relationships were so robust that George Comstock argues that heavy me-dia use became “recognized as a possible symptom of personal maladjustment.”43 The Kaiser Family Foundation studies, using an “index of personal contentedness,” finds much the same pattern for eight to eighteen-year-olds, although with some changes from 1999 to 2004. In 1999, less contented youths reported significantly more exposure to all media except the computer and audio media; in 2004, the link remained negative but the differences were statistically significant only for audio media, video games, and overall
Young people who are less contented or less satisfied with various aspects of their lives tend to engage in higher levels of media exposure than do their more contented counterparts.
Trends in Media Use
VOL. 18 / NO. 1 / SPRING 2008 27
media exposure. In general, then, recent results dovetail fairly well with a substantial literature demonstrating that young people who are less contented or less satisfied with various aspects of their lives tend to engage in higher levels of media exposure than do their more contented counterparts.
The term sensation-seeking refers to indi-viduals’ need to seek stimulation. Reasoning that various kinds of media use, such as video game playing, provide high stimulation, Rob-erts, Foehr, and Rideout examined the rela-tionship between seventh- to twelfth-grade students’ media use and scores on a sensa-tion-seeking measure. Although they did not find the expected link between sensation-seeking and video game exposure, they did find that compared with students classified as low or moderate sensation seekers, high sensation seekers reported significantly more television exposure, more use of audio media, and more total media exposure. Although the between-group differences for other types of media exposure were not reliable, high sensa-tion seekers consistently reported higher levels of exposure than their low and moder-ate sensation-seeking counterparts.44
Light vs. Heavy Media ExposureAs noted, the data summarized in table 2 provide scant support for the idea that time spent with new media is displacing time spent with older media. Rather, at least among older youths (eight to eighteen years), high exposure to one medium goes hand-in-hand with high exposure to most other media. Roberts, Foehr, and Rideout created groups of low, moderate, or high users of television, of computers, and of video games, classifying as heavy users the 20 percent of youths reporting more than five hours of daily TV exposure, the 16 percent reporting more than one hour a day of computer use, and
the 13 percent reporting more than one hour of video gaming. Conversely, light exposure was defined as one hour or less of TV daily (34 percent of kids), no use of a computer (45 percent), and no use of video games (58 percent). Youngsters classed as heavy users of each of these three media consistently reported higher levels of exposure to all other media. Heavy TV users reported about two hours more daily exposure to all other media (excluding TV) than moderate or light viewers—6:43, as against 4:31 and 3:57. For heavy computer users and heavy video game players, the difference in exposure to all other media ranged from three to four hours more daily. For heavy computer users, the time reported was 9:07, as against 6:39 for moderate users and 6:00 for light users. For heavy, moderate, and light video game users, the comparable figures were 10:58, 8:12, and 6:04. It is also worth noting that the pattern holds for each individual medium as well as for overall media exposure. For example, young people classed as heavy computer users spend more time watching TV, videos, and movies, more time listening to radio and to audio recordings, and more time playing video games than either light or moderate computer users spend with each of those specific media.
The total media exposure reported by each of the high-exposure groups is so high as to give one pause. For example, focusing on heavy users of television, if we add five hours of TV viewing (the criterion used to define heavy viewers) to the almost seven hours of “other” electronic media time they report, then heavy TV viewers are exposed to a minimum of just under twelve hours of media content daily. Similarly large numbers result when we con-duct the same exercise for youngsters classed as heavy users of computers (a minimum of ten hours daily media exposure) or of video
Donald F. Roberts and Ulla G. Foehr
28 THE FUTURE OF CHILDREN
games (twelve hours daily exposure). Such high total media exposure raises an obvious question: where could heavy users of TV, video games, or computers possibly find ten to twelve hours in their day to spend with media? A large part of the answer appears to reside in the media multitasking phenome-non—that is, the growing levels of concurrent media use among U.S. youths.
Media MultitaskingIn a recent examination of media multitask-ing, Ulla Foehr provides insights not only about the level of concurrent media use, but also about who is and is not media multitask-ing and which media are more likely to be used concurrently with which other media.45
Foehr notes that a large majority of young people—81 percent—report sharing at least some of their media time among two or more media concurrently. Wide variations, howev-er, exist in how and how much young people media-multitask. When asked how often they use other media at the same time they watch TV, 29 percent of seventh- to twelfth-graders say “most of the time” and another 30 percent reply “some of the time.” Asked that question in relation to listening to music, 33 percent say “most of the time” and 30 percent, “some of the time”; in relation to us-ing a computer, 33 percent reply “most of the time” and 29 percent, “some of the time.” In other words, for each of these three media, a solid majority of young Americans media-multitask at least some of the time, and from a quarter to a third report concurrent media use “most of the time.” Roughly one-fifth of eight- to eighteen-year-olds say that they typi-cally do not engage in concurrent media use.
Amount of media exposure strongly predicts media multitasking. Young people who report more exposure to media in general also
report more media multitasking. This is hardly surprising. Arguably the two activities can be conceived as two sides of the same coin. For example, when Roberts, Foehr, and Rideout classified seventh- through twelfth-graders as light, moderate, or heavy media multitaskers, they found that substantially greater shares of heavy media multitaskers were also classed as heavy users of each of the individual media.46 Thus, for example, 25 percent of heavy TV viewers (more than five hours daily) but only 11 percent of light TV viewers (one hour or less daily) were heavy media multitaskers. Similarly, 33 percent of heavy computer users but only 8 percent of light computer users were heavy multitaskers. Clearly, although some young people are more likely than others to use several media concurrently and some media invite multi-tasking more than others, the use of several media at the same time is a growing phenom-enon among U.S. youngsters—one deserving of more attention.
Correlates of Media MultitaskingBoth opportunity and environment play an important role in concurrent media use. Young people from households where the television can be seen from the computer are more likely to be media multitaskers than are young people from households in which computer placement does not allow TV viewing. Not having a computer at all exerts a negative influence. Youth from homes with no computer are less likely to be media multi-taskers, probably because the computer promotes media multitasking more than any other medium. Young people from high-tele-vision-orientation households (see table 3) are also more likely to use several media concur-rently than are those from low-television-orientation households. In other words, children from homes in which the television is usually on, is on during dinner, and in which
Trends in Media Use
VOL. 18 / NO. 1 / SPRING 2008 29
no rules govern TV use, are more likely to media-multitask. On a more psychological level, high sensation-seeking youngsters are more likely than their low sensation-seeking counterparts to be media multitaskers. Foehr reasons that because high sensation-seekers are averse to boredom and seek stimulating experiences, they are more likely “to keep multiple media ‘balls’ in the air at any one time.” Finally, gender is the single demo-graphic variable that predicts media multi-tasking. Girls report more concurrent media exposure than boys. Although this finding might seem to confirm the stereotype of women as historically being multitaskers (that is, juggling several household tasks while caring for children), no research addresses whether females are any more proficient at multitasking when it comes to media use.
Media PairingsIntuitively, it seems that some media should be more amenable to multitasking than others; most people sometimes read with music playing or the TV on in the background. Some media pairings also seem more reasonable
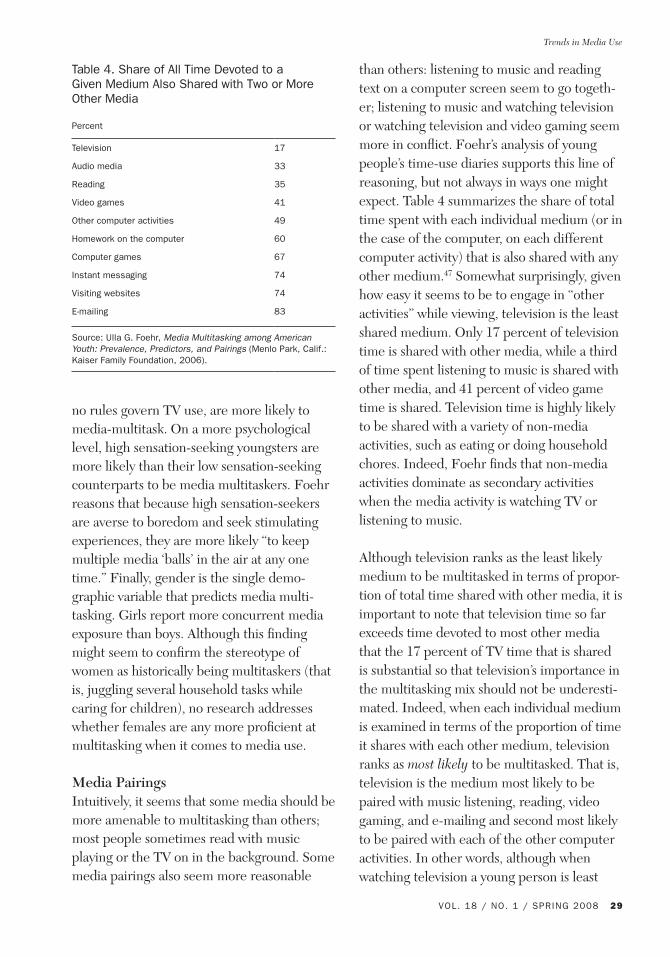
than others: listening to music and reading text on a computer screen seem to go togeth-er; listening to music and watching television or watching television and video gaming seem more in conflict. Foehr’s analysis of young people’s time-use diaries supports this line of reasoning, but not always in ways one might expect. Table 4 summarizes the share of total time spent with each individual medium (or in the case of the computer, on each different computer activity) that is also shared with any other medium.47 Somewhat surprisingly, given how easy it seems to be to engage in “other activities” while viewing, television is the least shared medium. Only 17 percent of television time is shared with other media, while a third of time spent listening to music is shared with other media, and 41 percent of video game time is shared. Television time is highly likely to be shared with a variety of non-media activities, such as eating or doing household chores. Indeed, Foehr finds that non-media activities dominate as secondary activities when the media activity is watching TV or listening to music.
Although television ranks as the least likely medium to be multitasked in terms of propor-tion of total time shared with other media, it is important to note that television time so far exceeds time devoted to most other media that the 17 percent of TV time that is shared is substantial so that television’s importance in the multitasking mix should not be underesti-mated. Indeed, when each individual medium is examined in terms of the proportion of time it shares with each other medium, television ranks as most likely to be multitasked. That is, television is the medium most likely to be paired with music listening, reading, video gaming, and e-mailing and second most likely to be paired with each of the other computer activities. In other words, although when watching television a young person is least
Table 4. Share of All Time Devoted to a Given Medium Also Shared with Two or More Other Media
Percent
Television 17
Audio media 33
Reading 35
Video games 41
Other computer activities 49
Homework on the computer 60
Computer games 67
Instant messaging 74
Visiting websites 74
E-mailing 83
Source: Ulla G. Foehr, Media Multitasking among American Youth: Prevalence, Predictors, and Pairings (Menlo Park, Calif.: Kaiser Family Foundation, 2006).
Donald F. Roberts and Ulla G. Foehr
30 THE FUTURE OF CHILDREN
likely to use several media concurrently, when a young person is media multitasking, televi-sion is the first or second most likely medium to be involved.
Table 4 also indicates that the computer is at the heart of the multitasking phenomenon. When all computer activities are lumped together to measure computer time, then the computer looks comparable to such media as music or print in terms of how much of its time is shared (just under half). But when each individual computer activity is examined separately, most of the time it is used is typi-cally shared with other media (frequently with other computer activities). For example, the proportion of shared computer activity time ranges from 60 percent (doing homework on the computer) to 83 percent (sending e-mail). In other words, when young people use a computer, they are likely engaged in second-ary activities, other media activities dominate as secondary activities, and another computer activity is most likely to be paired with the primary computer activity.
The computer truly appears to be a “me-dia multitasking station.” Its capacity to offer multiple windows on multiple activi-ties concurrently drives the phenomenon. And although we know of no empirical data addressing the question, we can’t help but wonder if the computer experience may not also fuel young people’s interest in and ability to engage in multiple information processing activities even beyond computer activities.
Some ImplicationsClearly, the label “Media Generation” fits today’s young people. More than any past generation, they have access to a wide, and still expanding, array of media—in their homes, in their rooms, and, with the emer-gence of miniaturization, in their backpacks
and pockets. They devote more time to me-dia than to any other single activity with the exception of sleep. Indeed, young Americans today are so immersed in media that they have become “media multitaskers.” Well over half report using multiple media concurrently “some” or “most” of the time, to the extent that in 2004, eight- to eighteen-year-olds reported media exposure levels (time spent with media content) more than 25 percent higher than media use levels (time spent with media)—5:48 of daily media use resulting in 7:50 of content exposure.
Arguably, then, the headline covering the findings from research on media exposure over the past ten years could be that concur-rent use of multiple media has become the order of the day among young people. They frequently listen while they watch while they click and, sometimes at least, write.48 This point is perhaps nowhere better illustrated than in the words of a seventeen-year-old boy quoted in a Pew Internet and American Life study of teenage life online: “I multitask every single second I am on-line. At this very moment, I am watching TV, checking my email every two minutes, reading a news-group about who shot JFK, burning some music to a CD and writing this message.”49
Arguably, the emergence of digital media, their portability, and the kinds of convergence they have enabled are the driving force behind the media multitasking phenomenon. As high-speed connectivity has expanded the communication capabilities of computers, whether in the form of desktop PCs, laptops, or, more recently, mobile phones (which have rapidly morphed into pocket computers), content that three decades ago was delivered through distinctly different media can now be accessed through a single instrument. As the boy quoted above illustrates, for today’s young
Trends in Media Use
VOL. 18 / NO. 1 / SPRING 2008 31
people some form of digital instrument often serves as the gateway to both traditional and new forms of print media (newspapers, magazines, books, message boards, blogs, and chatrooms), audio media (both music and talk are streamed and downloaded), and audiovi-sual media (the latest mobile phone promo-tions trumpet anytime, anywhere access to
motion pictures, television programs, and podcasts). And of course, each of these traditional “mass media” windows shares space concurrently with digital media’s enabling of new and extended interpersonal connec-tions—e-mail, instant messaging, blogging, photo-sharing, or recording (some)one’s life on any of a number of social networking sites, such as MySpace and Facebook. Teenagers’ rapid adoption of these social functions not only attests to the importance to them of social contacts, but also seems to be changing adoles-cents (at least large numbers of them) from traditional media consumers into real-time media critics (it is not unusual for “Internet buddies” to carry on an instant messaging conversation about a TV program while watching from different locations) and media producers (of websites, fan fiction, YouTube clips, and more).50
At the least, changes such as the convergence of media into one technology that facilitates concurrent access to multiple messages points to a need to rethink how “media exposure” is to be measured. Estimates of time devoted to radio, television, newspapers, or “the computer” no longer seem to capture young people’s media behavior; what were once conceived as separate activities seem no longer to function independently. New conceptualizations might take any of several forms. They could focus on the functions served by media exposure (diversion and pleasure, information seeking, social net-working). They could look at the type of engagement different kinds of exposure elicits (active responding as with a video game; information-seeking as working on a homework assignment; content creation, as when constructing a MySpace page; less active processing, as when watching a situation comedy or music video). Or they could classify exposure in terms of any of several content classifications (for example, fiction versus nonfiction, reality versus fantasy, social versus nonsocial). Whatever form new conceptualizations of media exposure take, it seems clear that we can no longer limit analyses of media exposure just to classification by medium.
It is also important to keep in mind that the young people’s media behaviors de-scribed here summarize averages. Even when results are examined in terms of the variables, such as age, gender, race, and socioeconomic status, commonly used in research, the results are based on averages. The problem is that averages may conceal a great deal of variation. Indeed, there may be nothing more elusive than “the average American child,” whether in terms of media behavior or any other behavior. Although it is true that substantial numbers of young
Arguably, then, the headline covering the findings from research on media exposure over the past ten years could be that concurrent use of multiple media has become the order of the day among young people.
Donald F. Roberts and Ulla G. Foehr
32 THE FUTURE OF CHILDREN
people report using multiple media concur-rently “most of the time,” it is also true that substantial numbers report that they “almost never” media multitask. Similarly, although 20 percent of youths report more than five hours of television viewing on any given day, and another 45 percent report from one to five hours, 35 percent watch less than one hour (with almost 20 percent not watching at all). And these kinds of findings hold even within the various demographic subgroups. For example, 31 percent of African American youth report more than five hours of daily television, but 16 percent report none at all. Indeed, as the discussion of the digital divide indicates, important differences remain in young people’s access to at least some kinds
of media. Our point is that even though media are central and ubiquitous in the lives of many young Americans, researchers have good reason to focus more attention on those who do not appear to be characterized by the “Media Generation” sobriquet.
That said, anything to which the lion’s share of U.S. youths devote more time than any other waking activity warrants continued scrutiny. That the media give American youngsters almost instantaneous access to more information than has ever been avail-able to any previous generation—access that, by the teen years, is generally unsupervised—suggests that the scrutiny should be intense.
Trends in Media Use
VOL. 18 / NO. 1 / SPRING 2008 33
Endnotes
1. Melvin L. DeFleur and Sandra Ball-Rokeach, Theories of Mass Communication, 5th ed. (New York: Long-
man, 1989).
2. Eric C. Newberger, Computer Use in the United States (U.S. Census Bureau, Current Population Reports,
Department of Commerce, October, 1997) [www.census.gov/prod/99pubs/p.20-522.pdf]; Jennifer Cheese-
man Day, Alex Janus, and Jessica Davis, Computer and Internet Use in the United States: 2003 (U.S.
Census Bureau, Current Population Reports, Department of Commerce, October, 2005) [www.census.gov/
prod/2005pubs/p.23–208.pdf].
3. Problems inherent in measuring media exposure are discussed by: George Comstock and Erica Scharrer,
Television: What’s On, Who’s Watching, and What It Means (San Diego: Academic Press, 1999); Donald
F. Roberts and Ulla G. Foehr, Kids and Media in America (New York: Cambridge University Press, 2004);
John P. Robinson and Geoffrey Godbey, Time for Life: The Surprising Ways Americans Use Their Time
(Pennsylvania State University Press, 1997).
4. Donald F. Roberts and others, Kids and Media at the New Millennium (Menlo Park, Calif.: Kaiser Family
Foundation, 1999) and Roberts and Foehr, Kids and Media in America (see note 3), report data on two-
through eight-year-olds gathered in 1999. Victoria J. Rideout, Elizabeth A. Vandewater, and Ellen A. War-
tella, Zero to Six: Electronic Media in the Lives of Infants, Toddlers, and Preschoolers (Menlo Park, Calif.:
Kaiser Family Foundation, 2003), reports data gathered on children from birth to age six in 2003; Victoria
J. Rideout and Elizabeth Hamel, The Media Family: Electronic Media in the Lives of Infants, Toddlers,
Preschoolers, and their Parents (Menlo Park, Calif.: Kaiser Family Foundation, 2006) reports data gathered
on children from birth to age six in 2005.
5. Roberts and others, Kids and Media at the New Millennium (see note 4), and Roberts and Foehr, Kids and
Media in America (see note 3), provide data on older youths gathered in 1999; Donald F. Roberts, Ulla
Foehr, and Victoria Rideout, Generation M: Media in the Lives of 8–18-year-olds (Menlo Park, Calif.: Kai-
ser Family Foundation, 2005) reports data gathered in 2004. Inclusion of media-focused, time-use diaries is
an important element of these studies because they enable estimates of the proportion of time youngsters
use several media concurrently, an increasingly common media behavior among U.S. young people, raising
an array of new issues and questions.
6. Roberts, Foehr, and Rideout, Generation M (see note 5).
7. Nielsen Media Research, “Nielsen Study Shows DVD Players Surpass VCRs” (Press Release, December 19,
2007) (www.nielsenmedia.com/nc/portal/site/Public/menuitem.55dc65b4a7d5adff3f659361, [3/19/07]).
8. Amanda Lenhart, Mary Madden, and Paul Hitlin, Teens and Technology: Youth Are Leading the Transition
to a Fully Wired and Mobile Nation (Washington, D.C.: Pew Internet & American Life Project, July 27,
2005) [www.pewinternet.org/pdfs/Teens_Tech_July2005web.pdf].
9. Mary Story, Karen M. Kaphingst, and Simone French, “The Role of Child Care Settings in Obesity Preven-
tion,” Future of Children 16, no. 1 (2006): 143–68, refers to apparently anecdotal evidence that children
spend more time with TV in child care homes than in child care centers.
10. Henry J. Becker, “Analysis and Trends of School Use of New Information Technologies (U.S. Congressional
Office of Technology Assessment, March, 1994) (www.gse.uci.edu/doehome/EdResource/Publications/
Donald F. Roberts and Ulla G. Foehr
34 THE FUTURE OF CHILDREN
EdTechUse/C-TBLCNT.HTM [March 5, 2007]); Richard J. Noeth and Boris B. Volkov, “Evaluating the
Effectiveness of Technology in Our Schools” (Iowa City, Iowa: ACT Policy Report, 2004) (www.act.org/
path/policy/pdf/school_tech.pdf [March 21, 2007]); “State of the States,” Education Week 24 (April 5, 2005);
Basmat Parsad and Jennifer Jones, “Internet Access in U.S. Public Schools and Classrooms: 1994–2003,”
Education Statistics Quarterly 7 (2005): 1–2.
11. U.S. Census Bureau, Current Population Survey (Department of Commerce, 2003) (www.census.gov/
population/www/socdemo/computer/2003.html).
12. Roberts, Foehr, and Rideout, Generation M (see note 5).
13. Parsad and Jones, “Internet Access in U.S. Public Schools and Classrooms: 1994–2003” (see note 10).
14. The Children’s Partnership, “Measuring Digital Opportunity for America’s Children” (Santa Monica, Calif.:
The Children’s Partnership, 2005) www.contentbank.org/AM/Template. cfm?Section= Research_From_
The_Childrens_Partnership&CONTENTID=8044&TEMPLATE=/CM/ContentDisplay.cfm.
15. See, for example, Jack Lyle and Heidi R. Hoffman, “Children’s Use of Television and Other Media,” in
Television and Social Behavior: Reports and Papers, vol. IV: Television in Day-to-Day Life: Patterns of Use,
edited by Eli Rubinstein, George Comstock, and John Murray (Rockville, Md.: U.S. Department of Health,
Education, and Welfare, 1972), pp. 129–256; Eleanor E. Maccoby, “Television: Its Impact on School
Children,” Public Opinion Quarterly 15 (1951): 421–44; Wilbur Schramm, Jack Lyle, and Edwin B. Parker,
Television in the Lives of Our Children (Stanford University Press, 1961).
16. Although some recent studies have asked youngsters how often they use several media at once, the media
use–media exposure distinction is possible only when research obtains measures of the amount of time
youth use several media concurrently. Roberts and his colleagues (see note 5) accomplished this by col-
lecting week-long time-use diaries asking youth to report all daily media activities for each half hour from
6 a.m. until midnight for seven days.
17. Because Roberts, Foehr, and Rideout, Generation M (see note 5), included exposure to print media in their
examination of young people’s media use, their published estimates of total media use and exposure differ
somewhat from those reported here, which include only electronic media.
18. It should be noted, however, that exposure times for computers, video games, and “other” screen media
are not strictly comparable from 1999 to 2004, because the latter questionnaire included items not covered
in 1999 (for example, handheld video games, instant messaging, DVRs); Roberts, Foehr, and Rideout,
Generation M (see note 5).
19. Roberts, Foehr, and Rideout, Generation M (see note 5). For a review of studies that have looked at
displacement attributed to the introduction of television, see Diana C. Mutz, Donald F. Roberts, and
D. P. van Vuuren, “Reconsidering the Displacement Hypothesis: Television’s Influence on Children’s Time
Use,” Communication Research 20 (1993): 51–74.
20. Lenhart, Madden, and Hitlin, Teens and Technology (see note 8).
21. George Comstock, Television and the American Child (San Diego, Calif.: Academic Press, 1991), reviews a
number of early studies of young children’s television viewing that illustrate lower exposure among younger
children.
Trends in Media Use
VOL. 18 / NO. 1 / SPRING 2008 35
22. Because data for younger and older children come from different data sources, results for the two age
groupings have been kept separate in all tables and figures.
23. This pattern, based on a “constructed curve” derived from abstracting findings from numerous small-scale,
non-representative samples, was first noted by George Comstock and others, Television and Human
Behavior (New York: Columbia University Press, 1978), and was elaborated by Comstock, Television and the
American Child (see note 21). Roberts and Foehr, Kids and Media in America (see note 3), using data
gathered by Roberts, Foehr, and Rideout, Kids and Media at the New Millennium (see note 4), directly
tested both TV viewing and overall media exposure and found that the bi-modal pattern holds remarkably
well.
24. Peter G. Christenson and Donald F. Roberts, It’s Not Only Rock and Roll: Popular Music in the Lives of
Adolescents (Englewood Cliffs, N.J.: Hampton Press, 1998), give even higher estimates. They argue that
because music listening is to adolescents typically a secondary or even tertiary activity, it is frequently over-
looked when adolescents attempt to account for their time, and is therefore undercounted.
25. Lenhart, Madden, and Hitlin, Teens and Technology (see note 8).
26. Rideout and Hamel, The Media Family (see note 4).
27. Roberts, Foehr, and Rideout, Generation M (see note 5); Roberts and others, Kids and Media at the New
Millennium (see note 4). Also see A. F. Albarran and D. Umphrey, “An Examination of Television Motiva-
tions and Program Preferences by Hispanics, Blacks, and Whites,” Journal of Broadcasting and Electronic
Media 37 (1993): 95–103; Aletha C. Houston and others, Big World, Small Screen: The Role of Television
in American Society (University of Nebraska Press, 1992); J. P. Tangney and Seymour Feshbach, “Children’s
Television Viewing Frequency: Individual Differences and Demographic Correlates,” Personality and
Social Psychology Bulletin 14 (1988): 145–58.
28. Comstock, Television and the American Child (see note 21).
29. Roberts and others, Kids and Media at the New Millennium (see note 4); Roberts, Foehr, and Rideout,
Generation M (see note 5); Comstock and Scharrer, Television: What’s On, Who’s Watching, and What It
Means (see note 3).
30. Both Roberts and others, Kids and Media (see note 4) and Roberts, Foehr, and Rideout, Generation M
(see note 5) used federal estimates of median community income for the zip code area of each participating
school as their proxy for household income.
31. Roberts, Foehr, and Rideout, Generation M (see note 5).
32. Comstock and Scharrer, Television: What’s On, Who’s Watching, and What It Means (see note 3), reviews
this trend.
33. Rideout and Hamel, The Media Family (see note 4).
34. Roberts, Foehr, and Rideout, Generation M (see note 5). Christenson and Roberts, It’s Not Only Rock and
Roll (see note 24), in their review of adolescents’ use of popular music, found that since the 1970s girls have
consistently reported more exposure than boys to music media.
35. Such a scenario is supported by at least one recent study of young children’s parents. Rideout and Hamel,
The Media Family (see note 4), found that not only do today’s parents see the media as important educa-
Donald F. Roberts and Ulla G. Foehr
36 THE FUTURE OF CHILDREN
tional tools, but they also report that they are more likely to witness their children imitating positive than
negative behaviors observed in the media.
36. Rideout, Vanderwater, and Wartella, Zero to Six (see note 4); Rideout and Hamel, The Media Family (see
note 4).
37. Roberts, Foehr, and Rideout, Generation M (see note 5).
38. Ibid.
39. See, for example, Schramm, Lyle, and Parker, Television in the Lives of our Children (see note 15); Mark
Fetler, “Television Viewing and Academic Achievement,” Journal of Communication 34 (1987): 104–18.
For extended reviews of the relationship between various measures of academic performance and televi-
sion exposure see Comstock, Television and the American Child (see note 21); P. A. Williams and others,
“The Impact of Leisure-Time Television on School Learning,” American Educational Research Journal 19
(1982): 19–50.
40. Although concern has been voiced that self-reported grades produce inflated estimates, the ordinal strength
of the measure has received validation. Sanford M. Dornbusch and others, “The Relation of Parenting Style
to Adolescent School Performance,” Child Development 58 (1987): 1244–57, report a
correlation of r=.77 between self-reported grades and actual grade point average.
41. Roberts and Foehr, Kids and Media in America (see note 3).
42. See, for example, Hilde T. Himmelweit, A. N. Oppenheim, and Pamela Vince, Television and the Child
(London: Oxford University Press, 1958); Eleanor E. Maccoby, “Why Do Children Watch Television?”
Public Opinion Quarterly 18 (1954): 239–44; Schramm, Lyle, and Parker, Television in the Lives of Our
Children (see note 15); J. P. Tangney, “Aspects of the Family and Children’s Television Viewing Content
Preferences,” Child Development 59 (1988): 1070–79.
43. Comstock, Television and the American Child (see note 21), p. 33.
44. Roberts, Foehr, and Rideout, Generation M (see note 5).
45. Ulla G. Foehr, Media Multitasking among American Youth: Prevalence, Predictors, and Pairings (Menlo
Park, Calif.: Kaiser Family Foundation, 2006); also see Ulla G. Foehr, “Media Multitasking among Ameri-
can Youth: Prevalence, Predictors, and Pairings” (Unpublished Doctoral Dissertation, Stanford University,
Stanford, Calif., 2006).
46. Respondents were assigned as light, moderate, or heavy media multitaskers on the basis of responses to
questions asking young people how often they used several media concurrently when using each of four
specific media: television, print, audio, computers. Heavy media multitaskers were those who answered
“most of the time” to three items and at least “some of the time” to a fourth; Roberts, Foehr, and Rideout,
Generation M (see note 5).
47. That is, the denominator in each of these calculations is the total of all time spent using a medium, whether
as a primary or secondary activity; the numerator is the total amount of time spent with that medium that is
also shared with any other medium.
48. It should be noted that there is still debate over whether and the degree to which media multitasking occurs
simultaneously or serially (albeit with extremely rapid serial switching). That is, how much processing of
Trends in Media Use
VOL. 18 / NO. 1 / SPRING 2008 37
information from distinct channels occurs at the same time and how much is the result of switching from
one channel to another has not been resolved. The problem is compounded because “medium” is not co-
extensive with “channel,” and both are independent of content. Television (a medium) includes at least two
channels, visual and audio, and possibly a third (for example, when a character reads aloud printed material
presented on the screen). Moreover, processing is influenced by content as well as channel (or medium).
Thus, for example, while simultaneous processing might operate when watching and hearing a television
character read printed material aloud, serial processing might be required when reading a magazine and
concurrently watching an unrelated television program (or even listening to music). See, for example, D.
E. Meyer and D. E. Kieras, “A Computational Theory of Executive Cognitive Processes and Multiple-Task
Performance, Part I, Basic Mechanisms,” Psychological Review 104, no. 1 (1997): 3–65.
49. Amelia Lenhart, Lee Rainie, and Oliver Lewis, Teenage Life Online: The Rise of the Instant-Messaging
Generation and the Internet’s Impact on Friendships and Family Relationships (Washington, D.C.: Pew
Internet and American Life Project, 2001).
50. Amelia Lenhart and Mary Madden, Teen Content Creators and Consumers (Washington, D.C.: Pew
Internet and American Life Project, 2005) report that over half of U.S. twelve- to seventeen-year-olds have
created website content.