Trends in global CO2 and total greenhouse gas emissions ...
85
TRENDS IN GLOBAL CO 2 AND TOTAL GREENHOUSE GAS EMISSIONS 2020 Report J.G.J. Olivier and J.A.H.W. Peters December 2020
Transcript of Trends in global CO2 and total greenhouse gas emissions ...

TRENDS IN GLOBAL CO2 AND TOTAL GREENHOUSE GAS EMISSIONS
2020 Report
J.G.J. Olivier and J.A.H.W. Peters
December 2020

PBL | 2
Trends in global CO2 and total greenhouse gas emissions: 2020 Report © PBL Netherlands Environmental Assessment Agency The Hague, 2020 PBL publication number: 4331 Corresponding author [email protected] Authors J.G.J. Olivier and J.A.H.W. Peters Acknowledgements We thank the International Energy Agency (IEA), the U.S. Geological Survey (USGS), International Fertiliser Association (IFA), the Global Gas Flaring Reduction Partnership (GGFR) of the World Bank and the Global Carbon Project (GCP) for providing recent statistics. We thank the members of the EDGAR team at EC-JRC for their support in the data compilation of the CO2 Fast Track 2019 and Pieter Boot and Michel den Elzen (PBL) and Monica Crippa (EC-JRC) for their comments. Graphics PBL Beeldredactie Production coordination PBL Publishers This publication can be downloaded from: www.pbl.nl/en. Parts of this publication may be reproduced, providing the source is stated in the form: Olivier J.G.J. and Peters J.A.H.W. (2020), Trends in global CO2 and total greenhouse gas emissions: 2020 report. PBL Netherlands Environmental Assessment Agency, The Hague. PBL Netherlands Environmental Assessment Agency is the national institute for strategic policy analysis in the fields of the environment, nature and spatial planning. We contribute to improving the quality of political and administrative decision-making by conducting outlook studies, analyses and evaluations in which an integrated approach is considered paramount. Policy relevance is the prime concern in all of our studies. We conduct solicited and unsolicited research that is both independent and scientifically sound.

PBL | 3
Contents SUMMARY 4 1 INTRODUCTION 10 2 TRENDS IN GLOBAL EMISSIONS 13
2.1 Introduction 13 2.2 Global trends in total greenhouse gas emissions 15 2.3 Global trends in CO2 emissions 19 2.4 Global emissions of other greenhouse gases 23 2.5 COVID-19 global trends and future implications 30
3 TRENDS IN LARGEST EMITTING COUNTRIES AND THE EU-28 33
3.1 China 36 3.2 United States 39 3.3 European Union 45 3.4 India 52 3.5 Russian Federation 56 3.6 Japan 60
APPENDICES 65
A. CO2 emissions per country, per capita, and per USD of GDP 65 B. Greenhouse gas emissions: CH4, N2O, F-gases, total per capita and per USD of GDP 69 C. Annual change in global sectoral emissions in recession years and in other years 76
REFERENCES 80
PBL | 4
Summary Growth of 1.1% in global greenhouse gas emissions in 2019 In 2019, the growth in total global greenhouse gas (GHG) emissions (excluding those from land-use change) continued at a rate of 1.1% (±1%), reaching 52.4 gigatonnes of CO2 equivalent1 2 (GtCO2 eq) (with a 95% uncertainty range of ±8%3). Although the 1.1% growth is half that seen in 2018, it is a continuation of the average annual growth rate of 1.1% since 2012, which is markedly lower than the growth rates seen in the first decade of this century (2.6% on average) (Figure S.1). The 2019 global GHG emissions amounted to 57.4 GtCO2 eq when also including those from land-use change (which are estimated at a very uncertain 5.0 GtCO2 eq (±50%)), which is an increase of 70% compared to 2018. These increases occurred while global economic growth in 2019 was 2.8%, which is somewhat lower than the growth in global Gross Domestic Product (GDP) of 3.7% in 2017 and 3.5% in 2018. The 2019 global GHG emissions excluding those from land-use change were about 59% higher than in 1990 and 44% higher than in 2000. The 1.1% increase in global GHG emissions in 2019 was mainly due to a 0.9% increase in global CO2 emissions from fossil-fuel combustion and industrial non-combustion processes including cement production, which contributed almost two thirds to the total GHG increase in 2019. Other greenhouse gas emissions, CH4, N2O and F-gases, increased in 2019 by a respective 1.3%, 0.8% and 3.8%. Although global GHG emissions mostly consist of CO2
(about 74%, including 7 percentage points, on average, from land-use change), other significant shares are from methane, nitrous oxide and fluorinated gases (F-gases) with 17%, 5% and 3%, respectively. Among the countries that contributed most to the 1.1% global increase excluding land-use change (about 570 MtCO2 eq), China stands out with an increase of about 420 MtCO2 eq (+3.1%), followed by 50 MtCO2 eq in both Indonesia (+5.5%), Vietnam (+12.8%) and India (+1.4%). These increases were partly counterbalanced by countries with decreasing GHG emissions, in particular by that in the European Union (EU-284) (-3.0%) and the United
1 Greenhouse gas emissions, excluding land-use change, are based on EDGAR v5.0 FT2019 (this report) and
those that include CO2 emissions from land-use change (LUC) are from Houghton and Nassikas (2017) with our own estimate for 2019. The 5.0 GtCO2 eq of LUC emissions in 2019 also include 0.5 GtCO2 eq in CH4 and N2O emissions from forest and peat fires that was obtained from preliminary data for 2019 in the Global Fire Emissions Database version GFED4.1s data set (Van der Werf et al., 2017). For CH4, N2O and the F-gases, this report uses the Global Warming Potential (GWP) metric from the Fourth Assessment Report (AR4) of the IPCC (2007), which is also used by industrialised countries in their annual national emissions inventory reports submitted to the UNFCCC (i.e. Annex I countries). The time horizon of the GWPs is 100 years. Please note that developing countries officially report their emissions using GWPs from the Second Assessment Report (SAR) of the IPCC. The largest difference is in the GWP of CH4: the GWP value is 25 in the AR4 and 21 in the SAR, so almost one fifth larger.
2 The historical EDGAR GHG emission trends in this report (excluding those from land-use change) were also
presented in UNEP’s Emissions Gap Report 2020 (UNEP, 2020; Moisio et al., 2020). 3 We estimated uncertainties with two standard deviations for global emissions of ±6% for CO2 (excluding LUC),
±25% for CH4,±30% for N2O and ±20% for fluorinated gases (UNEP, 2012), resulting in 7% uncertainty, and added an extra ±1% to account for the uncertainty in the 2018–2019 GHG emissions trend. These uncertainty ranges are consistent with those presented in Appendix 1 of UNEP’s Emissions Gap Report 2012 (UNEP, 2012) and IPCC AR5 (Blanco et al., 2014).
4 This report covers emissions up to and including 2019. This means the United Kingdom was still a Member
State of the European Union (it exited the EU on 31 January 2020). Therefore, the United Kingdom was

PBL | 5
States (-1.7%) and also by Japan and South Korea. The figures for countries and the EU-28 presented here do not include net emissions from land-use change (LUC), which are usually accounted for separately, because they are inherently very uncertain and can show very large interannual variations. The year 2019 was the second warmest year in the 140-year record with global land and ocean surface water temperatures of +0.95 oC higher than average. This is only 0.04 oC below the record of +0.99 oC set in 2016. The 5 warmest years since 1880 have all occurred since 2015 and 9 of the 10 warmest years have occurred since 2005. The year 2019 was characterised by warmer-than-average conditions across most of global land and sea surfaces. Record high annual land surface temperatures were measured across parts of central Europe, Asia, Australia and New Zealand, southern Africa, North America and eastern South America. The much dryer weather conditions in 2019 caused global emission levels from forest and peat fires that were considerably higher than in 2018 (70%), particularly in Equatorial Asia, Australia and South America.
Greenhouse gas emissions increased in 3 of the top-5 countries and decreased in the European Union, United States and Japan The six largest emitters of GHG, together accounting for 62% globally, are China (26%), the United States (13%), the European Union (about 9%), India (7%), the Russian Federation (5%) and Japan (almost 3%). Three of which showed a decrease in GHG emissions in 2019, namely the European Union (140 MtCO2 eq or -3.0%), the United States (110 MtCO2 eq or -1.7%) and Japan (20 MtCO2 eq or -1.6%). However, in the other three, GHG emissions
Figure S.1
Note: CO2 eq with GWPs from IPCC AR4
included in the EU totals discussed here. The UK’s shares in the EU-28 total greenhouse gas emissions, population and GDP in our data set in 2019 came to 11.7%, 13.4% and 13.9%, respectively.

PBL | 6
increased, namely in China (about 420 MtCO2 eq or +3.1%), India (about 50 MtCO2 eq or +1.4%) and the Russian Federation (20 MtCO2 eq or +0.9%) (ranked according to the largest absolute changes). Moreover, the 350 MtCO2 eq or +2.2% total increase in the rest of the world was almost as large as that of China.
Global CO2 emissions show smallest increase since 2015–2016 In 2019, global CO2 emissions increased by an estimated 350 MtCO2 or 0.9%, to a total of 38.0 GtCO2, to which notably China contributed most with an increase of 3.4% (about 380 MtCO2). The other largest absolute increases of about 50 MtCO2 were seen in both Vietnam +18.6%, Indonesia +8.0% and India +6.8%. These increases were partly counterbalanced by countries and regions that saw decreases in 2019, the largest of which are the United States with -2.8% and the European Union with -3.8% (both about 130 MtCO2) and Japan with -2.1%. The relatively small increase of 0.9% (in 2018: 2.4%) was due an 0.6% decline in coal consumption and a much lower 2.0% growth in natural gas consumption, after an erratically large increase of 5.0% in 2018. In 2019, global consumption of oil products continued to increase by a modest 0.8%. The decline in global coal consumption was mainly due to large decreases in the United States (15%) and the European Union (18%). Altogether, total global CO2 emissions from fossil-fuel combustion increased by 0.6% in 2019. The relatively small increase in CO2 emissions was aided by larger increases in non-fossil energy; nuclear power use increased by 3.2% in 2019 — the largest increase since 2004, hydropower increased by a modest 0.8% and other renewable sources combined (mainly wind and solar power) increased by 12.2% in 2019. Since 2012, global annual growth in CO2 emissions slowed down to about 1.5% and, in 2015 and 2016, CO2 emissions remained flat. Then, in 2017, global CO2 emissions started to increase again; by 1.4% in 2017, 2.4% in 2018 and 0.9% in 2019. This rebound was mainly due to a new rise in global coal consumption of 1.0% in 2017 and 1.7% in 2018, after three years of decreases (-0.2%, -2.4% and -1.9%). This three-year decline in global coal consumption was caused by three years of decreasing coal consumption in China, the United States and the European Union.
Global CH4 emissions continued to increase with moderate 1.3% growth The growth rate for methane emissions in 2019 is estimated at 1.3%, to a total of 9.8 GtCO2 eq. This is somewhat below the 1.8% growth in 2018, and markedly higher than the growth rates in 2015 and 2016 (0.3% and 0.1%, respectively), but very similar to those in 2012, 2014 and 2017 (all around 1.4%), which is also the average annual growth rate since 2010 (Figure S.1). The largest sources of methane emissions are the production and transmission of fossil fuels (32% share) — with coal at 12%, oil at 9% and natural gas at 11% — and livestock (28%): when animals ruminate their feed, they emit considerable amounts of methane. Globally, cattle account for two thirds of the CH4 emitted by livestock, followed by buffalo (10%), sheep (7%) and goats (5%). The third largest source is human waste and waste water. Rice cultivation on flooded rice fields is another source where anaerobic decomposition of organic material also produces methane (see Table 2.1 for an overview of the largest sources). Sources that contributed the most to the 1.3% increase in global CH4 emissions in 2019 were (in decreasing order of absolute changes): coal production (+3.0%), livestock farming (+1.1%) — particularly non-dairy cattle (+1.4%) — natural gas production and transmission (+2.7%), accounting for three quarters of the total net increase in emissions. Countries that contributed most to the 1.3% growth were notably China (+2.2%) and the United States

PBL | 7
(+2.5%), with further increases seen in (in decreasing order of absolute changes): Indonesia, Brazil, Russian Federation, Pakistan and India. Decreases were notably seen in Turkey, Sudan, Canada, Venezuela, Germany and Zaire.
Global N2O and F-gas emissions continue to grow For 2019, the growth in global N2O emissions was estimated at 1.1%, to a total of 2.8 GtCO2 eq, which is similar to that since 2014, which saw growth rates of between 0.8% and 1.3%. The largest sources of N2O are in agriculture and account for about two thirds of the total. Main global sources are manure dropped in pastures, rangeland and paddocks (24%) and the use of synthetic nitrogen fertilisers (13%). Somewhat smaller sources are other crop-related emissions (from N-fixing crops, crop residues left on the fields and histosols5) (together 11%) and indirect N2O emissions related to NH3 emissions from agriculture (9%). The largest non-agricultural source is fuel combustion (11%, or 17% when including indirect emissions from NOx emissions) (see Table 2.1 for an overview of the largest sources). For 2019, the growth in global N2O emissions was estimated at 1.1%, to a total of 2.8 GtCO2 eq, which is similar to the annual average since 2014, which saw growth rates of between 0.8% and 1.3% (Figure 2.5). Sources that contributed the most to the increase in 2019 were (in decreasing order of absolute changes): synthetic nitrogen fertilisers (+2.7%), manure dropped in pastures, rangeland and paddocks (+1.3%), indirect N2O from agriculture (+2.1%) and other agricultural sources (+1.1%), accounting for more than three quarters of the total net increase in emissions. The countries with the largest N2O increases in 2019 were (in decreasing order of absolute changes): Brazil (+2.9%), Australia (+5.9%), China (+0.9%), India (+1.6%) and the Russian Federation (+2.1%). Countries with degreasing emissions in 2019 were notably Sudan, followed by Zaire, the Central African Republic and the United States. F-gases, as a group of HFCs, PFCs and SF6, show the strongest emission growth with estimated annual global growth rates of 6.5%, on average, in the 2004–2014 period, and slowing down somewhat in the following years. For 2019, global total F-gas emissions were estimated to have increased by 3.8% to 1.75 GtCO2 eq, five times the emissions of 1990, which were estimated at 0.35 GtCO2 eq. The countries with the largest estimated F-gas increases in 2019 were notably the Russian Federation (+17%) and the United States (+1.9%), Turkey (+10%), China (+2.0%), Canada (+9%) and Japan (+3.1%). Countries with the largest decreases were notably France (-11%) and the United Kingdom (-6.4%), Germany (-1.4%), Lithuania (-14%) and Spain (-3.6%) (total trend for the EU-28 was -2.7%). It should be noted that the category of F-gas sources is very heterogeneous, with large differences in growth rates for the various constituents, and while reasonably accurate at a global level, emissions are often very uncertain at country level and, per gas, of the order of 100% or more, due to the methodology used for EDGAR v4.2 FT2019, which, for the years up to 2010, mainly relies on top-down estimates distributed among individual countries using various proxies.
Impact of COVID-19 policies on 2020 emission trends Several recent studies estimate the impact of COVID-19 policies on global energy-related CO2 emissions in 2020, but, to date, only few studies concern the impact of non-CO2 greenhouse gas emissions in 2020. Therefore, for a broader historical perspective and to
5 Histosol is a soil consisting primarily of organic materials, such as peat. These types of soils often have poor drainage.

PBL | 8
illustrate the impact of global recessions on all global greenhouse gas emissions, we analysed the impact of past global recessions on all these emissions using the EDGAR v5.0 FT2019 data set, which spans a period of 50 years. Historically, since 1970, for the three main greenhouse gases CO2, CH4 and N2O, their average annual growth during global recession years was 0.0%, -0.7% and 0.1%, respectively, whereas in other years, average annual growth was 2.7%, 1.4% and 1.3%. In an average ‘normal’ year, this translates into a total GHG emission growth of 2.4% versus 0% change in an ‘average’ recession year. Thus, the relative impact of past recessions for these three gases was -2.7%, -2.1% and -1.2%, in percentage points of annual change, on average, whereas the average impact on annual change in global GDP was -2.2%. In absolute percentages, the only global recession year since 1970 with a negative global GDP change was 2009 (-0.7%), when global emissions also saw negative changes in CO2, CH4 and N2O of -1.2%, -0.4% and -0.5%, respectively. However, global total GHG emissions also saw negative annual changes in several other years, with the largest decreases in 1981 for CO2 (-1.9%) and CH4 (-5.0%), in 1980 for N2O (-1.9%) and in 1982 for F-gases (-4.4%).
Methodology Calculations were based on the EDGAR database version v5.0 FT2019 for CO2 from the use of fossil fuel and carbonates (e.g. in cement clinker production and lime production) (Crippa et al., 2020)3, mainly based on IEA energy statistics (IEA, 2019). EDGAR version v5.0 was also used for methane and nitrous oxide, mainly based on various international statistics, including the FAO agricultural statistics (see Annex I in Crippa et al., 2019)6. The EDGAR v5.0 database covers the years 1970–2015 and includes comprehensive activity statistics and emission factor data up to 2015. For this report, we used the EDGAR v4.2 FT2010 data set for F-gases, since a comprehensive and consistent new data set for all F-gases was not yet available. For CO2 emissions in 2016, 2017, 2018 and 2019, a fast-track (FT) method was used as described in Olivier et al. (2017) and reported in Crippa et al. (2020). For 2016 and 2017, CO2 emissions from fossil-fuel combustion, national trends in coal, oil product and natural gas consumption were based on the latest detailed IEA statistics on 2016 and 2017 (IEA, 2019). For 2018 and 2019, FT estimates were based on the latest BP coal, oil and natural gas consumption statistics for the years from 2017 to 2019 (BP, 2020). For methane and nitrous oxide emissions over the 2016–2019 period, we mainly used a fast-track (FT) method for about 80% to 90% of global emissions, based on detailed agricultural statistics from FAO (CH4 and N2O), fuel production and transmission statistics from IEA and BP (CH4), for so-called Annex-I countries (industrialised countries under the UN Climate Convention) supplemented with data on coal production (CH4 recovery) and the production of chemicals (N2O abatement) (UNFCCC, 2020). For agricultural statistics, extrapolation was used for many sources where international statistics were not yet available for 2019. For F-gases, we used an FT method for Annex-I countries, for the most important gases and sources, using the reported emission trends for 2010–2019 (UNFCCC, 2020). For the remaining countries and years, for F-gases, we generally used extrapolation since international statistics were not available at the time7.
6 The EDGAR v5.0 data set does not include CH4 and N2O emissions from savannah burning. For our report, these emissions were added on the basis of the FAO data set for this source category. 7 This analysis is based primarily on GHG emission data (CO2 from fossil-fuel use and industrial processes, CH4, N2O and fluorinated gases), but excluding CO2 from land-use change, using data from EDGAR v5.0 FT2019. In general, for non-CO2 sources, updated international statistics from IEA (2019), BP (2020), USGS, FAO, IFA,

PBL | 9
We stress that the F-gas emissions, while reasonably accurate at a global level, are very uncertain on national levels, due to the methodology used for EDGAR v4.2 FT2010, which mainly relies on top-down estimates of the uses of F-gases distributed among individual countries using various proxies, and the methodology used for EDGAR v4.2 FT2019, which, for the years 2011–2019, mainly relies on trends in F-gas emissions per usage category reported by so-called Annex-I countries to the UN Climate Secretariat (mainly OECD countries and Central and Eastern European countries) and international production statistics on HCFC-22 and primary aluminium by technology type. We estimated uncertainties with two standard deviations for global emissions of ±6% for CO2
(excluding land-use change), ±25% for CH4, ±30% for N2O and ±20% for fluorinated gases, resulting in ±7% uncertainty for total global greenhouse gas emissions to which we added an extra ±1% to account for the uncertainty in the 2018–2019 trend in greenhouse gas emissions. These uncertainty ranges are consistent with those discussed in the Fifth Assessment Report of IPCC Working Group III.
Most comprehensive data set The EDGAR data set is the most comprehensive data set on global GHG emissions up to 2019, with detailed data on all GHG emission sources. Most other studies focus on CO2
emissions only, which make up around three quarters of total GHG emissions, and/or show shorter historical time series.
IRRI, UNFCCC (CRF) and other sources were used to estimate the trends for 2015–2019 emissions of CH4 and N2O, and UNFCC (CRF) and IAI and UNFCCC (CRF) for F-gases. For more details on the methodologies and data sources used for CO2 emissions, please see Annex I in Crippa et al. (2020).

PBL | 10
1 Introduction This report presents recent trends, up to 2020, in greenhouse gas (GHG) emissions, for both carbon dioxide (CO2) and non-CO2 GHG emissions. We calculated these emissions based on the EDGAR database version 5.0 for CO2 from fossil-fuel use and carbonate uses (such as cement clinker production and lime production) (Crippa et al., 2020), mainly based on the IEA energy statistics (IEA, 2017), and the latest version 5.0 for methane (CH4) and nitrous oxide (N2O) (Crippa et al., 2019). The EDGAR v5.0 database for greenhouse gases covers the years 1970-2015 and includes comprehensive activity statistics and emission factor data up to 2015. For 2016, 2017, 2018 and 2019 a fast-track (FT) method was used for CO2 emissions (as described in Olivier et al., 2017 and Crippa et al., 2020). For CO2 emissions from fossil-fuel combustion, the 2016 and 2017 emissions were based on the 2016/2015 and 2017/2016 trends by main fossil-fuel type and country in IEA (2019)8 and the 2017 and 2018 emissions were based on the 2017-2018-2019 trends in coal, oil and natural gas consumption by country in BP (2020). For the methane (CH4) and nitrous oxide (N2O) emissions from 2016 to 2019, we mainly used a fast-track method for about 80% to 90% of their global emissions9. For F-gases we used in this report the EDGAR v4.2 FT2010 data set that covers the years 1970-2010, since a new comprehensive and consistent data set for all F-gases is not yet available. For later years we used a fast-track method for so-called Annex-I countries (industrialised countries under the UN Climate Convention), using reported emission trends in the most important F-gases and sources for 2010-2018 (UNFCCC, 2020). For the remaining countries and years, we generally used for F-gases extrapolation since international statistics are not available. This also applies to most CH4 and N2O emissions in 2019. An exception are CH4 emissions in 2019 for fossil-fuel production for which IEA and/or BP statistics are available and for harvested area in rice cultivation for which for the top-6 countries data for 2019 were available. Please note that the EDGAR v5.0 data set does not cover CH4 and N2O emissions from savannah burning. Therefore, for this report the EDGAR v5.0 emission data were completed to cover all sources of anthropogenic GHG emissions (except for those from land-use change) with the data set on CH4 and N2O emissions from savannah burning up to 2017, as reported by the Food and Agriculture Organization (FAO)10.
8 This IEA data set was the most recent available at the time of this study. Later this year the new version IEA (2020e) has been released covering energy statistics and CO2 emissions up to and including 2018. 9 This analysis is based primarily on GHG emission data (CO2 from fossil-fuel use and industrial processes, CH4, N2O and fluorinated gases), but excluding CO2 from land-use change, using data from EDGAR v5.0 GHG FT2019 except for F-gases. Version v5.0 includes new statistics and several revisions to previous years. In general, for non-CO2 sources, we used updated international statistics from IEA, BP, USGS, FAO, IFA, IRRI, UNFCCC (CRF) and other sources to estimate the trends for 2015–2019 emissions of CH4, N2O and F-gases. For more details on the methodologies and data sources used for v5.0, please see Annex I in Crippa et al. (2019), Olivier et al. (2017), and see Maenhout et al. (2019) for a description of methods and data sources used in v4.3.2, also largely used in v5.0. 10 The UN Food and Agriculture Organization (FAO) has compiled data on savannah burning emissions, for 1990–2017, using data on monthly burned area, per 0.25ox0.25o grid cell, for five land-cover types from the GFED4.1s data set (Van der Werf et al., 2017), multiplied by biomass consumption per hectare and tier 1 emission factors from IPCC (2006), aggregated at country level. The GFED data cover the 1996–2020 period. For the years before 1996, FAO used the average of the 1996 to 2014 values. For details, see (a) Data set Information at http://fenixservices.fao.org/faostat/static/documents/GH/GH_e.pdf, (b) Metadata at http://www.fao.org/faostat/en/#data/GH/metadata.

PBL | 11
We stress that the F-gas emissions, while reasonably accurate at global level, are very uncertain at country level, due to the methodology used for EDGAR v4.2 FT2010, that mainly relies on top-down estimates distributed to individual countries using various proxies. With a share of well over 25% non-CO2 emissions constitute a significant fraction of global GHG emissions. For climate policies, this refers to methane (CH4), nitrous oxide (N2O) and the so-called F-gases (HFCs, PFCs, SF6 and NF3). To our knowledge, this report is the first to provide estimates of total global GHG emissions including 2019, based on detailed activity data on most of the sources for these years, whereas the 2016-2019 figures we estimated using a Fast-Track approach11. For global net CO2 emissions from land-use change (LUC), we used data recently generated in the Global Carbon Project (GCP) (Houghton et al., 2012) through 2015 (Houghton and Nassikas, 2017), which include data on CO2 emissions from forest and peat fires, from the Global Fire Emissions Database version GFED4.1s through 2019 (Van der Werf et al., 2017)12. Those data are inherently very uncertain and therefore typically not included in emission totals of countries (e.g. as reported by countries under the UN Climate Convention) (UNFCCC, 2011). For the comprehensive overview of all GHG emissions and removals, we included them in the main figure (Figure 2.1) to illustrate their share in overall, total global anthropogenic GHG emissions. However, discussions on emission data focus on those derived from the EDGAR database, which excludes LUC emissions. For more information on this subject, we refer to the Global Carbon Project (2020) and its new 2020 release. In addition to the global trends, the focus of this report is also on the top 5 emitting countries and the European Union as a whole, and on the global total and the countries that were largely responsible for the global emissions changes in 2019. Uncertainty about non-CO2 emission data is typically much larger than about CO2 emissions (excluding forest and other land-use-related emissions, ‘LUC’). This is because these sources are much more diverse and emissions are determined by technological or other source-specific factors, whereas for CO2, the emission factors are mainly determined by characteristics of the fossil-fuel type and carbon content of fuels and carbonates. Chapter 2 discusses the global emission trends, focusing on trends in emissions and drivers in the present decade (2010-2019). Firstly, we discuss the most important variables driving the volume of the GHG sources and which of those are covered by the international statistics used for our fast-track emission estimates, for the years 2016 to 2019. Section 2.1 discusses the global total GHG emissions, with a focus on CO2 and on the group of non-CO2 greenhouse gases and their relation with GDP. Section 2.2 presents the main trends in CO2 emissions, showing key trends in the use of main fossil fuels and cement production in the largest countries. Section 2.3 discusses the main trends in non-CO2 GHG emissions and the recent trends in key drivers of these emissions in the largest countries: fossil-fuel production, cattle stock, rice cultivation (drivers for CH4), and the use of synthetic fertilisers and manure used as fertiliser (drivers for N2O).
11 Other work on historical time series of anthropogenic GHG emissions, up to 2005 or 2014, includes US Environmental Protection Agency (EPA) on global non-CO2 greenhouse gas emissions for 1990–2005 (US EPA, 2012); the CAIT database for greenhouse gas emissions for 1990-2014, compiled by the WRI (2016); and the PRIMAP-hist data set for 1850–2017, developed at the Potsdam Institute for Climate Impact Research (PIK) (Gütschow et al., 2019). 12 The H&N time series was extended for 2016 to 2019 with preliminary numbers based on fire counts through 2019: for 2016 to 2018 numbers from GBC2019v1 (2019) and our own estimate for 2019 based on numbers from GFED4.1s (selected figure is similar to 1998 and 2015). Total LULUCF emissions presented here includes 0.2 GtCO2 eq for fire emissions from CH4 and N2O taken from the GFED 4.1s data set (also preliminary numbers based on fire counts).

PBL | 12
Chapter 3 provides more detailed information on the five largest emitting countries and the European Union, using the same approach as in Sections 2.1 to 2.3. The 2017 report provides more details on the methodology used for estimating non-CO2 emissions (Olivier et al., 2017), in Box 1.1 and Appendix D of that report. That report also discusses the quality and completeness of CH4 and N2O emission data by comparing emissions in the former EDGAR data set v4.3.2 with total CH4 and N2O emissions from the officially reported national emissions. For more information on the uncertainty in global greenhouse gas emissions we refer to Olivier and Peters (2012) for CO2 emissions and Appendix 1 of UNEP (2012) for the other greenhouse gases.

PBL | 13
2 Trends in global emissions
2.1 Introduction
Our analysis focuses on the identification of key trends and the main direct drivers that determine the changes in the quantity of CO2, CH4 and N2O emissions, both globally and for the five largest emitting countries and the European Union as a whole. These gases, currently, contribute a respective 73%, 19% and 5% to global total GHG emissions excluding land use, with F-gases accounting for the remaining 3% (CO2 contributes 74% when including 7 percentage points on average from land-use change, and CH4 then contributes about 17%). Table 2.1 summarises the main drivers of emissions and their share in global emissions. For the smaller remaining sources, also proxies have been used (e.g. statistics for other livestock) or trend extrapolation (e.g. average of the trend in three recent years, e.g.
Table 2.1 Key drivers of GHG emissions (excluding land use) and global shares Type of
gas Share gas
in GHG Main source drivers/ Other source drivers
Share in gas total
Year of statistics
CO2 72% Coal combustion 39% 2019
Oil combustion 31% 2019
Natural gas combustion 18% 2019
Cement clinker production 4% 2018
Subtotal drivers of CO2 92%
CH4 19% Cattle (rumination and droppings) 21% 2018
Rice cultivation (area harvested) 10% 2018/19
Natural gas production (including distribution) 14% 2019
Oil production (including associated gas venting) 9% 2019
Coal mining 10% 2019
Landfill: municipal solid waste generation ~ food consumption 10% 2018**
Waste water 11% 2018**
Subtotal drivers of CH4 85%
N2O 6% Cattle (droppings on pasture, range and paddock) * 23% 2018
Synthetic fertilisers (N content) * 13% 2017
Animal manure applied to soils * 5% 2018
Crops (share of N-fixing crops, crop residues and histosols) 11% 2017/18
Fossil-fuel combustion 11% 2019
Manure management (confined) 4% 2018
Indirect: atmospheric deposition & leaching and run-off (NH3)* 9% 2017/18
Indirect: atmospheric deposition (NOx from fuel combustion) 7% 2017/18
Subtotal drivers of N2O, incl. other, related drivers (*) 83%
F-gases 3% HFC use (emissions in CO2 eq) 61% NA/2018 **
HFC-23 from HCFC-22 production (emissions in CO2 eq) 22% NA/2018 **
SF6 use (emissions in CO2 eq) 14% NA/2018 **
PFC use and by-product (emissions in CO2 eq) 3% NA/2018 **
Subtotal drivers of F-gases 100%
* Activity data compiled by FAO cf. IPCC source category definitions. ** Statistics for Annex-I countries only, reporting annually to UNFCCC (CRF files): up to year t-2 (i.e. in 2020: 2018). Sources: EDGAR v5.0 for CO2, CH4 and N2O (1970–2015); EDGARv4.2 FT2010 for F-gases (1970–2010); Fast Track to 2019 for all gases.

PBL | 14
for landfills and waste water). For details, see Olivier et al. (2017). As we only use the fast-track methodology based on indicators of volume trends for estimating the emissions in the last four years (at maximum), we assume that these non-volume effects impacting emissions, such as changes in feed and food, are relatively small on a year-by-year basis. Most of these changes are not further discussed in this report. For more information on this we refer to the detailed National Inventory Reports that are submitted annually by most industrialised countries to the UN Climate Secretariat (UNFCCC, 2020). The direct drivers of CO2 are the combustion of coal, oil and natural gas, representing 89% of global CO2 emissions, with respective shares of 39%, 31% and 18%. Calcination in cement clinker production accounts for another 4% (Table 2.1). Fossil-fuel-related CO2 emissions can only be significantly reduced by switching to other energy sources, notably renewable sources such as hydropower, wind, solar and sustainably produced biofuels, or to nuclear power. Additional reductions may be achieved through energy-efficiency improvements. Furthermore, CO2 capture from flue gases and storage underground (CCS) may contribute to reducing the seemingly ever-increasing CO2 concentrations in the atmosphere (Global CCS Institute, 2020). For CH4, there are three large groups of sources: agriculture, fossil-fuel production and waste/waste water. In agriculture, ruminant livestock, particularly cattle, and rice production are the largest global sources. With a share of three quarters of all ruminant-related CH4 emissions (31%), those from cattle alone are responsible for 21% of current global CH4 emissions. Rice cultivation on flooded rice fields is another agricultural source, where anaerobic decomposition of organic material produces methane, accounting for 10% of CH4 emissions. Other large CH4 sources are coal production, natural gas production and transmission as well as oil production (including vented associated gas that consists mostly of CH4, if it cannot be utilised). Together, fossil-fuel production and transmission account for another third of global methane emissions, with each fuel having roughly equal share. The third largest source is human waste and waste water. These are other sources where anaerobic decomposition of organic material produces methane. When biomass waste in landfills and organic substances in domestic and industrial waste water are decomposed by bacteria in anaerobic conditions, substantial amounts of methane are generated. Landfill and waste water are both estimated at shares of about 10%. For these emissions, food supply as a driver would be a good indicator; however, FAO statistics on food balances are lagging several years behind (Table 2.1). For N2O, agricultural activities are the main emission source, with a share of almost 65%. The animal droppings on pastures, rangeland and paddocks are by far the largest global source of nitrous oxide, with an estimated share of 23%, and the use of synthetic nitrogen fertiliser is the second-largest source, accounting for 13%, at present. Indirect N2O emissions from agricultural activities contribute another 9%. Together, these sources account for 50% of global emissions, including 4% from animal manure applied to agricultural soils as fertiliser (Table 2.1). F-gas emissions consist of HFCs, PFCs, SF6 and NF3. With a share of almost three-quarters, emissions from the use of these gases are by far the largest source. Other sources are inadvertent by-product emissions of HFC-23 during the production of HCFC-22 and PFCs emissions that arise from primary aluminium production. At present emissions of HFCs and SF6 are the largest global sources of fluorinated gases with shares of 81% and 13% (PFCs only 6%). Total F-gas emissions from the use of these gases, in particular HFCs, have substantially increased since 2005 with about 4% per year, as industrialised countries show

PBL | 15
in their detailed GHG emission trend reports through 2018 (UNFCCC, 2020). This is an important source of data for F-gases, as there are no global statistics for their use and emissions. We recall the very large uncertainties in F-gas emissions at country level (see introduction of Appendix B). Other than by reducing the volumes of livestock and fertilisers used, CH4 and N2O emissions may also be partly reduced by changes in animal feed, optimising nitrogen fertiliser use on arable land, and changes in human food preferences for meat, fish and vegetables, and reduction in losses over the entire food chain, from primary production by farmers to final consumption. Moreover, methane generated in fossil-fuel production and in landfill and waste water may be reduced by recovering CH4 and either use it as biogas for energy purposes or by flaring it.
2.2 Global trends in total greenhouse gas emissions
In 2019, the growth in total global greenhouse gas (GHG) emissions (excluding those from land-use change) continued at a rate of 1.1% (±1%), reaching 52.4 gigatonnes of CO2 equivalent13 14 (GtCO2 eq) (with a 95% uncertainty range of ±8%15). Although the 1.1% growth is half that of 2018, it is a continuation of the average annual growth rate of 1.1% since 2012, which is markedly lower than the growth rates seen in the first decade of this century (2.6% on average) (Figure 2.1). Among the countries that contributed most to the 1.1% global increase (about 570 MtCO2 eq), China stands out with an increase of about 420 MtCO2 eq (+3.1%), followed by about 50 MtCO2 eq in both Indonesia (+5.5%), Vietnam (+12.8%) and India (+1.4%). These increases were partly counterbalanced by countries with decreasing GHG emissions, in particular in the European Union (-3.0%) and the United States (-1.7%) and also in Japan and South Korea. The 2019 global GHG emissions amounted to 57.4 GtCO2 eq (±10%) when also including those from land-use change (which are estimated at a very uncertain 5.0 GtCO2 eq (±50%)), representing an estimated increase of 70% compared to 2018. This increase occurred while global economic growth in 2019 was 2.8%, which is somewhat lower than the 3.7% growth in global Gross Domestic Product (GDP) in 2017 and 3.5% in 2018. The 2019 GHG emissions excluding those from land-use change are about 59% higher than in 1990 and 44% higher than in 2000. Global temperatures in 2019 The year 2019 was the second warmest year in the 140-year record with global land and ocean surface temperatures +0.95 oC higher than average. This is only 0.04 oC below the record of +0.99 oC set in 2016. The 5 warmest years since 1880 have all occurred since 2015 and 9 of the 10 warmest years have occurred since 2005. The year began with a
13 We use in this report for CH4, N2O and the F-gases the Global Warming Potential (GWP) metric from the Fourth Assessment Report (AR4) of the IPCC (2007), which is also used by industrialised countries in their annual national emissions inventory reports submitted to the UNFCCC (so-called Annex I countries). The time horizon of the GWPs used is 100 years. Please note that developing countries officially report their emissions using GWPs from the Second Assessment Report (SAR) of the IPCC. The largest difference is in the GWP of CH4: the GWP value is 25 in the AR4 and 21 in the SAR, so almost one fifth larger. 14 The historical EDGAR GHG emission trends in this report are also presented in UNEP’s Emissions Gap Report 2020, (UNEP, 2020). 15 We included uncertainties with two standard deviations for global emissions of ±6% for CO2 (excluding LUC),
±25% for CH4,±30% for N2O and ±20% for fluorinated gases (UNEP, 2012), resulting in 7% uncertainty and added an extra ±1% to account for the uncertainty in the 2018-2019 GHG emissions trend. The presented uncertainty ranges are consistent with those presented in Appendix 1 of UNEP’s Emissions Gap Report of 2012 (UNEP, 2012) and IPCC AR5 (Blanco et al., 2014).

PBL | 16
Box 2.1 Regional temperatures in 2019
weak-to-moderate El Niño, changing to ENSO (El Niño–Southern Oscillation) neutral conditions by July. During the year, monthly temperatures ranked among the five warmest on record for their respective months, with record highs for the months of June and July. The year 2019 was characterised by warmer-than-average conditions across most of global land and ocean surfaces. Record high annual land surface temperatures were measured across parts of central Europe, Asia, Australia and New Zealand, southern Africa, North America and eastern South America. The annual emission growth rate of 1.1% in 2019 equals average growth since 2012, when the average annual greenhouse gas emission growth was also 1.1% (Figure 2.2). In 2003,
United States In the contiguous United States, the average annual temperature was 0.7 °F (0.4 °C) above the 20th century average. This ranked among the warmest third of the 125-year record and was the coldest year since 2014. For the United States, the number of cooling degree days (CDD) — an indicator for the demand for air-conditioning — in 2019 was the third highest since 1950: only 5% lower than in 2018, which saw record high CDDs, but 9% higher than the average over the last two decades. Similarly, the number of heating degree days (HDD) — indicator for the demand for space heating — in 2019 was only 0.7% higher than in 2018 and than the average over the last 20 years.
European Union Following the EU's record warm year 2018, the year 2019 was also very warm, ranking as the second warmest on record and just 0.04 °C cooler than 2018. The years 2014 through 2019 all rank among the EU's six warmest years on record. According to the World Meteorological Organization (WMO), Belgium, Germany, Luxembourg, the Netherlands, and the United Kingdom set new national July temperature records. The Netherlands observed its highest February maximum temperature since national records began in 1901: on 26 February 2019, maximum temperatures reached 18.9 °C in De Bilt. The Netherlands' new national all-time maximum temperature of 40.7 °C set on 25 July in Gilze-Rijen surpassed a 75-year-old record of 38.8 °C set in August 1944 by 0.5 °C. This marked the first time that temperatures exceeded 40.0 °C in the Netherlands.
Heating Degree Days That the warmest years globally are concentrated in recent years rather than more evenly distributed over time is also confirmed by the annual number of Heating Degree Days (HDDs) in the United States and the European Union, which is used as estimator of the demand for space heating, and the number of Cooling Degree Days in the United States, which is used to estimate the electricity demand for air conditioning (see Sections 3.2 and 3.3).
Peak in forest fire emissions According to preliminary data for 2019 from the Global Fire Emissions Database version GFED4.1s, much dryer weather conditions caused the global emissions from forest fires in 2019 to be 70% higher than in 2018 (Van der Werf et al., 2017). The 2019 emissions are comparable with peaking emissions in 2015 and 1998. However, large differences were observed in different regions, in particular in Australia, where temperate forest fires in 2019 were 20-fold those of 2017 and 2018.

PBL | 17
global greenhouse gas emission growth accelerated to 4.0% and remained high through 2007 (the average increase was 3.6% over these years), which was related to the fast industrialisation of China, since the country became a member of the World Trade Organization (WTO) (Figure 2.1). Please note that the last global economic crisis was in 2008 and 2009 with global emissions increasing by+0.6% and +5.1% and in 2010 by +3.1%. This brings the average annual global growth in greenhouse gas emissions over the whole 2004–2011 period at 2.9%. Our analysis of recent trends in emissions and drivers focuses on the 2010–2019 period and includes the first decade of this century, for a broader perspective.
Figure 2.1
Note: CO2 eq with GWPs from IPCC AR4 The slowdown of the growth in global greenhouse gas emissions, since 2012, has continued in recent years, after the very low growth of 0.3% in both 2015 and 2016, with growth rates in 2017 and 2018 that are presently estimated at 1.5% and 2.2% (this was 1.3% in 2017 and 3.0% in our previous report (Olivier and Peters, 2020)). In the last three decades of the 20th century, the average global GHG emission increase of 1.3% per year was mainly driven by the 1.6% average annual growth in CO2 emissions since 1970. Thus, apart from short interruptions in years of global recessions, global GHG emissions have been increasing steadily in the decades since, e.g. from 24.5 gigatonnes in CO2 equivalent (GtCO2 eq) in 1970, via 33.1 GtCO2 eq in 1990 to 37.2 GtCO2 eq in 2002. Subsequently, in the next decade global emissions accelerated annual growth of 2.9% on average led to 48.0 GtCO2 eq in 2011, after which emissions increased at a much slower rate of 1.1% on average to the present 52.4 GtCO2 eq in 2019. Note that for climate policy purposes the emissions in 1990 are relevant as it is the default base year for the UN Climate Convention, 2005 is the base year for some national targets (such as for the European Union), further 2010 (more precisely the average of 2008-2012) was the target year for the first commitment period of the Kyoto Protocol. Further analysis

PBL | 18
may show the extent to which recent global and national GHG trends estimated in this report are in keeping with the total national GHG emission trends as expected from analyses of pledges of countries under the Paris Agreement (see UNEP, 2020; Miosio et al., 2020; Dafnomilis et al., 2020; PBL, 2020).
Annual change in global GDP, energy supply and total GHG emissions Figure 2.2 shows annual changes, for the 2001–2019 period, in global Gross Domestic Product (GDP), Total Primary Energy Supply (TPES)16 and global emissions of total greenhouse gases and for each individual gas (but aggregating the fluorinated gases in one group, the so-called F-gases). It shows that, while the average annual growth in the world economy has been fairly constant since 2010, annual growth in total greenhouse gas emissions saw a distinct drop to 0.3% in both 2015 and 2016. Conversely, in the aftermath of the global economic crisis of 2008–2009, 2011 saw a large annual growth in global greenhouse gas emissions of 3.1%, whereas global GDP showed only a slightly elevated annual growth (3.8%). In 2019, the relatively small increase in global greenhouse gas emissions of 1.1% was accompanied by relatively low GDP growth of 2.8%, compared to the average annual growth of 3.3% for all years since 2011. Annual CO2 emissions growth in this decade (1.2%) was very similar to the increase in annual total greenhouse gas emissions (1.3%), but lower than the average annual increase in TPES (1.6% on average). For individual years, the difference in percentage between CO2 and TPES growth has varied, since 2011, between -1.4 and +0.5 percentage points. A comparison with annual changes in generated hydropower shows that top years for hydropower (e.g. 2013 and 2016) often correspond with smaller increases in CO2 emission levels. For non-CO2 emissions, the annual increases were higher than for CO2, for most years since 2014 (0.5 percentage points higher, on average), except for 2018. Note that, among the non-CO2 gases, the share of methane in total non-CO2 gases is two thirds. Furthermore, globally, the annual increases in GDP and non-CO2 emissions were not well correlated, although, for all years and periods shown, as a rule the emission changes were somewhat smaller, in percentages, than the changes in GDP.
Figure 2.2
16 In this report, the BP definition of TPES is used as reported by BP (BP, 2020), which uses a substitution method for nuclear, hydropower and other non-biomass renewable energy that assumes one conversion efficiency in all these cases, which is year-dependent and increases from 36% in 2000 to 40.4% in 2019. Since BP’s data do not include the use of traditional biofuels, the amount used as primary solid biomass has been added using IEA data (total use minus the use in power generation) (IEA, 2020d).
PBL | 19
When looking at the separate greenhouse gases, we can see which gases were mainly responsible for the total GHG trend in this decade (Figure 2.2). It shows that the 13% increase in global GHG emissions in 2019 compared to 2010 is due mainly to a 12% increase in CO2 and CH4 and an almost 50% increase in F-gas emissions. The GHG emissions increase in 2019 of 1.1% was mainly due to a 0.9% increase in global CO2 emissions from fossil-fuel combustion and those from industrial non-combustion processes including cement production, which contribute almost two thirds to total GHG increase in 2019, but also non-CO2 emissions retained their relatively large annual increase of 1.6% in 2019, aided by the 1.3% increase in CH4 and 3.8% in F-gases. In contrast, the low global GHG emission growth in 2015 and 2016 of about 0.3% is mainly due to null or near null CO2 growth in these years, which is mainly caused by declining global coal consumption, notably in China, and relatively large declines in the United States (in 2015) and the European Union (in 2016). The emissions of the other greenhouse gases CH4, N2O and F-gases increased in 2019 by 1.3%, 0.8% and 3.8%, respectively. Although most of global GHG emissions consist of CO2
(about 73%), methane, nitrous oxide and fluorinated gases (so-called F-gases) also make up significant shares (19%, 5% and 3%, respectively). From the shares and increases in 2015 and 2016 we can infer that it was mainly the low 0.3% and 0.2% changes in CH4 emissions that caused the lower annual growth of 0.3% of total non-CO2 greenhouse gases in 2015 and 2016. These percentages for the share in total GHG emissions do not include net emissions from land use, land-use change and forestry (LULUCF), which are usually accounted for separately, because they are inherently very uncertain and show large interannual variations that reflect the periodically occurring strong El Niňo years, such as in 1997–1998 and 2015–2016, as shown by the grey area above the dashed line in Figure 2.1. When including LULUCF emissions — for 2019 estimated at about 5.0 GtCO2 eq — estimated global total GHG emissions come to 57.4 GtCO2 eq. in 2019.
Increase in the concentration of atmospheric CO2 among the highest in recent years During the year 2019, the CO2 concentration in the atmosphere at Mauna Loa (Hawaii) saw a net increase of 2.46 ppm and the annual mean reached 411.4 (±0.12) ppm. For comparison: just four years ago, 2015 passed the 400 ppm level with an annual mean of 400.8 ppm. However, in the years since 1959, the uncertainty ranges of the increases overlap in the years with the largest increases (2018, 2016, 2015 and 1998) (NOAA/ESRL, 2020). The annual increase in CO2 in the atmosphere was mainly driven by the dozens of gigatonnes in CO2 emissions from fossil-fuel combustion and those from calcination of carbonates found in limestone, when used to produce lime or cement clinker and by CO2 emissions from large-scale forest fires, whereas the net increase in atmospheric CO2 was also strongly mitigated by the net carbon uptake by the oceans and growing vegetation. Thus, there is no one-to-one relationship between the net increase in annual mean CO2 concentrations and annual CO2 emissions from fossil fuels and carbonates.
2.3 Global trends in CO2 emissions
In 2019, global CO2 emissions increased by an estimated 350 MtCO2 or 0.9% to a level of 38.0 GtCO2, to which notably China contributed most with an increase of 3.4% (about 380 MtCO2). The other largest absolute increases of about 50 MtCO2 were seen in both Vietnam (+18.6%), Indonesia (+8.0%) and India (+6.8%). These increases were partly counterbalanced by countries that saw decreases in 2019, the largest of which were the

PBL | 20
United States (-2.8%) and the European Union (-3.8%) (both about 130 MtCO2) and Japan (-2.1%). Within the EU-28, decreases were notably seen (in decreasing order of absolute changes) in Germany (-6.5%) and also in Poland (-4.4%), Spain (-4.6%), Italy (-2.8%) and the United Kingdom (-2.3%). Table 2.2 provides an overview of CO2 sources and their shares in global emissions. Fossil-fuel combustion contributes the lion’s share of almost 89%, of which electricity generation is the largest sector with almost 36% followed by industries and road transport, each with about 16% to 17%. Looking at the global shares of coal, oil and natural gas in total CO2 emissions from fossil-fuel combustion, in 2019, coal had a share of 44%, oil 35% and natural gas 22%, whereas their shares in total fossil-fuel consumption were 32%, 39% and 29%, respectively. Differences between the share in energy use and in CO2 emissions from fossil-fuel combustion are due to the fact that coal emits about twice as much CO2 per Joule than natural gas does, and oil is somewhere in between the two.
Table 2.2 Sources of CO2 emissions and their global shares in 2019 Source of CO2 Share
Electricity and heat generation 35.8% Manufacturing industries 16.7% Road transport 15.9% Buildings (houses, offices, etc.) 8.7% Other national fuel combustion 7.9% International transport (by air & water) 3.6% Total fossil-fuel combustion 88.6% of which:
- coal combustion 43.8% - oil combustion 34.6% - natural gas combustion 21.6%
Non-energy use of fuels 4.4% Cement clinker production 4.0% Other carbonate use 1.2% Carbon losses in coke ovens etc. 1.1% Associated gas flaring 0.8% Total other CO2 sources 11.4%
Source: EDGAR 5.0 FT2019 Of the remaining 11% emitted from other sources than fuel combustion, there are two that emit more than 4%, namely non-energy use of fuels (e.g. as chemical feedstock for the production of ammonia and other chemicals such as ethylene) and cement clinker production. Fossil-fuel combustion and these two other sources are the main sources that contribute most to the change in annual emissions, on both global and national levels. Thus, key indicators for the trend in CO2 emissions are the consumption of Total Primary Energy Supply (TPES), in particular the consumption of coal, oil and natural gas (versus renewable and nuclear energy) and cement production. Using the fast-track method for 2016–2019, fossil-fuel trends in coal, oil and natural gas in 2016 and 2017 were obtained from updated statistics by the International Energy Agency (IEA, 2019) that cover all years up to 2017, and the updated but more aggregated BP statistics for the trends in 2018 and 2019 (BP, 2020). Our estimate for global CO2 emissions from fossil-fuel combustion in 2019 of 33.7 GtCO2 is rather close to the 33.3 and 33.2 GtCO2

PBL | 21
estimated by the International Energy Agency earlier this year (IEA, 2020a, 2020b), when taking into account that we used BP (2020) data for the fossil-fuel consumption trends in 2018 and 2019. The revised global total CO2 emissions are slightly higher than in last year’s report, from +0.0 Gt in 1990 (+0.2%) to +0.1 Gt from 2000 to 2012 (+0.4%), slightly smaller in 2013 to 2015 (-0.2%) and -0.4% in 2016, no revision for 2017 and +0.1 Gt in 2018 (+0.4%).
The long-term emission trend from 1970 onwards In the 1970–2003 period, global CO2 emissions (excluding those from land-use change) increased by 1.6% per year, on average. From 2003 to 2011, the growth in emissions accelerated to 3.2% per year, on average, driven by China’s fast industrialisation since 2002, which was accompanied by large increases in energy consumption, in particular coal consumption. However, since 2012, global annual growth slowed down to about 1.5% per year and, in 2015 and 2016, CO2 emissions remained flat. In 2017, global CO2 emissions started to increase again; by 1.6% in 2017, 1.8% in 2018 and 1.3% in 2019. This rebound was mainly due to a new increase in global coal consumption of 0.4% in 2017 and 1.7% in 2018, after three years of decreases (-0.1%, -2.5% and -1.5%). This decline in global coal consumption was caused by three years of decreasing coal consumption in China and declines in the United States and the European Union, mainly from power plants switching to natural gas and increased global renewable power generation, in particular, wind and solar power.
Table 2.3 Trend indicators for annual change in global CO2 emissions Indicator Average 2001–11 Average 2012–16 2015 2016 2017 2018 2019
CO2 2.9% 0.7% 0.0% 0.1% 1.4% 2.4% 0.9% TPES* 2.4% 1.2% 0.7% 1.4% 1.7% 2.6% 1.2% 1A-Coal 4.5% -0.2% -2.4% -1.9% 1.0% 1.7% -0.6% 1A-Oil 1.5% 1.2% 2.3% 0.8% 1.2% 1.2% 0.8% 1A-Gas -3.4% 1.5% 1.6% 2.3% 2.1% 5.3% 2.0% Cement 7.4% 2.7% -2.2% 1.2% -1.0% -2.4% 5.1%
* Total Primary Energy Supply (TPES) data are from BP (2020), plus traditional biomass from IEA (2020d), since that is not included in the BP definition of TPES.
CO2 from fossil-fuel combustion In 2019, global coal consumption declined by 0.6%, following increases of 1.0% in 2016 and 1.7% in 2017 (Table 2.3), which was mainly due to large decreases in the United States (15%) and the European Union (18%) (notably in Germany (-21%) Spain (-55%) and Poland (-8%)) and a 5% decrease in South Korea. Collectively, these and other decreases were larger than total increases, notably those in China (+2.3%), Indonesia (+20%), Vietnam (+30%), Colombia (+63%) and other countries such as Morocco, India and Pakistan17 (BP, 2020). Coal-fired power plants are by far the largest consumers of coal. In 2019, the coal fleet grew more than in 2018. Nearly two thirds of newly commissioned capacity was in China, with the remaining third located mainly in India, Malaysia, Indonesia and Pakistan. The uptick was primarily due to an increase in newly installed power plants in China, the result of large permit-issuing rounds from 2014 to 2016. Outside China, the global coal fleet, overall, shrank for the second year, as retirements exceeded commissioning. Although commissioning increased in 2019, the pipeline for new commissioning is showing signs of a slowdown. New construction in 2019 decreased by two thirds, since 2015. For more details
17 This ranking according to the largest absolute changes, indicating change in percentages, is used throughout the report, in lists of countries or source categories.

PBL | 22
on new coal-fired power plants, those under construction, planned or retired, we refer to Shearer et al. (2020). Global consumption of oil products continued to increase by a modest 0.8% in 2019 (Table 2.3). The increase in global oil consumption was led by China (+5.0%), Iran (+10.8%) and India (+2.9%). Countries showing relatively large absolute decreases are Mexico (-5.5%), the United States (-0.3%), Pakistan (-11.4%), Italy (-4.4%), Taiwan (-5.0%), Japan ( -1.3%) and Venezuela (-11.9%) (BP, 2020).
Global natural gas consumption increased by only 2.0% in 2019, after an erratically large increase of 5.0% in 2018, which was led by the United States (+3.3%), China (+8.6%), Australia (+29.7%) and the European Union (+2.7%), in particular Spain, Germany, Italy and the Netherlands. Other countries that saw large increases in natural gas consumption are Bangladesh, Iraq and Mexico. Countries with relatively large absolute decreases were the Russian Federation (-2.2%), Japan (-6.6%), Venezuela (-16.3%) and Turkey (-8.5%). See Chapter 3, for more details on these countries and the European Union.
Together, total global CO2 emissions from fossil-fuel combustion increased by 0.6% in 2019. Global total emissions from cement clinker production and from non-energy use of fuels were estimated to increase by 5.1% and 3.3% in 2019. Together with other non-combustion sources, this explains the 0.9% increase in global total CO2 emissions in 2019.
For 2019, the difference with the larger global TPES increase of 1.3% (see Table 3.3) is due to the increase in non-fossil energy sources. The use of nuclear power increased by 3.2%, which was the largest increase since 2004, with the largest contributions by China (+18%), Japan (+33%), Belgium (+52%) and South Korea (+8.9%). The largest decreases were seen in France and the United Kingdom. Hydropower increased by a modest 0.8% in 2019, well below the long-term average increase of 2.0%, with the largest contributions in China, Turkey, India and Iran, while decreases were notably in the United States, the European Union, Vietnam and Norway. Other renewable energy comprises mainly wind and solar power (about two thirds), but also includes power generated from solid biomass waste and geothermal energy and modern biofuels in transport (BP, 2020). The use of these other renewable energy sources increased by 12.2% in 2019, with the largest contributors being China (+14%), the European Union (+8.2%), the United States (+5.9%) and Japan (+24%), and with smaller absolute increases seen in Brazil, Indonesia, Mexico and India. Within the EU-28, the largest contributors to the growth in 2019 were Germany, the United Kingdom, France, Sweden and the Netherlands (BP, 2020). The 1.2% increase in global energy supply (TPES) in 2019 was primarily due to the 4.1% increase in China, further supported by increases of 1.7% in India, 6.6% in Indonesia, 4.3% in Iran and 9.2% in Vietnam, and partly mitigated by decreases of around 1% in the other four largest emitters: European Union, United States, Russian Federation and Japan. We note that while energy demand is increasing, for peaking and curbing CO2 emissions it is not enough to have higher growth rates of renewable and nuclear energy. As long as their shares in total energy supply are too small, a growth in total energy demand will also imply continued growth in fossil-fuel use, thereby increasing total CO2 emissions.
CO2 from non-energy fuel uses and other sources Above, we discussed CO2 emissions emitted from the combustion of fossil fuels, which accounted for most of the CO2 emissions (89%, excluding those from land-use change). This is indeed the main cause of the increase in global CO2 emissions. The remaining 11% was made up from various sources, partly related to fossil-fuel production or use and, partly, to the use of limestone and dolomite (from the oxidation of the carbonates of which they are composed):

PBL | 23
• non-energy use of fossil fuels (4.4%), such as natural gas, naphtha or LPG as chemical feedstock, or coke used primarily as reducing agent in blast furnaces;
• limestone use in cement clinker production (4.0%); refers only to the non-combustion process of calcination of carbonates (e.g. in limestone) during cement clinker production;
• other use of limestone and dolomite (1.2%); covers CO2 from carbonate oxidation processes such as in lime production;
• solid fuel transformation (1.1%), notably coke production from coking coal; • gas flaring of natural gas produced that is not used nor vented at oil and natural
gas production sites (0.8%).
CO2 emissions from cement production was the only CO2 source that saw a rather strong 5.1% increase in global emissions in 2019, due to similar increases in global cement clinker production, with China as the largest contributor due to its very large share of 55% in global cement production (NBSC, 2020b). This is in contrast with the previous four years that saw smaller global cement production changes from -2.4% to 1.2%. In 2017 and 2018, China, India and Japan were the only countries of the top-6 to see decreases in cement production. After the completion of the FT2019 data set, gas flaring data for 2019 were published by the Global Gas Flaring Reduction Partnership (GGFR), an initiative managed by the World Bank, which shows global CO2 emissions from flaring increased by 3.5%, the largest increase for many years. The two largest flaring countries that contributed most to increasing CO2 flaring emissions were the Russian Federation +9% (7% in 2018) and the United States +23% (48% in 2018) (World Bank, 2020b).
2.4 Global emissions of other greenhouse gases
As discussed in the introduction, the non-CO2 GHG emissions originate from many different sources and are much more uncertain than CO2 emissions (Figure 2.3). Their uncertainty on a country and global level is of the order of 30% or more, whereas for CO2 this is about ±5% for OECD countries and ±10% for most other countries (Olivier et al., 2016). Note that due to the large diversity of the emission factors within these sources, and the lack of global statistics for F-gas production and their uses, the levels and annual trends in the emission of CH4, N2O and F-gases are much more uncertain than those in CO2. Compared to the trend in global CO2 emissions, the increase in non-CO2 GHG emissions did not go down as much in 2015 and 2016, namely from 1.9% average annual growth over the 2003–2014 period to a growth of 1.1% in 2015 and 0.8% in 2016. And higher growth resumed by 1.7% in 2017, 1.8% in 2018 and 1.6% in 2019. However, methane emissions, which make up two thirds of the non-CO2 greenhouse gas emissions, showed only a ~0.3% growth in 2015 and 2016, after which annual growth resumed at a higher level of 1.9% in 2017, 1.6% in 2018 and 1.3% in 2019. Although varying per country, non-CO2 emissions constitute a significant share in total GHG emissions. However, the global share of non-CO2 greenhouse gases is estimated to have declined from 36% in 1970 to 27% in 2014, after which it slowly started to increase to about 27.5% in 2019, because of the slow-down of the annual growth in global CO2 emissions since 2012. Over the last 50 years, global CO2 emissions annually increased on average by 1.8%, whereas global CH4 and N2O emissions annually increased by 0.8% and 0.7% (see Table 2.4).

PBL | 24
Figure 2.3
Methane emissions The trend in global methane (CH4) emissions since 1990 is presented in Figure 2.4. For CH4 emissions it is fossil-fuel production rather than combustion that is a large emission source. The largest methane sources are the production and transmission of coal, oil and natural gas, and livestock: when animals ruminate their feed, they emit considerable amounts of methane. Globally, cattle account for two thirds of the CH4 emitted by livestock, followed by buffalo, sheep and goats that haves shares of about 10%, 7% and 5%, respectively. The
Figure 2.4

PBL | 25
Note: CO2 eq with GWPs from IPCC AR4 Box 2.2 Global methane emissions from oil and natural gas systems underestimated
third largest source is human waste and waste water: when biomass waste in landfill and organic materials in domestic and industrial waste water decompose by bacteria in anaerobic conditions, substantial amounts of methane are generated. Likewise, rice cultivation in
This year, a new publication by Hmiel et al. (2020) on pre-industrial ice core14 CH4 measurements indicated that natural geological sources of methane emissions (e.g. from seepage and mud volcanoes) are a much smaller fraction of total atmospheric methane. The authors subsequently demonstrate that global methane emissions from oil and natural gas systems are the most likely sources that have been underestimated by up to 40% (Borunda, 2020).
This is consistent with the latest uncertainty estimates on national and global levels of methane emissions from oil and natural gas systems made by countries and in the scientific literature (see Olivier et al., 2002; IPCC, 2019), with uncertainty in default emission factors often estimated within the range of 30% to 50%, and up to 120% for natural gas systems (see 2019 Refinement to the 2006 IPCC Guidelines for National GHG Inventories). Olivier et al. (2017) shows that, sometimes, large changes in methane emissions are reported by countries in their annual submissions to the UN Climate Secretariat.
In 2020, also other publications on estimating global methane emissions from natural gas and oil production and transmission systems were published using remote sensing satellite observations of methane that were mapped on the production and transmission locations which were compiled by energy data analytics company Kayrros. This Paris-based company has developed a ‘Methane watch’ — an automated emission surveillance system using data from the European Space Agency’s Sentinel-5P satellite, for which it has developed algorithms that detect, quantify and attribute emissions directly to their sources (Kayrros, 2020).
Kayrros reports the number of hotspots of methane emissions from global oil and natural gas operations, based on satellite images for the first eight months of 2020 and compare them to images from the same period in 2019. The comparison shows that the number of large methane leaks from oil and natural gas systems increased by 32% in 2020. In Algeria, the Russian Federation and Turkmenistan, this number even increased by more than 40% (Mufson, 2020; McCulley, 2020; Denson, 2020). A hotspot was defined as a source emitting more than 5 tonnes of methane per hour (equivalent to 44 kt in a full year). In 2019, Kayrros detected visible large methane leaks (i.e. hotspots) totalling 10 Mt, which is more than 10% of total global emissions from oil and natural gas systems. The largest contributors to the rising number of oil and natural gas hotspots were the United States, the Russian Federation, Algeria, Turkmenistan, Iran and Iraq.
Kayrros detected the largest leak in Iraq, with emissions of 400 t/h (equivalent to 3.5 Mt CH4 per year). In the United States, the largest detected leak was from a pipeline emitting 150 t/h (equivalent to 1.3 Mt CH4 per year) (Mufson, 2020). Kayrros reported methane leaks in the Russian Federation from the Yamal gas pipeline in Siberia, with one leak estimated at 93 t/h (equivalent to 0.8 Mt CH4 per year) and another one nearby emitting 17 t/h (Nasralla, 2020).
Other new papers focus on production regions in the United States (Zhang et al., 2020; De Gouw et al., 2020; Schneising et al., 2020), as well as in other areas, such as Turkmenistan. For Turkmenistan, Schneising et al. (2020) indicate leakage rates of 4.1±1.5% of natural gas production. For more information on the United States, see Box 3.1 in Section 3.2.

PBL | 26
flooded rice fields is another source where anaerobic decomposition of organic material produces methane. Since the start of the 21st century global CH4 emissions started to rise again. From 2003 to 2014 they increased by 1.6% per year on average. Sources that contributed most to this increase were coal mining (+4.7% per year on average), natural gas production and distribution (+3.1%) and livestock (+0.9%). Countries with the largest absolute increase over these 10 years are China, Indonesia, India and Brazil, whereas the largest decreases occurred notably in the European Union (in particular the United Kingdom and Germany), but also in Argentina, Ukraine and Nigeria. Please note that these figures do not reflect recent research that suggest that CH4 emissions from oil and gas systems may be considerably larger than presently assumed (see Box 2.2). In 2019, the growth rate of methane emissions is estimated at 1.3% to a total of 9.8 GtCO2 eq, which is somewhat lower than the 1.8% growth in 2018. This is markedly higher than in 2015 and 2016 that saw growth rates of 0.3% and 0.1%, but it is very similar to the growth rate in 2012, 2014 and 2017 of around 1.4%, which is also the average annual growth rate since 2010 (Figure 2.4). Sources that contributed the most to the 1.3% increase in global CH4 emissions in 2019 were (in decreasing order of absolute changes): coal production (+3.0%), livestock farming (+1.1%) — particularly non-dairy cattle (+1.4%) — natural gas production and transmission (+2.7%), accounting for three quarters of the total increase in net emissions. Countries that contributed most to the 1.3% growth were notably China (+2.2%) and the United States (+2.5%), with increases also seen in (in decreasing order of absolute changes) Indonesia, Brazil, Russian Federation, Pakistan and India. Decreases were notably seen in Turkey, Sudan, Canada, Venezuela, Germany and Zaire. Present emissions are 25% higher than in 1990, when they were 7.8 GtCO2 eq. Increases in emissions from livestock and from natural gas production contributed most to the global emission increase of 5.4% since 2014, further aided by increases in emissions from wastewater treatment and discharge and landfills, whereas some decreases were seen in emissions from gas venting and savannah burning.
Nitrous oxide emissions The trend in global nitrous oxide (N2O) emissions since 1990 is presented in Figure 2.5. It clearly shows that agricultural activities are the largest sources of N2O accounting for about two-third. The main global sources of N2O emissions are from manure dropped in pastures, rangeland and paddocks (24%) and the use of synthetic nitrogen fertilisers (13%). More than half of global N fertiliser use is urea. Somewhat smaller sources are other crop-related emissions (from N-fixing crops, crop residues left on the fields and histosols18) (together 11%), the indirect N2O emissions related to NH3 emissions from agriculture (9%) and animal manure applied to soils (5%). The largest non-agricultural source is fuel combustion (17%, when including indirect emissions of N2O from NOx emissions), followed the production of chemicals (7%) and waste water (4%). For 2019, the growth in global N2O emissions was estimated at 1.1% to a total of 2.8 GtCO2 eq, which is similar to annual averages since 2014, the year that saw growth rates of between 0.8% and 1.3% (Figure 2.5). Sources that contributed the most to the increase in 2019 were (in decreasing order of absolute changes): synthetic nitrogen fertilisers (+2.7%), manure dropped in pastures, rangeland and paddocks (+1.3%), indirect N2O from agriculture (+2.1%) and other agricultural sources (+1.1%), accounting for more than three
18 Histosol is a soil consisting primarily of organic materials, such as peat. They often have poor drainage.

PBL | 27
quarters of the total net increase in emissions. The countries with the largest increases in 2019 were (in decreasing order of absolute changes) Brazil (+2.9%), Australia (+5.9%), China (+0.9%), India (+1.6%) and the Russian Federation (+2.1%). Countries with degreasing emissions in 2019 were notably Sudan, and also Zaire, the Central African Republic and the United States.
Figure 2.5 Note: CO2 eq with GWPs from IPCC AR4 In 2019, emissions were 29% higher than in 1990, when they were 2.2 GtCO2 eq. The increases in N2O emissions from the largest sources, notably manure dropped in the field, the use of synthetic nitrogen fertilisers, and indirect N2O emissions from agriculture, contributed the most to the 6.4% global emission growth since 2013, whereas some global N2O decreases were seen in the production of chemicals and savannah burning. Global N2O emissions from most sources, generally, developed rather smoothly, from 1990 to 2018 (Figure 2.5). An exception was N2O from the production of chemicals, such as adipic acid and nitric acid, as N2O abatement technology had been applied at many chemical plants, resulting in a 48% reduction in their global N2O emissions since their emissions peaked in 1979 and after small ‘peaks’ in 1997 and 2007. From 2004 to 2014, global N2O emissions increased by 10%, which is 1.2% per year, on average. Sources that contributed most to this increase were fuel combustion (+1.3% per year, on average), synthetic fertilisers (+1.6%), livestock droppings (+0.9%), crop-related emissions (+0.9%) and indirect N2O emissions from NOx emissions caused by fuel combustion (+1.8%). Countries with the largest absolute increase over these 10 years were India, China, Brazil and Mexico, whereas the largest decrease occurred in the European Union followed by Iran and the United States.
Fluorinated gas emissions The trend in F-gas emissions is presented in Figure 2.6. Although these gases make up the smallest category of the non-CO2 greenhouse gases, they show the strongest emission growth with estimated average annual global growth rates of 6.5%, over the 2004–2014 period, and slowing down somewhat in the following years to 5.4%, 4.6%, 3.8%, 3.2, and 3.8% in 2019. The countries with the largest estimated increases in 2019 were notably (in decreasing order of absolute changes) the Russian Federation (+17%), followed by the United States

PBL | 28
(+1.9%), Turkey (+10%), China (+2.0%), Canada (+9%) and Japan (+3.1%). Countries with the largest decreases were notably France (-11%) and the United Kingdom (-6.4%), Germany (-1.4%), Lithuania (-14%) and Spain (-3.6%) (total trend for EU-28 was -2.7%). Please note that F-gas emissions in EDGAR v4.2 FT2018 were estimated from 2010 onwards by using the 2010–2018 emission trend in the most emitted F-gases, as reported by industrialised countries (so-called Annex-I countries) to the UNFCCC (2020) and by extrapolating the average annual 2007–2010 trend for all other countries. Using these estimation methods, global total F-gas emissions, in 2019, amounted to 1.75 GtCO2 eq, worldwide, five times the emissions of 1990, which were estimated at 0.35 GtCO2 eq. Figure 2.6
Note: CO2 eq with GWPs from IPCC AR4 The main reason for this very high growth is the introduction of HFCs in the early 1990s to replace the use of CFCs as these were first phased out by industrialised countries to comply with the Montreal Protocol to protect the stratospheric ozone layer, developing countries would follow later. This accounts for about 1.0 GtCO2 eq of the global increase, and these HFC emissions account now for about 60% of all F-gas emissions (Figure 2.6), and emissions of HFC-134a, HFC-143a and HFC-125 make up most of them (about 90%). In addition, HFC-23 as by-product adds one fifth to total F-gas emissions. We note that these are very heterogeneous source categories, with large differences in growth rates for the different constituents, and often with very large uncertainties in emissions, at country level and per gas of the order of 100% or more.
Greenhouse gas emissions in top-5 countries and the European Union Figure 2.7 illustrates the 1990–2019 trends in total GHG emissions of the five largest emitting countries and the European Union, complemented with those in the other countries and from international transport (i.e. international marine and aviation emissions). These five largest emitters of GHG, together accounting for 62%, globally, are China (26%), the United States (13%), the European Union (about 9%), India (7%), the Russian Federation (5%) and Japan (almost 3%). These countries also have the highest CO2 emission levels.

PBL | 29
Three of them showed a decrease in GHG emissions in 2019: the European Union (by 140 MtCO2 eq or -3.0%),and the United States (by 110 MtCO2 eq or -1.7%) and Japan (by 20 MtCO2 eq or -1.6%. However, in the other three countries GHG emissions increased: in China (by about 420 MtCO2 eq or +3.1%, in India by about 50 MtCO2 eq or +1.4% and in the Russian Federation by 20 MtCO2 eq or +0.9% (ranked according to the largest absolute changes). Moreover, the total increase in the rest of the world was almost as large as that of China: by 350 MtCO2 eq or +2.2%.
Figure 2.7
Note: CO2 eq with GWPs from IPCC AR4 Together these five largest emitting countries and the European Union account for 51% of the world population, 65% of global gross domestic product (GDP) and 64% of the global total primary energy supply (TPES), accounted for 67% of total global CO2 emissions and about 62% of total global GHG emissions. Within the European Union most countries, such as Germany, Poland, Spain, Italy, the United Kingdom, France and the Netherlands, showed decreasing emissions whereas the largest increases in 2019 were seen in Austria and Sweden (both +2.7%). The total group of 20 largest economies (G2019), accounting for 77% of 2019 GHG emissions, showed a 0.8% increase. The collective emissions from the rest of the world showed a 2.2% increase in 2019 (1.7% for the eleven largest countries and 2.5% for remaining 186 countries). Appendix B provides more detailed tables, with the 1990–2019 GHG emission time series for the top 30 countries/regions, as well as per capita and per USD of GDP. Following UNFCCC reporting and accounting guidelines (UNFCCC, 2011), GHG emissions from international transport (aviation and shipping) are excluded from the national total in countries’ GHG emission reports, but nevertheless constitute about 2.6% of total global GHG emissions in 2019, for which a 2.9% increase was estimated. For CO2 emissions only, their total share is 3.6%: 1.7% for international aviation and 1.9% for international marine
19 Group of Twenty: 19 countries and the European Union. The 19 countries are: Argentina, Australia, Brazil, Canada, China, France, Germany, India, Indonesia, Italy, Japan, Republic of Korea, Mexico, the Russian Federation, Saudi Arabia, South Africa, Turkey, United Kingdom, and the United States.

PBL | 30
transport with estimated increases in 2019 of 3.6% and 2.4%, respectively. However, these growth percentages are rather uncertain, compared to CO2 emissions trends for country totals (Olivier et al., 2017). Appendix A provides tables with the 1990–2019 time series of CO2 emissions for the top 30 countries/regions, as well as per capita and per USD of GDP, whereas Appendix B provides tables with the 1990–2019 time series of total GHG emissions for these countries/regions. as well as for their CH4, N2O and F-gas emissions, and GHG emissions per capita and per USD of GDP.
2.5 COVID-19 global trends and future implications
The year 2019 is the year just before the COVID-19 pandemic hit the world that had a significant impact on anthropogenic greenhouse gas emissions in 2020. At the time of writing this report, the impact on total global greenhouse gas emissions is still under development and evaluation. For a discussion of the possible or likely impact on CO2 emissions in 2020, we refer the UNEP Emissions Gap Report 2020 (UNEP, 2020) that provides a synthesis of studies published to date on the impact of COVID-19 measures on CO2 emissions in 2020. Few studies, however, have so far been conducted on the COVID-19 impact on non-CO2 greenhouse gas emissions in 2020 (Forster et al., 2020). For a broader historical perspective and to illustrate the past impact of global recessions on the global emissions of all greenhouse gases, we analysed this impact by comparing annual changes in historical GDP and in GHG emissions in global recession years with non-recession years, using the EDGAR GHG FT2019 emissions data set for 1970–2018. We used the IMF definition of global recession years, which reads: ‘periods with a global annual real GDP growth rate of 3.0% or less’. This definition provides 6 global recessions, including 15 recession years and 32 non-recession years. The period contained 6 global recessions that meet the definition, since 1970: 1974–1975 (first oil crisis), 1980–1983 (second oil crisis), 1990–1993 (Gulf war), 1998 (Asian financial crisis), 2001–2002 (‘9/11’), and 2008–2009 (credit crunch). For each greenhouse gas, we looked at total global emissions and at the impact on emissions from main source categories and from more detailed sectors, either global emission estimates or global total activity data (statistics).
Table 2.4 Average annual change of global emissions 1970–2018 in global recession years, in other years and in the year before and after a global recession.
Gas Yr before Recession SD Yr after Non-recession SD
Impact (Rec-Non)
Reces Yr before
All years
GDP 4.4% 1.9% ±1.0% 4.1% 4.1% ±1.0% -2.2% -2.5% 3.4%
CO2 3.0% 0.0% ±1.0% 3.6% 2.7% ±1.7% -2.7% -2.9% 1.8%
CH4 1.1% -0.7% ±1.5% 1.5% 1.4% ±1.6% -2.1% -1.8% 0.8%
N2O 1.1% 0.1% ±1.0% 1.4% 1.3% ±1.1% -1.2% -1.1% 0.9%
F-gas 5.6% 2.8% ±4.4% 9.3% 6.6% ±3.4% -3.8% -2.8% 5.4%
HFCs 9.1% 6.2% ±8.6% 15.3% 9.5% ±6.8% -3.3% -2.9% 8.4%
PFCs 1.9% -3.6% ±6.4% 3.0% 2.5% ±4.0% -6.1% -5.5% 0.5%
SF6 6.1% 4.5% ±5.9% 7.8% 6.2% ±6.1% -1.7% -1.6% 5.6% Notes: SD = Standard Deviation of annual change in recession years and in non-recession years. According to an IMF definition, there were 6 recessions since 1970: 15 recession years and 32 other
years. The six global recessions were: 1974–1975 (first oil crisis), 1980–1983 (second oil crisis), 1990–1993 (Gulf war), 1998 (Asian financial crisis), 2001–2002 (‘9/11’), and 2008–2009 (credit crunch).

PBL | 31
During the analysis, we observed several marked differences: a) in global emission changes in recession years versus other years; b) in the first year after a recession, emission growth was larger than in average non-recession years; c) distinct differences could be observed between main GHG source categories, with some more sensitive to recessions than others; d) the spread in the percentages as indicated by the standard deviation in the percentages per category can be quite large, in some cases. Table 2.4 summarises the results for global emissions per greenhouse gas. This table shows that, for the three main greenhouse gases CO2, CH4 and N2O, the average annual growth during global recession years was 0.0%, -0.7% and 0.1%, whereas in other years, average annual growth was 2.7%, 1.4% and 1.3%, respectively. In an average ‘normal’ year, this translates into a total GHG emission growth of 2.4% versus 0% change in an ‘average’ recession year. Thus, the respective impact of recessions was -2.7%, -2.1% and -1.2% in percentage points of annual change, on average, whereas the average impact on annual global GDP growth was -2.2%. For F-gases, the figures are mostly much larger because these are fast growing sources, in particular HFCs and SF6. In absolute percentages, the only global recession year since 1970 with a negative global GDP change was 2009 (-0.7%). In that year, global emissions also saw negative changes of -1.2%, -0.4% and -0.5% for CO2, CH4 and N2O, respectively. However, global GHG emissions saw negative annual changes also in several other years, with the largest decreases in 1981 for CO2 (-1.9%) and CH4 (-5.0%), in 1980 for N2O (-1.9%) and in 1982 for F-gases (-4.4%). Table 2.4 also shows that, although in past global recessions global GDP growth using Purchasing Power Parity (PPP) was about half that of other years (from 4.1% ±1.0% SD to 1.9% ±1.0% SD), in those years, the change in global GHG emissions (excluding F-gases) was nil (CO2 and N2O) or negative (CH4). However, it is important to note that average global changes do not imply that the same is true on country, regional or sectoral levels. Although the figures above refer to global average recession years, they may indicate by how much GDP and greenhouse gas emissions could decline during a global recession due to lockdowns and other changes in society aimed at mitigating the COVID-19 virus. The largest decreases in any recession year in the past 50 years were found in 2009, the year of the ‘credit crunch’, which is the only year in this period with a 0.7% decrease in global GDP at PPP. In that year, all G20 countries saw large declines, except for China, India, Australia, South Korea and Indonesia. For example, GDP at PPP decreased in the United States (-2.5%), the European Union (-4.3%), the Russian Federation (-7.8%), Japan (-5.4%) and Mexico (-5.3%). The results from the analysis of sectoral emissions are summarised in Appendix C. For CO2, we considered the six main source categories and more detailed fossil-fuel combustion sub-sectors and more detailed other non-combustion sectors; for CH4, five main source categories were used for fossil fuels, three for agriculture and three for waste; for N2O, we considered two main source categories for fuels and industry, seven for agriculture and three for waste; and for F-gases, we used six categories (per gas, split into use and by-product). Please note that the emissions for 2019 presented in this report may be considered the most updated description for a ‘normal’ year to be benchmarked, with extraordinary emission levels in 2020 and, possibly, subsequent years. However, it must also be noted that the results for 2019 greenhouse gas emissions will be revised next year as new and refined statistics become available on 2019 activities, including livestock data (in this report up to

PBL | 32
2018); the use of F-gases (here up to 2018; available for industrialised countries only); and the use of synthetic nitrogen fertilisers (here up to 2017).20
20 The FAO data up to 2018 were not available at the time the emission data set compilation was finalised. On 1 September 2020, FAO released the data set that also includes this year.

PBL | 33
3 Trends in largest emitting countries and the EU-28
This chapter discusses the GHG emission trends for the six main emitters, consisting of five large countries (China (with share of 27%), the United States (13%), India (7%), the Russian Federation (5%) and Japan (3%)), and one region (the European Union (EU-28)(8%)). There are large differences between these six, in the share of the various greenhouse gases and the emission intensity of their energy use. Globally, the combined shares of CH4, N2O and F-gas emissions are about 27% of total GHG emissions (19%, 5%, and 3%, respectively), but they vary for the largest countries, from 14% for Japan to 30% for India. Estimations of current 2019 shares of non-CO2 GHG emissions were 17% for China, 21% for the United States, 24% for the EU-28 and 30% for the Russian Federation. These shares reflect the relative importance of non-CO2 GHG emission sources. Examples are the production of coal, oil and natural gas (releasing CH4) and agricultural activities, such as livestock farming (CH4 emissions from ruminants and manure), rice cultivation (CH4 released from wet fields through fermentation processes in the soil), animal manure and synthetic fertiliser use on arable land (N2O), and landfill and wastewater treatment practices (CH4).
Figure 3.1 Uncertainty margins: ±5% for the United States, EU-28, Japan and India; ±10% for Russian Federation and China, based mainly on the uncertainty estimate of annual CO2 emissions (PBL, 2012, 2017). Note: CO2 eq with GWPs from IPCC AR4 As discussed in Chapter 2, the GHG emission trends for three of the largest countries and regions have continued to grow in 2019, except for in the European Union, the United States
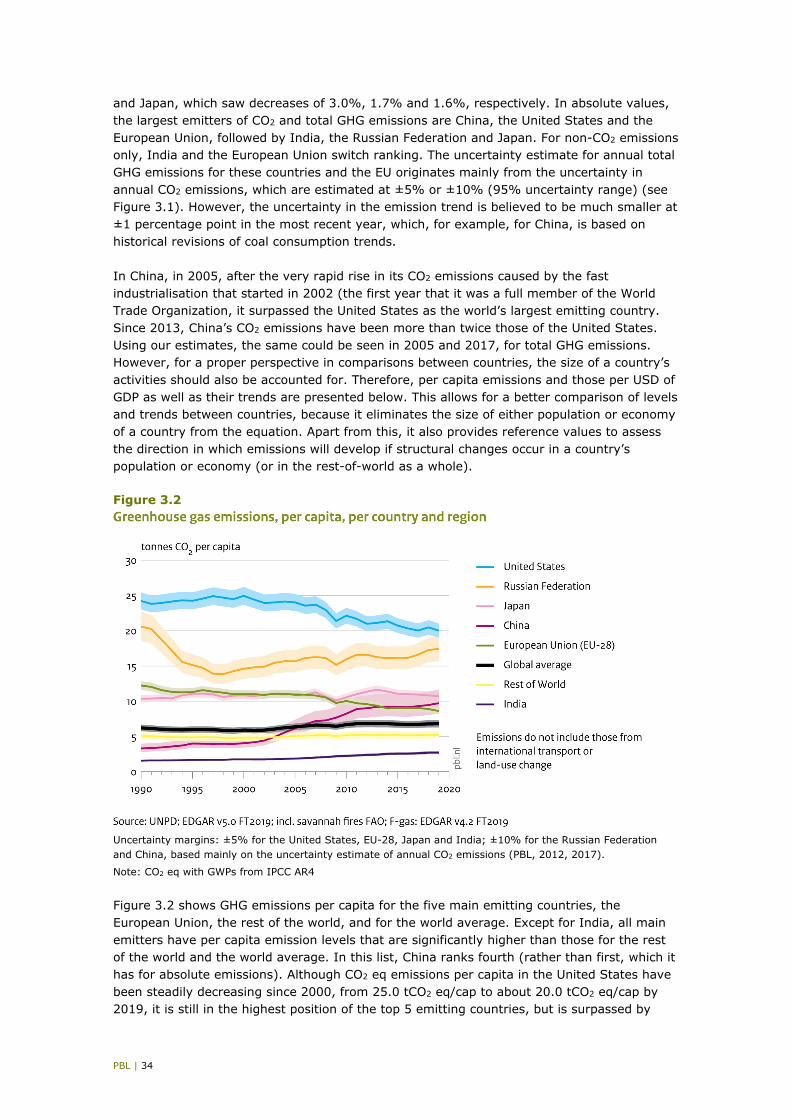
PBL | 34
and Japan, which saw decreases of 3.0%, 1.7% and 1.6%, respectively. In absolute values, the largest emitters of CO2 and total GHG emissions are China, the United States and the European Union, followed by India, the Russian Federation and Japan. For non-CO2 emissions only, India and the European Union switch ranking. The uncertainty estimate for annual total GHG emissions for these countries and the EU originates mainly from the uncertainty in annual CO2 emissions, which are estimated at ±5% or ±10% (95% uncertainty range) (see Figure 3.1). However, the uncertainty in the emission trend is believed to be much smaller at ±1 percentage point in the most recent year, which, for example, for China, is based on historical revisions of coal consumption trends. In China, in 2005, after the very rapid rise in its CO2 emissions caused by the fast industrialisation that started in 2002 (the first year that it was a full member of the World Trade Organization, it surpassed the United States as the world’s largest emitting country. Since 2013, China’s CO2 emissions have been more than twice those of the United States. Using our estimates, the same could be seen in 2005 and 2017, for total GHG emissions. However, for a proper perspective in comparisons between countries, the size of a country’s activities should also be accounted for. Therefore, per capita emissions and those per USD of GDP as well as their trends are presented below. This allows for a better comparison of levels and trends between countries, because it eliminates the size of either population or economy of a country from the equation. Apart from this, it also provides reference values to assess the direction in which emissions will develop if structural changes occur in a country’s population or economy (or in the rest-of-world as a whole).
Figure 3.2 Uncertainty margins: ±5% for the United States, EU-28, Japan and India; ±10% for the Russian Federation and China, based mainly on the uncertainty estimate of annual CO2 emissions (PBL, 2012, 2017).
Note: CO2 eq with GWPs from IPCC AR4 Figure 3.2 shows GHG emissions per capita for the five main emitting countries, the European Union, the rest of the world, and for the world average. Except for India, all main emitters have per capita emission levels that are significantly higher than those for the rest of the world and the world average. In this list, China ranks fourth (rather than first, which it has for absolute emissions). Although CO2 eq emissions per capita in the United States have been steadily decreasing since 2000, from 25.0 tCO2 eq/cap to about 20.0 tCO2 eq/cap by 2019, it is still in the highest position of the top 5 emitting countries, but is surpassed by

PBL | 35
three other G20 countries: Australia (30.7 tCO2 eq/cap), Canada (21.8 tCO2 eq/cap) and Saudi Arabia (21.1 tCO2 eq/cap) (not shown in the graph). The United States, the Russian Federation (17.4 tCO2 eq/cap), and Japan (10.7 tCO2 eq/cap) make up the top 3 GHG emitting countries per capita, of the five main emitting countries and the European Union. The emissions per USD of GDP (in 2011 prices and corrected for Purchasing Power Parity (PPP)) presented in Figure 3.3 show yet another picture. In contrast to the per capita emissions, the top 5 countries and the European Union are not all above the world average when it comes to emissions per USD of GDP. In India, emissions per USD of GDP virtually equal the world average, while those in the European Union are the lowest per USD of GDP, closely followed by Japan. Emissions per USD in the Russian Federation are the highest, closely followed by China, and are significantly higher than the world average. The trend for all countries is downward, including for the world average, except for the Russian Federation, whose emissions per USD have remained flat since 2012. We note that, since 2018, China’s emissions per USD of GDP are below those of the Russian Federation. And, in 2017, China’s GDP, calculated with Purchasing Power Parity (PPP), surpassed that of the United States — in 2019, it was 11.7% higher than the GDP of the United States (World Bank, 2020a).
Figure 3.3 Uncertainty margins: -5,+10% for the United States, EU-28, Japan and India; -15,+20% for the Russian Federation; and -20%,+20% for China, based mainly on the uncertainty estimates of annual CO2 emissions and of GDP (PBL, 2012, 2017).
Note: CO2 eq with GWPs from IPCC AR4 Appendix A provides more details for the top 30 countries/regions, with 1990–2019 time series on CO2 emissions, totals per country, per capita CO2 emissions and a similar table with CO2 emissions per USD of GDP. For the top 30 countries/regions, Appendix B provides more details, with 1990–2019 time series on GHG emissions, GHG totals, CH4, N2O, F-gas and per capita GHG emissions, as well as per USD of GDP. This chapter furthermore analyses the emission levels and trends for the top-5 emitting countries and the European Union, as Chapter 2 does for global total GHG emissions.
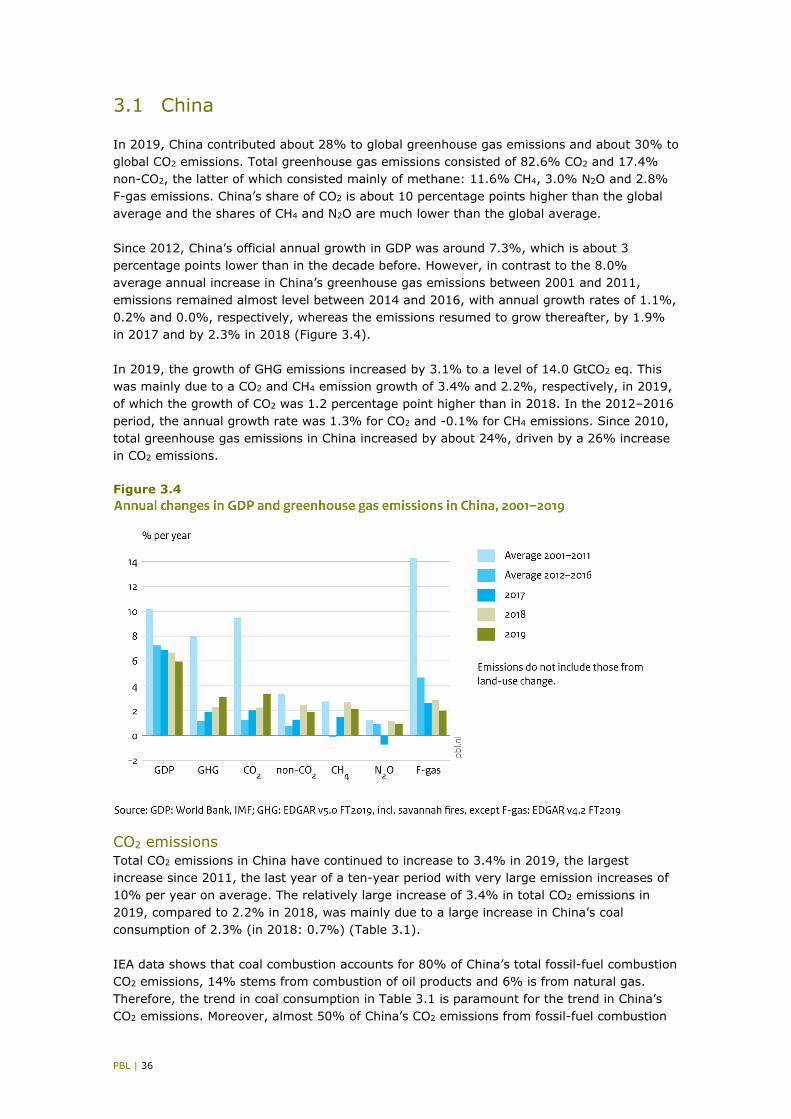
PBL | 36
3.1 China
In 2019, China contributed about 28% to global greenhouse gas emissions and about 30% to global CO2 emissions. Total greenhouse gas emissions consisted of 82.6% CO2 and 17.4% non-CO2, the latter of which consisted mainly of methane: 11.6% CH4, 3.0% N2O and 2.8% F-gas emissions. China’s share of CO2 is about 10 percentage points higher than the global average and the shares of CH4 and N2O are much lower than the global average. Since 2012, China’s official annual growth in GDP was around 7.3%, which is about 3 percentage points lower than in the decade before. However, in contrast to the 8.0% average annual increase in China’s greenhouse gas emissions between 2001 and 2011, emissions remained almost level between 2014 and 2016, with annual growth rates of 1.1%, 0.2% and 0.0%, respectively, whereas the emissions resumed to grow thereafter, by 1.9% in 2017 and by 2.3% in 2018 (Figure 3.4). In 2019, the growth of GHG emissions increased by 3.1% to a level of 14.0 GtCO2 eq. This was mainly due to a CO2 and CH4 emission growth of 3.4% and 2.2%, respectively, in 2019, of which the growth of CO2 was 1.2 percentage point higher than in 2018. In the 2012–2016 period, the annual growth rate was 1.3% for CO2 and -0.1% for CH4 emissions. Since 2010, total greenhouse gas emissions in China increased by about 24%, driven by a 26% increase in CO2 emissions.
Figure 3.4
CO2 emissions Total CO2 emissions in China have continued to increase to 3.4% in 2019, the largest increase since 2011, the last year of a ten-year period with very large emission increases of 10% per year on average. The relatively large increase of 3.4% in total CO2 emissions in 2019, compared to 2.2% in 2018, was mainly due to a large increase in China’s coal consumption of 2.3% (in 2018: 0.7%) (Table 3.1). IEA data shows that coal combustion accounts for 80% of China’s total fossil-fuel combustion CO2 emissions, 14% stems from combustion of oil products and 6% is from natural gas. Therefore, the trend in coal consumption in Table 3.1 is paramount for the trend in China’s CO2 emissions. Moreover, almost 50% of China’s CO2 emissions from fossil-fuel combustion

PBL | 37
are the result of power generation, of which virtually all (i.e. 97%) are from coal-fired power plants (IEA, 2019). Therefore, this sector is key in curbing China’s CO2 emissions. The large increase in cement production of 6.4% in 2019 (NBSC, 2020b), contrasting with the declines of reported for 2017 and 2018 (Table 3.1), resulted in a 6.8% increase in related clinker process emissions of CO2.
Table 3.1 Trend indicators for annual change in CO2 emissions in China Indicator Average 2001-11 Average 2012-16 2015 2016 2017 2018 2019
CO2 9.5% 1.3% 0.1% 0.2% 2.0% 2.2% 3.4% TPES* 7.9% 2.2% 0.8% 1.1% 2.8% 3.8% 4.1% 1A-Coal 10.1% 0.2% -1.7% -1.4% 1.2% 0.7% 2.3% 1A-Oil -7.9% 4.7% 7.5% 2.9% 3.2% 4.0% 5.0% 1A-Gas -19.5% 10.3% 6.0% 8.7% 16.3% 17.7% 8.6% Cement 12.2% 2.8% -5.3% 2.2% -3.3% -5.3% 6.4%
* Total Primary Energy Supply (TPES) data are from BP (2020), plus traditional biomass from IEA (2020d),
since that is not included in the BP definition of TPES. See note 12 in Section 2.2 for details. In 2019, power generation, which is China’s largest source of CO2 emissions, increased by 4.7% to 7,500 TWh. Of the total increase of 340 TWh, fossil-fuel-fired power plants (in total about 97% coal) provided about one third of the increase, of which 80% from coal, hydropower provided 21%, other renewable power 30% (mainly wind and solar) and 16% of the increase was in nuclear power (BP, 2020). Total primary energy use increased by 4.3% in 2019, which is much more than the 3.4% in CO2 emissions, the difference being increased use of non-fossil energy sources (see below).
Main energy use in China China’s total primary energy supply (TPES) of about 145 EJ (Exajoule = 1018 Joule) is almost a quarter of global TPES and has increased by 33% since 2010. Presently its per capita primary energy consumption is equal to the average of the G20 countries, which is about 50% higher than the world average, but 30% lower the that of the European Union. China’s primary energy supply consists of 56% coal, 17% renewable and nuclear energy, 19% oil, and 8% natural gas (BP, 2020; IEA, 2020d). In other words, 83% of China’s energy supply is still generated from fossil fuels. The 17% share of non-fossil energy consists of 5% wind and solar energy, another 8% hydropower, 2% biomass fuels and 2% nuclear energy. At present, about 32% of the electricity was generated from renewable and nuclear sources. In 2019, China’s TPES increased by 5.7 EJ or 4.1%, which is the highest percentage since 2011. The largest contribution of 4.0 EJ (+3.5%) is from fossil fuels (mainly coal and oil products), while renewable energy accounted for 1.2 EJ (+6.2%) and nuclear energy for 0.5 EJ (+17.8%). Retired coal-fired plants amounted to 7.54 GW in 2019, which is a quarter less than in 2018. The increase in 2019 of newly licenced coal-fired capacity of 43.8 GW in China was primarily due to an increase in plants going into operation as a result of large permitting rounds from 2014 to 2016. By January 2020, China had a total capacity of 1,023 GW of coal-fired power plants in operation. The net capacity additions are much larger than the growth of electricity production, which means that the overcapacity continued to worsen. China’s government has already assigned 40% of the coal power commissioned in 2019 to emergency back-up status, restricting the operating hours of these plants (Shearer et al., 2020).
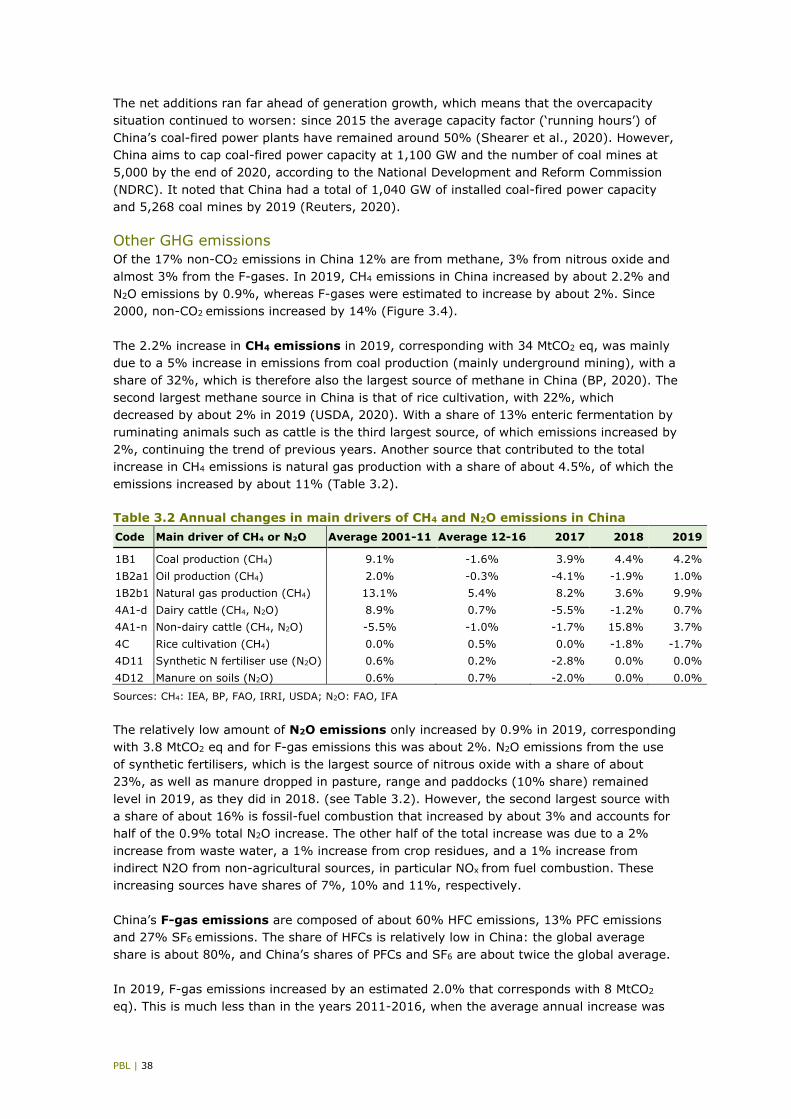
PBL | 38
The net additions ran far ahead of generation growth, which means that the overcapacity situation continued to worsen: since 2015 the average capacity factor (‘running hours’) of China’s coal-fired power plants have remained around 50% (Shearer et al., 2020). However, China aims to cap coal-fired power capacity at 1,100 GW and the number of coal mines at 5,000 by the end of 2020, according to the National Development and Reform Commission (NDRC). It noted that China had a total of 1,040 GW of installed coal-fired power capacity and 5,268 coal mines by 2019 (Reuters, 2020).
Other GHG emissions Of the 17% non-CO2 emissions in China 12% are from methane, 3% from nitrous oxide and almost 3% from the F-gases. In 2019, CH4 emissions in China increased by about 2.2% and N2O emissions by 0.9%, whereas F-gases were estimated to increase by about 2%. Since 2000, non-CO2 emissions increased by 14% (Figure 3.4). The 2.2% increase in CH4 emissions in 2019, corresponding with 34 MtCO2 eq, was mainly due to a 5% increase in emissions from coal production (mainly underground mining), with a share of 32%, which is therefore also the largest source of methane in China (BP, 2020). The second largest methane source in China is that of rice cultivation, with 22%, which decreased by about 2% in 2019 (USDA, 2020). With a share of 13% enteric fermentation by ruminating animals such as cattle is the third largest source, of which emissions increased by 2%, continuing the trend of previous years. Another source that contributed to the total increase in CH4 emissions is natural gas production with a share of about 4.5%, of which the emissions increased by about 11% (Table 3.2).
Table 3.2 Annual changes in main drivers of CH4 and N2O emissions in China Code Main driver of CH4 or N2O Average 2001-11 Average 12-16 2017 2018 2019
1B1 Coal production (CH4) 9.1% -1.6% 3.9% 4.4% 4.2% 1B2a1 Oil production (CH4) 2.0% -0.3% -4.1% -1.9% 1.0% 1B2b1 Natural gas production (CH4) 13.1% 5.4% 8.2% 3.6% 9.9% 4A1-d Dairy cattle (CH4, N2O) 8.9% 0.7% -5.5% -1.2% 0.7% 4A1-n Non-dairy cattle (CH4, N2O) -5.5% -1.0% -1.7% 15.8% 3.7% 4C Rice cultivation (CH4) 0.0% 0.5% 0.0% -1.8% -1.7% 4D11 Synthetic N fertiliser use (N2O) 0.6% 0.2% -2.8% 0.0% 0.0% 4D12 Manure on soils (N2O) 0.6% 0.7% -2.0% 0.0% 0.0%
Sources: CH4: IEA, BP, FAO, IRRI, USDA; N2O: FAO, IFA
The relatively low amount of N2O emissions only increased by 0.9% in 2019, corresponding with 3.8 MtCO2 eq and for F-gas emissions this was about 2%. N2O emissions from the use of synthetic fertilisers, which is the largest source of nitrous oxide with a share of about 23%, as well as manure dropped in pasture, range and paddocks (10% share) remained level in 2019, as they did in 2018. (see Table 3.2). However, the second largest source with a share of about 16% is fossil-fuel combustion that increased by about 3% and accounts for half of the 0.9% total N2O increase. The other half of the total increase was due to a 2% increase from waste water, a 1% increase from crop residues, and a 1% increase from indirect N2O from non-agricultural sources, in particular NOx from fuel combustion. These increasing sources have shares of 7%, 10% and 11%, respectively. China’s F-gas emissions are composed of about 60% HFC emissions, 13% PFC emissions and 27% SF6 emissions. The share of HFCs is relatively low in China: the global average share is about 80%, and China’s shares of PFCs and SF6 are about twice the global average. In 2019, F-gas emissions increased by an estimated 2.0% that corresponds with 8 MtCO2
eq). This is much less than in the years 2011-2016, when the average annual increase was

PBL | 39
4.7% (Figure 3.4). The increase is primarily due to a 6% increase in SF6 emissions and about 2% increase in HFC emissions. China’s HFC emissions are virtually all (i.e. 99%) HFC-23 emissions that are a by-product from the production of HCFC-22, which increased by an estimated 2% in 2019, and the remaining HFC emissions stem from the use of HFC-134a. The increase in SF6 emissions in China is mainly from the 6% increase in the use of SF6-containing switchgear in the power sector, which accounts for 85% of total SF6 emissions. Due to the relatively large increases over time, the 2019 share of F-gas emissions in China’s total greenhouse gas emissions more or less equalled that of N2O emissions.
3.2 United States
In 2019, the United States contributed 13% to global greenhouse gas emissions and about 13% to global CO2 emissions. Total greenhouse gas emissions consisted of 77.5% CO2 and 17.4% non-CO2, specifically: 10.4% CH4, 4.3% N2O and 7.7% F-gas. The United States’ share of CH4 is much lower than the global average and the share of F-gases is more than twice as high as the global average. Since 2011, the United States’ annual economic growth has been about 1.7% on average. In 2019, the US economy grew by about 2.3%. In contrast, since 2015 its total greenhouse gas emissions have decreased for three years (by 2.2%, 1.3% and 0.8%), increased in 2018 by 2.8% and decreased again in 2019 by 1.7% (Figure 3.5).
Figure 3.5
In 2019, total GHG emissions decreased by 1.7% to a level of 6.6 GtCO2 eq. This was mainly due to a CO2 and N2O emissions decline of 2.6% and 0.3%, respectively, of which the CO2 decrease in 2019 contrasted with the CO2 increase of 3.2% in 2018 (Figure 3.5). In the 2012-2016 period, the annual change was -1.1% for CO2 and 0.2% for N2O emissions. Since 2010, total greenhouse gas emissions in the United States have decreased by about 3.7%, driven by an 8.3% decline in CO2 emissions (which makes up almost 80% of total US greenhouse gas emissions) (Figure 3.5), whereas non-CO2 emissions increased by 16.2%

PBL | 40
over this period. Since they peaked in 2005, US greenhouse gas emissions declined by 7%, from 7.1 to about 6.6 GtCO2 eq in 2019.
CO2 emissions After an increase of 3.2% in 2018, total CO2 emissions in the United States have resumed to decrease by -2.6%% in 2019, the largest decline since 2015. The relatively large decrease of -2.6% in total CO2 emissions in 2019, compared to +3.2% in 2018, was mainly due to a large decrease in US coal consumption of -14.6% (in 2018: -4.2%) (Table 3.3). Total primary energy use decreased by 1.0% in 2019, which is less than the decrease of 2.6% in CO2 emissions, the difference being increased use of non-fossil energy sources and a shift from coal use and oil to natural gas (see below). The 2.6% decrease in total CO2 emissions and the 14.6% decrease in coal consumption in 2019 (BP, 2020), are very close to percentages reported by the U.S. Energy Information Administration (EIA), considering that their numbers are for energy-related emissions only, however they include fuel use in international transport (so-called bunker fuels) (EIA, 2020b). IEA data shows that coal combustion accounts for 28% of the United States’ total fossil-fuel combustion CO2 emissions, 42% stems from combustion of oil products and 30% is from natural gas. Therefore, the trend in coal and oil consumption in Table 3.3 is paramount for the trend in CO2 emissions. Moreover, about 85% of the United States’ CO2 emissions from oil combustion are produced by the transport sector, and 94% of CO2 emissions from coal combustion are produced by power generation, which share is 38% (IEA, 2019). Therefore, these sectors, which cover about 74% (56% when considering road transport and coal-fired power generation) of total CO2 emissions from fossil-fuel combustion, are key in curbing the United States’ CO2 emissions.
Table 3.3 Trend indicators for annual change in CO2 emissions in the United States Indicator Average 2001-11 Average 2012-16 2015 2016 2017 2018 2019
CO2 -0.8% -1.1% -3.0% -1.8% -1.4% 3.2% -2.6%
TPES* -0.3% 0.0% -1.1% -0.2% 0.3% 3.6% -1.0%
1A-Coal -1.4% -6.2% -13.8% -7.4% -2.4% -4.2% -14.6%
1A-Oil -1.1% 0.6% 3.7% 0.4% -0.6% 2.3% -0.3%
1A-Gas -4.5% 2.4% 3.3% 0.7% -2.3% 10.8% 3.3%
Cement -2.2% 3.8% 2.1% 0.3% 2.3% 1.9% 3.7%
* Total Primary Energy Supply (TPES) data are from BP (2020), plus traditional biomass from IEA (2020d),
since that is not included in the BP definition of TPES. See note 12 in Section 2.2 for details. The manufacturing industry emits one fifth of total US CO2 emissions from fuel combustion, which in 2019 were nearly unchanged. The buildings sector (residential and commercial and public services) is responsible for 11%. In 2019, the very small change of -0.1% in direct CO2 emissions from the buildings sector was mainly due to relatively very small changes in the winter weather in 2019 compared to 2018, resulting in very small changes in the demand for space heating: +0.6% in Heating Degree-Days (HDDs), the highest number since 2014, compared to 2018 (EIA, 2020f). This had an impact in particular on the use of natural gas. HDDs are used to estimate the demand for space heating in the residential and service sectors, which both mostly use natural gas or electricity (EIA, 2020b). In 2019, the use of main fossil oil products in road transport decreased in the United States: petrol -0.3% and diesel fuel -0.8%, whereas the use of bioethanol increased by 0.8% and (the smaller use of) biodiesel decreased -4.8%. This resulted in a 0.5% decrease

PBL | 41
in total CO2 emissions from road transport, after six years with increasing CO2 emissions (EIA, 2020b). In 2019, power generation, with a share of about 38% the largest source of US CO2 emissions, decreased by 1.3% to 4,400 TWh that is the largest annual decline since the 2009 recession year. The decrease was in part due to lower demand for air conditioning: -5.4% down in number of Cooling Degree-Days (CDDs) compared with 2018 (EIA, 2020f). This was due to differences in the summer weather, in 2018 with a record number of Cooling Degree-Days, the highest since 1949, that was increased by 11.0% compared to 2017. CDDs are used to estimate the demand for electricity for air conditioning in the summer months, with record levels in 2018 (EIA, 2020b). Of the total decrease of 60 TWh, coal-fired power plants decreased about 200 TWh, partly offset by an increase of 130 TWh of gas-fired power generation (BP, 2020). Total power sector CO2 emissions fell by about 150 MtCO2 or 8.3% in 2019, the largest annual decrease since the 2009 recession year. Net electricity generation decreased by 1.3% in 2019, but power sector CO2 emissions declined by even more, largely because of increases from renewable sources such as wind and solar. Electricity generation from coal fell, and the increase in natural gas-fired electricity generation was more limited, because renewable sources such as wind and solar prevail when available, since they have no fuel costs. CO2 emissions from coal-fired power plants declined by -15.5% in 2019, and CO2 emissions from natural-gas-fired power plants increased by 6.9%, resulting in an 8.3% decrease in total power plant CO2 emissions (EIA, 2020b). After the completion of the CO2 FT2019 data set, gas flaring data for 2019 were released by the Global Gas Flaring Reduction Partnership (GGFR), an initiative managed by the World Bank, that shows global CO2 emissions from flaring increased by 3.5% in 2019, the largest increase for many years. Although gas flaring is a relatively small source, with a share of 11.5% in global flaring emissions the United States is the third largest flaring country and increased its CO2 from gas flaring by 23% or 6.8 MtCO2 in 2019, contributing most of all countries to the global increase of 3.5% in 2019 (the United States’ increase was 48% in 2018 due to large increases in domestic shale oil production) (World Bank, 2020b).
Main energy use in the United States The United States’ total primary energy supply (TPES) of about 96 EJ (Exajoule = 1018 Joule) in 2019 is almost a fifth of present global TPES and has increased by 2% since 2010. Its present per capita primary energy consumption is about 4.5 times the global average and two times that of the European Union. The primary energy supply of the United States consists of 38% oil, 32% natural gas, 12% coal, and 18% renewable and nuclear energy (BP, 2020; IEA, 2020d). In other words, 82% of its energy supply is still generated from fossil fuels. The 18% share of non-fossil energy consists of 8% nuclear energy, 6% wind and solar energy, 2.5% hydropower and 2% biomass fuels. At present, about 37% of the electricity was generated from renewable and nuclear sources. In 2019, The United States’ TPES decreased by -0.9 EJ or -1.0%, after an increase of 3.6% in 2018. The largest contribution to the decrease is -1.1 EJ (-1.4%) from fossil fuels, mainly coal -14.6% (-1.9 EJ), but about half offset by increasing natural gas, +3.3% (+1.0 EJ). Renewable energy accounted for +0.2 EJ (+1.8%) and nuclear energy essentially did not change. Wind and solar energy contributed +0.3 EJ (+5.9%), which was partly offset by a decrease in hydropower -0.1 EJ (-6.7%).

PBL | 42
Retired coal-fired power plants amounted to about 13 GW in 2019, which is almost as much as in 2018, and the Energy Information Administration (EIA) expects the retirement of coal-fired power plants to continue (EIA, 2020d). According to the EIA, in the peak year 2011 there was 318 GW of coal-fired capacity, but has been declining since then because many plants retired or switched or replaced to natural gas and by the end of 2019 total coal-fired capacity was 229 GW: 49.2 GW of that amount was retired, 14.3 GW had the boiler converted to burn natural gas, and 7.9 GW was replaced with 15.3 GW natural gas combined cycle (NGCC) (EIA, 2020a). The decline in 2019 of coal-fired power generation was the largest percentage decline in history (16%) and second-largest in absolute terms (240 TWh). The coal fleet’s rate of operation, or utilisation, has also decreased, from 67% in 2010 to 48% in 2019. In contrast, natural gas combined-cycle turbine plants ran at 57% of their capacity in 2019 (EIA, 2020d). According to the Global Coal Plant Tracker, in 2019, the retired coal capacity amounted to 16.5 GW, which is almost as much as the 15.9 GW retired capacity in 2018 and is the second-highest amount for coal-fired power plant retirements in the United States. The highest was in 2015, when this was 21.6 GW. Nearly half of the globally retired coal power capacity in 2019 was in the United States (Global Energy Monitor, 2020; Shearer et al., 2020). By the end of 2019, the total coal-generating capacity was 229 GW. The decline in 2019 of coal generation levels was the largest percentage decline in history (16%) and second-largest in absolute terms (240 TWh). The coal fleet’s rate of operation, or utilisation, has also decreased, from 67% in 2010 to 48% in 2019. In contrast, natural gas combined-cycle turbine plants ran at 57% of their capacity in 2019 (EIA, 2020c). In 2020, the EIA expects 5.8 GW of coal-fired capacity to retire (EIA,2020k). New electric power generating capacity in 2020 is expected to amount 42 GW, of which 32 GW (76%) will come from wind and solar and 22% from natural gas (EIA, 2020e). During the winter and summer months, the coal-fired power plants operate at an average capacity factor, or utilisation rate, of more than 60%. Coal-fired power generation is used much less during the spring months March, April and May and during fall months September, October and November. These seasonal differences in capacity factor were larger in the last few years, because coal has been replaced by cheaper gas-fired and renewable power generation. In an effort to improve the cost efficiency of coal-fired plants some plant owners are now considering to run their plants on a seasonal basis only, that is, only during winter and summer months when demand is steadier (EIA, 2020e). CO2 emissions in 2019 were 0.8% above 1990 levels. From the comparison of percentage changes in shares in the energy supply we can conclude that the United States has strongly reduced the use of coal in power generation, over the past decade, which was compensated for by an increase in renewable power and, even more so, in gas-fired power generation.
Other GHG emissions Of the 22.5% non-CO2 emissions in the United States 10% are from methane, 4% from nitrous oxide and almost 8% from the F-gases. The share of CH4 is about half of the global average share of about 19% and more than double of the global of SF6 emissions of about 3.3%. In 2019, CH4 emissions in the United States increased by about 2.5% and F-gas emissions by 1.9%, whereas N2O emissions were estimated to have decreased by about -0.3%, corresponding with a collective increase in these non-CO2 gas emissions of 1.7% or 25 MtCO2 eq. In contrast to CO2 emissions, those of non-CO2 greenhouse gases have increased collectively by 16.2% since 2010 and by an estimated 1.7% in 2019 (Figure 3.5).

PBL | 43
Box 3.1. Methane emissions from oil and gas systems in the United States underestimated
Natural gas systems in the United States have a three-quarters share and oil systems have a quarter share in total methane emissions of the sector and these emissions are very uncertain. Annually, the US EPA makes recalculations of fugitive CH4 emissions from this sector as part of their emission inventory improvement programme (e.g. see Olivier et al., 2017, Table D.5). However, in recent years, it has not made significant revisions in its emissions inventory reports that are submitted, annually, to the UN Climate Secretariat (Lyon, 2018). When comparing the inventory submissions of the last five years, we observed that the 2017 inventory submission saw a total downward revision of 16% (mainly due to a 37% downward revision for oil systems) and, in the 2020 submission, total sector emissions were down by about 12% (mainly due to a 16% downward revision for gas systems). In the other three years, the total sector emissions were revised upward by a few per cent per year. As described in the 2018 Global GHG report (Olivier and Peters, 2018), in recent years, various measurement studies were made of methane emissions from oil and natural gas operations, indicating that the US national inventory misses substantial amounts of CH4 emissions from abnormal process conditions, or super emitters. Measurements suggest that methane emissions from this sector could be 60% higher because the US EPA’s bottom-up method does not account for facility-level high-emitting malfunctioning equipment and 2% of total facilities emit half of the total emissions (Alvarez et al., 2018; Guglielmi, 2018; Zavala-Araiza et al., 2015; Lyon, 2018). Compared to the latest EPA estimate of 7.58 Tg CH4 for total oil and natural gas emissions in 2015, that year’s estimate by Alvarez et al. of 13±2 (2𝜎𝜎) Tg CH4 is 70% higher. The National Academy of Sciences, Engineering, and Medicine published a report on methane emissions in the United States, with specific recommendations for EPA collaboration to improve the accuracy of emission estimates for the oil and gas sector, such as expanded efforts to measure emissions with top-down approaches and bottom-up methods (NAS, 2018). A study published last year, Howarth (2019), suggests that methane released from the production of shale oil and gas — predominantly produced in the United States — has a lower 13C content than conventional oil and gas production and concludes that the increase in global methane emissions from fossil fuels over the past decade is for more than half from shale oil and gas production in North America (Ambrose, 2019; Leahy, 2019). Several new papers published this year focus on CH4 emissions from oil and natural gas production regions in the United States, using remote sensing data from TROPOMI on the Sentinel-5P satellite and inverse modelling. Schneising et al. (2020) estimate 10.5 Tg CH4 emissions for 2018/2019 total annual oil and gas emissions, which is about 45% higher than the EPA estimate of 7.33 Tg CH4 emissions in 2018 (2𝜎𝜎 uncertainty 7% to 37%). Zhang et al. (2020) conclude that, in percentages, methane leakage relative to gross natural gas produced in the Permian Basin is about 60% higher than the national average leakage rate. On gas distribution emissions, Weller et al. (2020) conclude that emissions currently reported by the US EPA are underestimated by 50% or more because they fail to characterise the upper tail of the distribution of leak emission rates. From this it can be observed that, while detailed bottom-up and top-down studies indicate a significant underestimation of methane emissions from the oil and gas sector, the US EPA’s revisions of emissions from this sector until now, by and large are downward. Another new study of pre-industrial ice core 14CH4 measurements strongly points to an underestimation of global oil and gas systems of up to 40% (Hmiel et al., 2020). For more information on these global studies, see Box 2.2 in Section 2.4.

PBL | 44
The largest CH4 emissions sources in the United States are livestock, predominantly cattle, natural gas production and its transmission, and gas venting, which account for about 60%. In 2019, CH4 emissions in the United States are projected to have increased by 2.5% or 17 MtCO2 eq, mainly due to a large increase of 8% in methane emissions from natural gas production and its transport and distribution as well as a 6% increase from gas venting during oil production, but also an 8% increase from oil production and a 1.5% increase in enteric fermentation by ruminating animals contributed to the increasing trend, continuing increasing trends of previous years. These four increasing sources have shares of 21%, 16%, 4% and 26%, respectively. However, emissions from the oil and gas systems are likely to be significantly underestimated (see Box 3.1, for more details).
These increases were somewhat mitigated notably by an 11% decrease in CH4 emissions from coal production, which share is 5%. As illustrated in Table 3.4, over the past years CH4 emissions from coal mining have been decreasing due to downward trends in coal production resulting in emissions in 2019 that are half of those in 2010.
Table 3.4 Annual changes in main drivers of CH4 and N2O emissions in United States Code Main driver of CH4 or N2O Average 2001-11 Average 12-16 2017 2018 2019
1B1 Coal production (CH4) 0.0% -8.3% 7.1% -1.4% -7.1% 1B2a1 Oil production (CH4) -0.2% 9.4% 5.5% 17.2% 11.2% 1B2b1 Natural gas production (CH4) 1.6% 3.4% 2.3% 11.6% 10.2% 4A1-d Dairy cattle (CH4, N2O) 0.0% 0.2% 0.6% 0.7% 0.5% 4A1-n Non-dairy cattle (CH4, N2O) -0.6% -0.3% 2.0% 0.7% 1.7% 4C Rice cultivation (CH4) -1.3% 3.4% -23.3% 22.8% 6.6% 4D11 Synthetic N fertiliser use (N2O) -1.8% -0.4% -1.3% 0.0% 0.0% 4D12 Manure on soils (N2O) -1.8% 0.3% 0.7% 0.7% 0.7%
Sources: CH4: IEA, BP, FAO, IRRI, USDA; N2O: FAO, IFA In 2019, N2O emissions decreased by an estimated 0.3% corresponding with 1.0 MtCO2 eq, primarily due to -2% decrease in emissions from fuel combustion and by a decrease of -70% from savannah fires, but also a -2% decrease from industrial processes contributed to the decrease. These decreasing sources have shares of 22%, 0.1% and 7%. The very large decrease in savannah fire emissions is due to the related very high emissions in 2018 and very low emissions in 2019. This source category shows very large interannual variations. The second largest source in the United States is the use of synthetic fertilisers with a share of 17%, which remained constant in 2019, as it did in 2018 (Table 3.4). The F-gas emissions in the United States are composed of about 92% HFC emissions, on 1.3% PFC emissions and 6.7% SF6 emissions. The share of HFCs is relatively high in the United States: the global average share is about 80%, whereas the shares of PFCs and SF6 are one fifth and half of the global averages. In 2019, F-gas emissions in the United States increased by an estimated 2% corresponding with about 7 MtCO2 eq, which is similar to the increases in 2017 and 2018. The increase in F-gas emissions in 2019 was primarily due to an estimated 1.7% increase in HFC emissions, mainly from HFC use. Total HFC emissions in the United States still show a continuously increasing trend for several decades, whereas total the relatively small PFC and SF6 emissions are continuously decreasing over time. In the United States, generally, PFC emissions are mainly emitted from use in semi-conductor manufacture and as by-product from aluminium production, with an estimated decrease of 4% in 2019. Both PFC emissions as by-product and from PFC uses decrease over time. SF6 emissions decreased only slightly in 2019 by an estimated 0.4%, mainly due to a 2% decrease in emissions from the manufacture and use of SF6 containing electrical

PBL | 45
switchgear and circuit breakers that are used in the electricity sector, the same percentages as in 2018. SF6 from electrical equipment is one of the largest SF6 sources in the United States, but a very large unknown SF6 source with a strength approximately similar to all currently reported U.S. sources has been identified many years ago, but still has not been resolved (Maiss and Brenninkmeijer, 1998).
3.3 European Union
In 2019, the European Union (EU-28)21 contributed 9% to global greenhouse gas emissions and also about 9% to global CO2 emissions. Total greenhouse gas emissions consisted of 76.0% CO2 and 24.0% non-CO2, i.e. 14.0% CH4, 6.3% N2O and 3.6% F-gases. Since 2014, the EU’s GDP saw an average annual growth rate of 2.3%. However, in 2019 GDP growth decreased to 1.6%. The country that contributed most to this decrease was Germany with almost 1 percentage point less growth from 1.5% in 2018 to 0.6% in 2019, with smaller decreases in Italy (0.3% in 2019) and Poland (4.1% in 2019). GDP of the United Kingdom remained almost flat (1.4% in 2019).
Figure 3.6 Since the ‘peak year’ of 2004, when its greenhouse gas emissions were at the highest level in recent history, the EU’s total greenhouse gas emissions declined by 1.4% per year, on average, from 5.4 GtCO2 eq in 2004 to around 4.5 GtCO2 eq in 2014 to 2018. Since 2011, total greenhouse gas emissions did decrease every year, except for two years. In 2019, after a decrease of 1.4% in 2018, greenhouse gas emissions saw a larger decrease of 3.0% to 4.34 GtCO2 eq. Of the 28 Member States in 2019, only seven showed increasing emissions, with Austria and Sweden having the largest absolute increase. The 3.0% decrease in greenhouse gas emissions in 2019 was driven by a 3.8% decline in CO2 emissions that in 2019 had a 76% share in total EU greenhouse gas emissions. Collectively, the other
21 This report covers emissions up to and including 2019, in which year the United Kingdom was still a Member State of the European Union that exited the EU on 31 January 2020. Therefore we include the UK in EU totals discussed here. The UK’s share in the EU-28 total greenhouse gas emissions, population and GDP in our data set in 2019 is 11.7%, 13.4% and 13.9%, respectively.

PBL | 46
greenhouse gases showed a much smaller 0.5% decrease in 2019: CH4 -0.3%, F-gases -2.7%, and N2O a small increase of +0.3% (Figure 3.6). Figure 3.6 also shows that whereas total greenhouse gas emissions show decreases in most years, the decreases since 2012 seen in total GHG emissions are on average larger than in the decade before 2012. This trend is mainly set by the trend in CO2 emissions, as for the non-CO2 emissions this is not the case. Since 2010, EU’s total greenhouse gas emissions decreased by 12.6%. This trend is mainly set by the trend in CO2 emissions, which have declined by 15.7% since 2010. Also, inter-annual changes in total greenhouse gas emissions have mostly been due to similar variations in CO2 emissions, whereas total non-CO2 emissions trend was essentially flat since 2010, with increasing F-gas emissions nullified by decreasing CH4 emissions, and N2O emissions remained flat since 2010.
CO2 emissions The 3.8% decline in the EU’s CO2 emissions in 2019, to a level of about 3.3 GtCO2, was mainly due to the large 17.8% decrease in coal consumption in 2019. The consumption of oil products decreased only slightly by 0.4%, whereas natural gas consumption in the European Union increased by 2.7% in 2019 (Table 3.3) (BP, 2020). Cement production in the EU is estimated to have increased by 3.4% in 2019, which — with constant clinker fractions assumed - also leads to a 3.4% increase in CO2 emissions (Table 3.3), but their share in total CO2 emissions from the European Union is only 2.4%. Our estimate of the decrease in total CO2 emissions in 2019 of 3.8% is somewhat smaller than the 4.3% decrease estimated by Eurostat, however their estimation refers to CO2 from fossil-fuel combustion only, which is based on the sum of monthly statistics of coal, peat, oil and natural gas consumption, for which we estimate a decrease of 4.2% for the EU-28 (Eurostat, 2020a).
Table 3.5 Trend indicators for annual change in CO2 emissions in the European Union-28, 2000-2019 Indicator Average 2001-11 Average 2012-16 2015 2016 2017 2018 2019
CO2 -0.8% -1.6% 1.2% -0.5% 0.4% -1.5% -3.8% TPES* -0.2% -0.6% 1.4% 1.0% 1.1% -0.1% -1.4% 1A-Coal -1.1% -3.6% -2.3% -8.9% -2.5% -4.6% -17.8% 1A-Oil 0.7% -0.8% 2.6% 0.9% 0.5% -0.2% -0.4% 1A-Gas -3.0% -0.9% 4.5% 7.5% 2.8% -1.4% 2.7% Cement -1.7% -2.7% 2.1% 0.0% 7.8% 8.5% 3.4%
* Total Primary Energy Supply (TPES) data are from BP (2020), plus traditional biomass from IEA (2020d), since that is not included in the BP definition of TPES. See note 12 in Section 2.2 for details. IEA data shows that coal combustion accounts for about 29% of the EU’s total fossil-fuel combustion CO2 emissions, 42% stems from combustion of oil products and 28% is from natural gas. Therefore, the trend in oil and coal consumption in Table 3.3 is paramount for the trend in CO2 emissions. Moreover, about 69% of the European Union’s CO2 emissions from oil combustion are produced by the transport sector, and 80% of CO2 emissions from coal combustion are produced by power generation (IEA, 2019). Therefore, these sectors, which cover about 63% (50% when considering road transport and coal-fired power generation) of total CO2 emissions from fossil-fuel combustion, are key in curbing the European Union’s CO2 emissions. We note that, in 2019, in the European Union, seven Member States make up three quarters of the EU’s total CO2 emissions: Germany (21% share), United Kingdom (11%), Italy (10%),
PBL | 47
France (10%), Spain (8%) and the Netherlands (5%). In 2020, without the United Kingdom, the six largest emitting EU-27 countries account for about 70% of EU-27 total CO2 emissions. The EU Member States that were responsible for most of the total hard coal and brown coal decline of 17.8% in 2019 — ranked in order of largest absolute changes — were notably Germany, Spain, Poland, the Netherlands, Portugal and the United Kingdom, followed by Romania and Slovakia (BP, 2020). For the small, 0.4% decrease in the EU’s use of oil products, primarily, the following countries saw decreases: Italy (-4.4%), the United Kingdom (-2.1%), the Netherlands (-1.7%), Finland (-4.8%) and France (-0.6%), which were largely offset by increases in oil consumption, mainly in these countries: Germany, Portugal, Greece, Romania, Sweden, Poland, Bulgaria and Austria. The 2.7% increase in total EU natural gas consumption was primarily due to increases in Spain (+14.8%), Germany (+3.3%), Italy (+2.3%) and the Netherlands (+4.2%), followed by smaller increases in France, Belgium, Poland, Greece, the Czech Republic and Portugal. These increases were somewhat offset by decreases in gas consumption in notably Romania, the United Kingdom, Denmark and Bulgaria. The year 2019 ranks as the second warmest on record, following Europe's record warm year in 2018 and just 0.04 °C cooler than 2018. The years 2014 through 2019 all rank among Europe's six warmest years on record and Belgium, Germany, Luxembourg, the Netherlands and the United Kingdom set new national July temperature records (NOAA, 2020). The Netherlands observed its highest February maximum temperature since national records began in 1901 and set a new national all-time maximum temperature of 40.7 °C on 25 July, which was the first time that temperatures exceeded 40.0 °C in The Netherlands. They were observed on eight weather stations (KNMI, 2019). The July 2019 heatwave, which sent temperatures above 40° C in Northern Europe, strongly increased electricity demand for air conditioning. However, very warm winter months in 2019 decreased electricity consumption for space heating and this compensated for electricity demand surges in the summer. Thus, the reduced heating demand in the warm winter months continues to offset additional air conditioning demand in the hot summer months. (Agora Energiewende and Sandbag, 2020). The increase in EU natural gas consumption was not caused by colder winter weather in 2019 — winter months in 2019 were on average ‘1.0%’ milder than in 2018 — but it is linked to the large decline in coal consumption (Eurostat, 2020b). The large decrease in coal consumption in most countries is mainly due to the substantially increased CO2 price of the EU Emission Trading System (EU-ETS) in 2019 compared to 2018, with prices higher than EUR 25 per tonne CO2. This makes coal-fired power generation economically less profitable than power generation with natural gas, as coal-fired plants emit much more CO2 per kWh electricity than natural-gas-fired power plants and renewable power generation (Eurostat, 2020a, 2020b). Thus, to compensate for producing less electricity by coal, countries used more natural gas and more renewable energy, hence the increase in natural gas consumption. In 2019, total EU coal-fired power generation decreased its share (from 18.9% to 14.6%), which was compensated for mainly by increases in the share of natural gas (from 19.1% to 21.7%) and of wind power by (from 11.6% to 13.4%), but also by solar power (from 3.9% to 4.2%) and nuclear power (from 25.3% to 25.5%), which had also to compensate for a decrease in the share of hydropower (from 11.3% to 10.8%). At country level, the largest decreases in shares of electricity production by coal-fired power generation were in the Netherlands, Spain, Portugal, Denmark, Germany and Greece (see Table 3.6 for more

PBL | 48
Table 3.6 Changes in total coal and natural gas use (PJ) and in their shares in power generation in the EU-28 in 2019 (percentage points change) (source: BP, 2020)
Change in total in 2019 (PJ)
Change in power share in 2019 (percentage points)
EU-28 country *1 Coal Natural gas Coal Natural gas Renewables Note
EU-28 -1670 440 -4.4% 2.5% 1.8%
Austria 6 8 -0.4% 1.0% -0.3% *3
Belgium -3 18 0.0% -4.8% -2.8% *1
Bulgaria -20 -7 -0.9% 0.8% -2.4% *3
Croatia 3 5 0.0% 0.0% 0.0%
Czech Republic -45 12 -3.5% 2.4% 0.1%
Denmark -28 -8 -7.9% 0.0% 7.7%
Estonia -58 -1 6.3% 0.1% 7.5%
Finland -29 -3 -1.4% 0.0% 0.1%
France -81 26 -0.8% 1.5% 0.4%
Germany -600 101 -7.6% 2.1% 4.8%
Greece -53 15 -7.3% 3.4% 3.4%
Hungary -10 7 -1.7% 2.7% 0.2%
Ireland -19 4 -4.8% 1.0% 4.5%
Italy -71 57 -3.2% 3.1% 0.2%
Latvia 1 -2 0.0% 3.5% -3.5% *3
Netherlands -77 53 -9.2% 7.9% 1.6%
Poland -174 16 -3.2% 0.9% 2.1%
Portugal -56 12 -8.7% 6.0% 2.5% *3
Romania -23 -24 -1.4% -0.9% 1.0%
Slovakia -25 4 -2.4% -0.3% 3.4%
Slovenia -3 0 -0.5% 0.5% -0.9% *3
Spain -253 167 -8.9% 9.8% -1.7% *3
Sweden 2 1 0.0% 0.0% 2.4%
United Kingdom -55 -15 -3.0% 1.2% 4.1%
*1 Cyprus, Lithuania, Luxembourg and Malta do not use coal for power generation.
*2 Less biomass used in 2019
*3 Negative change because of less hydropower generated in 2019
details) (Agora Energiewende and Sandbag, 2020). As a result of these changes, total CO2 emissions from power generation in the EU decreased by about 11.5% in 2019. The manufacturing industry emits about 13% of total EU-28 CO2 emissions from fuel combustion, of which in 2019 emissions decreased by 2%, mostly due to a 5% decrease in CO2 emissions from iron and steel production. In 2019, the total use of main fossil oil products in road transport remained almost flat in the European Union with declining diesel fuel consumption (-0.2%), which makes up 70% of total road fuel use, whereas the use of bioethanol increased by 4.1% and (the smaller use of) biodiesel decreased by -1.1%. This resulted in a 0.3% decrease in total CO2 emissions from road transport, after a year with a similar decrease and four years with increasing emissions (Eurostat, 2020c).

PBL | 49
The buildings sector (residential and commercial and public services) is responsible for 18% of total CO2 emissions from fossil-fuel combustion. In 2019, the small 0.8% increase in direct CO2 emissions from the buildings sector was mainly due to changes in the winter weather in 2019 compared to 2018, resulting in increases in the demand for space heating, in particular in Germany, Italy and France: +0.9%, +3.0% and +3.8%, respectively, in Heating Degree-Days (HDD), that resulted in increases in CO2 emissions of about 1.8%, 1.5% and 0.7%, and the EU-28 total increase of 0.8%, although the average HDDs for the EU-28 total was 1.0% lower than in 2018 (Eurostat, 2020b). HDDs are used to estimate the demand for space heating in the residential and service sectors for specific years, both of which mostly use natural gas or electricity. After the completion of the CO2 FT2019 data set, gas flaring data for 2019 were released by the Global Gas Flaring Reduction Partnership (GGFR), an initiative managed by the World Bank, that shows global CO2 emissions from flaring increased by 3.5% in 2019, the largest increase for many years. Gas flaring is a relatively small source globally and the share of the European Union in it is only 1%. In total EU-28 CO2 emissions it only accounts for 0.1%. In 2019 the EU-28 decreased its CO2 from gas flaring by 12% or 1.0 MtCO2, after an 8% decrease in 2018 (World Bank, 2020b). The EU countries with oil production in the North Sea, the United Kingdom, the Netherlands, Denmark and Norway stand out for minimal flaring — their flaring intensity (amount of gas flared per barrel of oil produced) is very low; the North Sea weighted average, for example, is only a quarter of the global average (Davis and Charles, 2020).
Main energy use in the European Union The European Union’s total primary energy supply (TPES) of about 72 EJ (Exajoule = 1018 Joule) in 2019 is about 11% of present global TPES and has decreased by 7% since 2010. Its present per capita primary energy consumption is at about the same level of that of Japan and is 2.2 times the global average and about 40% higher than that of China. The primary energy supply of the European Union consisted of 37% oil, 29% of renewables plus nuclear, 23% of natural gas, and 11% of coal (BP, 2020; IEA, 2020d). This means that 71% of the EU’s energy supply was still composed of fossil fuels. The 29% share of non-fossil energy consists of 10% nuclear energy, 11% wind and solar energy, 4% hydropower and 4% biomass fuels. In 2019, about 62% of the electricity in the EU-28 was generated from renewable and nuclear sources. This percentage of total power generation is the highest among the top-6 emitters and almost twice the share in China (32%). In 2019, the EU’s TPES decreased by -1.0 EJ or -1.4%, after a minor change of -0.1% in 2018 and three years with increasing TPES. The largest contribution to the decrease is -1.3 EJ (-2.5%) from fossil fuels, mainly coal -17.6% (-1.7 EJ), but partly offset by increasing natural gas, +2.7% (+0.4 EJ). Renewable energy accounted for +0.4 EJ (+2.7%), however nuclear energy decreased by -0.9% (-0.1 EJ). Wind and solar energy contributed +0.6 EJ (+8.2%), which was partly offset by a decrease in hydropower of almost -0.2 EJ (-5.6%) due to non-favourable weather conditions in 2019. In 2019, about 62% of the power generated within the EU-28 was from renewable and nuclear sources and these sources contributed 29% to TPES (using the BP definition of TPES). The share of 29% is 0.8 percentage points higher than in 2018 and 7.8 percentage points higher than in 2010. The growth of renewable energy since 2010 was mainly due to the large annual growth in wind and solar power, with 14.5% per year, on average and 9.2% in 2019.

PBL | 50
Countries contributing most to total EU-28 wind and solar power generation in 2019 are Germany (30.5% share), the United Kingdom (13.5%), Spain (12.5%) and France and Italy (both 8%). In addition, biomass-fired power generation also increased steadily, by an average 5% per year and by 1.3% in 2019 with five countries covering two-thirds of total EU-28 generation: Germany (25%), United Kingdom (18%), Italy (12%), and Sweden and Finland with 7% and 6%. Since 2011, total nuclear energy in the European Union has been decreasing, over time. This is mainly due to a 45% decrease in Germany, since 2011, which is part of the phase-out of nuclear energy agreed upon in the German Parliament (the so-called Energiewende). In 2019, Germany’s share in total EU nuclear energy was about 9%. Retired coal-fired power plants in the EU-28 amounted to about 7.5 GW in 2019, which is the fourth highest year. This represents about one fifth of the global coal-fired plant retirements. Most retirements in the EU-28 were in the United Kingdom (2.7 GW) and Germany (1.2 GW). At present, 14 Member States have committed to phase out coal-fired power plants by 2030. Germany, which has 44.5 GW coal power capacity operating, has pledged to phase out by 2038. Poland, which has 30.9 GW of coal power capacity operating, has not committed to phase out coal power and has planned 1.4 GW of new coal power to start-up in 2020. Other countries with new coal capacity under construction are Germany (1.1 GW), the Czech Republic (0.7 GW), Greece (0.7 GW), whereas Romania and Hungary have new capacity in the preconstruction phase (Shearer et al., 2020). According to the Global Coal Plant Tracker, in 2019 the retired coal capacity in the European Union amounted to 8.4 GW. Apart of the United Kingdom and Germany mentioned above other countries that retired coal-fired plant capacity in 2019 were: Denmark (1.1 GW), Romania 1.0 GW), the Netherlands (0.7 GW), Greece (0.6 GW), Poland (0.6 GW), Spain (0.25 GW) and Finland (0.1 GW). Presently, the total coal-generating capacity is about 113 GW (Global Energy Monitor, 2020; Shearer et al., 2020). The decline in coal power capacity in the EU-27 and United Kingdom continues in 2020: in the first half of 2020 they saw a net reduction of 8.6 GW and another 6.0 GW coal power retirement is scheduled for the second half of 2020 (Shearer, 2020).
Other GHG emissions As they did in 2018, also in 2019 the emissions of non-CO2 greenhouse gases have decreased, collectively by -0.5% (this was -0.9% in 2018). Since 2010, according to our estimated the collective non-CO2 greenhouse gas emissions of the European Union have been varying closely around their 2010 level (Figure 3.6). CH4 emissions are the largest in this group, with a share of 14%, followed by 6.3% for N2O emissions and about 3.6% for F-gas emissions, in total greenhouse gas emissions in the European Union. In 2019, CH4 emissions in the European Union decreased by about -0.3% and F-gas emissions by and estimated -2.7%, whereas N2O emissions were estimated to have increased by about 0.2%, corresponding to a net decrease in these non-CO2 gases of -0.5% or -5 MtCO2 eq (Figure 3.6). The EU’s CH4 emissions continued to decrease for the second year in 2019, by 0.3% corresponding with 1.6 MtCO2 eq, mainly caused by a large -7% decrease in emissions from coal and coke production, and aided by a -1% decrease in both net methane emissions from landfills and from wastewater treatment and discharge, and for coal and waste water, the decreasing trends of previous years were continuing (Table 3.7). These decreasing sources have a share of 3%, 27% and 7%, respectively, and they were partly compensated by emission increases in natural gas production and transmission (transport and distribution) (+3%), which has a share of about 13% (Table 3.7). These sources showed the largest absolute emission changes in 2019. The largest methane source in the European Union is

PBL | 51
enteric fermentation by livestock, predominantly cattle, which accounted for about 31%. Since 2001, CH4 emissions have slowly decreased, the first decade on average by 1.5% per year, aided by downward trends in fossil-fuel production and cattle numbers (Table 3.7). Note that within the European Union-28 oil production took place mainly in the United Kingdom (about three quarters of total EU-28 production), and the remaining quarter mainly in Denmark, Italy, Germany, the Netherlands and in 12 other EU countries. In 2019, total N2O emissions in the European Union remained almost constant (0.2% increase or +0.4 MtCO2 eq), following three years of very small decreases (Figure 3.6). The sources with the largest N2O increases were primarily increase from the use of synthetic nitrogen fertilisers (+2.5%) and of indirect N2O from agricultural sources (+2%), with shares of 18% and 12%. Smaller increases were seen in manure dropped in pasture, range and paddocks (+1%) and manure applied to soils (+0.8%) (Table 3.7).
Table 3.7 Annual changes in main drivers of CH4 and N2O emissions in the EU-28
Code Main driver of CH4 or N2O Average 2001-11
Average 12-16 2017 2018 2019
1B1 Coal production (CH4) -2.4% -4.5% -2.1% -4.7% -13.2% 1B2a1 Oil production (CH4) -6.3% -2.7% -1.5% 5.4% 5.1% 1B2b1 Natural gas production (CH4) -3.5% -5.5% -3.9% -8.9% -9.8% 4A1-d Dairy cattle (CH4, N2O) -1.7% 0.1% -1.4% -0.5% -0.5% 4A1-n Non-dairy cattle (CH4, N2O) -0.9% 0.7% -0.2% -1.6% 0.0% 4C Rice cultivation (CH4) 1.5% -1.6% -0.9% -2.7% -0.5% 4D11 Synthetic N fertiliser use (N2O) -0.8% 1.8% 0.5% 2.6% 2.5% 4D12 Manure on soils (N2O) -0.8% 0.2% 0.1% 0.8% 0.8%
Sources: CH4: IEA, BP, FAO, IRRI, USDA; N2O: FAO, IFA Although emissions from most agricultural sources increased, decreases in N2O emissions from industrial processes (-3%), especially nitric acid production, from fuel combustion (-2%), in particular from coal-fired power plants, and crop residues (-5%) compensated for most of the increases in other sources. These decreasing sources have shares of 12%, 10% and 5%, respectively. The F-gas emissions in European Union are composed of about 89% HFC emissions, on 4% PFC emissions and 7% SF6 emissions. The share of HFCs is relatively high in the EU-28: the global average share is about 80%, whereas the share of SF6 is about half of the global average share off 12.8%. In 2019, F-gas emissions in the European Union decreased by an estimated 3% corresponding with about 5 MtCO2 eq. The decrease is primarily due to about 4% decrease in HFC emissions, mainly from HFC use, since by-product emissions of HFC-23 from HCFC-22 production has only an 4% share in HFC emissions. However, the latter also decreased by an estimated 4%. However, PFC emissions increased by about 8% in 2019, mainly due to by-product PFC emissions from aluminium production, which increases since 2015 after many years with decreasing emissions, but emissions from PFC use also increases since 2015. Also, SF6 emissions increased in 2019 by about 3%, due to a 2.5% increase in emissions from the manufacture and use of SF6-containing electrical switchgear in the electricity sector and an estimated 3.5% increase in emissions from other SF6 uses.
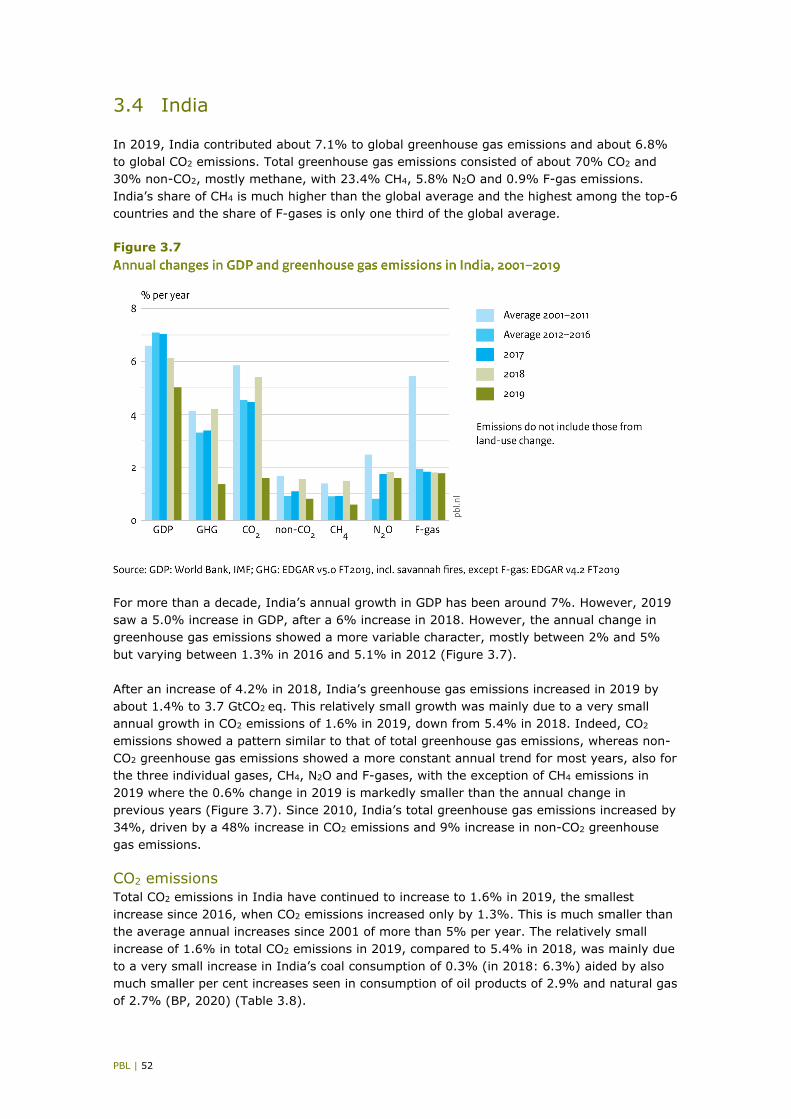
PBL | 52
3.4 India
In 2019, India contributed about 7.1% to global greenhouse gas emissions and about 6.8% to global CO2 emissions. Total greenhouse gas emissions consisted of about 70% CO2 and 30% non-CO2, mostly methane, with 23.4% CH4, 5.8% N2O and 0.9% F-gas emissions. India’s share of CH4 is much higher than the global average and the highest among the top-6 countries and the share of F-gases is only one third of the global average.
Figure 3.7
For more than a decade, India’s annual growth in GDP has been around 7%. However, 2019 saw a 5.0% increase in GDP, after a 6% increase in 2018. However, the annual change in greenhouse gas emissions showed a more variable character, mostly between 2% and 5% but varying between 1.3% in 2016 and 5.1% in 2012 (Figure 3.7). After an increase of 4.2% in 2018, India’s greenhouse gas emissions increased in 2019 by about 1.4% to 3.7 GtCO2 eq. This relatively small growth was mainly due to a very small annual growth in CO2 emissions of 1.6% in 2019, down from 5.4% in 2018. Indeed, CO2 emissions showed a pattern similar to that of total greenhouse gas emissions, whereas non-CO2 greenhouse gas emissions showed a more constant annual trend for most years, also for the three individual gases, CH4, N2O and F-gases, with the exception of CH4 emissions in 2019 where the 0.6% change in 2019 is markedly smaller than the annual change in previous years (Figure 3.7). Since 2010, India’s total greenhouse gas emissions increased by 34%, driven by a 48% increase in CO2 emissions and 9% increase in non-CO2 greenhouse gas emissions.
CO2 emissions Total CO2 emissions in India have continued to increase to 1.6% in 2019, the smallest increase since 2016, when CO2 emissions increased only by 1.3%. This is much smaller than the average annual increases since 2001 of more than 5% per year. The relatively small increase of 1.6% in total CO2 emissions in 2019, compared to 5.4% in 2018, was mainly due to a very small increase in India’s coal consumption of 0.3% (in 2018: 6.3%) aided by also much smaller per cent increases seen in consumption of oil products of 2.9% and natural gas of 2.7% (BP, 2020) (Table 3.8).

PBL | 53
IEA data shows that coal combustion accounts for 70% of India’s total fossil-fuel combustion CO2 emissions, 27% stems from combustion of oil products and 3% is from natural gas. Therefore, the trend in coal consumption in Table 3.8 is paramount for the trend in India’s CO2 emissions. Moreover, about 50% of India’s CO2 emissions from fossil-fuel combustion are the result of power generation, of which 95% are from coal-fired power plants that account for about 70% of India’s coal consumption (IEA, 2019). Therefore, this sector is key in curbing India’s CO2 emissions.
Table 3.8 Trend indicators for annual change in CO2 emissions in India 2000-2019 Indicator Average 2001-11 Average 2012-16 2015 2016 2017 2018 2019
CO2 5.9% 4.6% 2.6% 1.3% 4.5% 5.4% 1.6% TPES* 4.5% 3.2% 2.0% 3.4% 3.2% 5.1% 1.8% 1A-Coal 6.6% 4.5% -2.6% -0.5% 4.7% 6.3% 0.3% 1A-Oil -2.8% 5.7% 10.1% 5.9% 5.1% 4.9% 2.9% 1A-Gas -15.3% -6.6% -1.6% 12.1% 13.7% 8.1% 2.7% Cement 8.8% 3.9% 7.1% -3.3% -3.6% -3.6% 3.4%
* Total Primary Energy Supply (TPES) data are from BP (2020), plus traditional biomass from IEA (2020d), since that is not included in the BP definition of TPES. See note 12 in Section 2.2 for details. Almost all of the remaining coal consumption is used in the manufacturing industry, which is the second largest CO2 emitting sector and makes up for about a quarter of total CO2 emissions from fossil-fuel combustion. Road transport that uses 45% of India’s consumption of oil products, accounts for about 12% of total CO2 emissions and is the third largest source of CO2 emissions. Half of the remaining oil consumption is used in the manufacturing industry and the other half in the buildings sector. Of the relatively small amount of natural gas used in India half is used in electricity generation and the other half in the manufacturing industry (IEA, 2019).
Main energy use in India India’s total primary energy supply (TPES) of about 41 EJ (Exajoule = 1018 Joule) is about 6.5% of global TPES and has increased by 36% since 2010. Presently its per capita primary energy consumption is almost half of the world average, on third of that China and one fifth of that of the European Union. In 2019, 45.6% of India’s total primary energy supply consisted of coal, 24.0% of renewables plus nuclear energy, 25.1% oil, and 5.3% natural gas (IEA, 2020d; BP, 2020). This means that 76% of India’s energy supply still consisted of fossil fuels. The 24% share of non-fossil energy consists of and 16% biomass fuels, 4% hydropower, 3% wind and solar energy and 1% nuclear energy. In 2019, about 22% of the electricity in India was generated from renewable and nuclear sources. As noted before, this report uses the BP definition of TPES, which uses a substitution method for nuclear, hydropower and other non-biomass renewable energy (see note 12 in Section 2.2 for details), plus traditional biomass from the IEA, since that is not included in the BP definition of TPES. In 2019, India’s TPES increased by 0.7 EJ or 1.7%, which is the lowest percentage since 2001. The largest contribution of 0.4 EJ (+1.3%) is from fossil fuels (mainly oil products), while renewable energy accounted for 0.2 EJ (+2.4%) and nuclear energy for 0.1 EJ (+15.2%). Hydropower saw a large increase of 0.2 EJ (+15.9%) due to a strong monsoon

PBL | 54
season, and wind and solar energy contributed 0.1 EJ (+9.4%) to the increase of TPES, which was partly offset by a decrease in biomass fuel use of 0.07 EJ (-1.1%). Electricity generation increased by 0.5% in 2019, which is the smallest change since 1990, considering that the average annual growth in the last three decades was 6.2% per year. The only other year in the last 30 years that had a growth under 1% was 2005 with a growth of 0.9%. In 2019, the fraction of power generation by fossil fuels was 78% (73% from coal, 4.5% from natural gas and 0.5% from oil), which is the largest fraction of the five largest CO2 emitting countries and the European Union. Renewable energy accounted for 19% (hydropower 10% and wind and solar power 9%) and nuclear energy for 3%. The changes in 2019 in the energy mix for power generation were triggered by the large 15.9% increase in hydropower due to a strong monsoon season and the continued growth of wind and solar power by 9.8% in 2019. With a demand growth of 0.5% in 2019 this forced total fossil-fuel fired power generation to decrease by 2.7%, effectively mostly reducing coal-fired power generation by 2.6%, instead of only mitigating the increase in coal used in power generation as was the case since 2016. In 2019, India added 8.2 GW new capacity to its ‘coal fleet’ and started with the construction at four sites of 8.8 GW of new coal-fired capacity, despite having already 19.3 GW of coal-fired power plants under construction, which were put on hold mostly because of financial problems (Shearer et al., 2020). Moreover, over 40 GW and maybe as high as 70 GW of commissioned and under construction coal-fired power capacity were already financially stressed in 2018, which presents a systemic financial risk for the government (Worrall et al., 2018). Also, in 2019, newly proposed coal-fired capacity amounted to 1.4 GW. Coal-fired plants retired in 2019 amounted to 0.8 GW, which is far less than in 2017 and 2018. By the end of 2019, the total coal-generated capacity was 228 GW (Shearer et al., 2020). Please note the specific characteristic of India’s primary energy supply: the very high shares of traditional biomass used as fuel from 32% in 2000, 25% in 2010 to 17% in 2018. For most other large countries, total traditional biomass shares were generally 10% or less. Another feature is India’s large reliance on coal (46% in 2019), which it has in common with China, as both countries have large domestic coal reserves and thus coal production and consumption
Other GHG emissions Of the 30% non-CO2 greenhouse gas emissions in India 23% are from methane, almost 6% from nitrous oxide and 0.9% from the F-gases. India’s share of CH4 is about a quarter higher than the global average share of about 19% and about a quarter of the global of SF6 emissions of about 3.3%. In 2019, CH4 emissions in India increased by about 0.6%, N2O emissions by about 1.6% and F-gases were estimated to have increased by 1.8% (Figure 3.7). Since 2010, all of India’s non-CO2 greenhouse gas emissions have been increasing, collectively by 10%. In 2019, the increase was estimated at 0.8%. With a share in total greenhouse gas emissions of 23%, CH4 emissions are by far the largest in this group, followed by 5.8% for N2O and about 0.9% for F-gas. The 30% share of non-CO2 greenhouse gases in total greenhouse gas emissions is among the highest of the top-6 countries. In 2019, CH4 emissions continued to increase in India, by 0.6% or 5 GtCO2 eq, following a 1.5% increase in 2018. The increase in 2019 was mainly caused by an emission increase in enteric fermentation from livestock (+0.7%), together with those from wastewater treatment and discharge (+1.5%) and landfill (+2.1%), continuing the increasing trend of previous

PBL | 55
years (Table 3.9). These increasing sources have shares of 41%, 18% and 8% in total CH4 emissions. These increases are somewhat mitigated notably by a decrease in emissions from rice cultivation (-1.3%) and from natural gas production and transmission (transport and distribution) (-2.2%), both of which have a share of 11% (Table 3.9).
Table 3.9 Annual changes in main drivers of CH4 and N2O emissions in India
Code Main driver of CH4 or N2O Average 2001-11
Average 12-16 2017 2018 2019
1B1 Coal production (CH4) 4.9% 3.8% 0.7% 6.9% -0.5% 1B2a1 Oil production (CH4) 1.5% -1.2% 0.0% -2.3% -5.2% 1B2b1 Natural gas production (CH4) 4.9% -7.9% 2.9% 0.7% -2.1% 4A1-d Dairy cattle (CH4, N2O) 2.6% 2.4% 3.6% 3.8% 3.6% 4A1-n Non-dairy cattle (CH4, N2O) -0.6% -1.7% -2.0% -1.9% -1.7% 4C Rice cultivation (CH4) -0.1% -0.4% 1.4% 1.6% -1.3% 4D11 Synthetic N fertiliser use (N2O) 0.0% -0.7% 1.3% 1.3% 1.3% 4D12 Manure on soils (N2O) 0.0% 0.5% 0.4% 0.4% 0.4%
Sources: CH4: IEA, BP, FAO, IRRI, USDA; N2O: FAO, IFA In 2019, N2O emissions also continued to increase, for the sixth consecutive year, by 1.6% corresponding to 3.3 GtCO2 eq. This increase is in line with emissions in the five preceding years. The increase in 2019 was mainly caused by large emission increases from N-fixing crops and crop residues (+7.8%) that accounts for more than one third of the total increase, together with smaller increases from other agricultural activities, in particular the use of synthetic nitrogen fertilisers (+1.3%), which have shares in total N2O emissions of 25% and 22% (Table 3.9). Direct and indirect N2O emissions from fuel combustion, with shares of 13%% and 10%, also contributed considerably to the increase (+1.1% and +0.8%). All sources of N2O emissions in India related to agricultural activities account for about two thirds of India’s total N2O emissions. In 2019, F-gas emissions were composed of about 68% HFC emissions, 9% PFC emissions and 23% SF6 emissions. The share of HFCs is relatively low in India: the global average share is about 80%, and India’s share of SF6 are almost twice the global averages. F-gas emissions increased in 2019 by an estimated 1.8% that corresponds with 0.6 MtCO2 eq. This is similar to the annual increases in the five preceding years, but much less than in the years 2001-2011, when the average annual increase was 5.4% (Table 3.8). The increase is primarily due to a 1% increase in HFC emissions and about 3% increase in SF6 emissions. HFC emissions in India are accounted for as by-product HFC-23 from HCFC-22 manufacture, as HFC emissions from the use of HFCs (e.g. HFC-134a) are currently not accounted for. The increase in SF6 emissions is mainly from 3% increase in SF6 use in electrical equipment, which accounts for virtually all (i.e. 99%) of India’s total SF6 emissions. PFC emissions increased by about 4%, mainly from a similar increase in PFC emissions as by-product from aluminium production that accounts for most (i.e. 97%) of PFC emissions. Since 2001 PFC and SF6 emissions have been increasing more rapidly than HFC emissions, at annual rates of 3% to 4%.

PBL | 56
3.5 Russian Federation
In 2019, the Russian Federation contributed about 4.9% to global greenhouse gas emissions and about 4.7% to global CO2 emissions. Total greenhouse gas emissions consisted of 70.5% CO2 and 20.5% non-CO2 emissions: 18.9% CH4, 3.2% N2O and 7.4% F-gas. India’s share of F-gases is more than twice as high as the global average. Since 2001 to 2012, Russia’s average annual GDP growth has been around 5%; however, since 2013 the average annual growth was about 1% but varying between -2.0% in 2015 and +2.5% in 2018. In 2014 and 2015, the Russian economy suffered a financial crisis due to a sharp devaluation of the Russian ruble, the fall of the oil price in the second half of 2014 and international economic sanctions imposed on Russia. The annual change in the Russian greenhouse gas emissions also shows a variable character as is shown in Figure 3.8. Since 2011 the average annual change was 0.8% but varies between -1.9% in 2013 and +4.1% in 2018.
Figure 3.8 After the large increase of 4.1% in 2018, Russia’s greenhouse gas emissions showed a modest increase of 0.9% in 2019, to 2.54 GtCO2 eq. The much smaller increase was mainly due to a decline in CO2 emissions of 0.8% in 2019, down from 3.9%% growth in 2018, whereas the non-CO2 emissions increased by 4.9% in 2019, similar to the 4.8% growth in 2018. CO2 emissions has a 70% share in total greenhouse gas emissions from the Russian Federation and thus determines to a large extent the trend in total greenhouse gas emissions. However, as shown in Figure 3.8, the growth in CH4 emissions in 2019 was lower than in 2018, whereas N2O and F-gas emissions increased their growth in 2019 compared to 2018. According to our estimates the 17% increase in F-gas emissions was the main contribution to the total 0.9% increase in Russia’s greenhouse gas emissions, further aided by the 1.3% increase in CH4 emissions and increased N2O emissions, but partially offset by the 0.8% decline in CO2 emissions. However, we note once more the large uncertainties in F-gas emissions at country level, as discussed in Section 2.1, and therefore also in the estimated trend in total greenhouse gas emissions in 2019.
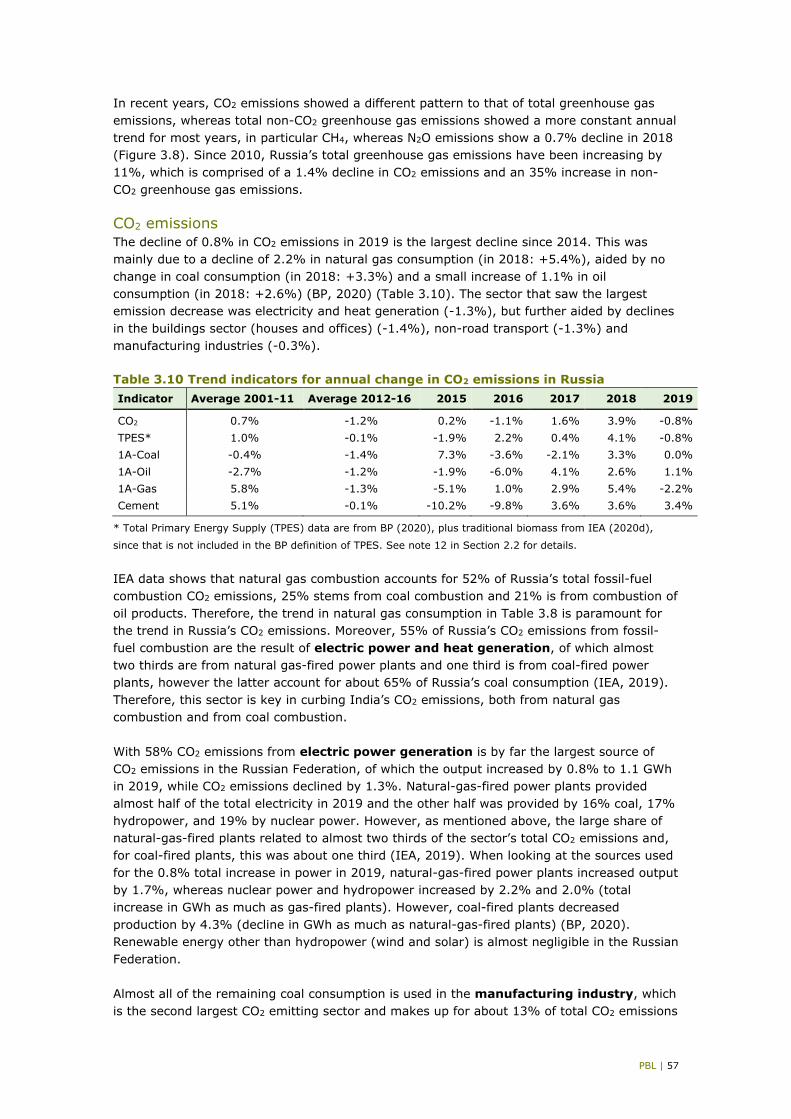
PBL | 57
In recent years, CO2 emissions showed a different pattern to that of total greenhouse gas emissions, whereas total non-CO2 greenhouse gas emissions showed a more constant annual trend for most years, in particular CH4, whereas N2O emissions show a 0.7% decline in 2018 (Figure 3.8). Since 2010, Russia’s total greenhouse gas emissions have been increasing by 11%, which is comprised of a 1.4% decline in CO2 emissions and an 35% increase in non-CO2 greenhouse gas emissions.
CO2 emissions The decline of 0.8% in CO2 emissions in 2019 is the largest decline since 2014. This was mainly due to a decline of 2.2% in natural gas consumption (in 2018: +5.4%), aided by no change in coal consumption (in 2018: +3.3%) and a small increase of 1.1% in oil consumption (in 2018: +2.6%) (BP, 2020) (Table 3.10). The sector that saw the largest emission decrease was electricity and heat generation (-1.3%), but further aided by declines in the buildings sector (houses and offices) (-1.4%), non-road transport (-1.3%) and manufacturing industries (-0.3%).
Table 3.10 Trend indicators for annual change in CO2 emissions in Russia Indicator Average 2001-11 Average 2012-16 2015 2016 2017 2018 2019
CO2 0.7% -1.2% 0.2% -1.1% 1.6% 3.9% -0.8% TPES* 1.0% -0.1% -1.9% 2.2% 0.4% 4.1% -0.8% 1A-Coal -0.4% -1.4% 7.3% -3.6% -2.1% 3.3% 0.0% 1A-Oil -2.7% -1.2% -1.9% -6.0% 4.1% 2.6% 1.1% 1A-Gas 5.8% -1.3% -5.1% 1.0% 2.9% 5.4% -2.2% Cement 5.1% -0.1% -10.2% -9.8% 3.6% 3.6% 3.4%
* Total Primary Energy Supply (TPES) data are from BP (2020), plus traditional biomass from IEA (2020d),
since that is not included in the BP definition of TPES. See note 12 in Section 2.2 for details.
IEA data shows that natural gas combustion accounts for 52% of Russia’s total fossil-fuel combustion CO2 emissions, 25% stems from coal combustion and 21% is from combustion of oil products. Therefore, the trend in natural gas consumption in Table 3.8 is paramount for the trend in Russia’s CO2 emissions. Moreover, 55% of Russia’s CO2 emissions from fossil-fuel combustion are the result of electric power and heat generation, of which almost two thirds are from natural gas-fired power plants and one third is from coal-fired power plants, however the latter account for about 65% of Russia’s coal consumption (IEA, 2019). Therefore, this sector is key in curbing India’s CO2 emissions, both from natural gas combustion and from coal combustion. With 58% CO2 emissions from electric power generation is by far the largest source of CO2 emissions in the Russian Federation, of which the output increased by 0.8% to 1.1 GWh in 2019, while CO2 emissions declined by 1.3%. Natural-gas-fired power plants provided almost half of the total electricity in 2019 and the other half was provided by 16% coal, 17% hydropower, and 19% by nuclear power. However, as mentioned above, the large share of natural-gas-fired plants related to almost two thirds of the sector’s total CO2 emissions and, for coal-fired plants, this was about one third (IEA, 2019). When looking at the sources used for the 0.8% total increase in power in 2019, natural-gas-fired power plants increased output by 1.7%, whereas nuclear power and hydropower increased by 2.2% and 2.0% (total increase in GWh as much as gas-fired plants). However, coal-fired plants decreased production by 4.3% (decline in GWh as much as natural-gas-fired plants) (BP, 2020). Renewable energy other than hydropower (wind and solar) is almost negligible in the Russian Federation. Almost all of the remaining coal consumption is used in the manufacturing industry, which is the second largest CO2 emitting sector and makes up for about 13% of total CO2 emissions

PBL | 58
from fossil-fuel combustion, with shares of coal and natural gas of 45% and 35%. With shares of 10% each, road transport (mainly oil products) and the buildings sector (70% natural gas) are the third and fourth largest sources of Russia’s CO2 emissions. The fifth largest CO2 emitting sector is the non-road transport sector with a share of 6%. This is much higher than most other countries because the Russian Federation is a large exporter of oil and natural gas and three quarters of this sector’s CO2 emissions were from natural gas used in the transport and export of natural gas and oil. The Russian Federation has a relatively high share of 8% of CO2 emissions from the non-energy use of fossil fuels, twice as high as the share of this source in global total CO2 emissions. The largest sources in Russia in this category are the use of natural gas as chemical feedstock in ammonia production and the use of coke as reducing agent in blast furnaces to convert iron oxides to iron. After the completion of the CO2 FT2019 data set, gas flaring data for 2019 were released by the Global Gas Flaring Reduction Partnership (GGFR), an initiative managed by the World Bank, that shows global CO2 emissions from flaring increased by 3.5% in 2019, the largest increase for many years. Although gas flaring is globally a relatively small source, with a share of 15.5% in global flaring emissions the Russian Federation is the country with the largest CO2 flaring emissions. This source contributes 2.5% to total Russian CO2 emissions, three times the global average share, and emissions from gas flaring in Russia increased by 9% or 4.1 MtCO2 in 2019, the second largest contribution to the global flaring increase in 2019 (in 2018 the increase was 7%) (World Bank, 2020b).
Main energy use in the Russian Federation The total primary energy supply (TPES) of the Russian Federation of about 30 EJ (Exajoule = 1018 Joule) is about 5% of global TPES and has increased by 6% since 2010. Presently its per capita primary energy consumption is more than three times of the world average, twice as high as of that China and two third of that of the United States. In 2019, 53.6% of Russia’s total primary energy supply consisted of natural gas, 22.0% oil, 12.1% coal, and 12.4% renewables plus nuclear (IEA, 2020d; BP, 2020). This means that 88% of Russia’s energy supply still consisted of fossil fuels. The 12% share of non-fossil energy consists of 6% hydropower and 6% nuclear energy. Other renewables are less than 1%. At present, about 37% of the electricity in the Russian Federation was generated using renewable and nuclear sources. In 2019, Russia’s TPES decreased by 0.2 EJ or -0.8%, which is the lowest percentage since 2015. The largest contribution to the decrease is of 0.4 EJ (-2.2%) is from natural gas, which was partly offset by increases in oil products of almost 0.1 EJ (+1.1%) and in hydropower (+1.6%) and nuclear energy for (+1.8%). After a 1.7% increase in 2018, electricity generation increased by 0.8% in 2019, which is within the normal range, considering that the average annual growth in the last two decades was 1.5% per year. In 2019, the fraction of power generation by fossil fuels was 63% (45.5% from natural gas, 16.3% from coal and 1.5% from oil), which is the same fraction as the global average fraction and as that in the United States. Renewable energy accounted for 18% (hydropower 17.4% and other sources 0.6%) and nuclear energy for 18.7%. The changes in 2019 in the energy mix for power generation were triggered by the continued increase in hydropower, by 2.0 in 2019, and the continued growth in nuclear power, by 2.2% in 2019. In 2019 three new reactors were started up and another one was officially closed. (WNISR, 2020). With a demand growth of 0.8% in 2019 this forced total fossil-fuel fired

PBL | 59
power generation to decrease by 2.7%, effectively mostly reducing coal-fired power generation by 4.3% while gas-fired generation increased by 1.7% (BP, 2020). After two years of (almost) no retiring of any coal capacity, Russian coal-fired plants retired in 2019 amounted to 1.4 GW and retirements continued in the first half of 2020 with 1.1 GW retired capacity. By the end of 2019, the Russian Federation had total capacity 45.7 GW of coal-fired power plants in operation (Shearer et al., 2020).
Other GHG emissions Of the 29.5% non-CO2 emissions in the Russian Federation 19% are from methane, 3.2% from nitrous oxide and about 7.4% from the F-gases. The share of SF6 is about double of the global of SF6 emissions of about 3.3%. In contrast to CO2 emissions that decreased in 2019, non-CO2 greenhouse gas emissions in the Russian Federation increased collectively by an estimated 4.9% in 2019 corresponding with about 35 MtCO2 eq (Figure 3.8). In 2019, CH4 emissions increased by about 1.3%, N2O emissions by about 2.1% and F-gases were estimated to have increased by 17% (Figure 3.8). In 2019, CH4 emissions continued to increase in the Russian Federation, by 1.3% or 6.3 MtCO2 eq, following a 2.7% increase in 2018. The increase in 2019 was mainly caused by an emission increase from natural gas production and transmission (transport and distribution) (+1.6%), an increase in gas venting during oil production (+3.0%) and a net increase from landfills (+3.0%), continuing the increasing trends of previous years. These increasing CH4 sources have a share of 29%, 16% and 15%, respectively. These increases were somewhat mitigated notably by a 1.5% emission decrease from enteric fermentation by ruminating animals and a 0.4% net decrease in CH4 emissions from coal mining, which have shares in total CH4 emissions of 9% and 15% (Table 3.11).
Table 3.11 Annual changes in main drivers of CH4 and N2O emissions in Russia
Code Main driver of CH4 or N2O Average 2001-11
Average 12-16 2017 2018 2019
1B1 Coal production (CH4) 2.3% 4.9% 6.3% 8.3% -0.3% 1B2a1 Oil production (CH4) 4.3% 1.3% -0.2% 1.4% 0.8% 1B2b1 Natural gas production (CH4) 1.5% -0.5% 7.9% -0.6% 1.5% 4A1-d Dairy cattle (CH4, N2O) -4.0% -2.4% -2.2% -4.5% -2.9% 4A1-n Non-dairy cattle (CH4, N2O) -2.3% -0.7% -1.0% 2.3% -0.9% 4C Rice cultivation (CH4) 1.9% -0.3% -8.9% -2.9% -3.1% 4D11 Synthetic N fertiliser use (N2O) -1.6% 3.0% 4.7% 4.5% 4.3% 4D12 Manure on soils (N2O) -1.6% 0.9% -0.1% 0.0% 0.0%
Sources: CH4: IEA, BP, FAO, IRRI, USDA; N2O: FAO, IFA
In 2019, N2O emissions in Russia increased by 2.1% or 1.7 MtCO2 eq, after a decrease of 0.7% in 2018 that was mainly due to a large 9% decrease in emissions from crop residues (Figure 3.8). The net increase in 2019 was mainly caused by emission increases from industrial processes (+4%), in particular nitric acid production, which have a 29% share in total emissions, which accounts for more than half of the total increase. Other large increases are an increase from the use of synthetic fertilisers (+4.3%) (Table 3.11), an increase from crop residues (+4%) and an increase in indirect N2O from agricultural sources (+3%). These increasing sources have shares of 13%, 15% and 10%, respectively. These increases were somewhat mitigated by a 1% decrease from fuel combustion and a 3% decrease in indirect N2O from NOx emissions by fuel combustion, with 8% and 6% shares.

PBL | 60
In 2019, total Russian F-gas emissions were composed of about 85% HFC emissions, 8% PFC emissions and 6% SF6 emissions. The share of SF6 is relatively low in the Russian Federation: the global average share is about 13%, and Russia’s share of SF6 is about half the global average. F-gas emissions in Russia increased in 2019 by an estimated 17% that corresponds with 27 MtCO2 eq. This is similar to the annual increases in the two preceding years, but much more than in the years 2001-2011 (Figure 3.8). The 17% increase is primarily due to a 23% increase in HFC emissions in 2019. Half of this increase is due to a 35% increase in HFC-23 emissions as by-product from HCFC-22 manufacture and the other half from a 14% emission increase from the use of HFCs, in particular HFC-143a and HFC-125. In 2019, PFC emissions decreased by about 15% due to a similar decrease in PFC emissions as by-product from aluminium production, which are generally decreasing over time. The 7% remaining PFC emissions from PFC uses are slowly increasing over time, by 0.3% per year. In 2019, SF6 emissions, estimated to have increased by 1.2%, most of which from the use of SF6-containing switchgear in the electricity sector, were
3.6 Japan
Japan contributed about 2.7% to global greenhouse gas emissions and about 3.0% to global CO2 emissions in 2019. Total greenhouse gas emissions were 85.1% CO2 and 14.9% non-CO2 emissions: 3.8% CH4, 1.3% N2O and 9.8% F-gas. The composition of the mix of greenhouse gases is in Japan much different not only from the other top-6 emitting countries but from all top-30 emitting countries. Japan’s share of CO2 is the highest among the top-6 with a share that is more than 10 percentage points higher than the global average. Consequently, Japan’s non-CO2 greenhouse gas emissions had a relatively small share of 14.9%. This is mainly due to the very small share of CH4 emissions of 3.8% - about a quarter of the global average -as Japan has almost no domestic fossil-fuel production. However, also the share N2O is very small, about a quarter of the global average — due to the virtually absence of N2O from manure dropped in pasture, range and paddocks — whereas the share of F-gases is three times as high as the global average. Since 2011, Japan’s annual economic growth has been about 1.0% on average. In 2019, the economy of Japan grew by about 0.7%, slightly up from 0.3% in 2018. In contrast, from 2010 to 2013 total greenhouse gas emissions have increased by 10% in 2013 and decreased every year since 2014 by the same amount as the 2010-2013 increase. Thus, on average greenhouse gas emissions did not change since 2010. After a 0.3% decrease in 2018, total greenhouse gas emissions decreased in 2019 by 1.6% to a level of 1.36 GtCO2 eq, the same level as in 2010 (Figure 3.9). The 1.6% decrease in 2019 was mainly due to a decline in CO2 emissions of 2.1%, whereas non-CO2 emissions increased by 1.6% (which make up 15% of Japan’s total greenhouse gas emissions). The latter was mainly due to a 3.1% increase in F-gas emissions that account for two-thirds of the non-CO2 emissions, whereas the -1.0% decline of CH4 emissions did only offset a very small part of the F-gas increase, let alone the 1.6% decline of N2O emissions in 2019. Figure 3.9 shows the emission trends per gas, since 2010, as well as total greenhouse gas and GDP. Since 2010, Japan’s total greenhouse gas emissions increased by 3.0%. This trend was mainly set by that in CO2 emissions, which have been increasing by 3.7% since 2010

PBL | 61
Figure 3.9
and by the non-CO2 emissions with an increase of 23% due to F-gas emissions increasing by more than 50% since 2010, as shown in Figure 3.9. Since 2010, Japan’s CH4 and N2O emissions have declined by 14% an 10%, respectively, but these are much smaller amounts than for F-gas emissions. Also, inter-annual changes in total greenhouse gas emissions were mostly due to similar variations in CO2 emissions, whereas the non-CO2 emission trend was much smoother and showed a small overall rise of 32%, since 2010.
CO2 emissions Since the peak year 2013, total CO2 emissions in Japan have continued to decline by 2.1% in 2019 to 1.15 GtCO2, the largest per cent decrease since 2015. The larger decline of 2.1% in total CO2 emissions in 2019, compared to 1.7% in 2018, was mainly due to a much larger per cent decline in Japan’s natural gas consumption of 6.6% (in 2018: 1.1%), although aided by smaller per cent declines seen in the consumption of coal of 1.7% and oil products of 1.3% (BP, 2020) (Table 3.12). IEA data shows that coal combustion accounts for about 40% of Japan’s total fossil-fuel combustion CO2 emissions, 35% stems from combustion of oil products and 20% is from natural gas. Therefore, the trend in coal consumption in Table 3.12 is paramount for the trend in Japan’s CO2 emissions. Moreover, almost 50% of the CO2 emissions from fossil-fuel combustion are the result of power generation, of which 55% is from coal-fired power plants. Moreover, coal-fired power plants account for almost 75% of total coal consumption (IEA, 2019). Half of total oil combustion CO2 emissions is from use in transport. Thus, power generation and transport account for two thirds of total CO2 emissions from fossil-fuel combustion. Therefore, these sectors are key in curbing Japan’s CO2 emissions. With a 50% share in 2019, electric power generation is the largest source of CO2 emissions in Japan, of which the output decreased by 1.9% to 1.0 GWh in 2019, while CO2 emissions declined by 3.2%. Natural-gas-fired power plants and coal-fired power provided a respective 35% and 31% of total power in 2019, with a 4% share of oil, 19% of renewable energy (of which 7% hydropower) and 6% nuclear power (BP, 2020). The second largest CO2 emitting sector was the manufacturing industry with a share of about 18%, of which more than half was from coal combustion and almost one third from oil

PBL | 62
combustion. In other words, coal combustion in the energy and industry sectors accounted for about 95% of Japan’s CO2 emissions from coal combustion. With a share of about 16%, road transport was the third largest source of CO2 (IEA, 2019).
Table 3.12 Trend indicators for annual change in CO2 emissions in Japan 2000-2019 Indicator Average 2001-11 Average 2012-16 2015 2016 2017 2018 2019
CO2 0.1% -0.6% -3.6% -1.2% -1.2% -1.7% -2.1% TPES* -0.8% -1.4% -1.4% -1.7% 1.3% -0.2% -0.9% 1A-Coal 1.5% 1.7% -0.9% -1.7% 0.3% -2.0% -1.7% 1A-Oil 3.6% -3.6% -4.9% -3.1% -3.1% -2.8% -1.3% 1A-Gas -3.3% 0.3% -4.8% 1.9% -2.5% -1.1% -6.6% Cement -4.1% 0.8% -5.3% -2.9% -0.6% -0.6% 3.4%
* Total Primary Energy Supply (TPES) data are from BP (2020), plus traditional biomass from IEA (2020d), since that is not included in the BP definition of TPES. See note 12 in Section 2.2 for details.
Main energy use in Japan Japan’s total primary energy supply (TPES) of about 18.8 EJ (Exajoule = 1018 Joule) is about 3.4% of global TPES and has declines by 12% since 2010. Presently its per capita primary energy consumption is at about the same level of that of the European Union and is 2.2 times the global average. In 2019, 40.0% of Japan’s total primary energy supply (TPES) consisted of oil, 26.0% of coal, 20.6% of natural gas, and 13.4% of renewables plus nuclear (IEA, 2020d; BP, 2020). This means that 86.6% of Japan’s energy supply still consisted of fossil fuels. The 13% share of non-fossil energy in 2019 consists of 3.5% hydropower, 5.8% wind and solar energy, 0.9% biomass and 4.0% nuclear energy. In 2019, about 29% of the electricity in India was generated from renewable and nuclear sources. In 2019, Japan’s TPES continued to decline by 0.2 EJ or 0.9%. The largest contribution of 0.5 EJ (-2.7%) is from fossil fuels (mainly natural gas by 0.3 EJ (-6.6%) and also hydropower saw a decline of 0.1 EJ (-9.1%%) due to unfavourable weather conditions. These declines were were partly offset by increases in wind and solar energy contributing 0.2 EJ (+24.1%) and nuclear energy contributing 0.1 EJ (+33.2%). After the tsunami and Fukushima nuclear accident in 2011 nuclear power plants suspended operations for inspections, which was compensated by the increases in the shares of natural gas and coal, whereas the share of oil products declined (IEA, 2020d; BP, 2020). All natural gas consumption consisted of gas imported as Liquified Natural Gas (LNG) (EIA, 2019). In addition, renewable energy (mainly wind and solar) has shown a relatively large and continuous annual growth since 2010, but hydropower remained almost constant. Since 2014, nuclear power has slowly been restarted and is increasing steadily again, and as nuclear power increases, a further decline in natural-gas-fired power plants is likely (IEA, 2019; BP, 2020; EIA, 2018). In 2018, Japan has restarted five nuclear power reactors. Thus, out of the remaining fleet of 34 operable reactors, 9 are currently operating. In September 2019, Japan has permanently shut down the four Fukushima-Daini reactors and the Genkai-2 reactor. In 2019, coal-fired power plants started up with a capacity of 1.3 GW. By the end of 2019, the total coal-generating capacity in Japan was 46.6 GW. Also, Japan has 9.3 GW in coal-fired capacity under construction, of which 1.8 GW started in 2019, and it has 21 coal-fired units under development with a total capacity of 11.9 GW (Shearer et al., 2020).

PBL | 63
Other GHG emissions Of the 15% non-CO2 emissions in Japan about 3.8% are from methane, 1.3% from nitrous oxide and almost 10% from F-gases. Japan’s share of non-CO2 emissions is about half of the global average share of about 27.5% and the lowest of the top-6 countries: the shares of CH4 and N2O are about one fifth and one quarter of the global average shares of about 19% and 5%, whereas the share of SF6 is triple that of the global of SF6 emissions of 3.3%. In contrast to CO2 emissions, which decreased since 2013 and by 2.1% in 2019, Japan’s emissions of non-CO2 greenhouse gases have increased much more since 2010, collectively by 26%, and by an estimated 1.6% in 2019 corresponding with about 3 MtCO2 eq (Figure 3.12). In 2019, CH4 emissions continued to decrease for the fifth year by 1.0% or -0.5 MtCO2 eq, after having constant CH4 emissions in 2018. Compared to 1990, emissions have decreased by 35% and 13% compared with 2010. The decrease in 2019 was caused by decreases in CH4 emissions from enteric fermentation by ruminating animals (-0.7%), in particular non-dairy cattle, rice cultivation (-0.8%) and landfills (-5%), the latter continuing the decreasing trend of previous years. (Table 3.13). These sources showed the largest absolute emission changes in 2019 and have shares of 36%, 31% and 4.5%, respectively. Most other sources also showed declining emissions in 2019.
Table 3.13 Annual changes in main drivers of CH4 and N2O emissions in Japan
Code Main driver of CH4 or N2O Average 2001-11
Average 12-16 2017 2018 2019
-24.0% -27.1% 1B1 Coal production (CH4) -7.9% 3.9% 3.1% -24.0% -27.1% 1B2a1 Oil production (CH4) 0.9% -8.6% -1.1% -8.9% -9.8% 1B2b1 Natural gas production (CH4) 3.1% -5.2% 4.6% -9.2% -10.1% 4A1-d Dairy cattle (CH4, N2O) -2.0% -2.7% -2.2% -0.6% -1.3% 4A1-n Non-dairy cattle (CH4, N2O) -0.3% -1.8% 0.6% 0.8% -0.6% 4C Rice cultivation (CH4) -1.0% -1.3% -0.9% 0.3% -0.8% 4D11 Synthetic N fertiliser use (N2O) 1.1% -2.5% 0.0% 0.0% 0.0% 4D12 Manure on soils (N2O) 1.1% 2.4% 0.4% 0.4% 0.4% Sources: CH4: IEA, BP, FAO, IRRI, USDA; N2O: FAO, IFA In 2019, N2O emissions also continued to decrease in Japan, for the sixth consecutive year, by 1.6% which corresponds to 0.3 MtCO2 eq. This is in line with the four previous years. Compared to 2010, N2O emissions have declined by 11%. The decrease in 2019 was mainly caused by large decreases in emissions from fossil-fuel combustion (-1.8%), industrial processes (-12%) and N2O emissions from NOx emissions from fuel combustion. These sources showed the largest absolute emission changes in 2019 and have shares of 35%, 4% and 15%, respectively. Within these sectors power generation, road transport and caprolactam production saw the largest decreases. The largest source of N2O emissions in Japan relates to fuel combustion with a share of more than one third and a 50% share when including indirect N2O emissions from that source. Most of the other large sources related to agricultural activities. In 2019, Japan’s total F-gas emissions were mainly composed of about 93% HFC emissions and only 5% PFC emissions and 2.5% SF6 emissions. The 93% share of HFCs is relatively high; the global average share is about 80%, and the 2.5% share of SF6 is very low, about one fifth of the global average. F-gas emissions in Japan increased in 2019 by an estimated 3% that corresponds with 4 MtCO2 eq. This is similar to the annual increases in the two preceding years, but than double compared with the years 2012-2016 (Figure 3.9).

PBL | 64
The 3% increase in HFC emissions is the primary cause of the 3% increase in total F-gas emissions, which are almost all from HFC use, since HFC-23 by-product emissions from HCFC-22 production declined strongly in recent years. PFC emissions increased only slightly in 2019 by about 1.5% from PFC uses that were decreasing over time, but in the last years appear to have changed. PFC emissions as by-product stopped in 2015 as aluminium production was discontinued in 2015. SF6 emissions also increased only slightly in 2019 by about 1%, mainly due to a 2% increase in emissions from other sources than the use of SF6-containing switchgear in the electricity sector, which SF6 emissions from decreased continuing trends in previous years.

PBL | 65
Appendices A. CO2 emissions per country, per capita, and per USD of
GDP
We note that, for CO2 emissions, the estimated uncertainty is generally between 2% to 5%, with exceptions of up to 10% or 15%. For CO2 emissions per USD of GDP, the uncertainty is estimated to be larger, generally at about 10%, but for some countries, such as the Russian Federation and China, this is about 20%, due to the uncertainty estimate in the GDP data.
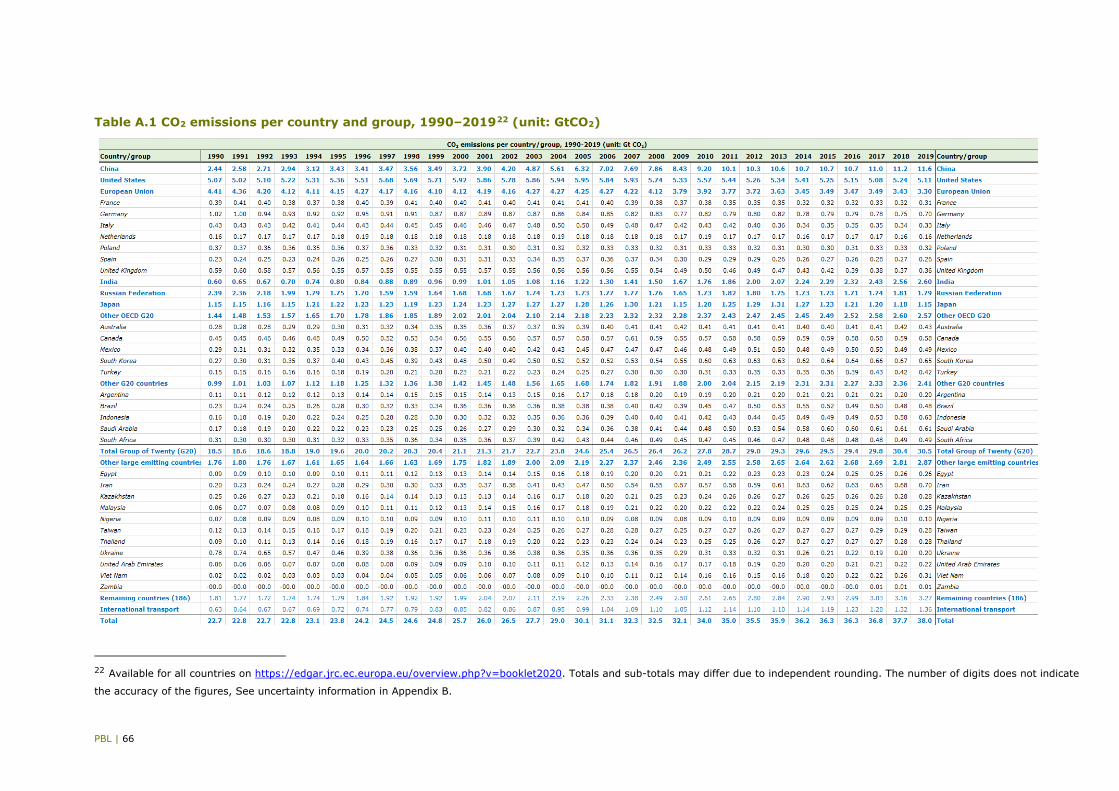
PBL | 66
Table A.1 CO2 emissions per country and group, 1990–201922 (unit: GtCO2)
22 Available for all countries on https://edgar.jrc.ec.europa.eu/overview.php?v=booklet2020. Totals and sub-totals may differ due to independent rounding. The number of digits does not indicate
the accuracy of the figures, See uncertainty information in Appendix B.

PBL | 67
Table A.2 CO2 emissions per capita, per country and group, 1990–201923 (unit: tonnes of CO2 per person)
23 Available for all countries on https://edgar.jrc.ec.europa.eu/overview.php?v=booklet2020. Totals and sub-totals may differ due to independent rounding. The number of digits does not indicate the accuracy of the figures, See uncertainty information in Appendix B.

PBL | 68
Table A.3 CO2 emissions per USD of GDP, per country and group, 1990–201924 (unit: kg CO2 per 1,000 USD of GDP [PPP, 2017 prices])
24 Available for all countries on https://edgar.jrc.ec.europa.eu/overview.php?v=booklet2020. Totals and sub-totals may differ due to independent rounding. The number of digits does not indicate the accuracy of the figures, See uncertainty information in the Appendix B.
CO2 emissions per USD of GDP, per country/group, 1990-2019 (unit: kg CO2 per 1,000 USD of GDP (PPP, 2011 prices))
Country/group 1990 1991 1992 1993 1994 1995 1996 1997 1998 1999 2000 2001 2002 2003 2004 2005 2006 2007 2008 2009 2010 2011 2012 2013 2014 2015 2016 2017 2018 2019 Country/group
China 1370 1330 1230 1180 1110 1110 1010 940 900 820 810 790 780 820 860 870 860 830 770 760 750 750 720 680 640 600 560 540 520 500 China
United States 500 500 490 490 470 470 460 460 440 420 420 410 400 390 380 370 350 350 340 320 330 320 300 300 300 280 270 260 260 250 United States
European Union 320 320 310 300 290 290 290 270 270 250 250 240 240 240 240 230 220 210 210 200 200 190 190 180 170 170 160 160 160 150 European Union
France 200 210 200 190 180 180 190 180 180 170 170 160 160 160 160 150 150 140 140 140 140 120 120 120 110 110 110 110 110 100 France
Germany 350 330 300 300 290 290 290 280 270 260 250 250 240 250 240 230 230 210 210 210 210 200 200 200 190 190 180 180 170 160 Germany
Italy 210 200 200 200 190 200 190 190 190 190 190 180 190 190 190 190 190 180 180 170 170 160 160 150 140 140 140 140 130 130 Italy
Netherlands 290 300 290 290 290 290 300 270 260 240 230 230 230 240 230 220 210 200 200 200 210 200 200 190 180 190 180 180 170 160 Netherlands
Poland 860 920 870 840 790 740 730 670 590 550 500 490 470 470 450 440 430 400 380 350 360 340 330 320 300 290 290 290 280 250 Poland
Spain 210 220 220 210 220 220 210 220 210 220 220 210 220 220 220 220 210 210 190 170 170 170 170 160 150 160 150 150 140 130 Spain
United Kingdom 330 340 330 320 300 290 290 270 260 250 250 240 230 230 230 220 210 200 200 190 190 170 180 170 150 140 130 130 120 120 United Kingdom
India 380 400 400 400 390 390 380 390 370 370 370 350 350 340 340 330 320 330 340 350 340 340 350 340 340 320 300 290 290 280 India
Russian Federation 750 780 840 840 870 880 890 820 870 840 780 750 710 690 640 600 570 520 490 500 500 510 480 460 450 460 460 460 460 450 Russian Federation
Japan 290 280 280 280 290 290 280 280 270 280 280 270 280 280 270 270 260 260 250 250 250 260 260 260 260 240 240 230 230 220 Japan
Other OECD G20 370 370 370 370 370 370 370 370 360 350 350 350 340 340 330 320 320 310 310 310 310 300 300 280 270 270 270 260 260 250 Other OECD G20
Australia 520 530 530 520 510 500 500 500 510 490 480 480 470 460 460 450 450 440 430 430 410 400 390 370 350 350 350 340 340 340 Australia
Canada 510 510 520 510 510 510 510 510 500 490 490 470 460 460 440 430 400 400 380 370 370 360 360 360 350 340 340 330 330 320 Canada
Mexico 230 240 230 230 240 240 240 230 240 220 230 230 230 240 230 240 240 230 230 240 240 230 230 220 210 210 210 200 200 190 Mexico
South Korea 500 490 490 510 500 490 490 480 440 430 450 440 400 390 390 370 360 350 340 340 350 350 350 330 320 320 320 310 310 300 South Korea
Turkey 220 220 220 210 220 220 220 220 220 220 230 220 220 220 210 200 210 220 220 220 210 200 210 180 180 180 180 190 180 180 Turkey
Other G20 countries 250 240 240 240 240 250 250 260 270 270 270 270 280 280 280 270 270 260 260 260 260 250 250 250 260 260 250 250 250 250 Other G20 countries
Argentina 230 220 210 200 200 210 210 210 210 220 220 220 230 230 230 220 220 210 210 210 200 200 200 200 210 210 210 200 200 200 Argentina
Brazil 150 150 150 150 150 150 160 170 170 170 180 180 170 170 170 160 160 160 160 150 150 150 160 170 170 170 160 160 160 150 Brazil
Indonesia 200 200 200 200 200 210 200 210 250 260 250 250 250 260 250 240 240 230 220 220 210 200 200 190 190 190 180 180 190 200 Indonesia
Saudi Arabia 260 230 240 250 270 270 280 280 290 310 300 320 350 330 320 320 330 340 350 380 400 380 380 380 390 390 380 390 380 380 Saudi Arabia
South Africa 820 810 810 810 800 820 810 830 840 780 760 760 760 790 810 790 760 750 770 730 730 680 690 690 690 670 670 670 670 680 South Africa
Total Group of Twenty (G20) 440 440 430 430 420 420 410 400 390 380 380 370 370 380 380 370 370 360 350 350 360 360 350 340 330 320 310 300 300 290 Total Group of Twenty (G20)
Other large emitting countries 510 510 490 470 460 450 430 430 420 420 410 410 400 400 390 390 380 370 370 360 350 350 350 340 330 320 320 310 310 310 Other large emitting countries
Egypt 270 270 270 260 240 250 250 250 250 260 240 250 250 250 260 280 280 280 260 260 250 250 260 250 250 250 240 240 230 220 Egypt
Iran 420 410 430 420 490 490 480 500 490 530 530 550 540 520 540 560 570 560 570 590 560 560 610 630 630 620 560 550 610 680 Iran
Kazakhstan 1,140 1,340 1,440 1,350 1,390 1,340 1,170 1,000 1,050 930 860 740 750 760 750 730 730 710 810 720 720 710 670 680 620 590 600 580 600 570 Kazakhstan
Malaysia 310 340 330 320 320 310 320 320 350 360 360 370 380 380 390 390 390 400 400 370 370 360 340 350 350 340 310 290 290 270 Malaysia
Nigeria 240 260 270 270 260 280 320 300 270 260 270 270 220 220 200 180 150 130 130 110 120 120 110 100 90 90 90 100 100 100 Nigeria
Taiwan 370 360 360 360 350 350 350 350 350 350 350 370 360 360 350 340 330 310 300 290 280 270 250 250 240 240 240 250 240 230 Taiwan
Thailand 230 240 240 250 260 270 290 300 290 290 280 280 280 280 280 280 270 260 260 260 250 250 250 260 250 250 240 230 220 210 Thailand
Ukraine 960 990 960 980 1,050 1,180 1,120 1,110 1,080 1,080 1,010 920 880 850 720 690 640 610 570 550 570 570 560 540 500 440 450 390 390 360 Ukraine
United Arab Emirates 280 310 290 310 320 320 310 300 310 310 280 310 310 300 290 290 280 290 340 360 370 350 350 350 340 330 330 330 330 340 United Arab Emirates
Viet Nam 180 170 160 180 190 200 210 220 240 230 240 250 270 270 300 300 290 300 310 330 350 330 310 310 320 340 350 320 360 390 Viet Nam
Zambia 170 180 180 150 140 140 110 130 120 100 90 90 90 90 90 90 80 50 50 50 50 60 80 80 80 80 90 120 120 120 Zambia
Remaining countries (186) 230 230 230 240 240 240 240 240 230 220 220 230 220 220 220 210 210 200 200 200 200 200 200 200 200 190 190 190 190 200 Remaining countries (186)
International transport International transport
Total 440 440 430 420 420 420 410 400 390 380 380 370 370 370 370 370 360 360 350 350 350 350 340 340 330 320 310 300 300 290 Total
PBL | 69
B. Greenhouse gas emissions: CH4, N2O, F-gases, total per capita and per USD of GDP
We note that the estimated uncertainty range in non-CO2 emissions, both in the national CRF data and as calculated using EDGAR data, is much larger than that for CO2 emission estimates (excluding those from land-use change), for which uncertainties are generally between 3% to 5%, with exceptions of up to 10% or 15%. The uncertainty of total country emissions per non-CO2 gas in the EDGAR data sets is generally in the same range as that of official national total emissions, such as 30% to 50% for CH4 and about 50% for N2O (or 100% including indirect emissions). However, uncertainties for specific F-gas emissions in EDGAR (on the use of these gases) are in the range of 100% or more (Olivier et al., 2017). However, since CO2 is the dominant GHG, the uncertainty about total GHG emissions remains relatively small, i.e. only a few percentage points larger than that of CO2 emissions, both globally and at country level, compared to those about the individual other greenhouse gases. For global GHG emissions, the uncertainty is estimated at 10%, mainly because the uncertainty about global CO2 emissions is around 10%, when including large-scale biomass fires and post-burn decay and adding uncertainty about erosion and redeposition. We estimate uncertainties with two standard deviations for global emissions of ±6% for CO2
(excluding LUC), ±25% for CH4, ±30% for N2O and ±20% for fluorinated gases (UNEP, 2012), resulting in 7% uncertainty and added an extra ±1% to account for the uncertainty in the 2018-2019 GHG emissions trend. These uncertainty ranges are consistent with those presented in Appendix 1 of UNEP’s Emissions Gap Report of 2012 (UNEP, 2012) and in IPCC AR5 WG III (Blanco et al., 2014). For most countries, the uncertainty in total GHG emissions is also around 10%, for the same reason as for global GHG emissions. However, there may be a few exceptions where this is up to 15%, in particular in cases where fossil-fuel-related CO2 emissions have a much smaller share than three-quarters in total national GHG emissions (excluding emissions from land-use change). All tables in the Appendices are also available as spreadsheets on the PBL website. They can be downloaded from the report page of this report.

PBL | 70
Table B.1 Total greenhouse gas emissions per country and group, 1990–201925 (unit: GtCO2 eq)
25 Totals and sub-totals may differ due to independent rounding. The number of digits does not indicate the accuracy of the figures, See uncertainty information in the Appendix. Calculated using the Global Warming Potentials (GWPs) for 100 year from the IPCC's Fourth Assessment Report (AR4).

PBL | 71
Table B.2 CH4 emissions per country and group, 1990–201926 (unit: MtCO2 eq)
26 Totals and sub-totals may differ due to independent rounding. The number of digits does not indicate the accuracy of the figures, See uncertainty information in the Appendix. Calculated using the Global Warming Potentials (GWPs) for 100 year from the IPCC's Fourth Assessment Report (AR4).

PBL | 72
Table B.3 N2O emissions, per country and group, 1990–201927 (unit: MtCO2 eq)
27 Totals and sub-totals may differ due to independent rounding. The number of digits does not indicate the accuracy of the figures, See uncertainty information in the Appendix. Calculated using the Global Warming Potentials (GWPs) for 100 year from the IPCC's Fourth Assessment Report (AR4).

PBL | 73
Table B.4 F-gas emissions, per country and group, 1990–201928 (unit: MtCO2 eq)
28 Totals and sub-totals may differ due to independent rounding. The number of digits does not indicate the accuracy of the figures, See uncertainty information in the Appendix. Calculated using the Global Warming Potentials (GWPs) for 100 year from the IPCC's Fourth Assessment Report (AR4).
F-gas emissions per country/group, 1990-2019 (unit: Mt CO2 eq)
Country/group 1990 1991 1992 1993 1994 1995 1996 1997 1998 1999 2000 2001 2002 2003 2004 2005 2006 2007 2008 2009 2010 2011 2012 2013 2014 2015 2016 2017 2018 2019 Country/group
China 15 13 15 22 32 24 28 39 30 83 68 85 115 139 185 225 258 243 257 266 281 294 308 323 337 353 370 379 390 398 China
United States 102 103 102 102 108 118 131 140 161 180 192 195 216 226 246 267 290 312 331 357 399 422 433 447 465 477 486 493 499 509 United States
European Union 62 64 60 63 66 66 73 75 82 84 89 83 88 93 98 104 113 122 131 136 144 163 150 153 158 163 170 170 162 158 European Union
France 10.8 11.6 13.4 16.7 13.6 9.0 9.9 10.7 12.5 13.3 14.8 15.3 16.2 16.7 17.4 17.2 18.7 20.4 22.1 23.1 25.0 25.2 25.6 25.7 25.8 26.2 27.4 26.2 22.6 20.2 France
Germany 13.7 14.5 12.8 12.7 13.8 15.1 16.7 17.7 18.2 17.8 20.5 18.5 19.4 20.0 21.8 23.8 26.4 27.9 30.2 29.2 30.0 30.9 31.5 32.1 32.9 33.9 34.5 34.7 34.1 33.6 Germany
Italy 4.7 4.5 4.1 4.3 5.0 5.3 7.9 7.8 9.1 10.4 10.0 11.4 11.7 11.4 11.5 11.8 13.2 14.3 15.3 16.5 17.8 19.0 19.7 20.5 21.3 21.9 22.6 23.2 23.3 23.5 Italy
Netherlands 7.5 7.6 7.5 8.2 8.6 8.1 8.9 8.6 9.5 8.8 9.1 4.8 3.6 4.3 3.9 4.2 4.6 4.9 5.2 5.4 5.7 5.6 5.6 4.8 4.3 4.6 4.3 4.2 4.2 4.3 Netherlands
Poland 0.6 0.6 0.6 0.7 0.8 0.9 1.0 1.1 1.3 1.4 1.5 1.7 1.9 2.1 2.5 2.9 3.2 3.5 3.7 3.3 2.9 3.0 3.0 3.2 3.5 3.6 3.0 3.1 2.7 2.5 Poland
Spain 7.3 7.4 7.6 7.5 7.5 7.7 8.1 8.0 8.8 7.2 8.8 7.8 8.1 9.0 9.7 10.4 11.4 12.3 13.2 13.5 14.1 13.9 13.9 14.4 14.6 11.9 12.3 11.9 11.2 10.8 Spain
United Kingdom 6.2 6.9 6.8 5.8 8.8 9.2 9.1 8.9 9.9 10.3 9.6 9.8 10.8 11.2 10.8 11.7 12.6 14.0 14.8 15.3 16.4 15.0 15.0 15.2 15.5 15.3 14.6 13.5 12.5 11.7 United Kingdom
India 10 11 10 10 9 9 9 10 13 13 16 16 16 20 24 18 18 26 24 26 28 28 29 30 30 31 31 32 32 33 India
Russian Federation 29 39 40 44 42 45 45 48 51 54 58 59 56 57 65 69 70 75 76 67 73 68 87 100 107 106 113 139 160 187 Russian Federation
Japan 33 39 43 55 54 77 70 69 67 64 59 59 55 58 58 62 67 71 74 78 83 88 96 105 111 116 122 126 130 134 Japan
Other OECD G20 33 34 32 33 32 33 41 43 43 52 50 46 54 53 54 61 65 66 69 69 74 77 85 94 111 145 163 170 184 199 Other OECD G20
Australia 5.6 5.2 4.7 4.2 3.5 3.4 3.3 3.5 3.9 4.3 4.7 5.0 5.5 6.1 6.7 7.3 8.2 8.8 9.5 10.0 10.3 10.9 10.6 11.3 12.5 13.6 14.0 13.4 13.9 14.5 Australia
Canada 14.2 15.2 14.4 15.4 15.2 15.2 16.3 16.7 17.9 19.1 19.9 20.2 21.2 22.6 23.4 24.9 26.6 27.8 28.8 30.2 33.4 36.7 40.1 43.5 46.0 50.9 52.6 56.5 61.4 66.9 Canada
Mexico 3.4 3.5 2.5 3.3 2.9 2.8 5.8 6.0 5.2 6.7 5.6 4.6 6.0 5.9 6.0 9.2 12.4 11.2 11.4 12.1 12.9 13.4 14.0 14.5 15.1 15.7 16.2 16.8 17.3 17.9 Mexico
South Korea 6.7 7.3 7.7 8.0 8.5 9.3 12.9 14.3 14.1 20.0 17.2 13.0 17.6 14.9 13.3 13.7 11.9 11.9 12.3 10.0 9.4 8.6 8.2 8.1 8.0 8.0 7.9 7.8 8.1 8.3 South Korea
Turkey 2.6 2.6 2.7 2.6 2.4 2.3 2.2 2.2 2.1 2.2 2.7 2.9 3.4 3.9 4.7 5.5 5.9 6.5 7.1 7.1 7.9 7.5 11.8 16.9 28.9 56.8 72.0 75.7 82.9 91.1 Turkey
Other G20 countries 18 18 16 15 14 13 12 12 12 10 10 10 11 13 15 16 17 19 19 20 20 21 22 23 23 24 25 25 26 26 Other G20 countries
Argentina 2.7 2.6 0.5 0.5 0.4 0.4 0.4 0.4 0.4 0.4 0.4 0.4 0.5 0.7 0.9 0.7 0.8 1.0 1.0 1.1 1.2 1.4 1.5 1.6 1.8 1.9 2.1 2.2 2.2 2.2 Argentina
Brazil 9.6 9.8 10.1 9.8 9.4 9.0 7.4 7.4 7.5 5.9 5.6 5.3 6.3 7.7 8.5 9.6 10.4 11.1 11.5 11.4 11.8 12.1 12.3 12.6 12.8 13.1 13.3 13.6 13.8 14.1 Brazil
Indonesia 1.8 1.8 1.9 1.8 1.7 1.5 1.4 1.3 1.0 1.0 1.0 1.0 0.9 1.0 1.0 1.0 1.0 1.1 1.1 1.2 1.2 1.3 1.3 1.3 1.4 1.4 1.5 1.5 1.6 1.6 Indonesia
Saudi Arabia 2.3 2.3 2.1 1.8 1.4 1.2 1.2 1.2 1.2 1.3 1.3 1.4 1.6 1.8 1.9 2.1 2.2 2.4 2.5 2.7 2.8 2.9 3.1 3.2 3.4 3.5 3.6 3.8 3.9 4.1 Saudi Arabia
South Africa 1.5 1.3 1.2 1.2 1.1 1.1 1.5 1.7 1.7 1.8 1.8 1.8 2.0 2.3 2.5 2.6 2.8 2.9 3.0 3.2 3.3 3.4 3.6 3.7 3.8 3.9 4.0 4.2 4.3 4.4 South Africa
Total Group of Twenty (G20) 300 321 319 345 359 386 408 434 458 538 542 552 611 659 744 822 899 933 981 1018 1101 1162 1209 1273 1341 1414 1479 1535 1583 1643 Total Group of Twenty (G20)
Other large emitting countries 10 11 11 10 9 9 10 10 10 12 14 14 16 18 18 18 20 21 22 21 22 22 22 23 23 23 24 25 26 27 Other large emitting countries
Egypt 2.2 2.3 2.3 2.2 2.2 2.0 2.6 2.2 2.4 2.6 2.7 2.8 2.9 2.9 3.1 3.4 3.6 3.8 3.9 4.0 4.2 4.3 4.4 4.6 4.7 4.8 5.0 5.1 5.2 5.4 Egypt
Iran 2.5 3.0 2.8 2.5 2.2 2.0 1.8 1.7 1.8 2.0 1.8 1.9 2.2 2.3 2.2 2.4 2.5 2.6 2.7 2.9 3.0 3.1 3.2 3.4 3.5 3.6 3.7 3.9 4.0 4.1 Iran
Kazakhstan - - - - - - - - - - 0.1 0.1 0.1 0.2 0.3 0.4 0.4 0.5 0.6 0.6 0.7 0.7 0.7 0.7 0.8 0.8 0.9 0.8 0.8 0.8 Kazakhstan
Malaysia 0.6 0.7 0.7 0.7 0.7 0.7 0.6 0.5 0.5 0.5 0.5 0.7 0.8 1.0 1.0 1.1 1.2 1.3 1.4 1.2 1.3 1.3 1.2 1.2 1.2 1.2 1.2 1.2 1.2 1.2 Malaysia
Nigeria 0.2 0.2 0.1 0.1 0.1 - 0.1 0.1 0.2 0.2 0.3 0.3 0.4 0.5 0.6 0.7 0.8 0.8 0.9 1.0 1.1 1.2 1.3 1.3 1.4 1.5 1.6 1.7 1.7 1.8 Nigeria
Taiwan 2.0 2.1 2.1 2.0 1.9 2.1 2.6 3.8 3.7 5.0 6.9 6.4 7.6 8.3 8.4 7.3 8.4 8.7 9.0 7.1 7.6 7.2 6.9 6.5 6.2 5.9 5.6 5.6 5.7 5.8 Taiwan
Thailand 1.4 1.4 1.3 1.2 1.0 0.9 0.8 0.7 0.5 0.5 0.4 0.5 0.7 0.8 0.9 1.1 1.1 1.2 1.2 1.3 1.3 1.4 1.4 1.5 1.5 1.6 1.6 1.7 1.8 1.8 Thailand
Ukraine 0.3 0.4 0.3 0.3 0.3 0.3 0.4 0.4 0.5 0.5 0.5 0.5 0.5 0.6 0.7 0.8 0.8 0.9 1.0 1.0 1.1 1.2 1.5 1.6 1.9 2.1 2.5 3.0 3.5 4.3 Ukraine
United Arab Emirates 0.9 1.0 0.9 0.8 0.7 0.6 0.7 0.7 0.7 0.8 0.9 0.9 0.9 0.9 1.0 1.1 1.2 1.2 1.3 1.4 1.4 1.5 1.6 1.6 1.7 1.8 1.8 1.9 2.0 2.0 United Arab Emirates
Viet Nam - - - - - - - - - - - - - - - - - - - - - - - - - - - - - - Viet Nam
Zambia - - - - - - - - - - - - - - - - - - - - - - - - - - - - - - Zambia
Remaining countries (186) 30 28 23 20 18 18 18 19 19 21 23 25 25 27 31 34 37 41 44 43 45 48 50 53 55 58 62 64 67 69 Remaining countries (186)
International transport - - - - - - - - - - - - - - - - - - - - - - - - - - - - - - International transport
Total 341 360 353 375 386 412 436 463 488 571 579 591 652 704 793 874 956 995 1046 1081 1167 1231 1281 1348 1419 1496 1565 1623 1675 1739 Total

PBL | 74
Table B.5 Greenhouse gas emissions per capita, per country and group, 1990–201929 (unit: tonnes of CO2 eq per person)
29 The number of digits does not indicate the accuracy of the figures, See uncertainty information in the Appendix. Calculated using the Global Warming Potentials (GWPs) for 100 year from the IPCC's Fourth Assessment Report (AR4).

PBL | 75
Table B.6 Greenhouse gas emissions per USD of GDP, per country and group, 1990–201930 (unit: kg CO2 per 1,000 USD of GDP [PPP])
30 Calculated using the Global Warming Potentials (GWPs) for 100 year from the IPCC's Fourth Assessment Report (AR4). GDP in USD for Purchasing Power Parity (PPP) and in prices of 2017.
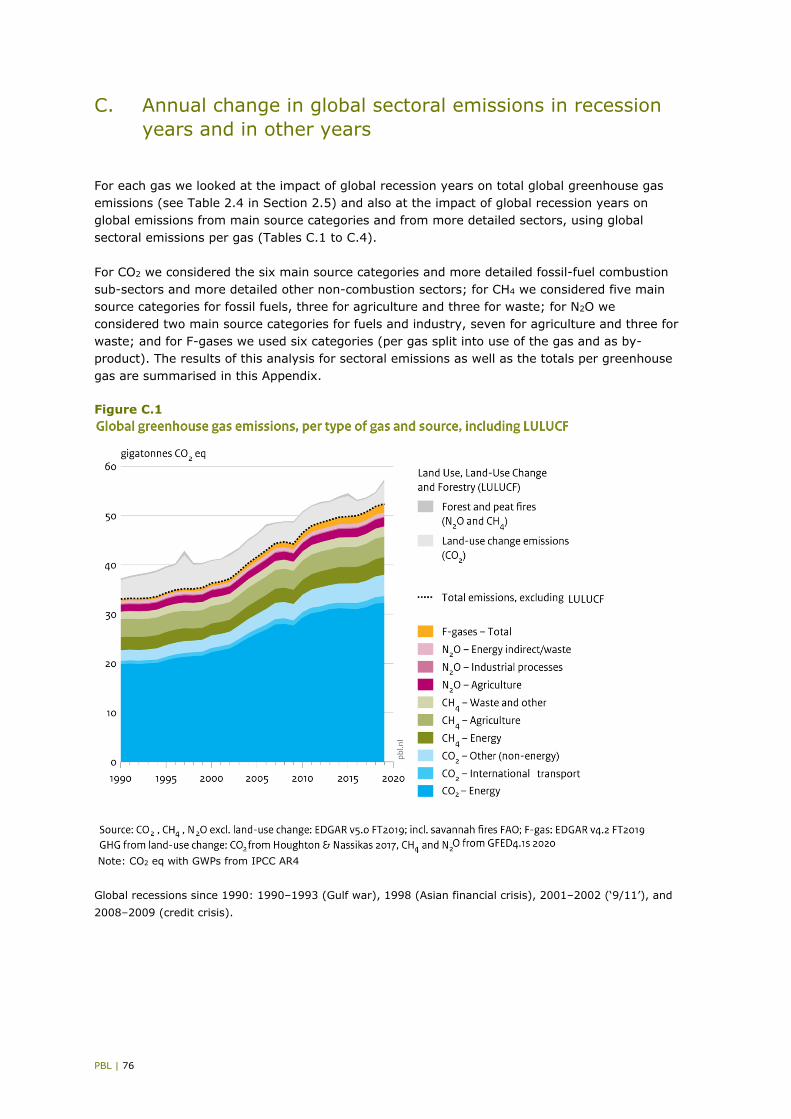
PBL | 76
C. Annual change in global sectoral emissions in recession years and in other years
For each gas we looked at the impact of global recession years on total global greenhouse gas emissions (see Table 2.4 in Section 2.5) and also at the impact of global recession years on global emissions from main source categories and from more detailed sectors, using global sectoral emissions per gas (Tables C.1 to C.4). For CO2 we considered the six main source categories and more detailed fossil-fuel combustion sub-sectors and more detailed other non-combustion sectors; for CH4 we considered five main source categories for fossil fuels, three for agriculture and three for waste; for N2O we considered two main source categories for fuels and industry, seven for agriculture and three for waste; and for F-gases we used six categories (per gas split into use of the gas and as by-product). The results of this analysis for sectoral emissions as well as the totals per greenhouse gas are summarised in this Appendix.
Figure C.1 Note: CO2 eq with GWPs from IPCC AR4 Global recessions since 1990: 1990–1993 (Gulf war), 1998 (Asian financial crisis), 2001–2002 (‘9/11’), and 2008–2009 (credit crisis).

PBL | 77
Table C.1 Average annual change of global CO2 emissions 1970-2018 in global recession years, in other years and in the year before and after a recession31.
Notes: SD = Standard Deviation of annual change in recession years and in non-recession years. According to an IMF definition there were 6 recessions since 1970: 15 recession years; and 32 other years. The six global recessions were: 1974–75 (first oil crisis), 1980–83 (second oil crisis), 1990–93 (Gulf war), 1998 (Asian financial crisis), 2001–02 (‘9/11’), and 2008–09 (credit crunch).
31 Calculated using the global total sectoral emissions of the EDGAR 5.0 FT2019 data set for CO2, CH4 and N2O and of the EDGAR 4.2 FT2019 data set for F-gases (HFCs, PFCs and SF6).
Share 2019 Source category Yr before Recession SD Yr after Non-recession SD Impact (R-N) Reces-Yr before All years SDCO2 GDP 4.4% 1.9% 1.0% 4.1% 4.1% 1.0% -2.2% -2.5% 3.4% 1.4%
88.6% Fuel combustion 2.9% 0.2% 1.1% 3.4% 2.6% 1.7% -2.4% -2.7% 1.8% 1.9%
4.4% Non-energy fuel use 2.7% -1.8% 3.2% 3.6% 3.0% 2.2% -4.8% -4.4% 1.5% 3.3%
0.8% Gas venting/ flaring 3.4% -3.8% 8.0% 4.7% 2.3% 8.1% -6.0% -7.1% 0.4% 8.4%
1.1% Solid fuel transformation 8.5% -4.9% 9.4% 9.3% 4.7% 8.4% -9.6% -13.5% 1.7% 9.7%
4.0% Cement production 2.5% 1.7% 2.8% 6.6% 4.2% 4.1% -2.5% -0.8% 3.5% 3.9%
1.2% Other carbonate use 1.7% -0.8% 2.7% 2.7% 2.7% 2.3% -3.4% -2.5% 1.6% 2.9%
100% Total CO2 3.0% 0.0% 1.0% 3.6% 2.7% 1.7% -2.7% -2.9% 1.8% 2.0%
35.8% Electricity and heat generation 4.1% 1.7% 2.4% 4.4% 3.3% 2.3% -1.6% -2.4% 2.7% 2.5%
16.7% Industries 3.0% -1.7% 2.1% 3.0% 2.4% 3.7% -4.1% -4.7% 1.1% 3.7%
15.9% Road transport 3.0% 1.6% 1.5% 3.2% 3.2% 1.8% -1.6% -1.4% 2.6% 1.8%
8.7% Building sector (RCO) 0.6% -1.2% 2.9% 1.9% 1.0% 1.9% -2.3% -1.8% 0.4% 2.4%
7.9% Other domestic fuel combustion 3.1% -0.2% 1.8% 2.6% 2.3% 1.7% -2.5% -3.3% 1.5% 2.1%
0.0% International air transport 4.3% -0.5% 4.2% 3.1% 4.3% 2.3% -4.8% -4.8% 2.8% 3.7%
0.0% International marine transport (bunke 2.7% -1.5% 6.0% 3.8% 3.0% 3.1% -4.5% -4.2% 1.6% 4.6%
Non-combustion CO2 category
0.8% Lime production 2.6% -0.2% 3.8% 3.2% 3.3% 3.1% -3.5% -2.8% 2.2% 3.6%
0.9% Ammonia production (gross CO2) 2.1% 0.9% 3.0% 7.4% 4.2% 4.8% -3.3% -1.2% 3.1% 4.6%
0.4% Crude steel production total 4.8% -2.6% 3.7% 5.3% 4.0% 4.9% -6.7% -7.4% 2.1% 5.4%
0.2% Blast furnaces 2.3% -7.8% 21.5% -10.0% 15.7% 71.3% -23.5% -10.1% 8.2% 60.3%
0.4% Ferroy Alloy production 7.1% -10.3% 13.9% 16.6% 6.2% 15.2% -16.5% -17.5% 1.1% 16.4%
0.3% Aluminium production (primary) 4.7% 1.0% 6.0% 6.1% 5.4% 3.6% -4.5% -3.7% 4.2% 5.0%
0.2% CO2 from urea application 5.1% 4.6% 5.7% 4.4% 4.9% 5.7% -0.3% -0.5% 4.7% 5.6%
0.2% CO2 from agricultural lime application 0.5% -1.2% 2.8% 4.5% 2.5% 4.8% -3.7% -1.7% 1.4% 4.6%

PBL | 78
Table C.2 Average annual change of global CH4 emissions 1970-2018 in global recession years, in other years and in the year before and after a recession.
Table C.3 Average annual change of global N2O emissions 1970-2018 in global recession years, in other years and in the year before and
after a recession.
Share 2019 Source category Yr before Recession SD Yr after Non-recession SD Impact (R-N) Reces-Yr before All years SDCH4 GDP 4.4% 1.9% 1.0% 4.1% 4.1% 1.0% -2.2% -2.5% 3.4% 1.4%
4.1% Fossil fuel combustion 1.1% 0.0% 2.2% 0.5% 0.8% 2.0% -0.8% -1.1% 0.5% 2.1%
12.2% Coal mining 1.8% -0.7% 2.8% 2.0% 2.9% 5.8% -3.5% -2.5% 1.8% 5.2%
2.6% Oil production, transm. 4.4% -1.2% 3.0% 2.9% 2.6% 2.7% -3.7% -5.5% 1.4% 3.3%
10.9% Associated Gas venting 4.5% 2.6% 1.5% 4.2% 3.7% 1.6% -1.1% -1.9% 3.4% 1.6%
6.5% Gas production, distr -0.3% -6.4% 7.6% 1.8% 1.3% 7.7% -7.7% -6.1% -1.1% 8.3%
28.0% Ruminants 0.8% 1.0% 0.7% 0.9% 0.9% 0.7% 0.1% 0.2% 0.9% 0.7%
9.5% Animal manure (confined) -1.1% -1.0% 1.7% -0.1% -0.2% 1.7% -0.8% 0.1% -0.5% 1.7%
5.2% Rice production 0.8% 0.4% 1.7% 0.6% 0.9% 3.1% -0.4% -0.4% 0.7% 2.7%
9.9% Landfills 1.1% 0.3% 1.7% 1.1% 1.4% 1.9% -1.2% -0.8% 1.1% 1.9%
10.5% Wastewater 2.1% 1.5% 0.6% 2.3% 2.0% 0.6% -0.4% -0.6% 1.8% 0.6%
0.6% Other 1.1% 0.3% 2.4% 0.6% 0.9% 2.5% -0.6% -0.8% 0.7% 2.5%
100% Total CH4 1.1% -0.7% 1.5% 1.5% 1.4% 1.6% -2.1% -1.8% 0.8% 1.8%
Share 2019 Source category Yr before Recession SD Yr after Non-recession SD Impact (R-N) Reces-Yr before All years SDN2O GDP 4.4% 1.9% 1.0% 4.1% 4.1% 1.0% -2.2% -2.5% 3.4% 1.4%
10.7% Fuel combustion 2.7% 1.0% 1.5% 2.8% 2.5% 1.7% -1.5% -1.8% 2.0% 1.8%
8.0% Industrial processes 1.9% -5.2% 6.2% 0.2% 1.3% 4.3% -6.5% -7.1% -0.7% 5.7%
3.6% Manure management (confined) 0.8% 0.8% 1.0% 0.7% 0.8% 1.6% -0.1% 0.0% 0.8% 1.4%
13.7% Synthetic Fertilizers 0.1% 1.3% 4.6% 3.3% 2.2% 3.3% -1.0% 1.1% 1.9% 3.7%
4.6% Animal Manure Applied to Soils 0.7% 0.3% 1.3% 0.5% 0.8% 1.0% -0.4% -0.3% 0.6% 1.1%
9.9% Other agriculture 0.9% 1.0% 2.6% 1.9% 1.1% 2.5% -0.1% 0.1% 1.0% 2.5%
22.8% Pasture, Range and Paddock Manure 1.0% 1.2% 0.6% 1.1% 1.0% 0.6% 0.1% 0.2% 1.1% 0.6%
9.2% Indirect N2O from agriculture 0.8% 0.7% 1.1% 1.4% 1.2% 1.0% -0.5% 0.0% 1.1% 1.0%
7.5% Indirect N2O non-agriculture 1.9% 0.0% 1.4% 2.1% 2.1% 1.7% -2.1% -1.9% 1.5% 1.8%
4.7% Savannah fires 1.4% 0.0% 6.2% -1.5% 0.5% 8.7% -0.5% -1.3% 0.3% 7.9%
4.3% Wastewater 1.3% 2.1% 0.9% 2.2% 2.0% 0.9% 0.2% 0.8% 2.0% 0.9%
1.0% Field burning and other waste 1.7% 1.1% 1.3% 3.3% 2.1% 1.7% -1.0% -0.6% 1.8% 1.6%
100% Total N2O 1.1% 0.1% 1.0% 1.4% 1.3% 1.1% -1.2% -1.1% 0.9% 1.2%

PBL | 79
Table C.4 Average annual change of global F-gas emissions 1970-2018 in global recession years, in other years and in the year before and after a recession.
Share 2019 Source category Yr before Recession SD Yr after Non-recession SD Impact (R-N) Reces-Yr before All years SD
F-gas GDP 4.4% 1.9% 1.0% 4.1% 4.1% 1.0% -2.2% -2.5% 3.4% 1.4%
80.8% HFCs 9.1% 6.2% 8.6% 15.3% 9.5% 6.8% -3.3% -2.9% 8.4% 7.4%
6.4% PFCs 1.9% -3.6% 6.4% 3.0% 2.5% 4.0% -6.1% -5.5% 0.5% 5.6%
12.8% SF6 6.1% 4.5% 5.9% 7.8% 6.2% 6.1% -1.7% -1.6% 5.6% 6.0%
100% Total F-gases 5.6% 2.8% 4.4% 9.3% 6.6% 3.4% -3.8% -2.8% 5.4% 4.1%
20.7% HFC-23 from HCFC-22 production 4.5% 3.3% 9.1% 11.8% 6.6% 9.3% -3.3% -1.2% 5.6% 9.2%
5.4% PFCs from aluminium production 1.0% -4.7% 6.6% 2.7% 2.5% 4.7% -7.2% -5.6% 0.2% 6.2%
9.0% SF6 use of Electr equipm 6.4% 3.3% 5.8% 8.4% 6.1% 5.6% -2.9% -3.1% 5.2% 5.7%
35.0% Total by-production + SF6 Eqm 2.9% 0.0% 4.9% 7.1% 4.7% 5.1% -4.7% -3.0% 3.2% 5.4%
60.1% HFC use 42.9% 40.0% 48.9% 43.7% 30.7% 37.3% 9.3% -3.0% 33.0% 40.8%
1.0% PFC use 32.8% 14.3% 17.4% 15.3% 15.3% 7164.2% -1.0% -18.5% 14.7% 5879%
3.9% Other SF6 use 7.9% 6.5% 9.7% 6.5% 8.2% 15.9% -1.7% -1.5% 7.5% 14.0%
65.0% Total F-gas use excl SF6 GIS 16.0% 11.9% 7.2% 14.8% 14.8% 14.5% -2.9% -4.1% 13.7% 12.6%

PBL | 80
References Agora Energiewende and Sandbag (2020). The European Power Sector in 2019: Up-to-Date Analysis
on the Electricity Transition. February 2020. https://ember-climate.org/project/power-2019/ Alvarez RA, Zavala-Araiza D, Lyon DR, Allen DT, Barkley ZR, Brandt AR, Davis KJ, Herndon SC,
Jacob DJ, Karion A, Kort EA, Lamb BK, Lauvaux T, Maasakkers JD, Marchese AJ, Omara M, Pacala SW, Peischl J, Robinson AL, Shepson PB, Sweeney C, Townsend-Small A, Wofsy SC and Hamburg SP. (2018). Assessment of methane emissions from the US oil and gas supply chain. Science, 361, 196–188, doi:10.1126/science.aar7204, 13 July 2018. https://bit.ly/3oSCogz
Ambrose J. (2019). Fracking causing rise in methane emissions, study finds. Guardian, 14 August 2019. rb.gy/bfcoxc
Badouard T. (2020). Global Energy Trends - 2020 Edition; October update. Global Energy Trends Quarterly Updates; 2020 new yearly estimates. Enerdata webinar, 12 October 2020. https://www.enerdata.net/publications/reports-presentations/world-energy-trends.html
Blanco G, Gerlagh R, Suh S, Barrett J, De Coninck HC, Diaz Morejon CF, Mathur R, Nakicenovic N, Ofosu Ahenkora A, Pan J, Pathak H, Rice J, Richels R, Smith SJ, Stern DI, Toth FL, and Zhou P. (2014). Chapter 5: Drivers, Trends and Mitigation. In: Climate Change 2014: Mitigation of Climate Change. Contribution of Working Group III to the Fifth Assessment Report of the Intergovernmental Panel on Climate Change. Cambridge (UK) and New York.
Borunda A. (2020). Natural gas is a much ‘dirtier’ energy source, carbon-wise, than we thought, National Geographic, 19 February 2020. rb.gy/ionysa
BP (2020). Statistical Review of World Energy 2020. https://on.bp.com/382lW6Q Crippa M, Oreggioni G, Guizzardi D,Muntean M, Schaaf E, Lo Vullo E, Solazzo E, Monforti-Ferrario F,
Olivier JGJ and Vignati E. (2019). Fossil CO2 emissions of all world countries, 2019 Report - Study, EUR 29849 EN, Publications Office of the European Union, Luxembourg, 2019, ISBN 978-92-76-11100-9, doi:10.2760/687800, JRC117610. https://edgar.jrc.ec.europa.eu/overview.php?v=booklet2019
Crippa M, Guizzardi D, Muntean M, Schaaf E, Solazzo E, Monforti-Ferrario F, Olivier JGJ and Vignati E. (2020). Fossil CO2 emissions of all world countries, 2020 Report, EUR 30358 EN, Publications Office of the European Union, Luxembourg, ISBN 978-92-76-21515-8, doi:10.2760/143674, JRC121460. https://edgar.jrc.ec.europa.eu/overview.php?v=booklet2020
Dafnomilis I, Den Elzen M, Van Soest H, Hans F, Kuramochi T and Höhne N. (2020). Exploring the impact of the COVID-19 pandemic on global emission projections. Assessment of green versus non-green recovery. PBL Netherlands Environmental Assessment Agency/NewClimate Institute. PBL report no. 4231, project number 319041. https://bit.ly/2IR5Owl
Davis M and Charles J-H. (2020) Tackling flaring: Lessons from the North Sea. Energy Voice, 8 October 2020. https://www.energyvoice.com/opinion/270340/tackling-flaring-lessons-from-the-north-sea/
De Gouw JA, Veefkind P, Roosenbrand E, Dix B, Lin JC, Landgraf J and Levelt PF. (2020). Daily satellite observations of methane from oil and gas production regions in the United States. Scientific Reports, 10, 1379. https://doi.org/10.1038/s41598-020-57678-4
Denson F. (2020) The Drilldown: Global methane leaks have gone up by a third this year: report. iPolitics, 15 October 2020. rb.gy/fs2q7i
EC-JRC/PBL (2019). Emissions Database for Global Atmospheric Research v5.0. Joint Research Centre of the European Commission/PBL Netherlands Environmental Assessment Agency. http://edgar.jrc.ec.europa.eu/overview.php?v=5. Note that this data set does not contain emissions from savannah fires (so no CH4 or N2O emissions).
EIA (2018). Japan has restarted five nuclear power reactors in 2018. Today in Energy, 28 November 2018. https://www.eia.gov/todayinenergy/detail.php?id=37633

PBL | 81
EIA (2019). Nuclear reactor restarts in Japan displacing LNG imports in 2019. Today in Energy, 4 March 2019. https://www.eia.gov/todayinenergy/detail.php?id=38533
EIA (2020a). New electric generating capacity in 2020 will come primarily from wind and solar, Today in Energy, 14 January 2020. https://www.eia.gov/todayinenergy/detail.php?id=42495
EIA (2020b). U.S. energy-related carbon dioxide fell by 2.8% in 2019, slightly below 2017 levels, Today in Energy, 5 May 2020. https://www.eia.gov/todayinenergy/detail.php?id=43615
EIA (2020c). U.S. coal-fired electricity generation in 2019 falls to 42-year low, Today in Energy, 11 May 2020. https://www.eia.gov/todayinenergy/detail.php?id=43675
EIA (2020d). More than 100 coal-fired plants have been replaced or converted to natural gas since 2011, Today in Energy, 5 August 2020. https://www.eia.gov/todayinenergy/detail.php?id=44636
EIA (2020e). As U.S. coal-fired capacity and utilization decline, operators consider seasonal operation, Today in Energy, 1 September 2020. https://www.eia.gov/todayinenergy/detail.php?id=44976
EIA (2020f). Table 1.9 Heating Degree Days by Census Division; and Table 1.10 Cooling Degree Days by Census Division. 27 April 2020. https://www.eia.gov/totalenergy/data/monthly/
Eurostat (2020a). Cooling and heating degree days by country - annual data [nrg_chdd_a] 2010–2019. Internet: https://ec.europa.eu/eurostat/web/products-datasets/product?code=nrg_chdd_a supplemented with UK data from DBEIS [Mean heating degree days 2002 to 2019 (DUKES 1.1.8)]
Eurostat (2020b). In 2019, CO2 emissions from energy use in the EU estimated to have decreased. Newsrelease 6 May 2019.
https://ec.europa.eu/eurostat/en/web/products-press-releases/-/8-06052020-BP Eurostat (2020c). Supply and transformation of oil and petroleum products - monthly data
[NRG_CB_OILM__custom_104606]. Data extracted 22 October 2020. https://bit.ly/3rggWEj FAO (2020a). FAOSTAT Production of live animals, crops, consumption of nitrogen fertilisers, burning
savannah. http://www.fao.org/faostat/en/#data FAO (2020b) Food Outlook - Biannual Report on Global Food Markets. June 2020. FAO. Rome.
https://doi.org/10.4060/ca9509en Forster PM, Forster HI, Evans MJ, Gidden MJ, Jones CD, Keller CA, Lamboll RD, Le Quéré C, Rogelj J,
Rosen D, Schleussner CF, Richardson TB, Smith CJ and Turnock ST. (2020). Current and future global climate impacts resulting from COVID-19. Nature Climate Change, 10, 913–919. 7 August 2020. https://doi.org/10.1038/s41558-020-0883-0
Guglielmi G. (2018). Methane leaks from US gas fields dwarf official estimates. Latest studies suggest that emissions could be coming from faulty equipment. Nature, 558,496-497.
https://www.nature.com/articles/d41586-018-05517-y Global Energy Monitor (2020). Global Coal Plant Tracker.
https://globalenergymonitor.org/coal/global-coal-plant-tracker/ Gütschow J, Jeffery L, Gieseke, R and Günther A. (2019). The PRIMAP-hist national historical
emissions time series (1850-2017) [Data set]. GFZ Data Services. https://doi.org/10.5880/PIK.2019.018
Halff A and Gould A. (2020). U.S. needs better methane rules to compete in global energy markets. Houston Chronicle, 24 August 2020. rb.gy/cfiorp
Hausfather Z. (2020). COVID-19 Could Result in Much Larger CO2 Drop in 2020. 30 April, 2020. The Breakthrough Institute. https://thebreakthrough.org/issues/energy/covid-co2-drop
Hmiel B, Petrenko VV, Dyonisius MN, Buizert C, Smith AM, Place PF, Harth C, Beaudette R, Hua Q, Yang B, Vimont I, Michel SE, Severinghaus JP, Etheridge D, Bromley T, Schmitt J, Faïn X, Weiss RF and Dlugokencky D. (2020). Preindustrial 14CH4 indicates greater anthropogenic fossil CH4 emissions. Nature, 578, 409–412. 19 February 2020.https://doi.org/10.1038/s41586-020-1991-8
Höhne N, den Elzen M, Rogelj J, et al. (2020) Emissions: world has four times the work or one-third of the time. Nature, 579,25-28, nature.com/articles/d41586-020-00571-x
Houghton RA and Nassikas AA. (2017). Global and regional fluxes of carbon from land use and land cover change 1850–2015. Global Biogeochem. Cycles, 31, 457–472. http://onlinelibrary.wiley.com/doi/10.1002/2016GB005546/full

PBL | 82
Houghton RA, Van der Werf GR, DeFries RS, Hansen MC, House JI, Le Quéré C, Pongratz J and Ramankutty N. (2012). Chapter G2 Carbon emissions from land use and land-cover change, Biogeosciences, 9, 5125–5142, doi: 10.5194/bgd-9-835-2012
Howarth RW. (2019). Ideas and perspectives: is shale gas a major driver of recent increase in global atmospheric methane? Biogeosciences, 16, 3033–3046. https://doi.org/10.5194/bg-16-3033-2019
IEA (2017). Energy balance statistics for 1970–2015, http://www.iea.org/ IEA (2019). CO2 Emissions from Fuel Combustion. Ed. 2019 (1971–2017). https://webstore.iea.org/co2-emissions-from-fuel-combustion-2019 https://webstore.iea.org/co2-emissions-from-fuel-combustion-2019-highlights IEA (2020a). Global CO2 emissions in 2019. 11 February 2020. https://www.iea.org/articles/global-
co2-emissions-in-2019 IEA (2020b) Global energy review 2019. The latest trends in energy and emissions in 2019. April
2020. https://www.iea.org/reports/global-energy-review-2019 IEA (2020c) Global energy review 2020. The impacts of the Covid-19 crisis on global energy demand
and CO2 emissions. April 2020. https://www.iea.org/reports/global-energy-review-2020/global-energy-and-co2-emissions-in-
2020 IEA (2020d). ‘Extended World Energy Balances’, 1970–2018, IEA World Energy Statistics and
Balances (database), https://doi.org/10.1787/data-00513-en (accessed 17 September 2020). International Energy Agency, Paris.
IEA (2020e). CO2 Emissions from Fuel Combustion; Overview. 2020 edition https://webstore.iea.org/co2-emissions-from-fuel-combustion-overview-2020-edition IMF (2020). World Economic Outlook Database Update April 2020. International Monetary Fund. https://www.imf.org/en/Publications/WEO/weo-database/2020/April IPCC (2006). IPCC Guidelines for National GHG Inventories. Prepared by the National GHG
Inventories Programme (NGGIP). Intergovernmental Panel on Climate Change. Internet: https://www.ipcc-nggip.iges.or.jp/public/2006gl
IPCC (2007). Working Group I Fourth Assessment Report ‘The Physical Science Basis’. In particular Chapter 10. https://wg1.ipcc.ch/publications/wg1-ar4/wg1-ar4.html https://www.ipcc.ch/publications_and_data/a4/wg1/en/ch2s2-10-2.html
IPCC (2019). 2019 Refinement to the 2006 IPCC Guidelines for National Greenhouse Gas Inventories. Calvo Buendia E, Tanabe K, Kranjc A, Baasansuren J, Fukuda M, Ngarize S, Osako A, Pyrozhenko Y, Shermanau P and Federici S. (eds). Published: IPCC, Switzerland. Internet: https://www.ipcc-nggip.iges.or.jp/public/2019rf/index.html
Janssens-Maenhout G, Crippa M, Guizzardi D, Muntean M, Schaaf E, Dentener F, Bergamaschi P, Pagliari V, Olivier JGJ, Peters JAHW, Van Aardenne JA, Monni S, Doering U and Petrescu AMR. (2019). EDGAR v4.3.2 Global Atlas of the three major GHG Emissions for the period 1970–2012. Earth Syst. Sci. Data, 11, 959–1002. https://doi.org/10.5194/essd-2017-79
Kayrros (2020). Methane watch. https://www.kayrros.com/methane-watch/ KNMI (2019) Temperatuur door historische grens van 40° (in Dutch), 25 July 2019
https://www.knmi.nl/over-het-knmi/nieuws/temperatuur-door-historische-grens-van-40-c Leahy S. (2019). Fracking boom tied to methane spike in Earth’s atmosphere. National Geographic,
15 August 2019. rb.gy/dqa7h9 Le Quéré C, Jackson RB,Jones MW, Smith AJP, Abernethy S, Andrew RM, De-Gol AJ, Willis DR, Shan
Y, Canadell JG, Friedlingstein P, Creutzig F and Peters GP. (2020). Temporary reduction in daily global CO2 emissions during the COVID-19 forced confinement. Nature Climate Change, 10, 647–653, 19 May 2020. DOI:10.1038/s41558-020-0797-x
Liu et al. (2020). Near-real-time monitoring of global CO2 emissions reveals the effects of the COVID-19 pandemic. Nature Communications,11, Article number 5172. 14 October 2020. https://www.nature.com/articles/s41467-020-18922-7
PBL | 83
Lyon, DR. (2018). EPA’s updated annual oil and gas methane inventory doesn’t convey entire picture. Environmental Defense Fund (EDF), Energy Exchange Blog, 13 April 2018. https://shar.es/aa1T80
Maiss M and Brenninkmeijer CAM. (1998) Atmospheric SF6: Trends, Sources, and Prospects. Environmental Science & Technology, 1998, 32, 3077–3086. https://pubs.acs.org/doi/10.1021/es9802807
McCulley R. (2020). Methane emissions show 'concerning' spike in Covid-19 pandemic's wake — Kayrros; Methane tracker says satellite data show steep increase as cost cuts and weak gas prices hit operational practices. Upstream, 14 October 2020. rb.gy/z7odnh
Mikulka J. (2020). The US oil and gas industry's methane problem is catching up with it. DesmogBlog, 16 September 2020. rb.gy/eorr8t
Moisio M, Van Soest H, Forsell N, Nascimento L, de Vivero G, Gonzales-Zuñiga S, Hans F, Lui ., Schiefer T, Mooldijk S, Höhne N, Batka M, Dafnomilis I, Den Elzen M and Kuramochi T. (2020). Overview of recently adopted mitigation policies and climate-relevant policy responses to COVID-19: 2020 update. NewClimate Institute, PBL Netherlands Environmental Assessment Agency, International Institute for Applied Systems Analysis. PBL report no. 4287. https://bit.ly/34AxWvo
Mufson S. (2020). The number of global methane hot spots has soared this year despite the economic slowdown. Washington Post, 14 October 2020. rb.gy/dtqper
Nasralla S. (2020). Satellites reveal major new gas industry methane leaks. Reuters, 26 June 2020. rb.gy/lisvyf
NAS (National Academies of Sciences, Engineering, and Medicine) (2018). Improving Characterization of Anthropogenic Methane Emissions in the United States. Washington, D.C .The National Academies Press. https://doi.org/10.17226/24987
NBSC (National Bureau of Statistics of China) (2020a). Statistical Communiqué of the People's Republic of China on the 2019 National Economic and Social Development. 28 February 2020. http://www.stats.gov.cn/english/PressRelease/202002/t20200228_1728917.html
NBSC (National Bureau of Statistics of China) (2020b). Annual indicators, Industry, Output of industrial products. http://data.stats.gov.cn/english/easyquery.htm?cn=C01 Accessed 18 May 2020.
NOAA (2020). Global Climate Report, Annual 2019. US National Oceanic and Atmospheric Administration’s National Centers for Environmental Information (NCEI). https://www.ncdc.noaa.gov/sotc/global/201913
NOAA/ESRL (2020). Trends in Atmospheric Carbon Dioxide. NOAA/ESRL's Global Monitoring Division (GMD). https://www.esrl.noaa.gov/gmd/ccgg/trends/
Olivier JGJ, Visschedijk AJH, Peters JAHW, Bakker J, Berdowski JJM and Bloos, JPJ. (2002). A global emission inventory of methane sources with trend data for the period 1970-1995. Section 4.2 in: Olivier JGJ. (2002). On the Quality of Global Emission Inventories. Approaches, Methodologies, Input Data and Uncertainties. Thesis Utrecht University. Utrecht, Utrecht University. ISBN 90-393-3103-0. http://dspace.library.uu.nl/handle/1874/678
Olivier JGJ, Van Aardenne JA, Monni S, Döring UM, Peters JAHW and Janssens-Maenhout G. (2010). Application of the IPCC uncertainty methods to EDGAR 4.1 global GHG inventories. In: ’3rd International Workshop on Uncertainty in GHG Inventories, 22–24 September 2010’. Proceedings. Lviv Polytechnic National University, Lviv, Ukraine. https://bit.ly/2CscDzI
Olivier JGJ and Peters JAHW. (2012). Trends in global CO2 emissions. 2017 Report. PBL Netherlands Environmental Assessment Agency, The Hague. https://bit.ly/39o91yh
Olivier JGJ, Schure KM and Peters JAHW. (2017). Trends in global CO2 and total GHG emissions. 2017 Report. PBL Netherlands Environmental Assessment Agency, The Hague. https://bit.ly/2y2Nw2F
Olivier JGJ and Peters JAHW. (2018). Trends in global CO2 and total GHG emissions. 2018 Report. Report no. 3125. PBL Netherlands Environmental Assessment Agency, The Hague. https://www.pbl.nl/en/publications/trends-in-global-co2-and-total-greenhouse-gas-emissions-2018-report

PBL | 84
Olivier JGJ and Peters JAHW. (2019). Trends in global CO2 and total GHG emissions. 2019 Report. Report no. 4068. PBL Netherlands Environmental Assessment Agency, The Hague. https://www.pbl.nl/en/publications/trends-in-global-co2-and-total-greenhouse-gas-emissions-2019-report
PBL (2020). PBL Climate Pledge NDC tool. Last updated 23 March 2020. https://themasites.pbl.nl/climate-ndc-policies-tool/
Reuters (2020) CORRECTED-China to cap 2020 coal-fired power capacity at 1,100 GW. 18 June 2020. https://reut.rs/34zsZTz
Schneising O, Buchwitz M, Reuter M, Vanselow S, Bovensmann H, and Burrows JP. (2020). Remote sensing of methane leakage from natural gas and petroleum systems revisited. Atmos. Chem. Phys., 20, 9169–9182. https://doi.org/10.5194/acp-20-9169-2020
Shearer C. (2020). Analysis: The global coal fleet shrank for first time on record in 2020. Carbon Brief, 3 August 2020. https://www.carbonbrief.org/analysis-the-global-coal-fleet-shrank-for-first-time-on-record-in-2020
Shearer C, Myllyvirta L, Yu A, Greig A, Mathew-Shah N, Gyorgy D and Nace T. (2020). Boom and Bust 2020. Tracking the global coal plant pipeline. Global Energy Monitor, Sierra Club, Greenpeace, March 2020. https://endcoal.org/global-coal-plant-tracker/reports/boom-and-bust-2020/
UNEP (United Nations Environment Programme) (2012). Appendix 1 and 2 of The Emissions Gap Report 2020. https://www.pbl.nl/sites/default/files/downloads/pbl-2012-unep-the-emissions-gap-report-2012-appendix_1_and_2.pdf https://bit.ly/2VheJtr
UNEP (United Nations Environment Programme) (2020). The Emissions Gap Report 2020. United Nations Environment Program (UNEP), Nairobi. In prep. Internet: https://www.unenvironment.org/resources/emissions-gap-report-2020
https://www.pbl.nl/en/publications/unep-emissions-gap-report-2020 UNPD (2019). United Nations Population Division. World Population Prospects, 2019 revision.
https://population.un.org/wpp/ UNFCCC (2011). Revision of the UNFCCC reporting guidelines on annual inventories for Parties
included in Annex I to the Convention. Decision 24/CP.19. FCCC/CP/2013/10/Add.3. http://unfccc.int/resource/docs/2013/cop19/eng/10a03.pdf
UNFCCC (2020). National Inventory Submissions 2020. https://unfccc.int/ghg-inventories-annex-i-parties/2020 CRF data in tables per (sub)source: https://rt.unfccc.int/locator
USDA (United States Department of Agriculture / Foreign Agricultural Service) (2020) Crop explorer, additional resources. With regionid = seasia, sasia, che
https://ipad.fas.usda.gov/cropexplorer/util/new_get_psd_data.aspx?regionid=seasia USGS (United States Geological Survey) (2020). 2012–2018/2019 production data on cement, lime,
ammonia, crude steel and aluminium, from the USGS Commodity Statistics. https://minerals.usgs.gov/minerals/pubs/commodity/
Van der Werf GR, Randerson JT, Giglio L, Van Leeuwen TT, Chen Y, Rogers BM, Mu M, Van Marle MJE, Mortan DC, Collatz J, Yokelson RJ and Kasibhatla PS. (2017). Global fire emissions estimates during 1997–2016. Earth Syst. Sci. Data, 9, 697–720. https://doi.org/10.5194/essd-9-697-2017
Weller ZD, Hamburg SP and Von Fischer JC. (2020). A National Estimate of Methane Leakage from Pipeline Mains in Natural Gas Local Distribution Systems, Environ. Sci. Technol, 54, 8958–67.
https://pubs.acs.org/doi/10.1021/acs.est.0c00437 WNISR (2020). The World Nuclear Industry. Status Report 2020.
https://www.worldnuclearreport.org/-World-Nuclear-Industry-Status-Report-2020-.html World Bank (2020a). World Development Indicators (WDI). Data set of 6 July 2020. GDP data
(expressed in 1000 US dollar, constant 2017 US$ and adjusted to the Purchasing Power Parity). http://databank.worldbank.org/data/reports.aspx?source=world-development-indicators https://data.worldbank.org/indicator/NY.GDP.MKTP.PP.KD
World Bank (2020b). Global gas flaring jumps to levels last seen in 2009. 21 July 2020. Global Gas Flaring Reduction Partnership (GGFR). https://www.worldbank.org/en/news/press-release/2020/07/21/global-gas-flaring-jumps-to-levels-last-seen-in-2009

PBL | 85
Worrall L, Whitle S, Garg V, Krishnaswamy S and Beaton C. (2018). India’s stranded assets: how government interventions are propping up coal power. September 2018. Global Subsidies Initiative, Working Paper 538. Overseas Development Institute (ODI), London. https://www.odi.org/publications/11185-india-s-stranded-assets-how-government-interventions-are-propping-coal-power
WRI (2016). CAIT Country GHG Emissions: Sources & Methods June 2015. World Resources Institute, http://cait.wri.org/historical
Zavala-Araiza, D, Lyon, DR, et al. (2015) Reconciling divergent estimates of oil and gas methane emissions, Proc Natl Acad Sci USA (PNAS), 112, 15597-15602. http://www.pnas.org/content/112/51/15597
Zhang Y, Gautam R, Pandey S, Omara M, Maasakkers JD, Sadavarte P, Lyon D, Nesser H, Sulprizio MP, Varon DJ, Zhang R, Houweling S, Zavala-Araiza D, Alvarez RA, Lorente A, Hamburg SP, Aben I, Jacob DJ. (2020). Quantifying methane emissions from the largest oil-producing basin in the United States from space. Sci. Adv., 6, eaaz5120 22 April 2020. https://advances.sciencemag.org/content/6/17/eaaz5120