
Conventional Arms Transfers to Developing Nations, 2008-2015

I
I
Report No. 86-99 F
TRENDS IN CONVENTIONAL ARMS TRANSFERS TO THE THIRD WORLD BY MAJOR SUPPLIER, 1978-1985
by Richard F. Grimmett
Specialist in National Defense Foreign Affairs and National Defense Division
May 9, 1986
UA 15 For.

The Congressional Research Service works exclusively for the Congress, conducting research, analyzing legislation, and providing information at the request of committees, Members, and their staffs.
The Service makes such research available, without partisan bias, in many forms including studies, reports, compilations, digests, and background briefings. Upon request, CRS assists committees in analyzing legislative proposals and issues, and in assessing the possible effects of these proposals and their alternatives. The Service's senior specialists and subject analysts are also available for personal consultations in their respective fields of expertise.
•

ABSTRACT
This report provides unclassified background data on transfers of
conventional armaments to Third World nations by the major supplying nations.
It covers the years from 1978-1985 and reviews in detail the values of arms
transfer agreements and deliveries, as well as the specific numbers of
important conventi10nal weapons delivered to the Third World during this
time period.
Graphics production assistance provided by Mandy MCGowan Production assistance provided by Dianne Rennack

CRS-v
CONTENTS
I. ABSTRAC1'.................................................. iii
II. INTRODUCTION................................................ 1
I II. MAJOR FINDINGS. . . . . . . . . • • . • . . . . . . . • • • . . . • . . • . • • • • . . . • . . . . • • • 1
IV. EXPLANATORY NOTES. • • . . . . . . • . . • . • . • • • . • • . • • • • . • • . • . • . . . . . . . . . 3
V. SELECTED SUMMARY OF DATA TRENDS, 1978-1985 •••••.•..•..•.•••. 5
VI. THIRD WORLD WEAPONS DELIVERIES TABLES ••.••••.•.••.........•• 24
VII. DESCRIPTION OF ITEMS COUNTED IN WEAPONS CATEGORIES, 1978-1985 ................................................... 48
VIII. REGIONS IDENTIFIED IN ARMS TRANSFER TABLES AND CHARTS •...•.. 49
CHARTS
CHART 1. ARMS TRANSFER AGREEMENTS WITH THE THIRD WORLD, 1978-1985 By All Suppliers (In Billions Of Constant 1985 Dollars)..... 7
CHART 2. ARMS TRANSFER AGREEMENTS WITH THE THIRD WORLD 1984 AND 1985 (As Percentage of All Agreements) .••••••.•.... 8
CHART 3. ARMS TRANSFER AGREEMENTS WITH THE THIRD WORLD, 1978-1985: United States, U.S.S.R., and Major West European Compared (In Billions of Constant 1985 Dollars) •.•.•.•..•••..••••.... 9
CHART 4. ARMS TRANSFER AGREEMENTS WITH THE THIRD WORLD, 1978-1985: By Major Supplier (In Billions of Constant 1985 Dollars) •..• 10
CHART 5. ARMS TRANSFER AGREEMENTS WITH THE THIRD WORLD, 1978-1985: Major Supplier Shares •..•..••.•.••....•.•••..••.....••.•.... 12
CHART 6. ARMS TRANSFER AGREEMENTS WITH THE THIRD WORLD, 1978-1985: Non-Communists And Communists Compared (In Billions of Constant 1985 Dollars) .........•... 13
CHART 7. ARMS TRANSFER AGREEMENTS, 1982-1985, With Near East and South Asia (Supplier Percentage) .....•..•.........• 16
CHART 8. ARMS TRANSFER AGREEMENTS WITH LATIN AMERICA, 1978-1981 and 1982-1985 (Supplier Percentage) .....•.•....... 17
CRS-vi
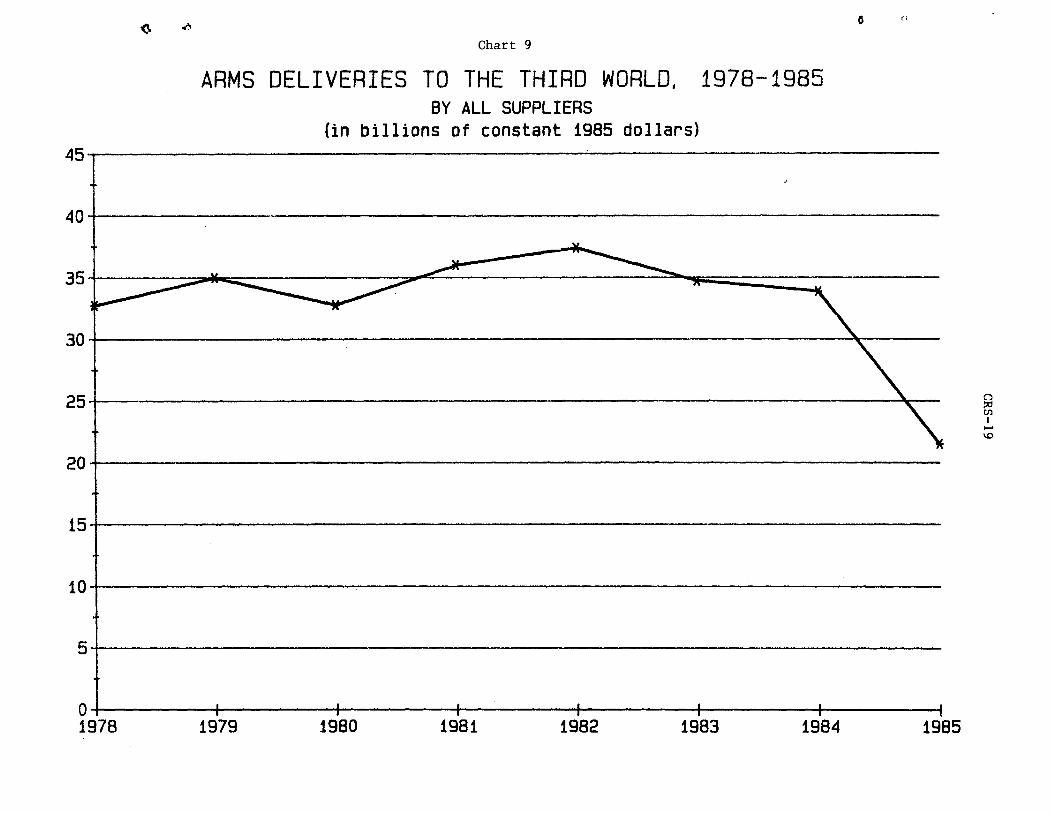
CHART 9. ARMS DELIVERIES TO THE THIRD WORLD, 1978-1985 By All Suppliers (In Billions Of Constant 1985 Dollars) .••• 19
CHART 10. ARMS DELIVERIES TO THE THIRD WORLD, 1978-1985: By Major Supplier (In Billions of Constant 1985 Dollars) ••. 20
CHART 11. ARMS DELIVERIES TO THE THIRD WORLD, 1978-1985: Major Supplier Shares. . . . . . . . . . . . . . . . . . . . . . . . • . . • . . . . • • . . . • 22
CHART 12. ARMS DELIVERIES TO THE THIRD WORLD, 1978-1985. Non-Communists and Communists Compared. (In Billions of Constant 1985 Dollars) ....•.....•.............• 23
TABLES
TABLE 1. ARMS TRANSFER AGREEMENTS WITH THE THIRD WORLD, BY SUPPLIER (In Millions of Current U.S. Dollars) •....•.... 30
TABLE lA. ARMS TRANSFER AGREEMENTS WITH THE THIRD WORLD, BY SUPPLIER (In Millions of Constant 1985 U.S. ])c)llar s) ....•...•.••...••.•.••••••..••......•••••••••••.••• 31
TABLE lB. ARMS TRANSFER AGREEMENTS WITH THE THIRD WORLD, BY SUPPLIER, 1978-1985 (Expressed as a Percent of Grand Total, by Year) .........................•.......•• 32
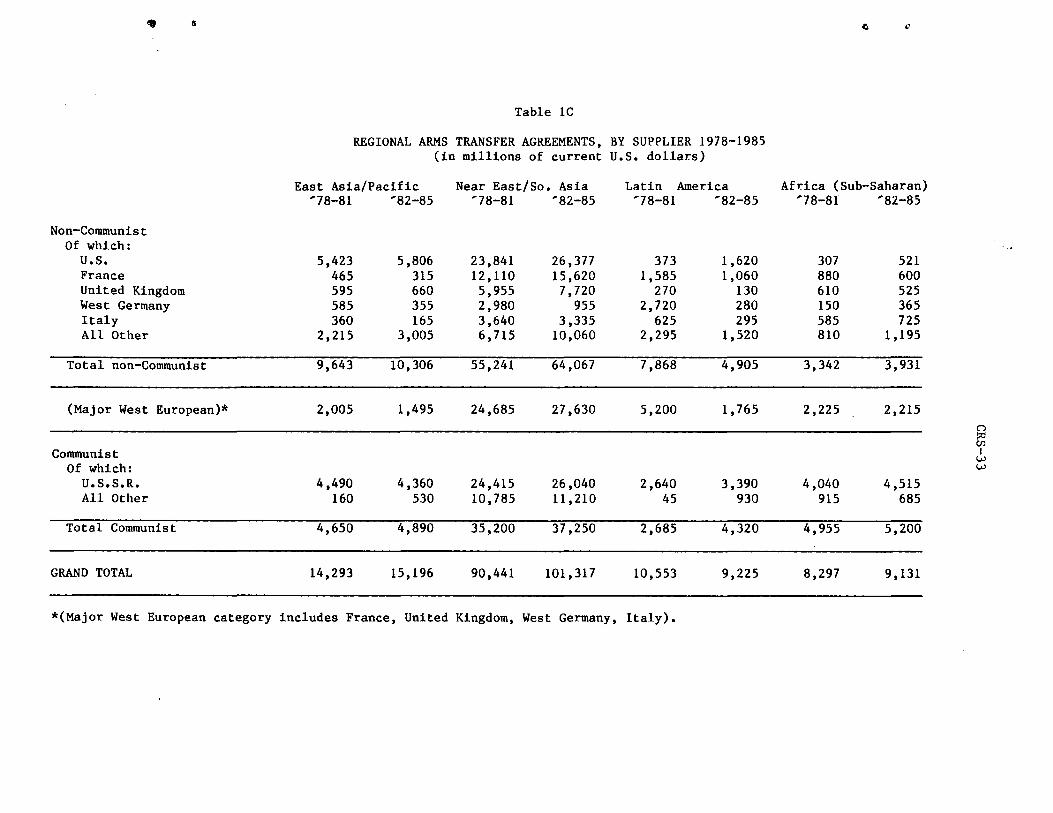
TABLE 1C. REGIONAL ARMS TRANSFER AGREEMENTS, BY SUPPLIER, 1978-1985 (In Millions of Current U.S. Dollars) •••..•....•. 33
TABLE lD. PERCENTAGE OF SUPPLIER AGREEMENTS VALUE BY REGION, 197 8-1985. . . . . . . . . . . . . . . . . . . . . . . . . . . . . . . . . . . . . . . . . . . . . . . . . . 34
TABLE lE. PERCENTAGE OF TOTAL AGREEMENTS VALUE BY SUPPLIER TO REGIONS, 1978-1985 .........•.......•.....•.....•..•.•••. 35
TABLE 2. ARMS DELIVERIES TO THE THIRD WORLD, BY SUPPLIER (In Millions of Current U.S. Dollars) .•..•.•.•••.•...•..... 36
TABLE 2A. ARMS DELIVERIES TO THE THIRD WORLD, BY SUPPLIER (In Mill ions of Constant 1985 U.S. Dollars) ................ 37
TABLE 2B. ARMS DELIVERIES TO THE THIRD WORLD, BY SUPPLIER, 1978-1985 (Expressed as a Percent of Grand Total by Year) ................................................... 38
TABLE 2C. REGIONAL ARMS DELIVERIES, BY SUPPLIER, 1978-1'985 (In Millions of Current U.S. Dollars) .•...••......•..•.•..• 39
TABLE 2D. PERCENTAGE OF SUPPLIER DELIVERIES VALUE BY REGION, 1978-1985 ................................................... 40
TABLE 2E. PERCENTAGE OF TOTAL DELIVERIES VALUE BY SUPPLIER TO REGIONS, 1978-1985 ........................•..•........•. 41

CRS-vii
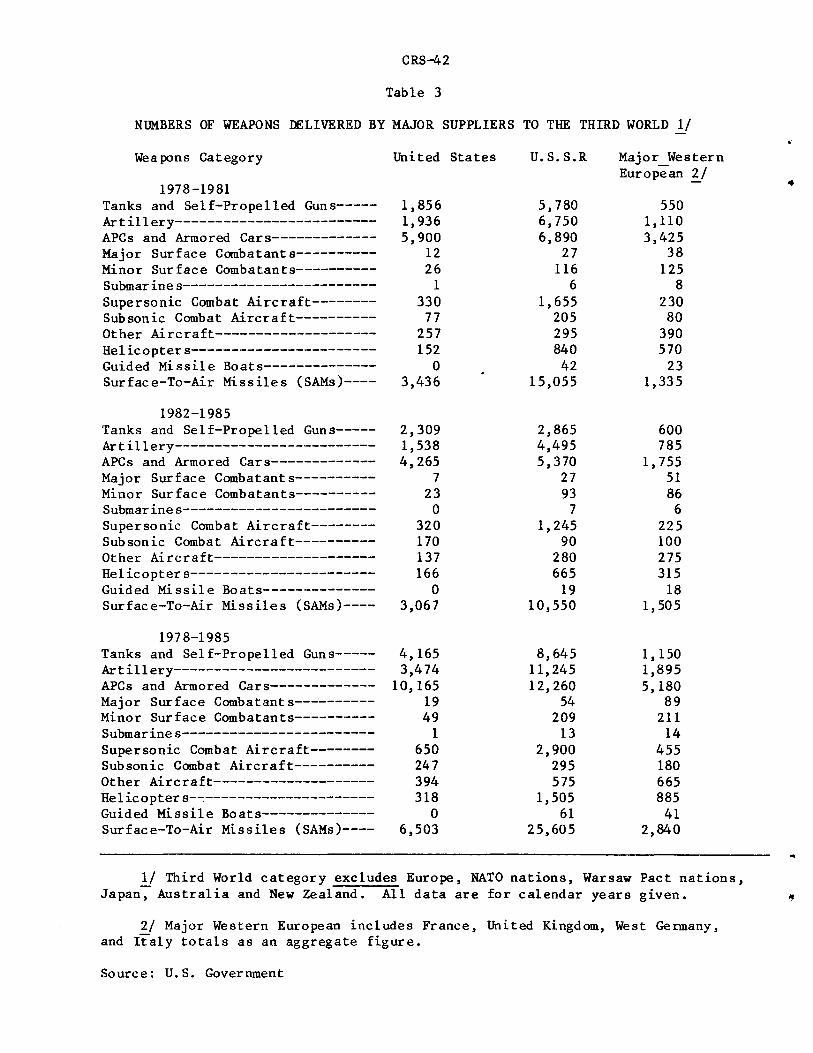
.. TABLE 3. NUMBERS OF WEAPONS DELIVERED BY MAJOR SUPPLIERS TO THE THIRD WORLD. . . • . . . • . . . . . . . • . . . . • . . . • . . . . . . . . . . . . . . . . 42
TABLE 4. NUMBERS OF WEAPONS DELIVERED BY MAJOR SUPPLIERS TO EAST ASIA AND THE PACIFIC • • • • • • • • • • • • • • • • • • • • • • • • • • • • • • • 43
TABLE 5. NUMBERS OF WEAPONS DELIVERED BY MAJOR SUPPLIERS TO NEAR EAST AND SOUTH ASIA. • • • • • • • • • • • • • • • • • • • • • • • • • • • • • • • 44
TABLE 6. NUMBERS OF WEAPONS DELIVERED BY MAJOR SUPPLIERS TO IA. TIN AMERICA. . . . . . . . . . . . . . . . . . . . . . . . . . . . • . . . . . . . . . . . . . . 45
TABLE 7. NUMBERS OF WEAPONS DELIVERED BY MAJOR SUPPLIERS TO AFRICA (SUS-SAHARAN) • • • • • • • • • • • • • • • • • • • • • • • • • • • • • • • • • • • • 46
TRENDS IN CONVENTIONAL ARMS TRANSFERS TO THE THIRD WORLD BY MAJOR SUPPLIER, 1978-1985
INTRODUCTION
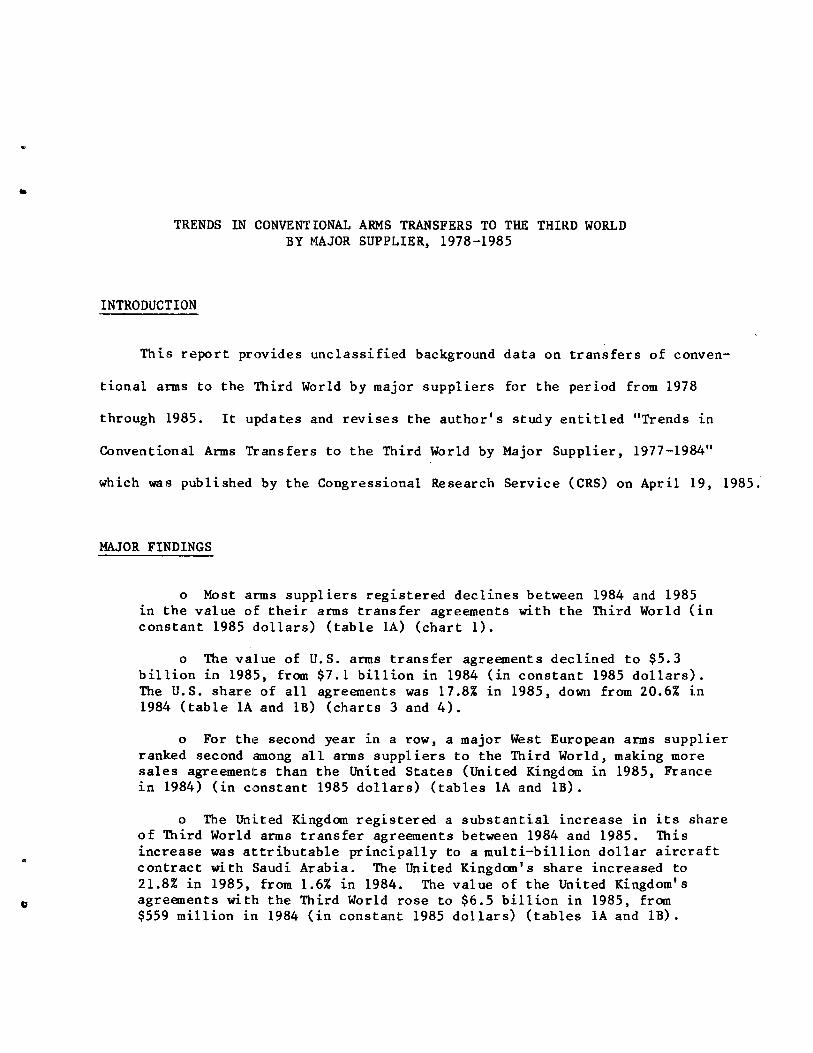
This report provides unclassified background data on transfers of conven-
tional arms to the Third World by major suppliers for the period from 1978
through 1985. It updates and revises the author's study entitled "Trends in
Conventional Arms Transfers to the Third World by Major Supplier, 1977-1984"
which was published by the Congressional Research Service (CRS) on April 19, 1985.
MAJOR FINDINGS
o Most arms suppliers registered declines between 1984 and 1985 in the value of their arms transfer agreements with the Third World (in constant 1985 dollars) (table lA) (chart 1).
o The value of U.S. arms transfer agreements declined to $5.3 billion in 1985, from $7.1 billion in 1984 (in constant 1985 dollars). The U.S. share of all agreements was 17.8% in 1985, down from 20.6% in 1984 (table lA and lB) (charts 3 and 4).
o For the second year in a row, a major West European arms supplier ranked second among all arms suppliers to the Third World, making more sales agreements than the United States (United Kingdom in 1985, France 1n 1984) (in constant 1985 dollars) (tables lA and lB).
o The United Kingdom registered a substantial increase in its share of Third World arms transfer agreements between 1984 and 1985. This increase was attributable principally to a multi-billion dollar aircraft contract with Saudi Arabia. The United Kingdom's share increased to 21.8% in 1985, from 1.6% in 1984. The value of the United Kingdom's agreements with the Third World rose to $6.5 billion in 1985, from $559 million in 1984 (in constant 1985 dollars) (tables lA and lB).

CRS-2
o Both the Soviet Union and France experienced notable declines in their shares of Third World arms transfer agreements between 1984 and 1985. The Soviet Union's share of agreements fell from 37.4% in 1984, to 30.4% in 1985. France's share of agreements fell from 21.7% in 1984, to 4.7% in 1985. While registering the highest total for any supplier in 1985, the value of the Soviet Union's agreements with the Third World fell to $9.1 billion in 1985, from $12.8 billion in 1984 (in constant 1985 dollars) (tables lA and lB) (charts 2 and 5).
o The four Major West European suppliers, as a group, increased their share of Third World arms transfer agreements between 1984 and 1985. This group's share rose from 25.6% in 1984, to 31.3% in 1985. The collective value of the Major West European suppliers' agreements with the Third World in 1985 (nearly $9.4 billion) exceeded that of the largest single supplier--the Soviet Union ($9.1 billion) (tables lA and lB) (charts 2, 3, 4 and 5).
o The value of all arms transfer agreements with the Third World in 1985 ($29.9 billion) was the lowest total for any year since 1978 (in constant 1985 dollars) though only slightly lower than the level of 1983 ($30 billion). The value of all arms transfer agreements with the Third World remains well below the peak year of 1980 when agreements exceeded $53.7 billion (in constant 1985 dollars) (table lA) (chart 1).
o The Near East and South Asia region is the greatest Third World arms market. In 1982-1985 it accounted for over 75% of the total value of all Third World arms transfer agreements (tables lC and lD).
o In the Near East and South Asia region between 1982-1985, the United States had the largest share of arms transfer agreements of any single supplier with 26%. The Soviet Union's share during this period was 25.7%. The four Major West European suppliers, as a group, had 27.3% of all arms transfer agreements (tables lC and lE) (chart 7).
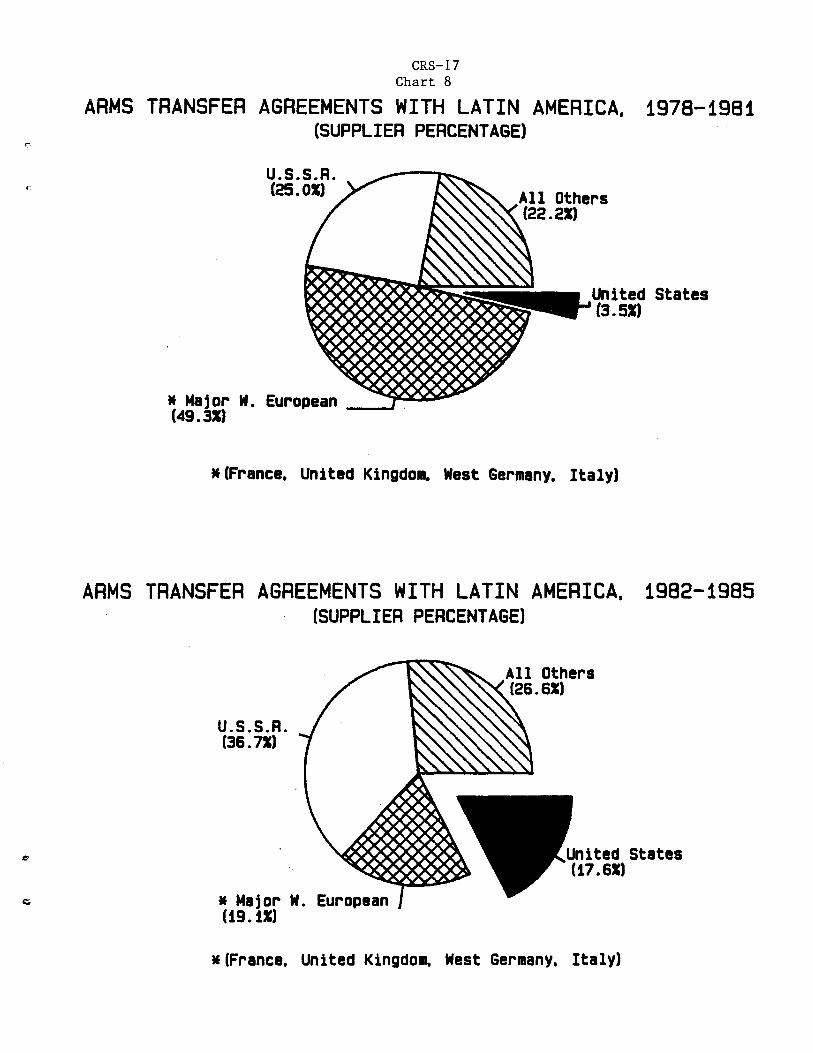
o Arms transfer agreements with the Latin American region became much more polarized during 1982-1985 than they had been during 1978-1981. The United States and the Soviet Union, which collectively accounted for 28.5% of these agreements in the earlier period, were responsible for 54.3% of these agreements between 1982-1985. The United States' share increased from 3.5% to 17.6%; the Soviet Union's share increased from 25% to 36.7% (tables lC and lE) (chart 8).
o The value of all non-Communist nations' arms transfer agreements with the Third World has exceeded that of such agreements by all Communist nations every year since 1978 (in constant 1985 dollars) (table lA) (chart 6).
o The value of all arms deliveries to the Third World in 1985 was the lowest of any year since 1978; and 1985 marked the third year in a row that the real value of all deliveries to the Third World declined (in constant 1985 dollars) (table 2A) (charts 9 and 12).

..
0
CRS-3
o The value of all non-Communist nations' arms deliveries to the Third World has exceeded that of all such deliveries by all Communist nations for every year since 1978 (with the one exception of 1979) (in constant 1985 dollars) (table 2A) (chart 12).
EXPLANATORY NOTES
The Third World category includes all countries except NATO nations,
Warsaw Pact nations, Europe, Japan, Australia and New Zealand. All data are
for the calendar year given, except for the U.S. MAP (Military Assistance
Program) and IMET (International Military Education and Training) program data
in the agreements table, which are included for the particular fiscal year.
U.S. commercial sales and deliveries data are excluded. This is done because
the U.S. Foreign Military Sales (FMS) program accounts for the overWhelming
amount of U.S. conventional arms transfer agreements and deliveries. Further,
the data maintained on U.S. commercial sales agreements and deliveries are
much less precise than that for the FMS program. However, all Foreign Military
Sales (FMS) construction sales and deliveries are included in the U.S values
totals. The reader is directed to the footnotes of the tables for other
details regarding data used in the report.
The data in this report are set out in a series of tables providing,
among other things, dollar values of arms transfer agreements and deliveries
as well as actual numbers of weapons delivered to Third World countries.
Charts that highlight the dollar value data are placed throughout the text.
Table 1 shows the dollar values of arms transfer agreements with the Third
World by supplier from 1978-1985. Table 2 shows the dollar values of arms
transfer deliveries to the Third World for the same years.
Table lA shows the values of arms transfer agreements with the Third
World by supplier from 1978-1985 expressed in constant 1985 U.S. dollars.
CRS-4
Table lB gives the percentage of all Third World arms transfer agreement ·1
values held by individual supplier or supplier group from 1978-1985. It
is based on the dollar figures given in table 1.
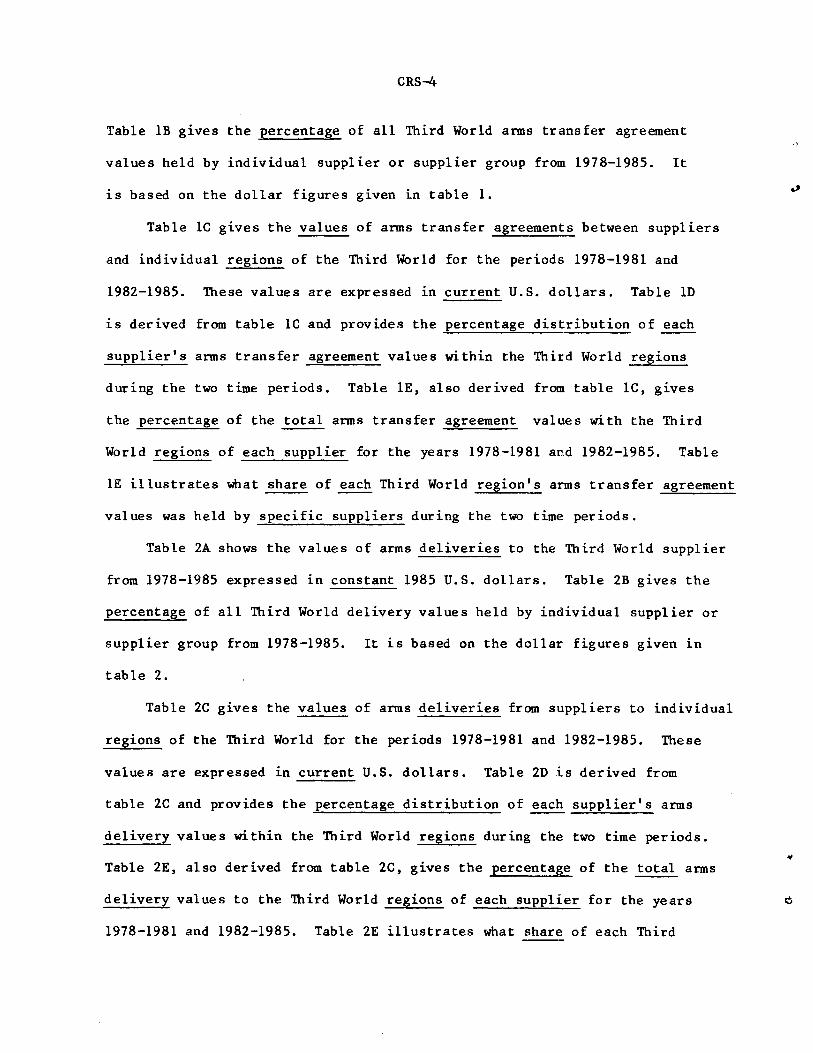
Table lC gives the values of arms transfer agreements between suppliers
and individual regions of the Third World for the periods 1978-1981 and
1982-1985. These values are expressed in current U.S. dollars. Table lD
is derived from table lC and provides the percentage distribution of each
supplier's arms transfer agreement values within the Third World regions
during the two time periods. Table lE, also derived from table lC, gives
the percentage of the total arms transfer agreement values with the Third
World regions of each supplier for the years 1978-1981 and 1982-1985. Table
lE illustrates what share of each Third World region's arms transfer agreement
values was held by specific suppliers during the two time periods.
Table 2A shows the values of arms deliveries to the Third World supplier
from 1978-1985 expressed in constant 1985 U.S. dollars. Table 2B gives the
percentage of all Third World delivery values held by individual supplier or
supplier group from 1978-1985. It is based on the dollar figures given in
table 2.
Table 2C gives the values of arms deliveries from suppliers to individual
regions of the Third World for the periods 1978-1981 and 1982-1985. These
values are expressed in current U.S. dollars. Table 2D is derived from
table 2C and provides the percentage distribution of each supplier's arms
delivery values within the Third World regions during the two time periods.
Table 2E, also derived from table 2C, gives the percentage of the total arms
delivery values to the Third World regions of each supplier for the years
1978-1981 and 1982-1985. Table 2E illustrates what share of each Third

CRS-5
World region's arms delivery values was held by specific suppliers during
the two time periods.
Tables 3 through 7 give detailed totals of specific weapons categories
actually delivered to either the Third World as a whole or to a specific
region of it by the United States, the USSR, and the four Major Western
European suppliers as a group. They provide delivery data for the periods
1978-1981, 1982-1985 and 1978-1985. Regions are identified at the end of the
tables as are descriptions of items included in the twelve specific weapons
categories. None of the data included in the weapon$ deliveries tables
represent items delivered to any country not defined as a Third World nation.
SELECTED SUMMARY OF DATA TRENDS, 1978-1985
Table 1 -- THIRD WORLD ARMS TRANSFER AGREEMENT VALUES
Tables 1 through lE present annual data on anns transfer agreements with
Third World nations by major suppliers from 1978-1985. These data show the
most recent trends in arms contract activity by major suppliers. To use these
data for purposes other than assessing general trends in seller/buyer activity
is to risk drawing hasty conclusions that can be rapidly invalidated by
events--precise values and comparisons may be changed by cancellations of
major arms transfer agreements.
Table 1 shows the annual current dollar amounts of arms transfer
agreements with the Third World. Since these figures do not allow for the
effects of inflation, they are, by themselves, of limited use. They provide,
however, the data from Which tables lA and lB are derived. Some of the more
notable facts reflected by these data are summarized below.

CRS-6
o Most arms suppliers registered declines between 1984 and 1985 in the value of their arms transfer agreements with the Third World (in constant 1985 dollars) (table lA) (chart 1).
o For the second year in a row, a major West European supplier ranked second among all arms suppliers to the Third World, making more sales agreements than the United States (United Kingdom in 1985, France in 1984) (in constant 1985 dollars) (tables lA and lB).
o The Uni.ted Kingdom registered a substantial increase in its share of Third World arms transfer agreements between 1984 and 1985. This increase was attributable principally to a multi-billion dollar aircraft contract with Saudi Arabia. The United Kingdom's share increased to 21.8% in 1985, from 1.6% in 1984. The value of the United Kingdom's agreements with the Third World rose to $6.5 billion in 1985, from $559 million in 1984 (in constant 1985 dollars) (tables lA and lB).
o The four Major West European suppliers, as a group, increased their share of Third World arms transfer agreements between 1984 and 1985. This group's share rose from 25.6% in 1984, to 31.3% in 1985. The collective value of the Major West European suppliers' agreements with the Third World in 1985 (nearly $9.4 billion) exceeded that of the largest single supplier--the Soviet Union ($9.1 billion) (tables lA and lB) (charts 2, 3, 4, and 5).
o Both the Soviet Union and France experienced notable declines in their shares of Third World arms transfer agreements between 1984 and 1985. The Soviet Union's share of agreements fell from 37.4% in 1984, to 30.4% in 1985. France's share of agreements fell from 21.7% in 1984, to 4.7% in 1985 (tables lA and lB) (charts 2 and 5).
o In 1985 the Soviet Union ranked first in Third World arms transfer agreements at $9.1 billion. The United Kingdom ranked second at $6.5 billion, while the United States ranked third at $5.3 billion. The value of U.S. Third World agreements fell from $7.1 billion in 1984 (in constant 1985 dollars). The United States' share of all Third World agreements in 1985 was 17.8%, down from 20.6% in 1984 (tables 1A and 1B) (chart 2).
o In 1985 the non-Communist suppliers collectively made $17.4 billion in arms trans fer agreements with the Third World compared to $12.5 billion for all Communist suppliers. The non-Communist suppliers collectively made 58% of all such agreements in 1985, compared to 42% for all Communist suppliers (tables 1 and 1B) (chart 6).
o The value of all non-Communist nations' arms transfer agreements with the Third World has exceeded that of such agreeme:nts by all Communist nations every year since 1978 (in constant 1985 dollars) (table 1A) (chart 6).
..

Ill Chart 1 •
ARMS TRANSFER AGREEMENTS WITH THE THIRD WORLD. 1978-1985 BY ALL SUPPLIERS
(in billions of constant 1985 dollars) 60~----------------------------------------------------------------
50+-------------~~--~------------·--------------------------------
40+-----~~------------------~~----------~-----------------------
30+---------------------------------------------~----------------~
20+----------------------------------------------
10~
o+--------4--------~--------~-------+--------~--------~------~ 1978 1979 1980 1981 1982 1983 1984 1985
n t;d til I
'"-.1

CRS-8
Chart 2
ARMS TRANSFER AGREEMENTS WITH THE THIRD WORLD 1984 (as I of all agreements)
* Major W. European (25.61)
1 Others (16. 41)
*(France. United Kingdoa West Germany. Italy)
ARMS TRANSFER AGREEMENTS WITH THE THIRD WORLD 1985 (as I of all agreements)
* Major W. European (31.31)
11 Others (20.51)
•(France. United Kingdom. West Germany. Italy)
•
..

" . • Chart 3
ARMS TRANSFER AGREEMENTS WITH THE THIRD WORLD, 1978-1985 UNITED STATES. U.S.S.R. AND MAJOR W. EUROPEAN COMPARED
2oT T taT l
16+
t 14--cn )
a: + ~ .
:i 12. 0 c
g; 10 en z s 8 _J _J H
aJ 6
4
2
0 I r: <
(in billions of constant 1985 dollars)
,.
1979 U.S.S.R.
1982 United States
1983 1984 1985
VZTLL1 -
C':l lA:! tn I
\0

Billions of
Dollars
Billions of
Dollars
Chart 4
ARMS TRANSFER AGREEMENTS WITH THE THIRD WORLD, 1978-1985: BY MAJOR SUPPLIER
(in constant 1985 Dollars)
United States
78 79 80 81 82 83 84 85 Year
Major Western European
78 79 80 81 82 83 84 85 Year
if •
Billions of
Dollars
Billions of
Dollars
Soviet Union
78 79 80 81 82 83 84 85 Year
All Others
1~+----·--
81 82 83 84 85 Year
•
("}
~ Ul I ,......
0

c:
CRS-11
Table lA -- THIRD WORLD ARMS TRANSFER AGREEMENT VALUES IN CONSTANT 1985 DOLLARS
Table lA displays the data in table 1 in constant 1985 U.S.
dollars. Beyond those already cited above, some of the more notable facts
reflected by these data are summarized below.
o The real value (constant dollars) of all Third World arms transfer agreements in 1985 ($29.9 billion) was the lowest total for any proceeding year since 1978, and only slightly lower than 1983.
o In real terms (constant dollars) there has been, on balance, a a lack of sustained growth in the total value of Third World arms transfer agreementts from 1978 to 1985.
Table lB -- THIRD WORLD ARMS TRANSFER AGREEMENT VALUES: SUPPLIER PERCENTAGES, 1978-1985
This table gives the percentage of all Third World arms transfer agreement
values held by individual suppliers or supplier groups from 1978-1985. This
table is based on the dollar figures given in table 1. It facilitates analysis
of percentage changes 1n Third World agreements shares of suppliers over
time between 1978-1985. It is the source for the various percentages used
in describing the data in table 1.

Chart 5
ARMS TRANSFER AGREEMENTS WITH THE THIRD WORLD, 1978-1985: MAJOR SUPPLIER SHARES
100~----------------------------------------------------------------~
Other
Percent 60
~ ""'-·------
""'Soviet Unio/""" __j ~ of Total
40 I ~
Maj. West European ~ ~ ~
20 I
United States I
0 78 79 80 81 82 83 84 85
Year
fl· • , ~

60
50
en 40 a: c(
-' -' 0 Cl
; 30t --' -' -Ill 20
10
0
'" 1.1 Chart 6 !':
ARMS TRANSFER AGREEMENTS WITH THE THIRD WORLD. 1978-1985 NON-COMMUNISTS AND COMMUNISTS COMPARED
H
(in billions of constant 1985 dollars)
~ Ill
1980 Non-Communist -
m Ill
1981 1982
~ ~
1983 1984 Communist m
~
1985
("')
:::0 Ul I ,_. w

CRS-14
Tables lC, lD and lE -- REGIONAL ARMS TRANSFER AGREEMENT VALUES, 1978-1985
Table lC gives the values of arms transfer agreements between suppliers
and individual regions of the Third World for the periods 1978-1981 and
1982-1985. These values are expressed in current U.S. dollars. Table lD,
derived from table lC, gives the percentage distribution of each supplier's
agreement values within the regions for the two time periods. Table lE,
also derived from table lC, illustrates what percentage share of each Third
World region's total arms transfer agreements was held by specific suppliers
during the years 1978-1981 and 1982-1985. Among the facts reflected in
these tables are the following:
o The Near East and South Asia region is the greatest Third World arms market. In 1982-1985 it accounted for over 75% of the total value of all Third World arms transfer agreements (tables lC and lD).
o The Near East and South Asia region ranked first in arms transfer agreements with all suppliers in both the 1978-1981 and 1982-1985 time periods (table lD).
o Arms transfer agreements with Latin America became much more polarized during 1982-1985 than they had been during 1978-1981. The United States and the Soviet Union, which collectively accounted for 28.5% of these agreements with Latin America in the earlier period, were responsible for 54.3% of these agreements between 1982-1985. The United States' share increased from 3.5% to 17.6%, the Soviet Union's share increased from 25% to 36.7% (tables lC, lD and lE) (chart 6).
o In the earlier period (1978-1981), the United States ranked first in agreements with East Asia and the Pacific with 37.9%. The Soviets ranked second with 31.4%. The Major West European suppliers, as a group, made 14% of this region's agreements in 1978-1981. In the later period (1982-1985), the United States ranked first in East Asia and Pacific agreements with 38.2%. The Soviets again ranked second with 28.7%. The Major West European suppliers, as a group, made 9.8% of this region's agreements in 1982-1985 (table lE).
o In the earlier period (1978-1981), the Soviet Union ranked first in agreements with the Near East and South Asia with 27%. The United States ranked a close second with 26.4%. The French ranked third with 13.4%. The Major West European suppliers, as a group, made 27.3% of this region's agreements in 1978-1981. In the later period (1982-1985), the United States ranked first in Near East and South Asian agreements with 26%. The Soviets ranked a close second with

n
CRS-15
25. 7%. France ranked third with 15.4%. The Major West European suppliers, as a group, made 27.3% of this region's agreements in 1982-1985 (table lE) (chart 7).
o In the earlier period (1978-1981), the West Germans ranked first in agreements with Latin America with 25.8%. The Soviets ranked second with 25%. The French ranked third with 15%. The Major West European suppliers, as a group, mad'e 49.3% of this region 1 s agreements in 1978-1981. In the later period (1982-1985), the Soviet Union ranked first in Latin American agreements with 36. 7%. The United States ranked second with 17. 6%. France ranked third with 11. 5%. The Major West European suppliers, as a group, made 19.1% of this region's agreements 1n 1982-1985(table lE) (chart 8).
o In the~ earlier period ( 1978-1981), the Soviet Union ranked first in agree.ments with Africa (Sub-Saharan) with 48. 7%. France ranked second with 10.6%. The Major West European suppliers, as a group, made 26.8% of this region's agreements in 1978-1981. In the later period (1982-1985), the Soviet Union continued to rank first in Sub-Saharan African agreements with 49. 5%. Italy ranked second with 7 .9%. France ranked third llllith 6.6%. The Major West European suppliers, as a group, made 24.3% of this region's agreements in 1982-1985 (table lE).
o Sub-Saharan Africa was the only region where the value of the agreements by the Communist suppliers collectively exceeded the values of those of all non-Communist suppliers for either time period. Communist suppliers, as a group, made 59.7% of this region's agreements in 1978-1981 and 56.9% of its agreements in 1982-1985 (table lE).

Chart 7
ARMS TRANSFER AGREEMENTS. 1982-1985 WITH NEAR EAST AND SOUTH ASIA
(SUPPLIER PERCENTAGE)
U . S . S • R • (25 • 71)
All Others (21. 01)
* Major (27. 31) United States (26.01)
W. European
*(France. United Kingdom. West Germany. Italy)
~ . ' "
(")
~ I
....... 0\
CRS-17 Chart 8
ARMS TRANSFER AGREEMENTS WITH LATIN AMERICA, 1978-1981 (SUPPLIER PERCENTAGE)
U.S.S.R. (25.01)
*Major W. European -~~00~ (49.31)
*(France. United Kingdo~ West Germany. Italy)
ARMS TRANSFER AGREEMENTS WITH LATIN AMERICA, 1982-1985 (SUPPLIER PERCENTAGE)
U.S.S.R. (36. 71)
* Major W. European (19.11)
United States (17 .61)
* (Fra~nce. United Kingdom. West Germany, Italy)

CRS-18
Table 2 -- THIRD WORLD ARMS DELIVERY VALUES
Table 2 shows the annual current dollar values of arms deliveries (items
actually transferred) to Third World nations by major suppliers from
1978-1985. The utility of these particular data is that they reflect events
that have occurred. Some of the more notable facts illustrated by these
data are summarized below.
o In 1985 the Soviet Union ranked first in Third World delivery values at $7.2 billion. The United States ranked second at $5.8 billion. France ranked third with $3.3 billion in deliveries (in current dollars).
o In 1985 the non-Communist suppliers collectively made $11.9 billion in deliveries to the Third World compared to $9.6 billion for all Communist suppliers. The non-Communist suppliers collective percentage of Third World delivery values was 55.4% in 1985 compared to 44.6% for all Communist suppliers. The four Major West European suppliers, as a group, made over $4.6 billion in Third World deliveries in 1985, which was 21.6% of all delivery values for that year (tables 2 and 2B).
Table 2A -- THIRD WORLD ARMS DELIVERY VALUES IN CONSTANT 1985 DOLLARS
Table 2A displays the data in Table 2 in constant 1985 U.S. dollars.
Some of the more notable facts reflected by these data are summarized below.
o In 1985, the real value (constant dollars) of arms deliveries to the Third World by the Soviet Union was the lowest for any year since 197 8. The value of deliveries by the United States in 1985 was the second lowest total since 1978 (1984 was the lowest year) (charts 10 and 11).
o In real terms (constant dollars) the total value of all arms deliveries to the Third WOrld in 1985 was the lowest of any year since 1978, and was the third year in a row that the real value of such deliveries declined (chart 9).
o The real value (constant dollars) of all non-Communist nations' arms deliveries to the Third World has exceeded that of all such deliveries by all Communist nations for every year since 1978 (with the sole exception of 1979) (chart 12).
•
"
~ ..., 0 (\
Chart 9
ARMS DELIVERIES TO THE THIRD WORLD. 1978-1985
45
40
... 35 ~
30
25
20
15
10
5
0 1978
I I
1979
BY ALL SUPPLIERS (in billions of constant 1985 dollars)
.
..v.
~ ~ ~
"' ""7f"'
~ \
I I I I I I
1980 1981 1982 1983 1984 1985
CJ ::0 Ul I ......
""

Billions of
Dollars
Billions of
Dollars
Chart 10
ARMS DELIVERIES TO THE THIRD WORLD, 1978-1985: BY MAJOR SUPPLIER
(in constant 1985 Dollars)
United States
78 79 80 81 82 83 84 85 Year
Major Western European
78 79 80 81 82 83 84 85 Year
~ "'
Billions of
Dollars
Billions of
Dollars
Soviet Union
80 81 82 83 Year
All Others
78 79 80 81 82 83 84 85 Year
\i
(')
l:d tJ)
I N 0

..
•
CRS-21
Table 2B -- THIRD WORLD ARMS DELIVERY VALUES: SUPPLIER PERCENTAGES, 1978-1985
This table gives the percentage of all Third World delivery values held
by individual suppliers or supplier groups from 1978-1985. This table is
based on the dollar figures given in table 2. It facilitates analysis of
percentage changes in Third World delivery shares of suppliers over time
between 1978-1985.
Tables 2C, 2D, and 2E -- REGIONAL ARMS DELIVERY VALUES, 1978-1985
Table 2C gives the values of arms deliveries between suppliers and
individual regions of the Third World for the periods 1978-1981, and 1982-1985.
These values are expressed in current U.S. dollars. Table 2D, derived from
table 2C, gives the percentage distribution of each supplier's delivery
values within the regions for the two time periods. Table 2E, also derived
from table 2C, illustrates what percentage share of each Third World region's
total arms delivery values was held by specific suppliers during the years
1978-1981 and 1982-1985. Among the facts reflected in these tables are the
following:
o The Near East and South Asia region has historically dominated in the value of deliveries made to the Third World. In 1982-1985, it accounted for 73.3% of the total value of all Third World arms deliveries (tables 2C and 2D).
o The Near East and South Asia region ranked first in the value of arms deliveries with all suppliers in both time periods, with only one exception (West Germany in 1982-1985) (table 2D) .
o In the earlier period (1978-1981), the Soviet Union ranked first in the value of arms deliveries to East Asia and the Pacific with 39.9%. The United States ranked second with 29.9%. The Major West European suppliers, as a group, held 12.4% of this region's delivery values in 1978-1981. In the later period (1982-1985), the Soviet Union ranked first in East Asia and Pacific delivery values

Percent of
Total
Chart 11
ARMS DELIVERIES TO THE THIRD WORLD, 1978-1985: MAJOR SUPPLIER SHARES
100~--------------------------------------------------------------~
Other 80+------·
60 Soviet Union
~·--
40+ ~ Maj. West European
20 -~--+----=-=======~~~---~~::::: United States
0+-------~~-------+--------~--------+-------~~------~--------~ 78 79 80 81 82 83 84 85
Year <J • c:
('")
~ tf.l I
N N

451 I
401 ! l + l
35~
1 I
en 30j cr , < ' _, + g 25+ g; . fl)
~ 20 1-4
::t 1-4 Ill
15
10
5
0
• 1'
1978
Chart 12
ARMS DELIVERIES TO THE THIRD WORLD. 1978-1985 NON-COMMUNISTS AND COMMUNISTS COMPARED
(in billions of constant 1985 dollars)
1979 1980 1981 1982 1983 1984 Non--Communists Communists - ~
r;
1985
(") J;O tf.)
I N w

CRS-24
with 37.1%. The United States ranked second with 32.7%. The Major West European suppliers, as a group, held 12.5% of this region's delivery values in 1982-1985 (table 2E).
o In the earlier period (1978-1981), the Soviet Union ranked first in the value of arms deliveries to the Near East and South Asia with 38.3%. The United States ranked second with 27.5%. France ranked third with 10%. The Major West European suppliers, as a group, held 22.2% of this region's delivery values in 1978-1981. In the later period (1982-1985), the Soviet Union ranked first in Near East and South Asian delivery values with 27.1%. The United States ranked second with 26.3%. France ranked third with 14.1%. The Major West European suppliers, as a group, held 21.9% of this region's delivery values in 1982-1985 (table 2E).
o In the earlier period (1978-1981), the Soviet Union ranked first in the value of arms deliveries to Latin America (33.4%). France ranked second with 20.2%. The United Kingdom ranked third with 8.7%. The Major West European suppliers, as a group, held 41.9% of this region's delivery values in 1978-1981. In the later period (1982-1985), the Soviet Union ranked first in Latin American delivery values with 30.2%. West Germany ranked second with 21.3%. The United States ranked third third with 11.2%. The Major West European suppliers, as a group, held 35.4% of this region's delivery values in 1982-1985 (table 2E).
o In the earlier period (1978-1981), the Soviet Union ranked first in the value of arms deliveries to Africa (Sub-Saharan) with 49.7%. France ranked second with 9.4%. The Major West European suppliers, as a group, held 27.8% of this region's delivery values in 1978-1981. In the later period (1982-1985), the Soviet Union ranked first in Sub-Saharan Africa delivery values with 57 .6%. France ranked second with 8. 7%. The Major West European suppliers, as a group, held 21.3% of this region's delivery values in 1982-1985 (table 2E).
o Sub-Saharan Africa was the only region where the value of arms deliveries by the Communist suppliers collectively exceeded the value of arms deliveries by all non-Communist suppliers for either time period. Communist suppliers, as a group, held 59.1% of this region's delivery values in 1978-1981 and 65.9% in 1982-1985 (table 2E).
THIRD WORLD WEAPONS DELIVERIES TABLES
Another type of useful data for assessing arms transfers to the Third
World by suppliers are those that indicate who has actually delivered numbers
of specific classes of military items to a region. These data are relatively

CRS-25
"hard" in that they reflect actual transfers of specific items of military
equipment. They have the limitation of not giving detailed information
regarding the sophistication level of the equipment delivered. However,
these data will show relative trends in the delivery of various classes of
military equipment and will also indicate who the leading suppliers are from
region to region over time. These data can also indicate Who has developed
a market for a category of weapon in a region, and perhaps suggest Whether
or not regional arms races are emerging. For these reasons, the following
tables set out actual deliveries of 12 separate categories of weaponry to
the Third World from 1978-1985 by the United States, the Soviet Union, and
the four Major West European suppliers as a group.
Table 3 --WEAPONS DELIVERED TO THE THIRD WORLD, 1978-1985
o The data in table 3 show that from 1978-1985 the Soviet Union led in 8 of the 12 categories of weapons delivered to the Third World as a whole, While the Major West European suppliers led in 4 and the United States in none. In the most recent 4-year period (1982-1985), the Soviet Union led in 10 categories, the Major West Europeans in 1, and the United States 1n one.
o Table 3 illustrates that from 1978-1985, the Soviets led 1n deliveries of tanks and self-propelled guns, artillery, APCs and armored cars, supersonic and subsonic combat aircraft, helicopters, guided missile boats, and surface-to-air missiles. In the 1978-1985 period the Major West European suppliers led in deliveries of both major and minor surface combatants, submarines, and other aircraft.
o Table 3 shows that in the most recent period (1982-1985) the Soviets led in deliveries of tanks and self-propelled guns, artillery, APCs and armored cars, minor surface combatants, submarines, supersonic combat aircraft, other aircraft, helicopters, guided missile boats, and surface-to-air missiles. The Major West European suppliers led in the delivery of major surface combatants. The United States led in the delivery of subsonic combat aircraft.
Breaking the lbird World delivery data into major regions gives an
indication of Which supplier or suppliers are dominating in deliveries of
specific classes of equipment and in general. The regions examined are

CRS-26
East Asia and the Pacific, Near East and South Asia, Latin America, and
Sub-Saharan Africa.
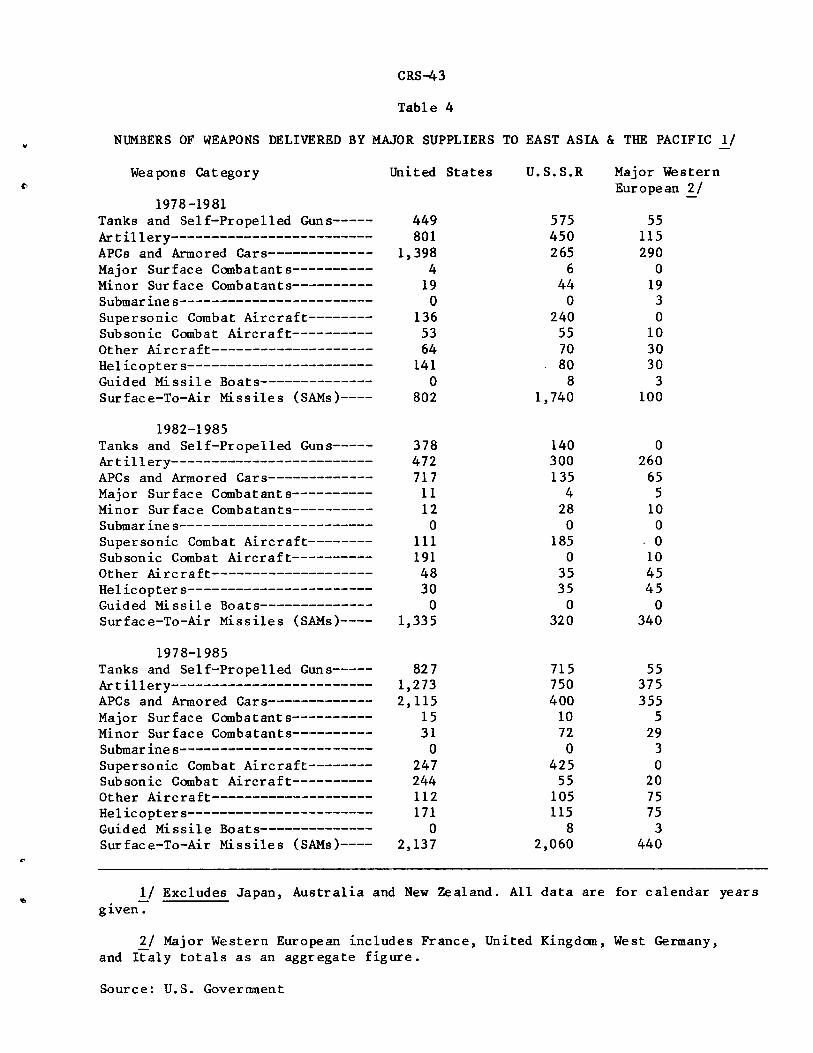
Table 4 -- WEAPONS DELIVERED TO EAST ASIA AND THE PACIFIC, 1978-1985
o The data in Table 4 show that from 1978-1985, the United States led in 8 of the 12 categories of major weapons deliveries to East Asia and the Pacific. The Soviets led in 3 categories, while the Major West Europeans led in one. In the most recent period (1982-1985) the Uhited States led in 7 categories, the Soviet Union led ~n 2, and the Major West Europeans led in one.
o Table 4 illustrates that from 1978-1985, the United States led in the delivery of tanks and self-propelled guns, artillery, APCs and armored cars, major surface combatants, subsonic combat aircraft, other aircraft, helicopters, and surface-to-air missiles. The Soviet Union led in deliveries of minor surface combatants, supersonic combat aircraft, and guided missile boats. The Major West European suppliers led in deliveries of submarines.
o Table 4 shows that in the most recent period (1982-1985), the United States led in deliveries of tanks and self-propelled guns, artillery, APCs and armored cars, major surface combatants, subsonic combat aircraft, other aircraft, and surface-to-air missiles. The Soviet Union led in deliveries of minor surface combatants and supersonic combat aircraft. The Major West European suppliers led in the delivery of helicopters.
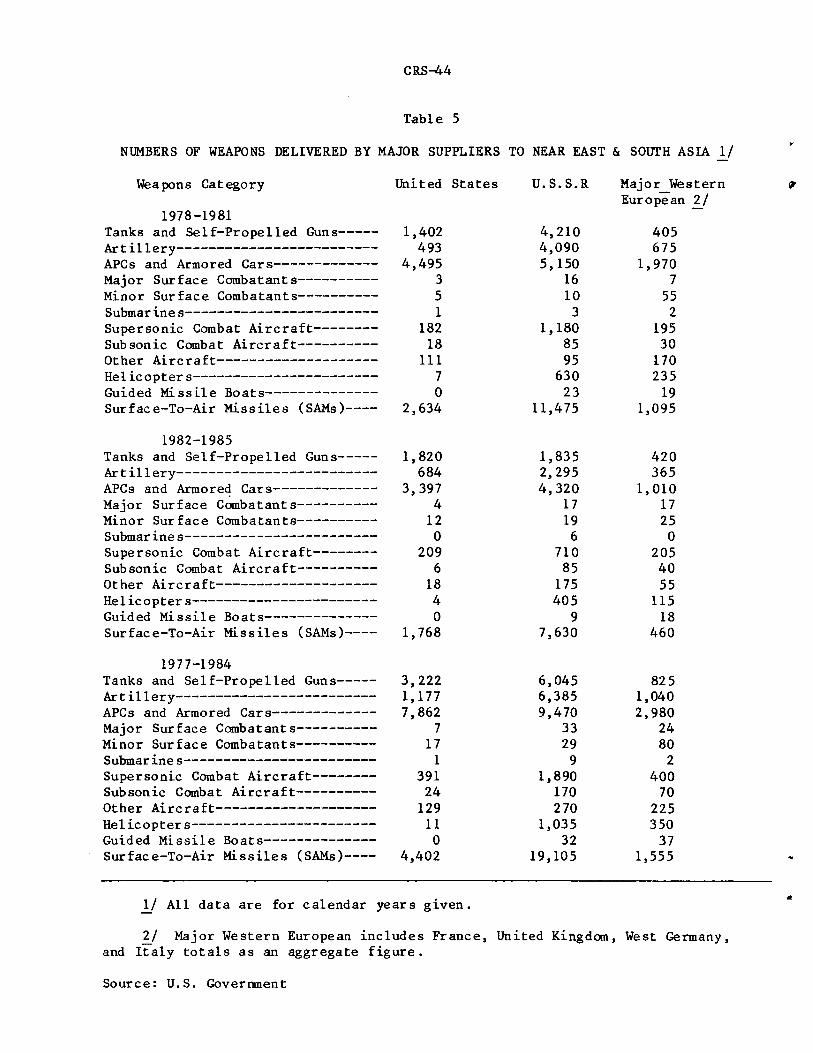
Table 5 -- WEAPONS DELIVERED TO NEAR EAST AND SOUTH ASIA, 1978-1985
o The data in Table 5 show that from 1978-1985, the Soviet Union dominated the delivery of major weapons to the Near East and South Asian region, leading in 10 of the 12 categories. The Major West European suppliers led in 2 categories. The United States led in none. In the most recent period (1982-1985), the Soviet Union led in 9 categories. The Major West Europeans led in 2 categories, and tied with the Soviet Union in one. The United States led in no category.
o Table 5 illustrates that from 1978-1985, the Soviet Union led in the delivery of tanks and self-propelled guns, artillery, APCs and armored cars, major surface combatants, submarines, supersonic and subsonic combat aircraft, other aircraft, helicopters, and surface-to-air missiles. The Major West European suppliers led in the delivery of minor surface combatants and guided missile boats.
CRS-27
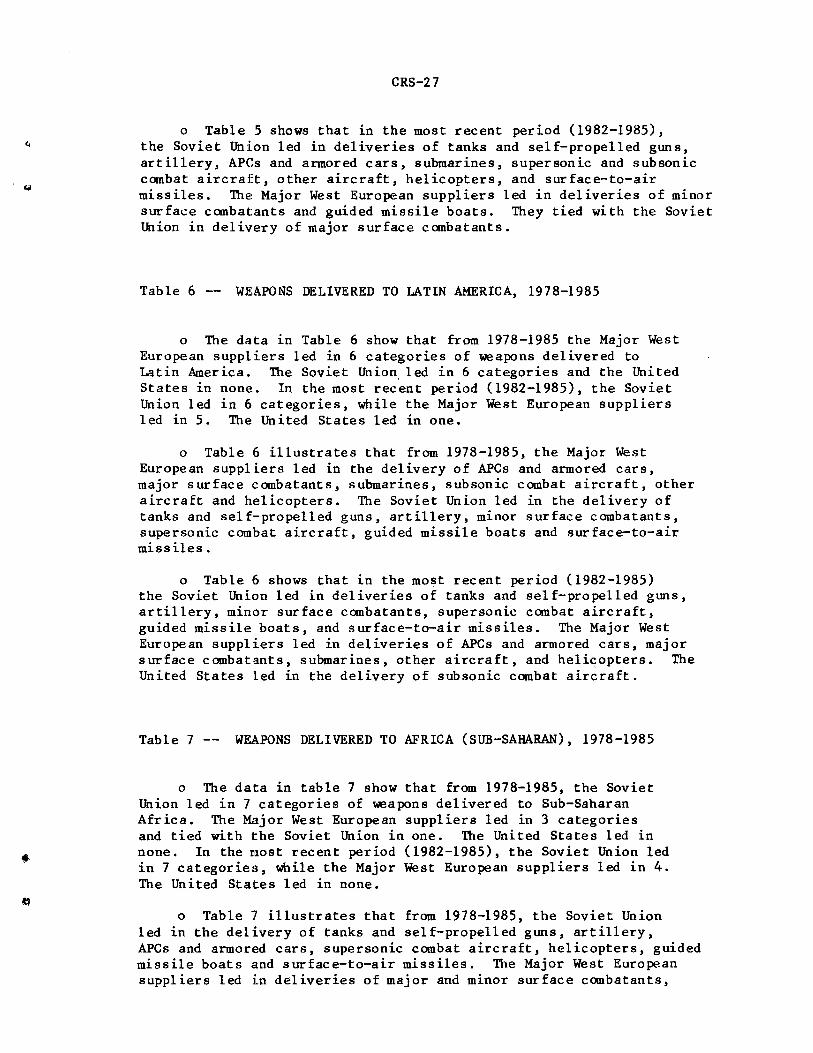
o Table 5 shows that in the most recent period (1982-1985), the Soviet Union led in deliveries of tanks and self-propelled guns, artillery, APCs and armored cars, submarines, supersonic and subsonic combat aircraft, other aircraft, helicopters, and surface-to-air missiles. The: Major West European suppliers led in deliveries of minor surface combatants and guided missile boats. They tied with the Soviet Union in delivery of major surface combatants.
Table 6 -- WE:APONS DELIVERED TO LATIN AMERICA, 1978-1985
o The data in Table 6 show that from 1978-1985 the Major West European suppliers led in 6 categories of weapons delivered to Latin America. The Soviet Union. led in 6 categories and the United States in none.. In the most recent period (1982-1985), the Soviet Union led in 6 categories, while the Major West European suppliers led 1n 5. The United States led in one.
o Table 6 illustrates that from 1978-1985, the Major West European suppliers led in the delivery of APCs and armored cars, major surface combatants, submarines, subsonic combat aircraft, other aircraft and helicopters. The Soviet Union led in the delivery of tanks and self-propelled guns, artillery, minor surface combatants, supersonic combat aircraft, guided missile boats and surface-to-air missiles.
o Table 6 shows that in the most recent period (1982-1985) the Soviet Union led in deliveries of tanks and sel £-propelled gtms, artillery, minor sur face combatants, supersonic combat aircraft, guided missile boats, and surface-to-air missiles. The Major West European suppliers led in deliveries of APCs and armored cars, major surface combatants, submarines, other aircraft, and helicopters. The United States led in the delivery of subsonic combat aircraft.
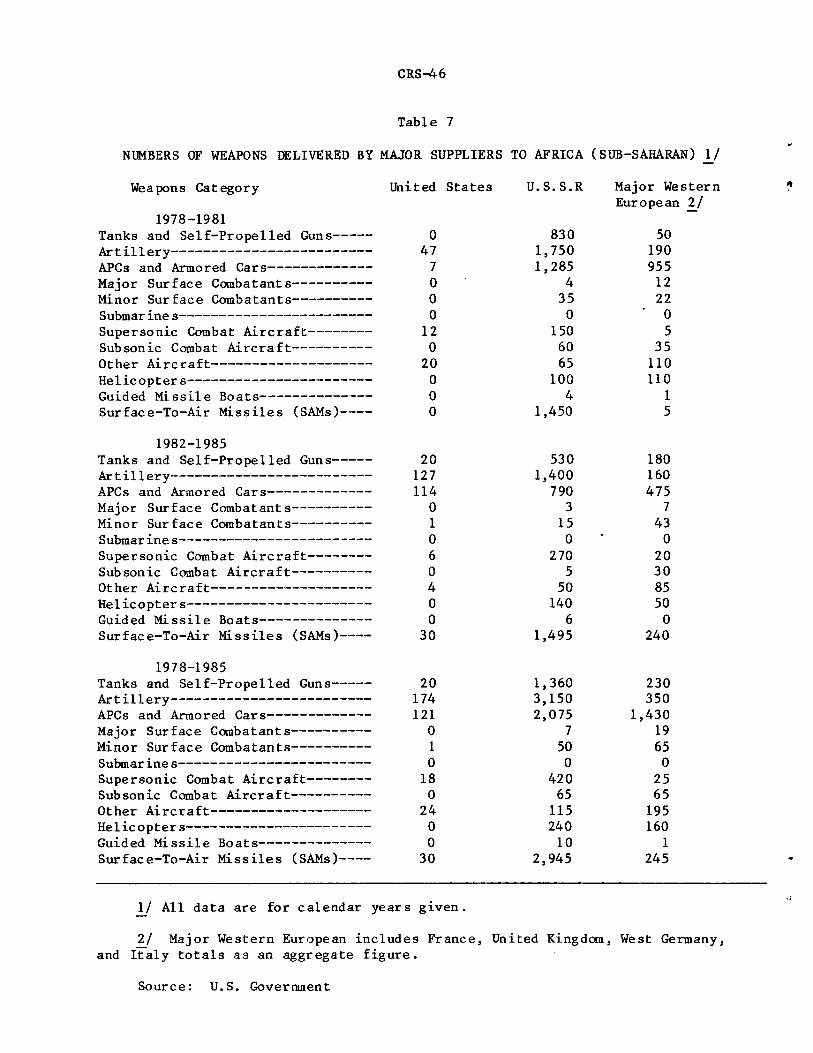
Table 7 -- Wfu\PONS DELIVERED TO AFRICA (SUB-SAHARAN), 1978-1985
o The data in table 7 show that from 1978-1985, the Soviet Union led in 7 categories of weapons delivered to Sub-Saharan Africa. The Major West European suppliers led in 3 categories and tied with the Soviet Union in one. The United States led in none. In the most recent period (1982-1985), the Soviet Union led in 7 categories, while the Major West European suppliers led in 4. The United States led in none.
o Table 7 illustrates that from 1978-1985, the Soviet Union led in the delivery of tanks and self-propelled guns, artillery, APCs and armored cars, supersonic combat aircraft, helicopters, guided missile boats and surface-to-air missiles. The Major West European suppliers led in deliveries of major and minor surface combatants,

CRS-28
other aircraft, and tied with the Soviet Union in the delivery of subsonic combat aircraft. The United States led in no delivery category.
o Table 7 shows in the most recent period (1982-1985), the Soviet Union led in the delivery of tanks and self-propelled guns, artillery, APCs and armored cars, supersonic combat aircraft, helicopters, guided missile boats, and surface-to-air missiles. The Major West European suppliers led in deliveries of major and minor surface combatants, subsonic combat aircraft and other aircraft. The United States led in no delivery category.
REGIONAL WEAPONS DELIVERIES SUMMARY, 1982-1985
o The regional weapons delivery data collectively show that the Soviet Union was the leading arms supplier to the Third World of several major classes of conventional weaponry from 1982-1985. The United States also transferred substantial quantities of many of the same weapons classes, but did not match the Soviets in sheer numbers delivered during this period.
o The Major West European suppliers were serious competitors of the two superpowers in weapons deliveries from 1982-1985, making notable deliveries of certain categories of armaments to every region of the Third World -- most particularly to Latin America and Sub-Saharan Africa, but increasingly to the Near East and South Asia region.
In spite of these various trends a cautionary note is warranted.
Aggregate data on weapons categories delivered by suppliers do not provide
specific indices of the quality or level of sophistication of the weaponry
actually provided. As the history of recent conventional conflicts suggests,
quality and/or sophistication of weapons can offset a quantitative disadvantage.
The fact that the United States, for example, may not "lead" in quantities
of weapons delivered to a region does not necessarily mean that the weaponry
it has transferred cannot compensate, to an 1mportant degree, for larger
quantities of less capable weapons systems delivered by the Soviet Union or
others.

CRS-29
Further, these data do not provide an indication of the capabilities of
the recipient nations to use effectively the weapons actually delivered to
them. Superior training-- coupled with quality equipment-- may, in the
last analysis, be a more hnportant factor in a nation's ability to engage
successfully in conventional warfare than the size of its weapons inventory.

Non-communist Of which:
United States France United Kingdom West Germany Italy All Other
Total non-Communist
Communist Of which:
u.s.s.R. All Other
Total Communist
GRAND TOTAL
**Dollar inflation index (1985=100)--------------
Table 1
ARMS TRANSFER AGREEMENTS WITH THE THIRD WORLD, BY SUPPLIER* (In millions of current U.S. dollars)
1978 1979 1980 1981 1982
4,868 9,560 8,880 6,635 12,801 1,975 3,395 7, 920 1,750 7,185 2,520 1,270 2,120 1,520 1,400 2,510 970 1,190 1,760 820 1,400 610 2,875 325 1,260 1,440 1,530 3,150 5,920 3,465
14,713 17,335 26, 135 17,910 26,931
3,610 10,825 12,810 8,345 12,675 1,395 1,160 1,930 7,410 3,990
5,005 11,985 14,740 15,755 16,665
19,718 29,320 40,875 33,665 43,596
.6278 .682 • 7611 .8452 .9056
**Based on Department of Defense Price Deflator
1983
9,379 1,820
570 605
1,580 6,685
20,639
4,130 3,400
7,530
28,169
.9387
*Third World category excludes Europe, NATO nations, Warsaw Pact nations, Japan, Australia and New Zealand. All data are for the calendar year given, except for u.s. MAP (Military Assistance Program) and IMET (International Military Education and Training) data which are included for the particular fiscal year. All prices given include the values of weapons, spare parts, construction, all associated services, military assistance and training programs. Statistics for foreign countries are based upon estimated selling prices. u.s. commercial sales contract values are excluded, as are MASF (Military Assistance Service Funded) related grant transfers to South Korea and Thailand. All data reflect termination of sale~ contracts.
Source: U.S. Government
a •
1984 1985
6,824 5,320 7,195 1,395
540 6,520 375 155 380 1,300
2,935 2,695
18,249 17,385
12,395 9,105 2,505 3,450
(")
14,900 12,555 ?:I C/)
I w 0
33,149 29,940
• 9656 1
~ o;.

• 0 41 ,.
Table lA
ARMS TRANSFER AGREEMENTS WITH THE THIRD WORLD, BY SUPPLIER (In millions of constant 1985 u.s. dollars)
1978 1979 1980 1981 1982 1983 1984 1985
Non-communist Of which:
United States 7,754 14,018 11,667 7,850 14' 135 9,991 7,067 5,320 France 3,146 4,978 10,406 2,071 7,934 1,939 7,451 1,395 United Kingdom 4,014 1,862 2,785 1,798 1,546 607 559 6,520 West Germany 3,998 1,422 1,564 2,082 905 645 388 155 Italy 2,230 894 3 '777 385 1,391 1,683 394 1,300 All Other 2,294 2,243 4,139 7,004 3,826 7,122 3,040 2,695
Total non-Communist 23,436 25,418 34,338 21,190 29,738 21,987 18,899 17,385
Communist Of which: ("'}
U.S.S.R. 5,750 15,872 16,831 9,873 13,996 4,400 12,837 9, lOS ~ All Other 2,222 1,701 2,536 8,767 4,406 3,622 2,594 3,450 c.,
.......
Total Communist 7,972 17,573 19,367 18,641 18,402 8,022 15,431 12,555
GRAND TOTAL 31,408 42,991 53,705 39,831 48,140 30,009 34,330 29,940

Table 18
ARMS TRANSFER AGREEMENTS WITH THE THIRD WORLD, BY SUPPLIER, 1978-1985 (expressed as a percent of Grand Total, by year)
1978 1979 1980 1981 1982 1983 1984 1985
Non-communist Of which:
United States 24.69% 32.61% 21.72% 19.71% 29.36% 33.30% 20.59% 17.77% France 10.02% 11.58% 19.38% 5.20% 16.48% 6.46% 21.71% 4.66% United Kingdom 12.78% 4.33% 5.19% 4.52% 3.21% 2.02% 1.63% 21.78% West Germany 12.73% 3.31% 2.91% 5.23% 1.88% 2.15% 1.13% .52% Italy 7.10% 2.08% 7.03% .97% 2.89% 5.61% 1.15% 4.34% All Other 7.30% 5.22% 7. 71% 17.59% 7.95% 23.73% 8.85% 9.00%
Total non-Communist 74.62% 59.12% 63.94% 53.20% 61.77% 73.27% 55.05% 58.07%
(Major West European)* 42.63% 21.30% 34.51% 15.91% 24.46% 16.24% 25.61% 31.30%
Communist l.l
Of which: :;d tf)
U.S.S.R. 18.31% 36.92% 31.34% 24.79% 29.07% 14.66% 37.39% 30.41% I
All Other 7.07% 3.96% 4. 72% 22.01% 9.15% 12.07% 7.56% w
11.52% N
Total Communist 25.38% 40.88% 36.06% 46.80% 38.23% 26.73% 44.95% 41.93%
GRAND TOTAL 100.00% 100.00% 100.00% 100.00% 100.00% 100.00% 100.00% 100.00%
*(Major West European category includes France, United Kingdom, West Germany, Italy).
.. . . "
• It or. "
Table 1C
REGIONAL ARMS TRANSFER AGREEMENTS, BY SUPPLIER 1978-1985 (in millions of current U.S. dollars)
East Asia/Pacific Near East/So. Asia Latin America Africa (Sub-Saharan) '78-81 '82-85 '78-81 '82-85 '78-81 '82-85 '78-81 '82-85
Non-Communist Of which:
u.s. 5,423 5,806 23,841 26,377 373 1,620 307 521 France 465 315 12,110 15,620 1,585 1,060 880 600 United Kingdom 595 660 5,955 7. 720 270 130 610 525 West Germany 585 355 2,980 955 2,720 280 150 365 Italy 360 165 3,640 3,335 625 295 585 725 All Other 2,215 3,005 6,715 10,060 2,295 1,520 810 1,195
Total non-Communist 9,643 10,306 55,241 64,067 7,868 4,905 3,342 3,931
(Major West European)* 2,005 1,495 24,685 27,630 5,200 1,765 2,225 2,215 (") :;o (/l
Communist I w
Of which: w
u.s.s.R. 4,490 4,360 24,415 26,040 2,640 3,390 4,040 4,515 All Other 160 530 10,785 11,210 45 930 915 685
Total Communist 4,650 4,890 35,200 37,250 2,685 4,320 4,955 5,200
GRAND TOTAL 14,293 15,196 90,441 101,317 10,553 9,225 8,297 9,131
*(Major West European category includes France, United Kingdom, West Germany, Italy).

Table 1D
PERCENTAGE OF SUPPLIER AGREEMENTS VALUE BY REGION, 1978-1985
East Asia/Pacific Near East/So. Asia Latin America Africa (Sub-Saharan) '78-81 '82-85 '78-81 '82-85 '78-81 '82-85 '78-81 '82-85
Non-Communist Of which
u.s. 18.11% 16.92% 79.62% 76.85% 1.25% 4.72% 1.03% 1.52% France 3.09% 1.79% 80.52% 88.78% 10.54% 6.02% 5.85% 3.41% United Kingdom 8.01% 7.30% 80.15% 85.45% 3.63% 1.44% 8.21% 5.81% West Germany 9.09% 18.16% 46.31% 48.85% 42.27% 14.32% 2.33% 18.67% Italy 6.91% 3.65% 69.87% 73.78% 12.00% 6.53% 11.23% 16.04% All Other 18.40% 19.04% 55.80% 63.75% 19.07% 9.63% 6.73% 7.57%
Total non-Communist 12.67% 12.39% 72.60% 77.00% 10.34% 5.89% 4.39% 4. 72%
(Major West European)* 5.88% 4.52% 72.36% 83.46% 15.24% 5.33% 6.52%, 6.69%
Communist Of which: (J
U.S.S.R. 12.62% 11.38% 68.61% 67.98% 7.42% 8.85% 11.35% 11.79% :;;1:1 C/l
All Other 1.34% 3.97% 90.59% 83.94% .38% 6.96% 7.69% 5.13% I
w .p.
Total Communist 9.79% 9.47% 74.12% 72.11% 5.65% 8.36% 10.43% 10.07%
GRAND TOTAL 11.57% 11.27% 73.18% 75.12% 8.54% 6.84% 6. 71% 6. 77%
*(Major West European category includes France, United Kingdom, West Germany, Italy).
" • • ~

• ~ " ~
Table 1E
PERCENTAGE OF TOTAL AGREEMENTS VALUE BY SUPPLIER TO REGIONS, 1978-1985
East Asia/Pacific Near East/So. Asia Latin America Africa (Sub-Saharan) '78-81 '82-85 '78-81 '82-85 '78-81 '82-85 '78-81 '82-85
Non-Communist Of which:
u.s. 37.94% 38.21% 26.36% 26.03% 3.53% 17.56% 3.70% 5.71% France 3.25% 2.07% 13.39% 15.42% 15.02% 11.49% 10.61% 6.57% United Kingdom 4.16% 4.34% 6.58% 7.62% 2.56% 1.41% 7.35% 5.75% West Germany 4.09% 2.34% 3.29% .94% 25.77% 3.04% 1.81% 4.00% Italy 2.52% 1.09% 4.02% 3.29% 5.92% 3.20% 7.05% 7.94% All Other 15.50% 19.77% 7.42% 9.93% 21.75% 16.48% 9.76% 13.09%
Total non-Communist 67.47% 67.82% 61.08% 63.23% 74.56% 53.17% 40.28% 43.05%
(Major West European)* 14.03% 9.84% 27.29% 27.27% 49.28% 19.13% 26.82% 24.26%
Communist ('")
Of which: :;.;:1 C/)
u.s.s.R. 31.41% 28.69% 27.00% 25.70% 25.02% 36.75% 48.69% 49.45% I w
All Other 1.12% 3.49% 11.92% 11.06% .43% 10.08% 11.03% 7.50% V1
Total Communist 32.53% 32.18% 38.92% 36.77% 25.44% 46.83% 59.72% 56.95%
GRAND TOTAL 100.00% 100.00% 100.00% 100.00% 100.00% 100.00% 100.00% 100.00%
*(Major West European category includes France, United Kingdom, West Germany, Italy).

Non-communist Of which:
United States France United Kingdom West Germany Italy All Other
Total non-Communist
Communist Of which:
U.S.S.R. All Other
Total Communist
GRAND TOTAL
**Dollar inflation index (1985=100)----------
Table 2
ARMS DELIVERIES TO THE THIRD WORLD, BY SUPPLIER* (In millions of current u.s. dollars)
1978
6,480 1,790 1,140
665 760
1,255
12,090
7,220 1,230
8,450
20,540
.6278
1979
5,885 1,430
920 755 650
1,700
11,340
11 ,445 1,070
12,515
23,855
.682
1980
5,445 2,690 1,695
980 650
1,700
13,160
10,350 1,405
11,7 55
24,915
• 7611
1981
5,912 4,050 2,455 1,155 1,055 3,030
17,657
10,100 2,660
12,760
30,417
.8452
1982
8,000 3,425 1,520
470 1,055 4,230
18,700
11,060 4,110
15,170
33,870
.9056
1983
9,508 4,125 1,270 1,120
870 2,640
19,533
9,400 3,640
13,040
32,573
.9387
**Based on Department of Defense Price Deflator.
1984
5,558 3,540 1,165 2,390 1,030 4,555
18,238
9,310 5,125
14,435
32,673
.9656
1985
5,823 3,270
410 395 565
1,450
11,913
7,200 2,410
9,610
21,523
1
*Third World category excludes Europe, NATO nations, Warsaw Pact nations, Japan, Australia and New Zealand. All data are for the calendar year given. All prices given include the values of weapons, spare parts, construction, all associated services, military assistance and training programs. Statistics for foreign countries are based upon estimated selling prices. U.S. commercial sales delivery values are excluded, as are MASF (Military Assistance Service Funded) related grant transfers to South Korea and Thailand.
Source: U.S. Government
• • " ~
C"'l :>:! U)
I w (j\

" ~ 11 "
Table 2A
ARMS DELIVERIES TO THE THIRD WORLD, BY SUPPLIER (In millions of constant 1985 U.S. dollars)
1978 1979 1980 1981 1982 1983 1984 1985
Non-communist Of which:
United States 10,322 8,629 7,154 6,995 8,834 10,129 5,756 5,823 France 2,851 2,097 3,534 4, 792 3,782 4,394 3,666 3,270 United Kingdom 1,816 1,349 2,227 2,905 1,678 1,353 1,207 410 West Germany 1,059 1,107 1,288 1,367 519 1,193 2,475 395 Italy 1,211 953 854 1,248 1,165 927 1 ,067 565 All Other 1,999 2,493 2,234 3,585 4,671 2,812 4,717 1,450
Total non-Communist 19,258 16,628 17,291 20,891 20,649 20,809 18,888 11 '913 CJ ~ Cfl
Communist I
VJ
Of which: ""-J
U.S.S.R. 11,500 16,782 13,599 11 '950 12,213 10,014 9,642 7,200 All Other 1,959 1,569 1,846 3,147 4,538 3,878 5,308 2,410
Total Communist 13,460 18,350 15,445 15,097 16,751 13,892 14,949 9,610
GRAND TOTAL 32,717 34,978 32,736 35,988 37,401 34,700 33,837 21,523

Table 2B
ARMS DELIVERIES TO THE THIRD WORLD, BY SUPPLIER, 1978-1985 (expressed as a percent of Grand Total, by year)
1978 1979 1980 1981 1982 1983 1984 1985
Non-communist Of which:
United States 31.55% 24.67% 21.85% 19.44% 23.62% 29.19% 17.01% 27.05% -.
France 8.71% 5.99% 10.80% 13.31% 10.11% 12.66% 10.83% 15.19% United Kingdom 5.55% 3.86% 6.80% 8.07% 4.49% 3.90% 3.57% 1.90% West Germany 3.24% 3.16% 3.93% 3.80% 1.39% 3.44% 7.31% 1.84% Italy 3.70% 2. 72% 2.61% 3.47% 3.11% 2.67% 3.15% 2.63% All Other 6.11% 7.13% 6.82% 9.96% 12.49% 8.10% 13.94% 6.74%
Total non-Communist 58.86% 47.54% 52.82% 58.05% 55.21% 59.97% 55.82% 55.35%
(Major West European)* 21.20% 15.74% 24.14% 28.65% 19.10% 22.67% 24.87% 21.56% ("')
:::0 til I
w 00
Communist Of which:
U.S.S.R. 35.15% 47.98% 41.54% 33.21% 32.65% 28.86% 28.49% 33.45% All Other 5.99% 4.49% 5.64% 8.75% 12.13% 11.17% 15.69% 11.20%
Total Communist 41.14% 52.46% 47.18% 41.95% 44.79% 40.03% 44.18% 44.65%
GRAND TOTAL 100.00% 100.00% 100.00% 100.00% 100.00% 100.00% 100.00% 100.00%
*(Major West European category includes France, United Kingdom, West Germany, Italy).
:t • "

., Q f •
Table 2C
REGIONAL ARMS DELIVERIES, BY SUPPLIER, 1978-1985 (in millions of current U.S. dollars)
East Asia/Pacific Near East/So. Asia Latin America Africa (Sub-Saharan) '78-81 '82-85 '78-81 '82-85 '78-81 '82-85 '78-81 '82-85
Non-Communist Of which:
u.s. 3,569 3,610 19,620 23,630 274 1,212 258 437 France 360 250 7,165 12,635 1,595 695 835 800 United Kingdom 720 320 4,590 3,440 690 135 420 540 West Germany 265 400 2,285 1,585 340 2,305 700 155 Italy 135 410 1,780 1,960 685 690 525 460 All Other 1,875 1,490 3,260 9,085 1,670 1,585 910 745
Total non-Communist 6,924 6,480 38,700 52,335 5,254 6,622 3,648 3,137
(Major West European)* 1,480 1,380 15,820 19,620 3,310 3,825 2,480 1,955 n ~ C/)
I
Communist w ~
Of which: u.s.s.R. 4,760 4,100 27,315 24,300 2,615 3,265 4,430 5,295 All Other 240 475 5,245 13,140 25 920 845 755
Total Communist 5,000 4,575 32,560 37,440 2,640 4,185 5,275 6,050
GRAND TOTAL 11,924 11,055 71,260 89,775 7,894 10,807 8,9Z3 9,187
*(Major West European category includes France, United Kingdom, West Germany, Italy).

Table 2D
PERCENTAGE OF SUPPLIER DELIVERIES VALUE BY REGION, 1978-1985
East Asia/Pacific Near East/So. Asia Latin America Africa (Sub-Saharan) '78-81 '82-85 '78-81 '82-85 '78-81 '82-85 '78-81 '82-85
Non-Communist Of which:
u.s. 15.05% 12.50% 82.71% 81.80% 1.16% 4.20% 1.09% 1.51% France 3.62% 1.74% 71.97% 87.87% 16.02% 4.83% 8.39% 5.56% United Kingdom 11.21% 7.22% 71.50% 77.56% 10.75% 3.04% 6.54% 12.18% West Germany 7.38% 9.00% 63.65% 35.66% 9.47% 51.86% 19.50% 3.49% Italy 4.32% 11.65% 56.96% 55.68% 21.92% 19.60% 16.80% 13.07% All Other 24.30% 11.55% 42.26% 70.40% 21.65% 12.28% 11 .• 80% 5. 77%
Total non-Communist 12.70% 9.45% 70.98% 76.32% 9.64% 9.66% 6.69% 4.57%
(Major West European)* 6.41% 5.15% 68.51% 73.26% 14.34% 14.28% 10.74% 7.30% (J :;d Cf.l I
+"-0
Communist Of which:
U.S.S.R. 12.17% 11.09% 69.82% 65.75% 6.68% 8.83% 11.32% 14.33% All Other 3.78% 3.11% 82.53% 85.94% .39% 6.02% 13.30% 4.94%
Total Communist 11.00% 8.76% 71.60% 71.66% 5.81% 8.01% 11.60% 11.58%
GRAND TOTAL 11.92% 9.15% 71.26% 74.30% 7.89% 8.94% 8.92% 7.60%
*(Major West European category includes France, United Kingdom, West Germany, Italy).
. ~ ~ ~

., ' ~ "
Table 2E
PERCENTAGE OF TOTAL DELIVERIES VALUE BY SUPPLIER TO REGIONS, 1978-1985
East Asia/Pacific Near East/So. Asia Latin America Africa (Sub-Saharan) "'78-81 "'82-85 "'78-81 "'82-85 "'78-81 "'82-85 "'78-81 "'82-85
Non-Communist Of which:
u.s. 29.93% 32.65% 27.53% 26.32% 3.47% 11.21% 2.89% I. ~£. 1¥ '+•IUh
France 3.02% 2.26% 10.05% 14.07% 20.21% 6.43% 9.36% 8. 71% United Kingdom 6.04% 2.89% 6.44% 3.83% 8.74% 1.25% 4. 71% 5.88% West Germany 2.22% 3.62% 3.21% 1. 77% 4.31% 21.33% 7.84% 1.69% Italy 1.13% 3. 71% 2.50% 2.18% 8.68% 6.38% 5.88% 5.01% All Other 15.72% 13.48% 4.57% 10.12% 21.16% 14.67% 10.20% 8.11%
Total non-Communist 58.07% 58.62% 54.31% 58.30% 66.56% 61.28% 40.88% 34.15%
(Major West European)* 12.41% 12.48% 22.20% 21.85% 41.93% 35.39% 27.79% 21.28% ('}
1:0 C/.l
Communist I .!:'
Of which: ,_.
u.s.s.R. 39.92% 37.09% 38.33% 27.07% 33.13% 30.21% 49.65% 57.64% All Other 2.01% 4.30% 7.36% 14.64% .32% 8.51% 9.47% 8.22%
Total Communist 41.93% 41.38% 45.69% 41.70% 33.44% 38.72% 59.12% 65.85%
GRAND TOTAL 100.00% 100.00% 100.00% 100.00% 100.00% 100.00% 100.00% 100.00%
*(Major West European category includes France, United Kingdom, West Germany, Italy).
CRS-42
Table 3
NUMBERS OF WEAPONS DELIVERED BY MAJOR SUPPLIERS TO THE THIRD WORLD 1/
2/ Major Western European includes France, United Kingdom, West Germany, and italy totals as an aggregate figure.
Source: U.S. Government
CRS-43
Table 4
NUMBERS OF WEAPONS DELIVERED BY MAJOR SUPPLIERS TO EAST ASIA & THE PACIFIC 1/
Weapons Category United States U.S.S.R Major Western European 2/
1978-1981 Tanks and Sel £-Propelled Guns----- 449 575 55 Artillery------------------------- 801 450 115 APCs and Armored Cars------------- 1,398 265 290 Major Surface Combatants---------- 4 6 0 Minor Surface Combatants---------- 19 44 19 Submarines------------------------ 0 0 3 Supersonic Combat Aircraft-------- 136 240 0 Subsonic Combat Aircraft---------- 53 55 10 Other Aircraft-------------------- 64 70 30 Helicopters----------------------- 141 80 30 Guided Missile Boats-------------- 0 8 3 Surface-To-Air Missiles (SAMs)---- 802 1, 740 100
1982-1985 Tanks and Self-Propelled Guns----- 378 140 0 Artillery------------------------- 472 300 260 APCs and Armored Cars------------- 717 135 65 Major Surface Combatants---------- 11 4 5 Minor Sur face Combatants---------- 12 28 10 Submarines------------------------ 0 0 0 Supersonic Combat Aircraft-------- 111 185 0 Subsonic Combat Aircraft---------- 191 0 10 Other Aircraft-------------------- 48 35 45 Helicopters----------------------- 30 35 45 Guided Missile Boats-------------- 0 0 0 Surface-To-Air Missiles (SAMs)---- 1,335 320 340
1978-1985 Tanks and Sel £-Propelled Guns----- 827 715 55 Artillery------------------------- 1,273 750 375 APCs and Armored Cars------------- 2,115 400 355 Major Surface Combatants---------- 15 10 5 Minor Surface Combatants---------- 31 72 29 Submarines------------------------ 0 0 3 Supersonic Combat Aircraft-------- 247 425 0 Subsonic Combat Aircraft---------- 244 55 20 Other Aircraft-------------------- 112 105 75 Helicopters----------------------- 171 115 75 Guided Missile Boats-------------- 0 8 3 Surf ac e-To-Ai r Missiles (SAMs)---- 2,137 2,060 440
1/ Excludes Japan, Australia and New Zealand. All data are for calendar years given.
2/ Major Western European includes France, United Kingdom, West Germany, and Italy totals as an aggregate figure.
Source: U.S. Government
CRS-44
Table 5
NUMBERS OF WEAPONS DELIVERED BY MAJOR SUPPLIERS TO NEAR EAST & SOUTH ASIA 1/
Weapons Category United States U.S.S.R Major Western European 3_/
1978-1981 Tanks and Self-Pro pe 11 ed Guns----- 1,402 4,210 405 Artillery------------------------- 493 4,090 675 APCs and Armored Cars------------- 4,495 5' 150 1,970 Major Surface Combatants---------- 3 16 7 Minor Surface Combatants---------- 5 10 55 Submarines------------------------ 1 3 2 Supersonic Combat Aircraft-------- 182 1,180 195 Subsonic Combat Aircraft---------- 18 85 30 Other Aircraft-------------------- 111 95 170 Helicopters----------------------- 7 630 235 Guided Missile Boats-------------- 0 23 19 Surface-To-Air Missiles (SAMs)---- 2,634 11,475 1,095
1982-1985 Tanks and Se 1 f-Prope lled Guns----- 1, 820 1,835 420 Artillery------------------------- 684 2,295 365 APCs and Armored Cars------------- 3,397 4,320 1,010 Major Surface Combatants---------- 4 17 17 Minor Surface Combatants---------- 12 19 25 Submarines------------------------ 0 6 0 Supersonic Combat Aircraft-------- 209 710 205 Subsonic Combat Aircraft---------- 6 85 40 Other Aircraft-------------------- 18 175 55 Helicopters----------------------- 4 405 115 Guided Missile Boats-------------- 0 9 18 Surface-To-Air Missiles (SAMs)---- 1,768 7,630 460
1977-1984 Tanks and Self-Propelled Guns----- 3,222 6,045 825 Artillery------------------------- 1,177 6,385 1,040 APCs and Armored Cars------------- 7,862 9,470 2,980 Major Surface Combatants---------- 7 33 24 Minor Surface Combatants---------- 17 29 80 Submarines------------------------ 1 9 2 Supersonic Combat Aircraft-------- 391 1,890 400 Subsonic Combat Aircraft---------- 24 170 70 Other Aircraft-------------------- 129 270 225 Helicopters----------------------- 11 1,035 350 Guided Missile Boats-------------- 0 32 37 Surface-To-Air Missiles (SAMs)---- 4,402 19,105 1,555
1/ All data are for calendar years given.
2/ Major Western European includes France, United Kingdom, West Germany, and italy totals as an aggregate figure.
Source: U.S. Government
..

•·
,,
CRS-45
Table 6
NUMBERS OF \ITEAPONS DELIVERED BY MAJOR SUPPLIERS TO LATIN AMERICA 1/
Weapons Category United States U.S.S.R Major Western European 2/
1978-1981 Tanks and Self-Propelled Guns----- 5 165 40 Artillery------------------------- 595 460 130 APCs and Armored Cars------------- 0 190 210 Major Surface Combatants---------- 5 1 19 Minor Sur face Combatants---------- 2 27 29 Submarines---------·--------------- 0 3 3 Supersonic Combat Aircraft-------- 0 85 30 Subsonic Combat Aircraft---------- 6 5 5 Other Aircraft-------------------- 62 65. 80 He 1 icopter s--------·--------------- 4 30 195 Guided Missile Boats-------------- 0 7 0 Surface-To-Air Missiles (SAMs)---- 0 390 135
1982-1985 Tanks and Sel £-Propelled Guns----- 23 360 0 Artillery------------------------- 348 500 0 APCs and Armored Cars------------- 0 125 205 Major Surface Combatants---------- 2 3 22 Minor Surface Combatants---------- 4 31 8 Submarines------------------------ 0 1 6 Supersonic Combat Aircraft-------- 36 80 0 Subsonic Combat Aircraft---------- 39 0 20 Other Aircraft-------------------- 68 20 90 Helicopters----------------------- 104 85 lOS Guided Missile Boats-------------- 0 4 0 Surface-To-Air Missiles (SAMs)---- 0 1,105 465
1978-1985 Tanks and Self-Propelled Guns----- 28 525 40 Artillery----------·--------------- 943 960 130 APCs and Armored Cars------------- 0 315 415 Major Surface Combatants---------- 7 4 41 Minor Surface Combatants---------- 6 58 37 Submarines------------------------ 0 4 9 Supersonic Combat Aircraft-------- 36 165 30 Subsonic Combat Aircraft---------- 45 5 25 Other Aircraft-------------------- 130 85 170 Helicopters----------------------- 108 115 300 Guided Missile Boats-------------- 0 11 2 Surface-To-Air Missiles (SAMs)---- 0 1,495 600
1/ All data are for calendar years given.
2/ Major Western European includes France, United Kingdom, West Germany, and italy totals as an aggregate figure.
Source: U.S. Government
CRS-46
Table 7
NUMBERS OF WEAPONS DELIVERED BY MAJOR SUPPLIERS TO AFRICA (SUB-SAHARAN) 1/
Weapons Category United States U.S.S.R Major Western European 2/
1978-1981 Tanks and Self-Propelled Guns----- 0 830 50 Artillery------------------------- 47 1,750 190 APCs and Armored Cars------------- 7 1,285 955 Major Surface Combatants---------- 0 4 12 Minor Sur face Combatants---------- 0 35 22 Submarines------------------------ 0 0 0 Supersonic Combat Aircraft-------- 12 150 5 Subsonic Combat Aircraft---------- 0 60 35 Other Aircraft-------------------- 20 65 110 Helicopters----------------------- 0 100 110 Guided Missile Boats-------------- 0 4 1 Sur face-To-Air Missiles (SAMs)---- 0 1,450 5
1982-1985 Tanks and Self-Propelled Guns----- 20 S30 180 Artillery------------------------- 127 1,400 160 APCs and Armored Cars------------- 114 790 47S Major Surface Combatants---------- 0 3 7 Minor Surface Combatants---------- 1 1S 43 Submarines------------------------ 0 0 0 Supersonic Combat Aircraft-------- 6 270 20 Subsonic Combat Aircraft---------- 0 s 30 Other Aircraft-------------------- 4 50 85 Helicopters----------------------- 0 140 so Guided Missile Boats-------------- 0 6 0 Surface-To-Air Missiles (SAMs)---- 30 1,49S 240
1978-198S Tanks and Self-Propelled Guns----- 20 1,360 230 Artillery------------------------- 174 3,150 3SO APCs and Armored Cars------------- 121 2,07S 1,430 Major Surface Combatants---------- 0 7 19 Minor Surface Combatants---------- 1 so 6S Submarines------------------------ 0 0 0 Supersonic Combat Aircraft-------- 18 420 25 Subsonic Combat Aircraft---------- 0 6S 6S Other Aircraft-------------------- 24 llS 195 Helicopters----------------------- 0 240 160 Guided Missile Boats-------------- 0 10 1 Surface-To-Air Missiles (SAMs)---- 30 2,945 24S
1/ All data are for calendar years given.
2/ Major Western European includes France, United Kingdom, West Germany, and italy totals as an aggregate figure.
Source: U.S. Goverrnnent
"

..
CRS-4 7
DESCRIPTION OF ITEMS COUNTED IN WEAPONS CATEGORIES, 1978-1985
Tanks and Self-propelled Guns Light, medium and heavy tanks Self-propelled artillery Sel £-propelled assault guns
Artillery Field and air defense artillery, mortars, rocket launchers, and recoilless
rifles -- 100 mm. and over FROG launchers -- 100 mm. and over
Armored Personnel Carrier (APCs) and Armored Cars Personnel carriers, armored and amphibious Armored infantry fighting vehicles Armored reconnaissance and command vehicles
Major Surface Combatants Aircraft carriers, cruisers, destroyers, frigates
Minor Surface Combatants Minesweepers, subchasers, motor torpedo boats Patrol craft, motor gunboats
Submarines All submarines, including midget submarines
Guided Missile Patrol Boats All boats in this class
Supersonic Combat Aircraft All fighters and bombers designed to function operationally at speeds
above Mach 1.
Subsonic Combat Aircraft All fighters and bombers, including propeller driven, designed to function
operationally at speeds below Mach 1.
Other Aircraft All other fixed-wing aircraft, including trainers, transports, reconnaLs
sance aircraft, and communications/utility aircraft
Helicopters All helicopters, including combat and transport.
Surface-to-air Missiles (SAMs) All air defense missiles .
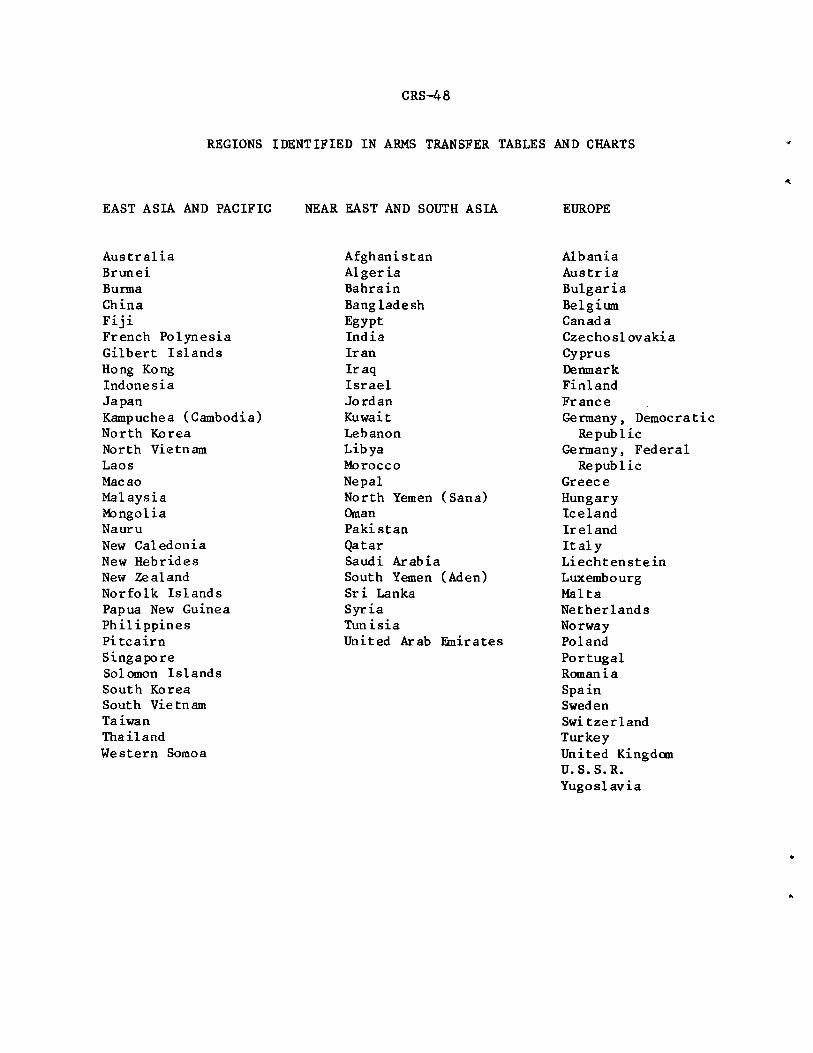
CRS-48
REGIONS IDENTIFIED IN ARMS TRANSFER TABLES AND CHARTS
EAST ASIA AND PACIFIC
Australia Brunei Burma China Fiji French Polynesia Gilbert Islands Hong Kong Indonesia Japan Kampuchea (Cambodia) North Korea North Vietnam Laos Macao Malaysia Mongolia Nauru New Caledonia New Hebrides New Zealand Norfolk Islands Papua New Guinea Philippines Pitcairn Singapore Solomon Islands South Korea South Vietnam Taiwan Thailand Western Somoa
NEAR EAST AND SOUTH ASIA
Afghanistan Algeria Bahrain Bangladesh Egypt India Iran Iraq Israel Jordan Kuwait Lebanon Libya Morocco Nepal North Yemen (Sana) Oman Pakistan Qatar Saudi Arabia South Yemen (Aden) Sri Lanka Syria Tunisia United Arab Emirates
EUROPE
Albania Austria Bulgaria Belgium Canada Czechoslovakia Cyprus Denmark Finland France Germany, Democratic
Republic Germany, Federal
Republic Greece Hungary Iceland Ireland Italy Liechtenstein Luxembourg Malta Netherlands Norway Poland Portugal Romania Spain Sweden Switzerland Turkey United Kingdan U.S.S.R. Yugoslavia
..
CRS-49
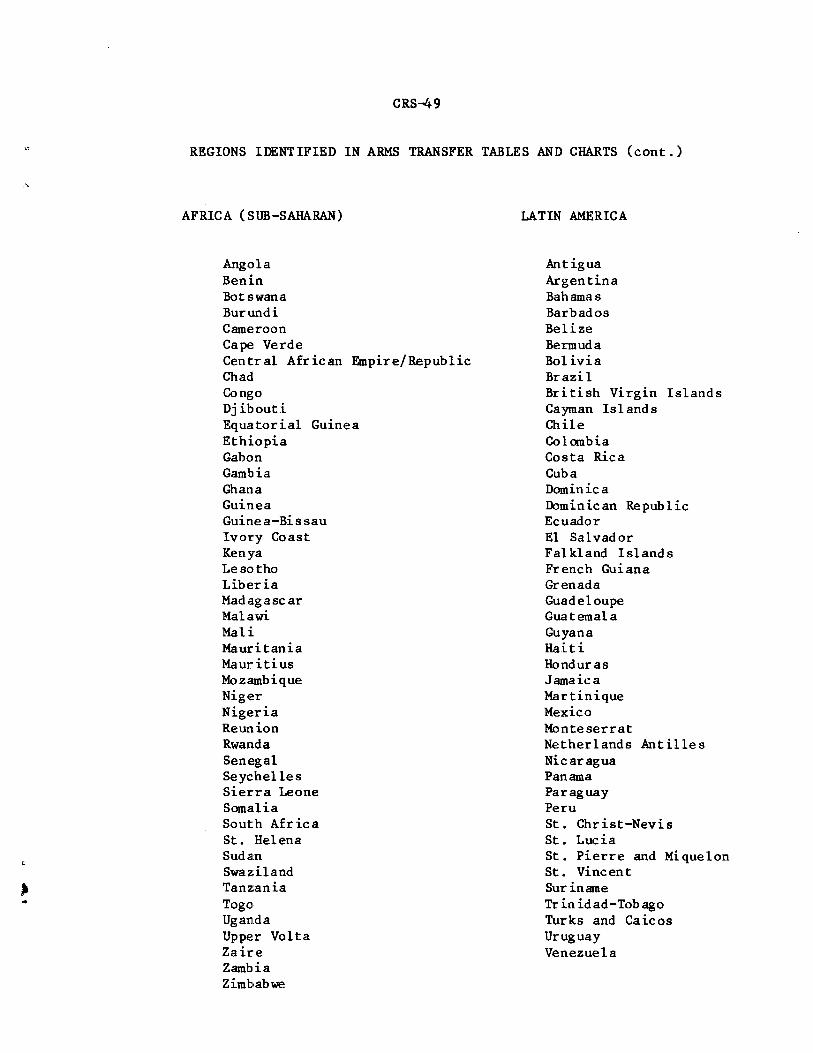
REGIONS IDENTIFIED IN ARMS TRANSFER TABLES AND CHARTS (cont.)
AFRICA (SUB-SAHARAN)
Angola Benin Botswana Burundi Cameroon Cape Verde Central African Empire/Republic Chad Congo Djibouti Equatorial Guinea Ethiopia Gabon Gambia Ghana Guinea Guinea-Bissau Ivory Coast Kenya Lesotho Liberia Madagascar Malawi Mali Mauritania Mauritius Mozambique Niger Nigeria Reunion Rwanda Senegal Seychelles Sierra Leone Somalia South Africa St. Helena Sudan Swaziland Tanzania Togo Uganda Upper Volta Zaire Zambia Zimbabwe
LATIN AMERICA
Antigua Argentina Bahamas Barbados Belize Bermuda Bolivia Brazil British Virgin Islands Cayman Is 1 and s Chile Colombia Costa Rica Cuba Dominica Dominican Republic Ecuador El Salvador Falkland Islands French Guiana Grenada Guadeloupe Guatemala Guyana Haiti Honduras Jamaica Martinique Mexico Monteserrat Netherlands Antilles Nicaragua Panama Paraguay Peru St. Christ-Nevis St. Lucia St. Pierre and Miquelon St. Vincent Suriname Trinidad-Tobago Turks and Caicos Uruguay Venezuela


