Trends in assaults after midnight - BOCSAR · 1 Issue paper no. 59 April 2011 NSW Bureau of Crime...
7
1 Issue paper no. 59 April 2011 Bureau Brief NSW Bureau of Crime Statistics and Research Trends in assaults after midnight Steve Moffatt and Don Weatherburn Aim: To determine whether there has been a decline in assaults after midnight following changes to liquor licensing policy after March 2008. Method: Time series analysis of reported assaults between January 2004 and December 2010. Results: The upward trend in assault between midnight and 5:00 a.m. in NSW between 2004 and 2008 reversed following changes to liquor licensing policy after March 2008 and the NSW Liquor Act in October 2008. Assaults on licensed premises have fallen by about one per cent a month since March 2008. The fall is not restricted to licensed premises but was found to affect all location categories other than non-licensed business/commercial premises. Conclusion: The imposition of new restrictions on licensed premises may have assisted in reducing the assault rate in NSW. Introduction On 11 March 2008, following a number of requests from the public and the media, the NSW Bureau of Crime Statistics and Research (BOCSAR) published a ranked list of the top 100 1 licensed premises for assaults occurring between January and September 2007. On 30 October 2008, new licence restrictions were imposed on the top 48 licensed premises on BOCSAR’s top 100 list 2 . The restrictions placed on the top 48 list came into force on 1 December 2008 and included: z Mandatory 2:00 a.m. lock outs z Cessation of alcohol service 30 minutes before closing time z Plastic or polycarbonate glasses for beer service after midnight z No ‘shots’ and drink purchase limits after midnight z Ten minute alcohol sale time outs every hour after midnight. In October 2009, Moffatt, Mason, Borzycki, and Weatherburn (2009) evaluated the effect of these initiatives and found a decline in the incidence of assault on the 48 licensed premises upon which restrictions were imposed. The decline, however, was not restricted to these premises. A general decline in the number of assaults on licensed premises occurred across the top 100 licensed premises listed on the BOCSAR website. The precise cause of the decline is unclear but likely influences include adverse publicity and increased enforcement activity by the NSW Police Force and the Office of Liquor, Gaming and Racing (OLGR). Though the restrictions only applied across a minority (48) of licensed premises, it would be fair to say that all licensees and the vast majority of patrons have become well aware of the increased level of supervision within the hotel and clubs sector since early 2008. Since much of the policy emphasis has been on alcohol related assault on the listed licensed premises after midnight (when most assaults occur), it is of interest to enquire into trends in assault on all licensed premises after midnight (when more than 40 per cent of assaults occur). It is also of interest to see whether the decline in assaults on licensed premises has been accompanied by decreases in assault in other premises types. This report examines these issues. Method The data used to carry out this study were drawn from COPS, the NSW Police Computerised and Operational Policing System. The data extracted from COPS consisted of all assaults recorded by the NSW Police Force as having occurred between midnight and 5:00 a.m. on any day between 1 January 2004 and 31 December 2010. Location information on each assault was
Transcript of Trends in assaults after midnight - BOCSAR · 1 Issue paper no. 59 April 2011 NSW Bureau of Crime...
1
Issue paper no. 59April 2011
Bureau BriefNSW Bureau of CrimeStatistics and Research
Trends in assaults after midnightSteve Moffatt and Don Weatherburn
Aim: To determine whether there has been a decline in assaults after midnight following changes to liquor licensing policy after March 2008.
Method: Time series analysis of reported assaults between January 2004 and December 2010.
Results: The upward trend in assault between midnight and 5:00 a.m. in NSW between 2004 and 2008 reversed following changes to liquor licensing policy after March 2008 and the NSW Liquor Act in October 2008. Assaults on licensed premises have fallen by about one per cent a month since March 2008. The fall is not restricted to licensed premises but was found to affect all location categories other than non-licensed business/commercial premises.
Conclusion: The imposition of new restrictions on licensed premises may have assisted in reducing the assault rate in NSW.
IntroductionOn 11 March 2008, following a number of requests from the public and the media, the NSW Bureau of Crime Statistics and Research (BOCSAR) published a ranked list of the top 1001 licensed premises for assaults occurring between January and September 2007. On 30 October 2008, new licence restrictions were imposed on the top 48 licensed premises on BOCSAR’s top 100 list2. The restrictions placed on the top 48 list came into force on 1 December 2008 and included:
z Mandatory 2:00 a.m. lock outs
z Cessation of alcohol service 30 minutes before closing time
z Plastic or polycarbonate glasses for beer service after midnight
z No ‘shots’ and drink purchase limits after midnight
z Ten minute alcohol sale time outs every hour after midnight.
In October 2009, Moffatt, Mason, Borzycki, and Weatherburn (2009) evaluated the effect of these initiatives and found a decline in the incidence of assault on the 48 licensed premises upon which restrictions were imposed. The decline, however, was not restricted to these premises. A general decline in the number of assaults on licensed premises occurred across the
top 100 licensed premises listed on the BOCSAR website. The precise cause of the decline is unclear but likely influences include adverse publicity and increased enforcement activity by the NSW Police Force and the Office of Liquor, Gaming and Racing (OLGR).
Though the restrictions only applied across a minority (48) of licensed premises, it would be fair to say that all licensees and the vast majority of patrons have become well aware of the increased level of supervision within the hotel and clubs sector since early 2008. Since much of the policy emphasis has been on alcohol related assault on the listed licensed premises after midnight (when most assaults occur), it is of interest to enquire into trends in assault on all licensed premises after midnight (when more than 40 per cent of assaults occur). It is also of interest to see whether the decline in assaults on licensed premises has been accompanied by decreases in assault in other premises types. This report examines these issues.
MethodThe data used to carry out this study were drawn from COPS, the NSW Police Computerised and Operational Policing System. The data extracted from COPS consisted of all assaults recorded by the NSW Police Force as having occurred between midnight and 5:00 a.m. on any day between 1 January 2004 and 31 December 2010. Location information on each assault was

2
also extracted, thereby permitting the creation of five separate time series:
1. Assaults on licensed premises2. Assaults in outdoor/public places3. Assaults on business/commercial premises4. Assaults on residential premises5. Assaults on public transport
In addition to these five series two aggregate series are also included. The sixth, ‘total’ comprises the total monthly number of assaults in NSW after midnight (i.e. all premises types) and the seventh, ‘total non-licensed’ is made up from total assaults excluding those occurring on licensed premises. Descriptive statistics for each of these series are presented in Table 1.
Time series analysis was used to investigate the trends in the number of assaults for the premises types listed in Table 1 before and after March 2008. After testing for stationarity (and finding that no stochastic trends were present in the seven times series over the period January 2004 to December 2010), a statistical model was constructed that expressed the monthly number of assaults as a function of a set of variables to control for the following factors;
i. Any general trend;
ii. Any change in trend around March 2008 (the policy effect); and
iii. Seasonal factors using controls for weekend time3 and month of year.
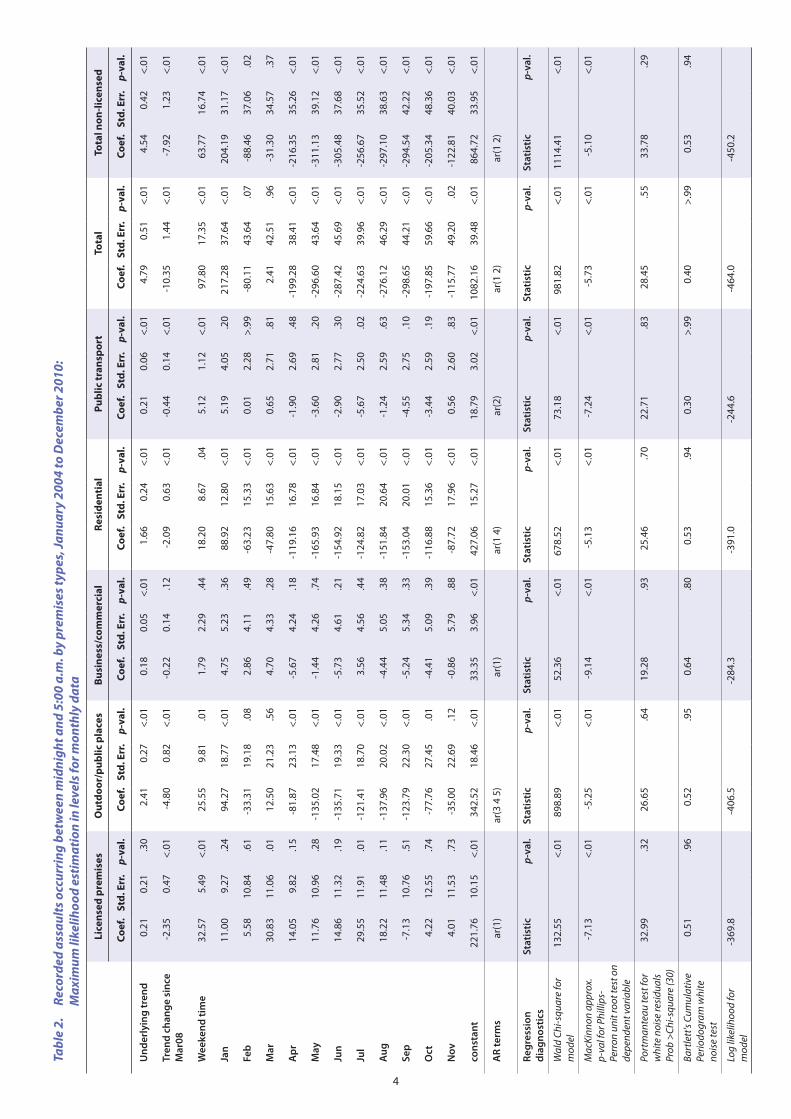
ResultsTable 1 shows that the vast majority of reported assaults occurring between midnight and 5:00 a.m. take place at residential, outdoor/public places or licensed premises. The monthly NSW counts for these three series are plotted below in Figures 1 and 2. Monthly counts for public transport, business/commercial premises, all non-licensed premises and all premises types are plotted in Figures A1 to A4 in the Appendix. The monthly series of assaults on licensed premises is included in all figures since it is the focal issue of the report. Note, too, that counts of assaults on licensed premises peak early in 2008, followed by a downtrend which seems to have flattened out over the last six months of 2010. Seasonality is
Table 1. Descriptive statistics for assaults recorded as occurring between midnight and 5:00 a.m., January 2004 to December 2010
Type of premises No. months
Monthly recorded assaults for NSW
Mean Std. Dev. Min Max
Licensed premises 84 237.7 34.8 167 308
Outdoor/public places 84 357.2 86.2 175 597
Business/commercial 84 39.1 8.8 18 58
Residential 84 398.5 82.2 275 680
Public transport 84 25.2 6.6 8 45
Total 84 1,104.10 186.3 774 1,667
Total non-licensed 84 866.3 176.8 545 1,424
more pronounced for the assaults occurring in outdoor/public places and residential premises (see strong January peaks in Figures 1 and 2). However these strong seasonal components make it difficult to see trends and turning points in the two series. The inclusion of a 12-month moving average trend line sheds some light on rising, stationary and falling levels for the series over the period of interest.
Figure 1 shows a fall in the reported assaults for NSW on licensed premises after midnight and a fall in assaults recorded in outdoor/public places after midnight. Note that for Figure 1 (assaults on licensed premises and outdoor/public places), the two moving average lines seem to follow similar paths since about 2006, whereas for Figure 2 (assaults on licensed premises and residential premises) the moving averages seem to be more divergent since March 2008. Whilst the series for assaults in residential premises does not show a clear turning point, the principal question of interest here is whether there is evidence of a slope change around the March 2008 policy changes. The models used to deseasonalise and test for underlying trend and any trend change since March 2008 are given in Table 2, along with the estimated results.
Phillips-Perron unit root tests suggest that all the series used in these analyses are stationary4 for the periods analysed. Autocorrelation5 is present but can be successfully controlled by the inclusion of the months and an autoregressive process in the models.
Results6 for all series are given in Table 2. Residuals for all models were free of autocorrelation and passed normality tests, that is, they were independent and identically distributed with zero mean and constant variance.
The first column shows the variables included in the model. The first term measures any underlying trend, the second term measures the change in the assault trend after March 2008, the third term measures the ‘weekend’ effect and the remaining terms control for seasonal fluctuations in the incidence of assault. Separate models are constructed for assaults on each premises type. The three columns labelled ‘Coef’, ‘Std. err.’ and ‘p-val’ show, respectively, the sign and magnitude of any change, the standard error of the estimate of change and whether or not the change is statistically significant.

3
0
100
200
300
400
500
600
700
Recorded assaults
Figure 2. Recorded assaults occurring at residential premises and licensed premises between midnight and 5:00 a.m., NSW, January 2004 to December 2010
Assault licensed premises Assault residential
Inspection of the first row in the table indicates a significant underlying upward trend for all assault series except those occurring on licensed premises, where the upward trend is non-significant (p = .30). Inspection of the second row shows a significant change in trend after March 2008 in all premises types except business/commercial (which did nevertheless get a sign change from the significantly positive underlying trend of 0.18 extra assaults per month to a non-significant negative coefficient). The size of the marginal effect for outdoor/public places is roughly double that for licensed premises (a drop of 4.80 assaults per month compared with a drop of 2.35 assaults per month respectively). The marginal effect for assaults on residential premises is slightly less than that of licensed premises (a drop of 2.09 assaults per month).
The output in Table 2 shows the strong seasonal effects for assaults in residential and outdoor/public places which is also evident as a flow-on to the output for the two aggregate series ‘all premises types’ and ‘non-licensed premises’. In fact almost every month can be distinguished by the models for these series. Licensed premises, business/commercial and public transport show the least amount of seasonality. The weekend time variable is significant in all series except for business/commercial premises, and has a larger marginal effect for licensed premises than for outdoor/public places or residential premises, even though these two series are higher in monthly counts. Note also that the model for residential assaults was able to detect a change in slope after March 2008, even though the series in Figure 2 does not appear to have a turning point.
The magnitude of the change in trend since the liquor licensing policy changes is indicated by the second row term in the Table 2 column labelled ‘Coef ’. We can gauge the relative size of the change in trend for different premises types by dividing the second row ‘Coef’ entries by the mean of the series in Table 1. The relative effect size of this change in trend is estimated at around 1 per cent per month for licensed premises and greater than 1 per cent per month for outdoor/public places and public transport since March 2008.
0
100
200
300
400
500
600
700
Recorded assaults
Figure 1. Recorded assaults occurring at outdoor/public places and licensed premises between midnight and 5:00 a.m., NSW, January 2004 to December 2010
Assault outdoor/public places
Assault licensed premises
The results given in Table 2 show strong evidence of trend change in recorded assaults over the period following the policy changes. This may be because some external factor was exerting similar influence over all the premises types after midnight or because the policy initiatives implemented on licensed premises had some spill-over effect outside licensed premises. To take this analysis further, a test of the direction of influence between assault levels at licensed premises and at other premises types has been reported in Appendix Table A1. The mutual relationship between assaults on licensed premises and on other premises types were examined using vector autoregression models. Exogenous variables used in the Table 2 models were included as controls. The results are briefly summarised in the p-values obtained from Granger tests
4
Tabl
e 2.
R
ecor
ded
assa
ults
occ
urri
ng b
etw
een
mid
nigh
t and
5:0
0 a.
m. b
y pr
emis
es ty
pes,
Janu
ary
2004
to D
ecem
ber 2
010:
M
axim
um li
kelih
ood
estim
atio
n in
leve
ls fo
r mon
thly
dat
a
Lice
nsed
pre
mis
esO
utdo
or/p
ublic
pla
ces
Busi
ness
/com
mer
cial
Resi
dent
ial
Publ
ic tr
ansp
ort
Tota
lTo
tal n
on-li
cens
ed
Coef
.St
d. E
rr.
p-va
l.Co
ef.
Std.
Err
.p-
val.
Coef
.St
d. E
rr.
p-va
l.Co
ef.
Std.
Err
.p-
val.
Coef
.St
d. E
rr.
p-va
l.Co
ef.
Std.
Err
.p-
val.
Coef
.St
d. E
rr.
p-va
l.
Und
erly
ing
tren
d 0.
210.
21.3
02.
410.
27<.
010.
180.
05<.
011.
660.
24<.
010.
210.
06<.
014.
790.
51<.
014.
540.
42<.
01
Tren
d ch
ange
sin
ce
Mar
08-2
.35
0.47
<.01
-4.8
00.
82<.
01-0
.22
0.14
.12
-2.0
90.
63<.
01-0
.44
0.14
<.01
-10.
351.
44<.
01-7
.92
1.23
<.01
Wee
kend
tim
e32
.57
5.49
<.01
25.5
59.
81.0
11.
792.
29.4
418
.20
8.67
.04
5.12
1.12
<.01
97.8
017
.35
<.01
63.7
716
.74
<.01
Jan
11.0
09.
27.2
494
.27
18.7
7<.
014.
755.
23.3
688
.92
12.8
0<.
015.
194.
05.2
021
7.28
37.6
4<.
0120
4.19
31.1
7<.
01
Feb
5.58
10.8
4.6
1-3
3.31
19.1
8.0
82.
864.
11.4
9-6
3.23
15.3
3<.
010.
012.
28>.
99-8
0.11
43.6
4.0
7-8
8.46
37.0
6.0
2
Mar
30.8
311
.06
.01
12.5
021
.23
.56
4.70
4.33
.28
-47.
8015
.63
<.01
0.65
2.71
.81
2.41
42.5
1.9
6-3
1.30
34.5
7.3
7
Apr
14.0
59.
82.1
5-8
1.87
23.1
3<.
01-5
.67
4.24
.18
-119
.16
16.7
8<.
01-1
.90
2.69
.48
-199
.28
38.4
1<.
01-2
16.3
535
.26
<.01
May
11.7
610
.96
.28
-135
.02
17.4
8<.
01-1
.44
4.26
.74
-165
.93
16.8
4<.
01-3
.60
2.81
.20
-296
.60
43.6
4<.
01-3
11.1
339
.12
<.01
Jun
14.8
611
.32
.19
-135
.71
19.3
3<.
01-5
.73
4.61
.21
-154
.92
18.1
5<.
01-2
.90
2.77
.30
-287
.42
45.6
9<.
01-3
05.4
837
.68
<.01
Jul
29.5
511
.91
.01
-121
.41
18.7
0<.
013.
564.
56.4
4-1
24.8
217
.03
<.01
-5.6
72.
50.0
2-2
24.6
339
.96
<.01
-256
.67
35.5
2<.
01
Aug
18.2
211
.48
.11
-137
.96
20.0
2<.
01-4
.44
5.05
.38
-151
.84
20.6
4<.
01-1
.24
2.59
.63
-276
.12
46.2
9<.
01-2
97.1
038
.63
<.01
Sep
-7.1
310
.76
.51
-123
.79
22.3
0<.
01-5
.24
5.34
.33
-153
.04
20.0
1<.
01-4
.55
2.75
.10
-298
.65
44.2
1<.
01-2
94.5
442
.22
<.01
Oct
4.22
12.5
5.7
4-7
7.76
27.4
5.0
1-4
.41
5.09
.39
-116
.88
15.3
6<.
01-3
.44
2.59
.19
-197
.85
59.6
6<.
01-2
05.3
448
.36
<.01
Nov
4.01
11.5
3.7
3-3
5.00
22.6
9.1
2-0
.86
5.79
.88
-87.
7217
.96
<.01
0.56
2.60
.83
-115
.77
49.2
0.0
2-1
22.8
140
.03
<.01
cons
tant
221.
7610
.15
<.01
342.
5218
.46
<.01
33.3
53.
96<.
0142
7.06
15.2
7<.
0118
.79
3.02
<.01
1082
.16
39.4
8<.
0186
4.72
33.9
5<.
01
AR
term
sar
(1)
ar(3
4 5
)ar
(1)
ar
(1 4
)ar
(2)
ar(1
2)
ar(1
2)
Re
gres
sion
di
agno
stic
sSt
atis
tic
p-va
l.St
atis
ticp-
val.
Stat
istic
p-va
l.St
atis
ticp-
val.
Stat
istic
p-va
l.St
atis
ticp-
val.
Stat
istic
p-va
l.
Wal
d Ch
i-squ
are
for
mod
el13
2.55
<.
0189
8.89
<.
0152
.36
<.
0167
8.52
<.
0173
.18
<.
0198
1.82
<.
0111
14.4
1
<.01
Mac
Kinn
on a
ppro
x.
p-va
l for
Phi
llips
-Pe
rron
uni
t roo
t tes
t on
depe
nden
t var
iabl
e
-7.1
3
<.01
-5.2
5
<.01
-9.1
4
<.01
-5.1
3
<.01
-7.2
4
<.01
-5.7
3
<.01
-5.1
0
<.01
Port
man
teau
test
for
whi
te n
oise
resi
dual
s Pr
ob >
Chi-s
quar
e (3
0)
32.9
9
.32
26.6
5
.64
19.2
8
.93
25.4
6
.70
22.7
1
.83
28.4
5
.55
33.7
8
.29
Bart
lett
's Cu
mul
ativ
e Pe
riodo
gram
whi
te
nois
e te
st
0.51
.9
60.
52
.95
0.64
.8
00.
53
.94
0.30
>.
990.
40
>.99
0.53
.9
4
Log
likel
ihoo
d fo
r m
odel
-369
.8
-4
06.5
-284
.3
-3
91.0
-244
.6
-4
64.0
-450
.2
5
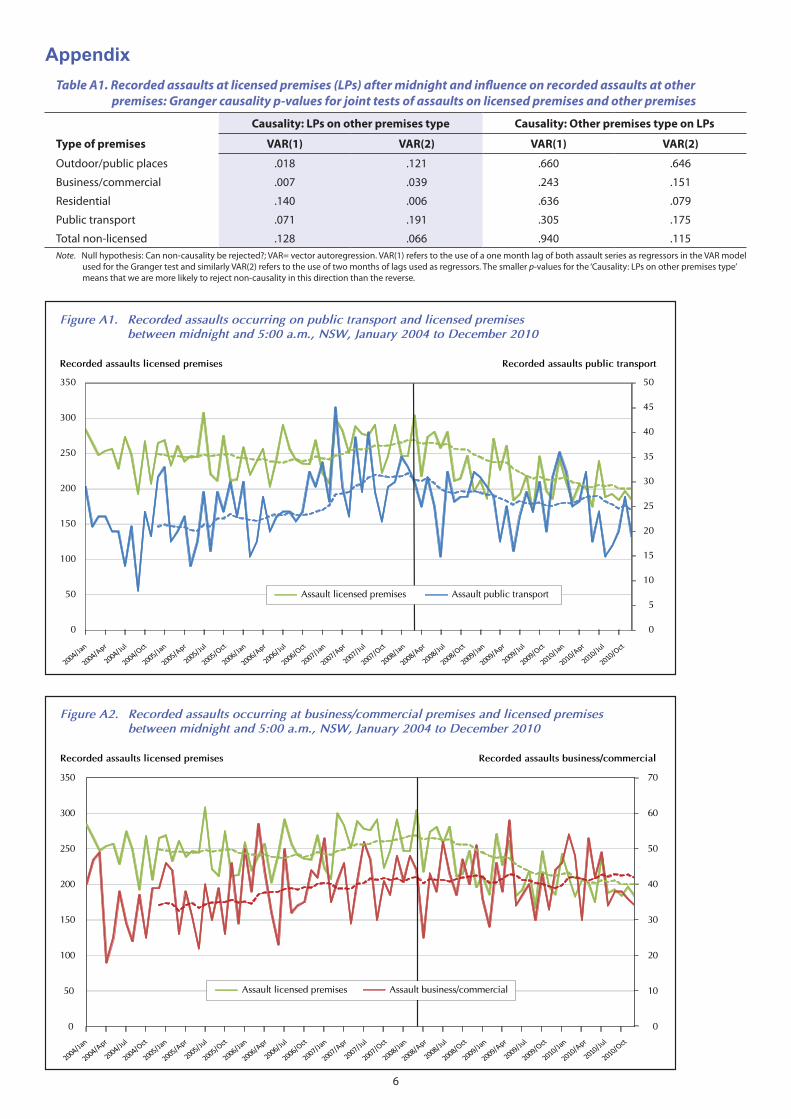
on these vector autoregression models in Appendix Table A1. The tests suggest that the reduction in assaults on licensed premises may have flowed on, to some extent, to assaults in outdoor/public places, business/commercial premises and residential premises. There is also some suggestion of a flow-on in the reduction of assaults on licensed premises to those on public transport and all non-licensed premises.
DiscussionThe decline in assaults after midnight since March 2008 is now detectable at the NSW level and is equivalent to a drop of about 1 per cent per month since the liquor licensing policy changes were implemented. Our results show that the underlying upward trend of 4.8 extra recorded assaults each month across the aggregate of all premises types in the period leading up to the policy changes has been reversed by the downward trend of 10.4 fewer assaults each month after March 2008. The downward trend is significant in all premises types other than non-licensed business/commercial premises. This is the first downward trend in assault recorded in NSW since 1988. However the effect may be moderating with the flattening in the series for assaults on licensed premises over the last six months of 2010.
Although it is impossible to pinpoint the precise reason for this decline in assault across NSW, there is little doubt it is a response to one or more of the measures taken from March 2008 onward to reduce the number of assaults on licensed premises. Prior to those measures the number of assaults on licensed premises in NSW was increasing. Since the policy changes were implemented this trend reversed. The shift in trend is entirely consistent with the results obtained from a recent natural experiment in Newcastle (Kypri, Jones, McElduff, & Barker, 2011) which found that the introduction of liquor licensing restrictions reduced the incidence of assaults in Newcastle but not in a nearby area where restrictions were not in force.
AcknowledgementsThe authors would like to thank Clare Ringland for helpful feedback on earlier versions of this brief and Florence Sin for the desktop publishing.
Notes1 As some premises had the same number of assaults the top
100 list actually contained 109 licensed premises.
2 The Star City Casino was not included in the list of premises on which restrictions were imposed.
3 Weekend time is a variable that assumes a value of one for any month with more than 13 days total for Fridays, Saturdays and Sundays and zero otherwise. This variable has been found to be a good predictor of assault levels along with month, which controls for the seasonal factors as well as variation in month length.
4 Phillips-Perron unit root tests were performed on all the assault series used in models and returned a MacKinnon approximate p-value for Z(t) <.01 for all series. Since the presence of unit roots could be rejected for all the series, the analysis was conducted in levels. STATA 10 output is shown in Table 2 Regression diagnostics.
5 Maximum likelihood estimation was used to estimate monthly assault counts. Along with the months, used as seasonal controls, an autoregressive error structure (for example AR terms at lags 3, 4 and 5 for assaults in outdoor/public places) was found to be effective in controlling for residual autocorrelation in the models and et is white noise.
6 The p-values for the Box-Ljung Q statistics were considered for each model before a final form was selected. All models reported had a non-significant set of p-values for their Box-Ljung Q statistics to lag 40, but only one result from the Portmanteau test as well as the result of Bartlett’s Cumulative Periodogram test for white noise residuals is given towards the bottom of the results tables. The log likelihood statistics and other diagnostics for each model are shown at the bottom of the appendix tables. The Wald p-value from the STATA 10 output was <.001 for all the models given in the appendices. The regression constant predicts the December level of assaults and all other months will be adjustments from the December level.
ReferencesKypri, K., Jones, C., McElduff, P., & Barker, D. (2011). Effects of restricting pub closing times on night-time assaults in an Australian city. Addiction, 106, 303-310.
Moffatt, S., Mason, A., Borzycki, C., & Weatherburn, D. (2009). Liquor licensing enforcement and assaults on licensed premises. Bureau Brief (No.40). Sydney: NSW Bureau of Crime Statistics and Research.
6
Recorded assaults licensed premises
Figure A2. Recorded assaults occurring at business/commercial premises and licensed premises between midnight and 5:00 a.m., NSW, January 2004 to December 2010
Recorded assaults business/commercial
0
10
20
30
40
50
60
70
0
50
100
150
200
250
300
350
Assault licensed premises Assault business/commercial
0
5
10
15
20
25
30
35
40
45
50
0
50
100
150
200
250
300
350
Recorded assaults licensed premises
Figure A1. Recorded assaults occurring on public transport and licensed premises between midnight and 5:00 a.m., NSW, January 2004 to December 2010
Recorded assaults public transport
Assault licensed premises Assault public transport
Table A1. Recorded assaults at licensed premises (LPs) after midnight and influence on recorded assaults at other premises: Granger causality p-values for joint tests of assaults on licensed premises and other premises
Type of premises
Causality: LPs on other premises type Causality: Other premises type on LPs
VAR(1) VAR(2) VAR(1) VAR(2)
Outdoor/public places .018 .121 .660 .646
Business/commercial .007 .039 .243 .151
Residential .140 .006 .636 .079
Public transport .071 .191 .305 .175
Total non-licensed .128 .066 .940 .115Note. Null hypothesis: Can non-causality be rejected?; VAR= vector autoregression. VAR(1) refers to the use of a one month lag of both assault series as regressors in the VAR model
used for the Granger test and similarly VAR(2) refers to the use of two months of lags used as regressors. The smaller p-values for the ‘Causality: LPs on other premises type’ means that we are more likely to reject non-causality in this direction than the reverse.
Appendix

7
NSW Bureau of Crime Statistics and Research - Level 8, St James Centre, 111 Elizabeth Street, Sydney 2000 [email protected] • www.bocsar.nsw.gov.au • Ph: (02) 9231 9190 • Fax: (02) 9231 9187 • ISBN 978-1-921824-17-3
© State of New South Wales through the Department of Justice and Attorney General 2011. You may copy, distribute, display, download and otherwise freely deal with this work for any purpose, provided that you attribute the Department of Justice and Attorney General as the owner. However, you must obtain permission if you wish
to (a) charge others for access to the work (other than at cost), (b) include the work in advertising or a product for sale, or (c) modify the work.
Recorded assaults licensed premises
Figure A4. Recorded assaults total and those occurring at licensed premises between midnight and 5:00 a.m., NSW, January 2004 to December 2010
Recorded assaults total
0
200
400
600
800
1000
1200
1400
1600
1800
0
50
100
150
200
250
300
350
Assault licensed premises Assault total
Recorded assaults licensed premises
Figure A3. Recorded assaults total non-licensed and those occurring at licensed premises between midnight and 5:00 a.m., NSW, January 2004 to December 2010
Recorded assaults total non-licensed
0
200
400
600
800
1000
1200
1400
1600
0
50
100
150
200
250
300
350
Assault licensed premises Assault total non-licensed