Trends in afforestation in southern Missouri · and later defecate the seeds (Arend 1950, Parker...
16
Trends in afforestation in southern Missouri W. Keith Moser 1 , Mark D. Nelson 1 , Sean Healey 2 , Mark H. Hansen 1 , Warren Cohen 3 Abstract: Past studies of forest disturbance traditionally have focused on biomass loss, e.g., blowdown in the Boundary Waters Canoe Area Wilderness, gypsy moth infestation, the impacts of Hurricanes Hugo and Katrina. Using FIA data and satellite imagery, this study examined a region of the country that is simultaneously experiencing biomass loss due to oak decline and biomass gain from afforestation of agricultural lands by eastern redcedar, following change to nonagricultural land use. This paper examines the increase in eastern redcedar in southwestern Missouri between 1985 and 2007. After converting stacks of Landsat imagery to delineations of forest and nonforest categories, we looked at changes between succeeding images. We observed a small increase in forest land area, particularly in the first 10 years of the analysis. Image-based estimates of forest land area did not differ significantly from estimates derived from FIA sample plot data. Differences in definition of forest may explain any real variations in the estimates. Keywords: Forest, inventory, FIA, remote sensing, eastern redcedar, agricultural abandonment, Landsat. 1 USDA Forest Service; Northern Research Station; Forest Inventory and Analysis Program; 1992 Folwell Ave.; St. Paul, MN 55108 2 USDA Forest Service; Rocky Mountain Research Station, 507 25th Street, Ogden, UT 84401 3 USDA Forest Service Pacific Northwest Research Station, Forestry Sciences Laboratory, 3200 SW Jefferson Way Corvallis, OR 97331 USDA Forest Service Proceedings – RMRS-P-56 14. In: McWilliams, Will; Moisen, Gretchen; Czaplewski, Ray, comps. 2009. 2008 Forest Inventory and Analysis (FIA) Symposium; October 21-23, 2008: Park City, UT. Proc. RMRS-P-56CD. Fort Collins, CO: U.S. Department of Agriculture, Forest Service, Rocky Mountain Research Station. 1 CD.
Transcript of Trends in afforestation in southern Missouri · and later defecate the seeds (Arend 1950, Parker...
Trends in afforestation in southern Missouri
W. Keith Moser1, Mark D. Nelson1, Sean Healey2, Mark H. Hansen1, Warren Cohen3
Abstract: Past studies of forest disturbance traditionally have focused on biomass loss, e.g., blowdown in the Boundary Waters Canoe Area Wilderness, gypsy moth infestation, the impacts of Hurricanes Hugo and Katrina. Using FIA data and satellite imagery, this study examined a region of the country that is simultaneously experiencing biomass loss due to oak decline and biomass gain from afforestation of agricultural lands by eastern redcedar, following change to nonagricultural land use. This paper examines the increase in eastern redcedar in southwestern Missouri between 1985 and 2007. After converting stacks of Landsat imagery to delineations of forest and nonforest categories, we looked at changes between succeeding images. We observed a small increase in forest land area, particularly in the first 10 years of the analysis. Image-based estimates of forest land area did not differ significantly from estimates derived from FIA sample plot data. Differences in definition of forest may explain any real variations in the estimates.
Keywords: Forest, inventory, FIA, remote sensing, eastern redcedar, agricultural abandonment, Landsat.
1 USDA Forest Service; Northern Research Station; Forest Inventory and Analysis Program; 1992 Folwell Ave.; St. Paul, MN 55108 2 USDA Forest Service; Rocky Mountain Research Station, 507 25th Street, Ogden, UT 84401 3 USDA Forest Service Pacific Northwest Research Station, Forestry Sciences Laboratory, 3200 SW Jefferson Way Corvallis, OR 97331
USDA Forest Service Proceedings – RMRS-P-56 14.
In: McWilliams, Will; Moisen, Gretchen; Czaplewski, Ray, comps. 2009. 2008 Forest Inventory and Analysis (FIA) Symposium; October 21-23, 2008: Park City, UT. Proc. RMRS-P-56CD. Fort Collins, CO: U.S. Department of Agriculture, Forest Service, Rocky Mountain Research Station. 1 CD.
Introduction
Past forest disturbance studies traditionally have focused on biomass loss, e.g., impacts of hurricane and blowdown, insect infestation, wildfire, and harvest activities. Little attention has been paid to biomass accretion in disturbance-dependent ecosystems, such as the ecotone between the grasslands and forests in the Upper Midwest. A combination of changing economics of agriculture and human-influenced disturbance patterns in this region have resulted in a substantially different landscape than in past decades. One tree species taking advantage of the reduction in disturbance events in Missouri woodlands and rangelands is eastern redcedar (Juniperus virginiana L.). The suppression of fire and the reduction in grazing on pastureland have resulted in an unprecedented expansion of eastern redcedar in Missouri. The overall study, of which this paper reports some early analyses, intends to document the pattern and extent of redcedar expansion.
USDA Forest Service Proceedings – RMRS-P-56 14.
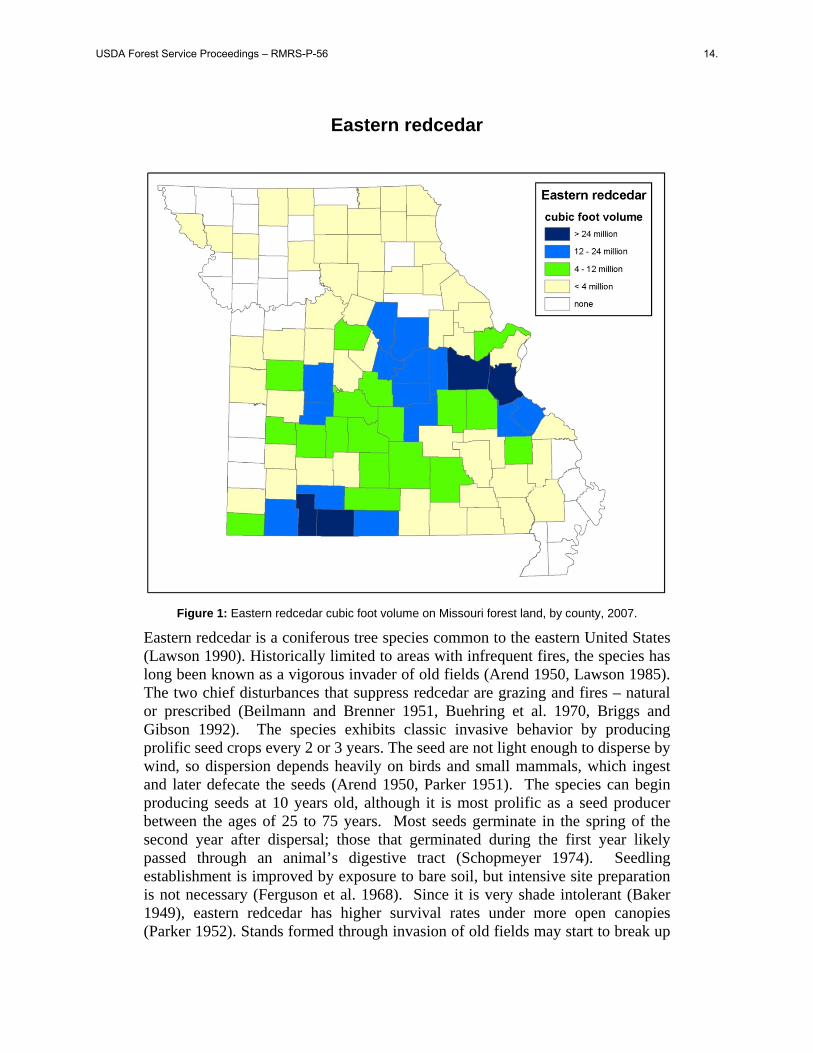
Eastern redcedar
Figure 1: Eastern redcedar cubic foot volume on Missouri forest land, by county, 2007.
Eastern redcedar is a coniferous tree species common to the eastern United States (Lawson 1990). Historically limited to areas with infrequent fires, the species has long been known as a vigorous invader of old fields (Arend 1950, Lawson 1985). The two chief disturbances that suppress redcedar are grazing and fires – natural or prescribed (Beilmann and Brenner 1951, Buehring et al. 1970, Briggs and Gibson 1992). The species exhibits classic invasive behavior by producing prolific seed crops every 2 or 3 years. The seed are not light enough to disperse by wind, so dispersion depends heavily on birds and small mammals, which ingest and later defecate the seeds (Arend 1950, Parker 1951). The species can begin producing seeds at 10 years old, although it is most prolific as a seed producer between the ages of 25 to 75 years. Most seeds germinate in the spring of the second year after dispersal; those that germinated during the first year likely passed through an animal’s digestive tract (Schopmeyer 1974). Seedling establishment is improved by exposure to bare soil, but intensive site preparation is not necessary (Ferguson et al. 1968). Since it is very shade intolerant (Baker 1949), eastern redcedar has higher survival rates under more open canopies (Parker 1952). Stands formed through invasion of old fields may start to break up
USDA Forest Service Proceedings – RMRS-P-56 14.
at around 60 years of age as hardwoods or other competing species become established.
Eastern redcedar has the potential to dramatically alter the structural characteristics of an ecosystem it enters. Dense redcedar stands not only change the character of pasture, range, or woodland to forest, but can also severely impact ground flora biomass and diversity, simultaneously creating a monolayer canopy and a monoculture. In native prairie ecosystems, encroaching redcedar is viewed as an undesirable invasive species. As previously mentioned, redcedar is suppressed by fire, as the stands are highly flammable and any established fires are extremely intense and usually stand-replacing.
This project provides several benefits to state agencies, resource managers, and others interested in trends in ecological succession along the prairie-woodland ecotone of the Upper Midwest. Gaining a better understanding of the relationship between satellite imagery and forest inventory data in this rapidly changing landscape will allow us to make better estimates of the resource. With an improved understanding of landscape change, we have the possibility to refine our post-sampling stratification. Our analysis of resource trends will improve as we can go back to times between periodic inventories and “fill in the gaps” on resource estimation. By obtaining a relatively intensive set of imagery (at 2-year intervals), we can simulate the effects of various image-sampling intensities to identify the most efficient and least expensive strategy for meeting the production needs of the U.S. Department of Agriculture, Forest Service’s Forest Inventory and Analysis (FIA) program. This is accomplished by comparing the value of intensive data for growth (a relatively continuous process) vs. mortality and harvesting (examples of discrete events). Finally, this study will provide baseline data for analysis of carbon storage in the forest-woodland-prairie ecotone. To achieve these goals, this study had two objectives: 1) Assess the relationship between satellite image data and FIA field sample data, specific to forest biomass change processes; and 2) Document the timing and amount of forest biomass change over time using a combination of remote sensing imagery and FIA data.
Methodology
In 2007, we published an analysis of the Boundary Waters Canoe Area Wilderness (BWCAW) after the 1999 windstorm (Moser et al. 2007a). One of the challenges of that study was estimating the intensity and extent of the damage from the storm. A sketch map of forest blowdown was produced by U.S. Forest Service Forest Health Protection staff, who flew over the area in fixed-wing aircraft following the blowdown event, ‘sketched’ damage site locations on maps, and visually interpreted severity of blowdown damage. Reasonable estimates of the blowdown damage area were produced from sketch maps, but the coarse resolution of sketch map polygons limited their utility for site-specific assessments or linkage to inventory plot data and satellite image pixels. Therefore, we developed and employed alternative methodologies to estimate damage extent (Nelson et al. 2007).
USDA Forest Service Proceedings – RMRS-P-56 14.
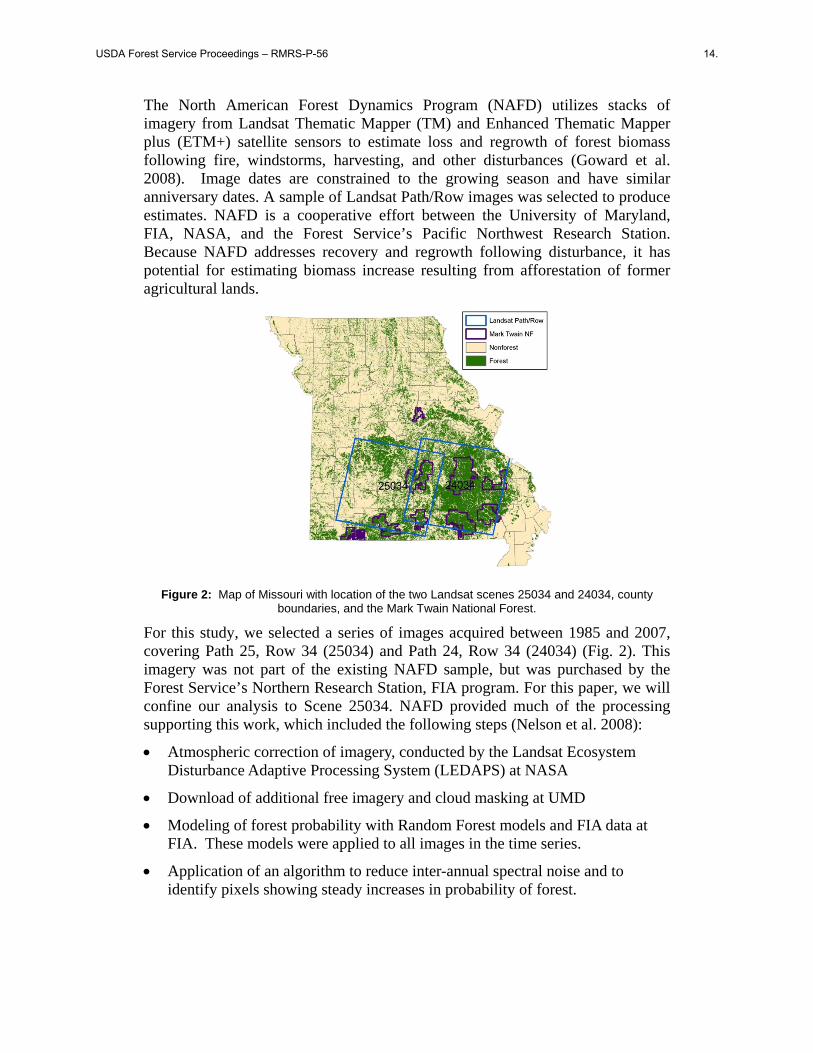
The North American Forest Dynamics Program (NAFD) utilizes stacks of imagery from Landsat Thematic Mapper (TM) and Enhanced Thematic Mapper plus (ETM+) satellite sensors to estimate loss and regrowth of forest biomass following fire, windstorms, harvesting, and other disturbances (Goward et al. 2008). Image dates are constrained to the growing season and have similar anniversary dates. A sample of Landsat Path/Row images was selected to produce estimates. NAFD is a cooperative effort between the University of Maryland, FIA, NASA, and the Forest Service’s Pacific Northwest Research Station. Because NAFD addresses recovery and regrowth following disturbance, it has potential for estimating biomass increase resulting from afforestation of former agricultural lands.
Figure 2: Map of Missouri with location of the two Landsat scenes 25034 and 24034, county
boundaries, and the Mark Twain National Forest.
For this study, we selected a series of images acquired between 1985 and 2007, covering Path 25, Row 34 (25034) and Path 24, Row 34 (24034) (Fig. 2). This imagery was not part of the existing NAFD sample, but was purchased by the Forest Service’s Northern Research Station, FIA program. For this paper, we will confine our analysis to Scene 25034. NAFD provided much of the processing supporting this work, which included the following steps (Nelson et al. 2008):
Atmospheric correction of imagery, conducted by the Landsat Ecosystem Disturbance Adaptive Processing System (LEDAPS) at NASA
Download of additional free imagery and cloud masking at UMD
Modeling of forest probability with Random Forest models and FIA data at FIA. These models were applied to all images in the time series.
Application of an algorithm to reduce inter-annual spectral noise and to identify pixels showing steady increases in probability of forest.
USDA Forest Service Proceedings – RMRS-P-56 14.
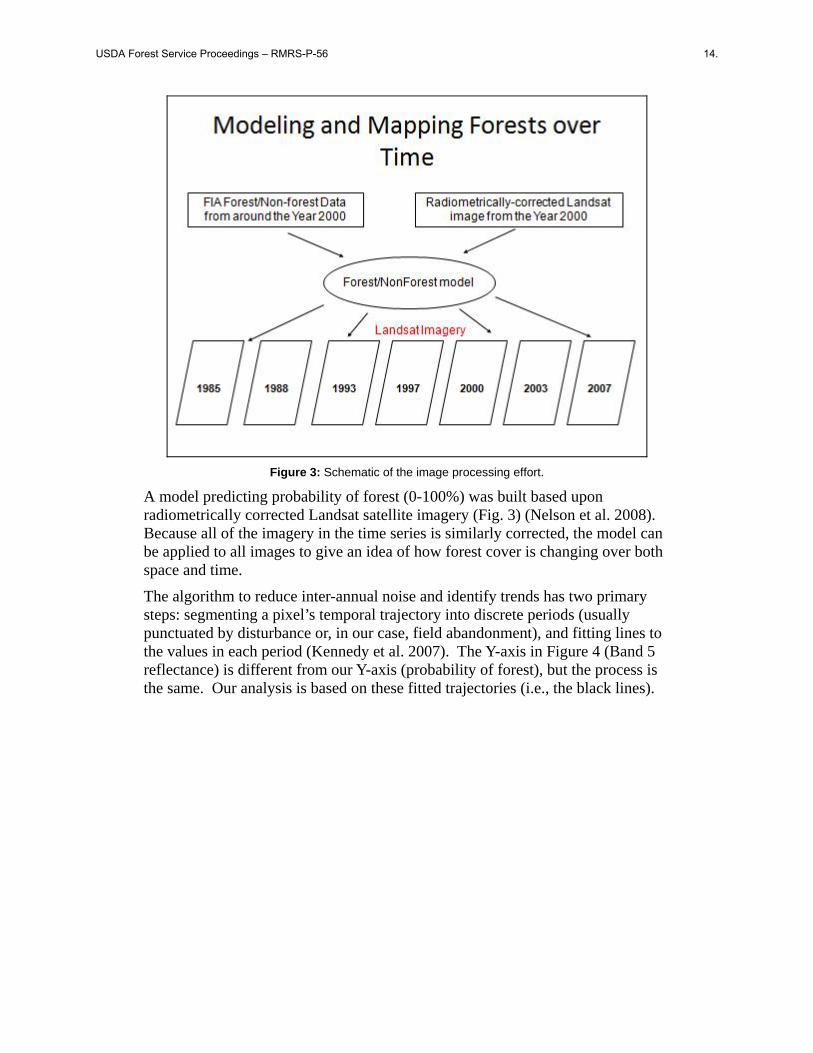
Figure 3: Schematic of the image processing effort.
A model predicting probability of forest (0-100%) was built based upon radiometrically corrected Landsat satellite imagery (Fig. 3) (Nelson et al. 2008). Because all of the imagery in the time series is similarly corrected, the model can be applied to all images to give an idea of how forest cover is changing over both space and time.
The algorithm to reduce inter-annual noise and identify trends has two primary steps: segmenting a pixel’s temporal trajectory into discrete periods (usually punctuated by disturbance or, in our case, field abandonment), and fitting lines to the values in each period (Kennedy et al. 2007). The Y-axis in Figure 4 (Band 5 reflectance) is different from our Y-axis (probability of forest), but the process is the same. Our analysis is based on these fitted trajectories (i.e., the black lines).
USDA Forest Service Proceedings – RMRS-P-56 14.
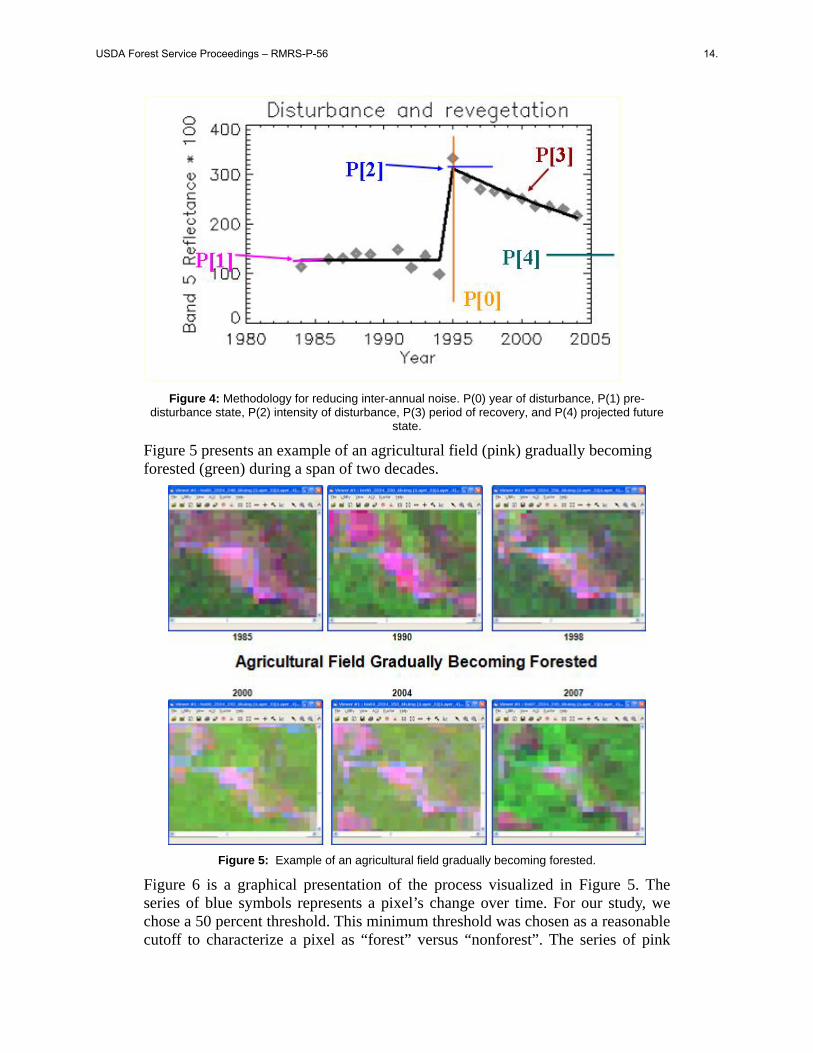
Figure 4: Methodology for reducing inter-annual noise. P(0) year of disturbance, P(1) pre-
disturbance state, P(2) intensity of disturbance, P(3) period of recovery, and P(4) projected future state.
Figure 5 presents an example of an agricultural field (pink) gradually becoming forested (green) during a span of two decades.
Figure 5: Example of an agricultural field gradually becoming forested.
Figure 6 is a graphical presentation of the process visualized in Figure 5. The series of blue symbols represents a pixel’s change over time. For our study, we chose a 50 percent threshold. This minimum threshold was chosen as a reasonable cutoff to characterize a pixel as “forest” versus “nonforest”. The series of pink
USDA Forest Service Proceedings – RMRS-P-56 14.
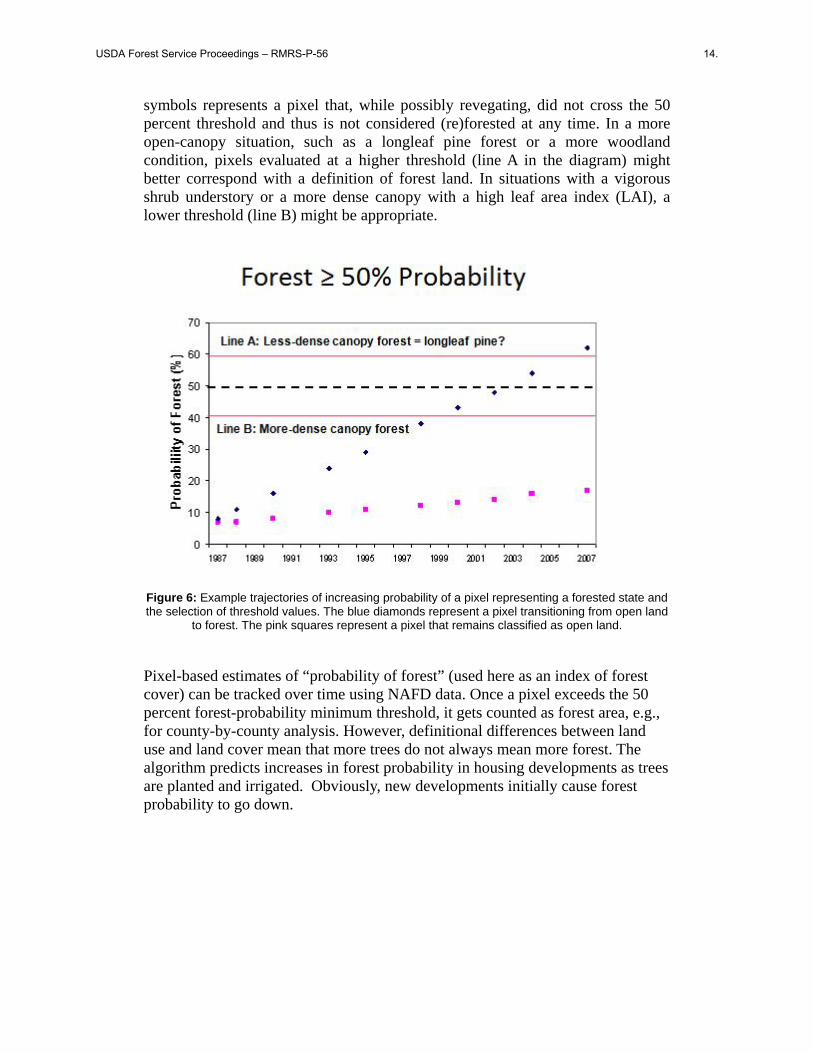
symbols represents a pixel that, while possibly revegating, did not cross the 50 percent threshold and thus is not considered (re)forested at any time. In a more open-canopy situation, such as a longleaf pine forest or a more woodland condition, pixels evaluated at a higher threshold (line A in the diagram) might better correspond with a definition of forest land. In situations with a vigorous shrub understory or a more dense canopy with a high leaf area index (LAI), a lower threshold (line B) might be appropriate.
Figure 6: Example trajectories of increasing probability of a pixel representing a forested state and the selection of threshold values. The blue diamonds represent a pixel transitioning from open land
to forest. The pink squares represent a pixel that remains classified as open land.
Pixel-based estimates of “probability of forest” (used here as an index of forest cover) can be tracked over time using NAFD data. Once a pixel exceeds the 50 percent forest-probability minimum threshold, it gets counted as forest area, e.g., for county-by-county analysis. However, definitional differences between land use and land cover mean that more trees do not always mean more forest. The algorithm predicts increases in forest probability in housing developments as trees are planted and irrigated. Obviously, new developments initially cause forest probability to go down.
USDA Forest Service Proceedings – RMRS-P-56 14.
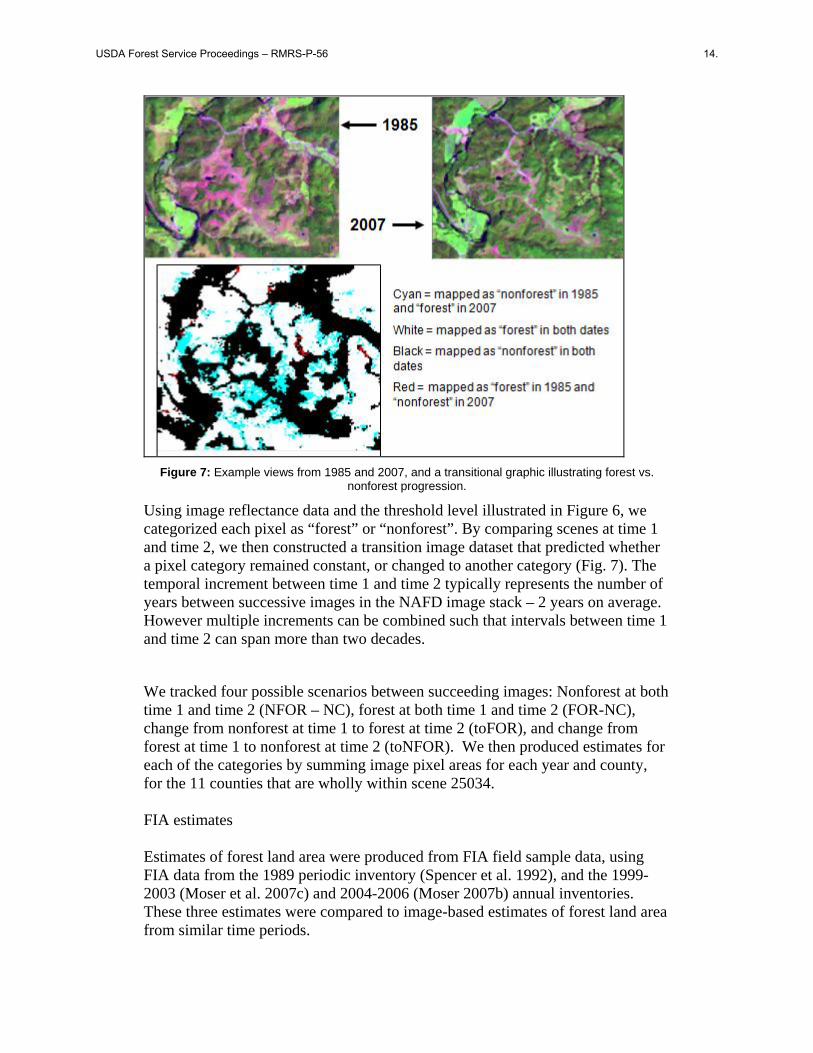
Figure 7: Example views from 1985 and 2007, and a transitional graphic illustrating forest vs.
nonforest progression.
Using image reflectance data and the threshold level illustrated in Figure 6, we categorized each pixel as “forest” or “nonforest”. By comparing scenes at time 1 and time 2, we then constructed a transition image dataset that predicted whether a pixel category remained constant, or changed to another category (Fig. 7). The temporal increment between time 1 and time 2 typically represents the number of years between successive images in the NAFD image stack – 2 years on average. However multiple increments can be combined such that intervals between time 1 and time 2 can span more than two decades.
We tracked four possible scenarios between succeeding images: Nonforest at both time 1 and time 2 (NFOR – NC), forest at both time 1 and time 2 (FOR-NC), change from nonforest at time 1 to forest at time 2 (toFOR), and change from forest at time 1 to nonforest at time 2 (toNFOR). We then produced estimates for each of the categories by summing image pixel areas for each year and county, for the 11 counties that are wholly within scene 25034. FIA estimates Estimates of forest land area were produced from FIA field sample data, using FIA data from the 1989 periodic inventory (Spencer et al. 1992), and the 1999-2003 (Moser et al. 2007c) and 2004-2006 (Moser 2007b) annual inventories. These three estimates were compared to image-based estimates of forest land area from similar time periods.
USDA Forest Service Proceedings – RMRS-P-56 14.
Results
ates of FOR-NC, NFOR-NC, toFOR, and toNFOR are reported for
ter
ing a
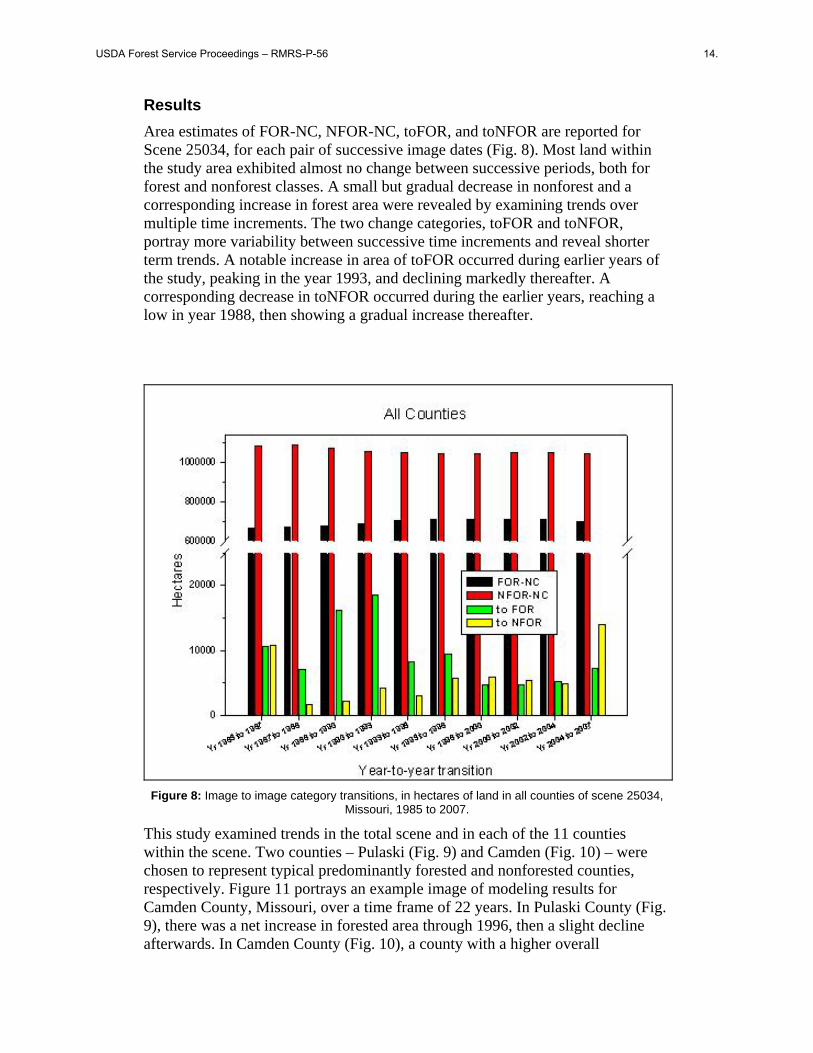
Area estimScene 25034, for each pair of successive image dates (Fig. 8). Most land withinthe study area exhibited almost no change between successive periods, both for forest and nonforest classes. A small but gradual decrease in nonforest and a corresponding increase in forest area were revealed by examining trends overmultiple time increments. The two change categories, toFOR and toNFOR, portray more variability between successive time increments and reveal shorterm trends. A notable increase in area of toFOR occurred during earlier years ofthe study, peaking in the year 1993, and declining markedly thereafter. A corresponding decrease in toNFOR occurred during the earlier years, reachlow in year 1988, then showing a gradual increase thereafter.
Figure 8: Image to image category transitions, in hectares of land in all counties of scene 25034,
This study examined trends in t each of the 11 counties re
y (Fig.
Missouri, 1985 to 2007.
he total scene and in within the scene. Two counties – Pulaski (Fig. 9) and Camden (Fig. 10) – wechosen to represent typical predominantly forested and nonforested counties, respectively. Figure 11 portrays an example image of modeling results for Camden County, Missouri, over a time frame of 22 years. In Pulaski Count9), there was a net increase in forested area through 1996, then a slight decline afterwards. In Camden County (Fig. 10), a county with a higher overall
USDA Forest Service Proceedings – RMRS-P-56 14.
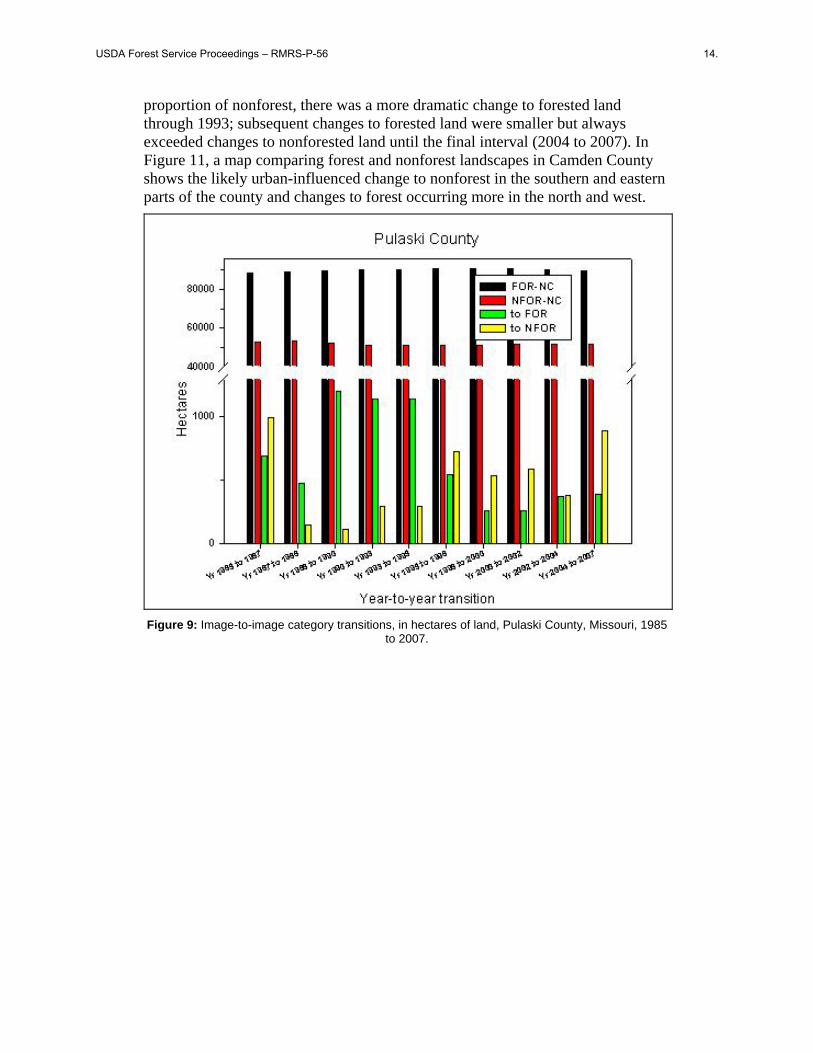
proportion of nonforest, there was a more dramatic change to forested lathrough 1993; subsequent changes to forested land were smaller but always exceeded changes to nonforested land until the final interval (2004 to 2007). Figure 11, a map comparing forest and nonforest landscapes in Camden County shows the likely urban-influenced change to nonforest in the southern and easternparts of the county and changes to forest occurring more in the north and west.
nd
In
Figure 9: Image-to-image category transitions, in hectares of land, Pulaski County, Missouri, 1985
to 2007.
USDA Forest Service Proceedings – RMRS-P-56 14.
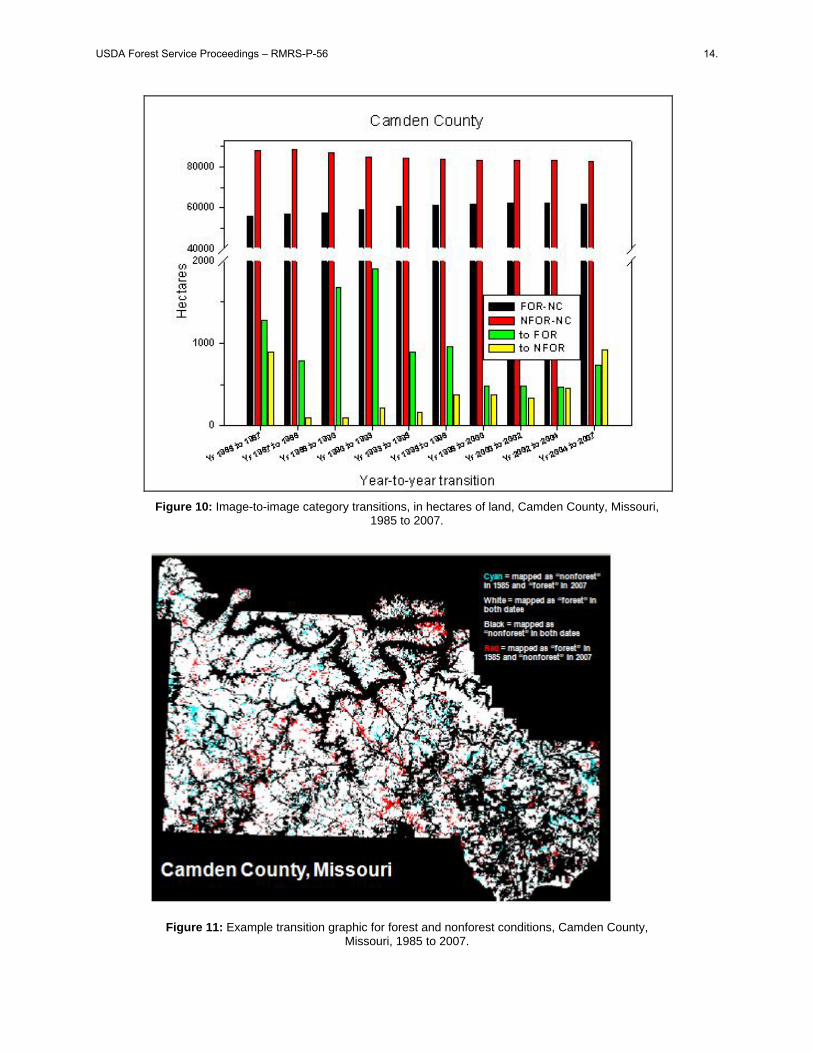
Figure 10: Image-to-image category transitions, in hectares of land, Camden County, Missouri,
1985 to 2007.
Figure 11: Example transition graphic for forest and nonforest conditions, Camden County,
Missouri, 1985 to 2007.
USDA Forest Service Proceedings – RMRS-P-56 14.
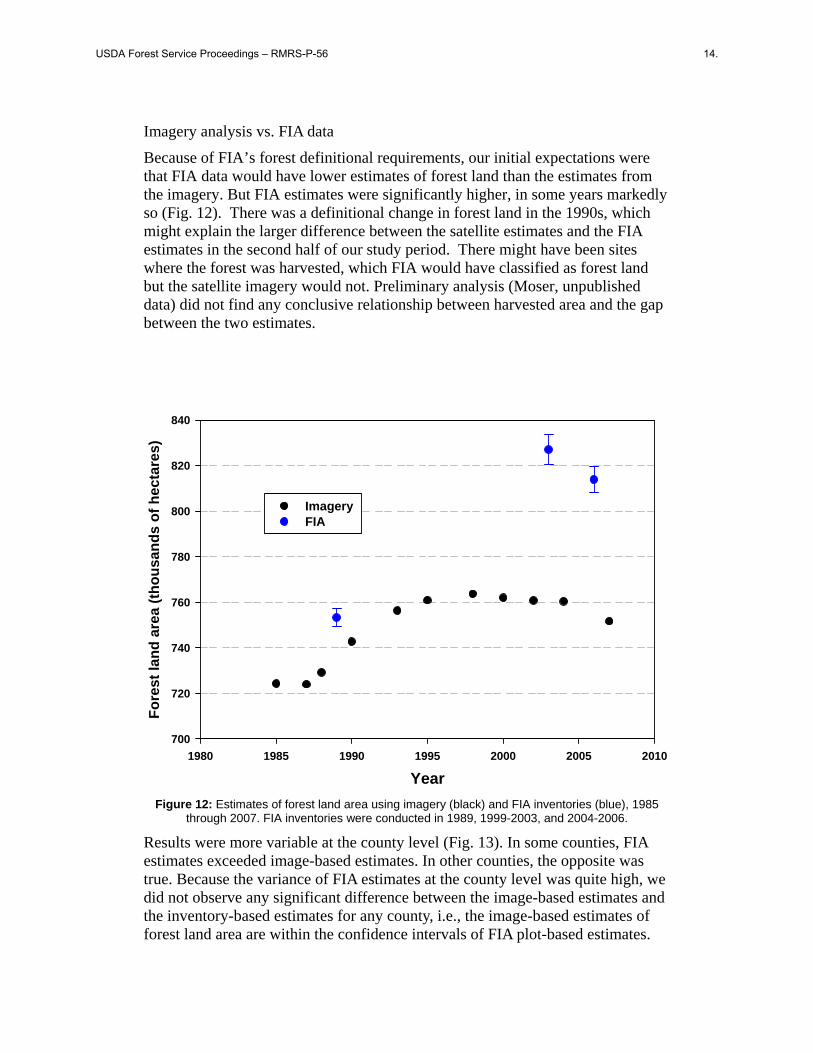
Imagery analysis vs. FIA data
Because of FIA’s forest definitional requirements, our initial expectations were that FIA data would have lower estimates of forest land than the estimates from the imagery. But FIA estimates were significantly higher, in some years markedly so (Fig. 12). There was a definitional change in forest land in the 1990s, which might explain the larger difference between the satellite estimates and the FIA estimates in the second half of our study period. There might have been sites where the forest was harvested, which FIA would have classified as forest land but the satellite imagery would not. Preliminary analysis (Moser, unpublished data) did not find any conclusive relationship between harvested area and the gap between the two estimates.
Year
1980 1985 1990 1995 2000 2005 2010
Fo
rest
lan
d a
rea
(th
ou
san
ds
of
hec
tare
s)
700
720
740
760
780
800
820
840
Imagery FIA
Figure 12: Estimates of forest land area using imagery (black) and FIA inventories (blue), 1985
through 2007. FIA inventories were conducted in 1989, 1999-2003, and 2004-2006.
Results were more variable at the county level (Fig. 13). In some counties, FIA estimates exceeded image-based estimates. In other counties, the opposite was true. Because the variance of FIA estimates at the county level was quite high, we did not observe any significant difference between the image-based estimates and the inventory-based estimates for any county, i.e., the image-based estimates of forest land area are within the confidence intervals of FIA plot-based estimates.
USDA Forest Service Proceedings – RMRS-P-56 14.
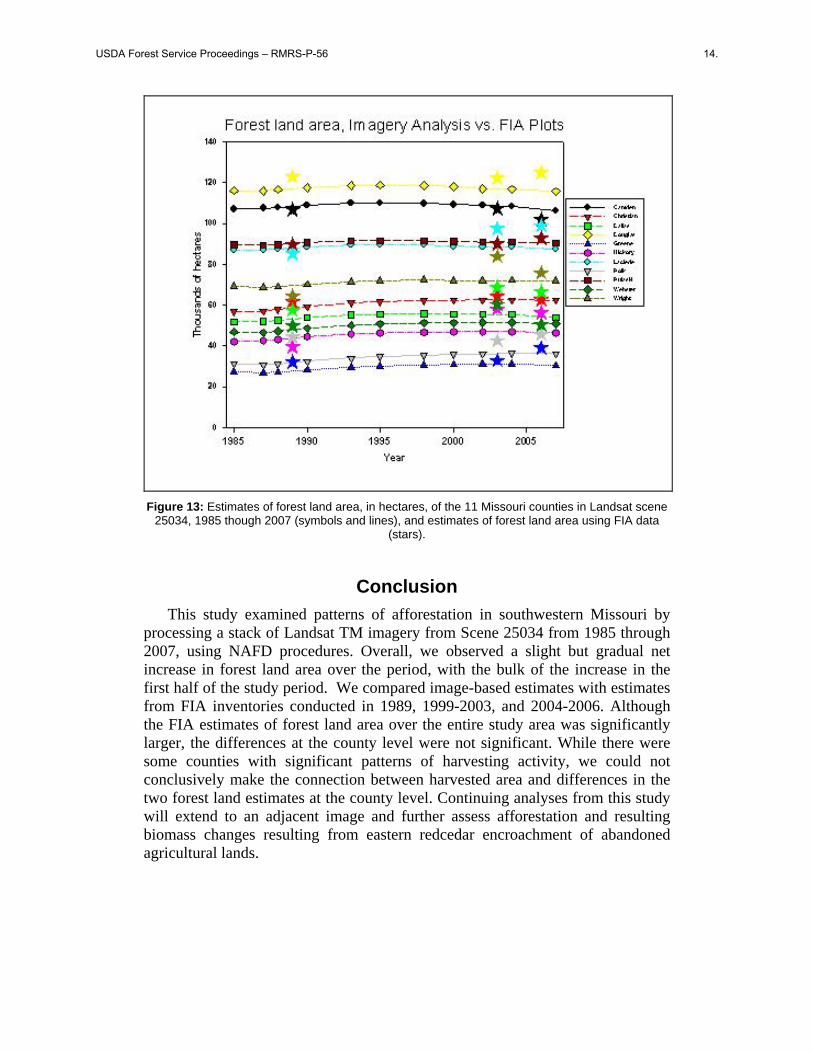
Figure 13: Estimates of forest land area, in hectares, of the 11 Missouri counties in Landsat scene
25034, 1985 though 2007 (symbols and lines), and estimates of forest land area using FIA data (stars).
Conclusion
This study examined patterns of afforestation in southwestern Missouri by processing a stack of Landsat TM imagery from Scene 25034 from 1985 through 2007, using NAFD procedures. Overall, we observed a slight but gradual net increase in forest land area over the period, with the bulk of the increase in the first half of the study period. We compared image-based estimates with estimates from FIA inventories conducted in 1989, 1999-2003, and 2004-2006. Although the FIA estimates of forest land area over the entire study area was significantly larger, the differences at the county level were not significant. While there were some counties with significant patterns of harvesting activity, we could not conclusively make the connection between harvested area and differences in the two forest land estimates at the county level. Continuing analyses from this study will extend to an adjacent image and further assess afforestation and resulting biomass changes resulting from eastern redcedar encroachment of abandoned agricultural lands.
USDA Forest Service Proceedings – RMRS-P-56 14.
Acknowledgements
The authors wish to acknowledge the contributions of the NRS-FIA program for purchasing the Landsat imagery, and to Robert Kennedy (Oregon State University), Nancy Thomas (University of Maryland), Jeff Masek (NASA Goddard), Chengquan Huang (University of Maryland), and Gretchen Moisen (IWFIA) for their contributions in processing the image data. Andrew Lister and Andrew Gray provided valuable comments on an earlier version of this manuscript.
References
Arend, J. L. 1950. Influence of fire and soil on distribution of eastern redcedar in the Ozarks. Journal of Forestry. 48:129–130.
Baker, F. S. 1949. A Revised Tolerance Table. Journal of Forestry. 47(3) 179-181(3).
Beilmann, A. P.; Brenner, L. G. 1951. The recent intrusion of forests in the Ozarks. Missouri Botanical Gardens Ann. 38:261 282.
Briggs, J. M.; Gibson, D. J. 1992. Effect of burning on tree spatial patterns in a tallgrass prairie landscape. Bulletin of the Torrey Botanical Club119:300–307.
Buehring, N.; Santelmann, P. W.; Elwell, H. M. 1971. Responses of eastern red cedar to various control procedures. Journal of Range Management. 24:378 38.
Ferguson, E. R.; Lawson, E. R.; Maple, W. R.; Mesavage, C. 1968. Managing eastern redcedar. Stat. Res. Pap. SO-37. New Orleans, LA: U.S. Department of Agriculture, Forest Service, Southern Forest Experiment Station. 15 p.
Goward, S.N.; Masek, J.G.; Cohen, W.; Moisen, G.; Collatz, G.J.; Healey, S.; Houghton, R.A.; Huang, C.; Kennedy, R.; Law, B.; Powell, S.; Turner, D.; Wulder, M.A. 2008. Forest disturbance and North American carbon flux. Eos, Transactions American Geophysical Union. 89: 105-116.
Kennedy, R. E.; Cohen, W. B.; Schroeder, T. A. 2007. Trajectory-based change detection of automated characterization of forest disturbance dynamics. Remote Sensing and the Environment. 110: 370-386.
Lawson, E. R. 1985. Eastern redcedar. An American wood. Washington DC: U.S. Department of Agriculture, Forest Service. FS-260. 7 p.
Lawson, E. R. 1990. Juniperus virginiana L. Eastern redcedar. In Burns, R.M. and Honkala, B.H., compilers. Silvics of North America, Vol. 1 Conifers. Agricultural Handbook 654. Washington, D.C.: U.S. Department of Agriculture, Forest Service,..
Moser W. K.; Hansen, M. H.; Nelson, M. D.; Crocker, S. J.; Perry, C. H.; Schulz, B.; Woodall, C. W.; Nagel, L.; Mielke, M. 2007a. The Boundary Waters and the Blowdown: A resource assessment of the Boundary Waters Canoe Area Wilderness, 1999-2003. Newtown Square, PA:U.S. Department of Agriculture, Forest Service, Northern Research Station. Gen. Tech. Rep. NRS-7. 54 p.
USDA Forest Service Proceedings – RMRS-P-56 14.
Moser, W. K.; Hansen, M. H.; Treiman, T. B. 2007b. Missouri’s forest resources, 2006. Res. Note NRS-4. Newtown Square, PA: U.S. Department of Agriculture, Forest Service, Northern Research Station. 4 p.
Moser, W. K.; Hansen, M. H.; Treiman, T. B.; Jepson, E.; Leatherberry, E. C.; Liknes, G.; Perry, C. H.; Olson, C. L.; Piva, R. J.; Woodall, C. W.; Brand, G. J. 2007c. Missouri’s forests 1999-2003, Part A. Resour. Bull. NRS-10. Newtown Square, PA: U.S. Department of Agriculture, Forest Service, Northern Research Station. 79 p.
Nelson, M. D.; Moser, W. K. 2007. Integrating remote sensing and forest inventory data for assessing the BWCAW blowdown. In: Greer, J. D., ed. New remote sensing technologies for resource managers; Proceedings of the 11th Forest Service Remote Sensing Applications Conference; 24-28 April 2006; Salt Lake City, UT. American Society for Photogrammetry and Remote Sensing: 8 p. CD-ROM.
Nelson, M. D.; Moser, W. K.; Healey, S.; Hansen, M. H.; Cohen, W. 2008. Analyzing Landsat time series data across adjacent Path/Rows and across multiple cycles of FIA: lessons learned in southern Missouri. In: McWilliams, Will; Moisen, Gretchen; Czaplewski, Ray, comps. 2008. Forest Inventory and Analysis (FIA) Symposium 2008; 2008 October 21-23; Park City, UT. Proc. RMRS-P-56CD. Fort Collins, CO: U.S. Department of Agriculture, Forest Service, Rocky Mountain Research Station. CD-ROM.
Parker, J. 1951. Natural reproduction from red cedar. Journal of Forestry. 49:285.
Parker, J. 1952. Establishment of eastern red cedar by direct seeding. Journal of Forestry. 50:914–917.
Schopmeyer C.S. (ed). 1974. Seeds of woody plants in the United States. Agricultural Handbook 450. Washington, D.C.: U.S. Dept. Agric., For. Serv., 883 pp.
Spencer, J. S., Jr.; Roussopoulos, S. M.; Massengale, R. A. 1992. Missouri’s forest resource, 1989: an analysis. Resour. Bull. NC-139. St. Paul, MN: U.S. Department of Agriculture, Forest Service, North Central Forest Experiment Station. 84 p.
USDA Forest Service Proceedings – RMRS-P-56 14.