TRENDS IN 3PL / CUSTOMER 3PL/CUSTOMER RELATIONSHIPS
46
TRENDS IN 3PL / CUSTOMER RELATIONSHIPS November 2016 Phone: +1-800-525-3915 Website: www.3plogistics.com Email: [email protected] TRENDS IN 3PL/CUSTOMER RELATIONSHIPS 2017 May 2017
Transcript of TRENDS IN 3PL / CUSTOMER 3PL/CUSTOMER RELATIONSHIPS
TRENDS IN 3PL / CUSTOMER RELATIONSHIPS
November 2016
Phone: +1-800-525-3915 Website: www.3plogistics.com Email: [email protected]
TRENDS IN 3PL/CUSTOMER RELATIONSHIPS2017
May 2017
All Rights Reserved.
No part of this publication may be reproduced, stored in a retrieval system or transmitted in any form by any means, electronic, mechanical, photocopied, recorded or otherwise, without the prior permission of the publisher, Armstrong & Associates, Inc.
The facts of this report are believed to be correct at the time of publication but cannot be guaranteed. Please note that the findings, conclusions and recommendations that Armstrong & Associates delivers will be based on information gathered in good faith from both primary and secondary sources, whose accuracy we are not always in a position to guarantee. As such, Armstrong & Associates can accept no liability whatsoever for actions taken based on any information that may subsequently prove to be incorrect.
©2017 Armstrong & Associates
ABOUT ARMSTRONG & ASSOCIATES, INC.Armstrong & Associates, Inc. (A&A) was established in 1980 to meet the needs of a newly deregulated domestic transportation market. Since then, through its leading Third-Party Logistics (3PL) market research and history of helping companies outsource logistics functions, A&A has become an internationally recognized key resource for 3PL market information and consulting.
A&A’s mission is to have leading proprietary supply chain knowledge and market research not available anywhere else. As proof of our continued work in supporting our mission, A&A’s 3PL market research is frequently cited in media articles, publications, and securities filings by publicly traded 3PLs. In addition, A&A’s email newsletter currently has over 40,000 subscribers globally.
A&A’s market research complements its consulting activities by providing continually updated data for analysis. Based upon its unsurpassed knowledge of the 3PL market and the operations of leading 3PLs, A&A has provided strategic planning consulting services to over 30 3PLs, supported 17 closed investment transactions, and provided advice to numerous companies looking to benchmark existing 3PL operations or outsource logistics functions.
©2017 Armstrong & Associates
ContentsIntroduction 13PL Value-Added Services 1Domestic 3PL Revenues Overview 6Global 3PL Revenues Overview 12Services 19Industries 23
Automotive 23Retailing 25Technological 27Food and Groceries 29
Regions 33Countries 35
China 36France 37Germany 38Hong Kong 39Japan 40Mexico 41Brazil 42
1©2017 Armstrong & Associates
INTRODUCTION
IntroductionEach year we analyze our research database of third-party logistics provider (3PL) customer relationships to gain insights into customer logistics outsourcing trends and overall market dynamics. This report is based on an analysis of more than 7,200 current 3PL customer relationships in our database. These relationships are based in 41 countries and represent nearly 20,000 services. Many of these relationships are explained in detail in the cases section of our Who’s Who in Logistics 3PL guide.
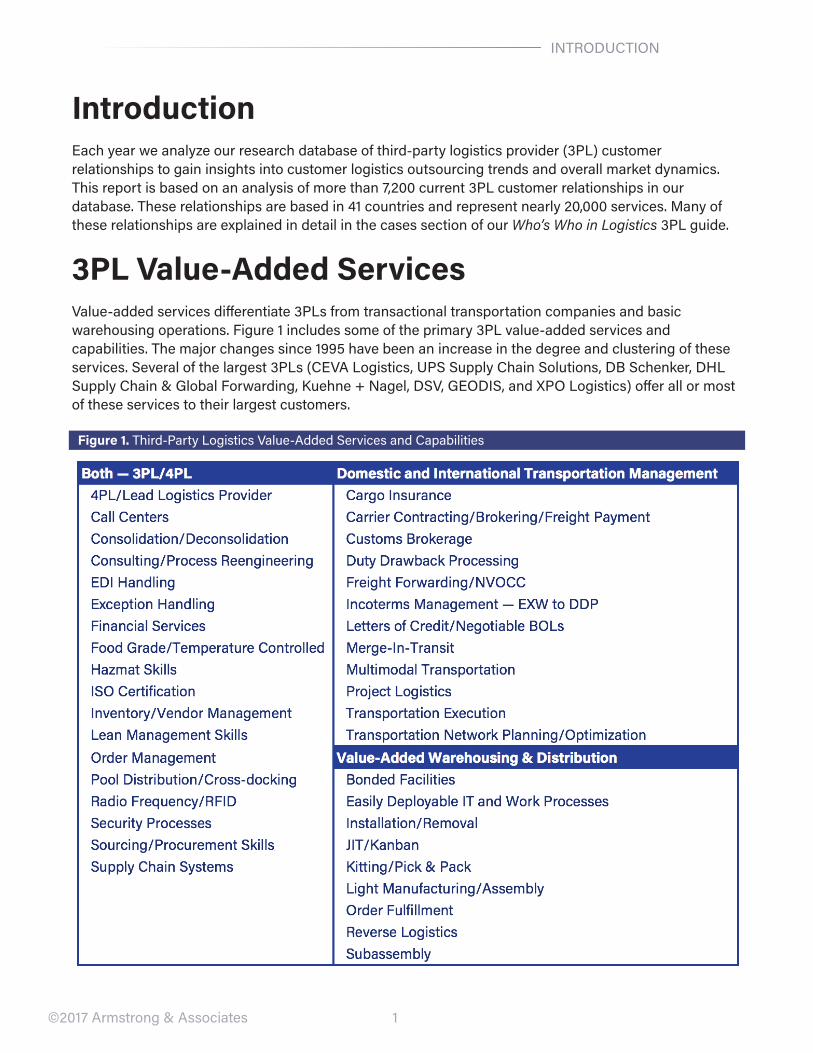
3PL Value-Added ServicesValue-added services differentiate 3PLs from transactional transportation companies and basic warehousing operations. Figure 1 includes some of the primary 3PL value-added services and capabilities. The major changes since 1995 have been an increase in the degree and clustering of these services. Several of the largest 3PLs (CEVA Logistics, UPS Supply Chain Solutions, DB Schenker, DHL Supply Chain & Global Forwarding, Kuehne + Nagel, DSV, GEODIS, and XPO Logistics) offer all or most of these services to their largest customers.
Figure 1. Third-Party Logistics Value-Added Services and Capabilities
2©2017 Armstrong & Associates
3PL VALUE-ADDED SERVICES
The key competitive differentiators among 3PLs include supply chain management systems capabilities, operations management skills, and logistics engineering expertise. Most tier-one 3PLs have implemented integrated systems platforms to support global transportation and warehouse management operations. These platforms offer internet visibility and exception handling capabilities combined with transportation management functionality for the daily management of orders, customer inventory, and the optimization of thousands of shipments across large geographical areas. The same 3PLs can run value-added warehousing operations, perform supply chain network analysis and design, and manage call center and fulfillment operations. Several 3PLs have expanded their global scope to provide significant coverage in those countries which make up the majority of the world’s gross domestic product. With the continued expansion of major 3PLs, often via acquisition, integration of operational pieces is a significant initiative. Approximately 15 3PLs have built the network scale required to offer single-source global solutions to large multinational companies. These Global Supply Chain Managers (GSCMs) can be expected to become increasingly dominant over the next few years.
The size of 3PL accounts varies in net revenues from a few hundred thousand dollars to over $500 million. Major 3PL contracts with Fortune 100 companies regularly exceed $50 million per year. Most of these $50 million-and-greater accounts are with automotive and high-tech companies.
Traditionally, large 3PLs steer away from accounts of less than $5 million in purchased transportation, or warehousing and distribution management. Smaller accounts with transportation management needs often turn to freight-brokerage-centric domestic transportation management 3PLs such as C.H. Robinson, Total Quality Logistics, Coyote Logistics, or Echo Global Logistics. Our experience shows that these small accounts tend to be more profitable on a gross margin percentage basis and change 3PLs less often.
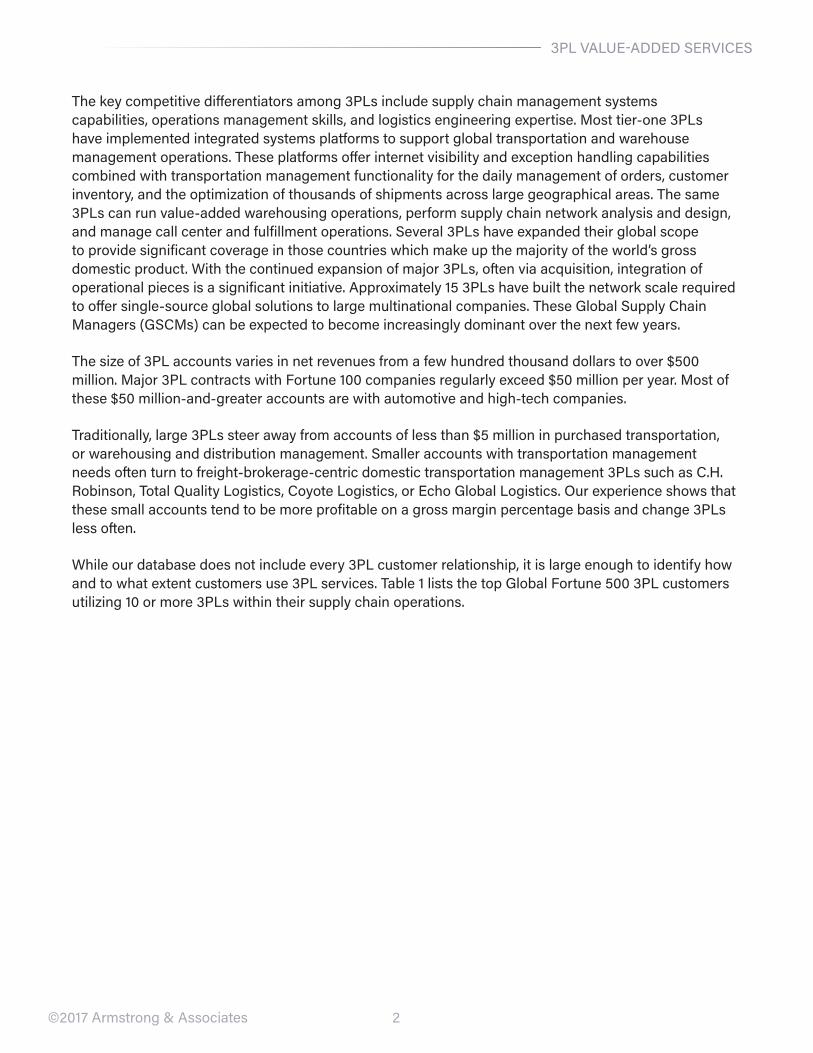
While our database does not include every 3PL customer relationship, it is large enough to identify how and to what extent customers use 3PL services. Table 1 lists the top Global Fortune 500 3PL customers utilizing 10 or more 3PLs within their supply chain operations.
3
3PL VALUE-ADDED SERVICES
©2017 Armstrong & Associates
Table 1. Top Global Fortune 500 Buyers of 3PL Services
4
3PL VALUE-ADDED SERVICES
©2017 Armstrong & Associates
Wal-Mart Stores ranks first in 3PL use with 63 3PL relationships. Globally, Damco International, Yusen Logistics, DHL Supply Chain & Global Forwarding, Cargo Services Far East Limited, and XPO Logistics are significant players in Wal-Mart’s supply chain. Domestically, it utilizes the services of C.H. Robinson, and GEODIS/OHL for a host of services from transportation management to value-added warehousing. With extensive import, warehousing, and transportation management needs, Wal-Mart leans heavily upon 3PLs in managing its global operations.
Volkswagen, seventh on the Global Fortune 500 list, ranks second in 3PL use with 57 3PL relationships. Key global 3PLs servicing Volkswagen include Imperial Logistics, TRADISA, arvato, ARS Altmann, and BLG Logistics Group. Domestically, syncreon provides a full suite of services for Volkswagen.
Nestlé ranks 66th in Global Fortune 500 revenues and third in overall 3PL use with 55 3PL relationships. Global 3PLs providing services to Nestlé include Ryder Supply Chain Solutions, CEVA Logistics, Americold, JSL, NFI, and VersaCold Logistics Services.
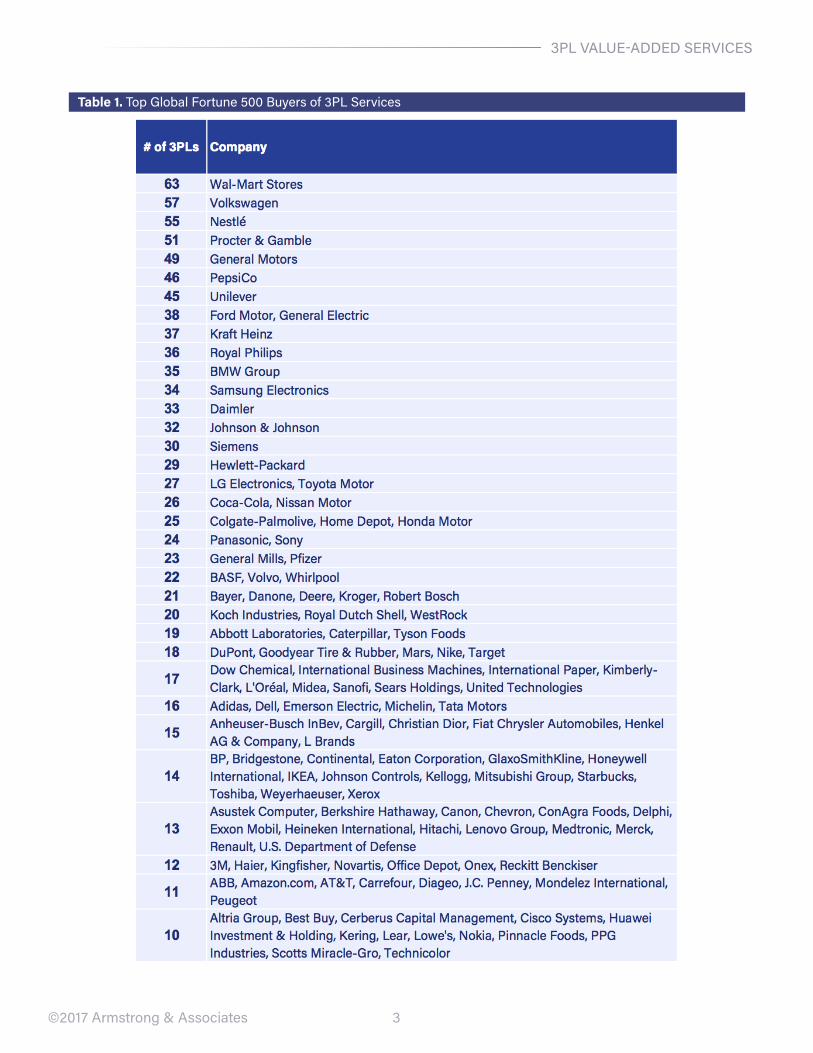
Not all Fortune 500 companies have business models that would require the services of a 3PL. We have excluded most Advertising, Financial, Insurance, Real Estate, Utilities and Waste companies from our analysis. Domestic Fortune 500 use of 3PLs is shown in Figure 2.
Figure 2. Domestic Fortune 500 Use of 3PLs 2008 – 2016
In 2016, 90% of Domestic Fortune 500 companies worked with at least one 3PL. This is a significant increase from our initial tracking in 2001, when only 46% of the companies had 3PL relationships. The increase reiterates the ongoing trend for companies to outsource logistics functions to 3PLs in order to control costs and increase supply chain efficiency. As Figure 2 shows, company size continues to be a good predictor of 3PL use. The larger the company, the more likely it will have at least one relationship with a 3PL. In addition, larger companies utilize more services from 3PLs than smaller ones, which we discuss later in this report.
In our analysis of 3PL use, there is some inter-year variation due to changes in the mix of customer
5
3PL VALUE-ADDED SERVICES
©2017 Armstrong & Associates
relationships being reported by 3PLs and shifts in the Fortune rankings. There is also some underreporting of customer relationships in all categories; this is usually attributed to confidentiality agreements preventing 3PLs from naming customers. However, the overall trend shows a significant increase in the penetration of all Fortune 500 companies by 3PLs since 2008. The increase is largest in the Fortune 401–500 group, as smaller companies increasingly recognize the strategic importance of 3PL relationships and services. The increase from 2012 to 2016 is smallest in the Fortune 1–100 group, which has maxed out at 97%. Since 2012, the largest change occurred in the Fortune 101–200 group. The majority of companies in this group (94%) now have 3PL relationships—nearly as many as the top 100 companies. The overall pattern of increases in each group indicates a significant trend of smaller companies outsourcing more functions to 3PLs over the last eight years.
In a shift from initial 3PL sales strategies emphasizing relationships with large Fortune 500 accounts, most 3PLs are now also pursuing smaller accounts, which offer the potential for strategic relationships with better profit margins.
Trends indicate continued awareness to the benefits of using 3PLs among Fortune 101–1,000 companies. This growth should hold over the foreseeable future. Since 2010, 3PLs developed business at an average of two to three times the rate of growth in the U.S. economy. Growth was diluted in 2015 due to lower fuel prices, which negatively impacted fuel surcharge revenue, while ample carrier capacity decreased demand for Domestic Transportation Managers. The overall U.S. 3PL market growth was 2.2% in 2015 and 3.5% in 2016. Employment growth has been a bright spot and has created a solid base of consumer spending. Credit availability has generated spending on premium items such as motor vehicles, residential housing, and nonresidential construction.
The increased 3PL usage described above is consistent with information from our other ongoing 3PL market research. Our estimate of 3PL penetration of the total potential U.S. 3PL market is 21%, up from 10% in 2002. This compares to current 3PL market penetration rates of 22% in Europe and 16% in the Asia Pacific. Consistent with the increased U.S. market penetration is our estimate of total U.S. 3PL revenues increasing from $65.3 billion in 2001 to $166.8 billion in 2016.
6©2017 Armstrong & Associates
DOMESTIC 3PL REVENUES
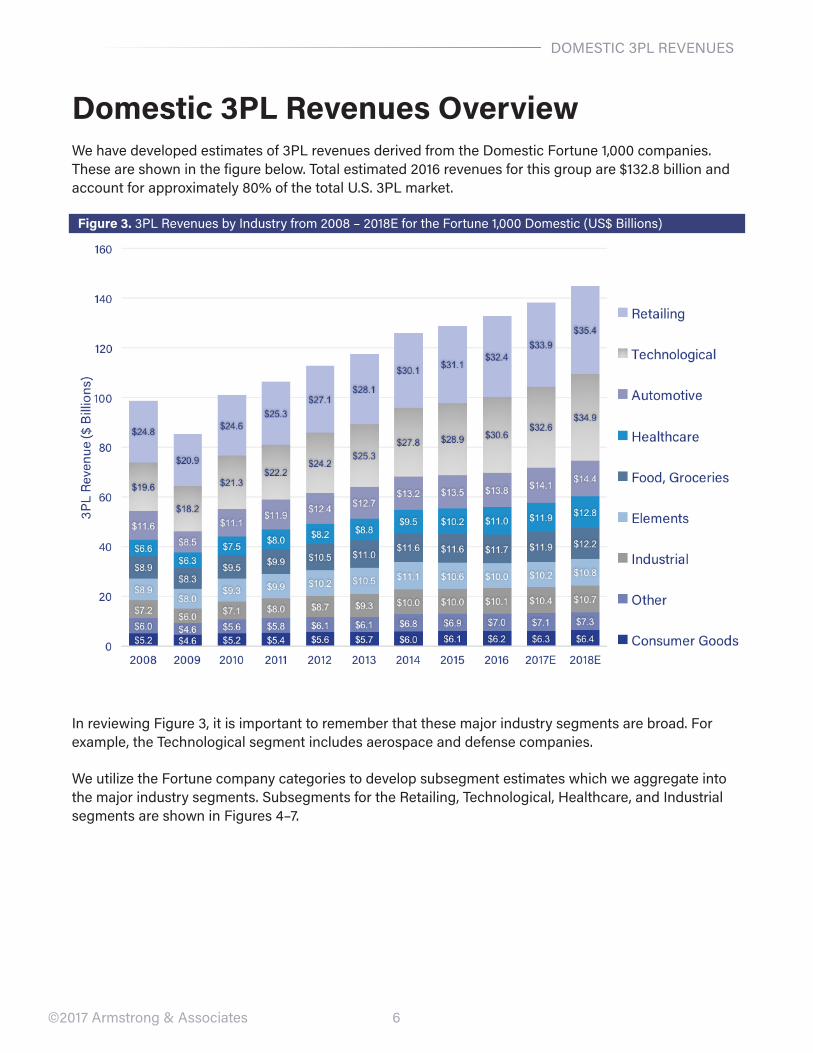
Domestic 3PL Revenues OverviewWe have developed estimates of 3PL revenues derived from the Domestic Fortune 1,000 companies. These are shown in the figure below. Total estimated 2016 revenues for this group are $132.8 billion and account for approximately 80% of the total U.S. 3PL market.
Figure 3. 3PL Revenues by Industry from 2008 – 2018E for the Fortune 1,000 Domestic (US$ Billions)
In reviewing Figure 3, it is important to remember that these major industry segments are broad. For example, the Technological segment includes aerospace and defense companies.
We utilize the Fortune company categories to develop subsegment estimates which we aggregate into the major industry segments. Subsegments for the Retailing, Technological, Healthcare, and Industrial segments are shown in Figures 4–7.
7©2017 Armstrong & Associates
DOMESTIC 3PL REVENUES
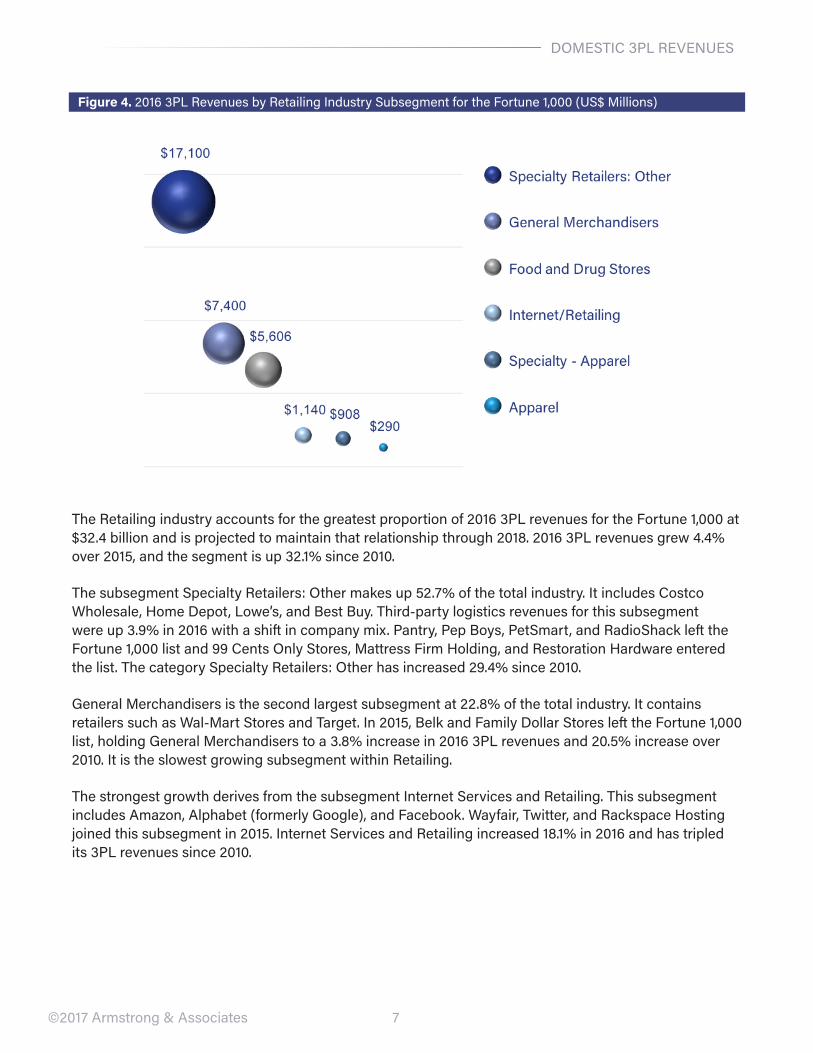
Figure 4. 2016 3PL Revenues by Retailing Industry Subsegment for the Fortune 1,000 (US$ Millions)
The Retailing industry accounts for the greatest proportion of 2016 3PL revenues for the Fortune 1,000 at $32.4 billion and is projected to maintain that relationship through 2018. 2016 3PL revenues grew 4.4% over 2015, and the segment is up 32.1% since 2010.
The subsegment Specialty Retailers: Other makes up 52.7% of the total industry. It includes Costco Wholesale, Home Depot, Lowe’s, and Best Buy. Third-party logistics revenues for this subsegment were up 3.9% in 2016 with a shift in company mix. Pantry, Pep Boys, PetSmart, and RadioShack left the Fortune 1,000 list and 99 Cents Only Stores, Mattress Firm Holding, and Restoration Hardware entered the list. The category Specialty Retailers: Other has increased 29.4% since 2010.
General Merchandisers is the second largest subsegment at 22.8% of the total industry. It contains retailers such as Wal-Mart Stores and Target. In 2015, Belk and Family Dollar Stores left the Fortune 1,000 list, holding General Merchandisers to a 3.8% increase in 2016 3PL revenues and 20.5% increase over 2010. It is the slowest growing subsegment within Retailing.
The strongest growth derives from the subsegment Internet Services and Retailing. This subsegment includes Amazon, Alphabet (formerly Google), and Facebook. Wayfair, Twitter, and Rackspace Hosting joined this subsegment in 2015. Internet Services and Retailing increased 18.1% in 2016 and has tripled its 3PL revenues since 2010.
8©2017 Armstrong & Associates
DOMESTIC 3PL REVENUES
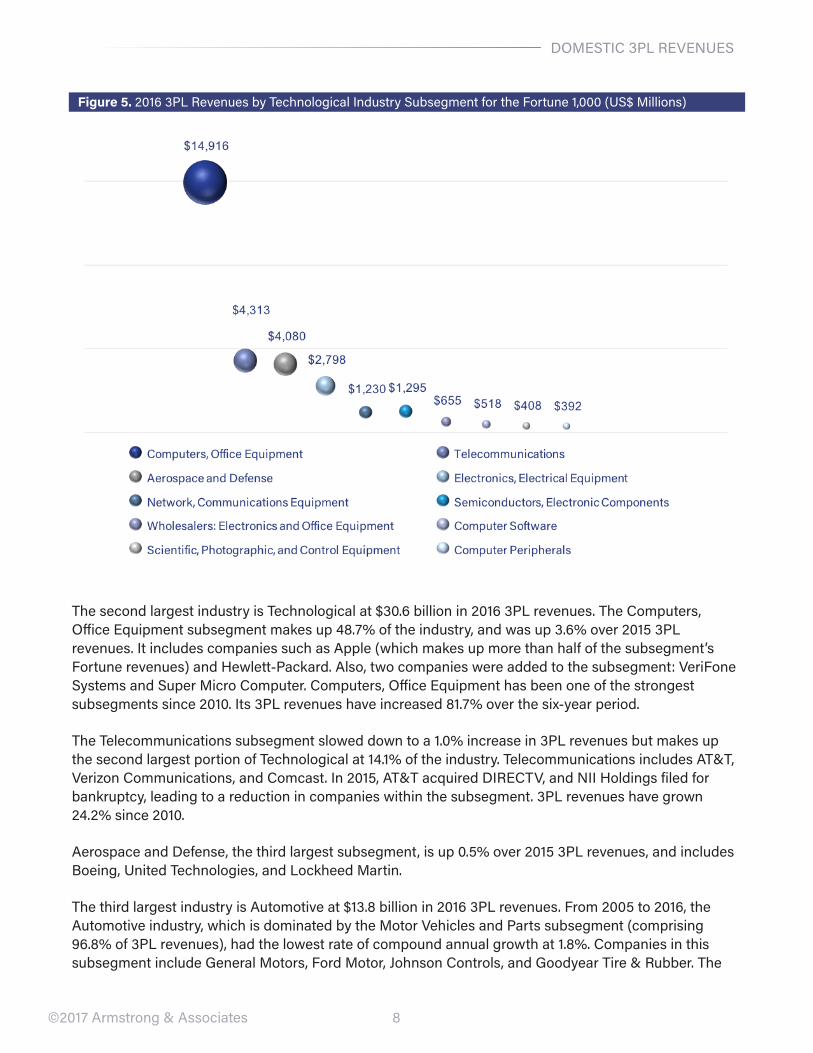
Figure 5. 2016 3PL Revenues by Technological Industry Subsegment for the Fortune 1,000 (US$ Millions)
The second largest industry is Technological at $30.6 billion in 2016 3PL revenues. The Computers, Office Equipment subsegment makes up 48.7% of the industry, and was up 3.6% over 2015 3PL revenues. It includes companies such as Apple (which makes up more than half of the subsegment’s Fortune revenues) and Hewlett-Packard. Also, two companies were added to the subsegment: VeriFone Systems and Super Micro Computer. Computers, Office Equipment has been one of the strongest subsegments since 2010. Its 3PL revenues have increased 81.7% over the six-year period.
The Telecommunications subsegment slowed down to a 1.0% increase in 3PL revenues but makes up the second largest portion of Technological at 14.1% of the industry. Telecommunications includes AT&T, Verizon Communications, and Comcast. In 2015, AT&T acquired DIRECTV, and NII Holdings filed for bankruptcy, leading to a reduction in companies within the subsegment. 3PL revenues have grown 24.2% since 2010.
Aerospace and Defense, the third largest subsegment, is up 0.5% over 2015 3PL revenues, and includes Boeing, United Technologies, and Lockheed Martin.
The third largest industry is Automotive at $13.8 billion in 2016 3PL revenues. From 2005 to 2016, the Automotive industry, which is dominated by the Motor Vehicles and Parts subsegment (comprising 96.8% of 3PL revenues), had the lowest rate of compound annual growth at 1.8%. Companies in this subsegment include General Motors, Ford Motor, Johnson Controls, and Goodyear Tire & Rubber. The
9
DOMESTIC 3PL REVENUES
©2017 Armstrong & Associates
industry felt the largest negative effect of the Great Recession of 2009 when year-over-year spending with 3PLs dropped over 27%. Automotive surpassed its 2007 3PL spending levels in 2012 and has grown 24.2% since 2010. Automotive is up 2.1% over 2015 3PL revenues.
Table 2. Compound Annual Growth Rates (CAGRs) by Industry for the Fortune 1,000 Domestic
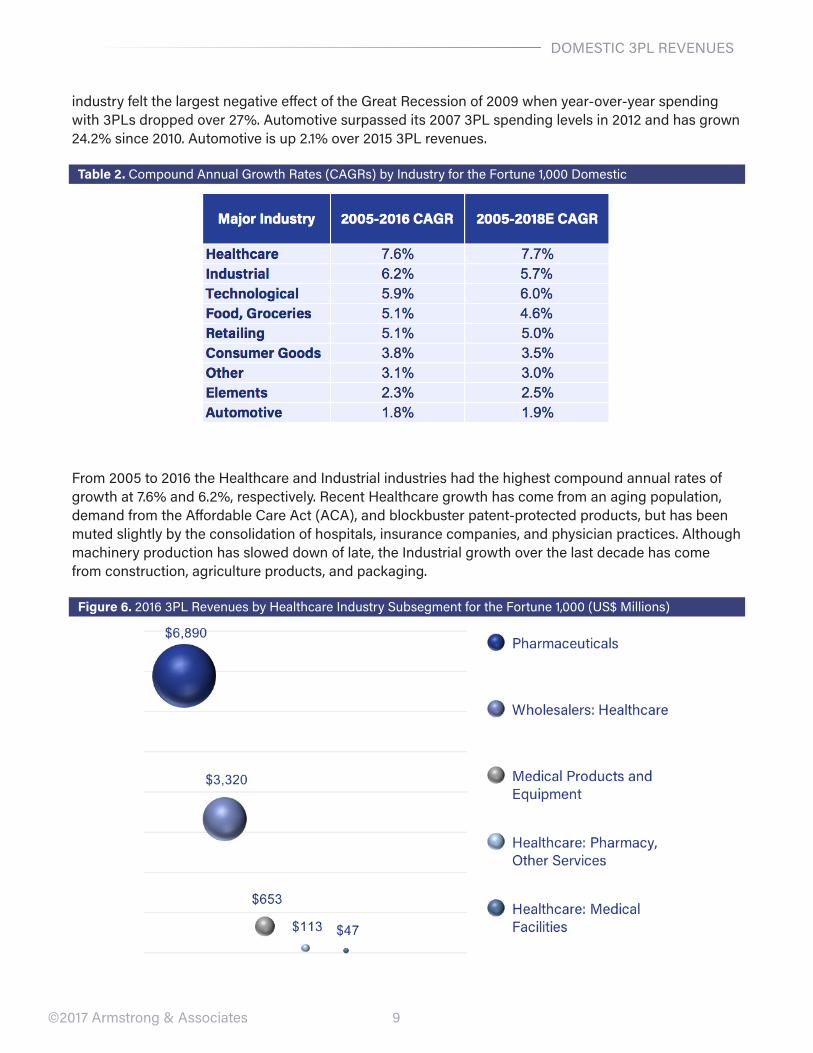
From 2005 to 2016 the Healthcare and Industrial industries had the highest compound annual rates of growth at 7.6% and 6.2%, respectively. Recent Healthcare growth has come from an aging population, demand from the Affordable Care Act (ACA), and blockbuster patent-protected products, but has been muted slightly by the consolidation of hospitals, insurance companies, and physician practices. Although machinery production has slowed down of late, the Industrial growth over the last decade has come from construction, agriculture products, and packaging.
Figure 6. 2016 3PL Revenues by Healthcare Industry Subsegment for the Fortune 1,000 (US$ Millions)
10
DOMESTIC 3PL REVENUES
©2017 Armstrong & Associates
The Healthcare industry’s Pharmaceuticals subsegment includes Johnson & Johnson, Merck, and Pfizer and accounts for 62.5% of industry 3PL revenues. In 2015, the top companies were down while the remainder, such as AbbVie and Gilead Sciences, pulled up the overall subsegment. Pharmaceuticals increased 6.6% over 2015 3PL revenues. The Wholesalers: Healthcare subsegment makes up 30.1% of Healthcare 3PL revenues and grew 10.3% over 2015. McKesson, AmerisourceBergen, and Cardinal Health generated growth for the subsegment. Wholesalers: Healthcare is up 72.6% since 2010.
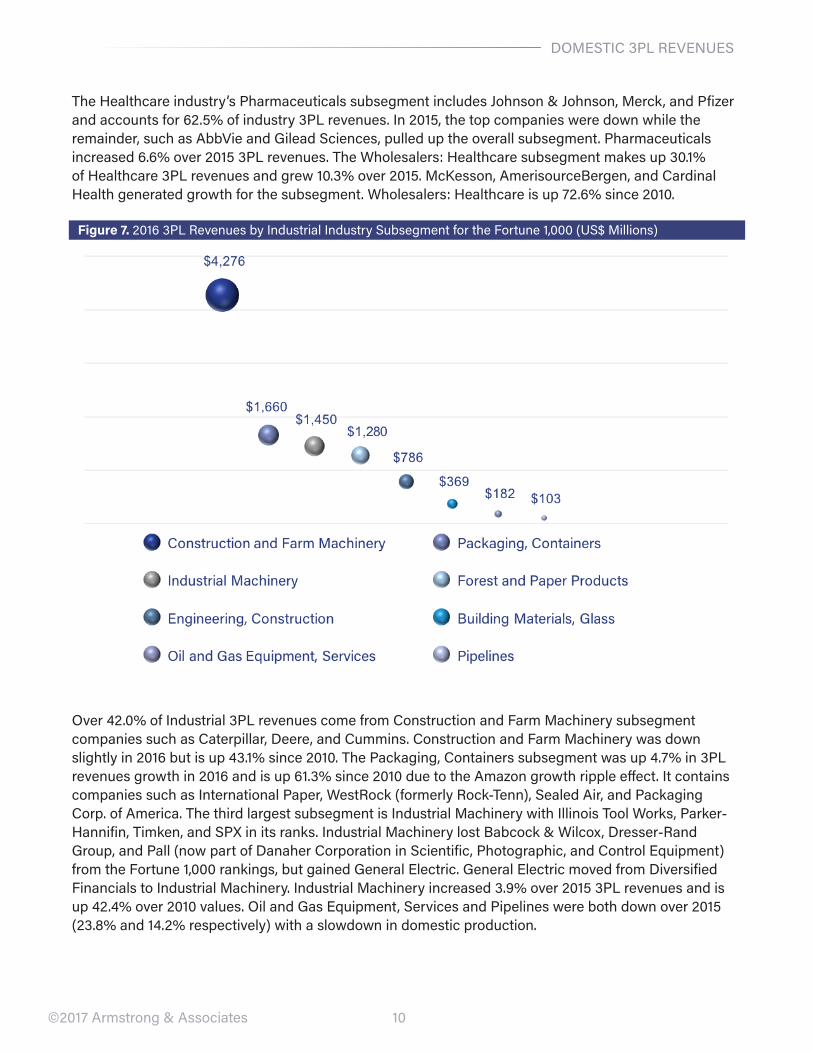
Figure 7. 2016 3PL Revenues by Industrial Industry Subsegment for the Fortune 1,000 (US$ Millions)
Over 42.0% of Industrial 3PL revenues come from Construction and Farm Machinery subsegment companies such as Caterpillar, Deere, and Cummins. Construction and Farm Machinery was down slightly in 2016 but is up 43.1% since 2010. The Packaging, Containers subsegment was up 4.7% in 3PL revenues growth in 2016 and is up 61.3% since 2010 due to the Amazon growth ripple effect. It contains companies such as International Paper, WestRock (formerly Rock-Tenn), Sealed Air, and Packaging Corp. of America. The third largest subsegment is Industrial Machinery with Illinois Tool Works, Parker-Hannifin, Timken, and SPX in its ranks. Industrial Machinery lost Babcock & Wilcox, Dresser-Rand Group, and Pall (now part of Danaher Corporation in Scientific, Photographic, and Control Equipment) from the Fortune 1,000 rankings, but gained General Electric. General Electric moved from Diversified Financials to Industrial Machinery. Industrial Machinery increased 3.9% over 2015 3PL revenues and is up 42.4% over 2010 values. Oil and Gas Equipment, Services and Pipelines were both down over 2015 (23.8% and 14.2% respectively) with a slowdown in domestic production.
11
GLOBAL 3PL REVENUES
©2017 Armstrong & Associates
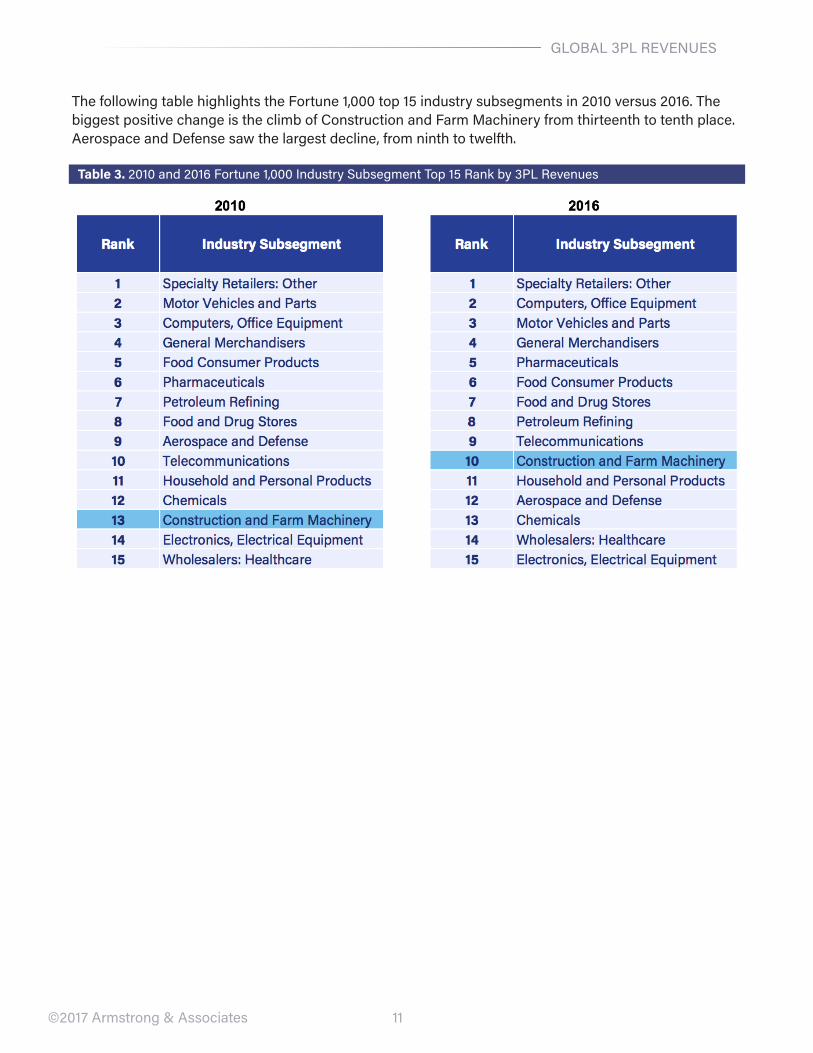
The following table highlights the Fortune 1,000 top 15 industry subsegments in 2010 versus 2016. The biggest positive change is the climb of Construction and Farm Machinery from thirteenth to tenth place. Aerospace and Defense saw the largest decline, from ninth to twelfth.
Table 3. 2010 and 2016 Fortune 1,000 Industry Subsegment Top 15 Rank by 3PL Revenues
12
GLOBAL 3PL REVENUES
©2017 Armstrong & Associates
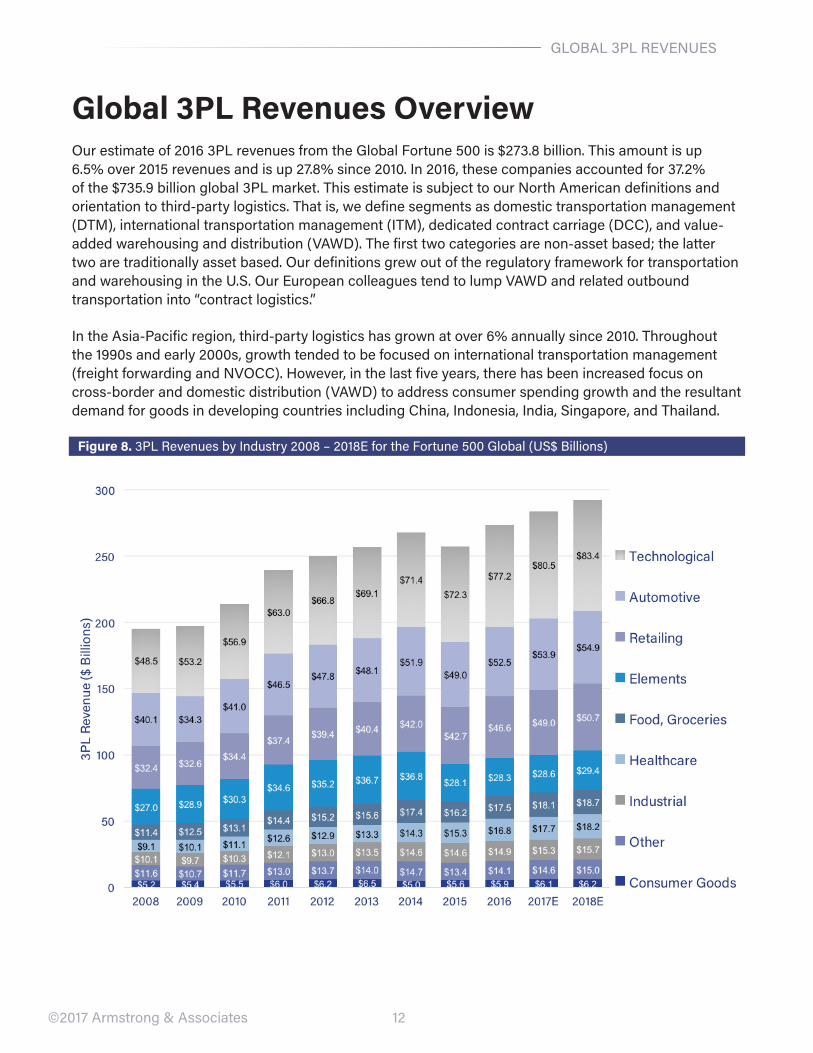
Global 3PL Revenues OverviewOur estimate of 2016 3PL revenues from the Global Fortune 500 is $273.8 billion. This amount is up 6.5% over 2015 revenues and is up 27.8% since 2010. In 2016, these companies accounted for 37.2% of the $735.9 billion global 3PL market. This estimate is subject to our North American definitions and orientation to third-party logistics. That is, we define segments as domestic transportation management (DTM), international transportation management (ITM), dedicated contract carriage (DCC), and value-added warehousing and distribution (VAWD). The first two categories are non-asset based; the latter two are traditionally asset based. Our definitions grew out of the regulatory framework for transportation and warehousing in the U.S. Our European colleagues tend to lump VAWD and related outbound transportation into “contract logistics.”
In the Asia-Pacific region, third-party logistics has grown at over 6% annually since 2010. Throughout the 1990s and early 2000s, growth tended to be focused on international transportation management (freight forwarding and NVOCC). However, in the last five years, there has been increased focus on cross-border and domestic distribution (VAWD) to address consumer spending growth and the resultant demand for goods in developing countries including China, Indonesia, India, Singapore, and Thailand.
Figure 8. 3PL Revenues by Industry 2008 – 2018E for the Fortune 500 Global (US$ Billions)
13
GLOBAL 3PL REVENUES
©2017 Armstrong & Associates
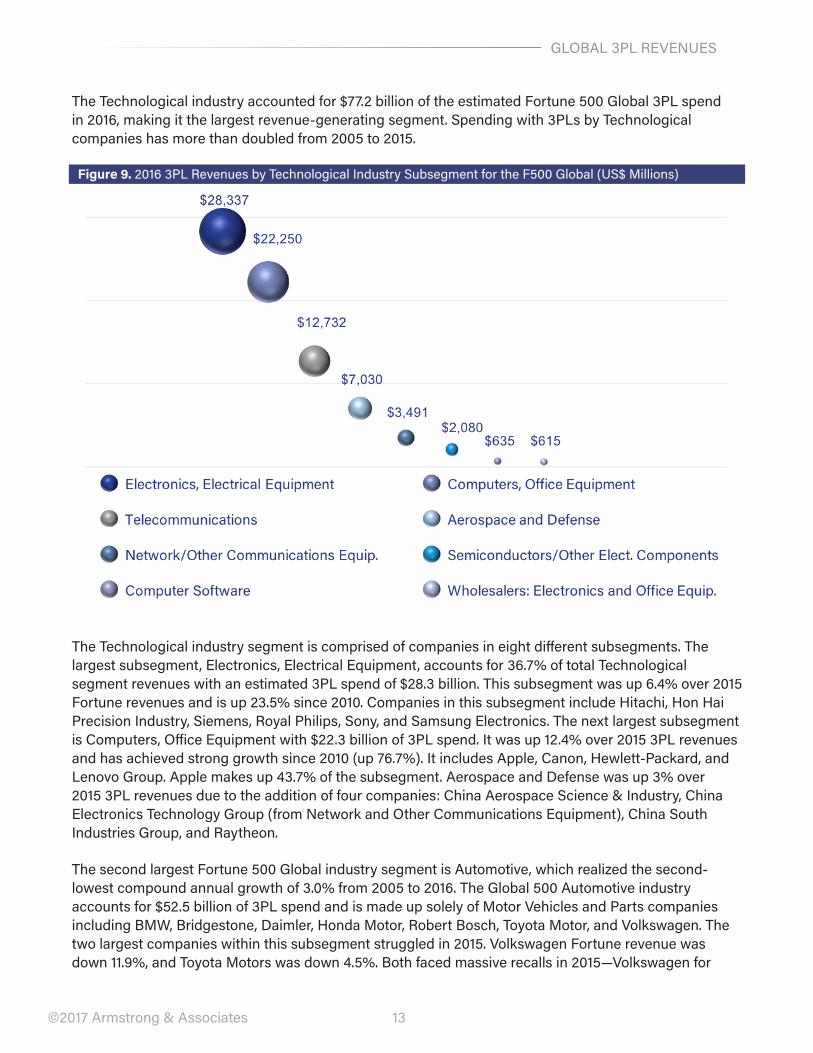
The Technological industry accounted for $77.2 billion of the estimated Fortune 500 Global 3PL spend in 2016, making it the largest revenue-generating segment. Spending with 3PLs by Technological companies has more than doubled from 2005 to 2015.
Figure 9. 2016 3PL Revenues by Technological Industry Subsegment for the F500 Global (US$ Millions)
The Technological industry segment is comprised of companies in eight different subsegments. The largest subsegment, Electronics, Electrical Equipment, accounts for 36.7% of total Technological segment revenues with an estimated 3PL spend of $28.3 billion. This subsegment was up 6.4% over 2015 Fortune revenues and is up 23.5% since 2010. Companies in this subsegment include Hitachi, Hon Hai Precision Industry, Siemens, Royal Philips, Sony, and Samsung Electronics. The next largest subsegment is Computers, Office Equipment with $22.3 billion of 3PL spend. It was up 12.4% over 2015 3PL revenues and has achieved strong growth since 2010 (up 76.7%). It includes Apple, Canon, Hewlett-Packard, and Lenovo Group. Apple makes up 43.7% of the subsegment. Aerospace and Defense was up 3% over 2015 3PL revenues due to the addition of four companies: China Aerospace Science & Industry, China Electronics Technology Group (from Network and Other Communications Equipment), China South Industries Group, and Raytheon.
The second largest Fortune 500 Global industry segment is Automotive, which realized the second-lowest compound annual growth of 3.0% from 2005 to 2016. The Global 500 Automotive industry accounts for $52.5 billion of 3PL spend and is made up solely of Motor Vehicles and Parts companies including BMW, Bridgestone, Daimler, Honda Motor, Robert Bosch, Toyota Motor, and Volkswagen. The two largest companies within this subsegment struggled in 2015. Volkswagen Fortune revenue was down 11.9%, and Toyota Motors was down 4.5%. Both faced massive recalls in 2015—Volkswagen for
14
GLOBAL 3PL REVENUES
©2017 Armstrong & Associates
its emissions recall, and Toyota Motors for the Takata airbags recall. Still, the Automotive category as a whole is up 7.2% over 2015 and 28.2% since 2010.
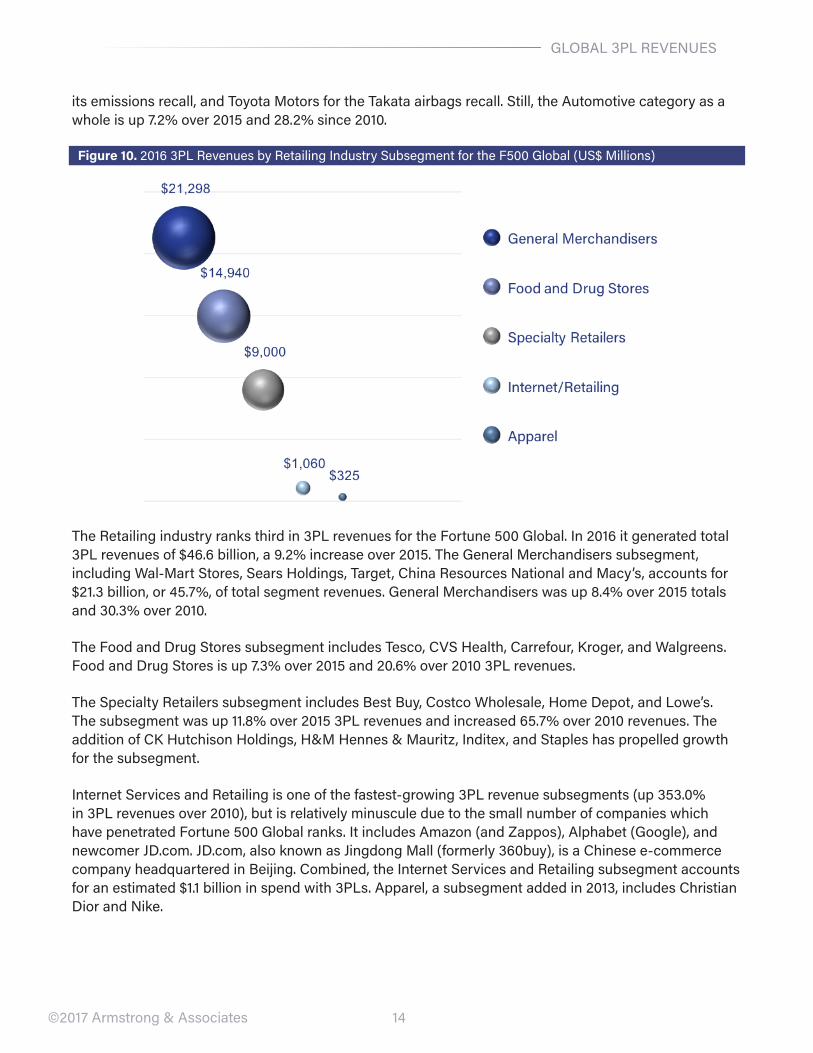
Figure 10. 2016 3PL Revenues by Retailing Industry Subsegment for the F500 Global (US$ Millions)
The Retailing industry ranks third in 3PL revenues for the Fortune 500 Global. In 2016 it generated total 3PL revenues of $46.6 billion, a 9.2% increase over 2015. The General Merchandisers subsegment, including Wal-Mart Stores, Sears Holdings, Target, China Resources National and Macy’s, accounts for $21.3 billion, or 45.7%, of total segment revenues. General Merchandisers was up 8.4% over 2015 totals and 30.3% over 2010.
The Food and Drug Stores subsegment includes Tesco, CVS Health, Carrefour, Kroger, and Walgreens. Food and Drug Stores is up 7.3% over 2015 and 20.6% over 2010 3PL revenues.
The Specialty Retailers subsegment includes Best Buy, Costco Wholesale, Home Depot, and Lowe’s. The subsegment was up 11.8% over 2015 3PL revenues and increased 65.7% over 2010 revenues. The addition of CK Hutchison Holdings, H&M Hennes & Mauritz, Inditex, and Staples has propelled growth for the subsegment.
Internet Services and Retailing is one of the fastest-growing 3PL revenue subsegments (up 353.0% in 3PL revenues over 2010), but is relatively minuscule due to the small number of companies which have penetrated Fortune 500 Global ranks. It includes Amazon (and Zappos), Alphabet (Google), and newcomer JD.com. JD.com, also known as Jingdong Mall (formerly 360buy), is a Chinese e-commerce company headquartered in Beijing. Combined, the Internet Services and Retailing subsegment accounts for an estimated $1.1 billion in spend with 3PLs. Apparel, a subsegment added in 2013, includes Christian Dior and Nike.
15
GLOBAL 3PL REVENUES
©2017 Armstrong & Associates
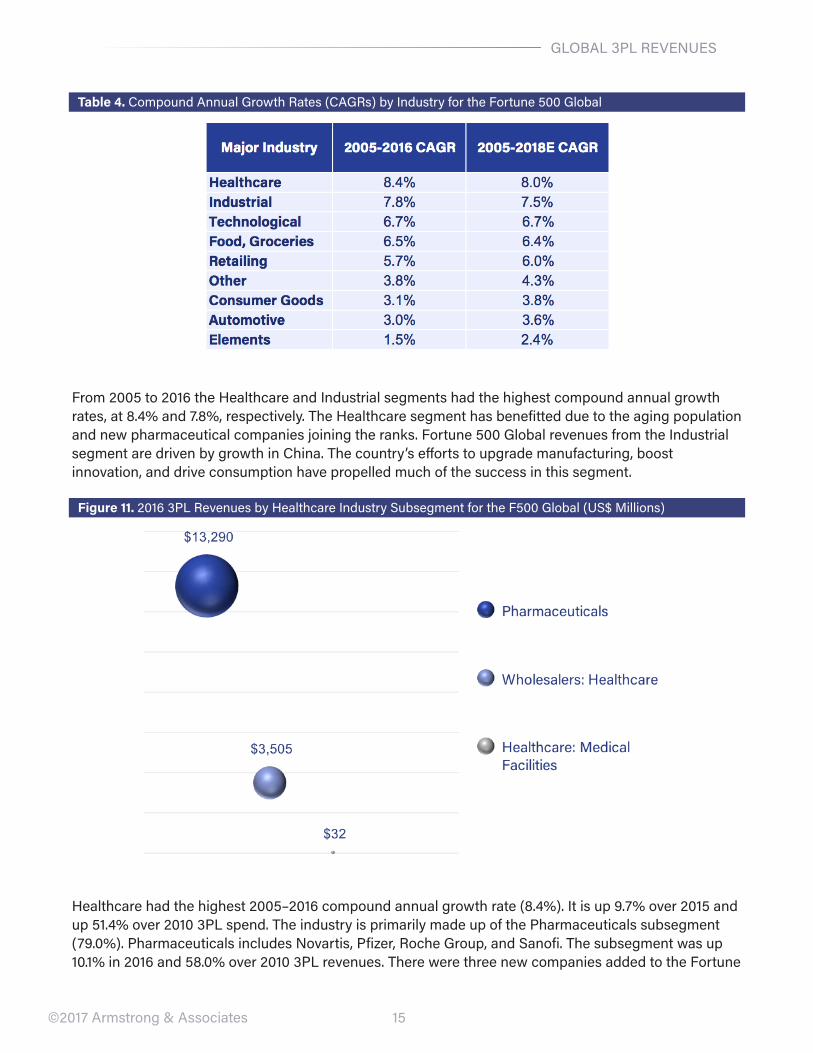
Table 4. Compound Annual Growth Rates (CAGRs) by Industry for the Fortune 500 Global
From 2005 to 2016 the Healthcare and Industrial segments had the highest compound annual growth rates, at 8.4% and 7.8%, respectively. The Healthcare segment has benefitted due to the aging population and new pharmaceutical companies joining the ranks. Fortune 500 Global revenues from the Industrial segment are driven by growth in China. The country’s efforts to upgrade manufacturing, boost innovation, and drive consumption have propelled much of the success in this segment.
Figure 11. 2016 3PL Revenues by Healthcare Industry Subsegment for the F500 Global (US$ Millions)
Healthcare had the highest 2005–2016 compound annual growth rate (8.4%). It is up 9.7% over 2015 and up 51.4% over 2010 3PL spend. The industry is primarily made up of the Pharmaceuticals subsegment (79.0%). Pharmaceuticals includes Novartis, Pfizer, Roche Group, and Sanofi. The subsegment was up 10.1% in 2016 and 58.0% over 2010 3PL revenues. There were three new companies added to the Fortune
16
GLOBAL 3PL REVENUES
©2017 Armstrong & Associates
ranking: AbbVie, Amgen, and Bayer. Wholesalers: Healthcare makes up 20.8% and includes McKesson, AmerisourceBergen, and Cardinal Health. Wholesalers: Healthcare was up 8.5% over 2015 and is up 53.8% over 2010 3PL revenues.
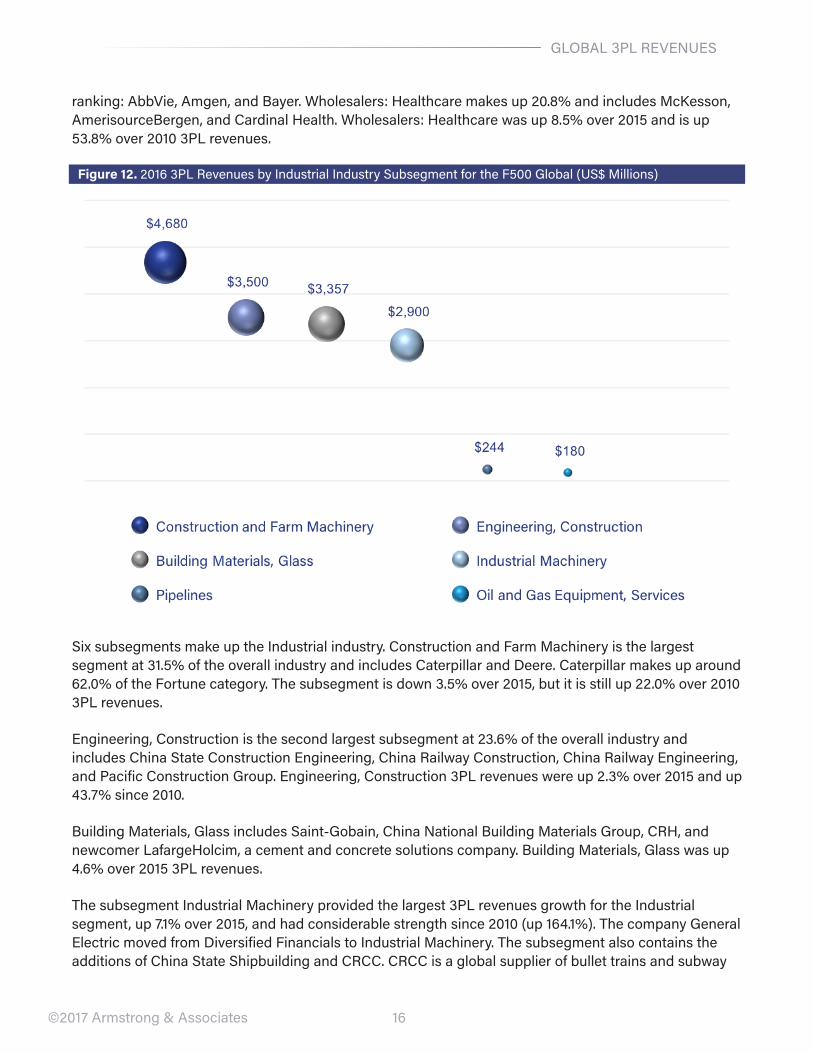
Figure 12. 2016 3PL Revenues by Industrial Industry Subsegment for the F500 Global (US$ Millions)
Six subsegments make up the Industrial industry. Construction and Farm Machinery is the largest segment at 31.5% of the overall industry and includes Caterpillar and Deere. Caterpillar makes up around 62.0% of the Fortune category. The subsegment is down 3.5% over 2015, but it is still up 22.0% over 2010 3PL revenues.
Engineering, Construction is the second largest subsegment at 23.6% of the overall industry and includes China State Construction Engineering, China Railway Construction, China Railway Engineering, and Pacific Construction Group. Engineering, Construction 3PL revenues were up 2.3% over 2015 and up 43.7% since 2010.
Building Materials, Glass includes Saint-Gobain, China National Building Materials Group, CRH, and newcomer LafargeHolcim, a cement and concrete solutions company. Building Materials, Glass was up 4.6% over 2015 3PL revenues.
The subsegment Industrial Machinery provided the largest 3PL revenues growth for the Industrial segment, up 7.1% over 2015, and had considerable strength since 2010 (up 164.1%). The company General Electric moved from Diversified Financials to Industrial Machinery. The subsegment also contains the additions of China State Shipbuilding and CRCC. CRCC is a global supplier of bullet trains and subway
17
GLOBAL 3PL REVENUES
©2017 Armstrong & Associates
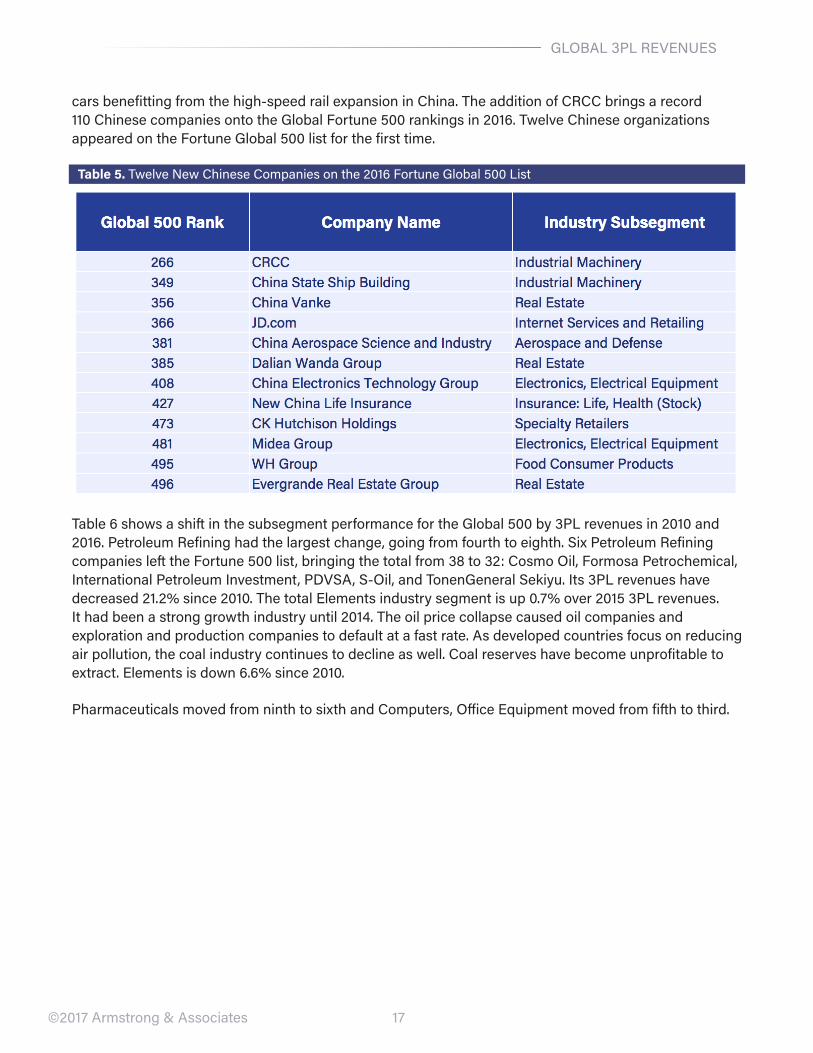
cars benefitting from the high-speed rail expansion in China. The addition of CRCC brings a record 110 Chinese companies onto the Global Fortune 500 rankings in 2016. Twelve Chinese organizations appeared on the Fortune Global 500 list for the first time.
Table 5. Twelve New Chinese Companies on the 2016 Fortune Global 500 List
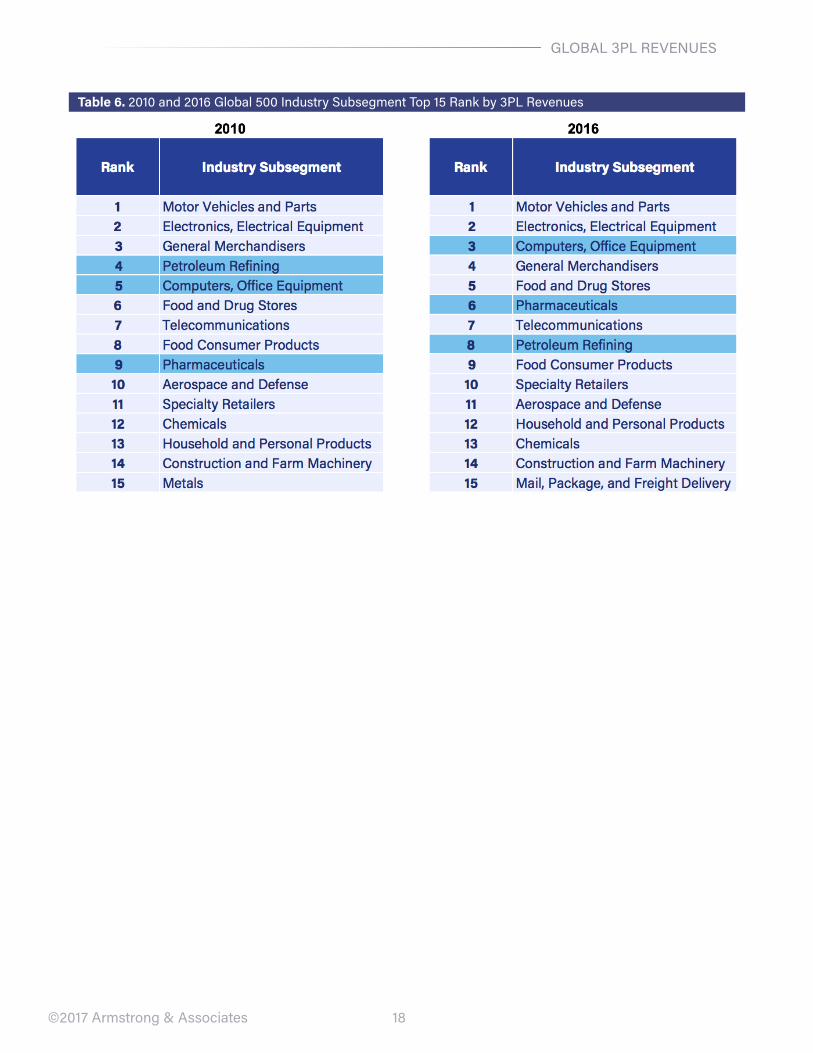
Table 6 shows a shift in the subsegment performance for the Global 500 by 3PL revenues in 2010 and 2016. Petroleum Refining had the largest change, going from fourth to eighth. Six Petroleum Refining companies left the Fortune 500 list, bringing the total from 38 to 32: Cosmo Oil, Formosa Petrochemical, International Petroleum Investment, PDVSA, S-Oil, and TonenGeneral Sekiyu. Its 3PL revenues have decreased 21.2% since 2010. The total Elements industry segment is up 0.7% over 2015 3PL revenues. It had been a strong growth industry until 2014. The oil price collapse caused oil companies and exploration and production companies to default at a fast rate. As developed countries focus on reducing air pollution, the coal industry continues to decline as well. Coal reserves have become unprofitable to extract. Elements is down 6.6% since 2010.
Pharmaceuticals moved from ninth to sixth and Computers, Office Equipment moved from fifth to third.
18
GLOBAL 3PL REVENUES
©2017 Armstrong & Associates
Table 6. 2010 and 2016 Global 500 Industry Subsegment Top 15 Rank by 3PL Revenues
19
SERVICES
©2017 Armstrong & Associates
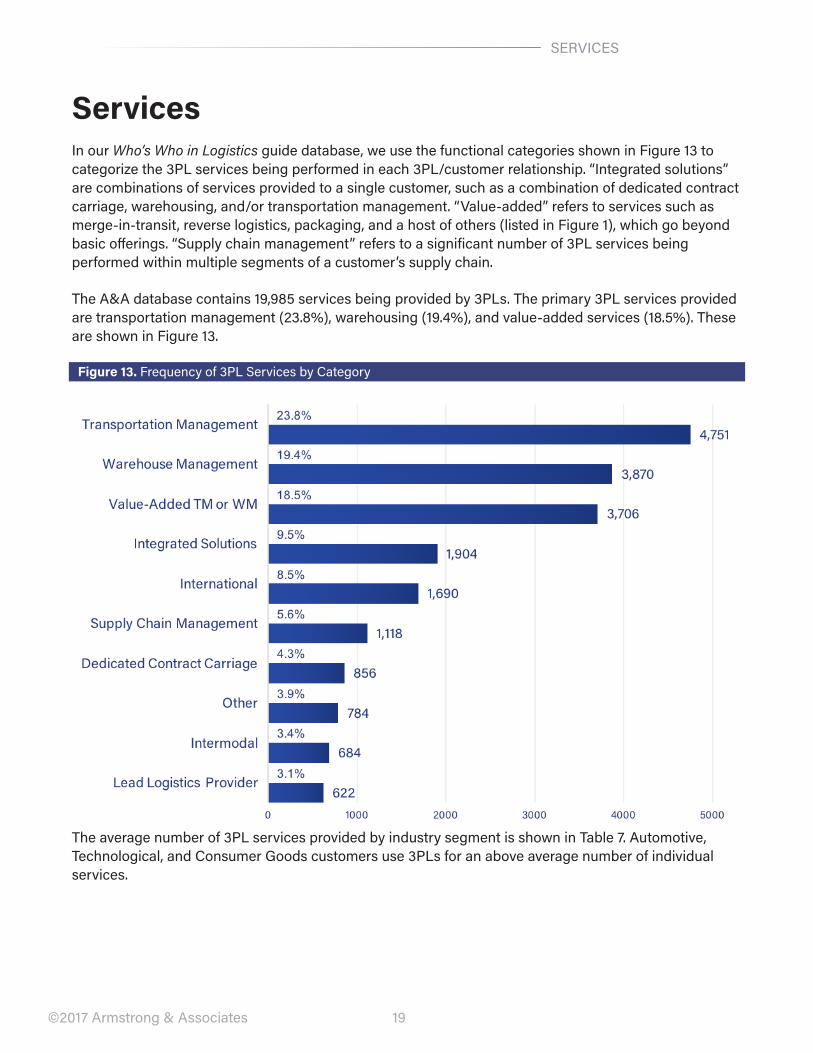
ServicesIn our Who’s Who in Logistics guide database, we use the functional categories shown in Figure 13 to categorize the 3PL services being performed in each 3PL/customer relationship. “Integrated solutions” are combinations of services provided to a single customer, such as a combination of dedicated contract carriage, warehousing, and/or transportation management. “Value-added” refers to services such as merge-in-transit, reverse logistics, packaging, and a host of others (listed in Figure 1), which go beyond basic offerings. “Supply chain management” refers to a significant number of 3PL services being performed within multiple segments of a customer’s supply chain.
The A&A database contains 19,985 services being provided by 3PLs. The primary 3PL services provided are transportation management (23.8%), warehousing (19.4%), and value-added services (18.5%). These are shown in Figure 13.
Figure 13. Frequency of 3PL Services by Category
The average number of 3PL services provided by industry segment is shown in Table 7. Automotive, Technological, and Consumer Goods customers use 3PLs for an above average number of individual services.
20
SERVICES
©2017 Armstrong & Associates
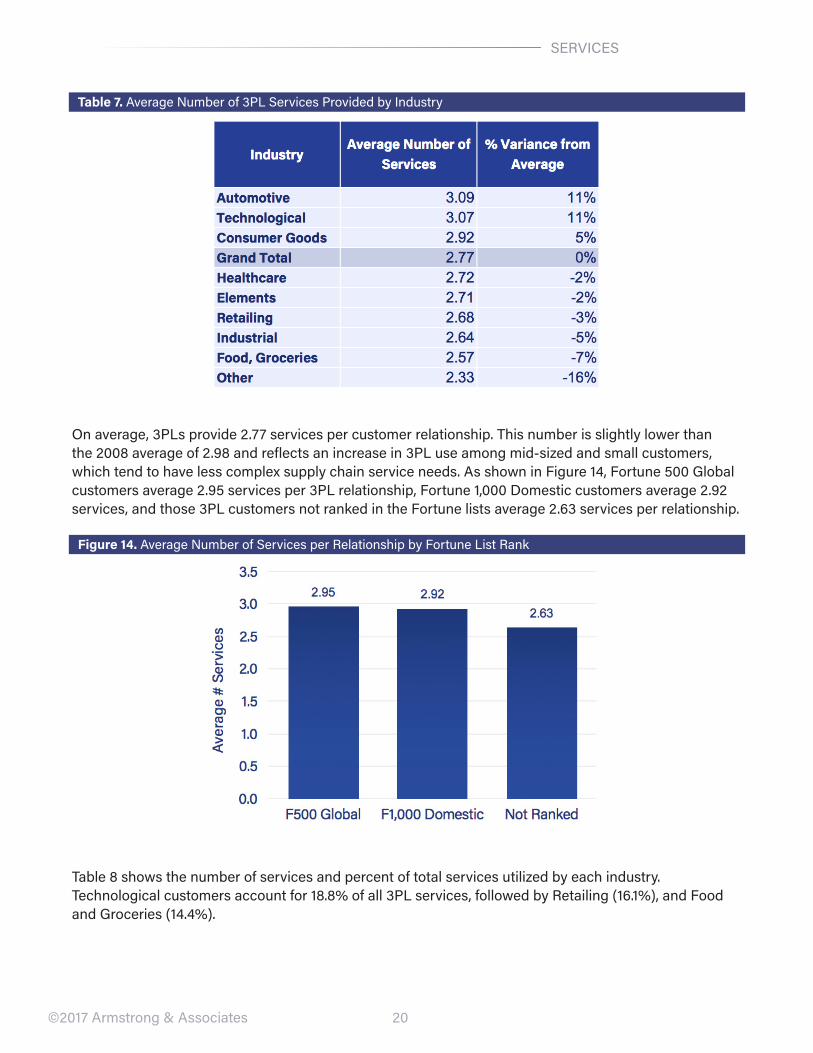
Table 7. Average Number of 3PL Services Provided by Industry
On average, 3PLs provide 2.77 services per customer relationship. This number is slightly lower than the 2008 average of 2.98 and reflects an increase in 3PL use among mid-sized and small customers, which tend to have less complex supply chain service needs. As shown in Figure 14, Fortune 500 Global customers average 2.95 services per 3PL relationship, Fortune 1,000 Domestic customers average 2.92 services, and those 3PL customers not ranked in the Fortune lists average 2.63 services per relationship.
Figure 14. Average Number of Services per Relationship by Fortune List Rank
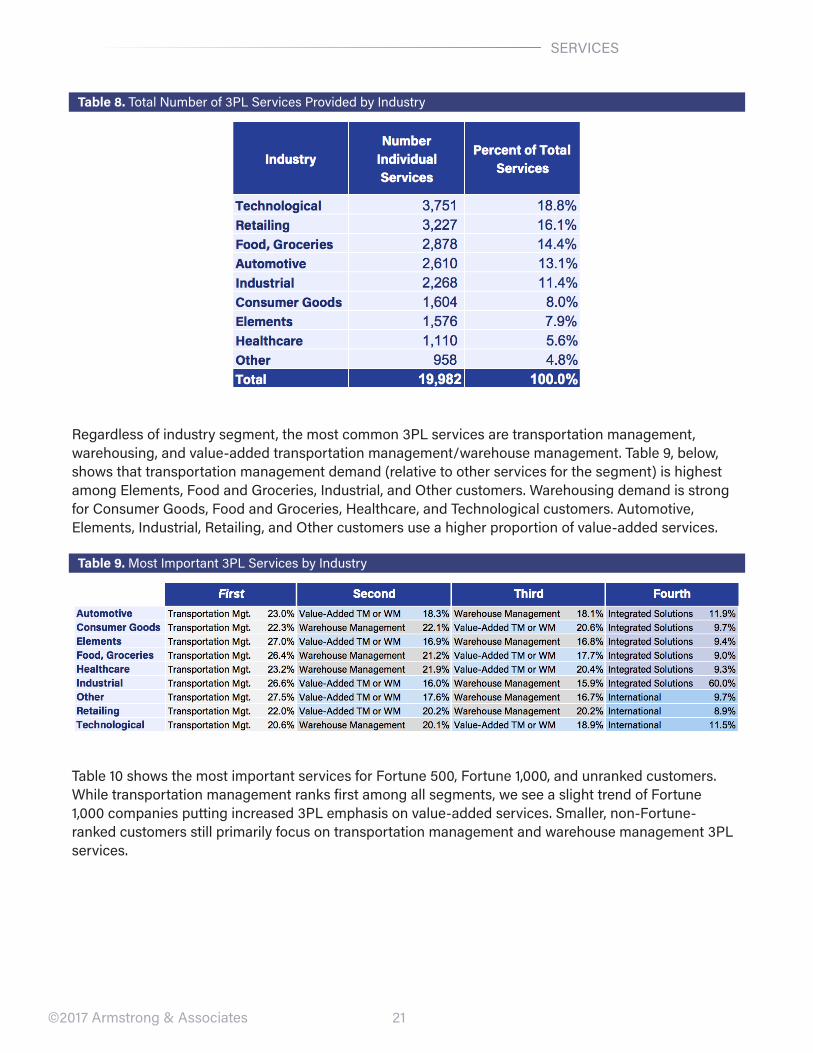
Table 8 shows the number of services and percent of total services utilized by each industry. Technological customers account for 18.8% of all 3PL services, followed by Retailing (16.1%), and Food and Groceries (14.4%).
21
SERVICES
©2017 Armstrong & Associates
Table 8. Total Number of 3PL Services Provided by Industry
Regardless of industry segment, the most common 3PL services are transportation management, warehousing, and value-added transportation management/warehouse management. Table 9, below, shows that transportation management demand (relative to other services for the segment) is highest among Elements, Food and Groceries, Industrial, and Other customers. Warehousing demand is strong for Consumer Goods, Food and Groceries, Healthcare, and Technological customers. Automotive, Elements, Industrial, Retailing, and Other customers use a higher proportion of value-added services.
Table 9. Most Important 3PL Services by Industry
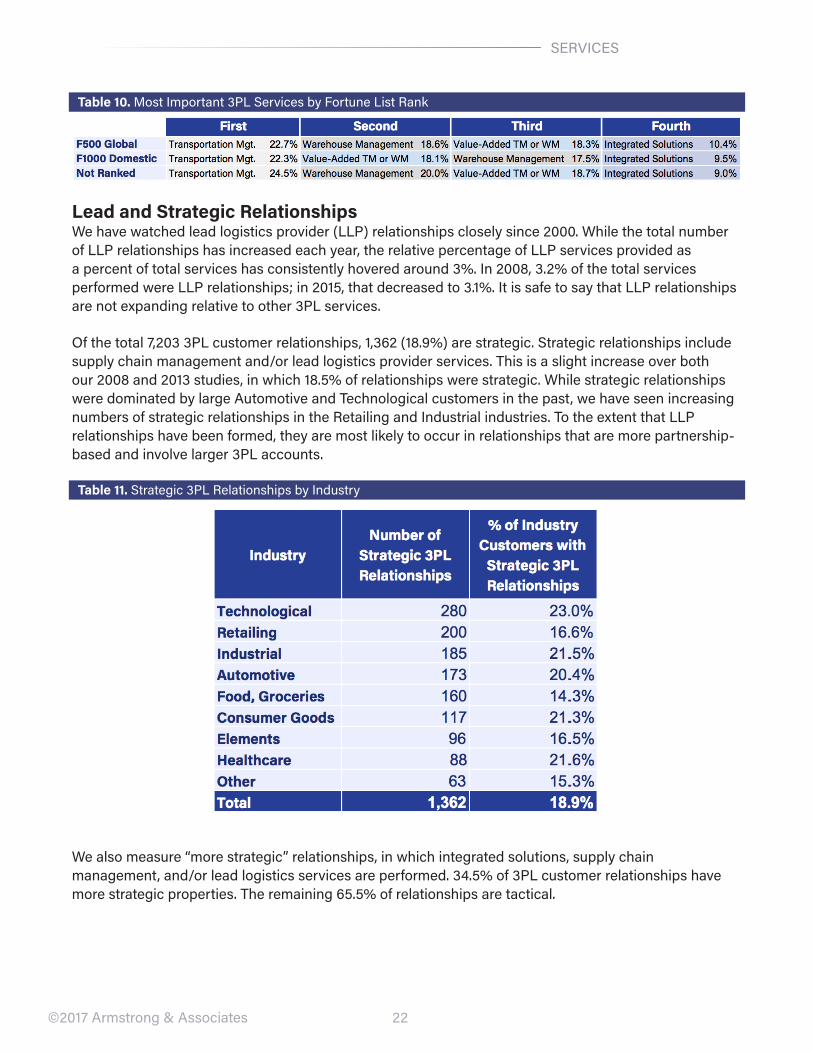
Table 10 shows the most important services for Fortune 500, Fortune 1,000, and unranked customers. While transportation management ranks first among all segments, we see a slight trend of Fortune 1,000 companies putting increased 3PL emphasis on value-added services. Smaller, non-Fortune-ranked customers still primarily focus on transportation management and warehouse management 3PL services.
22
SERVICES
©2017 Armstrong & Associates
Table 10. Most Important 3PL Services by Fortune List Rank
Lead and Strategic RelationshipsWe have watched lead logistics provider (LLP) relationships closely since 2000. While the total number of LLP relationships has increased each year, the relative percentage of LLP services provided as a percent of total services has consistently hovered around 3%. In 2008, 3.2% of the total services performed were LLP relationships; in 2015, that decreased to 3.1%. It is safe to say that LLP relationships are not expanding relative to other 3PL services.
Of the total 7,203 3PL customer relationships, 1,362 (18.9%) are strategic. Strategic relationships include supply chain management and/or lead logistics provider services. This is a slight increase over both our 2008 and 2013 studies, in which 18.5% of relationships were strategic. While strategic relationships were dominated by large Automotive and Technological customers in the past, we have seen increasing numbers of strategic relationships in the Retailing and Industrial industries. To the extent that LLP relationships have been formed, they are most likely to occur in relationships that are more partnership-based and involve larger 3PL accounts.
Table 11. Strategic 3PL Relationships by Industry
We also measure “more strategic” relationships, in which integrated solutions, supply chain management, and/or lead logistics services are performed. 34.5% of 3PL customer relationships have more strategic properties. The remaining 65.5% of relationships are tactical.
23©2017 Armstrong & Associates
INDUSTRIES
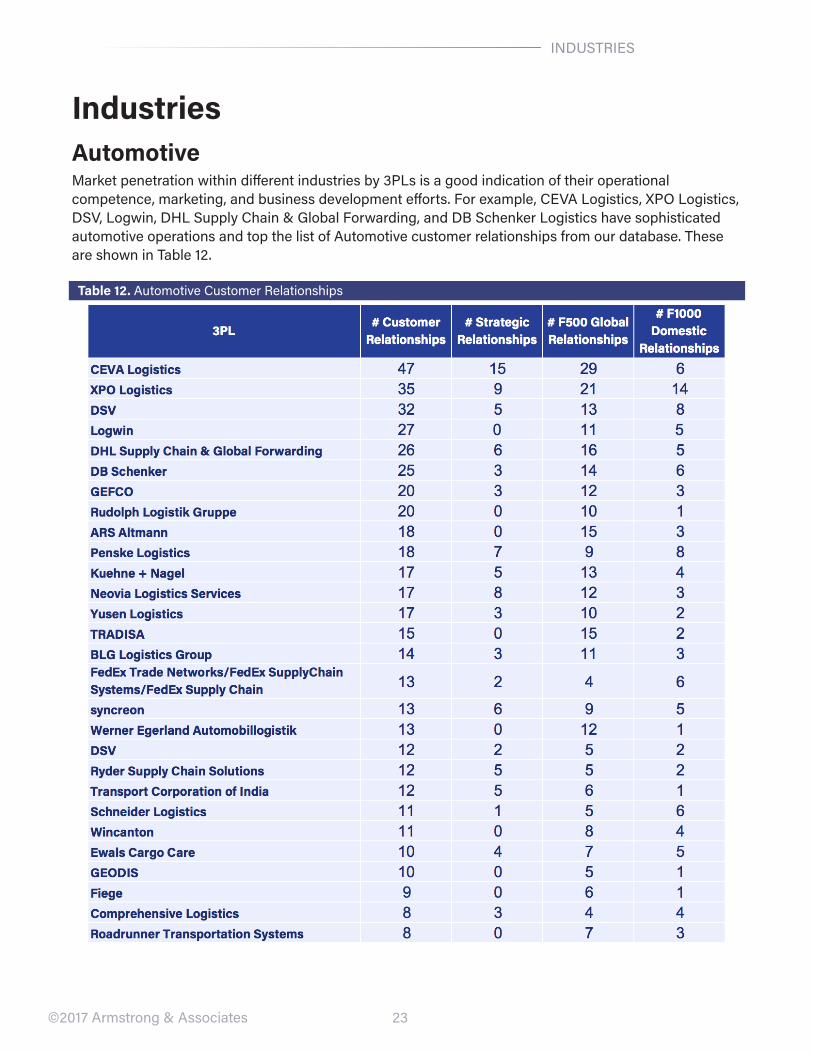
IndustriesAutomotiveMarket penetration within different industries by 3PLs is a good indication of their operational competence, marketing, and business development efforts. For example, CEVA Logistics, XPO Logistics, DSV, Logwin, DHL Supply Chain & Global Forwarding, and DB Schenker Logistics have sophisticated automotive operations and top the list of Automotive customer relationships from our database. These are shown in Table 12.
Table 12. Automotive Customer Relationships
24©2017 Armstrong & Associates
INDUSTRIES
CEVA LogisticsWith 2016 top-line revenue of $6.6 billion, CEVA Logistics is a top 10 global 3PL (servicing over 160 countries) and is one of the world’s largest automotive 3PLs. It has a heavy emphasis on manufacturing and is expanding operations in other industries. Revenue by industry is broken down as follows: Consumer/Retail - 26%, Automotive - 25%, Industrial & Aerospace - 21%, Technology - 18%, Healthcare - 5%, Energy - 4%, and Other - 1%. Recent new customer contracts have grown in the Automotive, Healthcare, Consumer Goods, and Retailing segments. Customers engage CEVA for an average of 3.06 services, and nearly a third of all customers have strategic relationships with CEVA. The average customer contract length is three years. Fiat is its largest customer. Other major automotive customers include Daimler, Ford Motor, General Motors, Honda, Michelin, and Mitsubishi.
CEVA’s core services include fulfillment centers, high-velocity cross-docks, sub-assembly, sequencing, dedicated contract transportation, and network design/redesign. Revenue is split between Contract Logistics (55%) and Freight Management (45%). The Americas account for 35% of revenues, Europe 41%, and the Asia-Pacific region 24%.
XPO LogisticsWith $8.6 billion in 2016 3PL revenue, XPO Logistics is the second largest 3PL in North America. The company has grown quickly over the last several years (including a 56% gross revenue increase from 2015 to 2016, primarily via acquisition). The company has 35 known Automotive customer relationships, and operates in 33 countries.
Major Automotive customers include Daimler, Ford Motor, General Motors, Navistar International, Takata Corporation, and Tower International.
Since 2008, XPO has made 20 acquisitions. Acquisitions completed in 2014 and 2015 include Con-way, Menlo Worldwide Logistics (VAWD, DTM), Norbert Dentressangle (VAWD, DTM, ITM), Bridge Terminal Transport, UX Specialized Logistics, New Breed Logistics, Atlantic Central Logistics, and Pacer International. Acquisitions were geared toward a particular service or purpose in the following categories: DTM including non-asset last-mile logistics and heavy goods delivery, intermodal and drayage, VAWD including e-commerce fulfillment, and asset-based less-than-truckload (LTL) transportation. In April 2017, company CEO Brad Jacobs said that the company is not planning additional mergers and acquisitions. Instead, XPO will focus on internal expansion.
XPO has two business units: Transportation and Logistics. Transportation includes DTM, ITM, LTL, and expedited. Transportation is its largest business unit at approximately 64% of the business. Logistics, the value-added warehousing and distribution business unit, was formed from its September 2014 acquisition of New Breed Logistics.
In North America (62% of total revenue), XPO provides a comprehensive service offering, including DTM, ITM, and LTL trucking. XPO’s European operations, predominantly in France, U.K., and Spain, account for 36% of total revenue. XPO is a major player in European VAWD, has the largest owned truck fleet, and is the leading LTL provider in France, U.K., Spain, and Portugal. The remaining 2% of revenue is derived from Asia and all other countries.
XPO’s primary industry verticals served are Retail (including e-commerce), comprising 26% of revenues, and Food/Beverage at 14%.
25©2017 Armstrong & Associates
INDUSTRIES
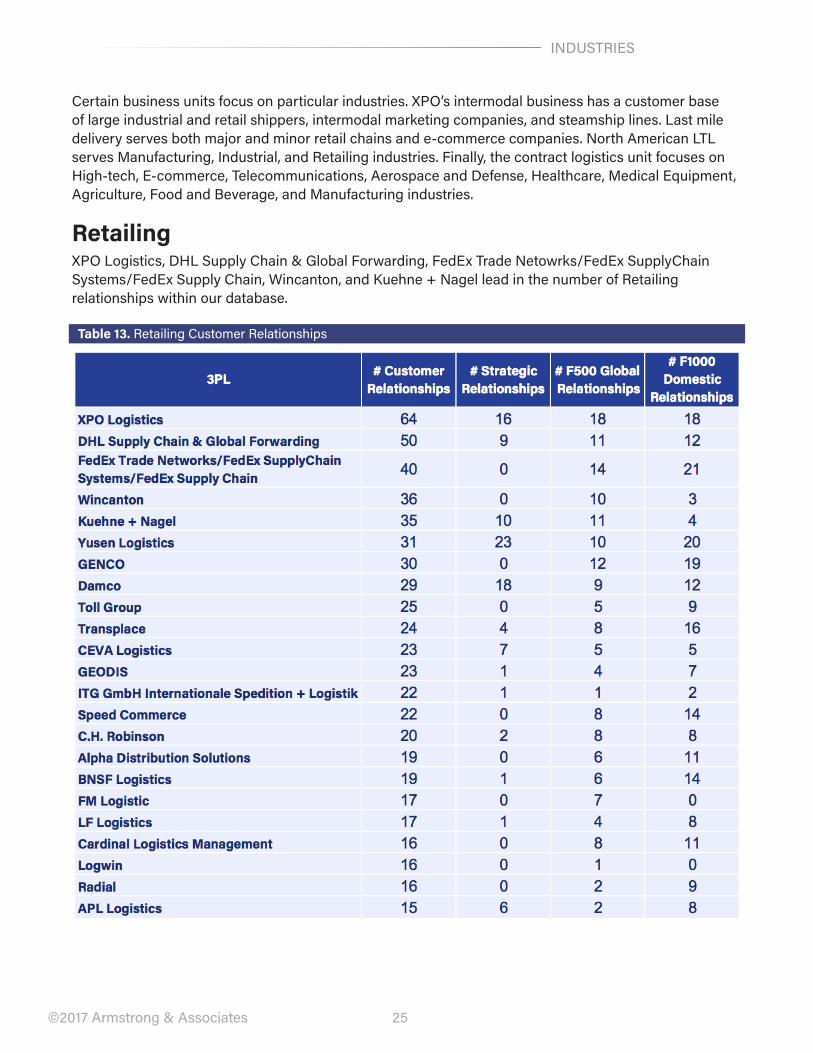
Certain business units focus on particular industries. XPO’s intermodal business has a customer base of large industrial and retail shippers, intermodal marketing companies, and steamship lines. Last mile delivery serves both major and minor retail chains and e-commerce companies. North American LTL serves Manufacturing, Industrial, and Retailing industries. Finally, the contract logistics unit focuses on High-tech, E-commerce, Telecommunications, Aerospace and Defense, Healthcare, Medical Equipment, Agriculture, Food and Beverage, and Manufacturing industries.
RetailingXPO Logistics, DHL Supply Chain & Global Forwarding, FedEx Trade Netowrks/FedEx SupplyChain Systems/FedEx Supply Chain, Wincanton, and Kuehne + Nagel lead in the number of Retailing relationships within our database.
Table 13. Retailing Customer Relationships
26©2017 Armstrong & Associates
INDUSTRIES
XPOXPO is profiled in the previous (Automotive) section. Customer relationships in the Retailing segment include Home Depot, Lowe’s, Nike, Office Depot, Tesco, Wal-Mart Stores, Walt Disney, and Williams-Sonoma.
DHL Supply Chain & Global Forwarding (DHL SC & GF)DHL Supply Chain & Global Forwarding, with 2016 logistics gross revenue of $26.1 billion, is the world’s largest 3PL. VAWD revenue accounts for about half of the company’s total revenues. Globally, it manages a network of 2,400 warehouses with 248 million square feet of space. Given its size, DHL SC & GF has operations of virtually every kind on every continent. Global Forwarding maintains more than 31 global carrier partners with contracts on a multitude of trade lanes and more than 330 gateway facilities. Its annual volume is 2.9 million TEUs and its less-than-container (LCL) capacity is 2 million cubic meters. It manages more than 45,000 weekly point pairs for LCL globally and handles 2 million shipments annually.
DHL serves customers of most industries, but is particularly strong in the Retailing, Consumer Goods, Automotive, and Technological industries. Customers use an average of 2.80 services, and the average contract length is three years. DHL’s Retailing accounts include Christian Dior, Fry’s Electronics, Home Depot, Icahn Enterprises, Marks & Spencer, Nike, Seven & I Holdings, and Wal-Mart Stores.
Global Forwarding offers services for the Technological, Pharmaceuticals, Automotive, Engineering and Manufacturing, Consumer, Fashion and Apparel, and Energy industries.
The Supply Chain division focuses on the Consumer Goods, Retailing, Technological, Life Sciences and Healthcare, Automotive, and Engineering & Manufacturing industries.
DHL aims for long-term strategic growth. DHL’s growth strategy is largely organic, and very expansive. In 2010 the company launched growth plans focused on regions, sectors, customers, and products. The company has a focus on emerging markets, and future strategy aims for 30% revenues derived from emerging markets by 2020. Core regions and products are well-established; capital expenditures in these areas tend to be lower. Instead, emerging markets and niche services are established. Capex in more established areas tends to be improvement and modernization investments. The scale of the company results in a continued need to standardize solutions based on best practices, followed by global implementation. Several product offerings have been converted to standardized products. Other recent standardization efforts included a large-scale information technology overhaul (New Forwarding Environment with SAP), which resulted in an unsuccessful, multi-year, €345 million write-off.
Kuehne + NagelSwiss-based Kuehne + Nagel finished 2016 with revenue of $20.3 billion, making it the second largest 3PL globally after DHL SC & GF. It has strong market positions in ocean and air freight forwarding, contract logistics (VAWD), and transportation management, with a clear focus on providing information technology-based integrated logistics solutions. The EMEA region accounts for 65% company revenues, while the Americas comprise 24%, and the Asia-Pacific region the remaining 11%. In 2016, Kuehne + Nagel’s Americas net revenue and profitability grew despite lowered international trade and currency issues. The sea freight and air freight business units led the way. In both areas, high internal productivity and strict cost management utilizing good investments made in technology and product development strengthened niche segments. Leveraging its forwarding and contract logistics capabilities, Kuehne + Nagel has built good global spare parts logistics and cold chain and pharmaceutical capabilities.
27©2017 Armstrong & Associates
INDUSTRIES
Its Contract Logistics segment attracted customers in the Automotive, Retailing/E-Commerce, High-tech, Pharmaceutical, Aerospace, and Consumer Goods industries. Kuehne + Nagel cites industry-specific solutions as an asset for attracting customers and expanding contracts in certain industries. Industry-specific solutions include KN PharmaChain, KN EngineChain (serving the Aerospace industry in the Middle East and Dubai), KN FreshChain (transporting perishables, particularly exported from Europe to the U.S.), and KN FashionChain. Finally, KN FreightNet, an online air freight and LCL booking, quoting, and tracking platform, helped Kuehne + Nagel to develop new customers and increase business with existing customers. It plans to rely on FreightNet as a strategic sales channel.
Kuehne + Nagel customers use an average of 3.28 services, and the average contract length is four years. Kuehne + Nagel’s Retailing industry customers include Auchan Holding, Carrefour, Home Depot, J. Sainsbury, Metro, and Wal-Mart Stores.
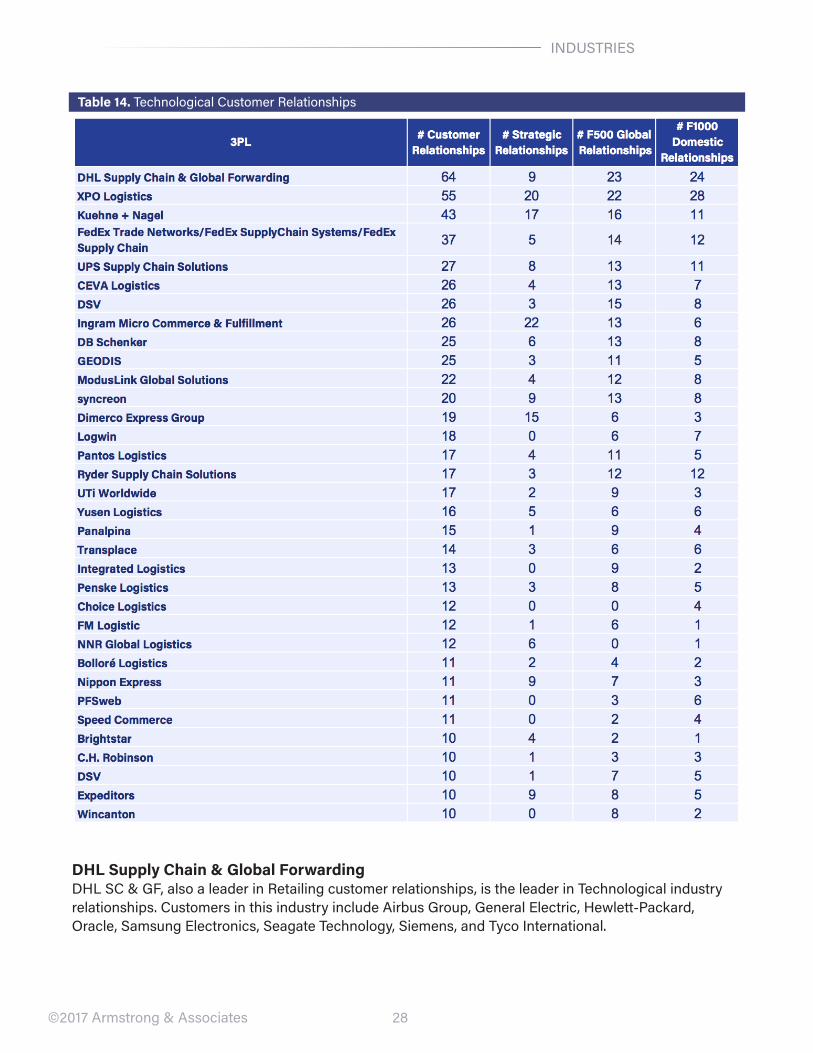
TechnologicalTechnological relationships tend to be dominated by transportation-centric providers with small-shipment expertise and value-added warehousing 3PLs offering targeted value-added services to High-tech companies. DHL Supply Chain & Global Forwarding, XPO Logistics, Kuehne + Nagel, FedEx Trade Networks/FedEx SupplyChain Systems/FedEx Supply Chain, UPS Supply Chain Solutions, and CEVA Logistics have the greatest number of relationships in this segment. Kitting, pick and pack, spare/service parts order fulfillment, returns handling, test and repair, and refurbishment are noteworthy value-added 3PL services being provided to customers. These relationships are listed in the following table.
28©2017 Armstrong & Associates
INDUSTRIES
Table 14. Technological Customer Relationships
DHL Supply Chain & Global ForwardingDHL SC & GF, also a leader in Retailing customer relationships, is the leader in Technological industry relationships. Customers in this industry include Airbus Group, General Electric, Hewlett-Packard, Oracle, Samsung Electronics, Seagate Technology, Siemens, and Tyco International.
29©2017 Armstrong & Associates
INDUSTRIES
XPO LogisticsSelect XPO Logistics Technological industry customers include General Electric, Hewlett-Packard, IBM, LAM Research, LG Electronics, Logitech, United Technologies, Verizon Communications, and Whirlpool.
Kuehne + NagelKuehne + Nagel has Technological industry relationships with Airbus Group, Apple, Corning, Oracle, Orange, Royal Philips, Samsung Electronics, and Siemens.
UPS Supply Chain Solutions (UPS SCS)UPS Supply Chain Solutions (UPS SCS), a business unit of UPS, offers DTM, VAWD, and ITM services. UPS SCS contributes more than $3 billion per year in package business to UPS. Forwarding revenues are 60% air and 40% ocean. Twelve percent of containers are LCL consolidations; 40% are Asia-U.S. The company is expanding value-added warehousing operations in the U.S., Canada, Western Europe, Brazil, and China.
UPS SCS has services tailored to the Aerospace, Automotive, Industrial, Retailing, Consumer, Healthcare, and High-tech industries. These operations are highly integrated between value-added and package delivery services. The company is capitalizing on demographic trends driving increased need for specialized Healthcare logistics. In 2015, UPS opened a new multi-client VAWD operation in New Jersey for handling medical devices and a new Healthcare facility in Amsterdam. UPS is also expanding its presence in the Aerospace industry. In 2015, UPS made a major move into the U.S. domestic transportation management (DTM)/freight brokerage space with the acquisition of Coyote Logistics.
UPS SCS customers use an average of 3.14 services, with an average contract length of four years. Major customers of Technological services include Cisco Systems, Hewlett-Packard, Hitachi, IBM, Mitsubishi Group, Siemens, SoftBank Group, and United Technologies.
Food and GroceriesFood and Groceries customers often have multimodal transportation requirements and multi-temperature VAWD needs. This often leads them to 3PLs providing integrated DTM and VAWD solutions.
XPO Logistics, C.H. Robinson, Transplace, Wincanton, and Ryder Supply Chain solutions have the greatest number of relationships in this segment.
30©2017 Armstrong & Associates
INDUSTRIES
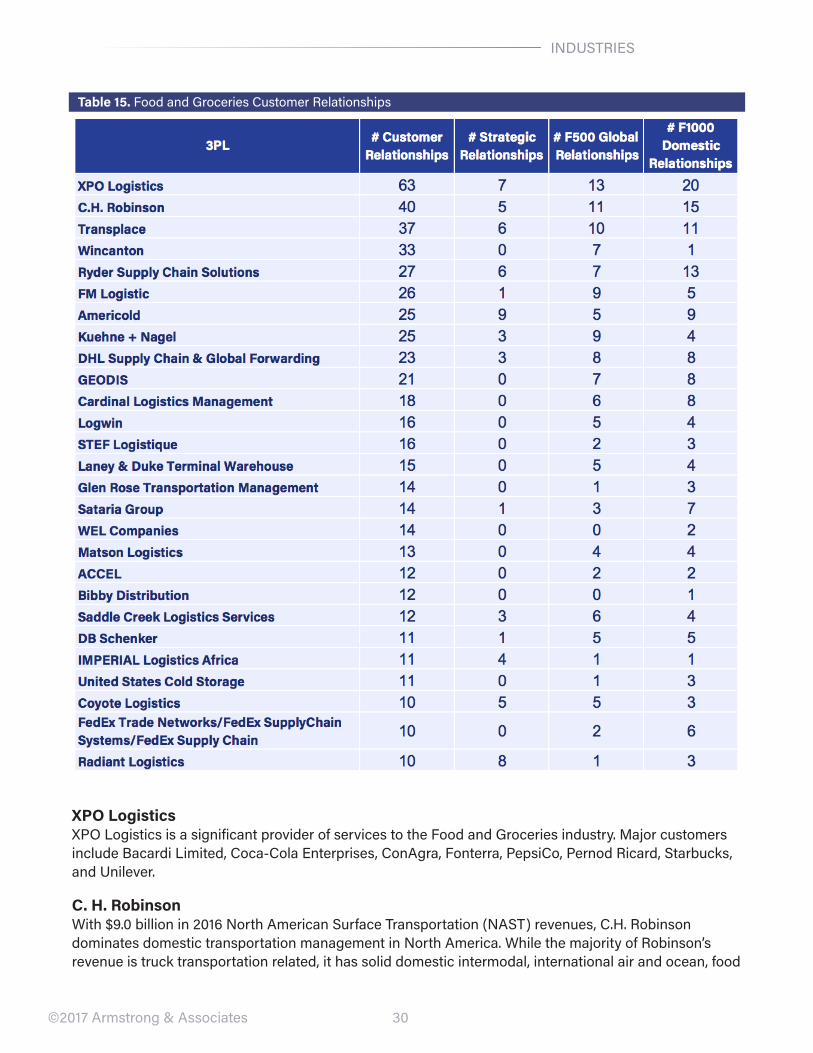
Table 15. Food and Groceries Customer Relationships
XPO LogisticsXPO Logistics is a significant provider of services to the Food and Groceries industry. Major customers include Bacardi Limited, Coca-Cola Enterprises, ConAgra, Fonterra, PepsiCo, Pernod Ricard, Starbucks, and Unilever.
C. H. RobinsonWith $9.0 billion in 2016 North American Surface Transportation (NAST) revenues, C.H. Robinson dominates domestic transportation management in North America. While the majority of Robinson’s revenue is truck transportation related, it has solid domestic intermodal, international air and ocean, food
31©2017 Armstrong & Associates
INDUSTRIES
sourcing, and supply chain management capabilities. C.H. Robinson’s TMC division focuses on large transportation network management. The TMC is now serving customers in the Americas, Europe, and Asia.
Its European operations have been successful, profitable, and are expanding in Poland and the Eastern Bloc. They are a natural fit for Europe’s atomized owner-operator based companies.
In 2009, C.H. Robinson added to its cross border capabilities by acquiring Laredo, Texas-based International Trade & Commerce, Inc. (ITC). Today, C.H. Robinson manages over 500,000 cross-border truckload shipments each year. Approximately 70% of the truckloads managed are northbound loads with the most frequent modes utilized being dry van, flatbed, and refrigerated.
C.H. Robinson’s 2012 acquisition of $635 million Phoenix International marked its largest acquisition and greatly expanded its international transportation management capabilities. C.H. Robinson now manages more than 485,000 ocean TEUs and 115,000 air freight metric tons annually. For its U.S. customs brokerage operations, C.H. Robinson has 98 licensed U.S. customs brokers working in 13 different U.S. offices.
In January 2015, C.H. Robinson acquired Freightquote.com, a privately-held LTL-focused DTM/Freight Brokerage, for $365 million. The acquisition added 3.5 percentage points to annual truckload net revenue growth, and 33 points to LTL net revenue growth. In the acquisition, C.H. Robinson picked up small but higher-margin customers. Customer acquisition also drove a 12.9% increase in managed services, warehousing, and small parcel.
C.H. Robinson’s sourcing service, operating as Robinson Fresh, has a long history of buying, selling, and marketing fresh produce and perishable items. Customers include retailers, distributors, restaurants, and wholesalers. Services include consolidation and delivery to multiple destinations, quality assurance, and monitoring. Experience in managing Food and Groceries logistics, and its wide customer network, has attracted customers such as Anheuser-Busch InBev, Coca-Cola Enterprises, ConAgra, Dole Foods, Kraft Heinz, Land O’Lakes, Nestlé, PepsiCo, and Unilever. Customers use an average of 2.43 services, and the average contract length is one year.
TransplaceTransplace, with $1.6 billion in 2016 gross revenue, is a leading U.S.-based domestic non-asset based transportation manager. The company has large systematic transportation network management capabilities, a lean management culture, and a solid IT backbone. Its service portfolio has expanded significantly over the past few years and includes network transportation management, supply chain consulting, software-as-a-service transportation management system (SaaS TMS) technology, freight brokerage (refrigerated, truckload, less-than-truckload, and intermodal), Canada and Mexico transportation operations, and international transportation management services.
Transplace’s strategic additions have increased the company’s North American operating footprint, overall operational capabilities, industries served, freight under management, and revenue. In one of the most publicized acquisitions of 2013, private equity investment firm Greenbriar Equity Group acquired Transplace. Transplace itself has made several strategic acquisitions since 2011. In December 2012, it acquired Torus Freight Systems, a Canadian-based 3PL focused on Canadian cross-border and intra-Canada transportation management. In April 2011, Transplace acquired SCO Logistics adding Chemicals industry expertise to Transplace’s portfolio. The SCO Logistics acquisition also provided Transplace
32©2017 Armstrong & Associates
INDUSTRIES
an operations center in the Northeast. In October 2011, Transplace made another strategic move and announced it was joining forces with intermodal marketing company Celtic International, creating a stand-alone operating division.
Building on SCO’s Chemical industry expertise, the 2015 Transplace acquisition of Logistics Managament Solutions strengthened the company’s customer base in the Packaging, Chemicals, and Advanced Materials industries. Transplace also acquired M33, a mid-sized network transportation manager, adding more than 60 customers in the Chemical and Industrial industries to its portfolio.
Customers use an average of 1.81 services, and the average contract length is 5.3 years. Key strategic accounts include AutoZone, Colgate-Palmolive, Del Monte Foods, DirectTV, Glatfelter, Office Depot, Philips, and WestRock.
33©2017 Armstrong & Associates
REGIONS
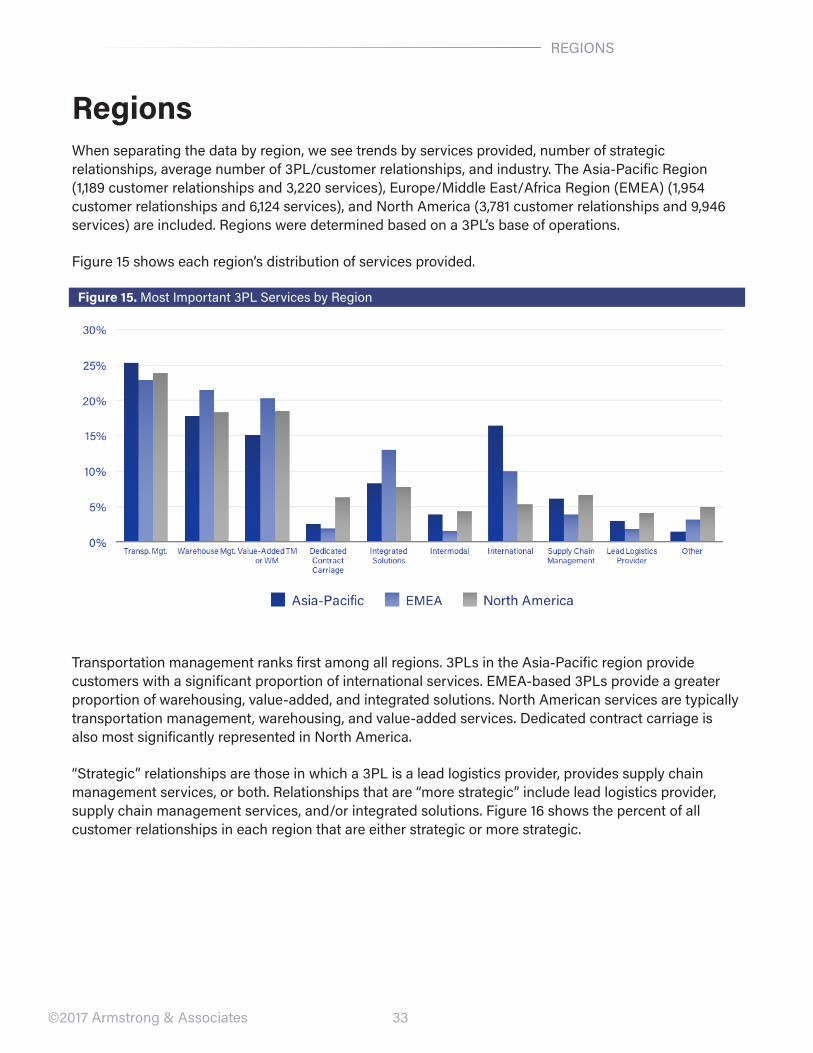
RegionsWhen separating the data by region, we see trends by services provided, number of strategic relationships, average number of 3PL/customer relationships, and industry. The Asia-Pacific Region (1,189 customer relationships and 3,220 services), Europe/Middle East/Africa Region (EMEA) (1,954 customer relationships and 6,124 services), and North America (3,781 customer relationships and 9,946 services) are included. Regions were determined based on a 3PL’s base of operations.
Figure 15 shows each region’s distribution of services provided.
Figure 15. Most Important 3PL Services by Region
Transportation management ranks first among all regions. 3PLs in the Asia-Pacific region provide customers with a significant proportion of international services. EMEA-based 3PLs provide a greater proportion of warehousing, value-added, and integrated solutions. North American services are typically transportation management, warehousing, and value-added services. Dedicated contract carriage is also most significantly represented in North America.
“Strategic” relationships are those in which a 3PL is a lead logistics provider, provides supply chain management services, or both. Relationships that are “more strategic” include lead logistics provider, supply chain management services, and/or integrated solutions. Figure 16 shows the percent of all customer relationships in each region that are either strategic or more strategic.

34©2017 Armstrong & Associates
REGIONS
Figure 16. Percent of Strategic or More Strategic Relationships by Region
Customer relationships with North American and Asia-Pacific-based 3PLs tend to be the most strategic. However, when considering more strategic relationships, EMEA-based 3PLs clearly lead, based on the high quantity of integrated solutions provided.
As seen in Table 16, below, EMEA-based 3PLs provide the greatest average number of services per customer, followed by the Asia-Pacific region. North American 3PLs provide the fewest services per customer.
Table 16. Average Number of Services by Region
The distribution of services within each industry varies by region, as shown in Figure 17.
35
REGIONS
©2017 Armstrong & Associates
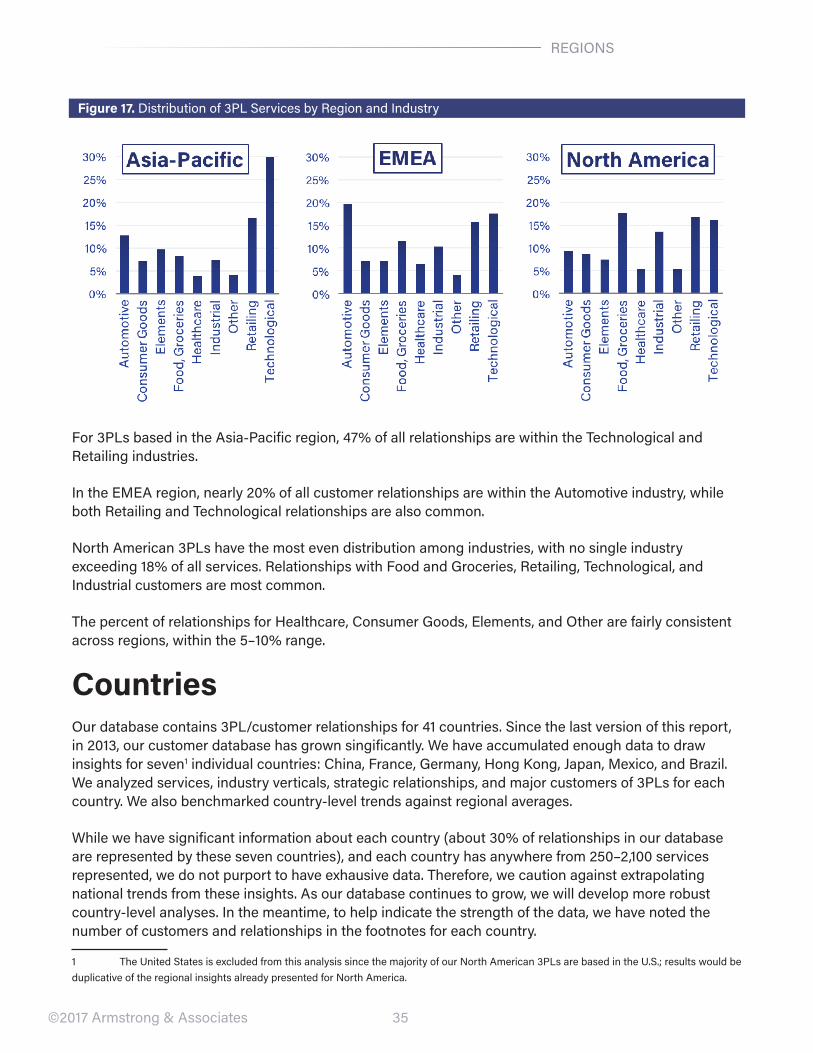
Figure 17. Distribution of 3PL Services by Region and Industry
For 3PLs based in the Asia-Pacific region, 47% of all relationships are within the Technological and Retailing industries.
In the EMEA region, nearly 20% of all customer relationships are within the Automotive industry, while both Retailing and Technological relationships are also common.
North American 3PLs have the most even distribution among industries, with no single industry exceeding 18% of all services. Relationships with Food and Groceries, Retailing, Technological, and Industrial customers are most common.
The percent of relationships for Healthcare, Consumer Goods, Elements, and Other are fairly consistent across regions, within the 5–10% range.
CountriesOur database contains 3PL/customer relationships for 41 countries. Since the last version of this report, in 2013, our customer database has grown singificantly. We have accumulated enough data to draw insights for seven1 individual countries: China, France, Germany, Hong Kong, Japan, Mexico, and Brazil. We analyzed services, industry verticals, strategic relationships, and major customers of 3PLs for each country. We also benchmarked country-level trends against regional averages.
While we have significant information about each country (about 30% of relationships in our database are represented by these seven countries), and each country has anywhere from 250–2,100 services represented, we do not purport to have exhausive data. Therefore, we caution against extrapolating national trends from these insights. As our database continues to grow, we will develop more robust country-level analyses. In the meantime, to help indicate the strength of the data, we have noted the number of customers and relationships in the footnotes for each country.
1 The United States is excluded from this analysis since the majority of our North American 3PLs are based in the U.S.; results would be duplicative of the regional insights already presented for North America.
36©2017 Armstrong & Associates
China
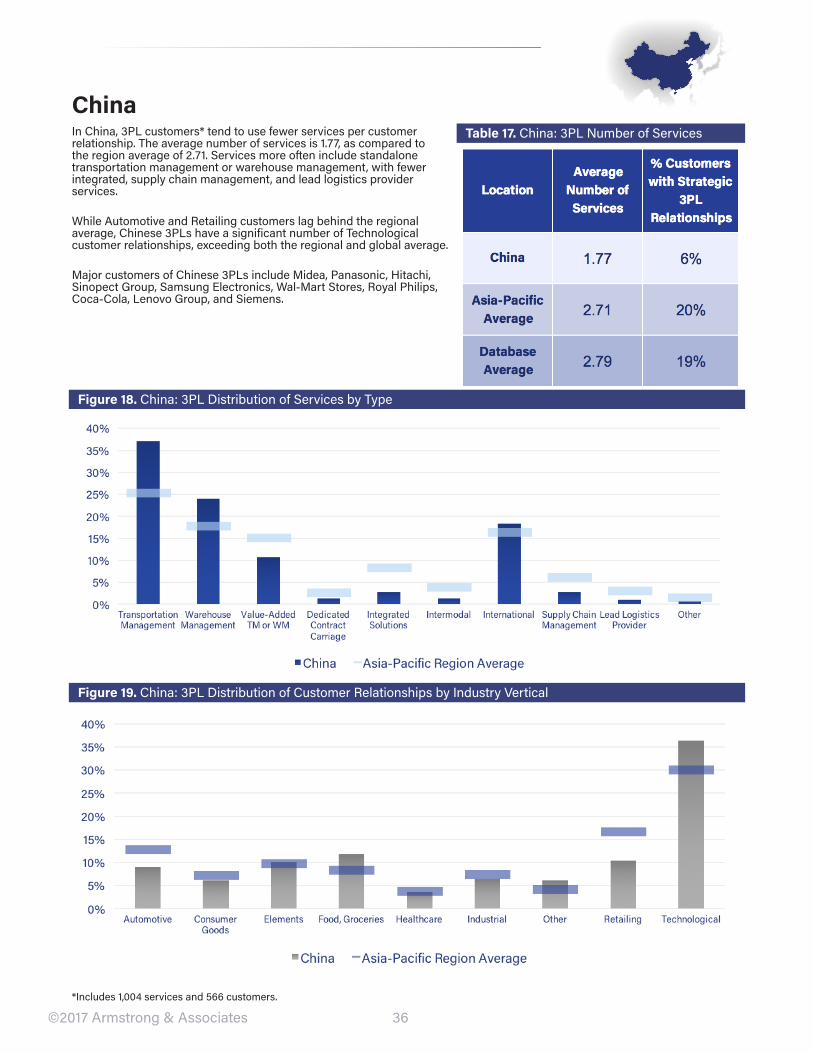
Figure 19. China: 3PL Distribution of Customer Relationships by Industry Vertical
Figure 18. China: 3PL Distribution of Services by Type
Table 17. China: 3PL Number of Services
*Includes 1,004 services and 566 customers.
In China, 3PL customers* tend to use fewer services per customer relationship. The average number of services is 1.77, as compared to the region average of 2.71. Services more often include standalone transportation management or warehouse management, with fewer integrated, supply chain management, and lead logistics provider services.
While Automotive and Retailing customers lag behind the regional average, Chinese 3PLs have a significant number of Technological customer relationships, exceeding both the regional and global average.
Major customers of Chinese 3PLs include Midea, Panasonic, Hitachi, Sinopect Group, Samsung Electronics, Wal-Mart Stores, Royal Philips, Coca-Cola, Lenovo Group, and Siemens.
37©2017 Armstrong & Associates
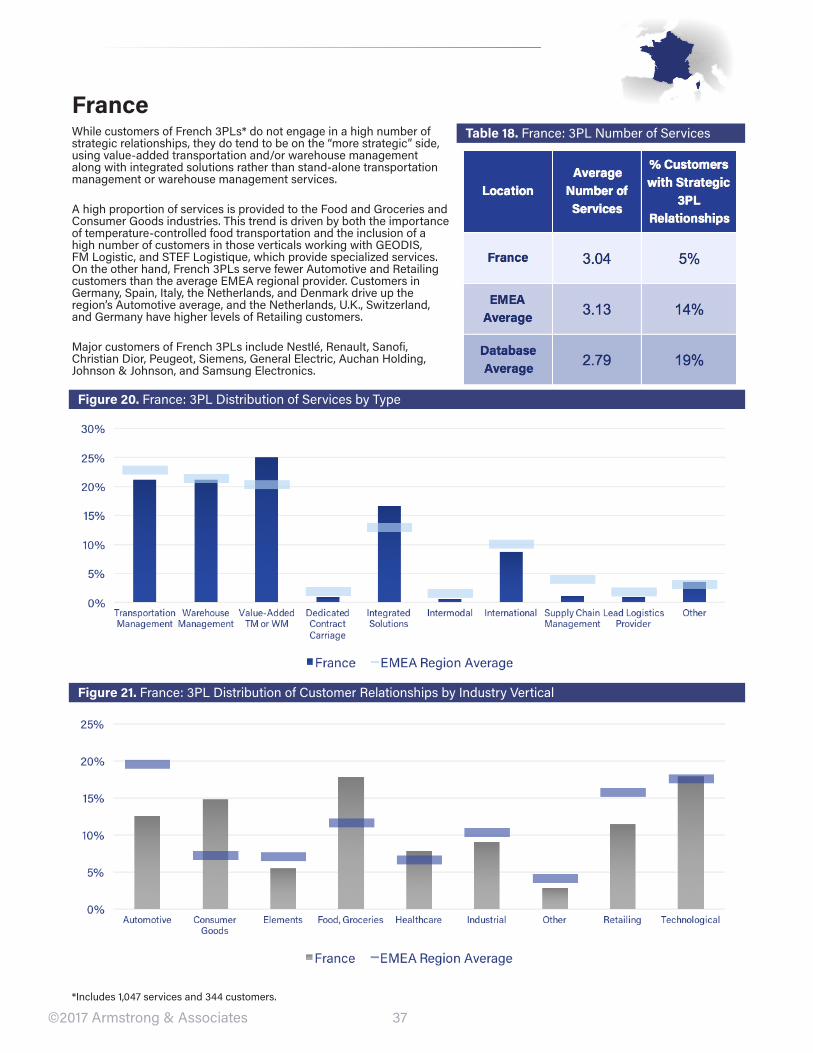
While customers of French 3PLs* do not engage in a high number of strategic relationships, they do tend to be on the “more strategic” side, using value-added transportation and/or warehouse management along with integrated solutions rather than stand-alone transportation management or warehouse management services.
A high proportion of services is provided to the Food and Groceries and Consumer Goods industries. This trend is driven by both the importance of temperature-controlled food transportation and the inclusion of a high number of customers in those verticals working with GEODIS, FM Logistic, and STEF Logistique, which provide specialized services. On the other hand, French 3PLs serve fewer Automotive and Retailing customers than the average EMEA regional provider. Customers in Germany, Spain, Italy, the Netherlands, and Denmark drive up the region’s Automotive average, and the Netherlands, U.K., Switzerland, and Germany have higher levels of Retailing customers.
Major customers of French 3PLs include Nestlé, Renault, Sanofi, Christian Dior, Peugeot, Siemens, General Electric, Auchan Holding, Johnson & Johnson, and Samsung Electronics.
*Includes 1,047 services and 344 customers.
Figure 20. France: 3PL Distribution of Services by Type
Table 18. France: 3PL Number of Services
France
Figure 21. France: 3PL Distribution of Customer Relationships by Industry Vertical
38©2017 Armstrong & Associates
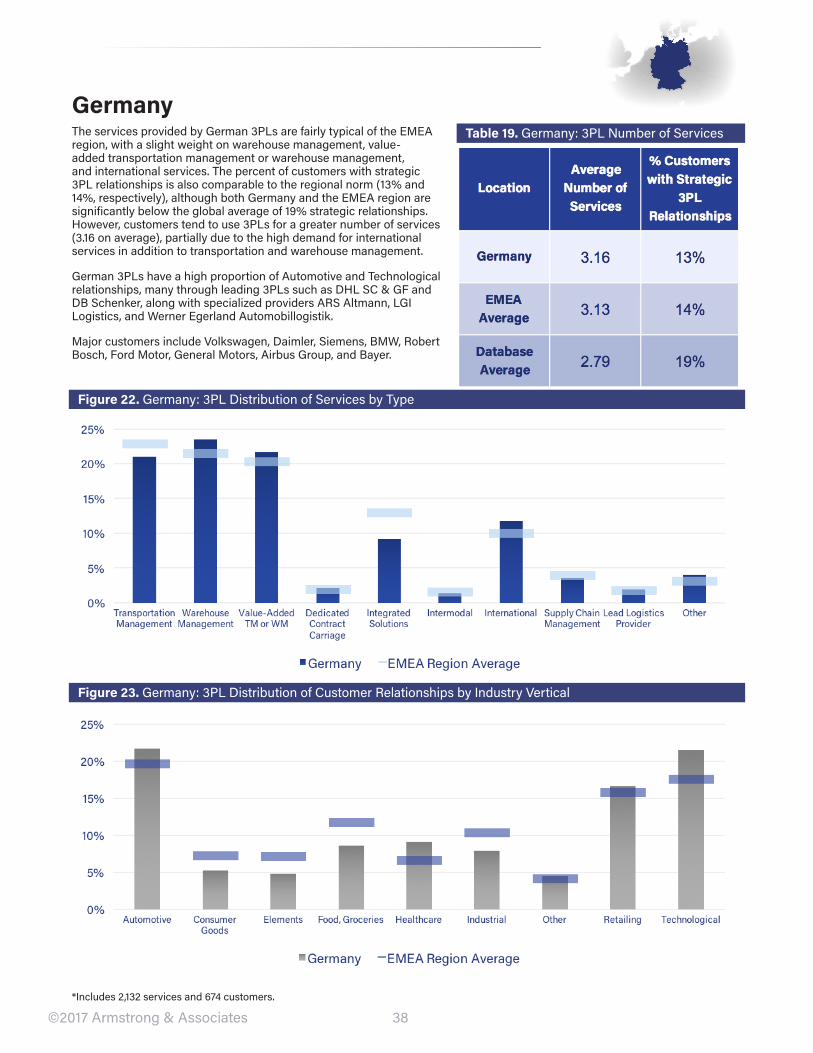
The services provided by German 3PLs are fairly typical of the EMEA region, with a slight weight on warehouse management, value-added transportation management or warehouse management, and international services. The percent of customers with strategic 3PL relationships is also comparable to the regional norm (13% and 14%, respectively), although both Germany and the EMEA region are significantly below the global average of 19% strategic relationships. However, customers tend to use 3PLs for a greater number of services (3.16 on average), partially due to the high demand for international services in addition to transportation and warehouse management.
German 3PLs have a high proportion of Automotive and Technological relationships, many through leading 3PLs such as DHL SC & GF and DB Schenker, along with specialized providers ARS Altmann, LGI Logistics, and Werner Egerland Automobillogistik.
Major customers include Volkswagen, Daimler, Siemens, BMW, Robert Bosch, Ford Motor, General Motors, Airbus Group, and Bayer.
Table 19. Germany: 3PL Number of Services
Figure 23. Germany: 3PL Distribution of Customer Relationships by Industry Vertical
Figure 22. Germany: 3PL Distribution of Services by Type
*Includes 2,132 services and 674 customers.
Germany
39©2017 Armstrong & Associates
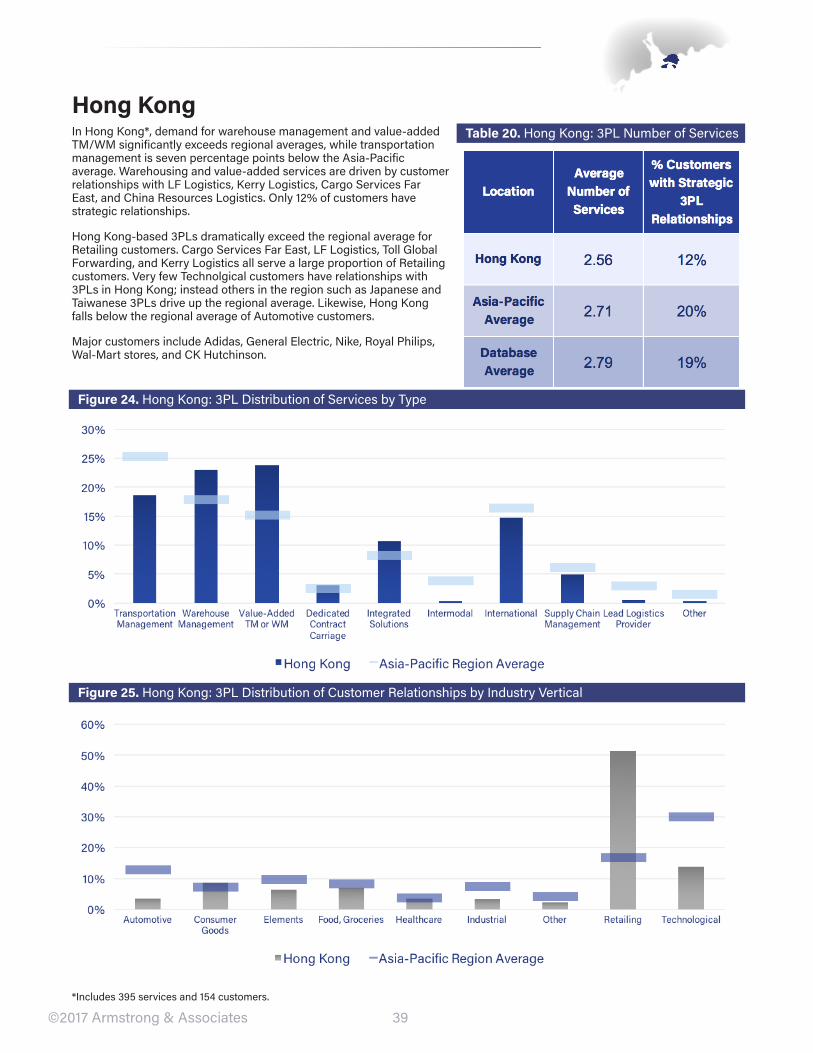
In Hong Kong*, demand for warehouse management and value-added TM/WM significantly exceeds regional averages, while transportation management is seven percentage points below the Asia-Pacific average. Warehousing and value-added services are driven by customer relationships with LF Logistics, Kerry Logistics, Cargo Services Far East, and China Resources Logistics. Only 12% of customers have strategic relationships.
Hong Kong-based 3PLs dramatically exceed the regional average for Retailing customers. Cargo Services Far East, LF Logistics, Toll Global Forwarding, and Kerry Logistics all serve a large proportion of Retailing customers. Very few Technolgical customers have relationships with 3PLs in Hong Kong; instead others in the region such as Japanese and Taiwanese 3PLs drive up the regional average. Likewise, Hong Kong falls below the regional average of Automotive customers.
Major customers include Adidas, General Electric, Nike, Royal Philips, Wal-Mart stores, and CK Hutchinson.
*Includes 395 services and 154 customers.
Figure 25. Hong Kong: 3PL Distribution of Customer Relationships by Industry Vertical
Figure 24. Hong Kong: 3PL Distribution of Services by Type
Table 20. Hong Kong: 3PL Number of Services
Hong Kong
40©2017 Armstrong & Associates
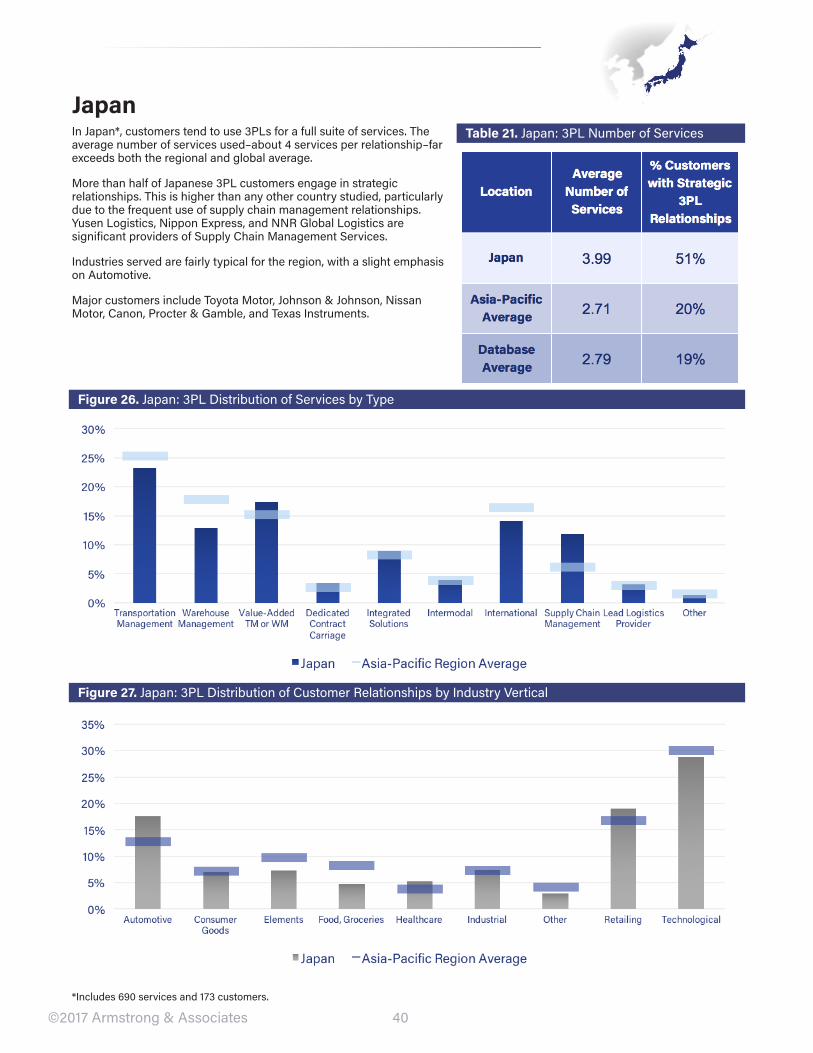
In Japan*, customers tend to use 3PLs for a full suite of services. The average number of services used–about 4 services per relationship–far exceeds both the regional and global average.
More than half of Japanese 3PL customers engage in strategic relationships. This is higher than any other country studied, particularly due to the frequent use of supply chain management relationships. Yusen Logistics, Nippon Express, and NNR Global Logistics are significant providers of Supply Chain Management Services.
Industries served are fairly typical for the region, with a slight emphasis on Automotive.
Major customers include Toyota Motor, Johnson & Johnson, Nissan Motor, Canon, Procter & Gamble, and Texas Instruments.
*Includes 690 services and 173 customers.
Figure 27. Japan: 3PL Distribution of Customer Relationships by Industry Vertical
Figure 26. Japan: 3PL Distribution of Services by Type
Table 21. Japan: 3PL Number of Services
Japan
41©2017 Armstrong & Associates
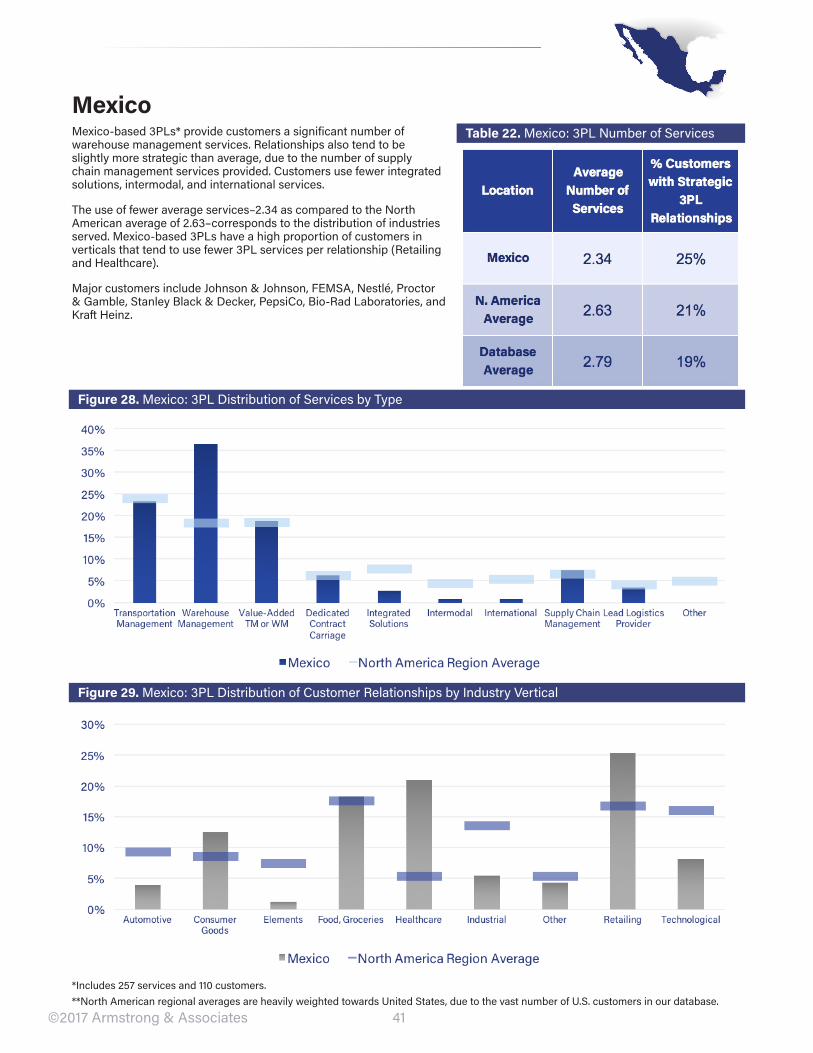
Mexico-based 3PLs* provide customers a significant number of warehouse management services. Relationships also tend to be slightly more strategic than average, due to the number of supply chain management services provided. Customers use fewer integrated solutions, intermodal, and international services.
The use of fewer average services–2.34 as compared to the North American average of 2.63–corresponds to the distribution of industries served. Mexico-based 3PLs have a high proportion of customers in verticals that tend to use fewer 3PL services per relationship (Retailing and Healthcare).
Major customers include Johnson & Johnson, FEMSA, Nestlé, Proctor & Gamble, Stanley Black & Decker, PepsiCo, Bio-Rad Laboratories, and Kraft Heinz.
*Includes 257 services and 110 customers. **North American regional averages are heavily weighted towards United States, due to the vast number of U.S. customers in our database.
Figure 29. Mexico: 3PL Distribution of Customer Relationships by Industry Vertical
Figure 28. Mexico: 3PL Distribution of Services by Type
Table 22. Mexico: 3PL Number of Services
Mexico
42©2017 Armstrong & Associates
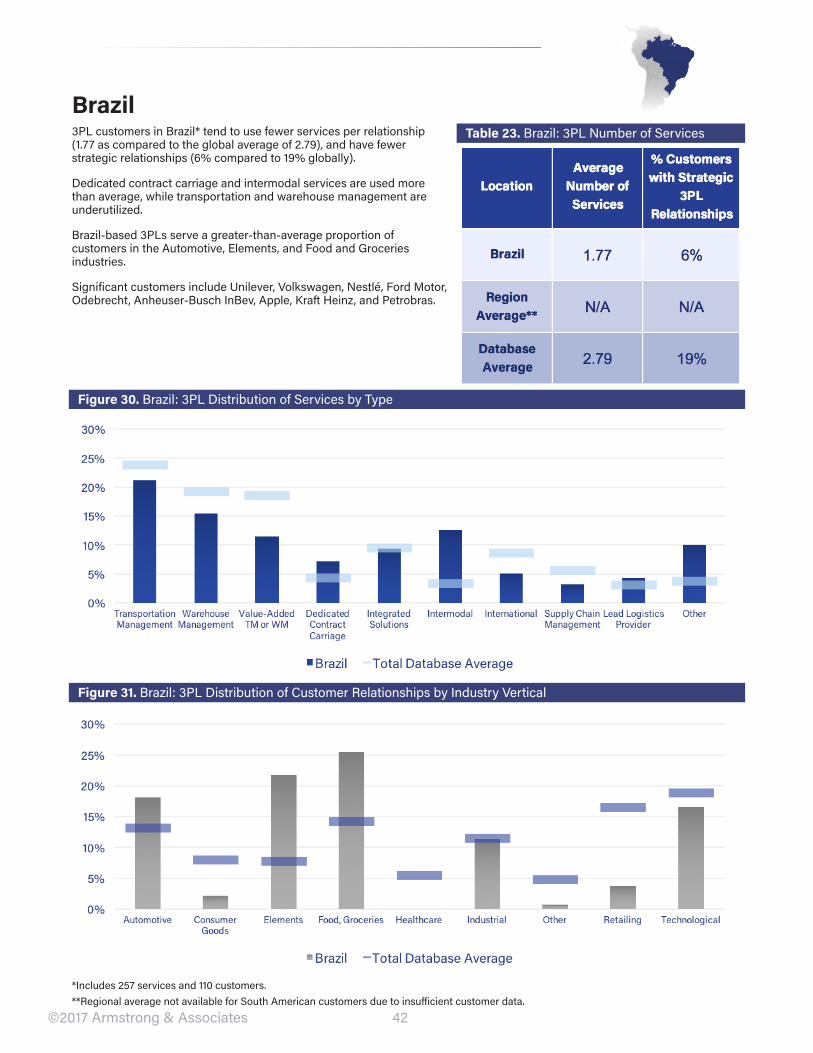
3PL customers in Brazil* tend to use fewer services per relationship (1.77 as compared to the global average of 2.79), and have fewer strategic relationships (6% compared to 19% globally).
Dedicated contract carriage and intermodal services are used more than average, while transportation and warehouse management are underutilized.
Brazil-based 3PLs serve a greater-than-average proportion of customers in the Automotive, Elements, and Food and Groceries industries.
Significant customers include Unilever, Volkswagen, Nestlé, Ford Motor, Odebrecht, Anheuser-Busch InBev, Apple, Kraft Heinz, and Petrobras.
Figure 31. Brazil: 3PL Distribution of Customer Relationships by Industry Vertical
Figure 30. Brazil: 3PL Distribution of Services by Type
Table 23. Brazil: 3PL Number of Services
Brazil
*Includes 257 services and 110 customers. **Regional average not available for South American customers due to insufficient customer data.
Market Research New Releases from Armstrong & Associates, Inc.
Expert Information Service (E.I.S.) Our premium market research and analysis offering includes access to our eight most popular 3PL market research reports and a subscription to our leading 3PL guide, Who’s Who in Logistics Online. Phone consulting is available.
Keep It Running – The Quintessential Spare Parts
Logistics Report
Global spare/service parts logistics revenue for third-party logistics providers has grown to $52.7 billion. The report details the spare parts logistics capabilities of seven leading 3PLs: UPS, FedEx, DHL, Ryder, DB Schenker, SEKO, and CEVA. Global spare parts logistics market estimates are included, and are further calculated at the country/region level and for major industry verticals.
Digital Freight Matching – Capturing Technology-Based
Efficiencies in the Trucking Industry
Digital Freight Matching (DFM) companies, sometimes referred to as “Uber for Trucking,” have gained popularity in the last several years. This report summarizes the DFM landscape, including: an overview of transportation and technology market conditions and trends, comparisons of product offerings, an assessment of five business models, a discussion of industry challenges, and profiles of 27 DFM companies.
Tightened Up – Third-Party Logistics Market Results and Trends for 2016
This definitive analysis explores trends in the third-party logistics industry and its major segments. Segment profitability and growth, 2015 M&A deals, value-added warehousing and distribution trends, and the Domestic Transportation Management/Freight Brokerage market are detailed. Global logistics costs by country and region are also provided, including historical trends, 2015 results, and 2016 estimates.
Reports are available for purchase at http://www.3plogistics.com