TRENDS AND FACTS 2017 - Hannover · Lehrte GVZ mega hub A 352 A 37 A 7 A 7 A 2 A 2 ... Pattensen...
52
BUSINESS PROMOTION Location information Issue 3 / 2017 TRENDS AND FACTS 2017
Transcript of TRENDS AND FACTS 2017 - Hannover · Lehrte GVZ mega hub A 352 A 37 A 7 A 7 A 2 A 2 ... Pattensen...

BUSINESS PROMOTION
Location information Issue 3 / 2017
TRENDS AND FACTS 2017

2 TRENDS AND FACTS 2017
TRENDS AND FACTS 2017
A nationwide comparison shows that the Hannover Region is an attractive business location with a high quality of life.
The Hannover Region Business and Employment Promotion department has compiled and presents the most important metrics about the Hannover economic area in this brochure.
We look forward to advising you on any and all topics relating to the loca-tion and consider ourselves to be a service provider for local and foreign companies. So whether you have a question about administration, would like advice on financing and funding opportunities for your company, are looking for land or property or need help with your company to cope with a difficult situation, we are at your service.
Your Hannover Region Business and Employment Promotion department

3
TABLE OF CONTENTS
Location & infrastructure
Population
Employment
Commuter interrelationships
Job market
Economic metrics
Purchasing power & retail
Business enterprises
Key sectors
Education & science
Commercial properties
Commercial plots
Tax assessment rates
Residential
Tourism
Trade fairs
Imprint
4
6
8
14
16
17
18
20
24
30
36
39
40
41
46
48
51
4 TRENDS AND FACTS 2017
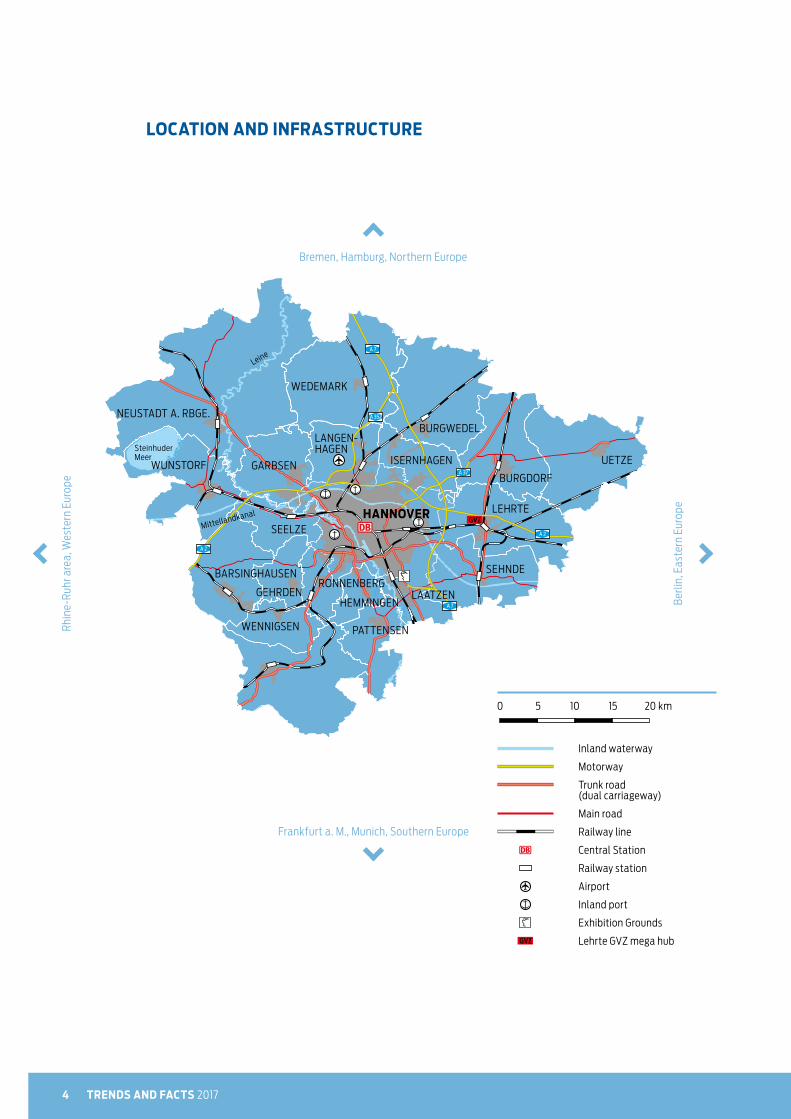
LOCATION AND INFRASTRUCTURE
Bremen, Hamburg, Northern Europe
Frankfurt a. M., Munich, Southern Europe
Rhin
e-Ru
hr a
rea,
Wes
tern
Eur
ope
Berli
n, E
aste
rn E
urop
e
0 5 10 15 20 km
Inland waterway
Motorway
Trunk road (dual carriageway)
Main road
Railway line
Central Station
Railway station
Airport
Inland port
Exhibition Grounds
Lehrte GVZ mega hub
A 352
A 37
A 7
A 7
A 2
A 2
NEUSTADT A. RBGE.
WUNSTORF GARBSEN
LANGEN- HAGEN
WEDEMARK
Leine
Steinhuder Meer
Mittellandkanal
BURGWEDEL
ISERNHAGEN
BURGDORF
UETZE
LEHRTE
SEHNDE
PATTENSEN
HEMMINGEN
WENNIGSEN
BARSINGHAUSEN
GEHRDEN
SEELZEHANNOVER
LAATZENRONNENBERG

5LOCATION AND INFRASTRUCTURE
The Hannover Region is a vital hub within the European
passenger, freight and goods transport infrastructure:
motorways, railway networks, airport, and inland water-
ways provide optimum connections to national and
international economic zones.
This infrastructure is complemented by one of Germany’s best
local public transport systems including a highly integrated
transport network comprising 170 bus lines and 12 LRT lines,
9 regional and 9 suburban railway lines serving 1,900 stops to
ensure excellent connections everywhere. Hannover’s local public
transport system (GVH) counted a record number of passengers
in 2016 – 216.2 million. The high and climbing user figures under-
pin the importance of Hannover as a transport hub.
Travel time by ICE high-speed trainfrom Hannover to (in h:m)
Berlin 01:35
Bremen 00:59
Dortmund 01:38
Dresden 03:52
Essen 02:03
Frankfurt am Main 02:19
Hamburg 01:15
Cologne 02:38
Leipzig 02:40
Munich 04:35
Nuremberg 02:57
Stuttgart 03:54
This close to ...
Traffic figures
Hannover Central Station 250,000 passengers622 regional and intercity trains
dailydaily
Hannover local public transport system (GVH) 216.2 million passengers 2016
Hannover Langenhagen airport 5.41 million passengers 2016
Source: Figures provided by transport and operating companies
6 TRENDS AND FACTS 2017
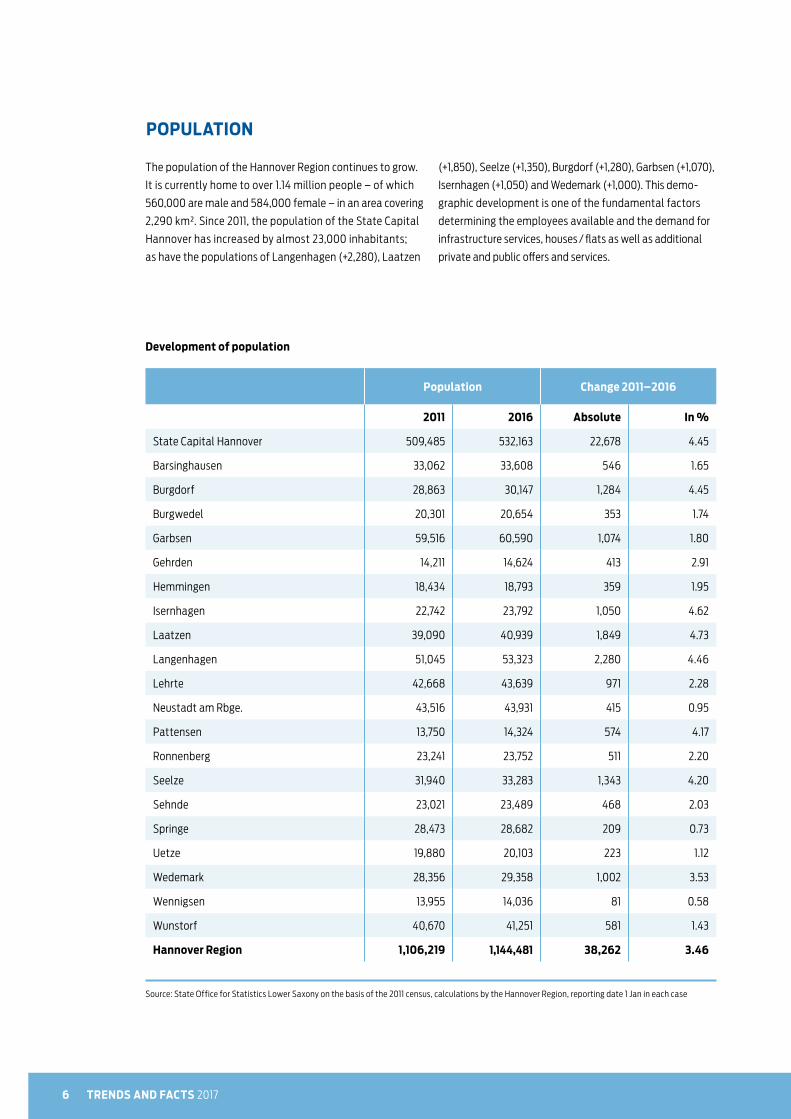
POPULATION
The population of the Hannover Region continues to grow.
It is currently home to over 1.14 million people – of which
560,000 are male and 584,000 female – in an area covering
2,290 km². Since 2011, the population of the State Capital
Hannover has increased by almost 23,000 inhabitants;
as have the populations of Langenhagen (+2,280), Laatzen
(+1,850), Seelze (+1,350), Burgdorf (+1,280), Garbsen (+1,070),
Isernhagen (+1,050) and Wedemark (+1,000). This demo-
graphic development is one of the fundamental factors
determining the employees available and the demand for
infrastructure services, houses / flats as well as additional
private and public offers and services.
Development of population
Population Change 2011–2016
2011 2016 Absolute In %
State Capital Hannover 509,485 532,163 22,678 4.45
Barsinghausen 33,062 33,608 546 1.65
Burgdorf 28,863 30,147 1,284 4.45
Burgwedel 20,301 20,654 353 1.74
Garbsen 59,516 60,590 1,074 1.80
Gehrden 14,211 14,624 413 2.91
Hemmingen 18,434 18,793 359 1.95
Isernhagen 22,742 23,792 1,050 4.62
Laatzen 39,090 40,939 1,849 4.73
Langenhagen 51,045 53,323 2,280 4.46
Lehrte 42,668 43,639 971 2.28
Neustadt am Rbge. 43,516 43,931 415 0.95
Pattensen 13,750 14,324 574 4.17
Ronnenberg 23,241 23,752 511 2.20
Seelze 31,940 33,283 1,343 4.20
Sehnde 23,021 23,489 468 2.03
Springe 28,473 28,682 209 0.73
Uetze 19,880 20,103 223 1.12
Wedemark 28,356 29,358 1,002 3.53
Wennigsen 13,955 14,036 81 0.58
Wunstorf 40,670 41,251 581 1.43
Hannover Region 1,106,219 1,144,481 38,262 3.46
Source: State Office for Statistics Lower Saxony on the basis of the 2011 census, calculations by the Hannover Region, reporting date 1 Jan in each case

7POPULATION
POPULATION
Change 2011–2016 in %
Change in population 2011–2016 in %
more than 4
2 to below 4
0 to below 2
Population
Change 2011–2016 absolute
Increase
10,000
750
1,500
Barsinghausen
Burgdorf
Burgwedel
Garbsen
GehrdenHem- mingen
Isernhagen
Laatzen
Langenhagen
Hannover
Lehrte
Springe
Neustadt a. Rbge.
Sehnde
Seelze
Wunstorf
Ronnen- berg
Pattensen
Wedemark
Wennigsen
Uetze

8 TRENDS AND FACTS 2017
Change According to gender
2015 2016 Absolute In % Male Female
State Capital Hannover 308,272 313,018 4,746 1.54 164,895 148,123
Barsinghausen 7,492 7,804 312 4.16 4,128 3,676
Burgdorf 5,456 5,694 238 4.36 2,451 3,243
Burgwedel 8,844 9,169 325 3.67 4,090 5,079
Garbsen 14,367 13,618 –749 –5.21 6,629 6,989
Gehrden 3,238 3,472 234 7.23 1,570 1,902
Hemmingen 3,825 3,766 –59 –1.54 2,151 1,615
Isernhagen 9,755 10,010 255 2.61 6,132 3,878
Laatzen 15,128 15,512 384 2.54 8,499 7,013
Langenhagen 32,031 32,429 398 1.24 20,207 12,222
Lehrte 12,580 12,799 219 1.74 7,505 5,294
Neustadt am Rbge. 9,404 9,488 84 0.89 4,338 5,150
Pattensen 3,531 3,502 –29 –0.82 1,730 1,772
Ronnenberg 4,258 4,574 316 7.42 2,581 1,993
Seelze 5,697 5,972 275 4.83 3,533 2,439
Sehnde 5,829 5,888 59 1.01 2,852 3,036
Springe 6,796 6,617 –179 –2.63 3,245 3,372
Uetze 3,201 3,335 134 4.19 1,811 1,524
Wedemark 7,021 7,162 141 2.01 3,790 3,372
Wennigsen 2,492 2,570 78 3.13 1,195 1,375
Wunstorf 11,597 11,587 –10 –0.09 6,010 5,577
Hannover Region 480,814 487,986 7,172 1.49 259,342 228,644
EMPLOYMENT
One key indicator for the economic growth and prosperity
of a region is a positive development in employment figures.
In the Hannover Region the number of employees in work
and paying social insurance contributions has again risen
year-on-year to reach an absolute record high of over
488,000 (+7,200), of which 259,300 are men and 228,650
women. The key centre of employment in the region is the
State Capital Hannover with a workforce of over 313,000.
Around 175,000 people are employed in the surrounding
area. The largest relative growth was achieved in Ronnen-
berg and Gehrden.
Employees paying social insurance contributions at their place of work
Source: Federal Labour Office, audited results, calculations by the Hannover Region, reporting date 1 Jan in each case

9EMPLOYMENT
Employees paying social insurance contributions at their place of work
change 2015–2016 in %
Change 2015–2016 in %
more than 4
2 to below 4
0 to below 2
–6 to below 0
Employees
Increase Decrease
7,000
250
500
Barsinghausen
Burgdorf
Burgwedel
Garbsen
GehrdenHem- mingen
Isernhagen
Laatzen
Langenhagen
Hannover
Lehrte
Springe
Neustadt a. Rbge.
Sehnde
Seelze
Wunstorf
Ronnen- berg
Pattensen
Wedemark
Wennigsen
Uetze

10 TRENDS AND FACTS 2017
The share of employees in the Hannover Region with an
academic professional qualification has again risen and
is now at 18.2 %, much higher than in Lower Saxony and
Germany as a whole.
The proportion of employees aged between 15 and 24 has
again fallen year-on-year. There has been a slight increase
in the proportion of foreign employees (9.6 %)
Employees paying social
insurance contributions
according to gender
Employees paying social
insurance contributions in
full-time employment
Employees paying social
insurance contributions in
part-time employment
Source: Federal Labour Office, audited results, calculations by the Hannover Region, reporting date 30.06.2016
100 %
80 %
60 %
40 %
20 %
0 %
Germany
53.6 46.4
100 %
80 %
60 %
40 %
20 %
0 %
Lower Saxony Germany
Female
Male
65.1 34.9 68.6 31.4 66.133.9
100 %
80 %
60 %
40 %
20 %
0 %
Hannover Region Lower Saxony Germany
20.4 79.617.7
82.322.7 77.3
Hannover Region
53.146.9
228,644
259,342
Lower Saxony
54.2 45.8
1,290,553
1,529,704
14,544,681
16,829,010
Hannover Region
122,159
227,986
635,013
1,388,629
7,741,590
15,083,746
106,477
31,349
655,500
141,019
6,802,785
1,744,845
Female
Male
Female
Male

11EMPLOYMENT
Employees paying social
insurance contributions
according to nationality
Employees paying social insurance
contributions according to level
of education
Source: Federal Labour Office, audited results, calculations by the Hannover Region, reporting date 30.06.2016
100 %
80 %
60 %
40 %
20 %
0 %
Hannover Region
9.6 90.4
Lower Saxony
7.1 92.9
Germany
1090
100 %
80 %
60 %
40 %
20 %
0 %
18.2
68.6
13.2
Lower Saxony
373,225
2,073,528
373,504
Germany
5,266,669
21,972,129
4,134,893
13.2
73.5
13.3 16.8
70
13.2
2,617,869
201,344
440,823
46,833
28,227,842
3,129,357
Hannover Region
88,884
334,918
64,184
German
Foreign
Employees paying social insurance
contributions according to
age structure
100 %
80 %
60 %
40 %
20 %
0 %
72.6
9.217.3
0.9
70.9
10.817.5
0.9
71.7
9.817.7
0.8
Hannover Region
44,797
354,414
84,617
4,158
Germany
3,084,668
22,482,643
5,551,853
254,526
Lower Saxony
303,543
1,998,702
493,415
24,597
Academic professional qualification
Vocational training
No vocational training
15–24 years of age
25–49 years of age
50–64 years of age
over 65 years of age

12 TRENDS AND FACTS 2017
The Hannover Region boasts a balanced economic structure
and a diverse spectrum of dynamic business sectors. This is
reflected in the distribution of people in work and paying
social insurance contributions according to economic sec-
tors. The number of persons paying social insurance contri-
butions rose in almost all economic sectors in comparison
to the previous year. Most jobs are in health and social services
(69,900), in manufacturing industries (67,530) and in trade
(65,180). Almost all economic sectors have seen a year on year
increase in job figures. There was significant jobs growth in art,
entertainment and recreation (+6.9 %) and in health and
social services (+5.3 %).

13EMPLOYMENT
2015 2016 Change
Absolute Share in % Absolute Share in % Absolute In %
Agriculture, forestry, fishing 1,297 0.3 1,270 0.3 –27 –2.1
Mining and pit & quarry industries 1,700 0.4 1,468 0.3 –232 –13.6
Manufacturing industries 67,505 14.0 67,528 13.8 23 0.0
Energy supply, water supply; sewage and waste disposal, and cleaning up environmental contamination
4,011 0.8 3,855 0.8 –156 –3.9
Other supply and disposal industries 3,983 0.8 3,891 0.8 –92 –2.3
Construction industry 20,450 4.3 21,042 4.3 592 2.9
Trading; maintenance and repair of vehicles 64,998 13.5 65,176 13.4 178 0.3
Transport and warehousing 31,918 6.6 32,276 6.6 358 1.1
Hospitality sector 14,954 3.1 15,299 3.1 345 2.3
Information and communication 20,119 4.2 20,058 4.1 –61 –0.3
Financial and insurance service providers 25,020 5.2 25,364 5.2 344 1.4
Real estate and property sector 3,701 0.8 3,808 0.8 107 2.9
Freelance, scientific and technical service providers
34,103 7.1 34,393 7.0 290 0.9
Other economic service providers 46,470 9.7 48,257 9.9 1,787 3.8
Public sector, defence; social insurance 31,536 6.6 32,656 6.7 1,120 3.6
Child care and education 22,107 4.6 20,607 4.2 –1,500 –6.8
Health and social services 66,499 13.8 69,993 14.3 3,494 5.3
Art, entertainment and recreation 5,537 1.2 5,920 1.2 383 6.9
Other service providers 14,333 3.0 14,541 3.0 208 1.5
Private households 559 0.1 584 0.1 25 4.5
Total 480,800 100.0 487,986 100.0 7,186 1.5
Source: Federal Labour Office, audited results, calculations by the Hannover Region, reporting date 30.06.2016
Employees paying social insurance contributions according to economic sector

14 TRENDS AND FACTS 2017
COMMUTING INTERRELATIONSHIPS
2016 saw the number of commuters coming into the
Hannover Region from outside rise to almost 125,000, a
figure approximately 25,000 higher than only 10 years ago.
Most of the incoming commuters come from the adjacent
districts of Hildesheim, Schaumburg, Celle, Peine, Hameln-
Pyrmont, Nienburg / Weser, Heidekreis and Gifhorn.
However, many commuters travel within the Hannover
Region. In addition to the State Capital Hannover (+115,200),
positive net commuter figures are also reported by Langen-
hagen (+11,800), Isernhagen (+1,700), Burgwedel (+1,800)
and Laatzen (+1,100).
*EPSI : Employees in jobs paying social insurance contributions
Source: Federal Labour Office, audited results, calculations by the Hannover Region, reporting date 30.06.2016
Commuting interrelationships
Inward commuters
Outward commuters Net
in % of EPSI* at the place
of residence
State Capital Hannover 173,315 58,132 115,183 58.3
Barsinghausen 4,410 8,883 –4,473 –36.4
Burgdorf 3,244 8,401 –5,157 –47.5
Burgwedel 6,920 5,130 1,790 24.3
Garbsen 8,927 18,125 –9,198 –40.3
Gehrden 2,563 4,279 –1,716 –33.1
Hemmingen 2,927 5,674 –2,747 –42.2
Isernhagen 8,639 6,942 1,697 20.4
Laatzen 12,701 11,628 1,073 7.4
Langenhagen 26,471 14,684 11,787 57.2
Lehrte 8,548 12,583 –4,035 –24.0
Neustadt am Rbge. 4,406 10,977 –6,571 –40.9
Pattensen 2,534 4,416 –1,882 –35.0
Ronnenberg 3,495 7,805 –4,310 –48.5
Seelze 4,081 11,195 –7,114 –54.4
Sehnde 4,283 7,442 –3,159 –34.9
Springe 3,588 7,231 –3,643 –35.5
Uetze 1,611 5,877 –4,266 –56.2
Wedemark 4,529 8,294 –3,765 –34.5
Wennigsen 1,822 4,138 –2,316 –47.4
Wunstorf 6,804 10,201 –3,397 –22.7
Hannover Region 124,301 60,520 63,781 15.0

15COMMUTING INTERRELATIONSHIPS
IN 2016, THE HANNOVER REGION COUNTED ALMOST 125,000 COMMUTERS COMING IN FROM OUTSIDE THE REGION, WHICH IS AROUND 25,000 HIGHER THAN THE FIGURE ONLY 10 YEARS AGO.
Hannover
Neustadt a. Rbge.
Wunstorf
Garbsen
Wedemark Burgwedel
Burgdorf UetzeIsernhagen
Seelze Lehrte
SehndeBarsinghausen
Wennigsen
Springe
Pattensen
HemmingenGehrden Ronnen-
berg
Langenhagen
Laatzen
7,23
1
3,58
8
4,41
6
2,53
44,13
8
1,822
5,67
4
2,92
77,805
3,49
5
4,27
9
2,56
3
8,88
3
4,41
0
11,19
5
4,08
1
11,6
28
12,7
01 7,442
4,28
3
12,5
83
8,54
8
58,13
2
173,
315
10,2
01
6,80
4
18,12
5
8,92
7 14,6
84
26,4
71
6,94
2
8,63
9
8,40
1
3,22
4
5,87
7
1,611
5,13
0
6,92
0
8,29
4
4,52
9
10,9
77
4,40
6
more than 45 %
0 % to below 45 %
–45 % to below 0 %
more than –45 %
Inward commuters
Outward commuters
Commuter interrelationships

16 TRENDS AND FACTS 2017
JOB MARKET
Source: Federal Labour Office, calculations by the Hannover Region
Unemployment figures in the Hannover Region
The number of unemployed and the
unemployment rates in Hannover Region
have again fallen compared to the previous
year. In June 2017, some 43,500 (–2,250)
people were out of work; this corresponds
to an unemployment rate of 7.1 % (–0.4 %)
with respect to the total civil workforce.
There are approximately 18,000 persons
registered as long-term unemployed,
of which 14,200 are foreigners, 2,000
severely disabled, 13,200 older persons
and 3,900 people under the age of 25.
Figures in % Change in % points
With respect to ... June 2016 June 2017
Total civil workforce
7.5 7.1 –0.4
Male 8.0 7.4 –0.6
Female 6.9 6.7 –0.2
15 to less than 25 years of age
7.3 6.4 –0.9
15 to less than 20 years of age
5.3 4.2 –1.1
50 to less than 65 years of age
7.2 6.8 –0.4
55 to less than 65 years of age
7.6 7.1 –0.5
Source: Federal Labour Office, calculations by the Hannover Region
Unemployment rate in the Hannover Region
June 2016 June 2017 Change
Absolute Share in % Absolute Share in % Absolute In %
Total 45,753 100.0 43,495 100.0 –2,258 –4.9
Male 25,492 55.7 23,945 55.1 –1,547 –6.1
Female 20,261 44.3 19,550 44.9 –711 –3.5
15 to less than 25 years of age
4,450 9.7 3,934 9.0 –516 –11.6
Over 50 years of age 13,800 30.2 13,246 30.5 –554 –4.0
Long-term unemployed
19,267 42.1 18,118 41.7 –1,149 –6.0
Severely disabled 2,188 4.8 2,025 4.7 –163 –7.4
Foreigners 14,595 31.9 14,210 32.7 –385 –2.6

17
ECONOMIC METRICS
The gross domestic product (GDP) per head of the working
population is a key metric for employment productivity.
The GDP per capita is a key metric for the prosperity of a
region. In the Hannover Region both of these parameters
fall well above the federal and state averages: GDP per
head of the working population is € 69,300 while GDP per
capita is approx. € 40,500. The gross added value, which
reflects the total value of all produced goods and services,
also shows the Hannover Region having per-capita values
higher than the federal and state figures. This highlights
the strong competitiveness of the Hannover Region.
JOB MARKET . ECONOMIC METRICS
Source: National accounts of the states, federal and state statistics offices, calculations by the Hannover Region
Source: National accounts of the states, federal and state statistics offices, calculations by the Hannover Region
70,000
60,000
50,000
40,000
30,000
20,000
10,000
0
per capita in € per working person in €2013
35,9
19
27,9
90
31,4
57
2014
36,4
83
28,6
31
32,3
90
2013
61,8
91
56,0
08
59,9
33
2014
62,3
81
56,8
59
61,4
26
70,000
60,000
50,000
40,000
30,000
20,000
10,000
0
per capita in € per working person in €2013
39,9
39
31,12
3
34,9
78
2014
40
,552
31,8
24
36,0
03
201368
,819
62,
277
66,6
42
2014
69,3
38
63,2
01
68,2
77 Hannover Region
Lower Saxony
Germany
Hannover Region
Lower Saxony
Germany
Gross added value
Gross Domestic Product
18 TRENDS AND FACTS 2017
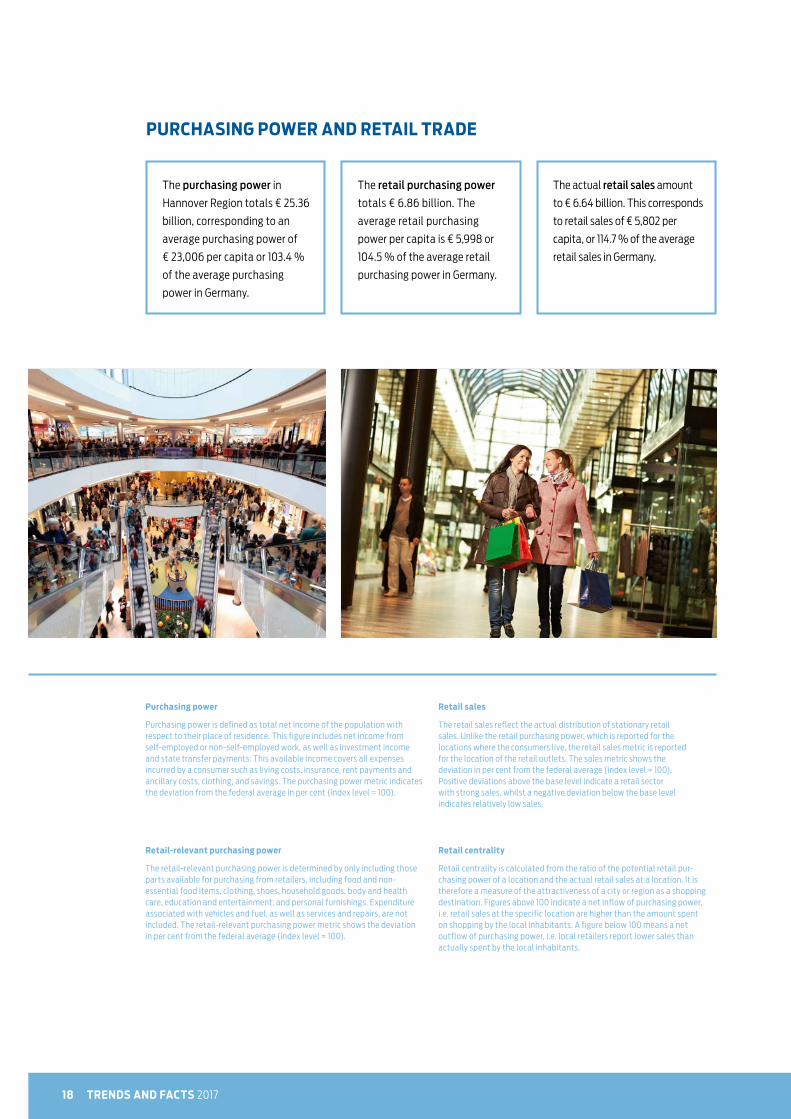
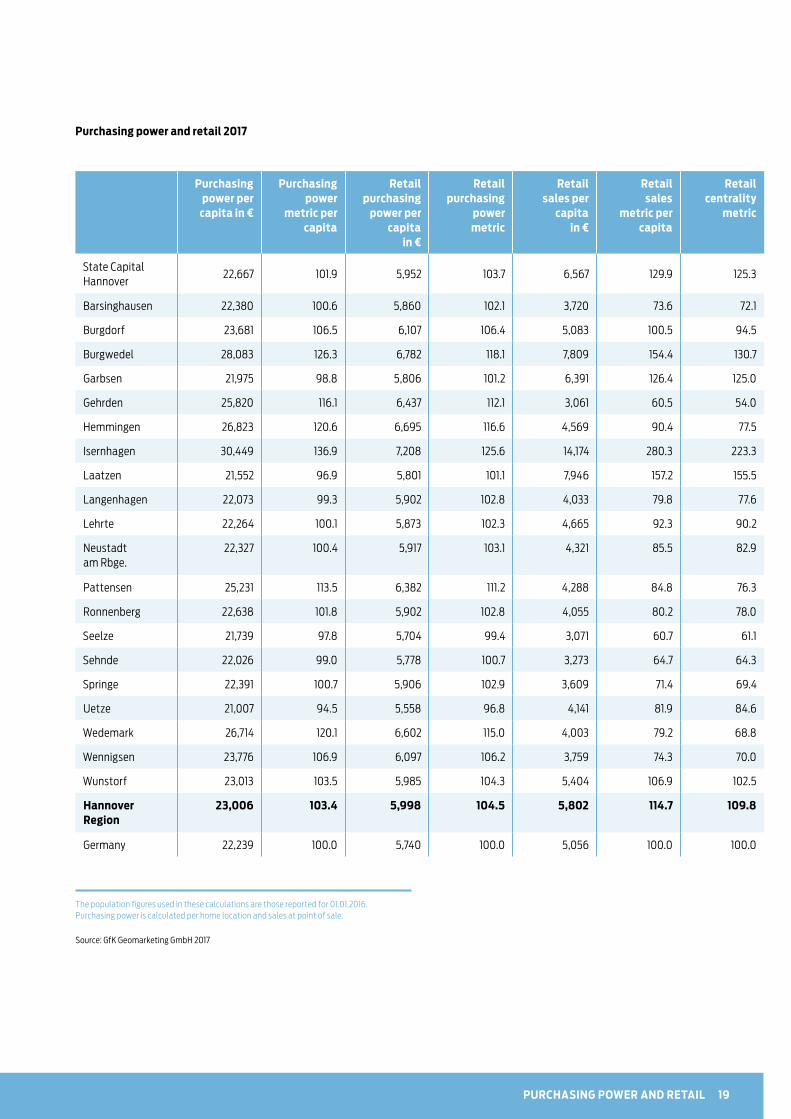
PURCHASING POWER AND RETAIL TRADE
Purchasing power
Purchasing power is defined as total net income of the population with respect to their place of residence. This figure includes net income from self-employed or non-self-employed work, as well as investment income and state transfer payments. This available income covers all expenses incurred by a consumer such as living costs, insurance, rent payments and ancillary costs, clothing, and savings. The purchasing power metric indicates the deviation from the federal average in per cent (index level = 100).
Retail-relevant purchasing power
The retail-relevant purchasing power is determined by only including those parts available for purchasing from retailers, including food and non- essential food items, clothing, shoes, household goods, body and health care, education and entertainment, and personal furnishings. Expenditure associated with vehicles and fuel, as well as services and repairs, are not included. The retail-relevant purchasing power metric shows the deviation in per cent from the federal average (index level = 100).
Retail sales
The retail sales reflect the actual distribution of stationary retail sales. Unlike the retail purchasing power, which is reported for the locations where the consumers live, the retail sales metric is reported for the location of the retail outlets. The sales metric shows the deviation in per cent from the federal average (index level = 100). Positive deviations above the base level indicate a retail sector with strong sales, whilst a negative deviation below the base level indicates relatively low sales.
Retail centrality
Retail centrality is calculated from the ratio of the potential retail pur- chasing power of a location and the actual retail sales at a location. It is therefore a measure of the attractiveness of a city or region as a shopping destination. Figures above 100 indicate a net inflow of purchasing power, i.e. retail sales at the specific location are higher than the amount spent on shopping by the local inhabitants. A figure below 100 means a net outflow of purchasing power, i.e. local retailers report lower sales than actually spent by the local inhabitants.
Begriffserklärung:
The purchasing power in
Hannover Region totals € 25.36
billion, corresponding to an
average purchasing power of
€ 23,006 per capita or 103.4 %
of the average purchasing
power in Germany.
The retail purchasing power
totals € 6.86 billion. The
average retail purchasing
power per capita is € 5,998 or
104.5 % of the average retail
purchasing power in Germany.
The actual retail sales amount
to € 6.64 billion. This corresponds
to retail sales of € 5,802 per
capita, or 114.7 % of the average
retail sales in Germany.
19PURCHASING POWER AND RETAIL
Purchasing power per
capita in €
Purchasingpower
metric percapita
Retailpurchasing
power percapita
in €
Retailpurchasing
powermetric
Retailsales per
capitain €
Retailsales
metric percapita
Retailcentrality
metric
State Capital Hannover
22,667 101.9 5,952 103.7 6,567 129.9 125.3
Barsinghausen 22,380 100.6 5,860 102.1 3,720 73.6 72.1
Burgdorf 23,681 106.5 6,107 106.4 5,083 100.5 94.5
Burgwedel 28,083 126.3 6,782 118.1 7,809 154.4 130.7
Garbsen 21,975 98.8 5,806 101.2 6,391 126.4 125.0
Gehrden 25,820 116.1 6,437 112.1 3,061 60.5 54.0
Hemmingen 26,823 120.6 6,695 116.6 4,569 90.4 77.5
Isernhagen 30,449 136.9 7,208 125.6 14,174 280.3 223.3
Laatzen 21,552 96.9 5,801 101.1 7,946 157.2 155.5
Langenhagen 22,073 99.3 5,902 102.8 4,033 79.8 77.6
Lehrte 22,264 100.1 5,873 102.3 4,665 92.3 90.2
Neustadt am Rbge.
22,327 100.4 5,917 103.1 4,321 85.5 82.9
Pattensen 25,231 113.5 6,382 111.2 4,288 84.8 76.3
Ronnenberg 22,638 101.8 5,902 102.8 4,055 80.2 78.0
Seelze 21,739 97.8 5,704 99.4 3,071 60.7 61.1
Sehnde 22,026 99.0 5,778 100.7 3,273 64.7 64.3
Springe 22,391 100.7 5,906 102.9 3,609 71.4 69.4
Uetze 21,007 94.5 5,558 96.8 4,141 81.9 84.6
Wedemark 26,714 120.1 6,602 115.0 4,003 79.2 68.8
Wennigsen 23,776 106.9 6,097 106.2 3,759 74.3 70.0
Wunstorf 23,013 103.5 5,985 104.3 5,404 106.9 102.5
Hannover Region
23,006 103.4 5,998 104.5 5,802 114.7 109.8
Germany 22,239 100.0 5,740 100.0 5,056 100.0 100.0
The population figures used in these calculations are those reported for 01.01.2016. Purchasing power is calculated per home location and sales at point of sale.
Source: GfK Geomarketing GmbH 2017
Purchasing power and retail 2017

20 TRENDS AND FACTS 2017
BUSINESS ENTERPRISES
NORD/LB publishes an annual ranking of Lower Saxony’s
businesses with the highest sales and value added results.
These companies safeguard the jobs and incomes of the
neighbouring commercial, trade and services enterprises
and are therefore the economic backbone of the location.
27 of the 100 companies in Lower Saxony with the highest
sales have their registered head offices in the Hannover
Region. 15 of these companies work in the manufacturing
sector. They are dominated by the automotive industry
and its subcontractors, and also include businesses in the
electronic engineering, aircraft construction, chemical and
food sectors. Large trading and service companies are also
headquartered in the Hannover Region.
Of the 50 companies in Lower Saxony with the highest value
added, 22 are located in the Hannover Region, including
enterprises working in the health, insurance and financial
sectors which are not reported under the companies with
the highest sales values.
Company Registered seat
Sales in € million
Employees Sector Ranking in Lower
Saxony
Continental AG (K)
ContiTech AG (K)Hannover
39,232.0
5,367.0
207,461
42,648
Automotive subcontracting industry
2
TUI AG (K)** Hannover 20,011.6 71,242 Tourism 3
Volkswagen Nutzfahrzeuge Hannover 10,341.0 20,800Commercial vehicle construction
1
AGRAVIS Raiffeisen AG (K) Hannover 6,934.5 6,233 Agricultural trading 6
DIRK ROSSMANN GMBH Burgwedel 5,024.6 26,318Wholesale and retail (drugstore articles)
8
Stadtwerke Hannover AG Hannover 2,311.6 2,274Energy supplies, energy services
19
Johnson Controls Power Solutions Europe (K)**
Johnson Controls Autobatterie GmbH & Co. KGaA **
Hannover
1,854.4
1,249.7
3,106
482
Accumulator and battery production
23
Expert AG(K)** Langenhagen 1,749.7 1,509Wholesale and retail (elec-trical and electronic devices)
24
Siemens AG** Laatzen 1,618.5 3,792 Electrical engineering 24
WABCO Holding GmbH (K) Hannover 1,200.9 2,552Automotive subcontracting industry
32
Konica Minolta Business Solutions Europe GmbH*
Langenhagen 1,186.4 415Production and marketing of printers and photocopiers
33
TÜV NORD Gruppe (K) Hannover 1,116.6 9,861 Technical services 35
Solvay Deutschland (Group) Hannover 1,110.4 2,639 Chemical industry 36
Companies with highest sales based in the Hannover Region

21BUSINESS ENTERPRISES
Company Registered seat
Sales in € million
Employees Sector Ranking in Lower
Saxony
MTU Maintenance Hannover GmbH Langenhagen 1,078.6 1,855 Aircraft engine maintenance 37
NEXANS DEUTSCHLAND GMBH GRUPPE (K) Hannover 965.7 11,437 Cable manufacturing 42
BauKing AG (K) Hannover 826.4 3,349Wholesale and retail (construction materials)
46
Sonepar Deutschland/ Region Nord-Ost GmbH
Hannover 804.6 1,558 Wholesale (electronics) 47
Toto-Lotto Niedersachsen GmbH Hannover 747.8 155 Lottery company 50
Sennheiser electronic GmbH & Co. KG (K) Wedemark 682.2 2,704 Electro-acoustics 57
Verlagsgesellschaft Madsack GmbH & Co. KG (K)
Hannover 649.5 5,280 Publishing 59
GP Günter Papenburg AG (K) Hannover 635.6 3,252 Construction industry 62
Klinikum Region Hannover GmbH Hannover 571.4 5,626 Health sector 67
Delticom AG (K) Hannover 559.8 129 Retail 68
Bahlsen Gruppe (K)
Bahlsen GmbH & Co. KGHannover
533.7
382.4
2,400
1,563Food industry 73
Konica Minolta Business Solutions Deutschland GmbH*
Langenhagen 461.4 1,781Production and marketing of computers and photocopiers
79
Kone GmbH (K) Hannover 412.5 1,912Production of elevators and escalators
88
CB-Group (K) Hannover 370.2 645 Chemical distribution 93

22 TRENDS AND FACTS 2017
Company Registered seat
Turnover in € million
Employees Sector Ranking in Lower
Saxony
Talanx AG (K)Hannover
2,758.0 21,892Insurance, re-insurance 4
Hannover Rück SE (K) 2,483.1 2,568
NORD/LB (K)Hannover
1,306.6 6,023Financial services 6
NORD LB 533.3 4,070
Medizinische Hochschule Hannover Hannover 484.5 7,842 Health 16
VHV Vereinigte Hannoversche Versicherung a.G. (K)
VHV Allgemeine Versicherung AG
Hannover
443.1
205.2
2,914
367
Insurance 19
Nds. Wach- und Schließgesellschaft Eggeling u. Schorling KG (K)
Hannover 176.1 5,100 Personal and property security 47
Versicherungsgruppe Hannover VGH Hannover 170.3 1,827 Insurance 49
Sparkasse Hannover Hannover 169.5 2,025 Financial services 50
Companies with the highest sales based in the Hannover Region (extract)
K = consolidated conglomerate or group
* Figures for the 2015/2016 financial year
** Figures for the 2014/2015 financial year
Methodology: The companies are considered in their entirety as conglome-rates or groups to reflect the particular role played by group HQs in economic terms. However, this also means that not all turnover, added value and employees reported here apply to the Hannover Region specifically. The NORD/LB analysis only considers companies domiciled in Lower Saxony or who provide data on activities in Lower Saxony. Other companies, for example units of major companies, who may be of high regional economic importance, but are not separately reported, are not included in the NORD/LB listings.
Source: NORD/LB (November 2016): Niedersachsen Report – 100 biggest companies in Lower Saxony

23
Almost 51,000 businesses in a range of economic sectors
are registered in the Hannover Region, including around
44,000 mini businesses with less than 9 employees, and
over 237 major businesses with more than 250 employees.
Almost one in five of these businesses works in the trading
sector. This is followed by freelance and scientific services
businesses (e.g. firms of architects or engineers, legal and
tax consultants, advertising companies and market
research companies), the property and housing sector,
building industry, and health and social services.
BUSINESS ENTERPRISES
AbsoluteShare
in %
Mining and pit and quarry industries 22 0.04
Manufacturing industry 2,268 4.46
Energy supplies 381 0.75
Water supplies, wastewater and waste disposal
114 0.22
Construction industry 4,426 8.70
Trading; servicing and repair of motor vehicles
9,545 18.76
Transport and storage 1,853 3.64
Hospitality sector 3,258 6.40
Information and communications 2,063 4.06
Finance and insurance services 1,098 2.16
Property and housing industry 4,517 8.88
Freelance, scientific and technical services 8,144 16.01
Other business services 3,097 6.09
Child care and education 1,332 2.62
Health and social services 3,825 7.52
Art, entertainment and recreation 1,586 3.12
Other services 3,338 6.56
Total 50,867 100.00
Businesses in the Hannover Region according to economic sector
Source: State Office of Statistics Lower Saxony, calculations by the Hannover Region, reporting date 29 Feb 2016
0 to 9 44,601
10 to 49 4,894
50 to 249 1,135
250 and more 237
Total 50,867
Businesses in the Hannover Region according to size of workforce
Source: State Office of Statistics Lower Saxony, calculations by the Hannover Region, reporting date 29 Feb 2016

24 TRENDS AND FACTS 2017
KEY SECTORS
The current business structure in the Hannover Region is
characterised by 12 key sectors boasting major innovation
and job creation potential. More than 70 % of all emplo-
yees paying social insurance contributions work in these
key sectors.
hannoverimpuls, the region’s business promotion organi-
sation, targets funding to the key sectors in the fields of
“energy and mobility”, “digital economy and production
Automotive industry
23,500 EPSIs* in the whole automotive value chain (4.9 % of TW**)
Together with Braunschweig and Wolfsburg, the Hannover Region is one of
the most significant international automotive centres
Resident companies: VW Nutzfahrzeuge, Continental AG, as well as
numerous subcontractors such as WABCO and Johnson Controls
Main activities: commercial vehicles, tyres, drive systems, special compo-
nents, braking systems, battery technology, vehicle information systems
Education and research institutes: 30 institutes and university facilities
associated with the automotive industry
The metropolitan region was subsidised by the federal programme
“Schaufenster Elektromobilität” (E-mobility showcase)
ITS Automotive as a cross-disciplinary mobility cluster for research
group projects
Flagship trade fairs: IAA commercial vehicles, Mobilitec incorporated within
Hannover Messe
Energy solutions
4,100 EPSIs* (0.9 % of TW**) in 65 companies
Resident companies: power station operators E.ON Kernkraft and enercity
as well as the largest energy utility and companies involved in the develop-
ment and implementation of new technologies (e.g. CHP-manufacturer
A-Tron, energiewerkstatt or Kraftwerk, Windwärts Energie, GeoNet –
Umweltconsulting)
Education and research organisations: 20 institutes and university facilities
involved in the energy industry, for example in wind power
Networks: Leibniz research centre Energie 2050 ForWind (research network
into wind power), climate protection agency Hannover Region,
Geozentrum Hannover
The world’s first wind turbine tower with a wooden construction and the first
biogas plant in North Germany which can feed biogas into natural gas grid
Flagship trade fairs: BioEnergy Decentral and Energy and wind, both
incorporated in the Hannover Messe
engineering”, “life sciences and medical technology” and
“the creative sector and multimedia”.
Other important sectors in the Hannover Region’s job
market continue to be the logistics industry, financial
services, knowledge-based services and the trades. The
conference and trade fair sector boosts national and
international awareness of the business location and
has a positive impact on Hannover Region’s image.

25KEY SECTORS
Health care
66,200 EPSIs* (13.8 % of TW**) in some 3,400 en-
terprises
Strong university and extra-university research and
education: Hannover Medical School, University
of Veterinary Medicine Hannover, Life Science at
Leibniz University Hannover, Hannover Clinical Trial
Centre, Fraunhofer Institute for Toxicology and
experimental medicine (ITEM), Lower Saxony
Centre for Biomedical Technology, Implant Research
and Development (NIFE), Clinical Research Centre
(CRC), Twincore Centre for Experimental and Clinical
Infection Research
Key clinic site and major players such as
Abbot Pharmaceuticals, Boehringer Ingelheim,
KIND Hörgeräte
Medical Park Hannover is the central business and
research location focusing on biomedical technology,
transplants, implants, regenerative medicine, diagnos-
tics, pre-clinical and clinical research and training
Network: Gesundheitswirtschaft Hannover e. V.
Flagship fairs: Altenpflege and Biotechnica –
Labvolution
Production engineering
12,400 EPSIs* (2.6 % of TW**) in 455 enterprises
Education and research: production Engineering
Centre (PZH), mechanical engineering faculty of
Leibniz University Hannover, mechanical engineering,
electrical engineering and information technology
departments of the University of Applied Sciences
and Arts Hannover
Cooperation with the Laser Centre Hannover (LZH),
the Institute for Integrated Production Hannover
(IPH), the Mechatronics Centre Hannover (MZH)
and the German Institute for Rubber Technology
(DIK)
Robotation Academy as a training and event centre
for robots and automation technology
Location of the German government’s Mittelstand 4.0
competence centre for Lower Saxony and Bremen
Networks: e.g. mit uns digital, competence network
optical technologies
Flagship fairs: Hannover Messe, EuroBLECH,
Agritechnica, EMO and LIGNA
* EPSI: employees paying social insurance contributions ** TW: total workforce
Source: Hannover Region (Business report 2016)

26 TRENDS AND FACTS 2017
Information and communications technology
22,800 EPSIs* (4.7 % of TW**)
Key companies including: Finanz Informatik, TUI,
InfoTec, htp, Sennheiser, Madsack, NDR etc.
Highly diversified sector structure specialising in
IT services
Education and research institutes: 25 institutes and
university facilities active in the IT and communi-
cations sector, including IT and multimedia campus
“Expo Park” and L3S
Networks: Hannover IT e. V.
Flagship fairs: CeBIT and the Digital Factory
incorporated in Hannover Messe
Creative sector
20,670 EPSIs* (4.3 % of TW**)
Key segment music industry: University for Music,
Drama and Theatre, important players like NDR Radio-
philharmonie, Peppermint Park, Sennheiser
Many projects and events as part of the UNESCO
City of Music
Start-up centre HALLE 96 with offices and work
places and shared infrastructure
Network: kre|H|tiv Netzwerk e. V. as the fastest
growing national and largest industry network
of its kind
Logistics economy
54,000 EPSIs* (11.2 % of TW**) in some 3,000
enterprises (sectoral approach)
Key players: DHL, Kühne+Nagel, DB Schenker,
Dachser, UPS, TNT, Hellmann, Hermes, DPD,
Syncreon etc.
Main focuses: industry logistics, trade logistics,
e-commerce, courier, express and parcel services,
contract logistics, after-sales
European and national distribution centres for VW
Commercial Vehicles, Mercedes-Benz, arvato, Bahlsen,
Lyreco, Sonepar, Weatherford, Delticom, EDC etc.
Logistics-centric research institutes: institute for
transport and automation technology, institute for
integrated production, institute for factory systems
and logistics
Networks: Logistikportal Niedersachsen e. V.,
roundtable Personnel Logistics of Region Hannover
Flagship fairs: CeMAT, the world’s largest exhibition
for intralogistics

27KEY SECTORS
Financial services
25,000 EPSIs* (5.2 % of TW**)
Head offices of key national insurance companies
(e.g. Talanx, Vereinigte Hannoversche Versicherung,
Versicherungsgruppe Hannover, Concordia
Versicherungsgruppe, Mecklenburgische
Versicherungsgruppe, Wertgarantie Technische
Versicherung, HannoverRück-Gruppe)
Head offices of Nord/LB, of Deutsche Hypotheken-
bank, of Niedersächsischen Börse as well as one of
the largest savings banks (Sparkasse) in Germany
Key training and education centres: Sparkasse Academy,
Vocational Academy for the Banking Industry, Insurance
Industry Training Centre, Insurance Sciences Inter-
disciplinary Competence Centre
Trade fair and congress industry
1,400 EPSIs* (0.3 % of TW**)
World’s largest exhibition ground with Deutsche Messe AG as strong player
69 shows in 2016 with 1.24 million visitors
Location of leading international flagship fairs such as CeBIT, Hannover
Messe, Agritechnica, IAA Trucks, EMO, Biotechnica/Labvolution
Number of major congresses and conferences climbs every year enjoying
national coverage
Conference and congress centres such as Convention Center, Hannover
Congress Centrum, Herrenhausen Palace
* EPSI: employees paying social insurance contributions ** TW: total workforce
Source: Hannover Region (Business report 2016)

28 TRENDS AND FACTS 2017
Trades
60,000 EPSIs* (13.5 % of TW**) in 11,400 enter-
prises, with annual sales of approx. € 4.7 billion
Main sectors: building and interior finishing (3,240
enterprises), health/body care/cleaning (3,120 enter-
prises) and the metal industry (2,810 enterprises)
Important stimulus for innovation which is also
applied in other economic areas, e.g. the energy sector
One in five trainees in the Hannover Region are
trade apprenticeships
Research and service facilities:
Heinz-Piest-Institut (HPI) for the trades
Training and education: training and education
centre of the chamber of trades Hannover

29KEY SECTORS
Knowledge-based company-centric services
32,800 EPSIs* (6.8 % of TW**) in legal, tax and
management consulting firms, architects and
engineering service companies, and advertising and
market research
Resident companies: branch offices of major service
companies such as Pricewaterhouse-Coopers,
Deloitte, Ernst & Young
The creation of an innovation and research campus at
Hannover Garbsen offers more future potential, in
particular for organisations in the engineering sector
Science and research
7,900 EPSIs* (1.7 % of TW**)
Characterised by the medical sector (Hannover
Medical School, University of Veterinary Medicine
Hannover, Leibniz University Hannover, Fraunhofer
Gesellschaft, Medical Park)
Above average number of start-ups
Above average number of third-party-funded jobs
Cooperation between science and industry’s manu-
facturing sector, above all in the automotive sector
* EPSI: employees paying social insurance contributions ** TW: total workforce
Source: Hannover Region (Business Report 2016)

30 TRENDS AND FACTS 2017
EDUCATION AND SCIENCE
The Hannover Region boasts super-regional significance
as an education location. Compared with the rest of Lower
Saxony and Germany, an above average number of pupils
gain university entrance qualifications (39.9 %). Overall,
approximately 11,300 pupils gained school leaving certi-
ficates in the Hannover Region in 2015 at one of the more
than 100 secondary schools.
100 %
90 %
80 %
70 %
60 %
50 %
40 %
30 %
20 %
10 %
0 %
Hannover Region Lower Saxony Germany
39.9 %
3.2 %
40.3 %
11.9 %
4.7 %
32.5 %
2.1 %
47.4 %
13 %
5.0 %
34.0 %
2.1 %
41.7 %
16.5 %
5.6 %
School leavers
University entrance qualification
Applied science university entrance
qualification
Secondary school leaving certificate
Lower secondary school leaving
certificate
Special needs school leaving
certificate or no school
leaving certificate*
* No distinction is made at a federal level between pupils leaving school with a special needs school leaving certificate or no school leaving certificate
Source: State Office of Statistics Lower Saxony, calculations by the Hannover Region, School Leaving Qualifications 2015

31EDUCATION AND SCIENCE
In terms of professional education, the Hannover Region
has a top ranking in Germany – taking as a measure the
number of vocational school students per head of popu-
lation. Almost 41,000 vocational students attend the wide
range of training establishments. These include not only
the vocational colleges focusing on training in specific
sectors – including specialist vocational colleges, technical
secondary schools, vocational grammar schools and
training colleges – but also a wide range of other school
types with a broad spectrum of training objectives and
entrance qualifications.
One third of the students learn business and administration
vocations, followed by technical professions covering elec-
trical engineering, mechanical engineering, automotive,
construction and printing technology as well as vocations
in the food/nutrition sector and social and health services.
Source: State Office of Statistics Lower Saxony, reporting date November 2015
Vocational training students
According to school type
Vocational school (part-time) 26,720
First year vocational training 427
Vocational preparation 742
Vocational college 6,637
Technical secondary school 2,683
Upper vocational school 35
Vocational grammar school 1,851
Technical college 2,321
Total 41,416
According to vocation
Agriculture 797
Construction 889
Chemistry, physics, biology 774
Printing technology 745
Electrical engineering 3,439
Paint technology/interior design 715
Health 2,065
Wood technology 372
Gardening and Landscaping 636
Body care 686
Social services 2,092
Mechanical engineering 3,393
Nutrition 2,217
Social services 2,947
Automotive 1,723
Other recognised vocational training 1,205
Technology 497
Various vocations 663
Without training contracts
(at a vocational school)322
Business and administration 14,240
Textile technology and clothing 244
Domestic science 755
Total 41,416
32 TRENDS AND FACTS 2017
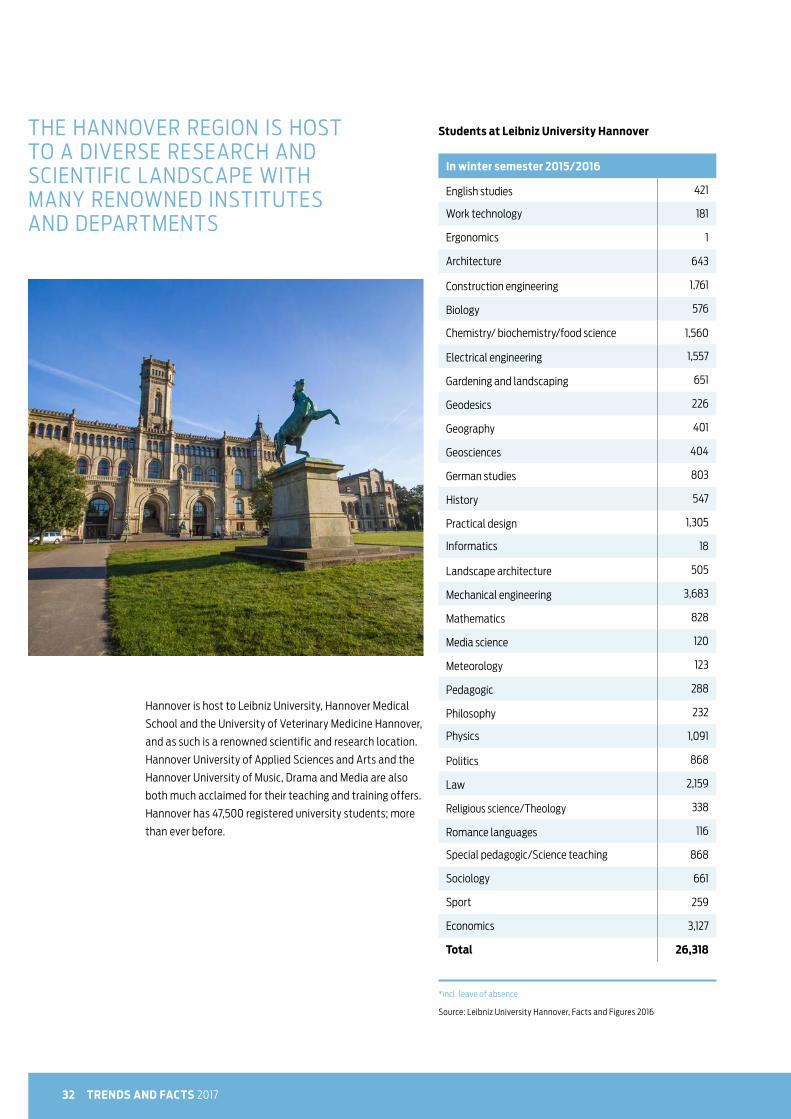
Hannover is host to Leibniz University, Hannover Medical
School and the University of Veterinary Medicine Hannover,
and as such is a renowned scientific and research location.
Hannover University of Applied Sciences and Arts and the
Hannover University of Music, Drama and Media are also
both much acclaimed for their teaching and training offers.
Hannover has 47,500 registered university students; more
than ever before.
English studies 421
Work technology 181
Ergonomics 1
Architecture 643
Construction engineering 1,761
Biology 576
Chemistry/ biochemistry/food science 1,560
Electrical engineering 1,557
Gardening and landscaping 651
Geodesics 226
Geography 401
Geosciences 404
German studies 803
History 547
Practical design 1,305
Informatics 18
Landscape architecture 505
Mechanical engineering 3,683
Mathematics 828
Media science 120
Meteorology 123
Pedagogic 288
Philosophy 232
Physics 1,091
Politics 868
Law 2,159
Religious science/Theology 338
Romance languages 116
Special pedagogic/Science teaching 868
Sociology 661
Sport 259
Economics 3,127
Total 26,318
Students at Leibniz University Hannover
In winter semester 2015/2016
*incl. leave of absence
Source: Leibniz University Hannover, Facts and Figures 2016
THE HANNOVER REGION IS HOST TO A DIVERSE RESEARCH AND SCIENTIFIC LANDSCAPE WITH MANY RENOWNED INSTITUTES AND DEPARTMENTS

33
Other universities and applied science universities
University of Applied Sciences and Arts Hannover 9,871
Hannover Medical School 3,456
University of Veterinary Medicine Hannover 2,402
University of Music, Drama and Media Hannover 1,556
Municipalities University of Administration in Lower Saxony
1,100
FOM University for Economics and Management 962
Leibniz Applied Science University 568
Applied Sciences University for Business 526
b.i.b International College 210
University of Applied Sciences of SME’s (FHM) 334
Vocational Academy of the Banking Sector 109
GISMA Business School 60
Total 21,154
Institute
Source: data provided by universities
Students in winter semester 2016/2017
EDUCATION AND SCIENCE
Science, Research, technology transfer,
start-up centres
Science and research represent cross-functional sectors
across various areas of the economy and are becoming
increasingly important in today’s globalised knowledge
economy. The Hannover Region is host to a very diverse
research and science sector with internationally acclaimed
institutes and faculties. Major strengths are in the medical
sector and the engineering disciplines – primarily in tech-
nology, research and knowledge-based segments of manu-
facturing industries, in particular in the automotive and
production engineering sectors.
Furthermore, Hannover-based research organisations
participate in a range of super-regional research networks,
e.g. ForWind-centre for wind energy research and the Audi-
tory Valley focusing on hearing. This creates a broad range
of opportunities for local cooperation in both research and
development as well as in the training and further training
of qualified skilled staff. The transfer of knowledge and
technology between research institutes and companies in
the Hannover Region is coordinated and supported by
numerous service providers and interfaces. Several start-up
centres support and assist innovative start-ups and young
enterprises in achieving their ideas. The Lower Saxony open
university coordinates the opening of new target groups, in
particular for those with vocational qualifications.
THE HANNOVER REGION BOASTS A VERY DIVERSE RESEARCH AND SCIENCE SECTOR WITH INTER- NATIONALLY ACCLAIMED INSTITUTES AND FACULTIES.
34 TRENDS AND FACTS 2017
13
12
33
15
1
2
3
4
5
7
8
9
10
19
22
17
18
36
38
37
4116
20
21
23
24
25
2642
27
43
48
28
2931
3230
35
34
39
4047
45
44
46
14
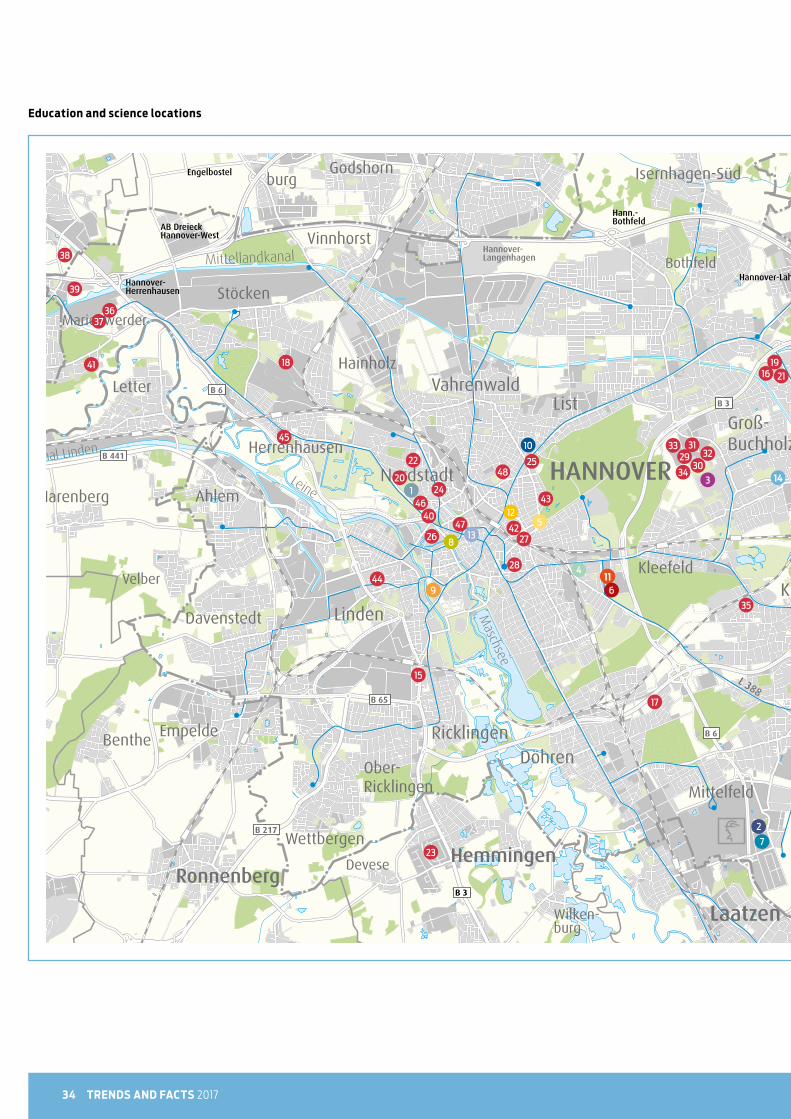
116
Education and science locations

35EDUCATION AND SCIENCE
Universities
1 Leibniz University Hannover (main campus)
2 University of Applied Sciences and Arts
Hannover (main campus)
3 Hannover Medical School
4 University of Veterinary Medicine Hannover
(main campus)
5 University of Music, Drama and Media Hannover
6 Applied Sciences University for Business
7 Leibniz Applied Science University
8 GISMA Business School
9 Municipalities University in Lower Saxony
10 University of Applied Sciences of SME’s (FHM)
11 b.i.b International College
12 FOM University for Economics and Management
13 Service office Open University
14 Berufsakademie für Bankwirtschaft
Selected research and science institutes
Natural sciences
15 Limnology and Water Protection
16 Federal Institute for Geosciences and
Natural Resources (BGR)
17 German Institute for Rubber Technology (DIK)
18 Limestone-Sand Research Association
19 Institute for Joint Geo scientific Activities
20 Nano and Quantum Engineering Laboratory
21 Leibniz University for Applied Geophysics (LIAG)
22 Max Planck Institute for Gravitational Physics
(Albert Einstein Institute)
Construction engineering
23 District Heating Research Institute in Hannover
24 Institute for Engineering Hydrology
25 Institute for Construction Research
Social sciences and philosophy
26 Research Institute for Philosophy Hannover
27 ISP Eduard Pestel Institute for Systems Research
28 Social Sciences Institute of the Protestant
Church in Germany
Medicine
29 Hannover Clinical Trial Center GmbH
30 Fraunhofer Institute for Toxicology and
Experimental Medicine (ITEM)
31 International Neuroscience Institute
Hannover GmbH (INI)
32 IPF PharmaCeuticals GmbH
33 Lower Saxony Centre for Biomedical Technology,
Implant Research and Development (MFE)
34 Twincore
Production engineering
35 European Research Corporation for Metal (EFB)
36 IPH Institute for Integrated Production
Hannover GmbH
37 Laser Centre Hannover
38 Production Engineering Centre Hannover (PZH)
39 Test Centre for Load-bearing Structures
Economics
40 Hannover Center of Finance
41 Medium-sized Enterprise Institute Lower Saxony
42 Lower Saxony Institute for Economics Research
Architecture, spatial sciences, landscape planning
43 Academy for Spatial Research and Regional
Planning (ARL)
44 ECOLOG Institute for Socio-ecological Research
and Education gGmbH
45 Lower Saxony Institute for Historical
Regional Research
Other
46 Heinz Piest Institute for the Trades (HPI)
47 German Centre for University and Science Research
DZHW
48 Criminological Research Institute Lower Saxony
(KFN)
Source: Ministry for Science and Education Lower Saxony, CIMA Institute for Regional Economics, State Capital Hannover, Hannover Region; reporting date July 2017
36 TRENDS AND FACTS 2017
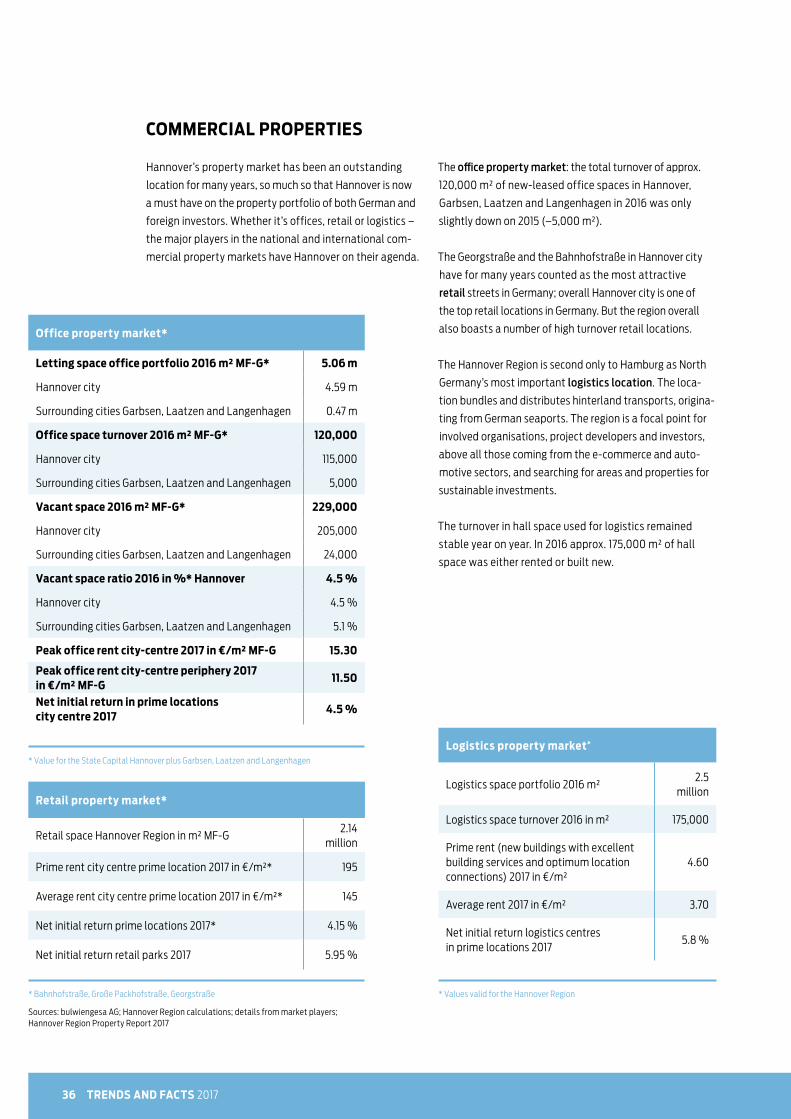
COMMERCIAL PROPERTIES
The office property market: the total turnover of approx.
120,000 m² of new-leased office spaces in Hannover,
Garbsen, Laatzen and Langenhagen in 2016 was only
slightly down on 2015 (–5,000 m²).
The Georgstraße and the Bahnhofstraße in Hannover city
have for many years counted as the most attractive
retail streets in Germany; overall Hannover city is one of
the top retail locations in Germany. But the region overall
also boasts a number of high turnover retail locations.
The Hannover Region is second only to Hamburg as North
Germany’s most important logistics location. The loca-
tion bundles and distributes hinterland transports, origina-
ting from German seaports. The region is a focal point for
involved organisations, project developers and investors,
above all those coming from the e-commerce and auto-
motive sectors, and searching for areas and properties for
sustainable investments.
The turnover in hall space used for logistics remained
stable year on year. In 2016 approx. 175,000 m² of hall
space was either rented or built new.
Hannover’s property market has been an outstanding
location for many years, so much so that Hannover is now
a must have on the property portfolio of both German and
foreign investors. Whether it’s offices, retail or logistics –
the major players in the national and international com-
mercial property markets have Hannover on their agenda.
Office property market*
Letting space office portfolio 2016 m² MF-G* 5.06 m
Hannover city 4.59 m
Surrounding cities Garbsen, Laatzen and Langenhagen 0.47 m
Office space turnover 2016 m² MF-G* 120,000
Hannover city 115,000
Surrounding cities Garbsen, Laatzen and Langenhagen 5,000
Vacant space 2016 m² MF-G* 229,000
Hannover city 205,000
Surrounding cities Garbsen, Laatzen and Langenhagen 24,000
Vacant space ratio 2016 in %* Hannover 4.5 %
Hannover city 4.5 %
Surrounding cities Garbsen, Laatzen and Langenhagen 5.1 %
Peak office rent city-centre 2017 in €/m² MF-G 15.30
Peak office rent city-centre periphery 2017 in €/m² MF-G
11.50
Net initial return in prime locations city centre 2017
4.5 %
* Value for the State Capital Hannover plus Garbsen, Laatzen and Langenhagen
Retail property market*
Retail space Hannover Region in m² MF-G 2.14
million
Prime rent city centre prime location 2017 in €/m²* 195
Average rent city centre prime location 2017 in €/m²* 145
Net initial return prime locations 2017* 4.15 %
Net initial return retail parks 2017 5.95 %
* Bahnhofstraße, Große Packhofstraße, Georgstraße
Sources: bulwiengesa AG; Hannover Region calculations; details from market players; Hannover Region Property Report 2017
Logistics property market*
Logistics space portfolio 2016 m² 2.5
million
Logistics space turnover 2016 in m² 175,000
Prime rent (new buildings with excellent building services and optimum location connections) 2017 in €/m²
4.60
Average rent 2017 in €/m² 3.70
Net initial return logistics centres in prime locations 2017
5.8 %
* Values valid for the Hannover Region

37
* Net basic rent
Source: IVD Commercial Property Price Comparison 2016/2017
Utility value, average in € per m²
Basic Moderate Good
Berlin 6.25 8.88 15.25
Bremen 4.50 7.00 9.00
Dortmund 5.50 7.50 9.50
Dresden 5.00 6.50 9.00
Essen 4.00 5.60 11.50
Frankfurt am Main 10.00 14.40 18.50
Hamburg 6.90 9.70 14.50
Hannover 5.50 6.75 11.00
Cologne 6.50 12.00 16.50
Leipzig 6.50 9.00 10.00
Munich 16.50 22.50 31.00
Nuremberg 6.60 8.07 9.64
Stuttgart 6.50 10.00 15.00
Office rents in selected cities*
COMMERCIAL PROPERTIES
The level of office and shop rents as well as the cost of
building land are key metrics for business location policy.
The price level is determined primarily by location factors,
such as the vicinity to Hannover’s city centre, transport
connections and near-by surrounding areas. The costs per
m² of office space in the State Capital Hannover range from
€ 5.50 per basic utility values up to € 11.00 for good utility
values. Shop rents in main shopping centres have a range
from € 14.00 to up to € 160.00, with a range of € 5.00 up to
€ 15.00 in adjacent core areas. These rental costs are mode-
rate when compared with other German cities.
Shopping area, average in € per m²
Prime site Secondary site
small (approx.
60 m²)
large (approx. 150 m²)
small(approx.
60 m²)
large (approx. 150 m²)
Berlin 180.00 125.00 35.00 25.00
Bremen 125.00 80.00 30.00 15.00
Dortmund 220.00 120.00 20.00 15.00
Dresden 110.00 n.a. n.a. n.a.
Essen n.a. n.a. n.a. n.a.
Frankfurt am Main 240.00 200.00 90.00 40.00
Hamburg 130.00 90.00 37.00 21.00
Hannover 160.00 80.00 25.00 14.00
Cologne 260.00 130.00 45.00 24.00
Leipzig 120.00 100.00 n.a. 30.00
Munich 410.00 320.00 170.00 110.00
Nuremberg 107.96 83.56 15.31 12.39
Stuttgart n.a. n.a. n.a. n.a.
Secondary core, average in € per m²
Prime site Secondary site
small (approx.
60 m²)
large (approx. 150 m²)
small(approx.
60 m²)
large (approx. 150 m²)
35.00 25.00 12.00 9.00
25.00 15.00 9.00 7.00
24.00 15.00 8.50 6.00
25.00 15.00 15.00 9.00
n.a. n.a. n.a. n.a.
55.00 40.00 20.00 18.00
27.00 21.00 16.00 11.00
15.00 10.00 7.00 5.00
25.00 12.00 7.00 6.00
25.00 15.00 12.00 10.00
110.00 40.00 35.00 23.00
19.70 12.91 8.47 6.68
n.a. n.a. n.a. n.a.
Shop rents in selected cities*
* Net basic rent, ground level
Source: IVD Commercial Property Price Comparison 2016/2017

38 TRENDS AND FACTS 2017
Utility value, average in € per m²
simple medium good
Berlin 60.00 100.00 145.00
Bremen 50.00 90.00 140.00
Dortmund 60.00 80.00 130.00
Dresden 30.00 50.00 70.00
Essen 65.00 95.00 150.00
Frankfurt am Main 225.00 300.00 450.00
Hamburg 100.00 135.00 160.00
Hannover 100.00 130.00 190.00
Cologne 110.00 135.00 160.00
Leipzig 35.00 60.00 100.00
Munich n.a. n.a. n.a.
Nuremberg 102.85 117.75 182.67
Stuttgart 250.00 400.00 650.00
Building plots in commercial areas *
* Incl. development costs / no subsidised prices
Source: IVD Commercial Property Price Comparison 2016/2017

39
COMMERCIAL PLOTS
A very important location factor for any business is the
availability of adequate qualitative and quantitative
commercial plots. The portfolio of immediately marketable
plots in the Hannover Region totals 88 ha, of which 37.7 ha is
classified as near-motorway. A further 274.2 ha are covered
by approved building plans, although these commercial
plots have either not yet been developed and/or are in
private ownership. Another 412.9 ha are incorporated in the
land development plan. As a result of competition for land
use and the demands for the protection of open spaces,
the opportunities for developing new commercial plots
are increasingly approaching their limits. In this situation
the potential to re-use brown field sites is particularly
important: 178.5 ha are current available.
in ha
Total commercial plot availability 775.1
Of which immediately marketable (officially authorised B-plan, developed, public property) 88.0
Of which motorway-near (max 2 km to German motorways) 37.7
Of which marketable at a later date (officially authorised B-plan, not developed and/or private property) 274.2
Of which land utilisation plan (still without a B-plan) 412.9
Potentially reusable brown field sites 178.5
Shortlisted business park/industrial estate (areas scheduled for planning by municipalities, still without F/B plans, possibly marketable in the medium to long term)
953.6
Source: Hannover Region Commercial Plot Monitoring Report 2017
Commercial plot availability in Hannover Region 2017
COMMERCIAL PROPERTIES . COMMERCIAL PLOTS
For more informationsee the latest Hannover Region Commercial Plot
Monitoring Report

40 TRENDS AND FACTS 2017
TAX ASSESSMENT RATES
The trade tax and the property tax are municipal taxes
whose assessment rates are revised annually as part of
municipal budget discussions. This empowers the munici-
palities to influence the size of the taxes paid by enter-
prises and to actively manage location policies. The tax
assessment rates in larger cities are generally higher than
those in their surrounding areas.
Source: Hannover Region
Trade tax Property tax A Property tax B
State Capital Hannover 480 530 600
Barsinghausen 470 560 560
Burgdorf 450 465 465
Burgwedel 400 430 430
Garbsen 430 430 430
Gehrden 390 490 490
Hemmingen 400 440 460
Isernhagen 400 450 450
Laatzen 460 600 600
Langenhagen 440 430 430
Lehrte 440 440 440
Neustadt am Rbge. 430 440 440
Pattensen 430 430 430
Ronnenberg 450 480 480
Seelze 460 550 550
Sehnde 440 460 460
Springe 395 450 450
Uetze 450 490 490
Wedemark 440 440 440
Wennigsen 440 460 460
Wunstorf 460 490 490
Property tax and trade assessment rates 2017

41
RESIDENTIAL
The demand and supply of residential property markets
are primarily influenced by regional providers and private
households. In the future, demand for housing will con-
tinue to be driven by further increases in the population of
the State Capital Hannover and in the number of surround-
ing municipalities. In contrast, vacant housing has been at
a very low level for many years (less than 2%) and is there-
fore significantly below the fluctuation reserve.
Despite the dynamic developments seen by the residential
property market, residential rents and purchase prices for
building land and owner-occupied apartments in Hannover
are still moderate when compared with other German cities.
TAX ASSESSMENT RATES . RESIDENTIAL
The residential property market in Hannover is currently
enjoying a renaissance. Proximity to the city centre, local
services and very good transport connections are key qual-
ity criteria in the selection of sites. These requirements are
satisfied by new housing areas, both in the state capital as
well as in towns and municipalities in the surrounding area
in the Hannover Region.
Living quality, average in € per m2
Medium Good Excellent
Berlin 9.80 12.00 n.a.
Bremen 9.50 11.75 12.75
Dortmund 8.00 9.90 n.a.
Dresden 8.00 9.50 10.50
Essen 8.20 10.25 n.a.
Frankfurt am Main 11.00 12.50 13.50
Hamburg 12.00 13.90 15.90
Hannover 10.00 11.50 13.00
Cologne 8.00 9.50 n.a.
Leipzig 7.00 8.80 11.20
Munich 14.80 16.60 21.00
Nuremberg 8.77 9.60 11.42
Stuttgart 12.40 13.50 14.90
* New builds – first tenancy, with respect to 3-room apartment, approx. 70 m2, not including publicly subsidised residential properties
Source: IVD residential comparison 2015/2016
Residential rents in selected cities, new builds - first tenancy

42 TRENDS AND FACTS 2017
* Completions from 1949, with respect to 3-room apartment, approx. 70 m2, not including publicly subsidised residential properties
Source: IVD residential comparison 2015/2016
Residential rents in selected cities, completions from 1949*
Living quality, average in € per m2
Basic Medium Good Excellent
Berlin 5.80 7.85 9.00 n.a.
Bremen 6.00 7.75 9.50 11.5
Dortmund 5.00 5.90 7.60 n.a.
Dresden 5.80 6.50 7.50 9.00
Essen 4.90 7.15 8.40 n.a.
Frankfurt am Main 7.80 9.00 10.50 13.00
Hamburg 7.50 9.25 12.00 14.6
Hannover 5.70 7.90 9.90 11.75
Cologne 7.50 9.50 12.00 n.a.
Leipzig 4.60 5.55 7.10 8.80
Munich 10.20 12.60 14.50 17.90
Nuremberg 6.37 7.58 8.72 10.87
Stuttgart 9.30 10.90 12.00 14.20

43RESIDENTIAL
Living quality, average in € per m2
Medium Good Excellent
Berlin 1,950 2,700 3,550
Bremen 1,300 2,200 3,000
Dortmund 1,450 2,100 2,650
Dresden 1,400 2,000 2,800
Essen 1,100 1,950 2,800
Frankfurt a. M. 2,200 3,500 5,500
Hamburg 2,500 3,400 5,000
Hannover 1,400 2,550 3,500
Cologne 2,300 3,400 4,600
Leipzig 1,250 1,750 2,450
Munich 4,200 5,300 7,400
Nuremberg 1,589 2,141 2,636
Stuttgart 2,950 3,650 4,850
Residential location, average in € per m2
Medium Good Excellent
Berlin 200 340 610
Bremen 160 270 500
Dortmund 270 335 500
Dresden 140 200 375
Essen 320 430 575
Frankfurt a. M. 450 630 850
Hamburg 350 480 740
Hannover 285 400 535
Cologne 440 750 1,200
Leipzig 130 220 420
Munich 1,350 1,850 2,900
Nuremberg 339 486 706
Stuttgart 685 850 1,025
Living quality, average in € per m2
Medium Good Excellent
Berlin 3,050 4,100 4,600
Bremen 2,600 3,800 4,500
Dortmund 2,350 2,800 3,950
Dresden 2,800 3,000 3,500
Essen 2,050 2,750 3,900
Frankfurt a. M. 3,200 3,800 4,300
Hamburg 3,600 4,600 6,500
Hannover 2,600 3,100 4,550
Cologne 3,200 3,900 5,200
Leipzig 2,820 3,100 3,600
Munich 5,900 6,900 9,000
Nuremberg 2,750 3,241 3,622
Stuttgart 4,400 5,500 7,350
Purchase prices for owner-occupied apartments in
selected cities – existing portfolio
Purchase price for building land in selected cities*
Purchase prices of owner-occupied apartments in
selected cities – new builds
* Detached and semi-detached houses, approx. 600 – 800 m2 plots
Source: IVD residential comparison 2016/2017
For more information see the latest Hannover
Property Report

44 TRENDS AND FACTS 2017
Living quality, average in €
Basic, approx. 100 m2
Medium, approx. 125 m2
Good, approx. 150 m2
Excellent, approx. 200 m2
Berlin n.a. 295,000 385,000 620,000
Bremen 120,000 220,000 410,000 800,000
Dortmund 250,000 350,000 440,000 720,000
Dresden 180,000 260,000 450,000 n.a.
Essen 240,000 365,000 535,000 840,000
Frankfurt am Main
350,000 470,000 700,000 1,100,000
Hamburg 260,000 370,000 565,000 1,000,000
Hannover 175,000 295,000 440,000 710,000
Cologne 300,000 430,000 620,000 1,500,000
Leipzig 175,000 245,000 350,000 660,000
Munich 620,000 840,000 1,300,000 2,250,000
Nuremberg 293,571 352,857 452,857 640,929
Stuttgart 390,000 595,000 900,000 1,500,000
* Detached privately-owned houses (including garage and usual size of plot in the locality)
Source: IVD residential comparison 2016/2017
Purchase prices for detached houses (ready for immediate occupation) in selected cities*

45
0 100 150 20050 250 300 350
State Capital Hannover
Wedemark
Springe
Wennigsen
Uetze
Barsinghausen
Lehrte
Garbsen
Isernhagen
Hemmingen
Pattensen
Gehrden
Wunstorf
Seelze
Neustadt am Rbge.
Laatzen
Burgwedel
Ronnenberg
Langenhagen
Sehnde
Burgdorf
126 ¤ / qm
119 ¤ / qm
117 ¤ / qm
180 ¤ / qm
284 ¤ / qm
301 ¤ / qm
168 ¤ / qm
161 ¤ / qm
159 ¤ / qm
145 ¤ / qm
207 ¤ / qm
227 ¤ / qm
233 ¤ / qm
176 ¤ / qm
210 ¤ / qm
127 ¤ / qm
139 ¤ / qm
112 ¤ / qm
94 ¤ / qm
116 ¤ / qm
108 ¤ / qm
Average purchase price in € per m2 Average Hannover Region 155 €/m2
* Building plots requiring no development costs. The average values only provide an overview of the current market. They do not reflect the fact that the prices are dependent on value-relevant features of each individual plot.
Source: Expert panel for real estate values Hamelin-Hannover, Real Estate Market Report 2017
Building plots for detached and semi-detached houses*
RESIDENTIAL

46 TRENDS AND FACTS 2017
TOURISM
The State Capital Hannover attracted more
than 2.24 million overnight stays annually
to achieve a new record and consolidate its
position as the city with the most overnight
guests in Lower Saxony. The overnight stays
in the surrounding area are also climbing: at
1.65 million overnight stays, the towns and
municipalities of the Hannover Region better
cities such as Bremen, Essen and Dortmund.
Overall, the Hannover Region counted over
3.9 million overnight stays in 2016.
Hannover Region State Capital Hannover Surrounding area
* These figures include overnight stays in accommodation establishments open for business with at least 10 beds, and camping sites open for business with at least 10 pitches.
Source: State Office of Statistics Lower Saxony, Hannover Region calculations
20062007
20082009
2010 20112012
20132014
20152016
4,000,000
3,500,000
3,000,000
2,500,000
2,000,000
1,500,000
1,000,000
500,000
0
Overnight stays in the Hannover Region*
THE STATE CAPITAL HANNOVER ACHIEVED A NEW RECORD OF 2.2 MILLION OVERNIGHTS.

47
Hannover Adventure Zoo, the Royal Gardens of Herren-
hausen, the home games of Hannover 96 football team,
the productions in the state theatre and the numerous
museums are all attractions in their own right. In the sur-
rounding area, the Steinhuder Meer lake, the Deister hills
and the Marienburg Castle are the main tourist magnets.
The Hannover Region offers a wide range of cultural, spor-
ting, entertainment and recreation attractions. Top events
include the Maschseefest, Hannover Schützenfest (marks-
men’s fair), the Lister Meile Fest, Regionsentdeckertag
(discovery day), the Hannover marathon, the Fête de la
Musique, the international fireworks competition and the
Kleines Fest im Großen Garten (outdoor variety festival in
the Royal Gardens of Herrenhausen).
TOURISM
Events
Hannover Christmas markets 1,900,000
Maschseefest 1,780,000
Schützenfest (Marksmen’s Fair) 1,000,000
Lister Meile Fest 250,000
Hannover Marathon 220,000
Entdeckertag (Discovery Day) 130,000
Fête de la Musique 80,000
Kleines Fest im Großen Garten 65,000
International fireworks competition 50,000
Beer festival 50,000
Steintorfest 30,000
N-Joy Starshow 25,000
NDR2 Plaza Festival 25,000
Maker Faire Hannover 15,000
Festival of Cultures 14,000
Kunstfestspiele Herrenhausen 14,000
Fährmannsfest 12,000
Classic in the Old Town 10,000
Tourist attractions
Hannover Adventure Zoo 1,160,000
Hannover 96, season 2016/17 623,000
Royal Gardens of Herrenhausen 545,000
State Theatre Hannover (opera, theatre) 370,000
Marienburg Castle 190,000
GOP variety theatre 183,700
Theater am Aegi 176,000
Sprengel-Museum 148,500
State Museum Lower Saxony 113,000
Hannover Museum of history 50,000
Wilhelm-Busch Museum 46,400
Parkbühne open air season 45,400
August-Kestner Museum 34,900
Kommunales Kino 26,600
Kestnergesellschaft 20,000
Selected events and tourist attractions in the Hannover Region
Source: Figures provided by event organisers and institutions
Visitor numbers 2016 Visitor numbers 2016

48 TRENDS AND FACTS 2017
TRADE FAIRS
the flagship of the information and communications tech-
nology sector; HANNOVER MESSE as the broad-based
forum for industry as a whole; Agritechnica as the world’s
largest agricultural machinery show; and the IAA Trucks as
the world’s leading show for trucks, mobility and transport.
In 2016, 69 shows took place in Hannover, attracting
approximately 1.24 million visitors.
The Hannover fairs and exhibitions are a vital factor in
raising awareness of Hannover as a business location and
have a positive knock-on effect on the image of the region
as a whole. Hannover is host to the world’s largest exhibition
grounds, with around 463,000 m2 covered exhibition space –
including top quality exhibition areas and halls. Hannover is
home to major flagship trade fairs: examples being CeBIT,
IN 2016 69 SHOWS TOOK PLACE IN HANNOVER, ATTRACTING APPROX. 1.24 MILLION VISITORS.
Hall space
in m2
Outdoor space in m2
Visitors to domestic trade
fairs 2016
Deutsche Messe AG Hannover 463,285 58,000 1,240,000
Messe Frankfurt GmbH 366,637 96,078 1,560,000
Koelnmesse GmbH 284,000 100,000 1,300,000
Messe Düsseldorf GmbH 261,800 43,000 1,591,000
Neue Messe München GmbH 180,000 425,000 1,605,000
Source: AUMA Association of the German Trade Fair Industry und trade fair company figures
Comparison of the top trade fair locations in Germany

49TRADE FAIRS
Exhibitors VisitorsNet letting space in m2
ABF and B.I.G. (2017) 796 92,546 47,107
Agritechnica (2015) 2,892 452,471 236,682
Altenpflege (2016) 561 27,032 17,065
Energy Decentral (2014) 351 31,217 11,320
BioTechnica/Labvolution (2015) 424 9,755 9,147
CeBIT (2016) 2,960 176,795 143,492
CeMAT (2016) 947 35,636 61,069
didacta (2015) 742 70,891 32,850
Domotex (2017) 1,435 36,402 91,896
EMO (2013) 2,131 142,797 180,582
EuroBLECH (2016) 1,505 60,636 87,818
EUROTIER (2016) 2,638 162,729 131,292
HANNOVER MESSE (2016) 5,082 190,885 181,871
IAA Commercial Vehicles (2016) 2,013 248,900 199,457
infa (2016) 1,398 178,644 40,444
Interschutz (2015) 1,453 156,844 108,362
LIGNA Hannover (2015) 1,552 93,099 121,195
Pferd & Jagd (2015) 878 94,990 38,955
Trade fair figures for Hannover’s flagship shows
Source: AUMA Association of the German Trade Fair Industry

50 TRENDS AND FACTS 2017
51
Region President
Business and Employment Promotion Department
Text and editorial Hannover Region Business and Employment Promotion Department
Photo credits Continental Aktiengesellschaft: Page 21
Dirk Rossmann GmbH: Page 21
Gundlach Bau und Immobilien GmbH & Co. KG: Page 42
hannoverimpuls GmbH: Pages 25, 26 bottom
HELMA Wohnungsbau GmbH: Page 40
Hanova: Pages 41, 43
GPI Glaser Projekt Invest: Page 45
HMTG: Pages 2/3, 12 top, 12 bottom, 18, 24 bottom, 25 top right,
26 bottom left, 27 top, 27 bottom, 32, 38, 46, 47, 48, 50
iStockPhoto: Pagen 25 left, 26 top, 28 top, 29, 30
Fotolia: Page 26 bottom right
Region Hannover: Titel, Pagen 5, 23, 28 bottom, 31, 44 left, 44 right
Talanx AG: Page 22
Volkswagen Aktiengesellschaft: Page 24 top
Maps Team Medienservice und Post Region Hannover
Design Kochstrasse™ – Agentur für Marken GmbH
Issue 7.17/3
Status
Printing
7/2017
Team Medienservice und Post Region Hannover

www.wirtschaftsfoerderung-hannover.de
HANNOVER REGIONBusiness and Employment Promotion
Haus der WirtschaftsförderungVahrenwalder Straße 730165 HannoverGermany
Tel.: +49 (0)511 61623-236Fax: +49 (0)511 61623-453
wirtschaftsfoerderung@region-hannover.dewww.wirtschaftsfoerderung-hannover.de
Your contact:
Lennart HeiseRegion HannoverTeam WirtschaftsförderungTel.: +49 (0)511 [email protected]


![Zygulsky - Walter Peter Gerlach, Forschungsprojekte · Averroisten - Schule, lehrte in Padua ab ca. 1302 / 1306, 1315 wegen Magie von Inquisition zum Tode verurteilt], « Liber compilationis](https://static.fdocuments.us/doc/165x107/5e1917de646bb77cc739fdab/zygulsky-walter-peter-gerlach-forschungsprojekte-averroisten-schule-lehrte.jpg)