Treatment Planning Considerations Using IMRT
21
6 Treatment Planning Considerations Using IMRT Introduction ...........................................................103 IMRT or 3DCRT? ...................................................105 The MSKCC IMRT Planning Process....................107 Patient Selection • Patient Simulation And Structure Localization • Selection Of Beam Energy, Number, And Direction • Optimization • Conversion Of Intensity Profiles To Leaf Motion • Forward Dose Calculation And Plan Evaluation • IMRT Plan Documentation And QA Controlling Dose Distributions Designed Using Inverse Planning: Optimization Algorithm Performance .......................................................115 Optimization Parameters • Beam Selection • “Optimization Only” Structures Summary ................................................................118 References ..............................................................119 Margie A. Hunt Chandra M. Burman Introduction In radiation therapy, a tumoricidal dose must be delivered while minimizing the dose to the sur- rounding normal tissues. Although three-dimensional conformal radiation therapy (3DCRT), with its careful delineation of target and normal tissues and volumetric evaluation of dose, has facil- itated an increased target dose and/or reduced normal tissue dose in certain sites (Armstrong et al. 1993), intensity modulated radiation therapy (IMRT) could lead to even greater improvements in the therapeutic ratio. The concept of intensity-modulated fields created through inverse planning was first pro- posed by Brahme in 1988 (Brahme 1988). Given a set of beams and a desired dose distribution, the optimum shape of the beams could be determined by back projection, leading to non- uniform beam intensities. Although this particular optimization technique was limited by non- physical solutions characterized by negative ray weights, the utility of the technique, particularly for concave targets surrounding an organ at risk, was obvious. It was soon realized that intensi- ty modulation was capable of producing highly complex, tightly conforming dose distributions. Since then, many computational techniques for determining the beam intensity profiles have been proposed, including gradient techniques (Bortfeld et al. 1990), maximal entropy and maximal likelihood optimization (Llacer 1997), simulated annealing (Rosen et al. 1995), and methods relying 103 MPP02120901—IMRT–Ling—file name: 06-hunt-treatment
Transcript of Treatment Planning Considerations Using IMRT
6Treatment Planning
Considerations Using IMRT
Introduction ...........................................................103IMRT or 3DCRT? ...................................................105The MSKCC IMRT Planning Process....................107Patient Selection • Patient Simulation And Structure
Localization • Selection Of Beam Energy, Number,And Direction • Optimization • Conversion OfIntensity Profiles To Leaf Motion • Forward DoseCalculation And Plan Evaluation • IMRT PlanDocumentation And QA
Controlling Dose Distributions Designed UsingInverse Planning: Optimization AlgorithmPerformance .......................................................115
Optimization Parameters • Beam Selection •“Optimization Only” Structures
Summary................................................................118References ..............................................................119
Margie A. HuntChandra M. Burman
IntroductionIn radiation therapy, a tumoricidal dose must be delivered while minimizing the dose to the sur-rounding normal tissues. Although three-dimensional conformal radiation therapy (3DCRT), withits careful delineation of target and normal tissues and volumetric evaluation of dose, has facil-itated an increased target dose and/or reduced normal tissue dose in certain sites (Armstrong et al.1993), intensity modulated radiation therapy (IMRT) could lead to even greater improvementsin the therapeutic ratio.
The concept of intensity-modulated fields created through inverse planning was first pro-posed by Brahme in 1988 (Brahme 1988). Given a set of beams and a desired dose distribution,the optimum shape of the beams could be determined by back projection, leading to non-uniform beam intensities. Although this particular optimization technique was limited by non-physical solutions characterized by negative ray weights, the utility of the technique, particularlyfor concave targets surrounding an organ at risk, was obvious. It was soon realized that intensi-ty modulation was capable of producing highly complex, tightly conforming dose distributions.Since then, many computational techniques for determining the beam intensity profiles have beenproposed, including gradient techniques (Bortfeld et al. 1990), maximal entropy and maximallikelihood optimization (Llacer 1997), simulated annealing (Rosen et al. 1995), and methods relying
103
MPP02120901—IMRT–Ling—file name: 06-hunt-treatment
104 HUNT AND BURMAN
on the genetic algorithm (Ezzell 1996). Some of these methods have been implemented in com-mercial planning systems including simulated annealing in CORVUS (NOMOS Corporation,Sewickley, PA) (Carol, Nash, and Campbell 1997) and gradient techniques in HELIOS (VarianAssociates, Palo Alto, CA). The Memorial Sloan Kettering Cancer Center (MSKCC) optimizationalgorithm, developed by Spirou and Chui (1998) and discussed in detail in chapter 3, relies ona conjugate gradient minimization method and least-squares objective function.
Just as there are many optimization methods used to design IMRT plans, several methodsexist for the delivery of intensity-modulated fields. Although physical compensators can beused (Purdy 1997), their fabrication is time consuming and their use is cumbersome. The rela-tively recent commercial availability of computer-controlled slit and multileaf collimators (MLCs)has made the delivery of intensity-modulated fields more practical. To date, extensive clinicalexperience exists for the following IMRT delivery methods: computer-controlled collimating slitdevice (Carol 1994), multiple static fields (i.e., the “step-and-shoot” method) (Galvin, Chen, andSmith 1993; Boyer et al. 1994), and dynamic multileaf collimation (DMLC) (Spirou and Chui1994). Each method has its advantages and limitations, and although there exist some studiescomparing delivery methods (Chui et al. 2001), there are really no available data that permit atrue “head to head” comparison between the various IMRT techniques currently available.
Although the overall processes of IMRT and 3DCRT are quite similar, the philosophical basisof plan design differs significantly. One might say they are diametrically opposite in approach.Conventional 3DCRT treatment planning is forward based and manually optimized. That is, thetreatment planner chooses all beam parameters, such as the number of beams, beam directions,shapes, weights, etc., and the computer merely calculates the resulting dose distribution. Basedon the resulting dose distribution the planner intuitively iterates the various parameters in anattempt to optimize the dose distribution. A key point being, however, that the optimum, or desireddose distribution is never explicitly defined. Thus, an optimal 3DCRT plan, designed conven-tionally, is the result of an iterative manipulation of beam energy, weighting, and direction, andbeam modifying devices such as blocks and wedges. Although computer-driven optimization ofparameters such as beam direction (Vijayakumar et al. 1991; Soderstrom and Brahme 1992) andweighting (Langer and Leong 1987; Mageras and Mohan 1993) has been attempted, it has met onlylimited clinical success.
Conversely, with IMRT dose distributions are inversely determined, meaning that the treatmentplanner must specify in advance the dose distribution that is desired, and the computer thencalculates a set of beam intensities that will produce, as nearly as possible, the desired dose dis-tribution. Specification by the planner of the desired dose distribution is made by means ofdose-volume constraints in which the planner defines for the computer minimum andmaximum desirable doses for all structures in the plan [such as the CTV (clinical targetvolume), PTV (planning target volume), and radiosensitive normal tissues] plus a set of penaltyweights to indicate the relative importance for meeting the specified dose constraints for eachstructure. For example, the planner could specify that meeting the dose constraints for the PTVare more important than for the spinal cord, or vice versa. Different penalty weights can also beapplied to overdosing as opposed to underdosing certain structures. So, for IMRT the optimiza-tion parameters and structures are the primary variables used to control the dose distribution asopposed to the beam weights or shapes as in 3DCRT treatment planning. Specification of the opti-mization parameters and beam placement requires knowledge of how the details of the dose cal-culation algorithms and anatomical features of the patient such as the proximity of the normaltissues to the target affect the outcome of optimization. Hence, the combination of beams, opti-mization parameters, and structures needed to achieve the best plan are planning system andpatient specific. Planners must develop an intuition as to how these factors affect optimizeddose distributions.
MPP02120901—IMRT–Ling—file name: 06-hunt-treatment
TREATMENT PLANNING CONSIDERATIONS USING IMRT
This chapter will describe the general approach to treatment planning optimization that hasbeen developed at MSKCC during the past 8 years. The techniques discussed have been founduseful for the optimization algorithm and delivery methods used at our institution. Some of thesetechniques may not be relevant or be ineffective with other systems. A variety of site-specificinformation is discussed in this chapter to demonstrate general issues related to IMRT planning.Additional site-specific planning information will be found in the appropriate clinical chapters.
IMRT Or 3DCRT?At the most basic level, IMRT could be considered in virtually all situations where there is a desireto either increase tumor dose or decrease normal tissue dose—that is, almost every site current-ly treated with external beam radiation therapy! However, there are increased costs associatedwith planning and delivering IMRT that must be considered. In addition to the necessary equip-ment costs, operating costs are higher (at least currently) and are proportional to the number ofpatients receiving IMRT treatment. Therefore, it makes sense to select sites for IMRT treatmentthat will reap the greatest benefit.
Multiple studies have now clearly demonstrated the value of IMRT in improving target cover-age and decreasing normal tissue doses in clinical situations where concave targets surroundnormal tissues (Happersett et al. 1999, 2000; Burman et al. 1997; Fournier-Bidoz et al. 2001;Hunt et al. 2001; Wu et al. 2000; Chao et al. 2000; De Neve et al. 1999; Verhey 1999; Hsiung etal. 2002). Concave distributions created with IMRT have been used in prostate cancer (Zelefskyet al. 2000) to facilitate dose escalation with no increase in rectal dose and in head and neck cancerto decrease normal tissue morbidity, particularly to the parotid glands (Wu et al. 2000). As anotherexample, consider the IMRT technique developed by Happersett et al. (2000) for the treatmentof thyroid cancer. Historically, an extremely difficult site in which to achieve good dose distri-butions, successful treatment of thyroid carcinomas requires doses of 60 Gy or more to large targetvolumes including the thyroid bed and regional lymph nodes that surround the spinal cord.Happersett et al. developed an IMRT technique consisting of either five or six fields (figure 6–1)and compared it to anterior posterior/posterior anterior (AP/PA) opposed fields and a 3-D con-formal plan for five patients. With IMRT the volume of the PTV receiving the prescription doseincreased by 10% relative to the 3-D plan and 60% relative to AP/PA fields. Dose to the spinalcord was acceptable with all three techniques, but the volume of lung receiving in excess of 25 Gywas 10% to 15% less with IMRT.
Another situation in which IMRT may lead to significant dosimetric improvements is that inwhich the tumor is embedded within or surrounded by a normal tissue exhibiting a dose responsewith relatively strong volume dependence. An excellent example is lung tumors, the treatmentof which is limited primarily by the tolerance of the spinal cord and surrounding normal lung.With conventional multi-field 3DCRT, the beam directions are carefully selected to avoid thespinal cord and to minimize the irradiated volume of normal lung. But beyond beam selection,the user has a limited armamentarium with which to manipulate target coverage and normal tissuedose. Uniform target dose and low normal tissue doses must be achieved using uniform or smooth-ly varying intensity patterns from each field (open or wedged fields). In contrast, IMRT com-bines the non-uniform intensity patterns from each field to obtain a uniform target dose. Thisoften leads to further decreases in lung dose, particularly at the low or mid dose levels. Figure6–2 compares 3-D and IMRT dose distributions for a lung tumor. Using identical beam arrange-ments, similar target coverage is achieved with both plans, but the lung dose is lower withIMRT. As discussed in greater detail in the chapter devoted to the treatment of lung cancer (chapter12), the improvement in lung dose achieved with IMRT may facilitate dose escalation. In a ret-rospective review of six patients treated with 3DCRT but re-planned with IMRT by Yorke et al.(Spirou et al. 2001; Yorke 2001), the addition of IMRT would have permitted the prescription
105
MPP02120901—IMRT–Ling—file name: 06-hunt-treatment

106 HUNT AND BURMAN
dose to be escalated by 13 Gy, on average, for five of six patients. This assumes that the samebiological dose limits for the lung would be required for the 3D and IMRT plans.
We have briefly described two clinical scenarios in which IMRT can produce dosimetricallysuperior distributions. Detailed discussions of these and other IMRT techniques can be found inthe site-specific chapters. In some situations, however, the benefits of IMRT may not be as significant
MPP02120901—IMRT–Ling—file name: 06-hunt-treatment
FIGURE 6–1. Five-field IMRT technique for the treatment of thyroid cancer. Note the concave shape of thedose distribution between the target and spinal cord. See COLOR PLATE 10.
FIGURE 6–2. A comparison of IMRT (a) and 3-D conformal (b) dose distributions for the treatment of alung tumor. Even though the same beam arrangement was used for both plans, there is significant improvementin the lung dose with IMRT. See COLOR PLATE 11.

TREATMENT PLANNING CONSIDERATIONS USING IMRT
and may not warrant the increased cost. Therefore, it is imperative that a critical evaluation ofIMRT take place prior to implementation in each clinic. At MSKCC, implementation for a newsite is always preceded by a comparison of 3-D and IMRT techniques that, by itself, requires sig-nificant physics and physician time. Once the decision to use IMRT is made, a standard beamarrangement and constraint template is defined whenever possible to streamline the routine plan-ning process. We believe that, with IMRT, communication between physicians and planners iscrucial. The pre-implementation phase, during which IMRT is compared to other techniques isan ideal time to discuss the goals of treatment and to define, as precisely as possible, the desiredtarget and normal tissues doses.
The MSKCC IMRT Planning ProcessSince 1997, IMRT planning at MSKCC has relied on the optimization algorithm developed bySpirou and Chui (1998), which uses conjugate gradient minimization and a least-squares objectivefunction (see also chapter 3). The basic planning steps are described below.
Patient SelectionThe vast majority of patients receiving IMRT treatment at MSKCC are treated to sites that havebeen identified by the department as suitable for this type of treatment. This includes prostate,head and neck, breast, pediatric, para-spinal, and some lung tumors. For these sites, evaluationsof the dosimetric benefits of IMRT have been completed and planning procedures have beenwritten that specify the desired target and normal tissue doses and the optimization constraintsused to achieve them. Other patients for whom IMRT may be beneficial, by virtue of tumor loca-tion, previous radiation treatment, etc., are discussed on a case-by-case basis prior to planning.IMRT treatment to non-routine sites may entail longer planning times (more than one week) sincethe target and normal tissue constraints must be determined and additional pre-treatmentquality assurance (QA) including film dosimetry may be necessary.
Patient Simulation And Structure LocalizationBecause of the increased conformality of the dose distributions achieved with IMRT, accurate andprecise patient treatment is of even more importance than with conventional treatment. All patientsundergoing IMRT at MSKCC are immobilized according to tumor location and patient condi-tion. Immobilization methods range from custom foam or thermoplastic molds for prostate, headand neck, and breast patients to stereotactic localization for patients with para-spinal lesions.After immobilization, which takes place either in a conventional simulator or CT simulator room,all patients undergo CT simulation, during which images are acquired throughout the treatmentvolume and an isocenter is defined. Using the CT (computed tomography) and other appropri-ate image sets including magnetic resonance or positron emission tomography (MR or PET), thePTV and critical organ contours are defined and transferred along with the images to the planningsystem.
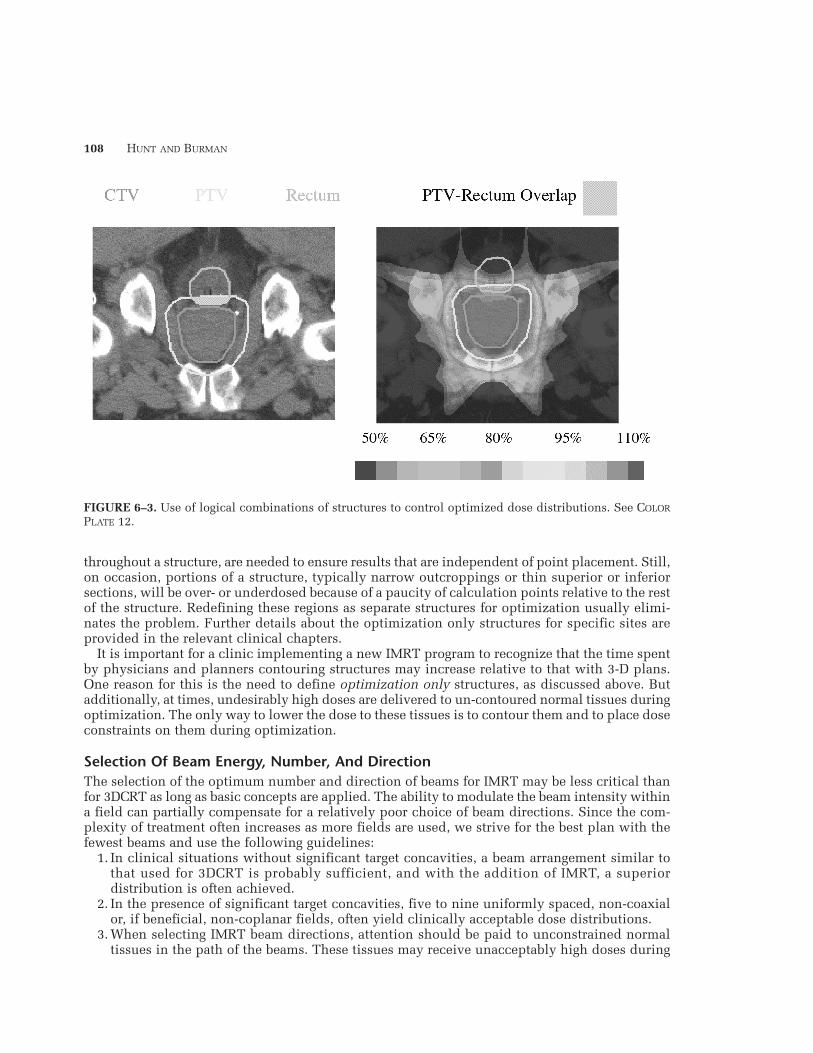
At the planning system, additional structures used solely to control the dose distribution duringoptimization are often defined by the planner. Typically, these optimization only structures areBoolean combinations of targets and normal tissues. By defining the intersection of targets andnormal tissues as separate structures, different prescription doses and constraints can easily beapplied to different regions, facilitating the creation of controlled dose gradients betweennormal tissues and targets. Figure 6–3 illustrates the use of Boolean structures in prostate cancerwhere routinely, the PTV, rectum and PTV-rectal overlap regions are given different constraintsduring optimization. Special care is taken during this pre-optimization phase to ensure that anadequate number of calculation points are defined within each structure since this influences theoptimization results. With the MSKCC algorithm, at least 30 points/cc, distributed quasi-randomly
107
MPP02120901—IMRT–Ling—file name: 06-hunt-treatment
108 HUNT AND BURMAN
throughout a structure, are needed to ensure results that are independent of point placement. Still,on occasion, portions of a structure, typically narrow outcroppings or thin superior or inferiorsections, will be over- or underdosed because of a paucity of calculation points relative to the restof the structure. Redefining these regions as separate structures for optimization usually elimi-nates the problem. Further details about the optimization only structures for specific sites areprovided in the relevant clinical chapters.
It is important for a clinic implementing a new IMRT program to recognize that the time spentby physicians and planners contouring structures may increase relative to that with 3-D plans.One reason for this is the need to define optimization only structures, as discussed above. Butadditionally, at times, undesirably high doses are delivered to un-contoured normal tissues duringoptimization. The only way to lower the dose to these tissues is to contour them and to place doseconstraints on them during optimization.
Selection Of Beam Energy, Number, And DirectionThe selection of the optimum number and direction of beams for IMRT may be less critical thanfor 3DCRT as long as basic concepts are applied. The ability to modulate the beam intensity withina field can partially compensate for a relatively poor choice of beam directions. Since the com-plexity of treatment often increases as more fields are used, we strive for the best plan with thefewest beams and use the following guidelines:
1. In clinical situations without significant target concavities, a beam arrangement similar tothat used for 3DCRT is probably sufficient, and with the addition of IMRT, a superiordistribution is often achieved.
2. In the presence of significant target concavities, five to nine uniformly spaced, non-coaxialor, if beneficial, non-coplanar fields, often yield clinically acceptable dose distributions.
3. When selecting IMRT beam directions, attention should be paid to unconstrained normaltissues in the path of the beams. These tissues may receive unacceptably high doses during
MPP02120901—IMRT–Ling—file name: 06-hunt-treatment
FIGURE 6–3. Use of logical combinations of structures to control optimized dose distributions. See COLOR
PLATE 12.

TREATMENT PLANNING CONSIDERATIONS USING IMRT
optimization that may only be noticed through careful review of dose distributions and dose-volume data.
Some recent discussions have raised the concern that IMRT may increase integral dose due tothe increased leakage radiation resulting from longer treatment times and the use of many treat-ment fields or an arc-type delivery. We would argue that the treatment time for many of the mostcommon IMRT treatments (prostate, for example), is not significantly longer than conventionaltreatment and that excellent IMRT dose distributions can be achieved without increasing thenumber of treatment fields.In fact, IMRT, applied to a conventional beam arrangement, mayactually decrease integral dose by virtue of its improved conformality. In a recent study of inte-gral dose for prostate patients, Della Biancia evaluated various 3-D and IMRT techniques for 15prostate patients (Della Biancia, Hunt, and Amols 2002). The integral doses for four (AP, PA, RL,LL) and six-field (RL, LL, RAO, LAO, RPO, LPO) 3-D plans were compared with those for 5, 9,and 13 non-coaxial field IMRT plans (figure 6–4). The five-field IMRT plan yielded the lowestintegral dose while a six-field 3-D technique resulted in the highest. Applying intensity modu-lation to the 3-D four- and six-field beam arrangements decreased the integral dose by as much
109
MPP02120901—IMRT–Ling—file name: 06-hunt-treatment
FIGURE 6–4. 3-D and IMRT beam arrangements used in the study of integral dose for prostate patients.

110 HUNT AND BURMAN
as 10%. As a result of the lower path length and improved conformality of the five-field IMRTplan, patients receiving IMRT to 81 Gy would have received approximately the same integral doseas patients treated to 75.6 Gy with a six-field 3DCRT technique.
It has also been suggested that, with IMRT, higher energy x-ray beams (≥10 MV) may not be asnecessary for deep-seated targets although the recent article by Pirzkall et al. (2002) appears tocast some doubt on this. This study compared IMRT prostate plans for 6, 10, and 18 MV X-raysand found target and rectal doses for 6 MV to be comparable to those obtained with a five-field18 MV plan, but only if at least nine fields were used. If fewer 6 MV fields were used, the dosesto superficial normal tissues were significantly higher than those observed in the higher energyplans.
At MSKCC, no changes in beam energy have been made as IMRT has replaced 3DCRT treat-ment. Pelvis and abdominal tumors are routinely treated with 15 MV, and lung, breast, head andneck, and pediatric tumors with 6 MV. Breast patients with separations greater than 23 cm aretreated using 15 MV X-rays and a beam spoiler or with a mix of 6 and 15 MV beams.
OptimizationA detailed description of the optimization algorithm can be found in chapter 3. Here, a brief
description is provided with emphasis on clinical application.For each treatment field, the collimator is adjusted to enclose the targets with a margin of 1.5
to 2 cm, which prevents the target from lying within the beam penumbra. With the MSKCC algo-rithm, failure to add this margin may lead to undesirable intensity peaks near the beam edges.An initial dose calculation is performed during which each beam is divided into segments 2mm wide and 5 mm long and the dose deposition coefficients, aij representing the dose deposit-ed to ith point in a structure for a unit weight of the jth ray, are calculated. The dose depositioncoefficients contain all the information needed by the optimization algorithm to determine theintensity profiles.
The desired dose distribution is described through the optimization parameters (i.e., constraints)for targets and normal tissues. Optimization is achieved by using an iterative process to minimizea quadratic objective function, shown here in a simplified form for a single target:
whereCp is the prescription dose for the target.Ck is the dose of the kth target constraint.wk is the user-defined penalty for the kth target constraint.Dj is the actual dose to the jth point within the target.N is the number of target points.
For targets, a prescription dose and a dose window defining the maximum and minimum doseconstraints are allowed. Within this window, a penalty of 1 is applied to deviations from theprescription whereas user-defined penalties are applied outside the window. For critical struc-tures, dose and dose-volume constraints are available. Dose constraints are defined by a maximumdose and penalty while dose-volume constraints are defined by a dose-volume combination andpenalty. All MSKCC optimization constraints are so-called soft constraints, meaning violation is
MPP02120901—IMRT–Ling—file name: 06-hunt-treatment
FN
D C w D C D Cobj j pj
kk
j k j kj
= − + − × −
∑ ∑ ∑1 2 2( ) ( ) ( )Θ
Θ( )D C
D C C
D C Cj k
j k k
j k k− =
− <
− >
10
00
if and is a minimum dose constraint
or and is a maximum dose constraintotherwise
TREATMENT PLANNING CONSIDERATIONS USING IMRT
possible, but at a cost (i.e., penalty). Hard constraints, those that may not be violated under anycircumstances, are under development.
At MSKCC, IMRT templates defining the optimization parameters and clinical criteria for alltargets and normal tissues are developed for each site prior to large-scale IMRT implementation.These templates are developed primarily through communication between physicians and physi-cists about the goals and realities of the IMRT treatment and trial-and-error planning on a sig-nificant number of test patients. The optimization parameters that define an IMRT template areaverage values, found to yield relatively good dose distributions in a majority of patients. As such,they serve as a starting point for planning individual patients. Invariably, planners must adjustthe optimization parameters to fine tune the dose distribution for each patient. The templatesfor the most frequently treated IMRT sites are discussed throughout this book in the site-specif-ic chapters. As an example, the MSKCC 81 Gy prostate template is shown in table 6–1. The opti-mization parameters are the actual numbers entered into the optimization software while theclinical criteria are used to evaluate the resulting dose distributions and dose-volume his-tograms (DVHs). It is important to recognize that the selection of optimization parameters is anempirical process and that the MSKCC templates will not necessarily apply to other optimizationalgorithms.
The importance of devoting significant physician and physicist effort to the development ofIMRT templates cannot be stressed enough as their use helps ensure efficient and consistent resultsfor all patients. The response of an optimization algorithm to changes in the optimizationparameters is not always intuitive, and even with the use of a template, sub-optimal results canbe obtained without the planner realizing it. Optimization algorithm performance studies areone way to get a better understanding of algorithm response and, although time consuming, arehighly recommended. A detailed description of the methods and results of one such study thatwe have recently completed is given later in this chapter in Controlling Dose Distributions DesignedUsing Inverse Planning.
At times, it is useful to modify certain factors affecting the optimization process or the result-ing intensity profiles. These include the form of the objective function, the number of iterationsperformed during optimization, and the profile smoothing method. All these affect the results ofoptimization and should be investigated as fully as possible prior to clinical implementation. Theeffect of one of these factors, intensity profile smoothing, is discussed in more detail below.
Intensity profiles may, under certain circumstances, be highly modulated, leading to deliveryproblems and increased treatment time. They may also deposit unacceptable dose to the critical
111
MPP02120901—IMRT–Ling—file name: 06-hunt-treatment
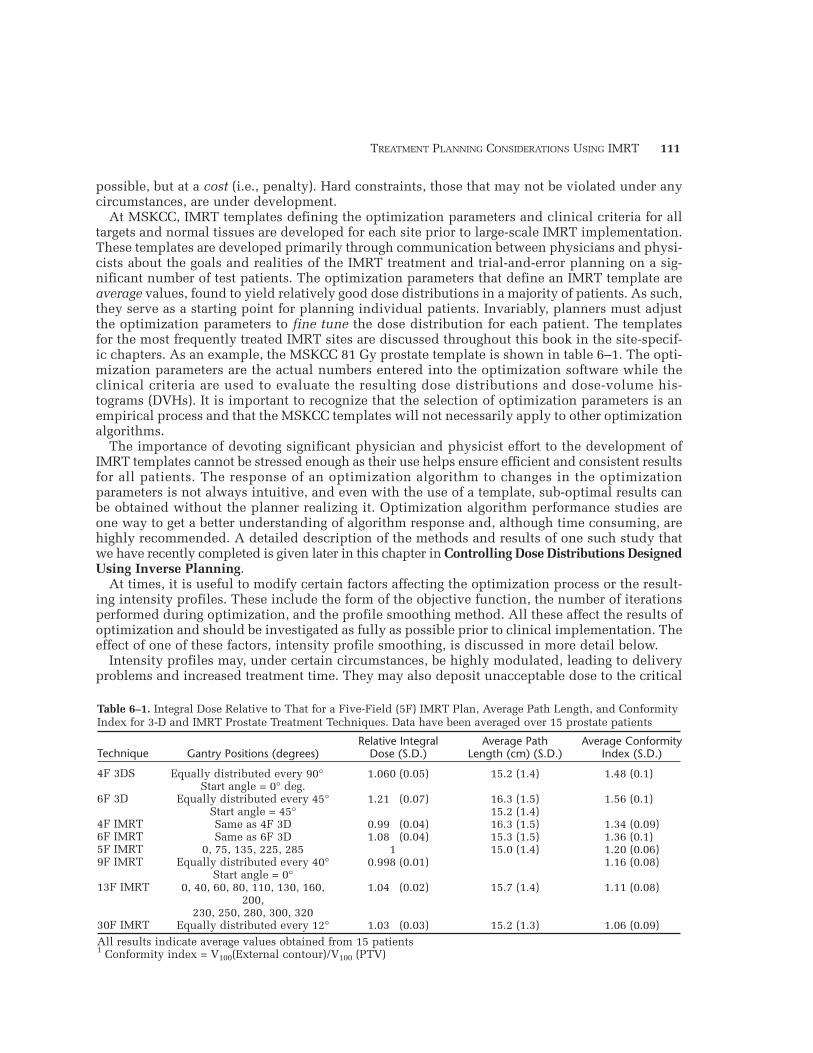
Table 6–1. Integral Dose Relative to That for a Five-Field (5F) IMRT Plan, Average Path Length, and ConformityIndex for 3-D and IMRT Prostate Treatment Techniques. Data have been averaged over 15 prostate patients
Technique
4F 3DS
6F 3D
4F IMRT6F IMRT5F IMRT9F IMRT
13F IMRT
30F IMRTAll results indicate average values obtained from 15 patients1 Conformity index = V100(External contour)/V100 (PTV)
Gantry Positions (degrees)
Equally distributed every 90°Start angle = 0° deg.
Equally distributed every 45°Start angle = 45°Same as 4F 3DSame as 6F 3D
0, 75, 135, 225, 285Equally distributed every 40°
Start angle = 0°0, 40, 60, 80, 110, 130, 160,
200,230, 250, 280, 300, 320
Equally distributed every 12°
Relative IntegralDose (S.D.)
1.060 (0.05)
1.210 (0.07)
0.990 (0.04)1.080 (0.04)0.001 (0.00)0.998 (0.01)
1.040 (0.02)
1.030 (0.03)
Average PathLength (cm) (S.D.)
15.2 (1.4)
16.3 (1.5)15.2 (1.4)16.3 (1.5)15.3 (1.5)15.0 (1.4)
15.7 (1.4)
15.2 (1.3)
Average ConformityIndex (S.D.)
1.48 (0.1)0
1.56 (0.1)0
1.34 (0.09)1.36 (0.1)01.20 (0.06)1.16 (0.08)
1.11 (0.08)
1.06 (0.09)

112 HUNT AND BURMAN
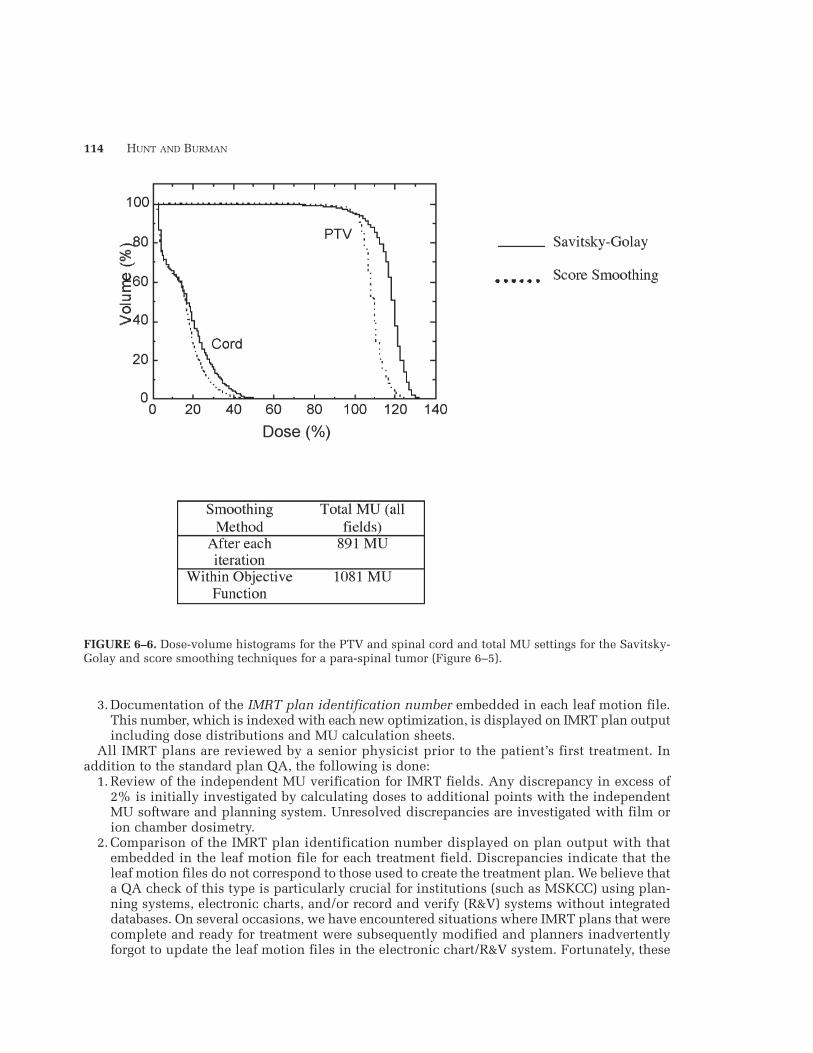
organs in the event of setup error or organ motion. Although some modulation is of course nec-essary, some is a result of numerical artifact, introduced during optimization. To reduce theseartifacts, intensity profiles are smoothed, using one of the methods discussed in detail inchapter 3. The default method of smoothing in the MSKCC system (Spirou and Chui 1994) appliesa Savitzky-Golay filter (Teukolsky, Vettering, and Flannery 1992), replacing each ray with a weight-ed average of itself and its neighbors. This technique significantly reduces the small intensityfluctuations arising from numerical artifact, thereby producing profiles that can be delivered easilyin reasonable time. As is the case for all smoothing algorithms however, sharp dose gradients nearcritical structures are degraded. To minimize this degradation, a second smoothing method (scoresmoothing) was introduced (Spirou et al. 2001) that incorporates a smoothing factor in theobjective function, thereby smoothing in regions of relatively low dose gradient while preserv-ing the high dose gradient at target-normal tissue interfaces. Dose profiles across a target normaltissue interface for a single field resulting from the Savitzky-Golay and the score smoothing methodsare compared in figures 6–5 and 6–6. Both smoothing techniques are used clinically and are chosenbased on the following guidelines:
1. When extremely steep dose gradients are not required (e.g., prostate and breast plans), littledifference is observed between the Savitzky-Golay and score-smoothing. Therefore, theSavitzky-Golay filter, applied at the end of each iteration, is generally applied since treat-ment times are minimized.
2. Steep dose gradients, such as those needed in the treatment of recurrent para-spinal or headand neck tumors, may only be achievable with more sophisticated smoothing techniques, i.e,score smoothing. Highly modulated fields delivered dynamically generally require moretreatment time and are more prone to beam hold-offs. If step-and-shoot delivery is used, alarger number of segments may be necessary.
3. All aspects of treatment, including the effect of treatment uncertainties should beconsidered before selecting a smoothing technique.
Conversion Of Intensity Profiles To Leaf MotionIMRT at MSKCC is delivered using dynamic multileaf collimation (DMLC) following the method-ology developed by Spirou and Chui (1994), discussed in chapter 3. After optimization, the inten-sity profiles are converted into 200 segments, requiring that in each segment, at least one leafmove at the maximum allowable speed, thereby minimizing treatment time. Both transmissionthrough the leaves and the effect of the rounded leaf edge of the Varian MLC are considered. Sincethe original intensity profiles cannot be converted with complete fidelity, the final leaf motionis converted back into a deliverable intensity profile for subsequent forward dose calculationand plan evaluation.
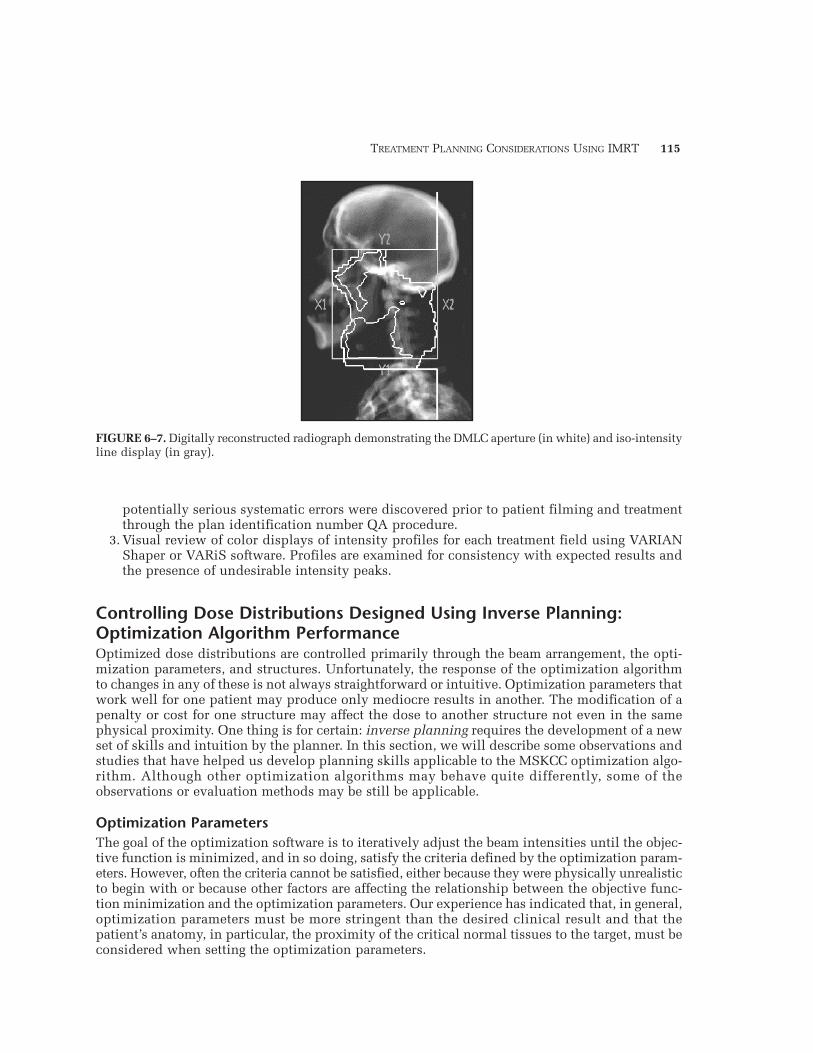
Forward Dose Calculation And Plan EvaluationOnce the forward dose calculation is completed using the deliverable profiles, the plan is eval-uated using standard methods including planar dose distributions, DVHs, and radiobiologicalindices such as tumor control probability (TCP) and normal tissue complication probability (NTCP).Additionally, the DMLC aperture, an MLC outline defined by the initial and final leaf positions,is created for each field and can be viewed in beam’s-eye view with overlaid iso-intensity contours(figure 6–7). If the dose distribution does not meet the clinical goals of treatment, the optimiza-tion parameters, optimization only structures, or beams are adjusted and the process is repeated.
MPP02120901—IMRT–Ling—file name: 06-hunt-treatment

TREATMENT PLANNING CONSIDERATIONS USING IMRT
IMRT Plan Documentation And QAUpon completion of the plan, monitor unit (MU) settings are calculated and plan documenta-tion is prepared. In addition to the standard documentation, the following is produced for IMRTplans.
1. Digitally reconstructed radiographs (DRRs) of each treatment field overlaid with the DMLCaperture, as described above. These images are compared with portal images, also overlaidwith the DMLC aperture, obtained during the patient setup prior to the first treatment.
2. Independent verification of the MU setting for each field. As described in chapter 4, astand-alone software application has been developed for this purpose that accepts, as input,the leaf motion file and MU setting for each field. From the leaf motion file, an intensityprofile is generated and the dose to a user-specified point is calculated for comparison withIMRT plan output. Since 1998, this program has provided independent verification ofIMRT MU settings and has supplanted the former requirement of film dosimetry for everytreatment portal.
113
MPP02120901—IMRT–Ling—file name: 06-hunt-treatment
FIGURE 6–5. Effect of two different profile smoothing methods on optimized dose distributions.(a) Profile smoothing performed at end of each iteration (Savitsky-Golay). (b) Profile smoothing performedwithin the objective function (Score Smoothing). (c) Intensity profiles for posterior beam created by smoothingat the end of each iteration (left) and within the objective function (right). See COLOR PLATE 13.
114 HUNT AND BURMAN
3. Documentation of the IMRT plan identification number embedded in each leaf motion file.This number, which is indexed with each new optimization, is displayed on IMRT plan outputincluding dose distributions and MU calculation sheets.
All IMRT plans are reviewed by a senior physicist prior to the patient’s first treatment. Inaddition to the standard plan QA, the following is done:
1. Review of the independent MU verification for IMRT fields. Any discrepancy in excess of2% is initially investigated by calculating doses to additional points with the independentMU software and planning system. Unresolved discrepancies are investigated with film orion chamber dosimetry.
2. Comparison of the IMRT plan identification number displayed on plan output with thatembedded in the leaf motion file for each treatment field. Discrepancies indicate that theleaf motion files do not correspond to those used to create the treatment plan. We believe thata QA check of this type is particularly crucial for institutions (such as MSKCC) using plan-ning systems, electronic charts, and/or record and verify (R&V) systems without integrateddatabases. On several occasions, we have encountered situations where IMRT plans that werecomplete and ready for treatment were subsequently modified and planners inadvertentlyforgot to update the leaf motion files in the electronic chart/R&V system. Fortunately, these
MPP02120901—IMRT–Ling—file name: 06-hunt-treatment
FIGURE 6–6. Dose-volume histograms for the PTV and spinal cord and total MU settings for the Savitsky-Golay and score smoothing techniques for a para-spinal tumor (Figure 6–5).
TREATMENT PLANNING CONSIDERATIONS USING IMRT
potentially serious systematic errors were discovered prior to patient filming and treatmentthrough the plan identification number QA procedure.
3. Visual review of color displays of intensity profiles for each treatment field using VARIANShaper or VARiS software. Profiles are examined for consistency with expected results andthe presence of undesirable intensity peaks.
Controlling Dose Distributions Designed Using Inverse Planning:Optimization Algorithm PerformanceOptimized dose distributions are controlled primarily through the beam arrangement, the opti-mization parameters, and structures. Unfortunately, the response of the optimization algorithmto changes in any of these is not always straightforward or intuitive. Optimization parameters thatwork well for one patient may produce only mediocre results in another. The modification of apenalty or cost for one structure may affect the dose to another structure not even in the samephysical proximity. One thing is for certain: inverse planning requires the development of a newset of skills and intuition by the planner. In this section, we will describe some observations andstudies that have helped us develop planning skills applicable to the MSKCC optimization algo-rithm. Although other optimization algorithms may behave quite differently, some of theobservations or evaluation methods may be still be applicable.
Optimization ParametersThe goal of the optimization software is to iteratively adjust the beam intensities until the objec-tive function is minimized, and in so doing, satisfy the criteria defined by the optimization param-eters. However, often the criteria cannot be satisfied, either because they were physically unrealisticto begin with or because other factors are affecting the relationship between the objective func-tion minimization and the optimization parameters. Our experience has indicated that, in general,optimization parameters must be more stringent than the desired clinical result and that thepatient’s anatomy, in particular, the proximity of the critical normal tissues to the target, must beconsidered when setting the optimization parameters.
115
MPP02120901—IMRT–Ling—file name: 06-hunt-treatment
FIGURE 6–7. Digitally reconstructed radiograph demonstrating the DMLC aperture (in white) and iso-intensityline display (in gray).

116 HUNT AND BURMAN
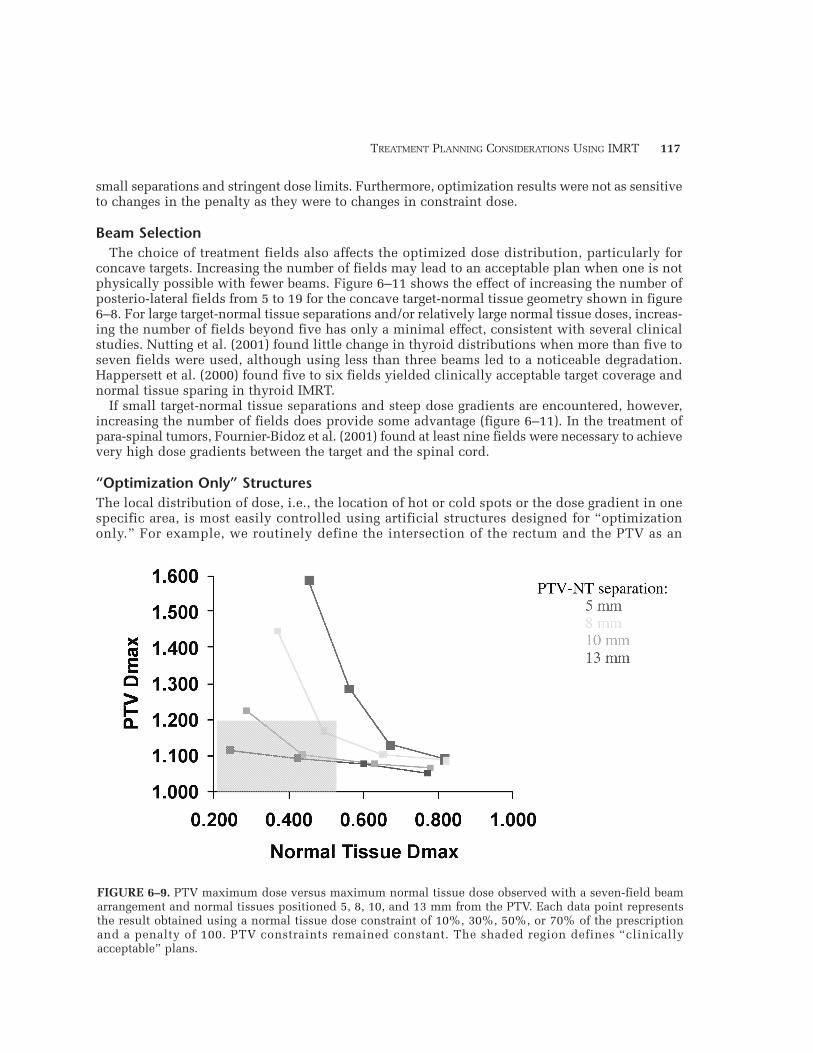
To improve our understanding of the performance of the optimization software, we have under-taken a pilot study designed to evaluate optimization results for one specific target-normaltissue geometry, that of a concave target surrounding a cylindrical normal tissue (Hunt et al. 2002)(figure 6–8). The variables included the separation between the target and normal tissue and theoptimization parameters applied to the normal tissue. The optimized dose distributions were eval-uated using the target dose uniformity and maximum normal tissue dose. Figure 6–9 displaysthe relationship between target and normal tissues doses for target-normal tissue separations of5 to 13 mm and different optimization parameters. The data points for a particular target-normaltissue separation represent the results obtained with normal tissue dose constraints of 10%, 30%,50%, and 70% of the prescription. Clearly, the target dose uniformity and normal tissue dosedepend strongly on the separation between the two structures, particularly when stringent con-straints are placed on the normal tissue dose. If, for example, acceptable plans are those inwhich target dose non-uniformity is no more than 20% and the maximum normal tissue dose isless than 55%, acceptable plans cannot always be achieved. As the separation between the twostructures increases, a range of constraints leads to acceptable, but different plans. The determi-nation of the best plan still requires a clinical decision based on the balance between target doseuniformity and normal tissue dose.
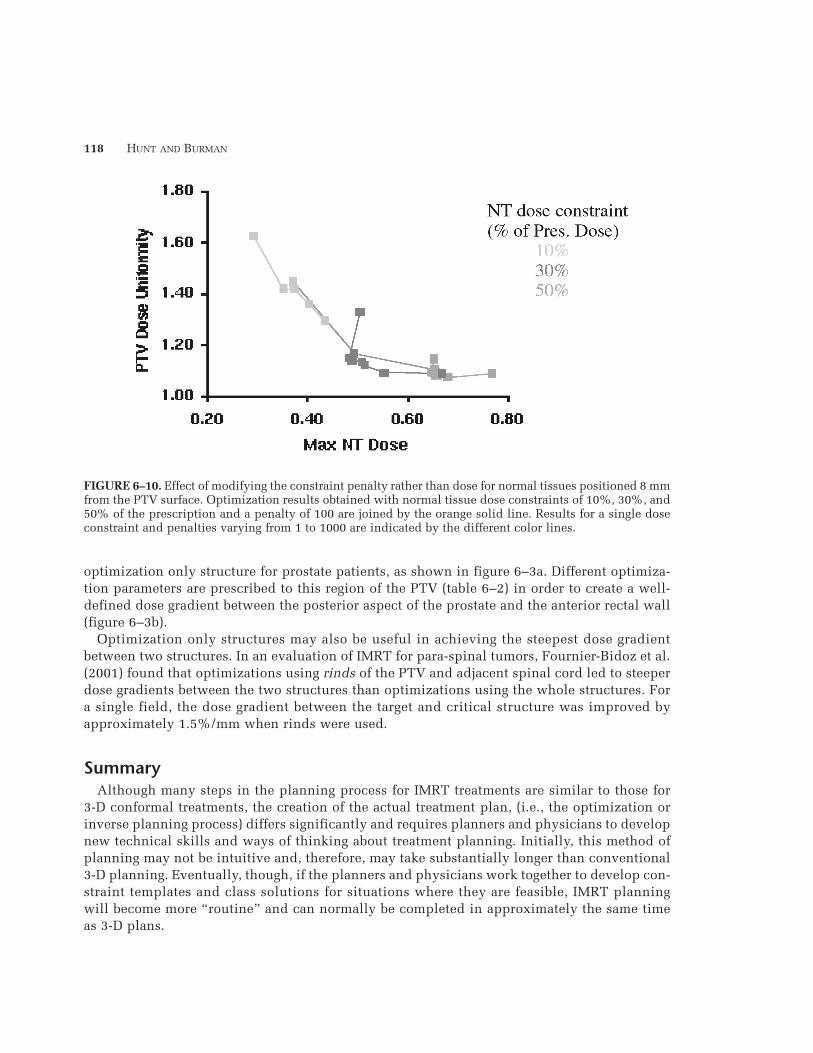
The effect of varying the penalty placed on the normal tissue rather than the optimizationdose is shown in figure 6–10. In general, an increasing penalty was associated with an increasein the PTV uniformity index and little change in the normal tissue dose. A simultaneous lower-ing of the normal tissue dose and increase in the PTV uniformity index was observed only for
MPP02120901—IMRT–Ling—file name: 06-hunt-treatment
FIGURE 6–8. Phantom, target, and normal tissue geometry used in optimization performance study. A varietyof beam arrangements including 5, 7, and 19 equally spaced posterio-lateral fields were studied.
TREATMENT PLANNING CONSIDERATIONS USING IMRT
small separations and stringent dose limits. Furthermore, optimization results were not as sensitiveto changes in the penalty as they were to changes in constraint dose.
Beam SelectionThe choice of treatment fields also affects the optimized dose distribution, particularly for
concave targets. Increasing the number of fields may lead to an acceptable plan when one is notphysically possible with fewer beams. Figure 6–11 shows the effect of increasing the number ofposterio-lateral fields from 5 to 19 for the concave target-normal tissue geometry shown in figure6–8. For large target-normal tissue separations and/or relatively large normal tissue doses, increas-ing the number of fields beyond five has only a minimal effect, consistent with several clinicalstudies. Nutting et al. (2001) found little change in thyroid distributions when more than five toseven fields were used, although using less than three beams led to a noticeable degradation.Happersett et al. (2000) found five to six fields yielded clinically acceptable target coverage andnormal tissue sparing in thyroid IMRT.
If small target-normal tissue separations and steep dose gradients are encountered, however,increasing the number of fields does provide some advantage (figure 6–11). In the treatment ofpara-spinal tumors, Fournier-Bidoz et al. (2001) found at least nine fields were necessary to achievevery high dose gradients between the target and the spinal cord.
“Optimization Only” StructuresThe local distribution of dose, i.e., the location of hot or cold spots or the dose gradient in onespecific area, is most easily controlled using artificial structures designed for “optimizationonly.” For example, we routinely define the intersection of the rectum and the PTV as an
117
MPP02120901—IMRT–Ling—file name: 06-hunt-treatment
FIGURE 6–9. PTV maximum dose versus maximum normal tissue dose observed with a seven-field beamarrangement and normal tissues positioned 5, 8, 10, and 13 mm from the PTV. Each data point representsthe result obtained using a normal tissue dose constraint of 10%, 30%, 50%, or 70% of the prescriptionand a penalty of 100. PTV constraints remained constant. The shaded region defines “clinicallyacceptable” plans.
118 HUNT AND BURMAN
optimization only structure for prostate patients, as shown in figure 6–3a. Different optimiza-tion parameters are prescribed to this region of the PTV (table 6–2) in order to create a well-defined dose gradient between the posterior aspect of the prostate and the anterior rectal wall(figure 6–3b).
Optimization only structures may also be useful in achieving the steepest dose gradientbetween two structures. In an evaluation of IMRT for para-spinal tumors, Fournier-Bidoz et al.(2001) found that optimizations using rinds of the PTV and adjacent spinal cord led to steeperdose gradients between the two structures than optimizations using the whole structures. Fora single field, the dose gradient between the target and critical structure was improved byapproximately 1.5%/mm when rinds were used.
SummaryAlthough many steps in the planning process for IMRT treatments are similar to those for
3-D conformal treatments, the creation of the actual treatment plan, (i.e., the optimization orinverse planning process) differs significantly and requires planners and physicians to developnew technical skills and ways of thinking about treatment planning. Initially, this method ofplanning may not be intuitive and, therefore, may take substantially longer than conventional3-D planning. Eventually, though, if the planners and physicians work together to develop con-straint templates and class solutions for situations where they are feasible, IMRT planningwill become more “routine” and can normally be completed in approximately the same timeas 3-D plans.
MPP02120901—IMRT–Ling—file name: 06-hunt-treatment
FIGURE 6–10. Effect of modifying the constraint penalty rather than dose for normal tissues positioned 8 mmfrom the PTV surface. Optimization results obtained with normal tissue dose constraints of 10%, 30%, and50% of the prescription and a penalty of 100 are joined by the orange solid line. Results for a single doseconstraint and penalties varying from 1 to 1000 are indicated by the different color lines.

TREATMENT PLANNING CONSIDERATIONS USING IMRT
ReferencesArmstrong, J. G., C. Burman, S. Leibel, D. Fontenla, G. Kutcher, M. Zelefsky, and Z. Fuks. (1993). “Three-
dimensional conformal radiation therapy may improve the therapeutic ratio of high dose radiation therapyfor lung cancer.” Int. J. Radiat. Oncol. Biol. Phys. 26:685–689.
Bortfeld, T., J. Burkelbach, R. Boesecke, and W. Schlegel. (1990). “Methods of image reconstruction fromprojections applied to conformation radiotherapy.” Phys. Med. Biol. 35: 1423–1434.
119
MPP02120901—IMRT–Ling—file name: 06-hunt-treatment
FIGURE 6–11. Effect of the number of treatment fields on optimization results for normal tissues posi-tioned 5 and 13 mm from the PTV. Results for 5, 7, and 19 equally spaced beam arrangements directedfrom the posterior and posterio-lateral directions are shown. The shaded area represents “clinically acceptable”plans.
Table 6–2. MSKCC IMRT Template for 81 Gy Prostate Patients: The IMRT Template Defines the ParametersThat Are Used as a Starting Point for Optimization and the Criteria Used to Evaluate the Plan
Optimization Parameters Treatment Plan Criteria
Structure
PTV (excludingRectalOverlap)
PTV-RectumOverlapRegion
Rectal WallRectal WallBladder WallBladder Wall
Max.Dose/Penalty
82.6 Gy/50
77.8 Gy/20
77 Gy/2032.4 Gy/2079.4 Gy/3532.4 Gy/20
MinDose/Penalty
79.4 Gy/50
75.3 Gy/10
————
Volume (%)—
—
—30—30
Dose
90 Gy Max.
—
75.6 Gy47 Gy
—40 Gy
Volume (%)
V95>90
—
3053—60

120 HUNT AND BURMAN
Boyer, A. L., T. Bortfeld, D. L. Kahler, and T. J. Waldron. “MLC Modulation of X-ray Beams in Discrete Steps”in XIth International Conference on the Use of Computers in Radiation Therapy. A. R. Hounsell, J. M.Wilkinson, and P. C. Williams (eds.). March 20–24, 1994. Manchester, UK. Manchester, UK: ChristieHospital NHS Trust. Madison, WI: Medical Physics Publishing, pp. 180–181, 1994.
Brahme, A. (1988). “Optimization of stationary and moving beam radiation therapy techniques.”Radiother. Oncol. 12(2):129–140.
Burman, C., C. S. Chui, G. Kutcher, S. Leibel, M. Zelefsky, T. LoSasso, S. Spirou, Q. Wu, J. Yang, J. Stein, R.Mohan, Z. Fuks, and C. C. Ling. (1997). “Planning, delivery, and quality assurance of intensity-modulat-ed radiotherapy using dynamic multileaf collimator: A strategy for large-scale implementation for thetreatment of carcinoma of the prostate.” Int. J. Radiat. Oncol. Biol. Phys. 39(4):863–873.
Carol, M. “Integrated 3-D Conformal Multivane Intensity Modulation Delivery System for Radiotherapy” inXIth International Conference on the Use of Computers in Radiation Therapy. A. R. Hounsell, J. M.Wilkinson, and P. C. Williams (eds.). March 20–24, 1994. Manchester, UK. Manchester, UK: ChristieHospital NHS Trust. Madison, WI: Medical Physics Publishing, pp. 172–173, 1994.
Carol, M. P., R. V. Nash, R. C. Campbell, R. Huber, and E. Sternick “The Development of a Clinically IntuitiveApproach to Inverse Treatment Planning: Partial Volume Prescription and Area Cost Function” in XIIICCR: XII International Conference on the Use of Computers in Radiation Therapy. D.D. Leavitt and G.Starkschall (eds). Salt Lake City, Utah, May 27–30, 1997. Madison, WI: Medical Physics Publishing, pp.317–319, 1997.
Chao, K. S., D. A. Low, C. A. Perez, and J. A. Purdy. (2000). “Intensity-modulated radiation therapy in headand neck cancers: The Mallinckrodt experience.” Int. J. Cancer 90(2):92–103.
Chui, C. S., M. F. Chan, E. Yorke, S. Spirou, and C. C. Ling. (2001). “Delivery of intensity-modulated radi-ation therapy with a conventional multileaf collimator: Comparison of dynamic and segmental methods.”Med. Phys. 28(12): 2441–2449.
Della Biancia, C., M. Hunt, and H. Amols. (2002). “A comparison of the integral dose from 3D conformaland IMRT techniques in the treatment of prostate cancer.” (Abstract). Med. Phys. 29(6):1216.
De Neve, W., W. De Gersem, S. Derycke, C. De Meerleer, M. Moerman, M. T. Bate, B. Van Duyse, L. Vakaet,Y. De Deene, B. Mersseman, C. De Wagter, and C. De Waeter. (1999). “Clinical delivery of intensity mod-ulated conformal radiotherapy for relapsed or second-primary head and neck cancer using a multileaf col-limator with dynamic control.” Radiother. Oncol. 50(3):301–314.
Ezzell, G. A. (1996). “Genetic and geometric optimization of three-dimensional radiation therapy treatmentplanning.” Med. Phys. 23(3): 293–305.
Fournier-Bidoz, N., P. Giraud, S. Spirou, C. Chui, M. Lovelock, K. Yenice, and M. Hunt. (2001). “Penumbrasharpening with IMRT in Paraspinal Treatments.” (Abstract). Med. Phys. 28(6):1260.
Galvin, J. M., X. G. Chen, and R. M. Smith. (1993). “Combining multileaf fields to modulate fluence distri-butions.” Int. J. Radiat. Oncol. Biol. Phys. 27(3): 697–705.
Happersett, L., M. Hunt, C. Chui, C. Burman, C. Ling, M. Zelefsky, S. Leibel, and H. Amols. (1999). “Dosepainting for prostate cancer using IMRT techniques.” American Association of Physicists in Medicine(AAPM) Annual Meeting, Nashville, TN, June1999. Med. Phys. 26(6): No page number.
Happersett, L., M. Hunt, L. Chong, et al. (2000). “Intensity Modulated radiation therapy for the treatment ofthyroid cancer.” Int. J. Radiat. Oncol. Biol. Phys. 48(3S):351.
Hsiung, C. Y., E. D. Yorke, C. S. Chui, M. A. Hunt, C. C. Ling, E. Y. Huang, C. J. Wang, H. C. Chan, S. A. Yeh,H. C. Hsu, and H. I. Amols. (2002). “Intensity-modulated radiotherapy versus conventional three-dimen-sional conformal radiotherapy for boost or salvage treatment of nasopharyngeal carcinoma.” Int. J. Radiat.Oncol. Biol. Phys. 53(3):638–647.
Hunt, M. A., M. J. Zelefsky, S. Wolden, C. S. Chui, T. LoSasso, K. Rosenzweig, L. Chong, S. V. Spirou, L.Fromme, M. Lumley, H. Amols, C. C. Ling, and S. A. Leibel. (2001). “Treatment planning and delivery ofintensity-modulated radiation therapy for primary nasopharynx cancer.” Int. J. Radiat. Oncol. Biol. Phys.49(3):623–632.
Hunt, M., C. Y. Hsiung, S. V. Spirou, C. S. Chui, and C. C. Ling. (2002). “Evaluation of concave dose distri-butions created using an inverse planning system.” Int. J. Radiat. Oncol. Biol. Phys. 54(3):953.
Langer, M., and J. Leong. (1987). “Optimization of beam weights under dose-volume restrictions.” Int. J.Radiat. Oncol. Biol. Phys. 13(8): 1255–1260.
MPP02120901—IMRT–Ling—file name: 06-hunt-treatment

TREATMENT PLANNING CONSIDERATIONS USING IMRT
Llacer, J. (1997). “Inverse radiation treatment planning using the dynamically penalized likelihood method.”Med. Phys. 24(11):1751–1764.
Mageras, G. S., and R. Mohan. (1993). “Application of fast simulated annealing to optimization of confor-mal radiation treatments.” Med. Phys. 20(3): 639–647.
Nutting, C. M., D. J. Convery, V. P. Cosgrove, C. Rowbottom, L. Vini, C. Harmer, D. P. Dearnaley, and S.Webb. (2001). “Improvements in target coverage and reduced spinal cord irradiation using intensity-mod-ulated radiotherapy (IMRT) in patients with carcinoma of the thyroid gland.” Radiother. Oncol.60(2):173–180.
Pirzkall, A., M. P. Carol, B. Pickett, P. Xia, M. Roach 3rd, L. J. Verhey. (2002). “The effect of beam energyand number of fields on photon-based IMRT for deep-seated targets.” Int. J. Radiat. Oncol. Biol. Phys.53(2):434–442.
Purdy, J. A. “The Development of Intensity Modulated Radiation Therapy” in 1st NOMOS IMRT Workshop.Durango, Colorado. Madison, WI: Advanced Medical Publishing, 1997.
Rosen, I. I., K. S. Lam, R. G. Lane, M. Langer, and S. M. Morrill. (1995). “Comparison of simulated anneal-ing algorithms for conformal therapy treatment planning.” Int. J. Radiat. Oncol. Biol. Phys. 33(5):1091–1099.
Soderstrom, S., and A. Brahme. (1992). “Selection of suitable beam orientations in radiation therapy usingentropy and Fourier transform measures.” Phys. Med. Biol. 37(4): 911–924.
Spirou, S. V., and C. S. Chui. (1994). “Generation of arbitrary intensity profiles by dynamic jaws or multi-leaf collimators.” Med. Phys. 21(7): 1031–1041.
Spirou, S. V., and C. S. Chui. (1998). “A gradient inverse planning algorithm with dose-volume con-straints.” Med. Phys. 25(3):321–333.
Spirou, S., E. Yorke, A. Jackson, and C. Chui. (2001). “Optimization with both dose-volume and biologicalconstraints for lung IMRT.” 43rd Annual AAPM Meeting, Salt Lake City, UT, July 22–26, 2001. Med. Phys.28(6):1261.
Spirou, S. V., N. Fournier-Bidoz, J. Yang, C. S. Chui, and C. C. Ling. (2001). “Smoothing intensity-modulat-ed beam profiles to improve the efficiency of delivery.” Med. Phys. 28(10):2105–2112.
Teukolsky, S., W. Vettering, and B. Flannery. Savitzky-Golay Smoothing Filters, in Numerical Recipes in C.New York: W.H. Press, pp. 650–655, 1992.
Verhey, L. J. (1999). “Comparison of three-dimensional conformal radiation therapy and intensity-modulatedradiation therapy systems.” Semin. Radiat. Oncol. 9(1):78–98.
Vijayakumar, S., L. C. Myrianthopoulos, I. Rosenberg, H. J. Halpern, N. Low, and G. T. Chen. (1991).“Optimization of radical radiotherapy with beam’s eye view techniques for non-small cell lung cancer.”Int. J. Radiat. Oncol. Biol. Phys. 21(3):779–788.
Wu, Q., M. Manning, R. Schmidt-Ullrich, and R. Mohan. (2000). “The potential for sparing of parotids andescalation of biologically effective dose with intensity-modulated radiation treatments of head and neckcancers: A treatment design study.” Int. J. Radiat. Oncol. Biol. Phys. 46(1):195–205.
Yorke, E. (2001). “Advantages of IMRT for dose escalation in radiation therapy of lung cancer.” 43rdAnnual AAPM Meeting, Salt Lake City, UT, July 22–26, 2001. Med. Phys. 28(6):1291–1292.
Zelefsky, M. J., Z. Fuks, L. Happersett, H. J. Lee, C. C. Ling, C. M. Burman, M. Hunt, T. Wolfe, E. S. Venktraman,A. Jackson, M. Skwarchuk, and S. A. Leibel. (2000). “Clinical experience with intensity modulated radi-ation therapy (IMRT) in prostate cancer.” Radiother. Oncol. 55(3):241–249.
121
MPP02120901—IMRT–Ling—file name: 06-hunt-treatment

COLOR PLATE 1. Figure 6-1. Five-field IMRT technique for the treatment ofthyroid cancer. Note the concave shape of the dose distribution between thetarget and spinal cord.
COLOR PLATE 2. Figure 6-2. A comparison of IMRT (a) and 3-D conformal (b) dose distributions for the treatmentof a lung tumor. Even though the same beam arrangement was used for both plans, there is significant improvementin the lung dose with IMRT.
(a) IMRT (b) 3D
2500 4000 6000 8400 cGy PTV

COLOR PLATE 3. Figure 6-3. Use of logical combinations of structures to control optimized dose distributions.
COLOR PLATE 4. Figure 6-5. Effect of two different profile smoothing methods on optimized dose distributions. (a)Profile smoothing performed at end of each iteration (Savitsky-Golay). (b) Profile smoothing performed within theobjective function (Score Smoothing). (c) Intensity profiles for posterior beam created by smoothing at the end ofeach iteration (left) and within the objective function (right).