Treatment of shale gas drilling flowback fluids (SGDFs) by ...
31
University of Wollongong University of Wollongong Research Online Research Online Faculty of Engineering and Information Sciences - Papers: Part A Faculty of Engineering and Information Sciences 1-1-2015 Treatment of shale gas drilling flowback fluids (SGDFs) by forward Treatment of shale gas drilling flowback fluids (SGDFs) by forward osmosis: membrane fouling and mitigation osmosis: membrane fouling and mitigation Gang Chen Chinese Academy of Sciences Zhongwei Wang Chinese Academy of Sciences, [email protected] Long D. Nghiem University of Wollongong, [email protected] Xue-mei Li Chinese Academy of Sciences Ming Xie University of Wollongong, [email protected] See next page for additional authors Follow this and additional works at: https://ro.uow.edu.au/eispapers Part of the Engineering Commons, and the Science and Technology Studies Commons Recommended Citation Recommended Citation Chen, Gang; Wang, Zhongwei; Nghiem, Long D.; Li, Xue-mei; Xie, Ming; Zhao, Baolong; Zhang, Mengxi; Song, Jianfeng; and He, Tao, "Treatment of shale gas drilling flowback fluids (SGDFs) by forward osmosis: membrane fouling and mitigation" (2015). Faculty of Engineering and Information Sciences - Papers: Part A. 3952. https://ro.uow.edu.au/eispapers/3952 Research Online is the open access institutional repository for the University of Wollongong. For further information contact the UOW Library: [email protected]
Transcript of Treatment of shale gas drilling flowback fluids (SGDFs) by ...

University of Wollongong University of Wollongong
Research Online Research Online
Faculty of Engineering and Information Sciences - Papers: Part A
Faculty of Engineering and Information Sciences
1-1-2015
Treatment of shale gas drilling flowback fluids (SGDFs) by forward Treatment of shale gas drilling flowback fluids (SGDFs) by forward
osmosis: membrane fouling and mitigation osmosis: membrane fouling and mitigation
Gang Chen Chinese Academy of Sciences
Zhongwei Wang Chinese Academy of Sciences, [email protected]
Long D. Nghiem University of Wollongong, [email protected]
Xue-mei Li Chinese Academy of Sciences
Ming Xie University of Wollongong, [email protected]
See next page for additional authors
Follow this and additional works at: https://ro.uow.edu.au/eispapers
Part of the Engineering Commons, and the Science and Technology Studies Commons
Recommended Citation Recommended Citation Chen, Gang; Wang, Zhongwei; Nghiem, Long D.; Li, Xue-mei; Xie, Ming; Zhao, Baolong; Zhang, Mengxi; Song, Jianfeng; and He, Tao, "Treatment of shale gas drilling flowback fluids (SGDFs) by forward osmosis: membrane fouling and mitigation" (2015). Faculty of Engineering and Information Sciences - Papers: Part A. 3952. https://ro.uow.edu.au/eispapers/3952
Research Online is the open access institutional repository for the University of Wollongong. For further information contact the UOW Library: [email protected]

Treatment of shale gas drilling flowback fluids (SGDFs) by forward osmosis: Treatment of shale gas drilling flowback fluids (SGDFs) by forward osmosis: membrane fouling and mitigation membrane fouling and mitigation
Abstract Abstract A polyamide thin-film composite (TFC) forward osmosis (FO) membrane was fabricated and compared to a commercially available cellulose acetate (CTA) membrane for treating shale gas drilling flow-back fluids (SGDFs). The polyamide TFC membrane outperformed its CTA counterpart in terms of pure water flux and reverse salt flux when synthetic brine was used as the feed. More severe fouling was observed for the polyamide TFC membrane as compared to the CTA counterpart when treating SGDF. Very quick buildup of fouling was identified for TFC membrane but not significant for CTA membrane. Ultrafiltration pre-treatment delayed but did not alleviate fouling formation. Surface modification of the TFC membrane by poly(ethylene gycol) (PEG) grafting resulted in reduced membrane fouling and marginal decrease in water flux.
Disciplines Disciplines Engineering | Science and Technology Studies
Publication Details Publication Details Chen, G., Wang, Z., Nghiem, L. D., Li, X., Xie, M., Zhao, B., Zhang, M., Song, J. & He, T. (2015). Treatment of shale gas drilling flowback fluids (SGDFs) by forward osmosis: membrane fouling and mitigation. Desalination, 366 113-120. Desalination
Authors Authors Gang Chen, Zhongwei Wang, Long D. Nghiem, Xue-mei Li, Ming Xie, Baolong Zhao, Mengxi Zhang, Jianfeng Song, and Tao He
This journal article is available at Research Online: https://ro.uow.edu.au/eispapers/3952

1
1
Treatment of Shale Gas Drilling Flowback Fluids (SGDF) 2
by Forward Osmosis: Membrane fouling and mitigation 3
4
Gang Chen1, Zhouwei Wang
1, Long D. Nghiem
2, Xue-Mei Li
1*, Ming Xie
2, 5
Baolong Zhao1, Mengxi Zhang
1,3, Jianfeng Song
1,3, Tao He
1,4* 6
7
1Membrane Materials and Separation Technology, Shanghai Advanced Research 8
Institute, Chinese Academy of Sciences, Shanghai, China 9 2Strategic Water Infrastructure Laboratory, School of Civil, Mining and 10
Environmental Engineering, University of Wollongong, Wollongong, NSW 2522, 11
Australia 12 3University of Chinese Academy of Sciences, Beijing, 100049, China 13
4School of Physical Science and Technology, ShanghaiTech University, Shanghai, 14
201210, China 15
16
17
Corresponding authors: [email protected], [email protected] 18
Tel: +86-21-20325162; Fax: 0086-21-20325034 19
20
Submitted to Desalination 21
22
23

2
24
Abstract 25
A polyamide thin-film composite (TFC) forward osmosis (FO) membrane was 26
fabricated and compared to a commercially available cellulose acetate (CTA) 27
membrane for treating shale gas drilling flow-back fluids (SGDF). The polyamide 28
TFC membrane outperformed its CTA counterpart in terms of pure water flux and 29
reverse salt flux when synthetic brine was used as the feed. However, due to its rough 30
and hydrophobic surface, more severe fouling was observed for the polyamide TFC 31
membrane as compared to the CTA counterpart when SGDF (with a significant 32
foulant content) was used as the feed solution. Ultrafiltration pretreatment was not 33
effective to control fouling of the polyamide TFC membrane. On the other hand, the 34
results demonstrate that surface modification of the TFC membrane by poly (ethylene 35
gycol) (PEG) grafting could be used to control the membrane fouling. The PEGylated 36
TFC membrane prepared in this study showed similar fouling resistance as the 37
commercially available CTA membrane when real SGDF was used as the feed 38
solution. 39
40
Keywords: Shale gas; forward osmosis; high salinity water; membrane fouling; 41
PEGylation. 42
43

3
1. Introduction 44
Hydraulic fracturing is a key technology in the exploration of shale gas, an 45
important unconventional natural gas, which has been recognized as an essential 46
component of the global energy mix to ensure supply continuity. During hydraulic 47
fracturing, the fracturing fluid, consisting of mainly water mixed with sand and 48
chemicals (such as surfactants, chelating agents, biocides), is injected at high pressure 49
into the producing formation, creating fissures that allow natural gas to release from 50
rock pores where it is trapped to the surface. About 70% of this fluid is returned to the 51
surface after the fracturing process. It is commonly known as shale gas drilling 52
flowback fluid (SGDF). In recent years, the treatment of SGDF has gained intensive 53
research attentions because of its large volume, significant environmental impact, 54
high salinity, and complicated composition [1-4]. Among several methods currently 55
being explored, forward osmosis is possibly the most promising technology due to its 56
resistance to fouling, process simplicity and high water recovery [5-9]. 57
Forward osmosis is an osmotically driven membrane process, where the chemical 58
potential gradient acts as the driving force for water transfer across the membrane 59
from a dilute feed to a concentrated draw solution [5]. The treatment of drilling mud 60
and flow-back water from shale gas exploration has been reported in several recent 61
studies [2, 10-12]. Cellulose triacetate (CTA) FO membranes were used in most of 62
these investigations [2, 12]. Despite the low fouling propensity of CTA FO 63
membranes and their relatively low water flux, significant membrane fouling has been 64
reported [2]. Polyamide FO membranes showed much higher flux and lower reverse 65

4
salt diffusion than CTA counterparts. However, the fouling behavior has not yet been 66
systematically investigated for treating real SGDF. 67
In this study, a thin-film composite (TFC) polyamide membrane was synthesized 68
to evaluate the treatment of SGDF in comparison to the commercially available CTA 69
membrane. Synthetic brine and real SGDF with a similar ionic composition were used. 70
The observation of fouling formation on the TFC FO membrane was reported in 71
comparison to the CTA FO membrane. The effect of pretreatment using ultrafiltration 72
for SGDF was investigated. The results also demonstrate that by PEGylating the TFC 73
membrane surface, a more fouling resistant membrane could be obtained. This 74
research provided important information on the attenuation of fouling during FO 75
treatment of SGDF. 76
77
2. Materials and methods 78
2.1 Chemicals and membrane materials 79
Polysulfone (PSf, P3500) was purchased from Solvay. Flat sheet CTA membranes 80
were obtained from Hydration Technology Innovations (Albany, OR). Sodium 81
chloride (NaCl) and potassium chloride (KCl) were provided by Sinopharm Chemical 82
Reagent Co., Ltd. M-phenylenediamine (MPD), triethyl amine (TEA), dimethyl 83
sulfoxide (DMSO), trimesoyl chloride (TMC), and Jeffamine (ED 2003) were 84
obtained from Sigma-Aldrich (Shanghai, China). Unless otherwise stated, all 85
chemicals and solvents were of reagent grade. SGDF sample was supplied by a 86
Chinese Petro company in Southwest China. The SGDF was filtered using GE 87
5
Whatman Filter Paper (40 μm) prior to any experiments and analyses to remove large 88
solid particles. A synthetic solution having an ionic composition identical to that of 89
the SGDF was prepared from analytical grade salts. 90
91
2.2 Composition determination of SGDF 92
Conductivity, pH, and turbidity of the flow-back fluid were measured using a 93
Mettler Toledo (LE703) conductivity meter, Sartorius pH meter (PB-10), Hach 94
turbidity meter (2100Q), respectively. A Shimadzu Inductively Coupled Plasma 95
Atomic Emission Spectroscopy (ICP AES, ICPE-9000) was used to determine the 96
cation concentration of the flow-back fluid. Total hardness was determined using 97
disodium ethylene diamine tetraacetate (EDTA-2Na) titration method. COD and 98
NH3-N was determined by digestive degradation and measured by spectrophotometer 99
(Hach DR2800) based on the standard methods. The distributions of the suspended 100
particles were measured by dynamic light scattering (Malvern Zetasizer Nano ZS90). 101
The top surfaces of both TFC and CTA membranes before and after experiments were 102
analyzed by scanning electron microscopy equipped with energy dispersive X-ray 103
spectroscopy (EDS) (Hitachi S-4800, Japan). 104
105
2.3 Fabrication of TFC-FO membranes and surface modification 106
2.3.1 Support membrane preparation 107
The support layer was prepared from PSf as follows: A mixture of PSf (18 g), 108
PEG-400 (8 g), and DMAC (73.6 g) were stirred mechanically at 65 C until a clear 109

6
solution was obtained. After cooling down to room temperature, the polymer solution 110
was filtered and then de-gassed. A film applicator (Elcometer 4340, Elcometer Asia 111
Pte. Ltd) was used to cast the membrane on a glass plate using a casting knife of 150 112
µm. The glass plate was then immersed into a water bath at 30 C. The resulting PSf 113
membrane was washed and stored in DI water. 114
115
2.3.2 Polyamide active layer fabrication 116
To form the polyamide active layer, the top surface of the PSf membrane was 117
brought into contact with a water phase, containing MPD (2 wt%), DMSO (2 wt%) 118
and TEA (4 wt%) for 2 min. The excess aqueous solution was decanted and the 119
membrane surface was blown dry with nitrogen gas. The membrane was then brought 120
into contact with a TMC hexane solution (0.15 wt.%) for 1 min and dried in air for 2 121
min. Finally, the TFC polyamide membrane was cured in an oven at 100 C for 3 min, 122
and stored in DI water before further experiments and analysis. 123
124
2.3.3 PEGylation of the polyamide layer 125
The TFC polyamide membrane surface was modified based on a PEGylation 126
technique published procedure [13]. Briefly, after draining the excess TMC solution 127
and before further curing step in an oven, the nascent polyamide layer was covered 128
with Jeffamine solution (1.0 wt.% in DI water) for 2 min, resulting in reaction of the 129
primary amine groups at the ends of the Jeffamine dangling acyl chloride groups on 130
the polyamide surface. The modified membrane surface was dried in an oven at 100 131

7
C for 3 min. The obtained membranes were rinsed and stored in DI water before 132
further experiments and analysis. 133
134
2.4 Membrane testing systems and protocols 135
2.4.1 Determination of membrane active layer properties 136
Key membrane transport parameters including pure water permeability 137
coefficient, A, salt permeability coefficient, B, and salt rejection, R, of the FO 138
membranes were determined using a laboratory-scale cross-flow reverse osmosis 139
system (Sterlitech Corporation) following the standard procedure previously 140
established by Cath et al [14]. The effective membrane area was 42 cm2. All 141
experiments were conducted at 25 1 C. The cross-flow velocity was maintained at 142
0.25 m/s. The intrinsic water permeability, A, was determined by: 143
A = Jw/P (1) 144
The pure water flux, Jw, was measured by dividing the volumetric permeate rate 145
by the membrane surface area with DI feed water under an applied trans-membrane 146
pressure of 10 bar. Salt rejection was characterized by keeping the applied pressure at 147
10 bar and measuring the rejection of 1000 ppm NaCl solution with a calibrated 148
conductivity meter (Mettler Toledo LE703). The water flux using NaCl feed solution 149
is denoted as JwNaCl
. The observed NaCl rejection, R, was determined from the 150
difference between the bulk feed (cb) and permeate (cp) salt concentrations, R = 151
1-cp/cb. The solute permeability, B, was determined from [15-17]: 152
8
k
J
R
RJB
NaCl
wNaCl
w exp1
(2) 153
where k represents the mass transfer coefficient for the cross-flow cell, and was 154
calculated from correlation for a rectangular cell geometry and laminar flow [18]. 155
156
2.4.2 Structural properties determination 157
A laboratory scale FO membrane system consisted of two half cells that could 158
hold a flat sheet sample of 30 cm2 (i.e. length, width, and height were 10, 3, and 0.4 159
cm, respectively). Two variable speed gear pumps (WT3000-1FA, Baoding Qili 160
Precision Pump Co., Ltd) were used to circulate the feed and draw solutions 161
concurrently. The feed and draw solution flow rates were monitored using rotameters. 162
The temperature of the feed and draw solutions were maintained at 25 1 C. The 163
weight of the feed and permeate reservoirs were determined by digital balances 164
(CP4202C, OHAUS Corporation), which are connected to a computer for data 165
logging. Membranes were tested under FO mode, where the feed water flows against 166
the dense active layer. Both feed and draw solution flow velocity was maintained at 167
4.6 cm/s. 168
The FO water flux was measured by monitoring the change in the draw solution 169
volume. The volume of both feed and draw solutions at the beginning of each 170
experimental run was 2.0 L. DI water and 0.5 M NaCl were used as the feed solution 171
and draw solution, respectively. The FO process was allowed to stabilize for 5 min 172
before each flux reading. The flux, Jv, was taken as the average reading over 30 min 173

9
by using the following equation: 174
drawm
vtA
mJ
(3) 175
Where Δm, Δt, Am, and ρdraw represent the mass of permeation water, time interval, 176
effective membrane surface area, and draw solution density, respectively. The change 177
of draw solution concentration was negligible and the ratio of water permeation to the 178
draw solution was less than 5%. 179
The reverse salt flux, Js, of the membrane was characterized by calculating the 180
change of salt content in the feed solution based on conductivity from the equation 181
(4): 182
tA
CVCVJ
m
ttS
00 (4) 183
The solute resistivity, K, can be determined by the following equation [19]: 184
mFv
bD
v AJB
AB
JK
,
,ln
1
(5) 185
where Jv is the FO water flux, D,b is the bulk osmotic pressure of the draw solution, 186
and F,m is the osmotic pressure at the membrane surface on the feed side. πF,m can be 187
calculated according to Eq. 6, 188
,
,
exp( )F m v
F b
J
k
(6) 189
The membrane structural parameter, S, was defined as the product of the product 190
of K and D [20]. 191
S KD (7) 192
193

10
2.4.3 Concentration of shale gas drilling flowback-fluid 194
The FO concentration of SGDF or synthetic brine was carried out using the same 195
laboratory-scale FO system as described above. Potassium chloride (KCl, 3.0 M) was 196
used as the draw solution [12]. Both feed and draw solutions (initial volume 2 L) were 197
maintained at 30 ± 1 C. The operation time varied from 12 to 48 h for different batch 198
of experiments. The flux was calculated according to Eq. 3 but averaged at every 10 199
min. All settings were evaluated with at least one replicate to ensure experimental 200
reproducibility. In this paper, only the representative profiles were included to 201
demonstrate the membrane fouling tendency during FO process. 202
203
2.5 Surface characterization 204
The membrane morphology was observed using scanning electron microscopy 205
(SEM). Samples were prepared by cryogenic breaking, followed by drying under 206
vacuum overnight at 30 C and gold coating. SEM images at low magnifications were 207
taken by Hitachi TM-1000. For images of high magnifications, a field emission 208
scanning electron microscopy (FESEM Hitachi S-4800) was utilized for image 209
acquisition. 210
211
3 Results and discussion 212
3.1 Characteristics of the FO membranes 213
The TFC membranes were prepared by interfacial polymerization using TMC and 214
MPD on a tailor-made PSf support. Fig. 1 shows both the top surface and 215

11
cross-section of the TFC membrane fabricated in this study and the commercially 216
available CTA membrane. The TFC membrane has a rough polyamide surface with 217
myriads of corrugation (Fig. 1a). It is supported by a porous PSf layer but has no 218
mesh reinforcement (Fig 1b). The PSf supporting layer has finger-like voids in the 219
middle and sponge porous structure close to the both top and bottom surfaces. In 220
contrast, the commercially available CTA membrane has a smooth surface (Fig. 1c) 221
and is reinforced by an embedded mesh in the middle (Fig. 1d). 222
223
224
Figure 1: SEM images of the polyamide TFC membrane fabricated in this study 225
(A and B, the top surface and cross section, respectively) and the commercially 226
available CTA membrane (C and D, the top surface and cross section, respectively). 227
228
Key characteristics of the FO membranes are shown in Table 1. The TFC 229
membrane showed a pure water permeability, A, of 3.5 L/m2h·bar, which is about 4 230

12
times higher than that of the CTA membrane. However, when using the same draw 231
solution (0.5 M NaCl), water flux of the TFC membrane was about twice as high as 232
that of the CTA membrane. The difference in performance ratio between the A value 233
(water permeability) and the actual water flux in FO mode can be attributed to the 234
different structural parameters (S) of these two membranes. The structural parameter 235
(S) of the TFC membrane (519 m) was considerably higher than that of the CTA 236
membrane (421 m). As a result, internal concentration polarization associated with 237
the TFC membrane is more severe than that associate with the CTA membrane. 238
The salt rejection of the TFC membranes in the RO test was also higher than that 239
of the CTA membrane. However, because the significantly higher water flux 240
compared to the CTA membrane, the solute permeability, B, of the TFC membrane is 241
slightly greater than that of CTA membrane. The ratio between the reverse solute flux 242
and FO water flux (Js/Jv) of the TFC membrane was 0.3 g/L, which is much smaller 243
than the CTA membrane (1.17 g/L). 244
245
Table 1 Characteristics of tailor-made TFC FO membranes and commercial CTA 246
membranes 247
Membrane
Water Permeability
A (L/m2·h·bar)
Rejection
(%)
B value
(10-7
m/s)
S value
(m)
Jv
(L/m2·h)
Js/Jv
(g/L)
TFC 3.5 95 3.04 519 16 0.30
CTA 0.79 89.1 2.39 421 8.7 1.17
Note: A, B and Rejection values were determined by RO using 1000 mg/L NaCl 248

13
as feed under pressure of 10 ± 0.1 bar. S, Jv and Js/Jv values were obtained from FO 249
test using 0.5 mol/L NaCl and deionized water as draw and feed solution respectively 250
under FO mode (active layer facing deionized water) 251
3.2 Composition of SGDF 252
The characteristics of the SGDF after pretreated with 40 μm filter paper are 253
shown in Table 2. The SGDF used in this study was saline (conductivity of 11.29 254
mS/cm) and slightly alkaline (pH = 8.2). The total dissolved solids (TDS) of the 255
SGDF was 6.9 g/L. Sodium and chloride were the dominant ions in this SGDF sample, 256
followed by potassium and calcium which were present at 393 and140 mg/L, 257
respectively. The concentrations of all other ions were insignificant. A synthetic brine 258
was prepared from deionized water and analytical grade salts to only include the 259
major ions found in the real SGDF (Table 2). 260
Table 2 Characterization of synthetic brine and SGDF pre-filtered by a qualitative 261
filter paper 262
Analyzed items SGDF Synthetic brine
Conductivity (mS/cm) 11.29 11.3
pH 8.19 --
TDS (mg/L) 6906 --
Turbidity (NTU) 135 --
Calcium (mg/L) 140.2 140
Magnesium (mg/L) 18.05 17.8
Strontium (mg/L) 4.9 4.9

14
Potassium (mg/L) 393 393
Sodium (mg/L) 2109 2500
Hardness (CaCO3 mg/L) 283 --
CODCr (mg/L) 358.5 --
Boron (mg/L) 16.9 --
Sillicon (mg/L) 19.2 --
NH3-N (mg/L) 9.5 --
Sulfate (mg/L) 2.2 --
Carbonate (mg/L) 149 --
Chloride (mg/L) 4202.2 4521.6
263
3.3 FO concentration process 264
Major ionic components of the synthetic brine are of the same concentrations as 265
those in the real SGDF (Table 2). Thus, the synthetic brine and real SGDF are 266
expected to have similar osmotic pressure. In this study, the synthetic brine was used 267
as a reference (blank) since it contains no other contaminants except inorganic salt. 268
By controlling the FO concentration process to a state that the feed solution is far 269
from saturation, the fouling in FO process could be identified as the decline in the FO 270
flux against concentration ratio or time. The flux change with the concentration ratio 271
of feed was monitored using both CTA and TFC membranes as shown in Fig. 2. 272
When synthetic brine was used as the feed, the TFC membrane showed an initial 273
water flux nearly twice that of the CTA membrane (Fig. 2). The higher initial water 274
15
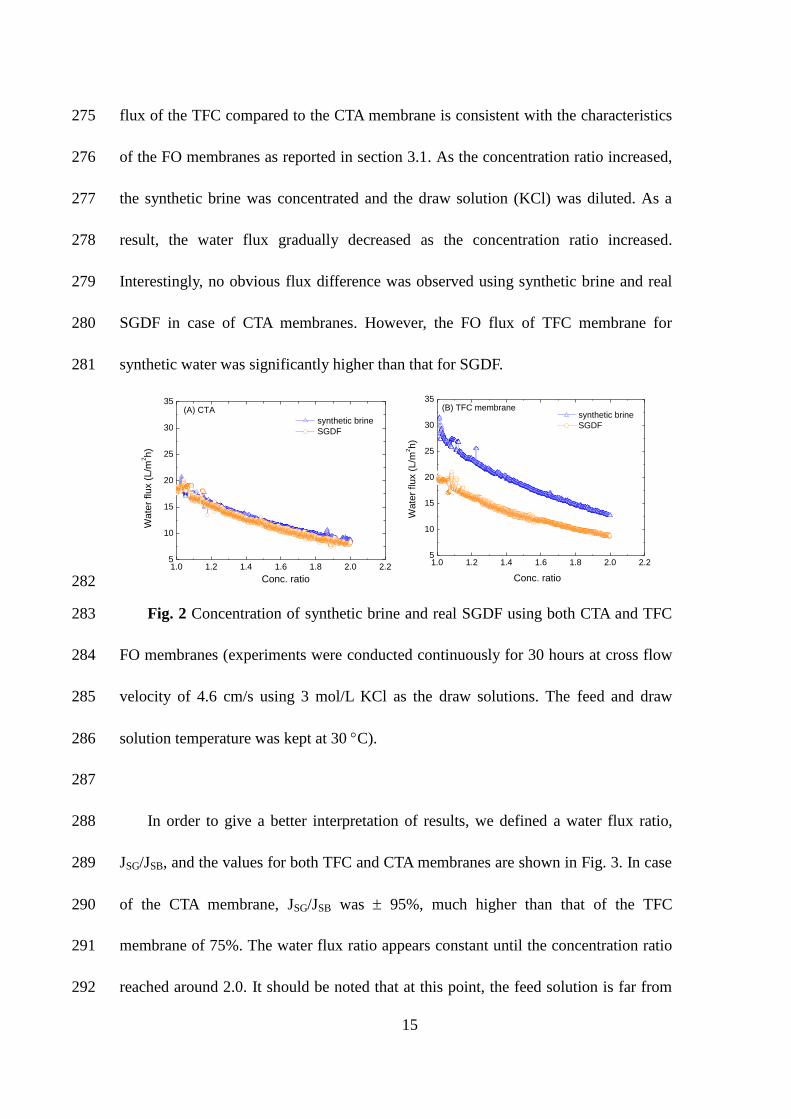
flux of the TFC compared to the CTA membrane is consistent with the characteristics 275
of the FO membranes as reported in section 3.1. As the concentration ratio increased, 276
the synthetic brine was concentrated and the draw solution (KCl) was diluted. As a 277
result, the water flux gradually decreased as the concentration ratio increased. 278
Interestingly, no obvious flux difference was observed using synthetic brine and real 279
SGDF in case of CTA membranes. However, the FO flux of TFC membrane for 280
synthetic water was significantly higher than that for SGDF. 281
1.0 1.2 1.4 1.6 1.8 2.0 2.25
10
15
20
25
30
35(A) CTA
Wate
r flux (
L/m
2h)
Conc. ratio
synthetic brine
SGDF
1.0 1.2 1.4 1.6 1.8 2.0 2.25
10
15
20
25
30
35(B) TFC membrane
Wa
ter
flu
x (
L/m
2h)
Conc. ratio
synthetic brine
SGDF
282
Fig. 2 Concentration of synthetic brine and real SGDF using both CTA and TFC 283
FO membranes (experiments were conducted continuously for 30 hours at cross flow 284
velocity of 4.6 cm/s using 3 mol/L KCl as the draw solutions. The feed and draw 285
solution temperature was kept at 30 C). 286
287
In order to give a better interpretation of results, we defined a water flux ratio, 288
JSG/JSB, and the values for both TFC and CTA membranes are shown in Fig. 3. In case 289
of the CTA membrane, JSG/JSB was 95%, much higher than that of the TFC 290
membrane of 75%. The water flux ratio appears constant until the concentration ratio 291
reached around 2.0. It should be noted that at this point, the feed solution is far from 292

16
saturation, thus no scaling is possible. The very high constant flux ratio for CTA 293
membrane indicates that no obvious fouling aggregation was built up on CTA 294
membrane during the FO process. The lower constant flux ratio for TFC membrane 295
shows that fouling occurred at the first beginning of the FO process and no further 296
fouling build-up was observed in the following FO process. 297
298
1.0 1.2 1.4 1.6 1.8 2.0 2.20
20
40
60
80
100
120
JS
G/J
SB (
%)
Conc. ratio
TFC
CTA
299
Fig. 3 Comparison of the FO water flux ratio for TFC and CTA membranes in 300
concentrating synthetic water and SGDF. JSG: FO water flux for SGDF; JSB: FO water 301
flux for synthetic brine. 302
303
Fouling was expected when the real SGDF was used as the feed. Fig. 4 shows the 304
SEM photos of the membrane surfaces for TFC and CTA membranes after treating 305
synthetic brine and SGDF. It is obvious that treating the synthetic brine, both top 306
surfaces of the TFC and CTA membrane remained clean. However, large crystals were 307
observed in the top surface of TFC membrane, and a few crystals were found in the 308

17
top surface of the CTA membrane. The chemical compositions of the crystals were 309
analyzed with EDS as shown in Fig. 5. The EDS shows that the chemical 310
compositions for TFC membrane surface shows that the crystals contained Ca, Mg, Sr 311
and Cl, C and O. It is most probable the precipitation of the CaCO3, MgCO3 and 312
SrCO3. 313
Comparing the top surfaces of the TFC membrane after treating the synthetic 314
brine (Fig.4 A) and SGDF (Fig. 4 B), we noticed that the ridge-and-valley 315
morphology was not as clear as fresh membrane (Fig. 1A), neither as that after 316
treating synthetic brine. It appears that the initially rough surface was smeared by 317
other contaminants. This is probably correct since there contains various unknown 318
organic matters as listed in Table 1 (COD =358 mg/L). However, since the synthetic 319
brine contains no other chemicals except the inorganic salt, the tendency for the 320
membrane to be fouled by other matters besides inorganic salt is low. Moreover, the 321
synthetic brine contains mainly ions in chloride from, the solubility is relatively high, 322
thus no scaling was observed at a concentration factor of 2. When comparing the 323
membrane surfaces of CTA membranes, it is indeed quite a surprise that the 324
membrane surface relatively clean and no obvious fouling was observed, which was 325
supported by the overlapping FO flux curves for both synthetic brine and SGDF as 326
shown in Fig. 2 and 3. 327
The complex nature of the real SGDF resulted in a quick formation of fouling 328
layer on TFC membrane surface. After formation of the fouling layer (as seen in Fig. 329
4), no severe mass transfer resistance was observed. CTA membrane showed the same 330

18
flux when treating SGDF as treating clean synthetic water. By combining the above 331
observation, it may be safe to conclude that the TFC membrane is prone to fouling by 332
the contaminants in SGDF, although the initial FO flux was not the same. 333
334
335
Figure 4. SEM photos of the top surfaces of the TFC membranes, (A) after 336
treating synthetic brine; (B) after treating SGDF; and top surfaces of the CTA 337
membranes, (C) treating synthetic brine; (D) after treating SGDF. The arrows refer to 338
surface area appeared to be covered by foulants. 339
340

19
0 4 8 12 160
700
1400
2100
2800
3500
Energy (keV)
Cl
Cl
C
O
-2 0 2 4 6 8 10 12 14 160
500
1000
1500
2000
2500
Energy (keV)
C
O
Ca
Ca
SrMg
0 2 4 6 8 100
500
1000
1500
2000
2500
Energy (keV)
C
O
-2 0 2 4 6 8 10 12 14 160
700
1400
2100
2800
3500
Energy (keV)
C
Cl
O
Ca
Na
Ca
A B
C D
0 4 8 12 160
700
1400
2100
2800
3500
Energy (keV)
Cl
Cl
C
O
-2 0 2 4 6 8 10 12 14 160
500
1000
1500
2000
2500
Energy (keV)
C
O
Ca
Ca
SrMg
0 2 4 6 8 100
500
1000
1500
2000
2500
Energy (keV)
C
O
-2 0 2 4 6 8 10 12 14 160
700
1400
2100
2800
3500
Energy (keV)
C
Cl
O
Ca
Na
Ca
A B
C D
341 342
Figure 5 EDS analysis of the top surfaces of flat sheet TFC membranes (A, fresh 343
and B, after concentrating SGDF) and CTA membranes (C fresh; and D after 344
concentrating SGDF) 345
346
3.4 Fouling mechanism 347
The results presented above indicate that TFC membrane is prone to fouling when 348
exposed to the real SGDF. Taking the membrane surface morphology into account as 349
shown in Fig. 1, it appears that the difference in membrane surface morphology is a 350
major reason for the high fouling propensity of the TFC compared to the CTA 351
membrane. The FO flux of TFC membrane (Fig.2 and Fig. 3) treating SGDF declined 352

20
almost instantaneously to about 75% at the beginning of the experiment. Combining 353
this and the SEM photo (Fig. 4 B), the quick fouling may be due to the filling-up of 354
the ridge-and-valley surface by foulants in the real SGDF (Fig 6). On the other hand, 355
the smooth surface of the CTA membrane reduces foulant deposition. Thus the 356
membrane surface was as clean as pristine membrane. 357
As schematically described in Fig. 6B, once the TFC surface is filled up, no 358
additional aggregation of foulants can occur and the fouled membrane surface is now 359
smooth. The duration of fouling buildup is obviously very quick, as shown in Fig. 2 360
and Fig. 3. This may be caused by the large amount of foulants (including organic 361
matter and colloidal particles) in the real SGDF [13, 21] . The SGDF contains a wide 362
distribution of particles with a maximum distribution intensity at ~1.2 m 363
(Supplementary Information Fig. S1). Even after pre-filtration with a commercial 364
ultrafiltration membrane of molecular weight cutoff of about 70000 Da., there remain 365
some particles of with a mean size of 0.3 m. Therefore, formation of a severe fouling 366
on the FO membrane is highly possible. By pre-filtrating the SGDF, the initial fouling 367
of the TFC membrane was slowed down (Supplementary Data Fig. S2). This was 368
probably due to the lower foulant content after ultrafiltration. However, the FO flux 369
declined gradually to a similar pattern as shown in Fig. 2 (B). 370
371

21
Support layer
Skin layer of CTA membrane
Flow direction
A372
Support layer
Flow direction
B
Active skinLayer of TFCmembrane
373
Fig. 6 Schematic of the fouling mechanism during the FO treatment of SGDF. 374
The small spheres represent possible foulants in the SGDF which may aggregate to 375
the surface. The dashed line indicates the top boundary between the active skin layer 376
and the feed bulk solution. 377
378
3.4 PEG grafting 379
Above investigation on the fouling formation during FO of SGDF shows that TFC 380
membrane tends to be fouled easier than CTA membrane. Results also indicated that 381
initial aggregation of the foulants to the rough surface was the starting point. 382
Reducing the content of foulant matter only delayed the membrane fouling. Therefore, 383
in this session, PEG grafting of the TFC membrane surface was adopted to reduce the 384
fouling propensity [13]. The PEG layer can reduce the TFC membrane surface 385

22
roughness and adhesion force between the surface and foulants, which has been 386
ascribed as the main reason for fouling reduction for TFC FO membrane after 387
PEGylation [13]. Jeffamine was used as the PEGylation agent. No significant changes 388
in the surface of the Jeffamine modified TFC membrane were observed (Fig.7A). 389
However, as can be seen in Fig. 7B the surface contact angle of modified membrane 390
decreased significantly from 86 ± 2.3o (unmodified membrane) to 34 ± 1.5
o 391
(PEGylated membrane). This is in agreement with previous results in the literature 392
[13], confirming that the PEGylation has been successful. 393
394
a
bPolyamide
86±2.3o
0
20
40
60
80
100
Polyamide PEGylation
Conta
ct
angle
(o)
Polyamide
PEGylation
PEGylation
34±1.5o
a
bPolyamide
86±2.3o
0
20
40
60
80
100
Polyamide PEGylation
Conta
ct
angle
(o)
Polyamide
PEGylation
PEGylation
34±1.5o
Polyamide
86±2.3o
0
20
40
60
80
100
Polyamide PEGylation
Conta
ct
angle
(o)
Polyamide
PEGylation
PEGylation
34±1.5o
395
Fig. 7. (A) An SEM image of the PEGylated TFC membrane surface and (B) 396
contact angles of TFC membrane before and after PEGylation. 397
398
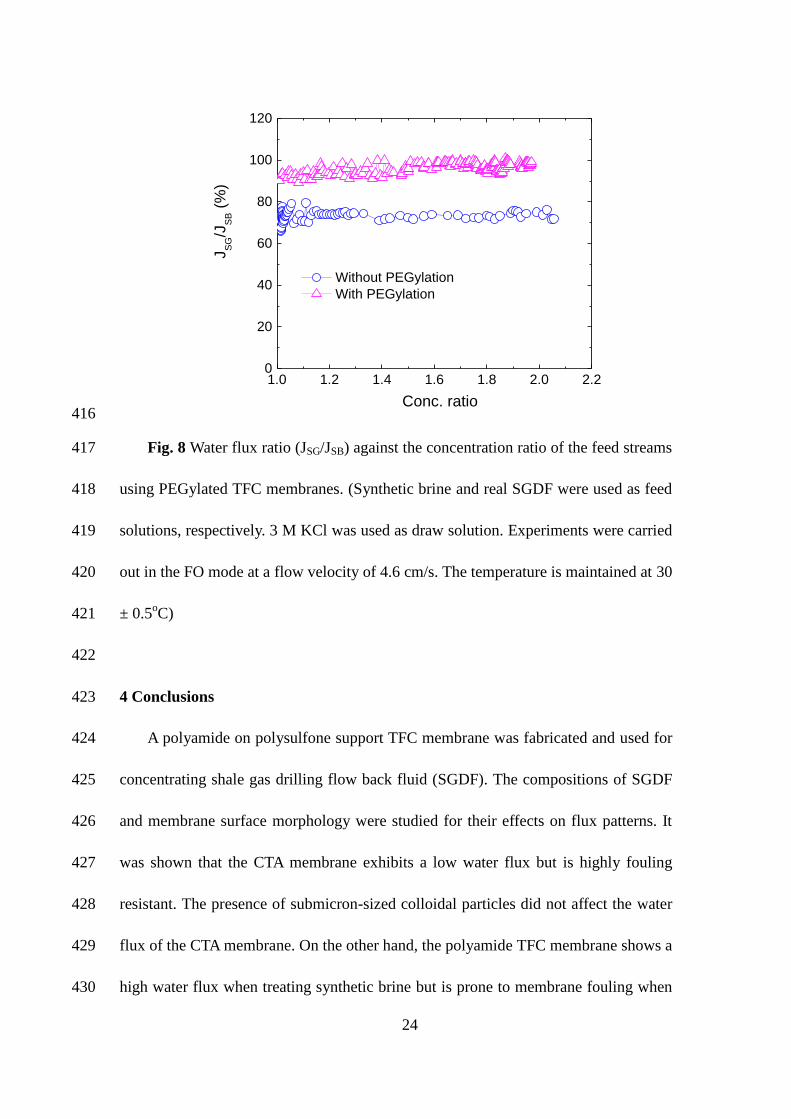
Again, the water flux ratio, JSG/JSB, was monitored for the TFC membranes after 399
23
PEGylation. After PEGylation, the water flux ratio stayed nearly constantly above 400
90%, in contrast to 75% before PEGylation, as shown in Fig. 8. Results confirmed 401
that PEGylation improves significantly the water flux of the TFC membrane. It should 402
be noted that that PEGylation resulted in reduction in the water flux value of about 403
20%. However, TFC membrane surface grafted with PEG has reduced adhesion to the 404
foulants, resulting in a fouling-resistance membrane. Similar observations have been 405
also reported previously [22-25]. SEM images of the PEGylated TFC membranes 406
after SGDF treatment are shown Supplementary Information Fig. S3. Slight coverage 407
of the surface by potential foulant was visible, however, no obvious scaling was found. 408
This observation confirmed the FO performance as shown in Fig. 8. However, the FO 409
flux indicates that the resistance of the fouling layer was not as significant as that 410
formed on the unmodified TFC membrane (Fig. 3). The results confirm that the 411
PEGylation is a very efficient way to reduce the membrane fouling. Further 412
optimization of the grafting density and layer thickness is necessary to maintain 413
optimal FO performance. 414
415
24
1.0 1.2 1.4 1.6 1.8 2.0 2.20
20
40
60
80
100
120
JS
G/J
SB (
%)
Conc. ratio
Without PEGylation
With PEGylation
416
Fig. 8 Water flux ratio (JSG/JSB) against the concentration ratio of the feed streams 417
using PEGylated TFC membranes. (Synthetic brine and real SGDF were used as feed 418
solutions, respectively. 3 M KCl was used as draw solution. Experiments were carried 419
out in the FO mode at a flow velocity of 4.6 cm/s. The temperature is maintained at 30 420
± 0.5oC) 421
422
4 Conclusions 423
A polyamide on polysulfone support TFC membrane was fabricated and used for 424
concentrating shale gas drilling flow back fluid (SGDF). The compositions of SGDF 425
and membrane surface morphology were studied for their effects on flux patterns. It 426
was shown that the CTA membrane exhibits a low water flux but is highly fouling 427
resistant. The presence of submicron-sized colloidal particles did not affect the water 428
flux of the CTA membrane. On the other hand, the polyamide TFC membrane shows a 429
high water flux when treating synthetic brine but is prone to membrane fouling when 430

25
treating real SGDF. The high fouling propensity of the polyamide TFC membrane 431
fabricated in this study could be ascribed to its rough and hydrophobic membrane 432
surface as well as the presence of colloidal particles in the real SGDF. Our study also 433
demonstrates that surface PEGylation of the TFC membranes could significantly 434
improve its fouling resistance while the reduction in pure water flux (due to 435
PEGylation) was only marginal. 436
437
Acknowledgements 438
The authors would like to thank the partial financial support from National 439
Natural Science Fund China (Project nos. 21176119), Shell Frontier Research 440
Funding (Project No. PT31966), the National Key Basic Research Program of China 441
(973 Program with project nos. 2012CB932800).442

26
ABBREVIATIONS 443
A intrinsic pure water permeability (L/m2·h·bar)
B salt permeability coefficient (L/m2·h)
Cf feed concentration (mol/L)
Cp permeate concentration (mol/L)
Jv water flux test by FO (L/m2·h)
Jw water flux test by RO (L/m2·h)
Js reverse salt flux by FO (g/m2·h)
K Solute resistivity (s/m)
k mass transfer coefficient (m/s)
D solution diffusion coefficient (cm2/s)
L the length of the channel (m)
osmotic pressure (bar)
porosity of the membrane
P operation pressure (bar)
S structural parameter (m)
Ε porosity (%)
τ tortuosity
ts thickness (m)
m1 wet membrane weight (g)
m2 dry membrane weight (g)
M mass of permeate water (g)
27
ρw water density (g/cm3)
ρp polymer density (g/cm3)
Sh Sherwood number
Re Reynolds number
Sc Schmidt number
Δt measured time (s)
Δm mass of permeability water in FO process (g)
Sm effective membrane area (cm2)
N the number of dissolved species of draw solution
R ideal gas constant (L.atm.mol-1
.K-1
)
T absolute temperature (K)
444

28
References
[1] B.G. Rahm, J.T. Bates, L.R. Bertoia, A.E. Galford, D.A. Yoxtheimer, S.J. Riha, Wastewater
management and Marcellus Shale gas development: Trends, drivers, and planning implications, Journal
of Environmental Management, 120 (2013) 105-113.
[2] K.L. Hickenbottom, N.T. Hancock, N.R. Hutchings, E.W. Appleton, E.G. Beaudry, P. Xu, T.Y. Cath,
Forward osmosis treatment of drilling mud and fracturing wastewater from oil and gas operations,
Desalination, 312 (2013) 60-66.
[3] B.G. Rahm, S.J. Riha, Toward strategic management of shale gas development: Regional, collective
impacts on water resources, Environmental Science & Policy, 17 (2012) 12-23.
[4] L. Shariq, Uncertainties associated with the reuse of treated hydraulic fracturing wastewater for
crop irrigation, Environmental Science & Technology, 47 (2013) 2435-2436.
[5] T.Y. Cath, A.E. Childress, M. Elimelech, Forward osmosis: Principles, applications, and recent
developments, Journal of Membrane Science, 281 (2006) 70-87.
[6] S. Zhao, L. Zou, C.Y. Tang, D. Mulcahy, Recent developments in forward osmosis: Opportunities
and challenges, Journal of Membrane Science, 396 (2012) 1-21.
[7] D.L. Shaffer, L.H.A. Chavez, M. Ben-Sasson, S.R.-V. Castrillon, N.Y. Yip, M. Elimelech,
Desalination and Reuse of High-Salinity Shale Gas Produced Water: Drivers, Technologies, and Future
Directions, Environmental Science & Technology, 47 (2013) 9569-9583.
[8] T.-S. Chung, X. Li, R.C. Ong, Q. Ge, H. Wang, G. Han, Emerging forward osmosis (FO)
technologies and challenges ahead for clean water and clean energy applications, Current Opinion in
Chemical Engineering, 1 (2012) 246-257.
[9] L.A. Hoover, W.A. Phillip, A. Tiraferri, N.Y. Yip, M. Elimelech, Forward osmosis: emerging
applications for greater sustainability, Environmental Science & Technology, 45 (2011) 9824-9830.
[10] R.L. McGinnis, N.T. Hancock, M.S. Nowosielski-Slepowron, G.D. McGurgan, Pilot
demonstration of the NH3/CO2 forward osmosis desalination process on high salinity brines,
Desalination, 312 (2013) 67-74.
[11] HTI, Oil wastewater treatment & gas treatment: lead story, in, 2011.
[12] X.M. Li, B.L. Zhao, Z.W. Wang, M. Xie, J.F. Song, L.D. Nghiem, T. He, Y. Chi, C.X. Li, G. Chen,
Water reclamation from shale gas drilling flow-back fluid using a novel forward osmosis-vacuum
membrane distillation hybrid system, Water Science and Technology, 69 (2014) 1036-1044.
[13] X.L. Lu, S.R.-V. Castrillon, D.L. Shaffer, J. Ma, M. Elimelech, In situ surface chemical
modification of thin-film composite forward osmosis membranes for enhanced organic fouling
resistance, Environmental Science & Technology, 47 (2013) 12219-12228.
[14] T.Y. Cath, M. Elimelech, J.R. McCutcheon, R.L. McGinnis, A. Achilli, D. Anastasio, A.R. Brady,
A.E. Childress, I.V. Farr, N.T. Hancock, J. Lampi, L.D. Nghiem, M. Xie, N.Y. Yip, Standard
Methodology for Evaluating Membrane Performance in Osmotically Driven Membrane Processes,
Desalination, 312 (2013) 31-38.
[15] W.A. Phillip, J.S. Yong, M. Elimelech, Reverse draw solute permeation in forward osmosis:
modeling and experiments, Environmental Science & Technology, 44 (2010) 5170-5176.
[16] C.Y. Tang, Q. She, W.C.L. Lay, R. Wang, A.G. Fane, Coupled effects of internal concentration
polarization and fouling on flux behavior of forward osmosis membranes during humic acid filtration,
Journal of Membrane Science, 354 (2010) 123-133.
[17] X. Jin, C.Y. Tang, Y.S. Gu, Q.H. She, S. Qi, Boric acid permeation in forward osmosis membrane

29
process: modeling, experiments, and implications, Environmental Science & Technology, 45 (2011)
2323-2330.
[18] E.M.V. Hoek, A.S. Kim, M. Elimelech, Influence of crossflow membrane filter geometry and
shear rate on colloidal fouling in reverse osmosis and nanofiltration separations, Environmental
Engineering & Science, 19 (2002) 357-372.
[19] S. Loeb, L. Titelman, E. Korngold, J. Freiman, Effect of porous support fabric on osmosis through
a Loeb-Sourirajan type asymmetric membrane, Journal of Membrane Science, 129 (1997) 243-249.
[20] J.R. McCutcheon, M. Elimelech, Influence of membrane support layer hydrophobicity on water
flux in osmotically driven membrane processes, Journal of Membrane Science, 318 (2008) 458-466.
[21] X.-M. Li, B. Zhao, Z. Wang, M. Xie, J. Song, L.D. Nghiem, T. He, C. Yang, C. Li, G. Chen, Water
reclamation from shale gas drilling flow-back fluid using a novel forward osmosis-vacuum membrane
distillation hybrid system, Water Science Technology, 69 (2014) 1036-1044.
[22] A.C. Sagle, E.M. Van Wagner, H. Ju, B.D. McCloskey, B.D. Freeman, M.M. Sharma, PEG-coated
reverse osmosis membranes: Desalination properties and fouling resistance, Journal of Membrane
Science, 340 (2009) 92-108.
[23] F. Li, J. Meng, J. Ye, B. Yang, Q. Tian, C. Deng, Surface modification of PES ultrafiltration
membrane by polydopamine coating and poly(ethylene glycol) grafting: Morphology, stability, and
anti-fouling, Desalination, 344 (2014) 422-430.
[24] S. Romero-Vargas Castrillón, X. Lu, D.L. Shaffer, M. Elimelech, Amine enrichment and
poly(ethylene glycol) (PEG) surface modification of thin-film composite forward osmosis membranes
for organic fouling control, Journal of Membrane Science, 450 (2014) 331-339.
[25] M.Z. Yunos, Z. Harun, H. Basri, A.F. Ismail, Studies on fouling by natural organic matter (NOM)
on polysulfone membranes: Effect of polyethylene glycol (PEG), Desalination, 333 (2014) 36-44.