Treatment of Junctions- Volume I: Final Report Treatment ... · Treatment of Junctions FINAL REPORT...
50
Treatment of Junctions- Volume I: Final Report Treatment of Junctions FINAL REPORT Volume I Section B6: Boralesgamuwa Transportation Research and Study Centre University of Moratuwa Sri Lanka 15 th January 2010
-
Upload
truongthuy -
Category
Documents
-
view
215 -
download
0
Transcript of Treatment of Junctions- Volume I: Final Report Treatment ... · Treatment of Junctions FINAL REPORT...

Treatment of Junctions- Volume I: Final Report
Treatment of Junctions
FINAL REPORT
Volume I
Section B6: Boralesgamuwa
Transportation Research and Study Centre
University of Moratuwa
Sri Lanka
15th
January 2010

Treatment of Junctions- Volume I: Final Report
i | P a g e
Section B6: Boralesgamuwa
Table of Contents
CHAPTER 1 - INTRODUCTION ___________________________________________________________ 1-1
1.1 Study Area ________________________________________________________________________ 1-2
1.2 Scope ____________________________________________________________________________ 1-6
1.3 Data Collection ____________________________________________________________________ 1-6
CHAPTER 2 - TRAFFIC ANALYSIS _______________________________________________________ 2-1
2.1 Turning Movement Counts ___________________________________________________________ 2-1
2.2 Link Movements ___________________________________________________________________ 2-3
2.2.1 Colombo-Horana Road ____________________________________________________________ 2-3
2.2.2 Dehiwala-Maharagama Road _______________________________________________________ 2-4
2.3 Pedestrian Movements______________________________________________________________ 2-4
2.4 Speed and delay ___________________________________________________________________ 2-6
2.5 Accident Studies ___________________________________________________________________ 2-7
2.6 Road Infrastructure _________________________________________________________________ 2-8
2.6.1 Highway Geometry of the Study Area _______________________________________________ 2-11
2.7 Summary of Problems _____________________________________________________________ 2-12
CHAPTER 3 - PROPOSED SOLUTIONS __________________________________________________ 3-1
3.1 Junction Control ___________________________________________________________________ 3-1
3.1.1 Flyover Option ___________________________________________________________________ 3-1
3.1.2 Signalization _____________________________________________________________________ 3-5
3.2 Traffic Management Measures _______________________________________________________ 3-8
3.2.1 Parking Control __________________________________________________________________ 3-9
3.2.2 Access Control ___________________________________________________________________ 3-9
3.2.3 Segregated pedestrian facilities _____________________________________________________ 3-9
3.2.4 Geometric improvements to the intersection _________________________________________ 3-10
3.2.5 Location and Design of bus stops and bus bays ________________________________________ 3-10
3.2.6 Re-routing of buses ______________________________________________________________ 3-10

Treatment of Junctions- Volume I: Final Report
ii | P a g e
Section B6: Boralesgamuwa
CHAPTER 4 - ECONOMIC ANALYSIS _____________________________________________________ 4-1
4.1 Costs _____________________________________________________________________________ 4-1
4.2 Benefits __________________________________________________________________________ 4-2
4.2.1 Traffic Analysis ___________________________________________________________________ 4-2
4.2.2 Economic Benefits ________________________________________________________________ 4-4
4.3 Cost-Benefit Analysis _______________________________________________________________ 4-8
4.3.1 Signalization Option ______________________________________________________________ 4-8
4.3.2 Flyover Option ___________________________________________________________________ 4-9
4.4 Non-Quantifiable Benefits __________________________________________________________ 4-10
CHAPTER 5 - CONCLUSIONS _____________________________________________________________ 5-1
CHAPTER 6 - RECOMMENDATION ______________________________________________________ 6-1

Treatment of Junctions- Volume I: Final Report
iii | P a g e
Section B6: Boralesgamuwa
List of Tables
Table 1-1: Details of Surveys Carried Out _____________________________________________ 1-6
Table 2-1: ADT (two days average) on Links __________________________________________ 2-1
Table 2-2: Peak Pedestrian Movements on Main Links ___________________________________ 2-5
Table 2-3: Two days hourly average speed of each turning of the roundabout _________________ 2-7
Table 2-4: Summary of Road Accidents in Study Area (Year 2007) _________________________ 2-7
Table 2-5: The cross sectional details of the road links in the study area. _____________________ 2-9
Table 2-6: Details of Three Wheeler Parking in the Study Area ___________________________ 2-10
Table 2-7: Details of the Important Land Use in the Study Area ___________________________ 2-11
Table 2-8: Existing Geometric Properties of the Approach Links of the Intersection ___________ 2-11
Table 3-1: Split of total vehicle turns at Boralesgamuwa Roundabout________________________ 3-1
Table 4-1: Comparative Cost Estimate of Options in 2008 prices ___________________________ 4-2
Table 4-2 : Comparison of Speed ‘Before and After’ ____________________________________ 4-3
Table 4-3: Economic Analysis for Signalization Option __________________________________ 4-5

Treatment of Junctions- Volume I: Final Report
iv | P a g e
Section B6: Boralesgamuwa
Table of Figures
Figure 1-1 : Study Area ____________________________________________________________ 1-2
Figure 1-2: Site map for the approximate length of the study area ___________________________ 1-3
Figure 1-3: Typical Road Conditions in the Study Area ___________________________________ 1-5
Figure 2-1 : Traffic Flow Diagrams (ADT by major vehicle groups)*Projected Traffic Data from
Traffic Survey of 2007 October _____________________________________________________ 2-2
Figure 2-2 : Special problems observed at site. _________________________________________ 2-3
Figure 2-3 : Hourly link flow of the intersection ________________________________________ 2-4
Figure 2-4 : Total daily pedestrian movement at Boralesgamuwa roundabout _________________ 2-5
Figure 2-5: Hourly Pedestrian flows across each road links at the intersection _________________ 2-6
Figure 2-6: Road Link Configuration of Boralesgamuwa Roundabout _______________________ 2-8
Figure 2-7: Three Wheeler Parking Locations in the Study Area ____________________________ 2-9
Figure 2-8: Locations of Important Land Use in the Study Area ___________________________ 2-10
Figure 2-9 : Proposed Lane Arrangement of the Intersection. _____________________________ 2-12
Figure 2-10: Longitudinal Section along B84 Road at the Roundabout ______________________ 2-12
Figure 3-1: Vertical Alignment of the flyover along Colombo-Horana Road (B084) ____________ 3-2
Figure 3-2: Horizontal Alignment of Flyover along B84 Road with existing Road Layout (Cantilever
Bridge). ________________________________________________________________________ 3-3
Figure 3-3: Horizontal Alignment of the Flyover along the Colombo Horana Road with a Straight
Segment. _______________________________________________________________________ 3-4
Figure 3-4: Road sections to be improved under signalization of the intersection. ______________ 3-6
Figure 3-5: Lane Arrangement of the Intersection for Signalization _________________________ 3-7
Figure 3-6: Signal Timing for Boralesgamuwa _________________________________________ 3-8
Figure 6-1: Map of Boralesgamuwa Study Area showing recommended improvements _________ 6-2

Treatment of Junctions- Volume I: Final Report
1-1 | P a g e
Section B6: Boralesgamuwa
CHAPTER 1 - INTRODUCTION
Boralesgamuwa Intersection is made by the crossing of the Colombo-Horana Road (B084) by the
Dehiwala- Maharagama Road (B094) at around the 12.5km distance from Colombo Fort. This
junction is an important suburban node for road transportation since:
• The north –south oriented Colombo-Horana Road (B084) is one of the primary
commuter traffic corridors to the city located between the Galle Road (A002) and High-
Level Road (A004) both of which are trunk roads connecting major provincial towns.
• The Dehiwala-Maharagama Road (B94) that crosses this junction at Boralesgamuwa is
one of the heavily used orbital road links in the East-West direction. This is located 6km
north of the Piliyandala Junction which is the next orbital road link and 3 kms north of
Kohuwela which has a similar connection.
• Its geographic location is just on the periphery of the Colombo Municipal and in a fast
developing suburban area.
• In addition to Colombo city it provides direct connections to three suburban centres in
the southern part of Colombo District. These being Piliyandala, Dehiwala and
Maharagama.
The intersection presently has a roundabout arrangement. This is a small roundabout with radius of
4.8 metres and has two lanes for each of its approaches for up to a short distance from the junction.
Beyond that all roads become two lane roads. The Colombo-Horana Road which carries the larger
traffic is a major commuter artery, with comparison to the Dehiwala-Maharagama Road. (B094)
However this major road has not been improved by any means for a long time but the Dehiwala-
Maharagama Road (B094) which is the orbital connector road has recently been completed with
asphalt surfacing. On the other hand the condition of the Colombo-Horana Road is very poor with
many potholes and uneven surfaces along the entire stretch of road from Horana to Havelock Town.
This situation is most sever in the immediate vicinity of the Boralesgamuwa junction particularly on
the section of road towards Piliyandala
The junction is also at the crest of a curve on the Colombo-Horana Road (B084). Each of the
approaches has around 200 metres of road frontage developed for commercial activities mostly in
terms of retail trade and services. In the case of the southern approach from Horana direction, this
length extends to about 300 metres. There is a moderate amount of activity associated with these
developments which attracts vehicular traffic as well as pedestrians. This causes an increase in the
intensity of road use around the junction with heavy demand for parking as well as for pedestrian
crossings which includes passengers transferring between buses.
The junction regularly gets congested during peak hours. The conflicts arising from the intersection of
the traffic flows and the activities arising from commercial developments are noticeable throughout

Treatment of Junctions- Volume I: Final Report
1-2 | P a g e
Section B6: Boralesgamuwa
the day culminating in large delays in the evening especially for traffic returning from Colombo. This
congestion increases during rainy weather conditions.
1.1 Study Area
The Scope of the study covered in this report is confined to examining the possible short term and
long term cost effective solutions to the traffic congestion which can be carried out by junction
improvement only. Hence the specified study area to be investigated would be confined to a very
small area extending around 500 to 600 meters from the centre of the junction.
There are no other junctions and
road links within this area. There
is one local road of some interest
to traffic management called
Aberatna Mw connected to the
Colombo- Horana Road (B084) at
a distance of around 200 metres
towards Piliyandala which
provides a connection by passing
the junction to the Dehiwala-
Maharagama Road (B094) on to
the Dehiwala link. This is a two
lane road but mainly serves as an
access road to residential areas.
This road link is not attractive
enough due to the capacity and the
poor highway geometry to serve as
a through road or as a by-pass road
to divert traffic movements
between the Piliyandala link and
the Dehiwala Link even if it is
improved in the future.
Figure 1-1 : Study Area
The buildings by the road side on all four road links within the study area do not exceed three floors
and typically signify the scale of development of a junction as opposed to a town centre. The most
important services available are confined to a supermarket, few banks, a police station, several retail
shops, hardware stores and small scale offices.

Treatment of Junctions- Volume I: Final Report
Section B6: Boralesgamuwa
The junction serves as an important
served by a bus route between Dehiwala and Maharagama in the east
routes in the north-south direction
Boralesgamuwa junction itself. Therefore no bus terminals or parkin
the study area at the moment.
However there are several three wheeler parks
junction. Apart from three wheeler parking, t
parking throughout the day. Parking
at any time of the day. A significant
small and medium trucks, delivery vans and h
parking. But parking can be seen
obstructing the pedestrian traffic flows.
There are no satisfactory pedestrian facilities alongside the roads
few metres of raised walkways with cu
parked vehicles.
The trace of the road and the commercial development
either side of the Boralesgamuwa roundabout
in the study area described earlier is given in
Figure 1-2: Site m
Volume I: Final Report
n important transit centre for bus passengers. The Boralesgamuwa junc
Dehiwala and Maharagama in the east-west direction and several
south direction. However there are no buses that originate from
junction itself. Therefore no bus terminals or parking for buses are required within
three wheeler parks at the junction itself and along the approaches
Apart from three wheeler parking, the study area has a significant demand for on
Parking on both sides of the road on all four approach roads
A significant fraction of these parked vehicles are commercial vehicles such as
small and medium trucks, delivery vans and hand tractors. There are no marked stalls for on
parking. But parking can be seen on the paved shoulders and on raised walkways everywhere
flows. There is no parking control implemented in the study area.
There are no satisfactory pedestrian facilities alongside the roads within the study area
metres of raised walkways with curbs, but they are un-paved. These also are usually occupied
mercial development along the Colombo- Horana Road (
Boralesgamuwa roundabout is shown in Figure 1.1. The condition of road and traffic
is given in Figure 1.2.
map for the approximate length of the study area
1-3 | P a g e
The Boralesgamuwa junction is
west direction and several
originate from the
required within
approaches to the
he study area has a significant demand for on street
approach roads can be seen
commercial vehicles such as
stalls for on-street
paved shoulders and on raised walkways everywhere
implemented in the study area.
within the study area. There are a
also are usually occupied by
Horana Road (B084) on
ondition of road and traffic

Treatment of Junctions- Volume I: Final Report
1-4 | P a g e
Section B6: Boralesgamuwa
Boralesgamuwa Roundabout
New Surfacing on Dehiwala –Maharagama Rd
Right-of-Way width on Horana-Colombo Rd (towards
Piliyandala)
Lack of Walkway Facilities
Inadequate and Unattractive Walkways (Horana Rd)
Pedestrian Crossing Near Police Station (Horana Rd)
Treatment of Junctions- Volume I: Final Report
Section B6: Boralesgamuwa
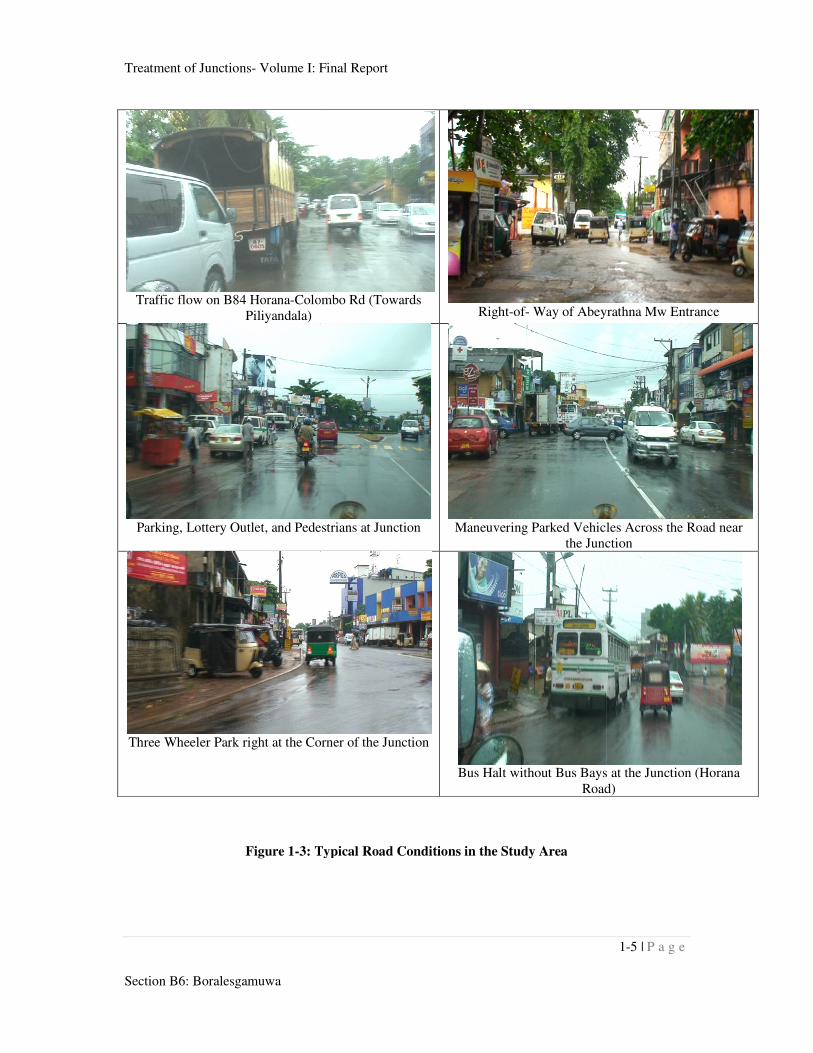
Figure 1-3: Typical Road Conditions in
Traffic flow on B84 Horana-Colombo Rd
Piliyandala)
Parking, Lottery Outlet, and Pedestrians at Junction
Three Wheeler Park right at the Corner of the Junction
Volume I: Final Report
: Typical Road Conditions in the Study Area
Colombo Rd (Towards
Right-of- Way of Abey
Parking, Lottery Outlet, and Pedestrians at Junction Maneuvering Parked Vehicles Across the Road near
the Junction
Three Wheeler Park right at the Corner of the Junction
Bus Halt without Bus Bays at the Junction (Horana
Road)
1-5 | P a g e
yrathna Mw Entrance
Parked Vehicles Across the Road near
the Junction
Bus Halt without Bus Bays at the Junction (Horana
Road)

Treatment of Junctions- Volume I: Final Report
1-6 | P a g e
Section B6: Boralesgamuwa
1.2 Scope
The scope of work reported herein as agreed upon with the Road Development Authority, include the
following:
• Analysis of Turning Movement Counts, Pedestrian Counts, Traffic Delay Counts or a full
traffic survey of the local area as the case may be, in order to obtain a clear picture of the
cause of the traffic congestion and to identify the remedies.
• Comprehensive analysis of traffic patterns including movement of pedestrians, parking,bus
circulating, in and out movements of bus stands and bus halting.
• Analysis of traffic accidents at such junctions.
• Consider the influence of other problems such as heavy inflows, out flows of traffic from and
to adjacent by-roads, misuse of road space etc.
• Identify the problems in the existing set up such as erroneous road markings, signs, signal
lights with faulty phases, lack of capacity for turning circles, inadequate lane widths etc.
• Calculation of benefits for technically feasible alternatives.
• Calculation of economic benefits for the above alternatives
• Based on above, recommend suitable solutions for each location which will include, solutions
such as new or improvements to signals, roundabouts, flyovers, over passes, traffic
management schemes, etc.
• If over passes/ flyovers required conceptual design of them with appropriate dimensions,
required legs etc.
• Report on the impact on Urban architecture
1.3 Data Collection
The Table 1-1 shows the details of the survey locations and type of surveys carried out pertaining to
this study. Surveys were carried out using a pool of 20 university students who were specifically
trained and worked in groups under an experienced survey supervisor. The details of how the surveys
were carried out are given in the Appendix.
Table 1-1: Details of Surveys Carried Out
Survey Date Locations
Travel Time Survey 5th & 11th October 2007 200 m from the junction
Turning Movement Counts (Classified) 16 Oct 2007 TM8 : Boralesgamuwa Junction
Pedestrian Counts 15 Oct 2007 200 m from the junction
Turning Movement Counts (Total) 21 Aug 2008 TM8 : Boralesgamuwa Junction

Treatment of Junctions- Volume I: Final Report
2-1 | P a g e
Section B6: Boralesgamuwa
CHAPTER 2 - TRAFFIC ANALYSIS
2.1 Turning Movement Counts
The results of the turning movement counts which show the movements by each vehicle type at the
Boralesgamuwa intersection is given in the Appendix. The tables and graphs given there are shown in
the following forms:
• Hourly total of all vehicle types for each approach and ADT for each approach
• Graph showing the variation of flow by each vehicle type for each approach
• Graph showing the variation of flows by each approach for all vehicle types
The summary of the traffic flows estimated from two days average of 2007 data in each approach of
the intersection are given in the following Table. It can be seen that there are over 53,000 vehicle
movements per day at the Boralesgamuwa intersection. Of this the passenger vehicle flows make up
over 85% of the intersection traffic flow.
Table 2-1: ADT (two days average) on Links1
Junction
Road ADT
Passenger
Vehicles
Buses Goods
Vehicles
Non
Motorized
Total
(including other
vehicle types)
B084 :
Horana Road
(A) 27,045 1,765 2,916 77 32,201
B094 :
Maharagama
Road (B) 15,201 769 1,644 56 17,957
B084 :
Horana Road
(C) 28,613 1,812 3,375 99 34,367
B094 :
Maharagama
Road (D) 19,321 816 2,179 58 22,794
The following Figures show the ADT for each vehicle type in the study area as well as the total ADT
by link of the road network
As per the traffic survey conducted in this year, the ADT on Colombo-Horana Road (B084) is above
36,000 vehicles per day. The maximum flow of 36,614 vehicles per day occurs on the Piliyandala
Link. On the Colombo Link the maximum is 32,620 vehicles per day. Maximum flow on the
Maharagama link (B094) is 21,031 per day. The lowest ADT is on the Dehiwala Link.
1 Estimated from 2007 Traffic Data

Treatment of Junctions- Volume I: Final Report
2-2 | P a g e
Section B6: Boralesgamuwa
Maximum peak traffic flow has been recorded in the evening is 5,350 vehicles per hour at the
junction. Maximum peak flow on the Piliyandala Link is 4,105 vehicles per hour which is the highest
hourly link flow at the junction. This seems to be a congested flow condition when comparing the
road capacity of an undivided two lane road which should be taken as around 2,800 vehicles per hour.
A: *ADT of Passenger Vehicle Flows at the
Roundabout
B: *ADT of Non-Motorized Vehicle Flows at the
Roundabout
C: *ADT of Bus Flows at the Roundabout
D: *ADT of Goods Vehicle Flows at the
Roundabout
E: *ADT of Total Flows at the Roundabout
(2007)
F: ADT of Total Flows at the Roundabout
(2008)
Figure 2-1 : Traffic Flow Diagrams (ADT by major vehicle groups)*Projected Traffic Data from
Traffic Survey of 2007 October

Treatment of Junctions- Volume I: Final Report
Section B6: Boralesgamuwa
There are 2.580 buses travelling across
the roundabout. This is a very insignificant number comp
There are 5,057 goods vehicle movements
traffic flow.
2.2 Link Movements
2.2.1 Colombo-Horana Road
The Colombo-Horana Road (B084) handles between 3,000 to 4,
during the am peak, while during the pm peak this increases to between 3,500 to 4,500 vehicles per
hour. Most of the congestion on the
over a length of around 500m to 700m. This area has a high density of commercial activities, and
hence many ad hoc parking activities takes place
hand tractors, uneven roof and plinth projections of temporary shops and workshops,
unpaved and uneven shoulders, corrugated road surface etc also contributes to reduc
capacity in this section. Some of the issues leading to
Horana Road are illustrated in Figure
Row of Hand Tractors Park on the
periods of time
Lottery Selling Point on the sidewalk and
pedestrians using carriageway
Figure 2
Volume I: Final Report
across this roundabout per day. Only 141 bicycle trips are found at
the roundabout. This is a very insignificant number compared to other town areas such as at
movements recorded at the junction. This is around 9% of the total
Horana Road
84) handles between 3,000 to 4,000 (Figure 2.2) vehicles per hour
during the am peak, while during the pm peak this increases to between 3,500 to 4,500 vehicles per
hour. Most of the congestion on the Dehiwala-Maharagama Road takes place on the Piliyandala link
0m to 700m. This area has a high density of commercial activities, and
hoc parking activities takes place alongside the road. The slow moving vehicles like
hand tractors, uneven roof and plinth projections of temporary shops and workshops,
unpaved and uneven shoulders, corrugated road surface etc also contributes to reduc
Some of the issues leading to the reduction in road capacity on Colombo
Horana Road are illustrated in Figure 2.2.
the treet for long Parking at Opposite Direction, Open Drains
reducing available capacity
Lottery Selling Point on the sidewalk and
pedestrians using carriageway Lack of Pedestrian Facilities resulting
pedestrian activity on the carriageway
2-2 : Special problems observed at site.
2-3 | P a g e
Only 141 bicycle trips are found at
other town areas such as at Panadura.
This is around 9% of the total
.2) vehicles per hour
during the am peak, while during the pm peak this increases to between 3,500 to 4,500 vehicles per
takes place on the Piliyandala link
0m to 700m. This area has a high density of commercial activities, and
The slow moving vehicles like
hand tractors, uneven roof and plinth projections of temporary shops and workshops, open drains,
unpaved and uneven shoulders, corrugated road surface etc also contributes to reducing the road
road capacity on Colombo –
Parking at Opposite Direction, Open Drains
reducing available capacity
Lack of Pedestrian Facilities resulting in much
pedestrian activity on the carriageway

Treatment of Junctions- Volume I: Final Report
2-4 | P a g e
Section B6: Boralesgamuwa
2.2.2 Dehiwala-Maharagama Road
It is observed that the commercial land use density along the Dehiwala-Maharagama Road (B094) is
much higher than the Colombo-Horana Road. A number of new high rise commercial buildings have
been built after the recent improvement of the road. Generally no raised and kerbed walkways are
provided on this road except for a short distance in front of the market side on the Maharagama Link.
This too is occupied by three wheelers and other vehicle parking. The Dehiwala-Maharagama Road
carries a maximum of 2,000 vehicles per hour at peak hours (Figure 2.3). This vehicular flow can be
easily handled with the four lane road configuration available on the Dehiwala-Maharagama Road
close to the junction. However, often the moving traffic is obstructed by parked vehicles, vehicle
maneuvering in and out of commercial establishments, pedestrians on the carriageway, etc. Therefore,
the solutions are needed to minimize such events by means of traffic management measures within the
existing infrastructure.
Figure 2-3 : Hourly link flow of the intersection
2.3 Pedestrian Movements
Pedestrian counts were conducted at four locations namely as shown in Table 3.3. Counts were done
at pedestrian crossings on the road within the area chosen for 12 hours. The summary of the
pedestrian analysis is given in the Appendix.
There are around 25,000 pedestrian crossings at the Boralesgamuwa Roundabout. Total crossings on
the Dehiwala-Maharagama Road are 13,750 pedestrians while on the Colombo-Horana road are
11,310 pedestrians. Maximum pedestrian flow takes place across the Maharagama Link at 5.30pm to
6.30pm which is around 700 pedestrians per hour (Figure 2-4).
0
500
1000
1500
2000
2500
3000
3500
4000
4500
6.30 7.30 8.30 9.30 10.30 11.30 12.30 13.30 14.30 15.30 16.30 17.30 18.30
Ho
url
y T
raff
ic F
low
Time
Hourly traffic flow on each road links of the intersection
B84 Road (Colombo Link)
B94 Road (Maharagama Link)
B84 Road (Piliyandala Link)
B94 Road (Dehiwala Link)

Treatment of Junctions- Volume I: Final Report
2-5 | P a g e
Section B6: Boralesgamuwa
Figure 2-4 : Total daily pedestrian movement at Boralesgamuwa roundabout
The Average Number of Pedestrians per hour crossing the road at those locations is summarized in
Table 2.2. The pedestrian demand for crossing the road seems to be somewhat constant ranging from
400 to 600 per hour with the highest flows observed on the Maharagama Link. However, these are
the pedestrian counts close to the marked pedestrian crossings and the total crossings within the study
area would be more than this.
According to these data, the average maximum flow rate of pedestrian crossings in one direction will
be 6-7 persons per minute. This could be easily handled with any phase arrangement of a signalized
intersection.
The bus stops in each direction of all road links are located after passing the intersection. Therefore,
bus passengers who are transferring from one direction to the other have to cross a road at least once.
It could be seen that both the vehicular peak and the pedestrian peak and the flow pattern during the
day is very similar (Figure 2-4 and Figure 2-5). This has aggravated the traffic congestion especially
during the peak periods at the intersection. There are above 10,600 vehicle movements and 2200
pedestrian crossings take place at the intersection during the evening peak hour. These figures are
10,200 and 1700 during the morning peak hour. Therefore, both vehicles and pedestrian movements
have to be considered for traffic management at the intersection.
Table 2-2: Peak Pedestrian Movements on Main Links
Location Maximum Hour Flow Time
Piliyandala link 419 5.30 – 6.30pm
Dehiwala Link 507 4.30 – 5.30pm
Kohuwela Link 623 4.30 – 5.30pm
Maharagama Link 727 5.30 – 6.30pm

Treatment of Junctions- Volume I: Final Report
2-6 | P a g e
Section B6: Boralesgamuwa
Figure 2-5: Hourly Pedestrian flows across each road links at the intersection
2.4 Speed and delay
The average speed at the roundabout is found to be 20km per hour according to two days average
travel time surveys (Table 2-3). This average is taken from 410 number of travel data obtained over
600m length covering all the turnings at the roundabout. The variation of speed shows that the
Piliyandala and Kohuwela approaches have the lowest speed. This varies between 8 to 25 km per hour
with right turns from Piliyandala approach to Maharagama in the am peak and through movements
from Kohuwela approach to Piliyandala in the pm peak also registering below 10 km per hour. The
speed variation on the Dehiwala-Maharagama road is between 14 km per hour to 28 km per hour. The
Kohuwela to Piliyandala approach has the largest variation ranging between 8 km per hour to 25 km
per hour, while right turns from Piliyandala to Maharagama has the lowest average ranging between 7
km per hour to 11 km per hour which also records the minimum average speed of 9km/hr. This
movement involves some congestion in Piliyandala link as well as the obstructions from the bus stop
towards Maharagama. The overall average vehicle speed is estimated at 24 km per hour.
0
100
200
300
400
500
600
700
6.3
0
7.3
0
8.3
0
9.3
0
10.3
0
11.3
0
12.3
0
13.3
0
14.3
0
15.3
0
16.3
0
17.3
0
To
tal P
ed
es
tria
n C
ros
sin
gs
Time
Total Hourly Distribution of Pedestrian Volumes By Links
Pliyandala Dehiwela Kohuwala Maharagama

Treatment of Junctions- Volume I: Final Report
2-7 | P a g e
Section B6: Boralesgamuwa
Table 2-3: Two days hourly average speed of each turning of the roundabout
2.5 Accident Studies
The accident statistics recorded by the Police for this study area for the year 2007 is given in Table 2-
4. It can be seen that there are around 7 fatal accidents and 19 grievous injury accidents per year at
this junction.
Table 2-4: Summary of Road Accidents in Study Area (Year 2007)
No
Road Section Accident Type
Total Road Name
From Where to
Where Length Fatal Grievous Light
Injuries
Property Damage
Only
1 B094 : To Maharagama
Within 300m of Junction
300 m 2 4 5 5 16
2 B094 : To Dehiwala
Within 300m of Junction
300 m 1 3 2 1 7
3 B084: To Piliyandala
Within 300m of Junction
300 m 1 6 8 4 19
4 B084 : To Kohuwala
Within 300m of Junction
300 m 3 4 9 4 20
5 In Junction 2 4 1 7
Total 7 19 28 15 69
Right Through Left Right Through Left Right Through Left Right Through Left
1 2 3 4 5 6 7 8 9 10 11 12
6.30 7 16 18 16 16 23 15 23 23 21 19 20
7.30 9 17 13 23 18 20 18 25 25 24 23 13
8.30 9 19 23 19 26 23 21 23 23 24 25 20
9.30 9 21 22 22 18 25 24 23 24 21 26 20
10.30 8 19 19 23 22 25 24 23 21 24 25 20
11.30 9 17 18 18 26 28 23 22 26 25 23 22
12.30 10 17 19 20 26 27 24 18 27 23 19 23
13.30 11 23 21 22 24 24 19 14 23 20 25 23
14.30 11 20 22 25 25 25 24 20 25 20 24 22
15.30 10 18 19 22 22 26 21 24 26 22 25 25
16.30 8 26 23 19 24 25 27 20 24 17 23 22
17.30 11 19 23 14 14 16 11 8 26 15 20 18
Minimum 7 16 13 14 14 16 11 8 21 15 19 13
Maximum 11 26 23 25 26 28 27 25 27 25 26 25
Avarege 9 19 20 20 22 24 21 20 24 21 23 21
Time
From
Average Speed (km/h) Over a Length of 600meters From the Direction of :
Piliyandala Dehiwala Kohuwala Maharagama

Treatment of Junctions- Volume I: Final Report
2-8 | P a g e
Section B6: Boralesgamuwa
2.6 Road Infrastructure
The road infrastructure within the study area is mainly the Colombo Horana Road and Dehiwala-
Maharagama Road. Abeyrathna Mawatha is one of the roads serving the residential areas from the
Horana Road and which also connects to the Dehiwala Road away from the junction. This road is
incapable as a bypass road in avoiding the junction, due to its capacity and length. There are no other
important roads falling within the study area.
At present, the Colombo–Horana Road (B84) carries an ADT of around 36,000 vehicles. It has 4 lanes
close to the junction at a length of around 100-200 meters to both sides from the junction. Beyond this
it has only two lanes for both directions of traffic. The ADT of around 21,000 vehicles carries on
Dehiwala – Maharagama Road (B94). It has two lanes undivided lane configuration throughout the
entire road lengths. Aberathna Mawtha is having two way single lane capacities and it has a right of
way of around 9.5 meters from wall to wall. Road link configuration of Boralesgamuwa roundabout is
given is Figure 2.3. The cross sectional dimensions of all road links approximately 60 meters away
from the junction (shown in Figure 2.6) is given in Table 2.5.
Figure 2-6: Road Link Configuration of Boralesgamuwa Roundabout

Treatment of Junctions- Volume I: Final Report
2-9 | P a g e
Section B6: Boralesgamuwa
Table 2-5: The cross sectional details of the road links in the study area.
All main road links at Boralesgamuwa have raised walkways which are not paved at the moment.
Therefore the surface is not even and pedestrians are often reluctant to use them. These walkways are
approximately 3m wide and occupied by parked three wheelers and motor bicycles. Pedestrian
crossings are available and marked across all four links in close proximity to the junction. There is
good use of these crossings as they are marked close to the junction.
Figure 2-7: Three Wheeler Parking Locations in the Study Area
The demand for parking of private vehicles and commercial vehicles could also be seen on either side
of the road very close to the junction. There are around 6 different three wheeler parks available
within a 200 meter radius on each of the links. These have a total capacity of over 100 stalls. All these
parking lots are however located on the pedestrian walkways. This causes pedestrians to use the road
way thus causing traffic congestion. The locations of these three wheeler parks are shown in Figure 2-
7. The number of parking slots in each of the respective parks is given in Table 2-6.
LaneWalkway/
ShoulderDrain
Gap to
Building
Edge
Total
(Wall to
Wall)
1 Colombo - Horana Road (Piliyandala Link) A-A 4 3.95 3 0.6 3.0 29.0
2 Colombo - Horana Road (Kohuwala Link) B-B 4 3.45 4 0.6 8.0 39.0
3 Dehiwala - Maharagama Road (Dehiwala Link) C-C 2 4.90 3 0.6 2.8 22.6
4 Dehiwala - Maharagama Road (Maharagama Link) D-D 2 5.60 3 0.6 1.5 21.4
Width of Road Sectional Elements (m)
Road Name and SectionItem
No
Map
Reference
No
#
Lanes

Treatment of Junctions- Volume I: Final Report
2-10 | P a g e
Section B6: Boralesgamuwa
Table 2-6: Details of Three Wheeler Parking in the Study Area
The location of important traffic attracting land use in the study area is shown in Figure 2-8. These are
given in Table 2-8. It can be seen that all these traffic attractors have main road frontages and are also
located very close to the junction. Also it is observed that the onsite parking provided is inadequate
for all these locations when compared to the demand for parking except at the Arpico Shopping
Centre (Table 2-7). Therefore, the additional parking at each of these traffic attractors always use the
left lane of the carriageway or walkways reducing important lane space close to the junction.
Figure 2-8: Locations of Important Land Use in the Study Area
1 Horana Road Link 1 60 28
2 Maharagama Road Link 2 25 15
3 Maharagama Road Link 3 20 32
4 Dehiwala Link 5 35 19
5 Horana Road Link 6 195 10
Total 104
Road Name and SectionItem
No
Map
Reference
No
Distance to Junction Centre (m) # Parking Lots

Treatment of Junctions- Volume I: Final Report
2-11 | P a g e
Section B6: Boralesgamuwa
Table 2-7: Details of the Important Land Use in the Study Area
2.6.1 Highway Geometry of the Study Area
Boralesgamuwa junction is an obliquely set out junction when considering the orientation of the four
approach links. The approach radius of the curvatures of each link is given in Table 2-8. According to
these values, it is required to have all such approaches to be super elevated even to maintain a speed
of 40 km/hr when approaching the junction. However since this is an intersection, the above criterion
is not applicable as speeds are expected to be reduced at the roundabout. The junction center has the
highest elevation in the longitudinal section of the Colombo-Horana Road in the study area and both
approaches climbs to this crest at a 3% gradient (Figure 2-10).
Table 2-8: Existing Geometric Properties of the Approach Links of the Intersection
1 Seylan Bank Horana Road Link 1 40 2
2 Cargills Super Market -Do- 2 30 2
3 Police Station Colombo Link 3 45 -
4 Laughs Super Market -Do- 4 105 10
5 Public Market Maharagama Road Link 5 20 -
6 People's bank -Do- 6 130 -
7 National Savings Bank (NSB) -Do- 7 130 -
8 Arpico Super Market -Do- 8 120 60
9 Hatton National Bank (HNB) -Do- 9 120 6
10 Sri Lanka Telecom (SLT) Horana Road Link 10 200 -
11 80
Land Use and Name
Total
Item No Road Name and SectionMap
Reference
No
Distance to
Junction
Centre (m)
Approximate #
Parking Lots
Available
1 Horana Link 200 40
2 Colombo Link 180 80
3 Dehiwala Link 120 30
4 Maharagama Link 80 40
Approximate Curve
Length (m)
Angle of Deviation at
intersection
10°
18°
Item
No
Approach Road Section to
Junction
Approach Radius of
Curvature (m)

Treatment of Junctions- Volume I: Final Report
2-12 | P a g e
Section B6: Boralesgamuwa
Figure 2-9 : Proposed Lane Arrangement of the Intersection.
Figure 2-10: Longitudinal Section along B84 Road at the Roundabout
2.7 Summary of Problems
The following is a summary of problems identified in this section:

Treatment of Junctions- Volume I: Final Report
2-13 | P a g e
Section B6: Boralesgamuwa
• The junction has both a horizontal and vertical curvature.
• There are no sidewalks on most of the approaches to the junction.
• Some sections where there are sidewalks there are trade stall and kiosks obstructing the
movement of pedestrians.
• Pedestrians mostly use either the unpaved shoulder weaving in between parked vehicles and
kiosks or the road carriageway.
• There are over 100 dedicated three wheeler parking stalls in 6 parking lots located within the
200 metres distance from the junction which are located in a manner where they obstruct
pedestrian walkways.
• The overall average speed through the Boralesgamuwa town and passing the junction is 24
km per hour. The Piliyandala approach and Kohuwela approach in the am and pm peak
register unacceptable speeds of less than 10 km per hour. The right turns from Piliyandala to
Maharagama are also mostly less than 10 km per hour throughout the day.
• The road right of way widths vary for each approach. In the case of the Dehiwala –
Maharagama road, it is between 21 to 23 metres and has 3 lane width which function as a two
lane highway with parking on both sides. In the case of the Piliyandala approach the width is
29 metres, but still provides for 3 lanes with broad shoulders which accommodate parking as
well as temporary structures at intermittent places. The widest approach is the Kohuwela
approach which has 39 metres right of way which has 4 lanes and space for parking.
• The ADT of the Colombo-Horana Road (B084) is around 35,000 while that of Dehiwala –
Maharagama Road ( B094) is around 29,000.
• There are around 25,000 pedestrian movements across the junction during the day. The
average flow rate is around 2,000 per hour with the highest across the Dehiwala and
Maharagama approaches. Most of these pedestrian crossings especially in the peak periods
are from transfer of bus passengers between Route 119 (Dehiwala-Maharagama) and buses on
the Colombo-Horana Road. The bus stops are located in the far-side so that pedestrian
crossings are maximized in transfers.
• The am peak hour load at the junction is 10,200 vehicle movements and 1700 pedestrian
movements. The pm peak load is 10,600 vehicle movements and 2200 pedestrian movements.
• There are 7 fatal accidents recorded for year 2007 at the Boralesgamuwa junction. Total
accidents recorded are 69. The major conflicts have arisen as a result of pedestrian and

Treatment of Junctions- Volume I: Final Report
2-14 | P a g e
Section B6: Boralesgamuwa
vehicle conflict. Hence this should be a major concern as 7 fatal accidents for a junction of
this nature has to be considered excessive when compared to other junctions being studied.
• The major problem at this junction is the lack of traffic management of the approaches. This
results in loss of road capacity as well as in increasing of road accidents.

Treatment of Junctions- Volume I: Final Report
3-1 | P a g e
Section B6: Boralesgamuwa
CHAPTER 3 - PROPOSED SOLUTIONS
The following interventions are required for the problems identified in the earlier chapter.
• Junction Control
• Access Control close to the junction
• On Street Parking controls
• Provision of segregated pedestrian facilities
• Geometric improvement to the intersection
• Design and allocation for bus stop and bus bays
• Re routing of buses
3.1 Junction Control
There is a proposal to consider a flyover at the junction. The alternative to this would be signalization
of the junction since roundabout capacity will be inadequate.
The total ADT of the Boralesgamuwa roundabout is above 53,000 at the moment. The growth rate of
traffic at this roundabout from last year to this year is 6.7%. This is generally a high growth rate.
Since a roundabout is a viable solution when there is a higher fraction of right turns, the present
junction management with a roundabout does not seem to be a suitable solution, when through
movements dominate due to the new improvements of the B084 and B094 roads (Table 3-1).
Table 3-1: Split of total vehicle turns at Boralesgamuwa Roundabout
3.1.1 Flyover Option
A flyover option of the Colombo Horana road above the Dehiwala- Maharagama road will facilitate
improved through movement for around 26,821 motorized vehicles on the Colombo-Horana Road.
Since there are 1,660 bus movements on the Colombo-Horana road, the total flyover users will be
25,160 motorized vehicles. The total motorized through traffic on the Dehiwala Maharagama road is
around 11,000 vehicles. Therefore, according to the traffic level, a flyover along the Colombo Horana
road will be more feasible than on the Dehiwala Maharagama road. With a 12% peak period demand,
the flyover should be able to provide a capacity of 3,020 vehicles per hour. Thus a 2-lane flyover with
an observed peak period directional split of 55/45 will require a peak period peak direction capacity of
1,660 vehicles per hour. If the flyover is designed as a two lane undivided road with 4-5% grade, the
2007 2008
Left 20 14
Through 63 71
Right 17 15
% Total Turning Movement Turn

Treatment of Junctions- Volume I: Final Report
3-2 | P a g e
Section B6: Boralesgamuwa
capacity available will be around 2,000 vehicles per hour. This will clearly be inadequate and delays
will occur due to queuing of vehicles. Moreover, slow moving vehicles climbing the flyover will be
very slow. This will cause queuing to take place behind such vehicles. With a 55/45 observed spilt
during peak period, this will become very severe due to the lack of passing opportunities as opposing
flow will also be high. Thus a 4 lane flyover will be required to adequately address the capacity issue.
Since the nature of existing vertical alignment of the Colombo Horana Road is such that it has the
crest of a vertical curve at the roundabout itself the flyover length has to be increased from a
minimum (280m) to 475m as shown in Figure 3-1. This length is calculated according to the gradient
of both approaches shown in same figure.
Figure 3-1: Vertical Alignment of the flyover along Colombo-Horana Road (B084)
3.1.1.1 Flyover Option 1- Concrete Only
There are two options available for flyover construction based on the method and material used for
the construction. Since the Colombo- Horana Road selected in the study area has some curvatures in
its horizontal alignment along the centre line, the same alignment could be followed by the flyover in
order to reduce the damage to the buildings and to cause minimum acquisition. This option is shown
in Figure 3-2. The flyover length will be 475 meters and the effective length including the horizontal
approach length, will be around 600 meters. However, in this case the flyover should be constructed
as a concrete structure (as Ragama Concrete Flyover) to obtain the required curvature.
Since this can be constructed as a cantilever concrete structure with single pier at the centre,
acquisition in between the road section of the two ramps are not involved as the access roads can be
accommodated under the bridge. Therefore there will not be considerable damage to the buildings
besides the existing Colombo Horana Road. Also since the construction of piers is confined to the

Treatment of Junctions- Volume I: Final Report
3-3 | P a g e
Section B6: Boralesgamuwa
road centre, traffic during the construction is minimal. Therefore these are very significant advantages
over steel flyovers which need wider concrete foundations projecting 1.5m height above the road
surface (Kelaniya Steel Flyover).
Figure 3-2: Horizontal Alignment of Flyover along B84 Road with existing Road Layout
(Cantilever Bridge).
3.1.1.2 Flyover Option 2 – Steel
Generally the steel flyovers are difficult to construct as they use pre- cast sections and curves are
difficult to provide for. Hence a possible horizontal layout of a straight flyover across the junction is
shown in Figure 3-3. The acquisition of land and demolition of buildings has alternatively shifted
from one side to the other side along the length of the flyover as shown in this figure.

Treatment of Junctions- Volume I: Final Report
3-4 | P a g e
Section B6: Boralesgamuwa
Figure 3-3: Horizontal Alignment of the Flyover along the Colombo Horana Road with a
Straight Segment.
Since both options for flyovers have to be span long distances (475m) due to the increased vertical
displacement required the cost of the construction will be very high. Furthermore a 4 lane flyover will
require a width of around 18 metres therefore the resulting acquisition will be quite severe with the
road width required at the base of the flyover having to have a right of way width of at least 34
metres. This means that in the Piliyandala approach around 5 metres width has to be acquired.
Acquisition from the Kohuwela approach will be less.
A distinct advantage of having a flyover would be the creation of space under the bridge. While
unused space would be a problem, development for commercial purposes would also create additional
traffic issues. The most suitable use of this space would be for parking of vehicles. On a 475 m length
of flyover it is possible to accommodate parking for around 100 vehicles. However the type of bridge
and the type of design utilized has to be given due consideration to facilitate this. If columns are
located on the extremes as opposed to the centre then the remaining lane will be constrained and some
acquisition may be necessary to ensure that at least 2 lanes of traffic run right through on the ground.
Moreover if the horizontal structural elements are placed at the bottom of the bridge as in the case of a
steel structure, then they will obstruct the through movements. If a steel bridge is constructed like at
Kelaniya, the space under the bridge will become marginalized space and become useful for small
shops and informal traders thus reducing the mobility for turning traffic. This may be addressed by
considering a concrete bridge which can be designed with adequate clearance for parking of vehicles
and for turning movements of the traffic at grade under the bridge.

Treatment of Junctions- Volume I: Final Report
3-5 | P a g e
Section B6: Boralesgamuwa
3.1.1.3 Impact of Flyover on Urban Landscape
Boralesgamuwa is a significant urban node on the way to the south of Colombo. It is the last such
node that occurs in quick succession on the Colombo-Horana road. Hence, today this has become a
passer-by urban space rather than a node. Boralesgamuwa is also a busy place where many people
transit, shop, and use as their town centre. However, due to heavy unplanned traffic the container
quality of this urban space has deteriorated. Therefore, any effort to ease out the traffic shall
strengthen the livability of the town centre.
This urban centre does not have any particular significant urban character but the majority of land
utilization is for mid-scale commercial purposes The most notable physical character is the slight
climb on both the roads where they meet, therefore the roundabout is at a higher level. This existing
character could be responded by new constructions, thus rebuilding the urban centre as a true urban
space which would facilitate life.
In easing out the traffic, the authorities will have to take necessary steps to scale down the domination
of the traffic artillery and allow the domination of public space. By scaling down the dominance of
the roads, one can support urban life, thus turning Boralesgamuwa into a typical mid-scale town
centre. There shall be more spaces for citizens and those who transit, so that they will respond to the
urban spaces more positively. Those who cross the city centre would also enjoy the strengthened
urban images. These steps shall empty through traffic as quickly as possible, without hindering the
accessibility to urban spaces and buildings.
We do not consider a flyover as a socially-viable and architecturally-suitable solution for many
reasons. This heavy bulky structure will further strengthen the dominance of traffic, completely
ignoring the humane quality of the urban space. The above mentioned climb of the roads means the
flyover will have be rather high, thus over-stating its presence. This one-sided engineering solution
will further deteriorate the use of urban space by its citizens. The flyover will also dissect the city into
two major sections thus completely diluting the container quality of the city and degrading into a
leftover ghetto like space. The passer-by nature of Boralesgamuwa will further be reinforced, and the
city centre would face a gradual extinction. The sprawl will also continue thus stretching the traffic
congestion further down the two roads. The citizens, having lost accessibility to their urban spaces,
will lose the connection to their living city.
Also there will be a large extent of unused land under the flyover due to this long span. Also due to
this long length, the entire town area will be separated and the service road network may not be
attractive enough to through travel users even though they really need to stop at this town center for a
service. There may be an effect on the local economy since the town centre is confined to the entire
length of the proposed flyover.
3.1.2 Signalization
Signalization of the existing roundabout is also a possible option. The percentage of right and left
turning movements at Boralesgamuwa is generally in equal proportion to each other in all approaches

Treatment of Junctions- Volume I: Final Report
3-6 | P a g e
Section B6: Boralesgamuwa
with the major flow in the through direction. Therefore signalization is a favorable option as a short
and medium term solution for the congestion here.
Figure 3-4: Road sections to be improved under signalization of the intersection.
The lane arrangement for signalization of Boralesgamuwa intersection is shown in Figure 3-5. In
order to provide adequate capacity for at least 10 years, the design capacity should be considered as
95,000 ADT. Accordingly the requirement would be for 6 lanes on the Colombo-Horana Road and 4
Lanes on the Dehiwala-Maharagama Road at the intersection. All links should be divided with a 1.5m
wide center median in order to prevent crossings and “U Turns” close to the intersection. Separate
Left lane filter should be provided from the Piliyandala Link to the Dehiwala Link and form the
Dehiwala Link to the Colombo Link. This can be provided with the space presently available.

Treatment of Junctions- Volume I: Final Report
3-7 | P a g e
Section B6: Boralesgamuwa
Figure 3-5: Lane Arrangement of the Intersection for Signalization
3.1.2.1 Phase arrangement of the signal design
Left turns from Piliyandala and Dehiwala approaches at the proposed signalized intersection are
provided with a separate turning lane. Separate right turns are provided from the Colombo Horana
Road. Right turns are shared with through movements at the two approaches of the Dehiwala
Maharagama Road. However the discharge capacity can be made available with the three phase
arrangement without much difficulty. The signal design will be successful for a 3 phase arrangement
and the signal timings were calculated for the above lane arrangement. The cycle time of the phase
arrangement could be kept as 90 seconds most of the time of the day. It could be kept at even 60
seconds at off peak periods (10.00 am – 1.00pm and 3.00pm – 4.30pm). However it reaches 180
seconds during the two peak periods. The intersection delay with this arrangement is estimated as
1,362,115 vehicle seconds (378 vehicle hours) during the 12 hour traffic period of a working day.
Therefore this delay should be compared with the existing delay due to various activities of
obstructions close to the intersection.

Treatment of Junctions- Volume I: Final Report
3-8 | P a g e
Section B6: Boralesgamuwa
Figure 3-6: Signal Timing for Boralesgamuwa
3.2 Traffic Management Measures
The signalization of the intersection also requires parallel improvements to some of the supporting
infrastructure such as parking control and management, pedestrian control, bus parking and bus
routing through the junction. If such facilities are also provided together with signalization, the
benefits will be maximized since they will achieve both traffic flow speed improvements and reduce
accidents.
These facilities are considered necessary for a length of around 700 meters along the Colombo Horana
Road and 400 meters along the Dehiwala –Maharagama Road.
The specific improvements and suggestions to complement the signalization of the junction are
discussed below:
• On Street Parking controls
• Access Control close to the junction
• Provision of segregated pedestrian facilities
• Geometric improvement to the intersection
• Design and allocation for bus stop and bus bays
• Re routing of buses
0
20
40
60
80
100
120
140
160
180
200
00.0
…
01.0
…
02.0
…
03.0
…
04.0
…
05.0
…
06.0
…
07.0
…
08.0
…
09.0
…
10.0
…
11.0
…
12.0
…
13.0
…
14.0
…
15.0
…
16.0
…
17.0
…
18.0
…
19.0
…
20.0
…
21.0
…
22.0
…
23.0
…
Sig
nal C
ycle
Tim
e
Time of the Day
Adjusted Cycle Time with Three Phase Signal System at Boralesgamuwa
Monday

Treatment of Junctions- Volume I: Final Report
3-9 | P a g e
Section B6: Boralesgamuwa
3.2.1 Parking Control
It is suggested that private and commercial parking should be controlled by means of specifying the
“parking areas” and “no parking” areas. In this respect parking bays could be constructed beyond the
queue formation length of the junction which would be around 75 metres in the upstream direction as
well as beyond 25 metres of the downstream direction. This will allow maximum storage of vehicles
up stream prior to discharge from the signal on green light. It will also allow parking after left turning
vehicles have merged with the traffic. This would be adequate as left turns will only share with right
turns of the opposing traffic and excess capacity will be available for merging traffic to the
downstream over a length of 25 meters.
It is also recommended that:
• Demarcation on the road with durable road paints, and use sign boards
• On street parking in the peak direction should be banned within 200m to intersection
Special consideration should be given to parking requirements of 3 wheelers. Some of these bays
could be allocated for 3 wheelers.
3.2.2 Access Control
At present most business establishments located within very close proximity to the junction have un-
restricted access to the road there by disturbing the flow of traffic not only with vehicular movements
but also by parking vehicles in such places where a part of the vehicle protrudes to the road. It is
recommended that guard rails be erected up to at least 75 metres on either side of the junction on each
of the approaches. Only limited access should be provided to commercial establishments. This will
also help the movement of pedestrians and improve safety as well.
3.2.3 Segregated pedestrian facilities
It was noted that the pedestrian activity level at Boralesgamuwa is as important as the traffic
movements. Therefore some degree of priority should be placed on the requirements of pedestrians
within the study area. This can be identified as follows:
• Inclusion of signalized pedestrian crossings within the signalization of the intersection.
• Provide at least another crossing at a distance of 75 metres to the junction with a centre
median refuge.
• Construct a centre median barrier so that pedestrians would not cross the road in between the
crossings.
• Provide raised and paved sidewalks up to end of the built up areas on all approaches. This
will be around 1,000 metres in all. At least the first 75 metres should have guard rails on
either side.

Treatment of Junctions- Volume I: Final Report
3-10 | P a g e
Section B6: Boralesgamuwa
• Remove the unauthorized and authorized constructions including lottery kiosks, utility poles
and even sign posts that are constructing pedestrian flow.
These measures will prevent pedestrians crossing at unsafe locations as well as prevent them from
getting in to the path of motorized traffic thus improving safety for pedestrians as well as speed of
vehicles.
3.2.4 Geometric improvements to the intersection
The Boralesgamuwa junction as has been pointed out in earlier chapters is located at a top of a
vertical curve. It is also located within a horizontal curve on the Colombo Horana Road. There are
some geometric improvements that are required especially for the Piliyandala Link of Colombo
Horana Road. This could be accommodated within the existing Right of Way junction where the road
could be re-aligned to reduce the horizontal curvature.
In doing this the entire available road should be utilized for street space, with broad side walks. The
temporary building projections and unauthorized activities that are common especially along the
Piliyandala Link should be removed. It is also recommended that the geometry of the lanes around the
junction should include lane markings and marking of parking stalls as well as bus halts.
3.2.5 Location and Design of bus stops and bus bays
There are over 2,600 bus movements through the junction every day. Almost all buses make at least
one stop within the study area. At present all bus stops are located at the far side of the junction (i.e.
passing the junction) so that transfer passengers have to cross one stream of traffic thus causing
intense congestion due to the pedestrian movements across the peak traffic flows.
Most bus to bus transfers occur from the Colombo Bound buses to the Maharagama bound buses in
the am peak and the reverse in the pm peak is from Dehiwala Bound buses to Horana bound buses.
Hence it would be most efficient and safe for the bus stops to be located as follows:
• Horana Direction – far side
• Colombo Direction – far side
• Dehiwala Direction – near side
• Maharagama Direction – near side
3.2.6 Re-routing of buses
Although beyond the purview of the RDA, one of the solutions to the traffic problem caused by high
stoppage of buses at halts and the subsequent flow of pedestrians across the roads is to introduce some
bus routes that would make right turns and left turns thus taking passengers without transferring them
as the junction. In this respect the following routes may be considered:

Treatment of Junctions- Volume I: Final Report
3-11 | P a g e
Section B6: Boralesgamuwa
• Piliyandala – Battaramulla via Boralesgamuwa, Maharagama, Pamunuwa and
Jayewardenepura Hospital
• Kesbewa – Fort via Boralesgamuwa, Karagampitiya, Kalubowila Road, Galle Road and
Bambalapitiya
• Maharagama – Fort via Boralesgamuwa, Kohuwela, Pamankade, Galle Road and
Bambalapitiya

Treatment of Junctions- Volume I: Final Report
4-1 | P a g e
Section B6: Boralesgamuwa
CHAPTER 4 - ECONOMIC ANALYSIS
4.1 Costs
The cost of the improvements proposed in the above chapter will include the following
• Signalization of the intersection including acquisition
• Access Control around the intersection.
• Widening and Improvements to the approach roads, realignment, construction of signs and
road markings.
The following general works are also recommended.
• Improvements to carriageway and resurfacing of approach roads up to intersection.
• Reconstruction and improvements to walkways on the above sections
• Improvements to the Traffic Management measures in the study area including access control,
guard rails, bus stop relocation, construction of bus bays etc.
The construction cost for each option is given in Table 4-1.

Treatment of Junctions- Volume I: Final Report
4-2 | P a g e
Section B6: Boralesgamuwa
Table 4-1: Comparative Cost Estimate of Options in 2008 prices
4.2 Benefits
Economics benefits from this project are many fold. For the purpose of this study we will include the
following benefits:
• Reduction in Vehicle Operating Costs for vehicles using Horana Road and Dehiwala -
Maharagama Road
• Value of Travel Time Savings for vehicles on Horana Road and Dehiwala -Maharagama
Road
• Saving from Reduction of Accidents
4.2.1 Traffic Analysis
In computing the above benefits the traffic analysis has considered the following.
Qty Amount (Rs) Qty Amount (Rs)
1.0 Land Acquisition, & Demolision and Reconstruction
1.1 Road Length m 700 475
1.2 Single Storey m2 40000 1035 41,400,000.00 2600 104,000,000.00
1.3 Two Storey m2 100000 60 6,000,000.00 560 56,000,000.00
1.4 Three Storey m2 160000 27 4,320,000.00 380 60,800,000.00
1.5 Total Land m2 30000 1122 33,660,000.00 3540 106,200,000.00
Sub Total 1 85,380,000.00 327,000,000.00
2.0 General Civil Cost
2.1 Preliminaries Sum 5,000,000.00 10,000,000.00
2.2 Clearing m2 80 4800 384,000.00 4370 349,600.00
2.3 Base & Sub Base m2 850 4800 4,080,000.00 7400 6,290,000.00
2.4 Asphalt Surfacing m2 2,300 14940 34,362,000.00 7400 17,020,000.00
2.5 Walk Ways m2 900 8400 7,560,000.00 3000 2,700,000.00
2.6 Kerbs m 1,450 8400 12,180,000.00 2000 2,900,000.00
2.7 Drains m 4,600 2800 12,880,000.00 1000 4,600,000.00
2.8 Fencing and Barricades m 14,000 960 13,440,000.00 100 1,400,000.00
2.9 Road Markings m 90 6660 599,400.00 1300 117,000.00
2.10 Sign Boards Nos 35,000 58 2,030,000.00 20 700,000.00
2.11 Traffic Signal Unit Nos 6,000,000 1 6,000,000.00
Sub Total 2 98,515,400.00 46,076,600.00
3.0 Cost of Flyover (4 Lane) m 6,076,389 475 2,886,284,722.2
Total 183,895,400.00 3,259,361,322.22
Add for Variations (20%) 36,779,080.00 651,872,264.44
Grand Total 220,674,480.00 3,911,233,586.67
Ite
m N
o
Item Description Unit Rate (Rs)
Option 1 Option 2
Signalization of intersection Flyover with Streight Ramp

Treatment of Junctions- Volume I: Final Report
4-3 | P a g e
Section B6: Boralesgamuwa
The present travel speeds reported in Chapter 3 can be summarized as follows:
• Horana Road Through Traffic – 19 km/hr
• Horana Road Turning Traffic – 19 km/hr
• Dehiwala-Maharagama all traffic – 22 km/hr
The two options considered along with the other traffic management measures that have been
recommended will improve the speeds of these two flow movements in particular. The increase in
speed of the left and right turns on both roads are given below in table 4.2
Table 4-2 : Comparison of Speed ‘Before and After’
Approach Turn Speed Km/hr
Existing Signalization Flyover
Piliyandala Left 20
25 km/hr
25
Through 19 35
Right 9 25
Dehiwala Left 24
30
Through 22
Right 20
Colombo Left 24 25
Through 20 25
Right 21 25
Maharagama Left 21
30 Through 23
Right 21
The signalization delay for the 3 phase arrangement was estimated at 1,362,115 vehicle seconds. This
works out to around 27 seconds per vehicle. When adjusted for the average speed gain it translates to
the improvement of the junction speeds up to 24.7 km/hr, which we shall assume as 25 km/hr.
In the flyover option, it was shown in Section 4.1 that the estimated average demand would be around
26,800 vehicles per day, with an average flow rate of 450 vehicles per lane per hour. After adjusting
for capacity reduction factors with respect to lane width, gradient and heavy vehicles (and low horse
powered vehicles) we get a volume to capacity ratio of 0.3 which translates to average speeds of
around 40 km per hour for a maximum speed limit of 50 km/hr and free flow speed of 70 km/hr.
However, low horse powered vehicles such as three wheelers, and some motor cycles as well as heavy
vehicles such as trucks and buses are unlikely to attain this speed especially on the gradient. Since
these vehicles constitute nearly 50% of the flow, the average speed may have to be considered as 35
km/hr for the flyover. With respect to the turning movements we will assume it will increase up to 25
km/hr and for the Dehiwala-Maharagama road all movements will increase to 30 km/hr.
Treatment of Junctions- Volume I: Final Report
4-4 | P a g e
Section B6: Boralesgamuwa
4.2.2 Economic Benefits
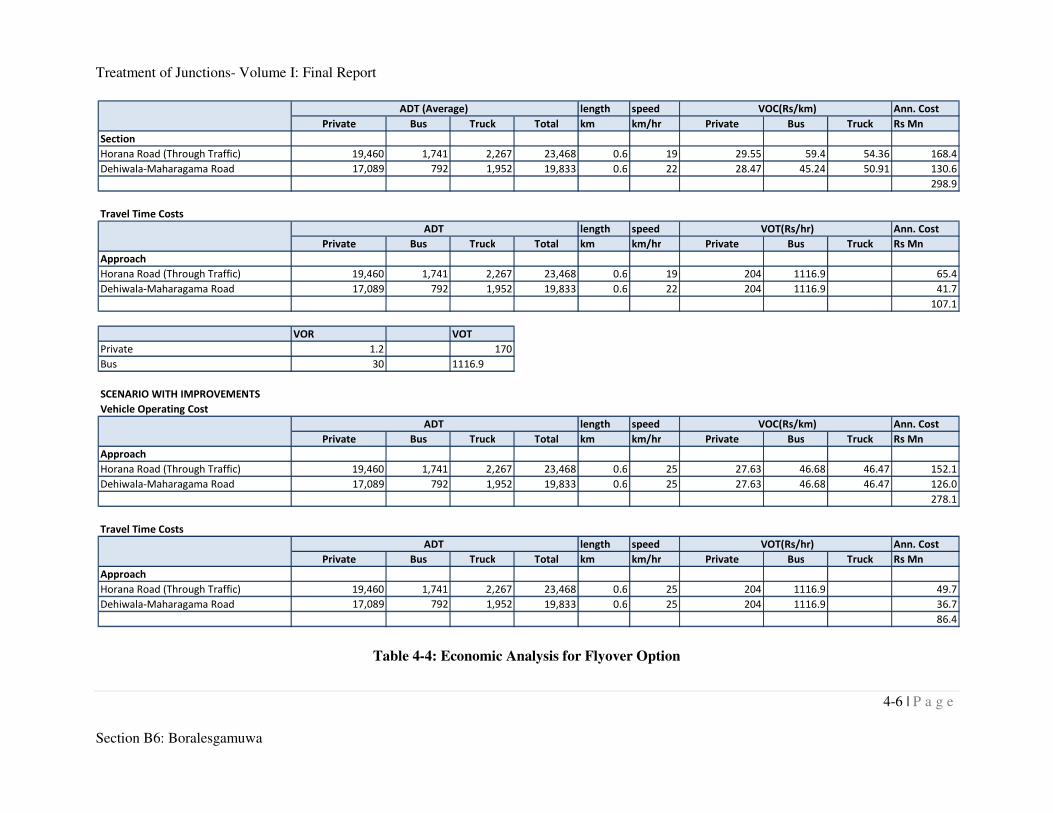
Table 4-3 and Table 4-4 show the computation of economic costs and benefits for the signalization
and flyover options respectively. The calculations are based on a ‘before and after’ traffic flow
estimate taking into account the flow estimates given in Section 5.2.1 for private vehicles, goods
vehicles and buses separately. The cost estimation uses unit values from ‘Assessing Public Investment
in the Transport Sector’2. These include vehicle operating costs at given speeds wherein the roughness
was assumed at IRR =3. The Value of Time for passengers was taken after considering Vehicle
Occupancy Rates (VOR) and the Value of Time (VoT) from the above reference after adjusting for
price escalation using CCPI. All estimates shown in Table 4-3 and Table 4-4 are in SLR in 2008
prices.
Accident savings are computed assuming that 50% of the accidents presently occurring at the
Boralesgamuwa junction study area could be reduced by a fly over with signalization option reducing
by 40% since both options which will separate many conflicts and make it safer for both pedestrians
as well as vehicle users. The economic cost of accidents also has been taken from the same source.3
2 National Planning Department, Authored by Kumarage A.S., Ed Storm, T.L. Gunaruwan et al, 1999
3 Ibid

Treatment of Junctions- Volume I: Final Report
4-5 | P a g e
Section B6: Boralesgamuwa
Table 4-3: Economic Analysis for Signalization Option
Treatment of Junctions- Volume I: Final Report
4-6 | P a g e
Section B6: Boralesgamuwa
Table 4-4: Economic Analysis for Flyover Option
length speed Ann. Cost
Private Bus Truck Total km km/hr Private Bus Truck Rs Mn
Section
Horana Road (Through Traffic) 19,460 1,741 2,267 23,468 0.6 19 29.55 59.4 54.36 168.4
Dehiwala-Maharagama Road 17,089 792 1,952 19,833 0.6 22 28.47 45.24 50.91 130.6
298.9
Travel Time Costs
length speed Ann. Cost
Private Bus Truck Total km km/hr Private Bus Truck Rs Mn
Approach
Horana Road (Through Traffic) 19,460 1,741 2,267 23,468 0.6 19 204 1116.9 65.4
Dehiwala-Maharagama Road 17,089 792 1,952 19,833 0.6 22 204 1116.9 41.7
107.1
VOR VOT
Private 1.2 170
Bus 30 1116.9
SCENARIO WITH IMPROVEMENTS
Vehicle Operating Cost
length speed Ann. Cost
Private Bus Truck Total km km/hr Private Bus Truck Rs Mn
Approach
Horana Road (Through Traffic) 19,460 1,741 2,267 23,468 0.6 25 27.63 46.68 46.47 152.1
Dehiwala-Maharagama Road 17,089 792 1,952 19,833 0.6 25 27.63 46.68 46.47 126.0
278.1
Travel Time Costs
length speed Ann. Cost
Private Bus Truck Total km km/hr Private Bus Truck Rs Mn
Approach
Horana Road (Through Traffic) 19,460 1,741 2,267 23,468 0.6 25 204 1116.9 49.7
Dehiwala-Maharagama Road 17,089 792 1,952 19,833 0.6 25 204 1116.9 36.7
86.4
ADT VOT(Rs/hr)
VOC(Rs/km)
ADT VOT(Rs/hr)
ADT VOC(Rs/km)
ADT (Average)

Treatment of Junctions- Volume I: Final Report
4-7 | P a g e
Section B6: Boralesgamuwa
PRESENT SCENARIO-2008
Vehicle Operating Cost
length speed Ann. Cost
Private Bus Truck Total km km/hr Private Bus Truck Rs Mn
Section
Horana Road (Through Traffic) 19,460 1,741 2,267 23,468 0.6 19 29.55 59.4 54.36 168.4
Horana Road (Turning Traffic) 8,541 47 838 9,426 0.6 19 29.55 59.4 54.36 63.2
Dehiwala-Maharagama Road 17089 792 1952 19833 0.6 22 28.47 45.24 50.91 130.6
362.1
Travel Time Costs
length speed Ann. Cost
Private Bus Truck Total km km/hr Private Bus Truck Rs Mn
Approach
Horana Road (Through Traffic) 19,460 1,741 2,267 23,468 0.6 19 204 1116.9 65.4
Horana Road (Turning Traffic) 8,541 47 838 9,426 0.6 19 204 1116.9 19.8
Dehiwala-Maharagama Road 17089 792 1952 19833 0.6 22 204 1116.9 41.7
126.9
VOR VOT
Private 1.2 170
Bus 30 1116.9
SCENARIO WITH IMPROVEMENTS
Vehicle Operating Cost
length speed Ann. Cost
Private Bus Truck Total km km/hr Private Bus Truck Rs Mn
Approach
Horana Road (Through Traffic) 19,460 1,741 2,267 23,468 0.6 35 26.07 42.12 39.9 140.9
Horana Road (Turning Traffic) 8,541 47 838 9,426 0.6 25 27.63 46.68 46.47 58.2
Dehiwala-Maharagama Road 17089 792 1952 19833 0.6 30 26.7 45.24 46.47 122.4
321.5
Travel Time Costs
length speed Ann. Cost
Private Bus Truck Total km km/hr Private Bus Truck Rs Mn
Approach
Horana Road (Through Traffic) 19,460 1,741 2,267 23,468 0.6 30 204 1116.9 41.4
Horana Road (Turning Traffic) 8,541 47 838 9,426 0.6 25 204 1116.9 15.1
Dehiwala-Maharagama Road 17089 792 1952 19833 0.6 30 204 1116.9 30.6
87.1
ADT VOC(Rs/km)
ADT (Average) VOC(Rs/km)
ADT VOT(Rs/hr)
ADT VOC(Rs/km)

Treatment of Junctions- Volume I: Final Report
4-8 | P a g e
Section B6: Boralesgamuwa
4.3 Cost-Benefit Analysis
The benefits computed in Tables 4-3 and 4-4 are as follows:
• Savings in Travel Time Costs
• Savings in Vehicle Operating Costs
• Savings in Accident Costs
In the case of economic benefits due to generated traffic, no increase in the economic activity of the
area has been assumed since the project is of a very local nature and unlikely to generate regional
development. Based on the estimates in Table 4-3 and Table 4-4, an economic analysis has been
performed to obtain the Economic Internal Rate of Revenue (EIRR). This is shown in Table 4-5 and
Table 4-6 for the signalization and flyover options respectively.
This analysis is based on:
1. The assumption that value of vehicle operating costs, travel time and maintenance costs will
increase but in a manner that they will remain constant in real terms over the project life.
2. Project Life for the signalization is taken as 10 years after commissioning, and for the flyover
option it is taken as 20 years, where construction is expected to be completed by end of 2010.
3. Traffic growth has been assumed at a very conservative 3% growth rate. This is much less
than the 4 to 6 percent growth seen in urban areas.
The following conclusions can be reached from this economic analysis:
4.3.1 Signalization Option
The summary of the costs and benefits that have been discussed in earlier sections have been
summarized and discounted over the project life in Table 4-5.
Based on the Table 4-5 it is seen that the Signalization Option the following conclusions can be
reached:
1. On the above assumptions it returns an EIRR of 19.7% which can be termed a moderate
return on investment for an urban road project.
2. At a discount rate of 0% it returns a Net Present Value of Rs 422 million over 10 years.
3. At undiscounted prices it returns a Benefit to Cost Ratio of 2.4.

Treatment of Junctions- Volume I: Final Report
4-9 | P a g e
Section B6: Boralesgamuwa
Table 4-5: Cost Benefit Analysis for Signalization Option
Year Cost Benefit
Capital Recurrent VOC VOT Accidents Generated Total Net
2008 0 0
2009 221
2010 4.5 21 21 19 0 60.1 56
2011 4.5 21 21 19 0 61.9 57
2012 4.5 22 22 20 0 63.8 59
2013 4.6 23 23 20 0 65.7 61
2014 4.6 23 23 21 0 67.7 63
2015 4.7 24 24 22 0 69.7 65
2016 4.7 25 25 22 0 71.8 67
2017 4.8 26 25 23 0 73.9 69
2018 4.8 26 26 24 0 76.2 71
2019 4.9 27 27 24 0 78.4 74
267.3 689.3 643
Total
Discount Rate 0.0
Generated Traffic 0.0
NPV 421.9 Rs Million
The following sensitivity tests have been also performed:
1. If construction costs increase by 50% in real terms the project returns an EIRR of 12.1%
which shows that the signalization project is not robust to absorb cost variations.
2. If benefits reduce by half over the project life period, returns an EIRR of 5.4% showing it is
marginally robust to absorb reduction in benefits.
4.3.2 Flyover Option
The summary of the costs and benefits that have been discussed in earlier sections have been
summarized and discounted over the project life in Table 4-6.
Based on the Table 4-6 it is seen that the Flyover Option the following conclusions can be reached:
1. On the above assumptions it returns a negative EIRR which does not indicate that the project
is economically viable.
2. At a discount rate of 0% it returns a Net Present Value of negative Rs 2,852million.
At undiscounted prices it returns a Benefit to Cost Ratio of only 0.2.

Treatment of Junctions- Volume I: Final Report
4-10 | P a g e
Section B6: Boralesgamuwa
Table 4-6: Cost Benefit Analysis for Flyover Option
Year Cost Benefit
Capital Recurrent VOC VOT Accidents Generate
d
Total Net
2008 0 0
2009 3,911 -3,911
2010 79.0 41 40 24 0 104.2 25
2011 79.8 42 41 24 0 107.3 27
2012 80.6 43 42 25 0 110.5 30
2013 81.4 44 44 26 0 113.8 32
2014 82.2 46 45 27 0 117.2 35
2015 83.0 47 46 28 0 120.7 38
2016 83.9 48 48 28 0 124.4 41
2017 84.7 50 49 29 0 128.1 43
2018 85.5 51 50 30 0 131.9 46
2019 86.4 53 52 31 0 135.9 49
2020 87.3 54 54 32 0 140.0 53
2021 88.1 56 55 33 0 144.2 56
2022 89.0 58 57 34 0 148.5 59
2023 89.9 60 59 35 0 153.0 63
2024 90.8 61 60 36 0 157.5 67
2025 91.7 63 62 37 0 162.3 71
2026 92.6 65 64 38 0 167.1 74
2027 93.6 67 66 39 0 172.1 79
2028 94.5 69 68 40 0 177.3 83
2029 95.4 71 70 42 0 182.6 87
5650.5 2798.6 1,059
Total
Discount Rate 0.0
Generated Traffic 0.0
NPV -2851.9 Rs Million
B/C 0.2
4.4 Non-Quantifiable Benefits
There are several other benefits that have not been included in the economic analysis which will
greatly favour the construction of the signalization project. These may be identified as:
1. Introduction of modernization to Boralesgamuwa city centre
2. Improvement to important National Highway.
3. Improves the bus to bus transfers.
4. Benefits to pedestrians in terms of time savings have not been computed.

Treatment of Junctions- Volume I: Final Report
5-1 | P a g e
Section B6: Boralesgamuwa
CHAPTER 5 - CONCLUSIONS
The following conclusions on the above analysis based on the primary option of flyover versus the
signalization can be tabulated as follows:
Feature of Impact Signalization Option Flyover Option
Cost of Construction Rs 211 million for a 3 phase
signal with widening for 4 lane
approaches on Horana Road and
3 lanes at Dehiwala-
Maharagama road approaches.
Rs 3,911 million for a 2 x 2 lane
flyover of 475 metres
Urban Landscape No adverse Impact Considered too dominant for a
small suburban town centre
such as Borelesgamuwa.
Cost of Other General
Improvements
Included in above Included in above
Increase in Travel Speed Through traffic speeds on
Horana Road will increase from
19 km per hour to 25 km per
hour
Overall junction speed will
increase from and average of
around 22 km per hour to 25 km
per hour.
Acquisition Will require acquisition close to
the junction
Will require acquisition at the
toes.
Economic Benefit-Cost
Analysis
EIRR is 19.7% and NPV is Rs
422 million with a Benefit-Cost
ratio of 2.4.
NPV at 0% discount rate is
negative Rs 2,951 million and
the Benefit-Cost Ratio is 2.2.
Safety Will improve both at
intersections and by placing
centre median guard rails.
Estimated 40% reduction.
Will improve due to grade
separation. Estimated 50%
reduction.
Level of Service Signal Timing for existing flow
returns an acceptable Level of
Service
Width is inadequate for
acceptable Level of Service on
two lane undivided flyover.
Ramp gradient may have to be
restricted to 4%.
Adequacy of Capacity Will be adequate for next 10
years and up to 20 years if
public transport is improved
Two lane undivided flyover will
not be adequate for more than 5
years. Four lanes will be
adequate for over 20 years.
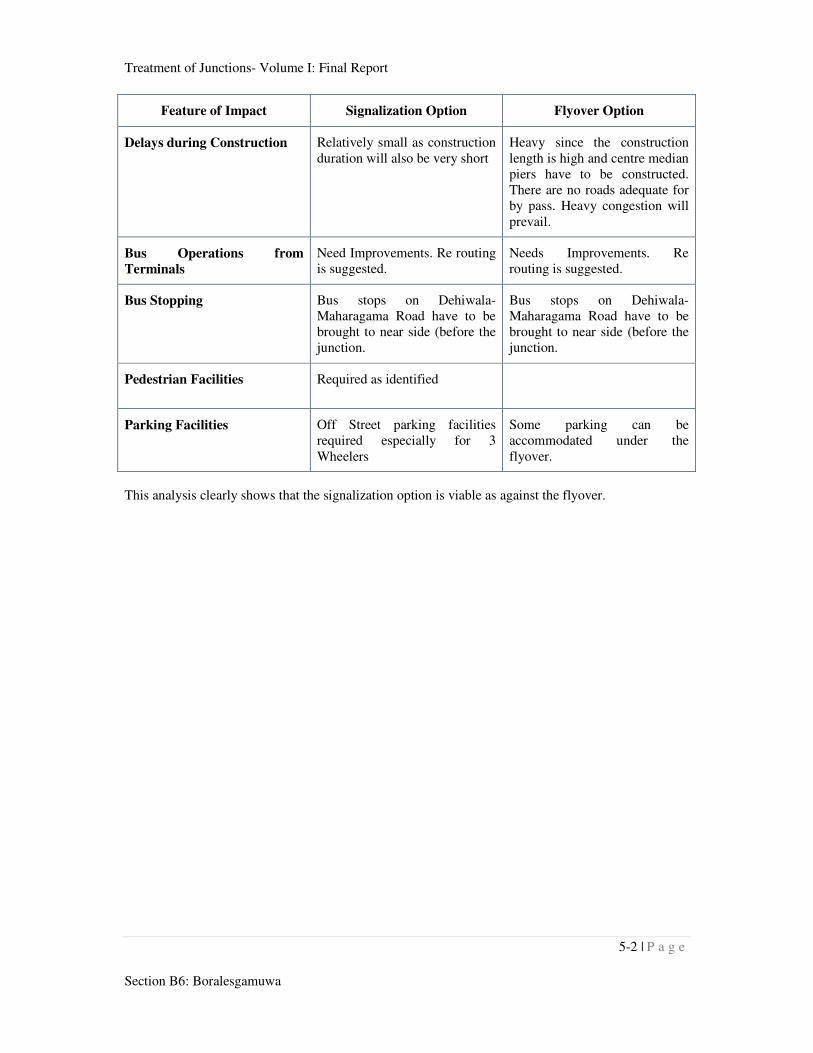
Treatment of Junctions- Volume I: Final Report
5-2 | P a g e
Section B6: Boralesgamuwa
Feature of Impact Signalization Option Flyover Option
Delays during Construction Relatively small as construction
duration will also be very short
Heavy since the construction
length is high and centre median
piers have to be constructed.
There are no roads adequate for
by pass. Heavy congestion will
prevail.
Bus Operations from
Terminals
Need Improvements. Re routing
is suggested.
Needs Improvements. Re
routing is suggested.
Bus Stopping Bus stops on Dehiwala-
Maharagama Road have to be
brought to near side (before the
junction.
Bus stops on Dehiwala-
Maharagama Road have to be
brought to near side (before the
junction.
Pedestrian Facilities Required as identified
Parking Facilities Off Street parking facilities
required especially for 3
Wheelers
Some parking can be
accommodated under the
flyover.
This analysis clearly shows that the signalization option is viable as against the flyover.
Treatment of Junctions- Volume I: Final Report
6-1 | P a g e
Section B6: Boralesgamuwa
CHAPTER 6 - RECOMMENDATION
The following measure to improve the traffic flow in Boralesgamuwa Junction can be recommended
based on the economic viability and other issues discussed earlier.
• Junction Control using signalization. This will require widening of the approach roads to
include geometry of 6 lanes on the Colombo-Horana Road and 4 lanes on the Dehiwala-
Maharagama Road.
• Access Control close to the junction by constructing guard rails with limited openings to
prevent vehicles parking obstructing the flow of traffic at the intersection as well as to reduce
disruption to free flow caused by vehicles entering and exiting the different establishments at
the junction.
• On Street Parking controls in the form of designating ‘no parking’ areas and creating parking
bays for 3 wheelers at properly designed and located places.
• Provision of segregated pedestrian facilities with raised sidewalks along both roads with
pedestrian crossings located not further than 75 metres apart from each other with centre
median refuges.
• Relocate bus stops on Dehiwala – Maharagama Road and to construct proper bus bays on all
approaches.
• Re routing of through buses to reduce transfers at the Boralesgamuwa junction and adding to
congestion caused by heavy pedestrian flows.
These measures will result in
• Improved average speed on within Boralesgamuwa Study area from the exiting average of 22
km per hour to an estimated 25 km/hr.
• It will also lead to reduction of accidents as intersections are better controlled and pedestrian
crossings are better managed.
• There will be some modernization to the city.
The project is estimated to cost around 211 million rupees but its benefits will far outweigh the costs
in terms of an EIRR of 19.7% and an NPV at 0% discount rate of Rs 442 million and a Benefit-Cost
ratio of 2.4.
The project will remain moderately stable even if there are unexpected cost variations or reduction of
benefits.

Treatment of Junctions- Volume I: Final Report
6-2 | P a g e
Section B6: Boralesgamuwa
In contrast a flyover of 475 metres will cost Rs 3,911 million. Such a project does not return the scale
of benefits to make it viable. The NPV is found to be negative.
The summary of the recommendations is shown in the Figure 6-1.
Figure 6-1: Map of Boralesgamuwa Study Area showing recommended improvements