TREASURY WINE ESTATES/media/Files/Global/ASX-Announcements/... · TREASURY WINE ESTATES Interim...
31
TREASURY WINE ESTATES Interim 2017 Results 14 February 2017
-
Upload
phungquynh -
Category
Documents
-
view
213 -
download
0
Transcript of TREASURY WINE ESTATES/media/Files/Global/ASX-Announcements/... · TREASURY WINE ESTATES Interim...

TREASURY
WINE ESTATESInterim 2017 Results
14 February 2017
2
Michael ClarkeChief Executive Officer
33
Result headlines1,2,3,4
• Reported net profit after tax $136.2m; more than double prior year
• Reported Earnings Per Share (EPS) 18.5 cents per share; more than double prior year
• Reported EBITS5 $226.8m, up 59%; higher than F15 reported EBITS
• All regions delivered double digit EBITS growth in 1H17
• EBITS margin accretion reported; up 4.3ppts to 17.5%
• Strong cash conversion at 104%
• Interim dividend 13.0 cents per share, unfranked; 5 cents per share higher than the prior period (up 63%)
• Cumulative run-rate COGS savings of $56m from supply chain optimisation; $15m delivered in 1H17
• 2H17 EBITS expected to be broadly in line with 1H176
• High-teens EBITS margin expected by F18
• Total cash synergies recognised from the acquisition of Diageo Wine to reach a run-rate of US$35m by F20
• Total COGS savings from Supply Chain Optimisation initiative to reach a run-rate of at least $100m by F20
1. Financial information in this report is based on reviewed financial statements. Non-IFRS measures have not been subject to audit or review. The non-IFRS
measures are used internally by management to assess the operational performance of the business and make decisions on the al location of resources
2. Comparative balances have been restated to reflect the final purchase price allocation for the Diageo acquisition, reallocation of inter-regional corporate and IT
costs, and a change in accounting standards relating to Agricultural Assets. Refer to Appendix 1
3. All figures and calculations are subject to rounding
4. All Result Headlines metrics disclosed on a reported currency basis
5. Earnings before interest, tax, SGARA and material items
6. Absent significant foreign exchange rate fluctuations

44
Brand and marketing highlights in 1H17 – Chateau St Jean
Investment in standout packaging and appetite
appeal, “French” inspired design cues

55
Brand and marketing highlights in 1H17 – Beringer
Introducing “Main & Vine by Beringer”
Commenced de-coupling of the Commercial tier and elevating the Luxury credentials of the
Masterbrand
66
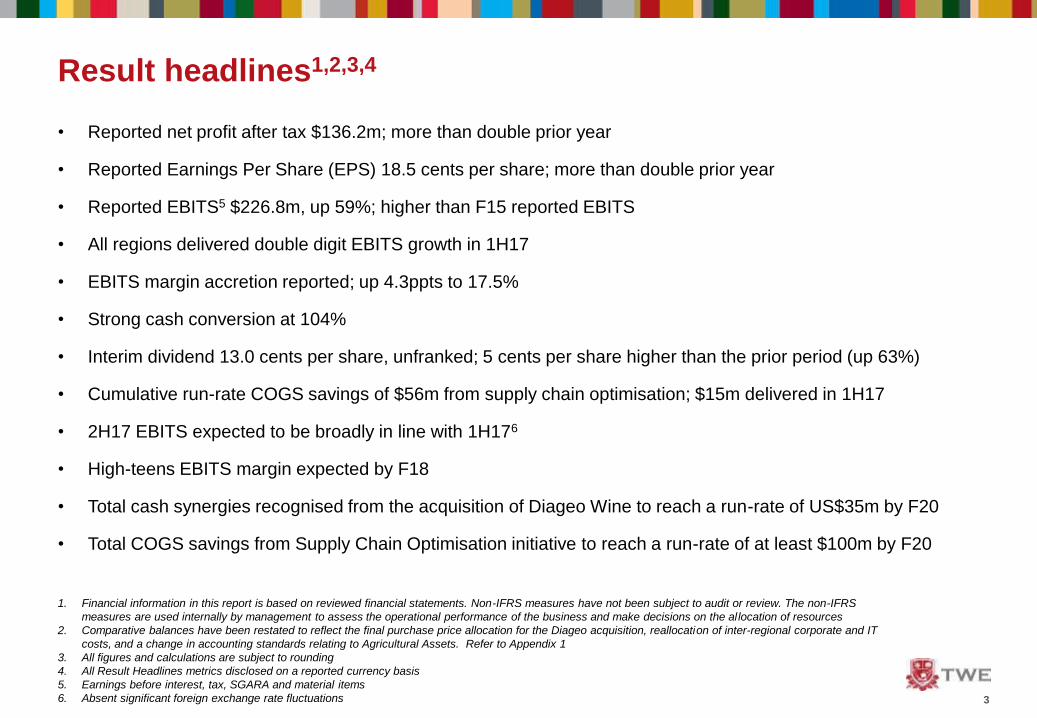
Brand and marketing highlights in 1H17 – Beaulieu Vineyard
Separation and de-coupling the Commercial tier and elevating the Luxury credentials of
the Masterbrand

77
Brand and marketing highlights in 1H17 – Beaulieu Vineyard
Honour Matters, Now more than ever
New advertising campaigns taking ownership of the brand’s enduring values

88
Brand and marketing highlights in 1H17 – Sterling Vineyards
Refreshed packaging bringing the Sterling Vineyards brand name and proposition to life

99
Brand and marketing highlights in 1H17 – Sterling Vineyards
“Always Polished, Never Dull”
Positioning the brand as an aspirational choice for the millennial consumer

1010
Brand and marketing highlights in 1H17 – 19 Crimes
Red Blend Cabernet Sauvignon The Banished Dark Red The Warden Red Blend More to Come
Accelerating brand growth with bold product extensions with exciting innovation to come
1111
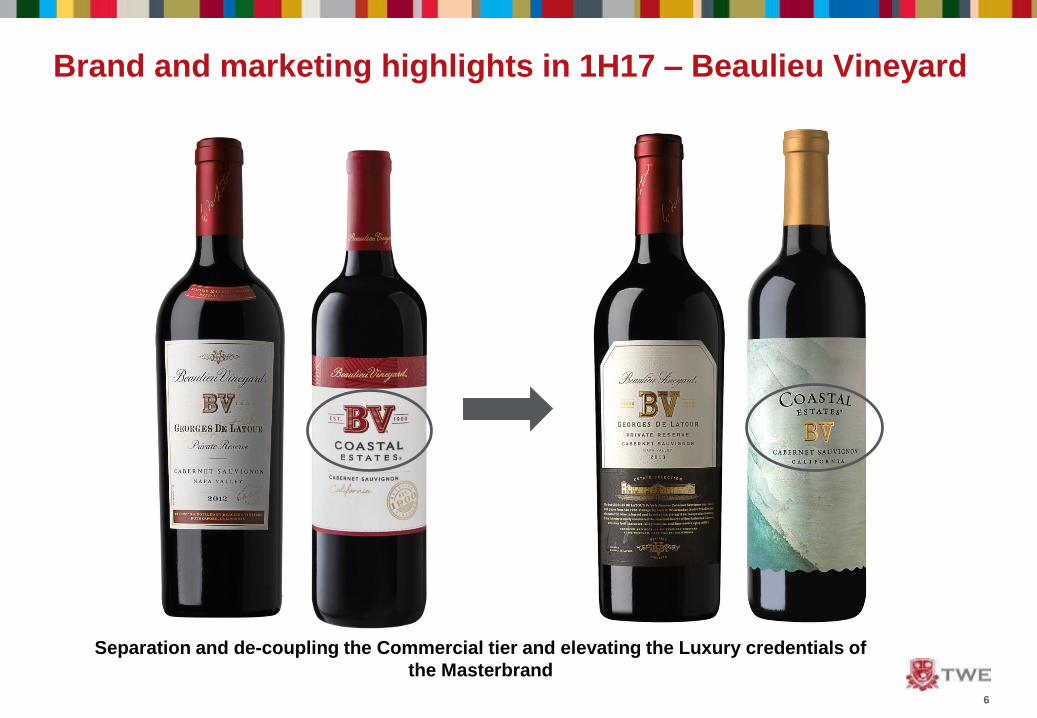
Brand and marketing highlights in 1H17 – The Stag by St. Huberts
Victorian Chardonnay & Shiraz North Coast, CA Cabernet Argentinian Malbec
Globally sourcing The Stag by St. Huberts portfolio from Australia, North Coast CA and Argentina

12
Michael ClarkeChief Executive Officer
13
Gunther BurghardtChief Financial Officer

1414
Profit & Loss1
1. Unless otherwise stated all percentage or Dollar movements from prior periods are pre material items and on a constant currency basis
2. Stated on a reported currency basis
EBITS growth and regional contribution
$134.1m
$226.8m
Historical EBITS and EBITS margin2
Accelerating momentum across all regions delivering strong interim result
• NPAT before material items and SGARA up $61.3m to $148.6m (+70%) principally driven by higher EBITS
• EBITS up 69% to $226.8m; all four regions delivered double digit EBITS growth
• SGARA loss of $10.5m (versus loss of $14.3m in pcp) principally driven by higher vintage costs associated with the 2016
Californian vintage in 1H17
• Higher net finance costs driven by increased average borrowings and assumption of finance leases post acquisition of Diageo Wine
in 2H16
• Higher tax expense due to increased earnings, including the acquisition of Diageo Wine
• Material item expense (post tax) of $6.1m reflecting integration costs and implementation of supply chain optimisation in the US

1515
Balance Sheet1
Strong balance sheet maintained Committed debt facility maturity profile
• Net assets up $104.5m principally reflecting the acquisition of Diageo Wine. Adjusting for movements in foreign currency, net assets
increased $108.8m
• TWE continues to target financial metrics consistent with an investment grade credit profile
• Lower borrowings reflect repayment of US$125m Diageo Wine acquisition bridge facility in 2H16, partially offset by acquired finance leases
• Net debt 3 / EBITDAS, adjusted for operating leases 1.5x and interest cover of 16.0x2
• Weighted average term to maturity of committed facilities 3.9 years, with $473.2m undrawn
• Gross debt 75% fixed, 25% floating
A$m
TWE’s balance sheet continues to provide the flexibility to pursue future value accretive opportunities
1. Unless otherwise stated all balance sheet percentage or Dollar movements from the previous corresponding period are on a reported currency basis
2. Interest cover calculated as the ratio of earnings to net interest expense, where earnings is the consolidated pre-tax profit (pre any material items and SGARA) plus the sum
of the amount of net interest expense adjusted for amortised interest costs, per financial covenants
3. Borrowings increased by $3.6m (1H16: $5.3m, F16: $12.7m) to reflect a fair value hedge of a portion of US Private Placement notes
A$m 1H17 F16 1H16
Cash & cash equivalents 339.9 256.1 1,101.2
Receivables 622.3 611.4 593.8
Current inventories 927.3 895.7 710.9
Non-current inventories 645.2 678.4 461.0
Property, plant & equipment 1,354.2 1,347.8 1,090.0
Agricultural assets 37.2 35.8 36.0
Intangibles 1,120.3 1,101.5 812.2
Assets held for sale 37.7 68.2 17.6
Other assets 261.3 291.6 191.3
Total assets 5,345.4 5,286.5 5,014.0
Payables 704.2 726.3 509.3
Borrowings 640.2 631.1 670.9
Provisions 78.3 83.1 105.9
Other liabilities 274.3 276.8 184.0
Total liabilities 1,697.0 1,717.3 1,470.1
Net assets 3,648.4 3,569.2 3,543.9

1616
Cash flow and net debt1
Excellent cash conversion maintained
• Net debt2 decreased $69.3m to $295.9m
• Other drivers of the movement in net debt include:
− EBITDAS increased $93.3m on a reported currency basis
− Favourable movement in working capital of $12.8m
• 1H16 net debt included proceeds received from the equity
funding component of the Diageo Wine acquisition
• Cash conversion at 104%3
Continued investment in quality and an efficient asset base
1. All cash flow percentage or Dollar movements from the previous corresponding period are on a reported currency basis
2. Borrowings increased by $3.6m (1H16: $5.3m, F16: $12.7m) to reflect a fair value hedge of a portion of US Private Placement notes
3. Cash conversion (Net operating cash flows before financing costs, tax and material items divided by EBITDAS)
• Capital expenditure up $17.3m to $60.7m, driven by:
– Continued investment in premiumisation activities;
including investment in vineyard redevelopments and
upgrades to Luxury wine making facilities
– Integration of Diageo Wine
– Offsetting oak purchases in 1H17 were barrels disposed
under sale and leaseback arrangements of $11.6m
• Maintenance and replacement capital expenditure not expected
to exceed $110m in F17
• Capital expenditure of circa $80m expected in F17 to deliver
TWE’s integration synergies of US$35m (run rate by F20)
A$m 1H17 1H16
IT Spend 2.9 9.2
Oak Purchases 15.7 7.6
Vineyard redevelopments 9.7 6.9
Upgrades to wine making equipment and facilities 4.4 3.3
Other Capex 9.9 7.3
Total maintenance and replacement capex 42.6 34.3
Supply Chain Optimisation initiative 2.5 9.1
Diageo Wine integration 15.6 -
Total capital expenditure 60.7 43.4
Oak barrels under sale and leaseback arrangements (11.6) -
Net capital expenditure 49.1 43.4
A$m (unless otherwise stated) 1H17 1H16
EBITDAS 283.9 190.6
Change in working capital 12.8 42.5
Other items (2.8) 6.2
Capital expenditure (60.7) (43.4)
Net investment expenditure/other 14.7 2.3
Net interest paid (11.5) (6.3)
Tax paid (22.8) (2.2)
Dividends/distributions paid (88.6) (52.1)
Material item cash flows 3.1 35.8
Issue of shares, less transaction costs - 475.5
On-market share purchases (18.3) (4.6)
Total cash flows from activities 109.8 644.3
Opening net debt at 30 June (365.2) (213.9)
Total cash flows from activities (above) 109.8 644.3
Proceeds from settlement of derivatives 1.1 13.6
Debt revaluation and foreign exchange movements (41.6) (7.2)
Decrease in net debt 69.3 650.7
Closing net debt at 31 December (295.9) 436.8
1717
Inventory analysis
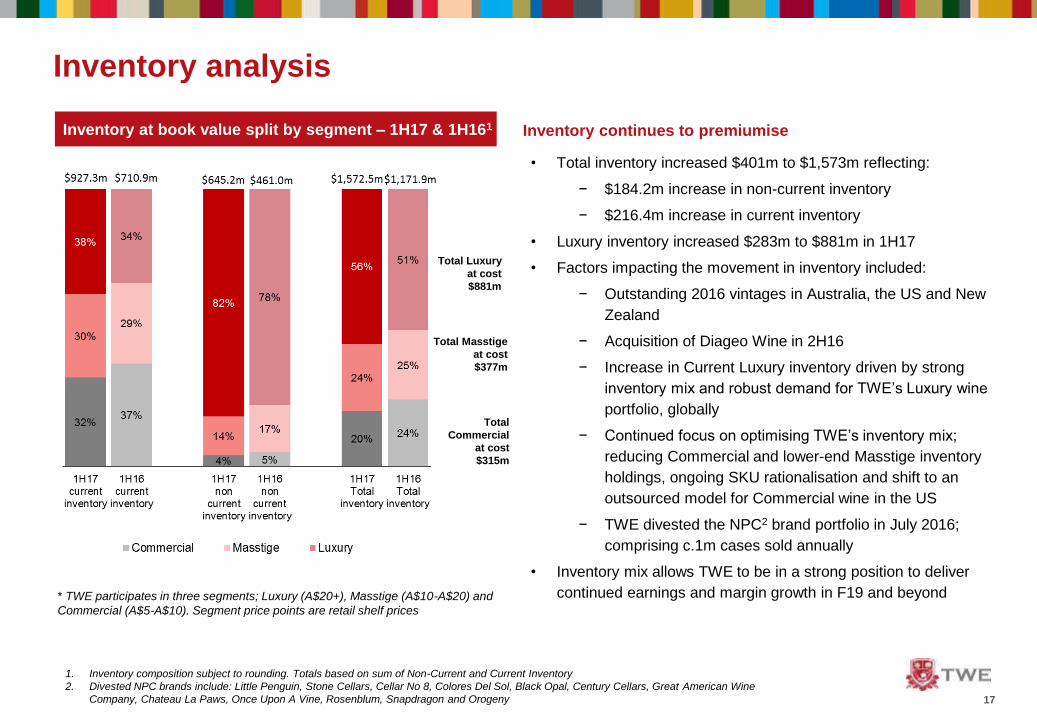
Inventory at book value split by segment – 1H17 & 1H161
1. Inventory composition subject to rounding. Totals based on sum of Non-Current and Current Inventory
2. Divested NPC brands include: Little Penguin, Stone Cellars, Cellar No 8, Colores Del Sol, Black Opal, Century Cellars, Great American Wine
Company, Chateau La Paws, Once Upon A Vine, Rosenblum, Snapdragon and Orogeny
* TWE participates in three segments; Luxury (A$20+), Masstige (A$10-A$20) and
Commercial (A$5-A$10). Segment price points are retail shelf prices
Total Luxury
at cost
$881m
Total Masstige
at cost
$377m
Total
Commercial
at cost
$315m
Inventory continues to premiumise
• Total inventory increased $401m to $1,573m reflecting:
− $184.2m increase in non-current inventory
− $216.4m increase in current inventory
• Luxury inventory increased $283m to $881m in 1H17
• Factors impacting the movement in inventory included:
− Outstanding 2016 vintages in Australia, the US and New
Zealand
− Acquisition of Diageo Wine in 2H16
− Increase in Current Luxury inventory driven by strong
inventory mix and robust demand for TWE’s Luxury wine
portfolio, globally
− Continued focus on optimising TWE’s inventory mix;
reducing Commercial and lower-end Masstige inventory
holdings, ongoing SKU rationalisation and shift to an
outsourced model for Commercial wine in the US
− TWE divested the NPC2 brand portfolio in July 2016;
comprising c.1m cases sold annually
• Inventory mix allows TWE to be in a strong position to deliver
continued earnings and margin growth in F19 and beyond

18
Angus McPherson | ANZ
Robert Foye | Europe & Asia
Bob Spooner | Americas
Michael Clarke | Summary & Outlook

1919
Australia & New Zealand
ANZ regional performance Historical EBITS & EBITS margin performance1
1. Presented on a reported currency basis
2. TWE deliberately reallocated Australian customers who serviced Asia to the Asia region. Source: Aztec Sales Data | Off-premise Channel Only | Bottled Wine Only | Scan
MAT to January 2017 & Management estimates
Strengthening category leadership position by investing in strategic partnerships with category growth solutions and
outstanding consumer insights
• Achieved adjusted volume growth of 2% in Australia; more than double the bottled wine category2
• Portfolio premiumisation and enhanced price realisation underpinned positive NSR per case, led by Penfolds, Pepperjack, Wynns
and Annie’s Lane in 1H17
• Strengthened partnerships with strategic accounts in 1H17 underpinned by continued, industry-leading consumer insights and
category growth solutions
• 2016 Penfolds Collection launch at Magill Estate in October 2016 and Wolf Blass brand activations through AFL Footy Finals, “The
Chase” campaign and Bromley By Wolf Blass were key brand building highlights in 1H17
• Regional Gems portfolio delivered above category volume growth in 1H17, supported by relaunch of T’Gallant Sparkling range and
launch of St Hubert’s The Stag
• Lower CODB margin in 1H17 supported by continued focus on reducing costs, optimised brand building investment and NSR growth
• EBITS growth and EBITS margin accretion delivered in 1H17
• EBITS margin accretion expected in 2H17 driven by continued momentum, margin accretive innovation, strengthening customer
partnerships and ongoing focus on managing costs
A$m 1H17 1H16 % 1H16 %
Volume (m 9Le) 4.2 4.2 0.3% 4.2 0.3%
NSR (A$m) 322.8 318.1 1.5% 319.3 1.1%
NSR per case (A$) 77.25 76.37 1.2% 76.66 0.8%
EBITS (A$m) 53.1 46.9 13.2% 48.3 9.9%
EBITS margin (%) 16.4% 14.7% 1.7ppts 15.1% 1.3ppts
Reported currency Constant currency
2020
Europe
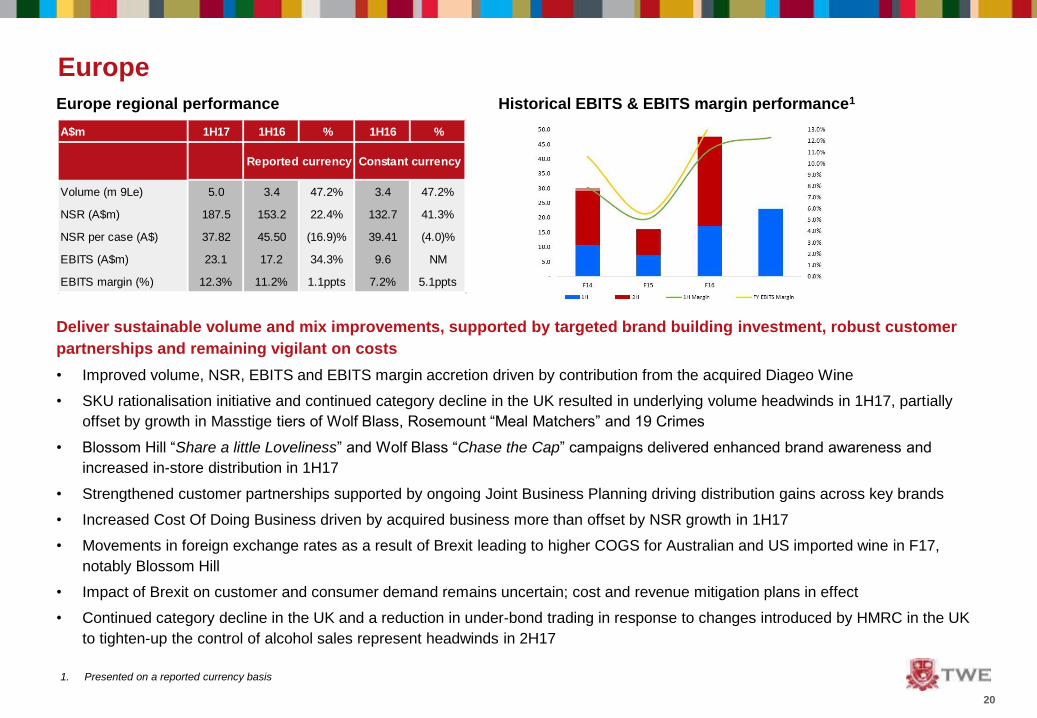
Europe regional performance Historical EBITS & EBITS margin performance1
Deliver sustainable volume and mix improvements, supported by targeted brand building investment, robust customer
partnerships and remaining vigilant on costs
• Improved volume, NSR, EBITS and EBITS margin accretion driven by contribution from the acquired Diageo Wine
• SKU rationalisation initiative and continued category decline in the UK resulted in underlying volume headwinds in 1H17, partially
offset by growth in Masstige tiers of Wolf Blass, Rosemount “Meal Matchers” and 19 Crimes
• Blossom Hill “Share a little Loveliness” and Wolf Blass “Chase the Cap” campaigns delivered enhanced brand awareness and
increased in-store distribution in 1H17
• Strengthened customer partnerships supported by ongoing Joint Business Planning driving distribution gains across key brands
• Increased Cost Of Doing Business driven by acquired business more than offset by NSR growth in 1H17
• Movements in foreign exchange rates as a result of Brexit leading to higher COGS for Australian and US imported wine in F17,
notably Blossom Hill
• Impact of Brexit on customer and consumer demand remains uncertain; cost and revenue mitigation plans in effect
• Continued category decline in the UK and a reduction in under-bond trading in response to changes introduced by HMRC in the UK
to tighten-up the control of alcohol sales represent headwinds in 2H17
1. Presented on a reported currency basis
A$m 1H17 1H16 % 1H16 %
Volume (m 9Le) 5.0 3.4 47.2% 3.4 47.2%
NSR (A$m) 187.5 153.2 22.4% 132.7 41.3%
NSR per case (A$) 37.82 45.50 (16.9)% 39.41 (4.0)%
EBITS (A$m) 23.1 17.2 34.3% 9.6 NM
EBITS margin (%) 12.3% 11.2% 1.1ppts 7.2% 5.1ppts
Reported currency Constant currency
2121
Asia
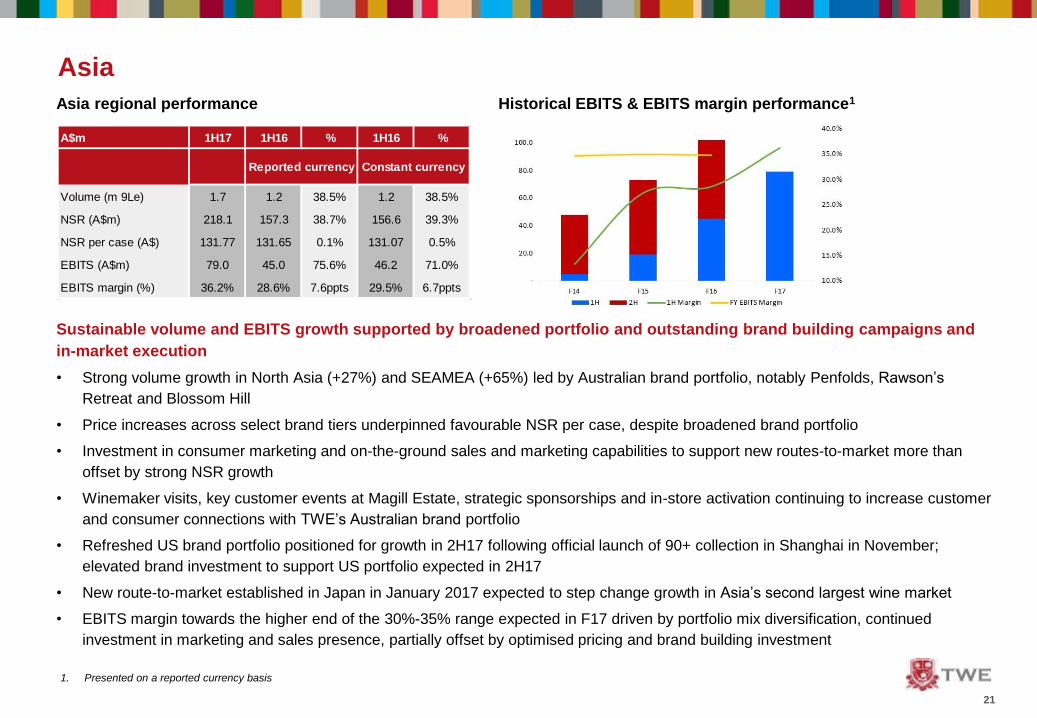
Asia regional performance Historical EBITS & EBITS margin performance1
Sustainable volume and EBITS growth supported by broadened portfolio and outstanding brand building campaigns and
in-market execution
• Strong volume growth in North Asia (+27%) and SEAMEA (+65%) led by Australian brand portfolio, notably Penfolds, Rawson’s
Retreat and Blossom Hill
• Price increases across select brand tiers underpinned favourable NSR per case, despite broadened brand portfolio
• Investment in consumer marketing and on-the-ground sales and marketing capabilities to support new routes-to-market more than
offset by strong NSR growth
• Winemaker visits, key customer events at Magill Estate, strategic sponsorships and in-store activation continuing to increase customer
and consumer connections with TWE’s Australian brand portfolio
• Refreshed US brand portfolio positioned for growth in 2H17 following official launch of 90+ collection in Shanghai in November;
elevated brand investment to support US portfolio expected in 2H17
• New route-to-market established in Japan in January 2017 expected to step change growth in Asia’s second largest wine market
• EBITS margin towards the higher end of the 30%-35% range expected in F17 driven by portfolio mix diversification, continued
investment in marketing and sales presence, partially offset by optimised pricing and brand building investment
1. Presented on a reported currency basis
A$m 1H17 1H16 % 1H16 %
Volume (m 9Le) 1.7 1.2 38.5% 1.2 38.5%
NSR (A$m) 218.1 157.3 38.7% 156.6 39.3%
NSR per case (A$) 131.77 131.65 0.1% 131.07 0.5%
EBITS (A$m) 79.0 45.0 75.6% 46.2 71.0%
EBITS margin (%) 36.2% 28.6% 7.6ppts 29.5% 6.7ppts
Reported currency Constant currency

2222
Americas
Americas regional performance Historical EBITS & EBITS margin performance1
Leverage investment in US brand portfolio, organisational capability and strengthened retail and distributor partnerships
to deliver sustainable volume and profitability growth
• Volume and NSR up strongly driven by contribution of acquired Diageo Wine business, partially offset by divestment of non-priority
Commercial portfolio in July 20162
• Diageo Wine acquisition delivering strong portfolio mix benefits and EBITS margin accretion, despite significant uplift in brand building
investment in 1H17
• Portfolio mix benefit more than offset incremental costs associated with building a stronger, fitter and bigger business in the US
• Re-set of US brand portfolio underpinned higher brand building investment recognised in 1H17; A&P per case increased 30%
• US brand portfolio now positioned for sustainable volume and value growth in 2H17; targeting volume and value growth in line with
category in 2H173
• Route-to-market change in Canada announced in January 2017 to facilitate increased market coverage and deliver cost efficiencies
• Continued margin accretion expected to be delivered by volume growth and portfolio premiumisation, enhanced returns from the
Diageo Wine business, optimisation of brand investment and cost management
1. Presented on a reported currency basis
2. Non-priority Commercial portfolio comprised approximately 1m cases sold annually
3. Total Wine Category $4+ Table (excluding Box) in volume and value growth of 0.9% and 2.8%, respectively. Source: IRI Market Advantage, Table $4+ excluding Box and
Aseptic Wine Size Package, 26 weeks ending 1/8/17, Total Multi Outlet + Liquor
A$m 1H17 1H16 % 1H16 %
Volume (m 9Le) 7.9 7.1 12.6% 7.1 12.6%
NSR (A$m) 566.3 450.8 25.6% 433.3 30.7%
NSR per case (A$) 71.24 63.87 11.5% 61.39 16.0%
EBITS (A$m) 90.7 51.7 75.4% 48.1 88.6%
EBITS margin (%) 16.0% 11.5% 4.5ppts 11.1% 4.9ppts
Reported currency Constant currency

2323
Summary and outlook
• TWE is transitioning from an agricultural, order-taking company to a brand-led, high performance organisation
• Strong 1H17 result demonstrates execution of strategy and initiatives to deliver ongoing value accretion
• 2H17 EBITS expected to be broadly in line with 1H17, absent significant fluctuations in foreign exchange rates
• High-teens EBITS margin expected by F18
• Total cash synergies recognised from the acquisition of Diageo Wine to reach a run-rate of US$35m by F20
• Total COGS savings from its Supply Chain Optimisation initiative to reach a run-rate of at least $100m by F20
• Ongoing focus on delivering shareholder value accretion via ROCE improvement; delivered by earnings and Capital
Employed optimisation

24
Questions

2525
Disclaimer
Treasury Wine Estates (TWE) advises that this presentation contains forward looking statements which may be subject to
significant uncertainties outside of TWE’s control.
No representation is made as to the accuracy or reliability of forecasts or the assumptions on which they are based.
Actual future events may vary from these forecasts and you are cautioned not to place undue reliance on any forward looking
statement.
26
Supplementary
Information
2727
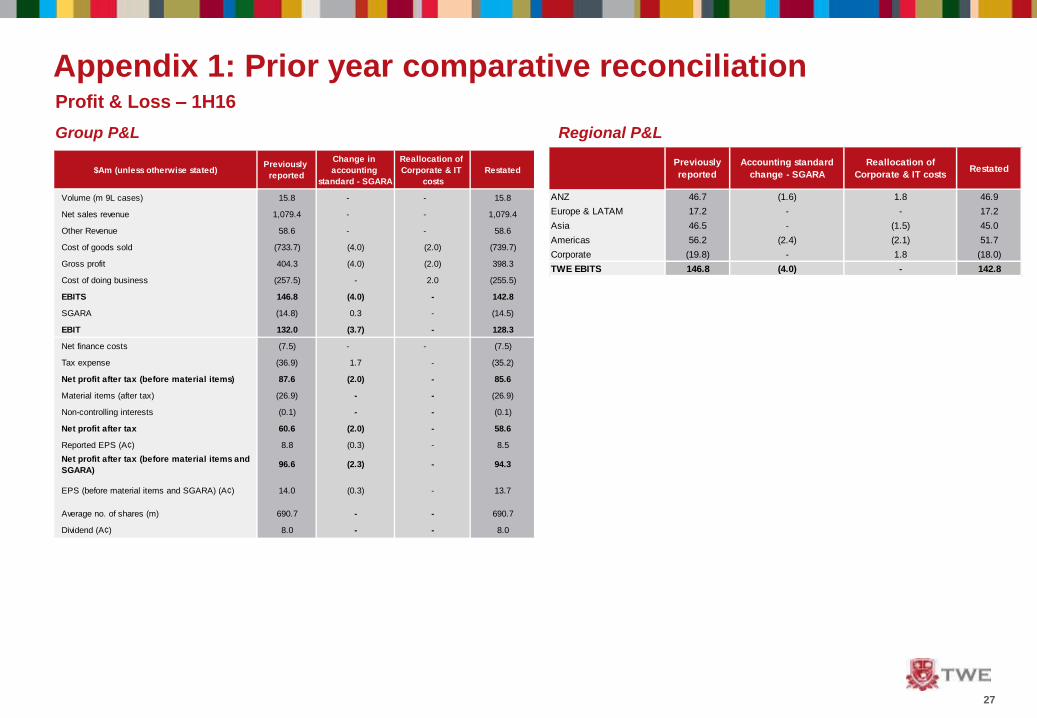
Appendix 1: Prior year comparative reconciliation Profit & Loss – 1H16
Group P&L Regional P&L
Previously
reported
Accounting standard
change - SGARA
Reallocation of
Corporate & IT costsRestated
ANZ 46.7 (1.6) 1.8 46.9
Europe & LATAM 17.2 - - 17.2
Asia 46.5 - (1.5) 45.0
Americas 56.2 (2.4) (2.1) 51.7
Corporate (19.8) - 1.8 (18.0)
TWE EBITS 146.8 (4.0) - 142.8
$Am (unless otherwise stated)Previously
reported
Change in
accounting
standard - SGARA
Reallocation of
Corporate & IT
costs
Restated
Volume (m 9L cases) 15.8 - - 15.8
Net sales revenue 1,079.4 - - 1,079.4
Other Revenue 58.6 - - 58.6
Cost of goods sold (733.7) (4.0) (2.0) (739.7)
Gross profit 404.3 (4.0) (2.0) 398.3
Cost of doing business (257.5) - 2.0 (255.5)
EBITS 146.8 (4.0) - 142.8
SGARA (14.8) 0.3 - (14.5)
EBIT 132.0 (3.7) - 128.3
Net finance costs (7.5) - - (7.5)
Tax expense (36.9) 1.7 - (35.2)
Net profit after tax (before material items) 87.6 (2.0) - 85.6
Material items (after tax) (26.9) - - (26.9)
Non-controlling interests (0.1) - - (0.1)
Net profit after tax 60.6 (2.0) - 58.6
Reported EPS (A¢) 8.8 (0.3) - 8.5
Net profit after tax (before material items and
SGARA)96.6 (2.3) - 94.3
EPS (before material items and SGARA) (A¢) 14.0 (0.3) - 13.7
Average no. of shares (m) 690.7 - - 690.7
Dividend (A¢) 8.0 - - 8.0

2828
Appendix 1: Prior year comparative reconciliation Balance Sheet
Balance sheet as at 31 December 2015 Balance sheet as at 30 June 2016
A$mPreviously
reported
Change in
accounting
standard - SGARA
Restated
Cash & cash equivalents 1,101.2 - 1,101.2
Receivables 593.8 - 593.8
Current inventories 710.9 - 710.9
Non-current inventories 461.0 - 461.0
Property, plant & equipment 961.3 128.7 1,090.0
Agricultural assets 255.5 (219.5) 36.0
Intangibles 812.2 - 812.2
Assets Held for Sale 17.6 - 17.6
Other assets 191.3 - 191.3
Total assets 5,104.8 (90.8) 5,014.0
Payables 509.3 - 509.3
Borrowings 670.9 - 670.9
Provisions 105.9 - 105.9
Other liabilities 212.8 (28.8) 184.0
Total liabilities 1,498.9 (28.8) 1,470.1
Net assets 3,605.9 (62.0) 3,543.9
A$mPreviously
reported
Final purchase
price accounting -
Diageo
Change in
accounting
standard -
SGARA
Restated
Cash & cash equivalents 256.1 - 256.1
Receivables 611.4 - 611.4
Current inventories 904.0 (8.3) - 895.7
Non-current inventories 678.4 - - 678.4
Property, plant & equipment 1,154.5 (13.1) 206.4 1,347.8
Agricultural assets 340.0 (2.2) (302.0) 35.8
Intangibles 1,060.2 41.3 - 1,101.5
Assets Held for Sale 98.8 (30.6) - 68.2
Other assets 273.8 17.8 - 291.6
Total assets 5,377.2 4.9 (95.6) 5,286.5
Payables 725.4 0.9 - 726.3
Borrowings 630.9 0.2 - 631.1
Provisions 80.4 2.7 - 83.1
Other liabilities 305.4 1.1 (29.7) 276.8
Total liabilities 1,742.1 4.9 (29.7) 1,717.3
Net assets 3,635.1 - (65.9) 3,569.2

29
Impact of foreign exchange rate movements & hedging
• The sensitivity of EBITS to 1% change in primary cost and revenue
currencies shown in the accompanying table (excluding potential
impact of currency hedging)
• TWE maintains an active foreign exchange risk management
strategy, focused on the transactional exposures associated with
the Commercial and lower Masstige price segments:
− AUD/GBP: c.70% of 2H17 exposure protected against
appreciation of the exchange rate above 0.54
− AUD/USD: c.50% of 2H17 exposure protected against
appreciation of the exchange rate above 0.79
− Modest hedge positions in place for other currency exposures,
with hedge positions structured to provide significant
participation in favourable exchange rate movements
CFX Impact (A$m)
Currency Underlying Hedging2 Total
AUD/USD and AUD/GBP (20.9) 5.4 (15.5)
Net other currencies 7.0 (0.2) 6.8
1H17 (13.9) 5.2 (8.7)
AUD/USD and AUD/GBP 33.9 (0.8) 33.1
Net other currencies (11.2) - (11.2)
1H16 22.7 (0.8) 21.9
• $(8.7)m adverse constant currency impact in 1H17
(comprising transaction and translation impacts)
• TWE has a diversified portfolio of currency exposures
where production cost currencies and revenue
generating currencies are not matched
‒ $(20.9)m adverse impact from appreciation of
the AUD relative to the main currency pairs
(USD and GBP), offset by $7.0m benefit from
appreciation of TWE’s primary revenue
currencies1
‒ $5.2m relative benefit from hedging in 1H17
versus the prior year ($1.7m gain in 1H17
versus $3.5m loss in the prior year based on
constant currency)
Currency
Pair
Primary
ExposureMovement
EBITS
Sensitivity (A$m)
AUD/USD COGS, EBITS + 1% (1.7)
AUD/GBP COGS, EBITS + 1% (0.6)
CAD/USD NSR + 1% 0.6
EUR/GBP NSR + 1% 0.4
USD/GBP COGS + 1% (0.3)
1. USD relative to the CAD in the Americas, GBP relative to the EUR, SEK and NOK in Europe
1H17 constant currency impact 2H17 EBITS sensitivity and risk management

30
• TWE has a diversified portfolio of currency exposures where
production cost currencies and revenue generating currencies
are not matched
• The map illustrate TWE’s key transactional foreign exchange
flows by region
• Moderate increase to cross border transactional exposures
following Diageo Wine acquisition, with US denominated bulk
wine sourcing for Blossom Hill the key incremental exposure
NZ COO
Australia COO
C. Europe NSR
US COO
S. Africa COO
Norway NSR Sweden NSR
Canada NSR
NZ COO
Australia COO
Italy COO
Americas Europe
USD/CAD
EUR/USD
AUD/USD
NZD/USD
GBP/SEKGBP/NOK
EUR/GBP
GBP/USD
GBP/ZAR
AUD/GBP
NZD/GBP
Asia Pacific
NZ COO
NZ NSR
Note: Asian sales invoiced in AUD and
in some instances USD
Foreign exchange exposures
Note: Asian sales invoiced in AUD and
in some instances USD
ANZ and Asia
EuropeAmericas
Indicate cash flow direction
COO: Country of origin / production
NSR: Net sales revenue

3131
Definitions
Term Definition
Constant currency
Throughout this presentation, constant currency assumes current and prior period earnings of foreign
operations are translated and cross border transactions are transacted at current year exchange
rates
NSR Net sales revenue
EBITDAS Earnings before interest, tax, depreciation, amortisation, material items & SGARA
EBITS Earnings before interest, tax, material items and SGARA
EBIT Earnings before interest, tax and material items
Exchange rates
Average exchange rates used for profit and loss purposes in the 1H17 results are: $A1 = $US 0.7539
(1H16: $A1 = $US 0.7230), $A1 = GBP 0.5902 (1H16 $A1 = GBP 0.4713). Period end exchange
rates used for balance sheet items in 1H17 results are: $A1 = $US 0.7219 (1H16: $A1 = $US
0.7288), $A1 = GBP 0.5887 (1H16: $A1 = GBP 0.4918)
SGARA
Australian accounting standard AASB141 “Agriculture.” From 1 July 2016, changes to AASB 141 will
apply in respect of vine assets. Vines will no longer be recorded at fair value, but will be recorded at
cost and depreciated. Had the standard been applied in F16, depreciation expense would have been
approximately $6.0 million higher. In F17, TWE expects the incremental depreciation charge to be
approximately $15.5 million.
ShipmentShipments refer to volume movement from TWE to a third party off-premise or on-premise distributor
or retailer
Depletion Depletions refer to volume movements from a distributor to an on-premise or off-premise retailer