Treasury Management Strategy 2018-19...3 1.14 The Treasury Management Strategy for 2018-19 also...
37
Appendix J Treasury Management Strategy 2018-19
Transcript of Treasury Management Strategy 2018-19...3 1.14 The Treasury Management Strategy for 2018-19 also...

Appendix J
Treasury Management Strategy 2018-19

1
1 Introduction
CIPFA Treasury Management in the Public Services: Code of Practice and Cross Sectoral Guidance Notes
1.1 CIPFA has defined treasury management as “the management of the
organisation’s investments and cash flows, its banking, money market and capital market transactions; the effective control of the risks associated with those activities; and the pursuit of optimum performance consistent with those risks.”
1.2 The Council has adopted CIPFA’s Treasury Management in the Public Services: Code of Practice and Cross Sectoral Guidance Notes (the Treasury Code). The adoption is included in the Council’s Constitution Part 4 at paragraph 7.7 of the Financial Procedure Rules. CIPFA Prudential Code for Capital Finance in Local Authorities
1.3 The CIPFA Prudential Code for Capital Finance in Local Authorities (the Prudential Code) is a professional code of practice. Local authorities have a statutory requirement to comply with the Prudential Code when making capital investment decisions and carrying out their duties under Part 1 of the Local Government Act 2003 (Capital Finance etc. and Accounts).
1.4 The CIPFA Prudential Code sets out the manner in which capital spending plans should be considered and approved, and in conjunction with this, the requirement for an integrated treasury management strategy.
1.5 Councils are required to set and monitor a range of prudential indicators for capital finance, covering affordability, prudence, capital expenditure, external debt and treasury management, as well as a range of treasury indicators.
Treasury Management Policy Statement
1.6 The Council’s Treasury Management Policy Statement is included in Appendix J-
1. The policy statement follows the wording recommended by the latest edition of the CIPFA Treasury Code.
Treasury Management Practices
1.7 The Council’s Treasury Management Practices (TMPs) set out the manner in
which the Council will seek to achieve its treasury management policies and objectives, and how it will manage and control those activities.
1.8 The Council’s TMPs Schedules cover the detail of how the Council will apply the TMP Main Principles in carrying out its operational treasury activities. They are reviewed annually and approved by the Council’s S151 Officer.

2
The Treasury Management Strategy
1.9 It is a requirement under the Treasury Code to produce an annual strategy report on proposed treasury management activities for the year.
1.10 The Council’s Treasury Management Strategy is drafted in the context of the key
principles of the Treasury Code, as follows:
Public service organisations should put in place formal and comprehensive objectives, policies and practices, strategies and reporting arrangements for the effective management and control of their treasury management activities.
Their policies and practices should make clear that the effective management and control of risk are prime objectives of their treasury management activities and that responsibility for these lies clearly within their organisations. Their appetite for risk should form part of their annual strategy, including any use of financial instruments for the prudent management of those risks, and should ensure that priority is given to security and liquidity when investing funds.
They should acknowledge that the pursuit of value for money in treasury management, and the use of suitable performance measures, are valid and important tools for responsible organisations to employ in support of their business and service objectives; and that within the context of effective risk management, their treasury management policies and practices should reflect this.
1.11 The purpose of the Treasury Management Strategy is to establish the framework
for the effective and efficient management of the Council’s treasury management activity, including the Council’s investment portfolio, within legislative, regulatory, and best practice regimes, and balancing risk against reward in the best interests of stewardship of the public purse.
1.12 The Treasury Management Strategy incorporates:
The Council’s capital financing and borrowing strategy for the coming year.
The Council’s policy on the making of Minimum Revenue Provision (MRP) for the repayment of debt, as required by the Local Authorities (Capital Finance & Accounting) (Amendments) (England) Regulations 2008.
The Affordable Borrowing Limit as required by the Local Government Act 2003.
The Annual Investment Strategy for the coming year as required by the CLG revised Guidance on Local Government Investments issued in 2010.
1.13 The strategy takes into account the impact of the Council’s Medium Term
Financial Plan (MTFP), its revenue budget and capital programme, the balance sheet position and the outlook for interest rates.

3
1.14 The Treasury Management Strategy for 2018-19 also includes the Council’s:
Policy on borrowing in advance of need.
Counterparty creditworthiness policies.
1.15 The main changes from the Treasury Management Strategy adopted in 2017-18 are:
Updates to interest rate forecasts.
Updates to debt financing budget forecasts.
Updates to Prudential and Treasury Indicators.
1.16 The Council regards the successful identification, monitoring and control of risk to be the prime criteria by which the effectiveness of its treasury management activities will be measured. The Treasury Management Scheme of Delegation is shown in Appendix J-2.
2 Current Treasury Management Position
2.1 The Council’s treasury portfolio position at 31 March 2018, with forward projections is summarised below. The table shows the actual external borrowing (the treasury management operations), against the capital borrowing need (the Capital Financing Requirement - CFR), highlighting any over or under borrowing. The CFR is simply the total historic outstanding capital expenditure which has not yet been paid for from either revenue or capital resources. It is essentially a measure of the Council’s underlying borrowing need.
2.2 Any capital expenditure which has not immediately been paid for, will increase
the CFR. The CFR does not increase indefinitely, as the minimum revenue provision (MRP) is a statutory annual revenue charge which broadly reduces the borrowing need in line with each asset’s life. This is shown in graphical form in Appendix J-6. The CFR and borrowing figures include borrowing undertaken or planned for third party loans.

4
£m
2017-18 2018-19 2019-20 2020-21 2021-22 2022-23
Projected
Estimate Estimate Estimate Estimate Estimate
External borrowing
Borrowing at 1 April
527.2 583.9 641.3 677.8 686.3 692.1
Expected change in borrowing
56.7 57.3 36.6 8.4 5.9 7.3
Actual borrowing at 31 March
583.9 641.2 677.9 686.2 692.2 699.4
CFR – the borrowing need (note 1)
692.4 739.3 763.9 759.3 751.8 745.5
Under / (over) borrowing (note 2)
108.5 98.1 86.0 73.1 59.6 46.1
Total Available for Investments at 31 March
Funds Available for Investment (note 3)
0.0 0.0 0.0 0.0 0.0 0.0
Change in Funds Available for Investment
0.0 0.0 0.0 0.0 0.0 0.0
Net borrowing 583.9 641.2 677.9 686.2 692.2 699.4 1 The forecast CFR for 2017-18 is £7.6m less than that included within the Treasury Management Strategy for 2017-18 (£700m) resulting from reductions in expenditure or scheme reprofiling.The increase in the CFR forecast in 2018-19 relates to new elements in the capital programme which are not financed via existing capital (grants, reserves) or revenue resources. 2 The difference between the underlying need to borrow and actual borrowing forecast at 31st March. The CFR has not been fully funded with loan debt as cash supporting the Council’s reserves, balances and cash flow has been used as a temporary measure. This strategy is prudent while investment returns are low and to mitigate against counterparty risk. 3Consequent to maintaining an under borrowed position, the level of funds available for investment will be kept to a minimum whilst ensuring that sufficient liquidity is available to meet expected payments as projected in the Council’s cash flow modelling
Capital Expenditure
2017-18 2018-19 2019-20 2020-21 2021-22 2022-23
Projected Estimate Estimate Estimate Estimate Estimate
£m £m £m £m £m £m
Net financing need for the year
56.7 57.3 36.6 8.4 5.9 7.3

5
2.3 Within the set of prudential indicators there are a number of key indicators to ensure that the Council operates its activities within well defined limits. Among these the Council needs to ensure that its gross borrowing does not, except in the short term, exceed the total of the CFR in the preceding year plus the estimates of any additional CFR for the current and next two financial years. This allows some flexibility for limited early borrowing for future years, but ensures that borrowing is not undertaken for revenue purposes except to cover short term cash flows.
2.4 The S151 Officer reports that the Council complied with this prudential indicator in the current year and does not envisage difficulties for the future. This view takes into account current commitments, existing plans, and the proposals in this budget report.
3 Prospects for Interest Rates
3.1 The Council has appointed Link Asset Services (LAS), formerly known as Capita Asset Services (CAS), as its treasury advisor and part of their service is to assist the Council to formulate a view on interest rates. The following table gives the LAS central view for short term (Bank Rate) and longer fixed interest rates.
Dec-17 Mar-18 Jun-18 Sep-18 Dec-18 Mar-19 Jun-19 Sep-19 Dec-19 Mar-20 Jun-20 Sep-20 Dec-20 Mar-21
Bank Rate 0.50% 0.50% 0.50% 0.50% 0.75% 0.75% 0.75% 0.75% 1.00% 1.00% 1.00% 1.25% 1.25% 1.25%
5yr PWLB Rate 1.50% 1.60% 1.60% 1.70% 1.80% 1.80% 1.90% 1.90% 2.00% 2.10% 2.10% 2.20% 2.30% 2.30%
10yr PWLB View 2.10% 2.20% 2.30% 2.40% 2.40% 2.50% 2.60% 2.60% 2.70% 2.70% 2.80% 2.90% 2.90% 3.00%
25yr PWLB View 2.80% 2.90% 3.00% 3.00% 3.10% 3.10% 3.20% 3.20% 3.30% 3.40% 3.50% 3.50% 3.60% 3.60%
50yr PWLB Rate 2.50% 2.60% 2.70% 2.80% 2.90% 2.90% 3.00% 3.00% 3.10% 3.20% 3.30% 3.30% 3.40% 3.40% 3.2 As expected, the Monetary Policy Committee (MPC) delivered a 0.25% increase
in Bank Rate at its meeting on 2 November. This removed the emergency cut in August 2016 after the EU referendum. The MPC also gave forward guidance that they expected to increase Bank Rate only twice more by 0.25% by 2020 to end at 1.00%. The Link Asset Services forecast as above includes increases in Bank Rate of 0.25% in November 2018, November 2019 and August 2020.
3.3 The overall longer run trend is for gilt yields and Public Works Loan Board (PWLB) rates to rise, albeit gently. It has long been expected, that at some point, there would be a more protracted move from bonds to equities after a historic long-term trend, over about the last 25 years, of falling bond yields. The action of central banks since the financial crash of 2008, in implementing substantial Quantitative Easing, added further impetus to this downward trend in bond yields and rising bond prices. Quantitative Easing has also directly led to a rise in equity values as investors searched for higher returns and took on riskier assets. The sharp rise in bond yields since the US Presidential election in November 2016 has called into question whether the previous trend may go into reverse, especially now the Fed. has taken the lead in reversing monetary policy by starting, in October 2017, a policy of not fully reinvesting proceeds from bonds that it holds when they mature.
3.4 Until 2015, monetary policy was focused on providing stimulus to economic growth but has since started to refocus on countering the threat of rising

6
inflationary pressures as stronger economic growth becomes more firmly established. The Fed. has started raising interest rates and this trend is expected to continue during 2018 and 2019. These increases will make holding US bonds much less attractive and cause their prices to fall, and therefore bond yields to rise. Rising bond yields in the US are likely to exert some upward pressure on bond yields in the UK and other developed economies. However, the degree of that upward pressure is likely to be dampened by how strong or weak the prospects for economic growth and rising inflation are in each country, and on the degree of progress towards the reversal of monetary policy away from quantitative easing and other credit stimulus measures.
3.5 From time to time, gilt yields – and therefore PWLB rates - can be subject to exceptional levels of volatility due to geo-political, sovereign debt crisis and emerging market developments. Such volatility could occur at any time during the forecast period.
3.6 Economic and interest rate forecasting remains difficult with so many external influences weighing on the UK. The above forecasts (and MPC decisions) will be liable to further amendment depending on how economic data and developments in financial markets transpire over the next year. Geopolitical developments, especially in the EU, could also have a major impact. Forecasts for average investment earnings beyond the three-year time horizon will be heavily dependent on economic and political developments.
3.7 The overall balance of risks to economic recovery in the UK is probably to the downside, particularly with the current level of uncertainty over the final terms of Brexit.
3.8 Downside risks to current forecasts for UK gilt yields and PWLB rates – meaning a reduction in the borrowing rates available to the Council - currently include:
Bank of England monetary policy takes action too quickly over the next
three years to raise Bank Rate and causes UK economic growth, and
increases in inflation, to be weaker than we currently anticipate.
Geopolitical risks, especially North Korea, but also in Europe and the Middle
East, which could lead to increasing safe haven flows.
A resurgence of the Eurozone sovereign debt crisis, possibly Italy, due to its
high level of government debt, low rate of economic growth and vulnerable
banking system.
Weak capitalisation of some European banks.
The result of the October 2017 Austrian general election is likely to result in
a strongly anti-immigrant coalition government. In addition, the new Czech
prime minister is expected to be Andrej Babis who is strongly against EU
migrant quotas and refugee policies. Both developments could provide
major impetus to other, particularly former Communist bloc countries, to
coalesce to create a major block to progress on EU integration and

7
centralisation of EU policy. This, in turn, could spill over into impacting the
Euro, EU financial policy and financial markets.
Rising protectionism under President Trump.
A sharp Chinese downturn and its impact on emerging market countries.
3.9 The potential for upside risks to current forecasts for UK gilt yields and PWLB rates– meaning an increase in the borrowing rates available to the Council - especially for longer term PWLB rates include: -
The Bank of England is too slow in its pace and strength of increases in
Bank Rate and, therefore, allows inflation pressures to build up too strongly
within the UK economy, which then necessitates a later rapid series of
increases in Bank Rate faster than we currently expect.
UK inflation returning to sustained significantly higher levels causing an
increase in the inflation premium inherent to gilt yields.
The Fed causing a sudden shock in financial markets through misjudging
the pace and strength of increases in its Fed. Funds Rate and in the pace
and strength of reversal of Quantitative Easing, which then leads to a
fundamental reassessment by investors of the relative risks of holding
bonds, as opposed to equities. This could lead to a major flight from bonds
to equities and a sharp increase in bond yields in the US, which could then
spill over into impacting bond yields around the world.
Investment and borrowing rates
Link Asset Services forecast that investment returns are likely to remain low
during 2018-19 but to be on a gently rising trend over the next few years.
Borrowing interest rates increased sharply after the result of the general
election in June and then also after the September Monetary Policy
Committee (MPC) meeting when financial markets reacted by accelerating
their expectations for the timing of Bank Rate increases. Since then,
borrowing rates have eased back again somewhat. Apart from that, there
has been little general trend in rates during the current financial year. The
policy of avoiding new borrowing by running down spare cash balances has
served well over the last few years. However, this needs to be carefully
reviewed to avoid incurring higher borrowing costs in the future when
authorities may not be able to avoid new borrowing to finance capital
expenditure and/or the refinancing of maturing debt;
There will remain a cost of carry to any new long-term borrowing that
causes a temporary increase in cash balances as this position will, most
likely, incur a revenue cost – the difference between borrowing costs and
investment returns.

8
4 Borrowing Strategy
4.1 The overarching objectives for the Council’s borrowing strategy are as follows:
To manage the Council’s debt maturity profile, leaving no one future year with a disproportionate level of repayments. . (Achieved via short and long term cash flow forecasting in tandem with balance sheet analysis)
To maintain a view on current and possible future interest rate movements, and to plan borrowing accordingly. (Achieved via consultation with treasury advisors and monitoring of other economic commentary to provide sensitivity analysis)
To monitor and review the balance between fixed and variable rate loans against the background of interest rates and the Prudential Indicators. (Achieved via consultation with treasury advisors and monitoring of other economic commentary to provide sensitivity analysis)
Reduce reliance on the PWLB as a source of funding and review all alternative options available, including forward loan agreements. (Achieved via regular communication with money market brokers, financial institutions, and other debt issuers and appraised in conjunction with treasury advisors.)
Support the launch of the UK Municipal Bonds Agency (MBA), as shareholder, and its bond issuance programme. . (Achieved via regular liaison with UKMBA and supply of information on future debt requirements)
Provide value for money and savings where possible to meet budgetary pressures. (Achieved via appraisal of full suite borrowing counterparties and products in conjunction with sensitivity analysis regarding delivery of the capital programme and its impact on the overall CFR)
4.2 The Council is currently maintaining an under borrowed position. This means that the capital borrowing need (the Capital Financing Requirement), has not been fully funded with loan debt as cash supporting the Council’s reserves, balances and cash flow has been used as a temporary measure. This strategy is prudent while investment returns are low and counterparty risk remains elevated.
4.3 The under/internal borrowing position has been maximised during 2017-18, which has resulted in an optimum treasury portfolio generating revenue savings whilst reducing credit risk. Looking forward, projections show that the CFR is increasing over the next 2 – 3 years. At the same time cash backed reserves and balances are projected to fall, therefore new loans, which have been budgeted for, will be required to maintain sufficient operational cash resources.
4.4 To assist with its long term treasury management strategy, the Council has
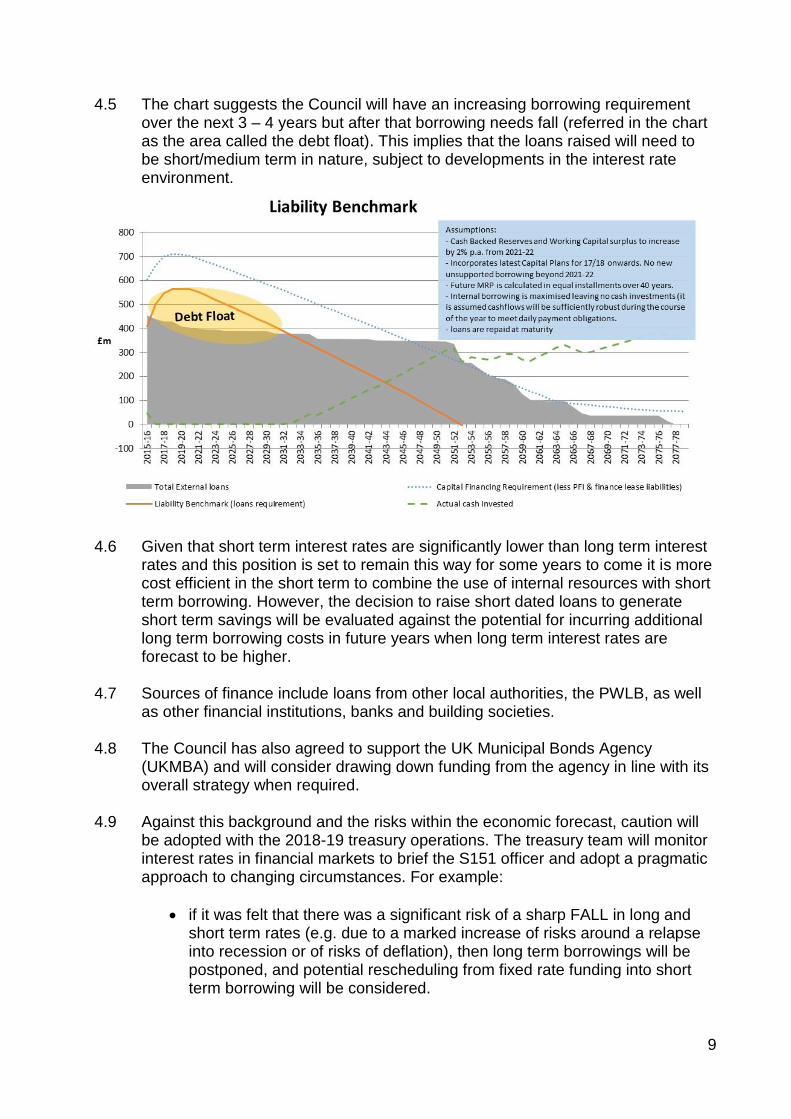
created a Liability Benchmark, which forecasts the Council’s need to borrow over the long term assuming cash balances are kept to a minimum.
9
4.5 The chart suggests the Council will have an increasing borrowing requirement over the next 3 – 4 years but after that borrowing needs fall (referred in the chart as the area called the debt float). This implies that the loans raised will need to be short/medium term in nature, subject to developments in the interest rate environment.
4.6 Given that short term interest rates are significantly lower than long term interest rates and this position is set to remain this way for some years to come it is more cost efficient in the short term to combine the use of internal resources with short term borrowing. However, the decision to raise short dated loans to generate short term savings will be evaluated against the potential for incurring additional long term borrowing costs in future years when long term interest rates are forecast to be higher.
4.7 Sources of finance include loans from other local authorities, the PWLB, as well as other financial institutions, banks and building societies.
4.8 The Council has also agreed to support the UK Municipal Bonds Agency (UKMBA) and will consider drawing down funding from the agency in line with its overall strategy when required.
4.9 Against this background and the risks within the economic forecast, caution will
be adopted with the 2018-19 treasury operations. The treasury team will monitor interest rates in financial markets to brief the S151 officer and adopt a pragmatic approach to changing circumstances. For example:
if it was felt that there was a significant risk of a sharp FALL in long and short term rates (e.g. due to a marked increase of risks around a relapse into recession or of risks of deflation), then long term borrowings will be postponed, and potential rescheduling from fixed rate funding into short term borrowing will be considered.

10
if it was felt that there was a significant risk of a much sharper RISE in long and short term rates than that currently forecast, perhaps arising from an acceleration in the start date and in the rate of increase in central rates in the USA and UK, an increase in world economic activity or a sudden increase in inflation risks, then the portfolio position will be re-appraised. Most likely, fixed rate funding will be drawn whilst interest rates are lower than they are projected to be in the next few years.
Prudential & Treasury Indicator
4.10 There is a requirement under the Local Government Act 2003 for local authorities to have regard to CIPFA’s Prudential Code for Capital Finance in Local Authorities (the “CIPFA Prudential Code”) when setting and reviewing their Prudential Indicators. The Prudential Code for Capital Finance in Local Authorities was updated in 2011.
4.11 A full set of Prudential Indicators and borrowing limits are shown in Appendix J-3. Policy on Borrowing in Advance of Need
4.12 Any decision to borrow in advance will be within forward approved Capital
Financing Requirement estimates, and will be considered carefully to ensure that value for money can be demonstrated and that the Council can ensure the security of such funds.
4.13 Borrowing in advance will be made within the following constraints:
Year Max. Borrowing in advance
Notes
2017-18 100% Borrowing in advance will be limited to no more than the expected increase in borrowing need (CFR) over the period of the approved Medium Term Capital Programme, a maximum of 3 years in advance.
2018-19 50%
2019-20 25%
4.14 Risks associated with any borrowing in advance activity will be subject to prior
appraisal and subsequent reporting through the Council’s reporting mechanism for treasury management and capital financing matters.
4.15 As mentioned within 4.2 the Council is currently maintaining an under borrowed position and, although new funding will be required to meet the net financing need for 2018/19, it is not anticipated that borrowing in advance of need will take place subject to reviewing that value for money can be demonstrated in adopting this position.

11
4.16 The Council will not borrow more than or in advance of its needs to purely profit from the investment of the extra sums borrowed. Debt Rescheduling
4.17 As short term borrowing rates will be considerably cheaper than longer term fixed interest rates, there may be potential opportunities to generate savings by switching from long term borrowing to short term borrowing. However, these savings will need to be considered in the light of the current treasury position and the size of the cost/benefit of any debt repayment (premiums and discounts included).
4.18 The reasons for any rescheduling to take place will include:
the generation of cash savings and/or discounted cash flow savings;
helping to fulfil the treasury strategy; and
enhance the balance of the portfolio (amend the maturity profile and/or the balance of volatility).
4.19 Consideration will also be given to identifying whether there is any residual potential for making savings by running down investment balances to repay debt prematurely as short term rates on investments are likely to be lower than rates paid on current debt.
4.20 All rescheduling will be reported to the Cabinet, at the next scheduled Treasury Management quarterly report following its action.
5 Minimum Revenue Provision
5.1 The Council is required to repay annually an element of it’s total historic outstanding capital expenditure which has not yet been paid for from either revenue or capital resources (the CFR). This is achieved through a revenue charge known as the minimum revenue provision – MRP. It is also allowed to undertake additional voluntary payments if required (voluntary revenue provision - VRP).
5.2 CLG Regulations have been issued which require full Council, upon the recommendation of Cabinet or equivalent committee, to approve an MRP Statement in advance of each year. A variety of options are provided to councils, so long as there is a prudent provision. Following Cabinet recommendation, the Council is recommended to approve the MRP Policy in Appendix J-4 which sets out how MRP will be charged against particular asset types or other forms of expenditure.
5.3 The Council, in conjunction with its Treasury Management advisors, has considered the MRP policy to be prudent.

12
6 Investment Strategy
6.1 Government guidance on Local Government Investments in England requires that an Annual Investment Strategy (AIS) be set. The Guidance permits the Treasury Management Strategy Statement (TMSS) and the AIS to be combined into one document.
6.2 The Council’s general policy objective is to invest its surplus funds prudently. Due to the ongoing uncertainty in the banking sector which has seen institutions fold, it is now felt more appropriate to focus on the safe return of the sums invested. As such the Council’s investment priorities in priority order are:
security of the invested capital;
liquidity of the invested capital; and
the yield received from the investment.
6.3 A copy of the Council’s Investment Strategy is shown in Appendix J-5.
7 Sensitivity of Forecasts and Risk Analysis
Risk Management 7.1 The Council regards the successful identification, monitoring and control of risk to
be the prime criteria by which the effectiveness of its treasury management activities will be measured. Treasury management risks are identified in the Council’s approved Treasury Management Practices. The main risks to the treasury activities are:
Credit and counterparty risk (security of investments)
Liquidity risk (adequacy of cash resources)
Interest rate risk (fluctuations in interest rate levels)
Exchange rate risk (fluctuations in exchange rates)
Refinancing risks (impact of debt maturing in future years)
Legal and regulatory risk (non-compliance with statutory and regulatory requirements)
Fraud, error and corruption, and contingency management (in normal and business continuity situations)
Market risk (fluctuations in the value of principal sums)
7.2 The TMP Schedules set out the ways in which the Council seeks to mitigate
these risks. Examples are the segregation of duties (to counter fraud, error and corruption), and the use of creditworthiness criteria and counterparty limits (to minimise credit and counterparty risk).Council officers, in conjunction with the treasury advisers, will monitor these risks closely.

13
Sensitivity of the Forecast
7.3 The sensitivity of the forecast is linked primarily to movements in interest rates and in cash balances, both of which can be volatile. Interest rates in particular are subject to global external influences over which the Council has no control. In terms of interest rates, with the forecast average investment portfolio of £9m for 2018-19, each 0.1% increase or decrease in investment rates equates to £9k revenue impact.
7.4 Both interest rates and cash balances will be monitored closely throughout the year and potential impacts on the Council’s debt financing budget will be assessed. Action will be taken as appropriate, within the limits of the TMP Schedules and the treasury strategy, and in line with the Council’s risk appetite, to keep negative variations to a minimum. Any significant variations will be reported to Cabinet as part of the Council’s regular budget monitoring arrangements.
8 Reporting Arrangements
8.1 In line with Code full Council is required to receive and approve, as a minimum, three main reports each year, which incorporate a variety of policies, estimates and actuals. These reports are:
a) Annual Treasury Management Strategy
the capital plans (including prudential indicators);
a Minimum Revenue Provision Policy (how residual capital expenditure is charged to revenue over time);
the Treasury Management Strategy (how the investments and borrowings are to be organised) including treasury indicators; and
an Investment Strategy (the parameters on how investments are to be managed).
b) Treasury Management Mid Year Report This will update the Cabinet with the progress of the capital position, amending prudential indicators as necessary, and indicating whether the agreed treasury strategy is meeting the Council’s stated capital financing objectives, or whether any policies require revision.
c) Treasury Management Outturn Report This provides details of a selection of actual prudential and treasury indicators and actual treasury operations compared to the estimates within the strategy.
8.2 In addition, Cabinet will receive quarterly Monitoring Reports in sync with the Council’s other financial monitoring reports. The second and fourth quarter report will go to full Council as described above. The quarterly reports will be subject to the Council’s Scrutiny process.
14
9 Treasury Management Budget
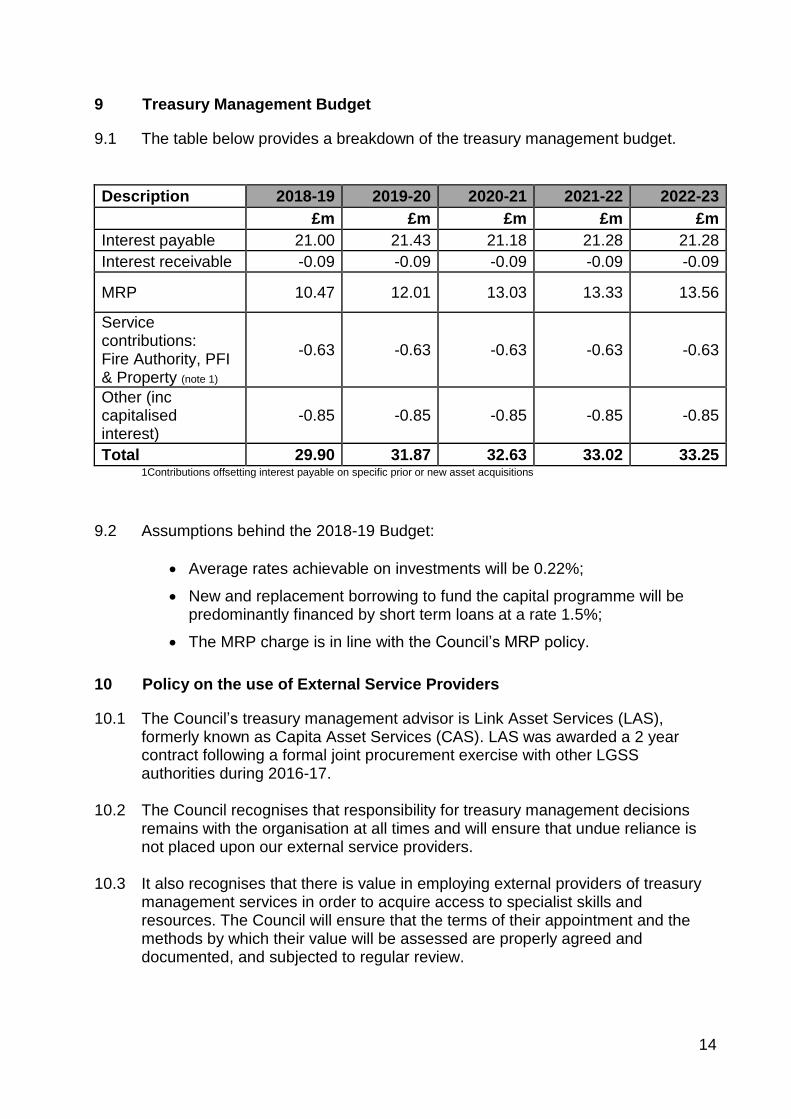
9.1 The table below provides a breakdown of the treasury management budget.
Description 2018-19 2019-20 2020-21 2021-22 2022-23
£m £m £m £m £m
Interest payable 21.00 21.43 21.18 21.28 21.28
Interest receivable -0.09 -0.09 -0.09 -0.09 -0.09
MRP 10.47 12.01 13.03 13.33 13.56
Service contributions: Fire Authority, PFI & Property (note 1)
-0.63 -0.63 -0.63 -0.63 -0.63
Other (inc capitalised interest)
-0.85 -0.85 -0.85 -0.85 -0.85
Total 29.90 31.87 32.63 33.02 33.25 1Contributions offsetting interest payable on specific prior or new asset acquisitions
9.2 Assumptions behind the 2018-19 Budget:
Average rates achievable on investments will be 0.22%;
New and replacement borrowing to fund the capital programme will be predominantly financed by short term loans at a rate 1.5%;
The MRP charge is in line with the Council’s MRP policy.
10 Policy on the use of External Service Providers
10.1 The Council’s treasury management advisor is Link Asset Services (LAS), formerly known as Capita Asset Services (CAS). LAS was awarded a 2 year contract following a formal joint procurement exercise with other LGSS authorities during 2016-17.
10.2 The Council recognises that responsibility for treasury management decisions remains with the organisation at all times and will ensure that undue reliance is not placed upon our external service providers.
10.3 It also recognises that there is value in employing external providers of treasury management services in order to acquire access to specialist skills and resources. The Council will ensure that the terms of their appointment and the methods by which their value will be assessed are properly agreed and documented, and subjected to regular review.

15
11 Future Developments
11.1 Local Authorities are having to consider innovative strategies towards improving service provision to their communities. This approach to innovation also applies to councils’ treasury management activities. The Government has already introduced new statutory powers and regulatory agencies such as CIPFA are introducing policy changes which will have an impact on treasury management approaches in the future. Examples of such changes are: Localism Act
11.2 A key element of the Act is the “General Power of Competence”: “A local authority has power to do anything that individuals generally may do.” The Act opens up the possibility that a local authority can use derivatives as part of their treasury management operations. However the legality of this has not yet been tested in the courts even though CIPFA have set out a framework of principles for the use of derivatives in the Treasury Management Code and guidance notes. The Council has no plans at this point to use financial derivatives under the powers contained within this Act. Loans to Third Parties
11.3 The Council may borrow to make grants or loans to third parties for the purpose of capital expenditure, as allowable under paragraph 25 (1) (b) of the Local Authorities (Capital Financing and Accounting) (England) Regulations 2003 (Statutory Instrument No. 3146). This will usually be to support local economic development, and may be funded by external borrowing.
11.4 The following key projects in this respect are under way:
University of Northampton Energy Centre Loan (£22m) – Fully guaranteed by the UK Government to facilitate the construction of an Energy Centre to provide services to the Waterside Campus.
UK Municipal Bonds Agency
11.5 The Agency raised £6m share capital from 56 local authorities, including
Northamptonshire County Council (£200,000), plus the Local Government Association to launch the UK Municipal Bonds Agency.
11.6 The purpose of the Agency is to issue bonds in the capital markets on behalf of local authorities across the country and at lower rates than available from the PWLB.
11.7 Following completion of Framework Agreement, which sets out the relationship between the Agency and local authority borrowers, including the joint and several guarantee, the Agency now stands ready to start bond issuance. The Agency planned a small amount of borrowing involving a limited number of local authorities in 2017-18 which we are informed will occur shortly. Northamptonshire is not involved in this initial borrowing.

16
Proposals to amend the CIPFA Treasury Management and Prudential Codes
11.8 CIPFA is currently conducting a review of the Treasury Management Code of
Practice and the Prudential Code. This review will particularly focus on non-treasury investments and especially on the purchase of property with a view to generating income. Such purchases could involve undertaking external borrowing to raise the cash to finance these purchases, or the use of existing cash balances. Both actions would affect treasury management. A separate report is required on non-treasury investments to deal with such purchases, their objectives, how they have been appraised, how they have been financed, and what powers were used to undertake these purchases. The TMSS 2018-19 include a high-level summary of the impact on MRP from non-treasury investments such as purchase of property.
N.B. All non-treasury investments and financial guarantees, loans etc are already required to be part of the TMSS for Scottish authorities so this proposal would put English and Welsh authorities into a similar position.
11.9 CIPFA has also indicated in its draft proposals that they will be withdrawing the
following prudential indicators which has caused confusion as to how to calculate them:
Incremental impact of capital investment decisions on council tax.
Estimates of the ratio of financing costs as a percentage of net revenue stream for three years ahead.
Actual ratio of financing costs to net revenue stream (after the year-end).
Q4 of the Prudential Code consultation questionnaire also questioned whether HRA indicators should be removed. These indicators will be retained in TMSS 2018-19 as they are important local indicators. CIPFA have also indicated that they will change the requirement to report on investments for longer than 364 days to longer than 365 days.
Impact of MIFID II reforms from 3 January 2018
11.10 Under MIFID II, all local authorities will be classified as retail counterparties and
will have to consider whether to opt up to professional status and for which types of investments. To ensure the Council maintains access to current trading arrangements it has utilised the CIPFA (PS Link) portal or corresponded directly with dealing platforms and related parties to opt up to professional status where applicable. The Council has met the 3rd January deadline with all applicable counterparties.

17
Impact of IFRS 9 11.11 An important consideration when assessing current and future investment policy
is the implementation of accounting standard IFRS 9 in the 2018-19 Local Authority Code of Practice.
11.12 A key element of the new standard is the move from incurred losses on financial
assets (i.e. an event that has happened) to expected loss ( i.e. the likelihood of loss across the asset lifetime). Whilst this will not impact upon traditional treasury investments materially, the standard also encompasses other investment areas including: loans to third parties, subsidiaries, or longer dated service investments.
11.13 The expected credit loss model requires local authorities to make provision for these potential losses having assessed the asset with regard to the due diligence undertaken prior to investment, the nature of any guarantees, and subsequent regular updates.
11.14 The Council holds the following material loan agreement with third parties:
University of Northampton Energy Centre Loan (£22m) – fully guaranteed by the UK Government to facilitate the construction of an Energy Centre to provide services to the Waterside Campus.
As this loan is underwritten by an explicit government guarantee therefore no provision is required.
11.15 In addition to the above, the new standard requires changes to the recognition and subsequent valuation treatment of certain investment products. These instruments such as property funds and equity funds, but also service investments that give rise to cashflows that are not solely payments of principal and interest (SPPI) on the principal outstanding. The current ability to release valuation gains and losses on these instruments via the Available for Sale reserve is removed. At the point of valuation therefore these nominal gains and losses must be recognised in the current year and therefore potentially impact upon the General Fund balance of the authority.
11.16 At the time of writing this Treasury Management Strategy Statement it remains unclear whether a statutory override will be introduced by the Department for Communities and Local Government (DCLG) to mitigate the risks described above when the final 2018-19 Code of Practice is adopted.
12 Training
12.1 A key outcome of investigations into local authority investments following the credit crisis has been an emphasis on the need to ensure appropriate training and knowledge in relation to treasury management activities, for officers employed by the Council, in particular treasury management staff, and for members charged with governance of the treasury management function.

18
12.2 Link Asset Services run training events regularly which are attended by the Treasury Team. In addition members of the team attend national forums and practitioner user groups.
12.3 Treasury Management training for relevant officers and councillors will be delivered as required to facilitate informed decision making and challenge processes.
13 List of Appendices
Appendix J-1: Treasury Management Policy Statement Appendix J-2: Treasury Management Scheme of Delegation and Role of
Section 151 Officer Appendix J-3: Prudential & Treasury Indicators Appendix J-4: Minimum Revenue Provision (MRP) Policy Statement Appendix J-5: Annual Investment Strategy Appendix J-6: Net Borrowing Graph

19
APPENDIX J-1
Treasury Management Policy Statement
This organisation defines its treasury management activities as: “The management of the organisation’s investments and cash flows, its banking, money market and capital market transactions; the effective control of the risks associated with those activities; and the pursuit of optimum performance consistent with those risks.” This organisation regards the successful identification, monitoring and control of risk to be the prime criteria by which the effectiveness of its treasury management activities will be measured. Accordingly, the analysis and reporting of treasury management activities will focus on their risk implications for the organisation, and any financial instruments entered into to manage these risks. This organisation acknowledges that effective treasury management will provide support towards the achievement of its business and service objectives. It is therefore committed to the principles of achieving value for money in treasury management, and to employing suitable comprehensive performance measurement techniques, within the context of effective risk management.

20
APPENDIX J-2 Treasury Management Scheme of Delegation and Role of Section 151 Officer The Scheme of Delegation Full Council
Approval of annual strategy and mid year update to the Strategy. Approval of the annual Treasury Management report. Approval of the Treasury Management budget.
Cabinet
Approval of the Treasury Management quarterly update reports. Approval of the Treasury Management outturn report.
Scrutiny Committee
Scrutiny of performance against the Strategy. The Treasury Management Role of the Section 151 Officer The S151 (responsible) officer:
recommending clauses, Treasury Management policy/practices for approval, reviewing the same regularly, and monitoring compliance;
submitting regular Treasury Management policy reports;
submitting budgets and budget variations;
receiving and reviewing management information reports;
reviewing the performance of the Treasury Management function;
ensuring the adequacy of Treasury Management resources and skills, and the effective division of responsibilities within the Treasury Management function;
ensuring the adequacy of internal audit, and liaising with external audit; and
recommending the appointment of external service providers.

21
APPENDIX J-3 Prudential and Treasury Indicators
1 The Capital Prudential Indicators 1.1 The Council’s capital expenditure plans are the key driver of Treasury
Management activity. The output of the capital expenditure plans are reflected in prudential indicators, which are designed to assist members’ overview and confirm capital expenditure plans.
1.2 Capital Expenditure. This prudential Indicator shows the Council’s capital
expenditure plans; both those agreed previously, and those forming part of this budget cycle. Capital expenditure excludes spend on PFI and leasing arrangements, which are now shown on the balance sheet.
1.3 The table below summarises the net funding need (borrowing) of the capital
expenditure plans for the Council. Third party loans, classified as capital expenditure, are included within the expenditure.
Capital Expenditure
2017-18 2018-19 2019-20 2020-21 2021-22 2022-23
Projected Estimate Estimate Estimate Estimate Estimate
£m £m £m £m £m £m
Net financing need for the year
56.7 57.3 36.6 8.4 5.9 7.3
1.4 The Council’s Borrowing Need (the Capital Financing Requirement). The second prudential indicator is the Council’s Capital Financing Requirement (CFR). The CFR is the total historical outstanding capital expenditure which has not yet been paid for from either revenue or capital resources. It is a measure of the Council’s underlying borrowing need. Any capital expenditure above, which has not immediately been paid for, will increase the CFR.
1.5 Following accounting changes the CFR includes any other long term liabilities (e.g. PFI schemes, finance leases) brought onto the balance sheet. Whilst this increases the CFR, and therefore the Council’s borrowing requirement, these types of scheme include a borrowing facility and so the Council is not required to separately borrow for these schemes. The CFR below is shown net of these liabilities.

22
2017-18 2018-19 2019-20 2020-21 2021-22 2022-23
Projected Estimate Estimate Estimate Estimate Estimate
£m £m £m £m £m £m
Capital Financing Requirement (1)
Total CFR 692.4 739.3 763.9 759.3 751.8 745.5
Movement in CFR 47.6 46.8 24.6 -4.6 -7.5 -6.3
Movement in CFR represented by
Net financing need for the year (above)
56.7 57.3 36.6 8.4 5.9 7.3
Less Capital Receipts to repay borrowing
0.0 0.0 0.0 0.0 0.0 0.0
Less MRP and other financing movements
9.1 10.5 12.0 13.0 13.4 13.6
Movement in CFR 47.6 46.8 24.6 -4.6 -7.5 -6.3
1 The increased movement in the CFR forecast in 2017-18 and 2018-19 relates to new elements in the capital programme which are not financed via existing capital (grants, reserves ) or revenue resources. 1.6 The Operational Boundary. This is the limit beyond which external borrowing is
not normally expected to exceed. All things being equal, this could be a similar figure to the CFR, but may be lower or higher depending on the levels of actual borrowing undertaken as impacted by the level of current and future cash resources and the shape of the interest rate yield curve.
Operational Boundary
2017-18 2018-19 2019-20 2020-21 2021-22 2022-23
£m £m £m £m £m £m
Total Borrowing 722.4 769.3 793.9 789.3 781.8 775.5
The rise in the Operational Boundary from 2017-18 to 2018-19 reflects the Movement in the CFR (see 1.5) to facilitate additional external borrowing to meet the Council’s capital programme requirements.
1.7 The Authorised Limit for external borrowing. A further key prudential indicator
represents a control on the maximum level of borrowing. This represents a limit beyond which external borrowing is prohibited, and this limit needs to be set or revised by the full Council. It reflects the level of external borrowing which, while not desired, could be afforded in the short term, but is not sustainable in the longer term.
23
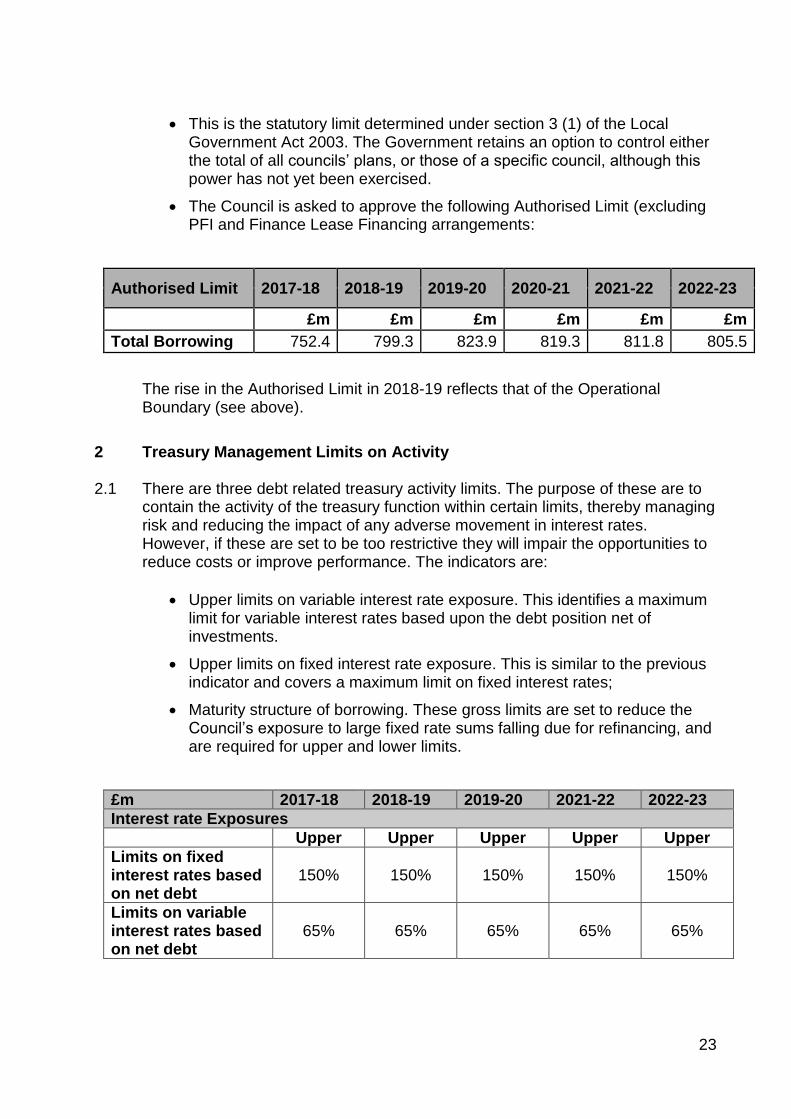
This is the statutory limit determined under section 3 (1) of the Local Government Act 2003. The Government retains an option to control either the total of all councils’ plans, or those of a specific council, although this power has not yet been exercised.
The Council is asked to approve the following Authorised Limit (excluding PFI and Finance Lease Financing arrangements:
Authorised Limit 2017-18 2018-19 2019-20 2020-21 2021-22 2022-23
£m £m £m £m £m £m
Total Borrowing 752.4 799.3 823.9 819.3 811.8 805.5
The rise in the Authorised Limit in 2018-19 reflects that of the Operational Boundary (see above).
2 Treasury Management Limits on Activity 2.1 There are three debt related treasury activity limits. The purpose of these are to
contain the activity of the treasury function within certain limits, thereby managing risk and reducing the impact of any adverse movement in interest rates. However, if these are set to be too restrictive they will impair the opportunities to reduce costs or improve performance. The indicators are:
Upper limits on variable interest rate exposure. This identifies a maximum limit for variable interest rates based upon the debt position net of investments.
Upper limits on fixed interest rate exposure. This is similar to the previous indicator and covers a maximum limit on fixed interest rates;
Maturity structure of borrowing. These gross limits are set to reduce the Council’s exposure to large fixed rate sums falling due for refinancing, and are required for upper and lower limits.
£m 2017-18 2018-19 2019-20 2021-22 2022-23
Interest rate Exposures
Upper Upper Upper Upper Upper
Limits on fixed interest rates based on net debt
150% 150% 150% 150% 150%
Limits on variable interest rates based on net debt
65% 65% 65% 65% 65%

24
The Interest rate exposure is calculated as a percentage of net debt. Due to the mathematical calculation exposures could be greater than 100% or below zero (i.e. negative) depending on the component parts of the formula. The formula is shown below:
Total Fixed (or Variable) rate exposure Total borrowing – total investments
Fixed rate calculation:
(Fixed rate borrowing – Fixed rate investments*) Total borrowing – Total investments
*defined as greater than 1 year to run Variable rate calculation:
(Variable rate borrowing** – variable rate investments**) Total borrowing – Total investments ** Defined as less than 1 year to run to maturity, or in the case of LOBO borrowing, the call date falling within the next 12 months. The Treasury Management Code of Practice Guidance notes requires that maturity is determined by the earliest date on which the lender can require repayment, which in the case of LOBO loans is the next break point. This indicator represents the borrowing falling due in each period expressed as a percentage of total borrowing.
2.2 Affordability Prudential Indicators 2.3 The previous sections cover the overall capital and control of borrowing
prudential indicators, but within this framework prudential indicators are required to assess the affordability of the capital investment plans. These provide an indication of the impact of the capital investment plans on the Council’s overall finances. The Council is asked to approve the following indicators:
2.4 Actual and estimates of the ratio of financing costs to net revenue stream.
This indicator identifies the trend in the cost of capital (borrowing and other long term obligation costs net of investment income) against the net revenue stream. The estimates of financing costs include current commitments and the proposals in this budget report.
Maturity Structure of borrowing 2017-18
Lower Upper Actual Dec 2017
Under 12 months 0% 80% 35%
12 months to 2 years 0% 50% 2%
2 years to 5 years 0% 50% 9%
5 years to 10 years 0% 50% 1%
10 years and above 0% 100% 53%

25
2.5 This is calculated as the estimated net financing costs for the year divided by the amounts to be met from government grants and local tax payers (described in the budget report as the net budget requirements).
2017-18 Estimate
2018-19 Estimate
2019-20 Estimate
2020-21 Estimate
2021-22 Estimate
7.0% 7.0% 7.8% 7.6% 7.6%
2.6 Estimates of the incremental impact of capital investment decisions on
council tax. This indicator identifies the revenue costs associated with proposed changes to the capital programme recommended in this budget report compared to the Council’s existing approved commitments and current plans. The assumptions are based on the budget, but will invariably include some estimates, such as the level of Government support, which are not published over the budget planning period.
2.7 Incremental impact of capital investment decisions on the band D council
tax
2017-18 Estimate
2018-19 Estimate
2019-20 Estimate
2020-21 Estimate
2021-22 Estimate
(£4.94) £7.84 £7.84 £1.09 £2.70
2.8 In addition the Council sets a local affordability indicator. Further information on
the Golden Rule can be found in the Capital Strategy which sets a limit on the annual discretionary capital financing costs as a percentage of net revenue budget.
26
APPENDIX J-4
Minimum Revenue Provision Policy Statement 1 Policy Statement 1.1 The Council is required to make an annual provision from revenue to contribute
towards the reduction in its overall borrowing requirement. This provision is known as the Minimum Revenue Provision (MRP).The Council assess it’s MRP in accordance with the main recommendations contained within the Guidance issued by the Secretary of State under section 21(1A) of the Local Government Act 2003.
1.2 A change in policy was introduced in 2015-16 for the proportion of the provision that relates to the historic debt liability that had accumulated to 31st March 2007. Up until 2014-15 this element of the annual provision was calculated using Option 1 of the Guidance, the “Regulatory Method”, which based the calculation on 4% of the Capital Financing Requirement, amended for Adjustment A, on a reducing balance basis. From 2015-16 this debt liability will be provided for using an annuity calculation methodology, allowable under the DCLG Guidance.
1.3 Capital expenditure incurred from 2007-08 onwards will be subject to MRP in the year after the asset has become operational. MRP will be provided for under Option 3 of the DCLG Guidance and will be based on the estimated useful life of the assets, using the equal annual instalment method.
1.4 Whilst the Council currently uses Option 3 as the method of calculation for any expenditure post 2007-08 it retains the option to change the method which it uses in the future to calculate MRP in order to ensure that the charge for the tax payer is prudent.
1.5 Estimated life periods will be determined under delegated powers. To the extent
that expenditure is not on the creation of an asset and is of a type that is subject to estimated life periods that are referred to in the guidance, these periods will generally be adopted by the Council. However, the Council reserves the right to determine useful life periods and prudent MRP in exceptional circumstances where the recommendations of the guidance would not be appropriate.
1.6 As some types of capital expenditure incurred by the Council are not capable of
being related to an individual asset, asset lives will be assessed on a basis which most reasonably reflects the anticipated period of benefit that arises from the expenditure. Also, whatever type of expenditure is involved, it will be grouped together in a manner which reflects the nature of the main component of expenditure with substantially different useful economic lives.
1.7 Non-operational assets – The Council will not charge MRP on its non
operational assets. MRP will only be charged in the financial year following the asset becoming operational. This policy will be reviewed annually.
1.8 Use of Capital Receipts – The Council may use capital receipts in the year in which they are received to offset the MRP charge for that year. Any unapplied

27
capital receipts will be available in future years and will be applied in a prudent manner.
1.9 Private Finance Initiatives (PFI) and Finance Leases - Any PFI or finance
lease that comes onto the balance sheet via the introduction of the new International Financial Report Standards will already have taken capital financing into account as part of their revenue charges. For this reason they will be excluded from MRP calculations. Prudential indicators will be shown “net of PFI and finance leases”.
1.10 Third party loans – Under statute the payment of the loan will be treated as
capital expenditure. The expenditure will be funded from the capital which will be treated as a capital receipt. As a result MRP will not generally be charged on the loan as it is not appropriate to do so.
1.11 Capitalisation of Interest - MRP will be charged on capitalised interest in line with the Interest Capitalisation policy of the Council.
1.12 Borrowing to Fund Assets with Guaranteed Future Income Streams - One new potential funding source for capital projects identified by central government is tax increment financing (TIF) where future NNDR tax streams from new developments could be used to initially fund those new developments.
1.13 This type of capital expenditure will be financed from future income streams. MRP will not be charged on any cash flow borrowing required to fund expenditure up front where TIF provides a guaranteed future income stream.
1.14 Revenue Funded from Capital Under Statute (REFCUS) - REFCUS will be treated in the same way as other capital expenditure for the purposes of charging MRP, and will be charged based on the estimated useful life of the asset.
1.15 MRP on investment properties – A new MRP policy has been developed to inform the Council on its property investment activities funded from borrowing. Following due diligence in assessing the business case, and with an appreciation of the risks associated, MRP will be applied on investment property as follows:
1. Freehold over 60 years 2. Leasehold property over the term of the lease

28
APPENDIX J-5 Annual Investment Strategy 1 Investment Policy 1.1 The Council’s investment policy has regard to the CLG’s Guidance on Local
Government Investments (“the Guidance”) and the 2011 revised CIPFA Treasury Management in Public Services Code of Practice and Cross Sectoral Guidance Notes (“the CIPFA TM Code”). The Council’s investment priorities will be security first, liquidity second, and then return.
1.2 Investment instruments identified for use in the financial year are listed in section
3.20 under the ‘Specified’ and ‘Non-Specified’ Investments categories. Counterparty limits will be as set through the Council’s Treasury Management Practices – Schedules.
1.3 The use of Credit Ratings:
The Council has established the minimum long-term/short-term and other credit ratings it considers appropriate for each category of investment. Please see specified and non-specified investments in Section 8 for further details.
Building Societies who do not have a colour rating assigned by Link Asset Services will be assessed on the size of their asset base. Any Building Society with an asset base in excess of £2billion will be included, but will be deemed a non-specified investment. Currently Nationwide is the only building society that meets this criterion.
2 Creditworthiness Policy 2.1 The Council applies the creditworthiness service provided by Link Asset
Services. This service employs a sophisticated modelling approach utilising credit ratings from the three main credit rating agencies - Fitch, Moodys and Standard and Poors. The credit ratings of counterparties are supplemented with the following overlays:
credit watches and credit outlooks from credit rating agencies;
credit default swap (CDS) spreads to give early warning of likely changes in credit ratings; and
sovereign ratings to select counterparties from only the most creditworthy countries.
2.2 This modelling approach combines credit ratings, credit watches and credit
outlooks in a weighted scoring system which is then combined with an overlay of CDS spreads for which the end product is a series of colour coded bands which indicate the relative credit worthiness of counterparties. These colour codes are used by the Council to determine the duration for investments. The Council will

29
therefore use counterparties within the following durational bands provided they meet the minimum sovereign rating described in section 3:
Yellow 5 years
Purple 2 years
Blue 1 year (only applies to nationalised or semi nationalised UK Banks)
Orange 1 year
Red 6 months
Green 100 days
No Colour not to be used
2.3 The Link Asset Services creditworthiness service uses a wider array of
information than just primary ratings and by using a risk weighted scoring system, does not give undue preponderance to just one agency’s ratings.
2.4 All credit ratings will be monitored daily. The Council is alerted to changes to
ratings of all three agencies through its use of the Link Asset Services credit worthiness service.
if a downgrade results in the counterparty or investment scheme no longer meeting the Council’s minimum criteria, its further use as a new investment will be withdrawn immediately.
in addition to the use of credit ratings the Council will be advised of information in movements in Credit Default Swap against the iTraxx benchmark and other market data on a weekly basis. Extreme market movements may result in downgrade of an institution or removal from the Council’s lending list.
2.5 Sole reliance will not be placed on the use of this external service. In addition this
Council will also use market data and market information, information on government support for banks and the credit ratings of that government support.
2.6 The S151 Officer has discretion during the year to lift or increase the restrictions on the counterparty list and or to adjust the associated lending limits on values and periods should it become necessary, to enable the effective management of risk in relation to its investments.
3 Sovereign Limits
3.1 Expectation of implicit sovereign support for banks and financial institutions in extraordinary situations has lessened considerably in the last couple of years, and alongside that, changes to banking regulations have focussed on improving the banking sectors resilience to financial and economic stress.

30
3.2 The Council has determined that for 2018-19 it will only use approved counterparties from overseas countries with a sovereign credit rating from the three main ratings agencies that is equal to or above AA-. Banks domiciled in the UK are exempt from this minimum sovereign credit rating, so may be used if the sovereign rating of the UK falls below AA-.
3.3 The list of countries that qualify using these credit criteria as at the date of this report are shown below. This list will be amended by officers should ratings change in accordance with this policy.
AAA Singapore AA
Australia Sweden Abu Dhabi (UAE)
Canada Switzerland France
Denmark Qatar
Germany AA+ UK
Luxembourg Finland
Netherlands Hong Kong AA-
Norway USA Belgium
4 Banking Services 4.1 The Council will continue to use its own bankers for short term liquidity
requirements if the credit rating of the institution falls below the minimum credit criteria. A pragmatic approach will be adopted and monitored closely.
5 Investment Position and Use of Council’s Resources 5.1 The application of resources (capital receipts, reserves etc.) to either finance
capital expenditure or other budget decisions to support the revenue budget will have an ongoing impact on investments unless resources are supplemented each year from new sources (asset sales etc.).
5.2 Investments will be made with reference to the core balances and cash flow
requirements and the outlook for short-term interest rates (i.e. rates for investments up to 12 months).
5.3 The Council is asked to approve the following treasury indicator and limit ‘total principal funds invested for greater than 364 days’. These limits are set with regard to the Council’s liquidity requirements and to reduce the need for early sale of an investment and are based on the availability of funds after each year-end. This indicator is calculated by adding together all investments which have greater than 364 days to run to maturity at a single point in time.

31
5.4 The Council is asked to approve the treasury indicator and limit: -
Maximum principal sums invested > 364 days
£m 2018-19 2019-20 2020-21 2021-22 2022-23
Principal sums invested > 364 days
0.0 0.0 0.0 0.0 0.0
The Council does not expect to have any investments that exceed 364 days.
5.5 For its cash flow generated balances, the Council will seek to utilise its business
reserve accounts, notice accounts, money market funds and short-dated deposits (overnight to three months) in order to benefit from the compounding of interest.
6 Specified Investments
6.1 An investment is a specified investment if all of the following apply:
The investment is denominated in sterling and any payments or repayments in respect of the investment are payable only in sterling;
The investment is not a long term investment (i.e. up to 1 year);
The making of the investment is not defined as capital expenditure by virtue of regulation 25(1)(d) of the Local Authorities (Capital Finance and Accounting) (England) Regulations 2003 [SI 3146 as amended];
The investment is made with a body or in an investment scheme of high credit quality (see below) or with one of the following public-sector bodies:
- The United Kingdom Government; - A local authority in England or Wales (as defined under section 23
of the 2003 Act) or a similar body in Scotland or Northern Ireland; and
- High credit quality is defined as a minimum credit rating as outlined in section 8.2 of this strategy.
7 Non Specified Investments 7.1 Non-Specified investments are defined as those not meeting 6.1 above. 7.2 Lending to third parties
The Council has the power to lend monies to third parties subject to a number of criteria. Any loans to or investments in third parties will be made under the Well Being powers of the Council conferred by section 2 of the Local Government Act 2000 or permitted under any other act.
The Well Being power can be exercised for the benefit of some or all of the residents or visitors to a local authority’s area. The power may also be used to benefit organisations and even an individual.

32
Loans of this nature will be under exceptional circumstances. Loans above £2m will require Cabinet approval. The Section 151 Officer in conjunction with the lead member responsible for finance may approve loans to third parties below this £2m threshold.
The primary aims of the Investment Strategy, in order of priority, are the security of its capital, liquidity of its capital and to obtain a return on its capital commensurate with levels of security and liquidity. These aims are crucial in determining whether to proceed with a potential loan.
Recipients of this type of investment are unlikely to be a financial institution and therefore unlikely to be subject to a credit rating as outlined in section 3. In order to ensure security of the Authority’s capital, extensive financial due diligence must be completed prior to any loan or investment being agreed. The Authority will use specialist advisors to complete financial checks to ascertain the creditworthiness of the third party. Where necessary additional guarantees will be sought. This will be via security against assets and/or through guarantees from a parent company.
8 The use of Specified and Non-Specified Investments 8.1 Investment instruments identified for use in the financial year are as follows:
The tables below set out the types of investments that fall into each category and the limits placed on each of these. A detailed list of each investment type is available in the Treasury Management Practices guidance notes.
Maximum counterparty limits may be temporarily exceeded by small amounts and for very short periods where interest is added by the counterparty to the principal investment amount. In such instances the interest amounts will be withdrawn as soon as reasonably practicable.
The counterparty limit with the Council’s corporate bank (Barclays) may be breached on an overnight basis when cash surpluses are identified after the day’s dealing position is closed. This occurs when the timing for receipt of funds is uncertain, for example the sale of a property. In such instances funds will be withdrawn as soon as reasonably practicable.
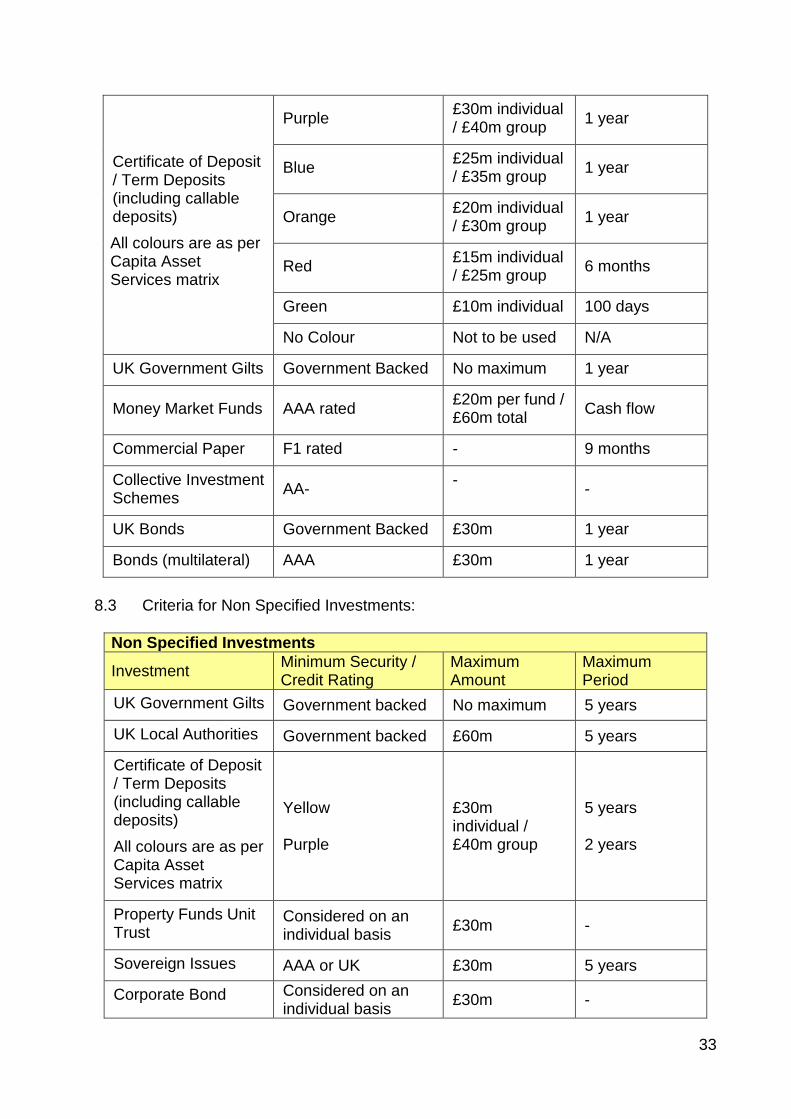
8.2 Criteria for Specified Investments:
Specified Investments
Investment Minimum Security / Credit Rating
Maximum Amount
Maximum Period
Debt Management Agency Deposit Facility (DMADF)
Government backed No maximum 6 months
UK Treasury Bills Government backed No maximum 9 months
UK Local Authorities Government backed £60m 1 year
33
Certificate of Deposit / Term Deposits (including callable deposits)
All colours are as per Capita Asset Services matrix
Purple £30m individual / £40m group
1 year
Blue £25m individual / £35m group
1 year
Orange £20m individual / £30m group
1 year
Red £15m individual / £25m group
6 months
Green £10m individual 100 days
No Colour Not to be used N/A
UK Government Gilts Government Backed No maximum 1 year
Money Market Funds AAA rated £20m per fund / £60m total
Cash flow
Commercial Paper F1 rated - 9 months
Collective Investment Schemes
AA- -
-
UK Bonds Government Backed £30m 1 year
Bonds (multilateral) AAA £30m 1 year
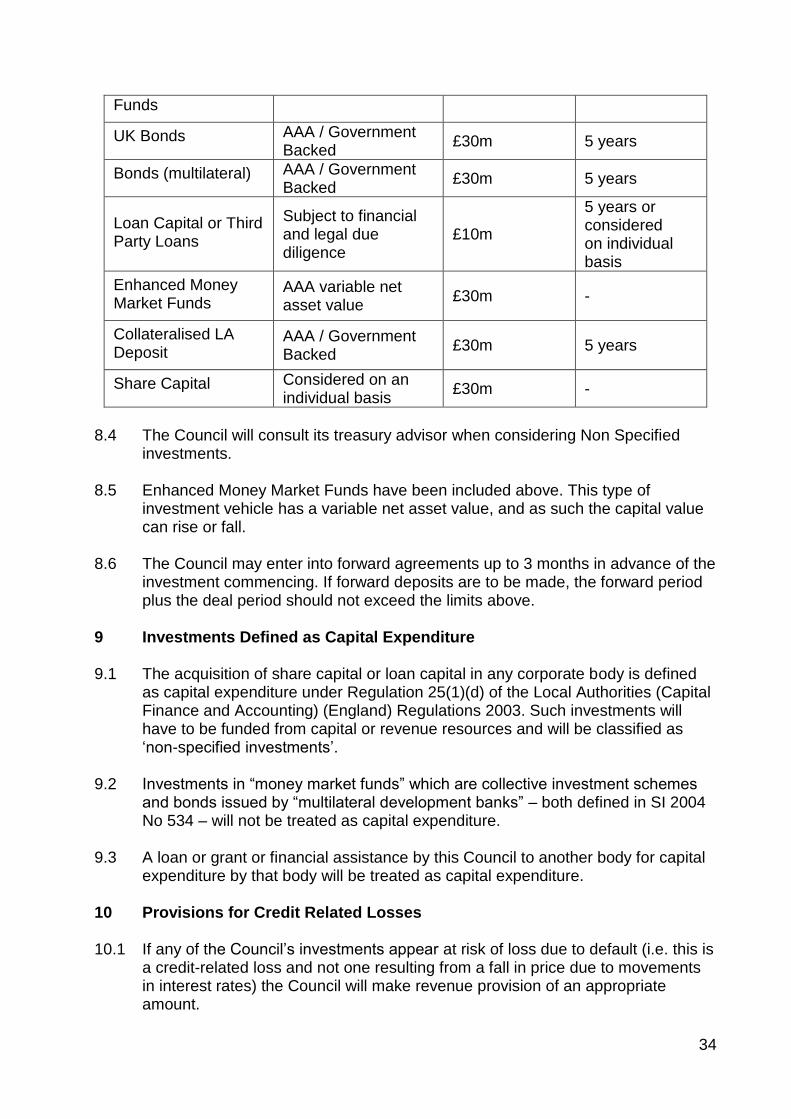
8.3 Criteria for Non Specified Investments:
Non Specified Investments
Investment Minimum Security / Credit Rating
Maximum Amount
Maximum Period
UK Government Gilts Government backed No maximum 5 years
UK Local Authorities Government backed £60m 5 years
Certificate of Deposit / Term Deposits (including callable deposits)
All colours are as per Capita Asset Services matrix
Yellow Purple
£30m individual / £40m group
5 years 2 years
Property Funds Unit Trust
Considered on an individual basis
£30m -
Sovereign Issues AAA or UK £30m 5 years
Corporate Bond Considered on an individual basis
£30m -
34
Funds
UK Bonds AAA / Government Backed
£30m 5 years
Bonds (multilateral) AAA / Government Backed
£30m 5 years
Loan Capital or Third Party Loans
Subject to financial and legal due diligence
£10m
5 years or considered on individual basis
Enhanced Money Market Funds
AAA variable net asset value
£30m -
Collateralised LA Deposit
AAA / Government Backed
£30m 5 years
Share Capital Considered on an individual basis
£30m -
8.4 The Council will consult its treasury advisor when considering Non Specified
investments.
8.5 Enhanced Money Market Funds have been included above. This type of investment vehicle has a variable net asset value, and as such the capital value can rise or fall.
8.6 The Council may enter into forward agreements up to 3 months in advance of the investment commencing. If forward deposits are to be made, the forward period plus the deal period should not exceed the limits above.
9 Investments Defined as Capital Expenditure 9.1 The acquisition of share capital or loan capital in any corporate body is defined
as capital expenditure under Regulation 25(1)(d) of the Local Authorities (Capital Finance and Accounting) (England) Regulations 2003. Such investments will have to be funded from capital or revenue resources and will be classified as ‘non-specified investments’.
9.2 Investments in “money market funds” which are collective investment schemes
and bonds issued by “multilateral development banks” – both defined in SI 2004 No 534 – will not be treated as capital expenditure.
9.3 A loan or grant or financial assistance by this Council to another body for capital
expenditure by that body will be treated as capital expenditure.
10 Provisions for Credit Related Losses 10.1 If any of the Council’s investments appear at risk of loss due to default (i.e. this is
a credit-related loss and not one resulting from a fall in price due to movements in interest rates) the Council will make revenue provision of an appropriate amount.

35
11 End of Year Investment Report 11.1 At the end of the financial year, the Council will report on its investment activity
as part of its Annual Treasury Report. 12 Pension Fund Cash 12.1 The Council will comply with the requirements of The Local Government Pension
Scheme (Management and Investment of Funds) Regulations 2009, which were implemented on 1st January 2010. The Council will not pool pension fund cash with its own cash balances for investment purposes. Any investments made by the pension fund directly with this local authority will comply with the requirements of SI 2009 No 393.

APPENDIX J-6
36