Treasury Economic Report
13
W W W E E E E E E K K K L L L Y Y Y E E E C C C O O O N N N O O O M M MI I I C C C R R R E E E P P P O O O R R R T T T S S S E E E P P P T T T E E E M M MB B B E E E R R R 2 2 2 3 3 3 , , , 2 2 2 0 0 0 1 1 1 1 1 1 D D D E E E P P P A A A R R R T T T M M ME E E N N N T T T O O O F F F F F F I I I S S S C C C A A A L L L P P P O O O L L L I I I C C C Y Y Y Highlights Contents Avg. Daily Turnover; Rs.1.9 Billion Brent Crude Oil: US$ 111.47 per bbl Exchange Rate on 23 rd Sep: US$1=Rs. 110.31 Inflation in August: 7.0 percent (Point to Point) 364 days Treasury Bill Rate: 7.30 percent Tourist Arrivals-Aug: Up by 30 percent Call Money Weekly Average: 8.02 percent Inflation & Exchange Rate ii Interest Rate Movements iii iv Capital Market Inte rnat ion al Commod it Prices v Crude Oil Prices vi Weekly Wholesale Commodity Prices vii Government Debt, External Finance & Tourism ix External Trade x Production xi
Transcript of Treasury Economic Report

8/3/2019 Treasury Economic Report
http://slidepdf.com/reader/full/treasury-economic-report 1/13
W W W EEEEEEKKKLLLYYY EEECCCOOONNNOOOMMMIIICCC RRREEEPPPOOORRRTTT SSSEEEPPPTTTEEEMMMBBBEEERRR 222333 , , , 222000111111DDDEEEPPPAAARRRTTTMMMEEENNNTTT OOOFFF FFFIIISSSCCCAAALLL PPPOOOLLLIIICCCYYY
Highlights Contents
Avg. Daily Turnover; Rs.1.9 Billion
Brent Crude Oil: US$ 111.47 per bbl
Exchange Rate on 23rd Sep: US$1=Rs. 110.31
Inflation in August: 7.0 percent (Point to Point)
364 days Treasury Bill Rate: 7.30 percent
Tourist Arrivals-Aug: Up by 30 percent
Call Money Weekly Average: 8.02 percent
Inflation & Exchange Rate ii
Interest Rate Movements iii
iv
Capital Market
International Commodit Prices v
Crude Oil Prices vi
Weekly Wholesale Commodity Prices vii
Government Debt, External Finance &Tourism
ix
External Trade x
Production xi

8/3/2019 Treasury Economic Report
http://slidepdf.com/reader/full/treasury-economic-report 2/13
ii
TRENDS IN INFLATION
Source: Department of Census and Statistics
CCPI(%)(2006/2007=100)
Core Inflation(%)(2006/2007=100)
Month
Point topoint
AnnualAverage
Pointto
point
Annual
Average
Aug-2010 5.0 4.9 6.0 6.6Sep 5.7 5.3 6.2 6.5
Oct 6.5 5.7 7.2 6.6
Nov 6.9 6.1 7.9 6.7
Dec 6.8 6.2 8.9 7.0
Jan-2011FebMarchAprMay
June JulyAug
6.27.27.78.98.27.17.57.0
6.16.16.26.46.66.77.07.1
6.55.76.67.68.48.78.97.8
6.86.66.66.66.97.17.47.5
Point to point
Annual Average
2
4
6
8
10
J a n
‐ 1 0
F e b
M a r
A p r
M a y
J u n e
J u l y
A u g
S e p
O c t
N o v
D e c
J a n
‐ 1 1
F e b
M a r c h
A p r
M a y
J u n e
J u l y
%
Inflation Trend
Point to
point
Annual Average
2
3
4
5
6
7
8
9
10
Jan -10 Feb Mar Apr May June Ju ly Aug Sep Oct Nov Dec J an -11 Feb Mar ch Apr May June Ju ly
%
Core Inflation Trend
The point to point inflation decreased to 7.0 per cent in August 2011 from 7.5 per cent recorded in July 2011 mainly from pricedecreases in the sub category of food and non alcoholic beverages. The annual average inflation rose slightly to 7.1 per cent in
August 2011 from 7.0 per cent recorded in July 2011. Core inflation that measures the price movements of the items in the CCPbasket excluding fresh food, energy, transport, rice and coconut, decreased to 7.8 per cent in year on year basis and annual averagincreased to 7.5 per cent in August 2011, compared to 8.9 per cent and 7.4 per cent, respectively in the previous month.
INFLATION AND EXCHANGE RATE
1 REAL INTEREST RATES
Sources: Department of Census and Statistics, Central Bank of Sri Lanka
Month CCPI(2006/07=100)
CCPIPoint
toPoint
Change
Annual
Avg Change
91
DaysT BillRate
RealInterest
Rate(Y on
Y)
RealInterest
Rate(Annual
Avg)
Aug-2010 141.4 5.0 4.9 7.55 -2.55 -2.65Sep 142.6 5.7 5.3 7.13 -1.43 -1.83Oct 144.1 6.5 5.7 7.11 -0.61 -1.41Nov 145.7 6.9 6.1 7.29 -0.39 -1.19Dec 147.2 6.8 6.2 7.24 -0.44 -1.04
Jan-2011FebMarAprMay
June) JulyAug
149.2151.3150.6150.6151.5151.2151.7151.3
6.27.27.78.98.27.17.57.0
6.16.16.26.46.66.77.07.1
7.016.976.987.097.107.127.117.11
-0.810.230.721.811.10-0.020.39-0.11
-0.91-0.87-0.78-0.69-0.50-0.42-0.11-0.01
AWDR
TB YeildRate
AnnualAverage
Inflation
0
2
4
6
8
10
12
2 0 1 0 J a n
2 0 1 0 F e b
2 0 1 0 M a r
2 0 1 0 A p r
2 0 1 0 M a y
2 0 1 0 J u n e
2 0 1 0 J u l y
2 0 1 0 A u g
2 0 1 0 S e p
2 0 1 0 O c t
2 0 1 0 N o v
2 0 1 0 D e c
2 0 1 1 J a n
2 0 1 1 F e b
2 0 1 1 M a r
2 0 1 1 A p r
2 0 1 1 M a y
2 0 1 1 j u n e
2 0 1 1 j u n e
%
Declined Interest Rates

8/3/2019 Treasury Economic Report
http://slidepdf.com/reader/full/treasury-economic-report 3/13
iii
INTEREST RATE MOVEMENT
Category
Week
Ending Sep 23,2011
WeekAgo
MonthAgo
Year Ago
Repo 7.00 7.00 7.00 7.25
Reverse Repo 8.50 8.50 8.50 9.00
Call Money Weekly Average 8.02 8.02 7.93 8.52
Treasury Bill (Yield rate)91 Days182 Days364 Days
7.147.227.30
7.117.207.26
7.117.197.25
7.137.177.30
Prime Lending Rate 9.32 9.51 9.36 10.19
Commercial Bank AverageWeighted Deposit Rate (AWDR)
6.40 6.40 6.35 6.86
Call money rates remained between 7.60 per cent and 8.05 per c
during the week. The Commercial Bank Average Weighted Dep
Rate (AWDR) in August averaged at 6.40 per cent. The Pr
Lending Rate stood at 9.32 per cent by week ending 23rd
September 2011. Commercial Bank Average Weighted Pr
Lending Rate for the month of August averaged at 9.43 per cent.
Source: Central Bank of Sri Lanka
MONEY SUPPL
Source: Central Bank of Sri Lanka
July2011
June2011
May2011
Apr2011
Mar2011
July2010
June2010
May2010
Apr2010
Mar2010
Growth 2010/11 Julyto July(%)
M1
(Rs Mn) 433.0 421.0 423.2 423.5 419.1 351.2 348.4 354.6 351.9 362.8 23.29
M2
(Rs Mn) 2,025.9 1,992.5 1,957.1 1,935.7 1,899.8 1,651.0 1,637.9 1,622.3 1,603.3 1,601.0 22.71
M2b
(Rs Mn) 2,312.3 2,270.9 2,239.0 2,212.1 2,176.2 1,916.4 1,881.4 1,875.3 1,868.9 1,851.7 20.66
CONTRIBUTION OF FOOD ITEMS TO THEDECREASE IN CCPI FROM JULY TO AUGUST 2011
MOVEMENTS OF THE CCPI IN FOODITEMS
Commodity Value ChangeRs.cts.
Change %
Food -142.99 -0.34Rice -25.43 -0.06Potatoes 4.83 0.01Coconut -45.93 -0.11Coconut oil -22.15 -0.05Chicken 17.55 0.04Eggs 5.13 0.01
Fish and Sea food 11.34 0.03Mango 15.3 0.04Vegetables -144.16 -0.34Sugar 14.5 0.03Red onions -63.14 -0.15B'onion 31.29 0.07Green chilies -3.43 -0.01Limes 4.39 0.01Other 56.92 0.14
Month %Change
Month toMonth
Inflation
Point to Annual
Point Average
Aug-10 0.3 5.3 5.3
Sep 1.7 7 5.7
Oct 2.3 9.3 6.2
Nov 2.2 10.1 6.7
Dec 2.1 9.9 6.9
Jan-11 2.4 10.2 7.1
Feb 2.7 13.1 7.5Mar -1.5 13.7 8.1
Apr -1.7 14.4 8.7
May 0.5 12.6 9.4
June -1 10.1 1
July -0.8 9.4 10.5
Aug -0.7 8.2 10.7
EXCHANGE RATES
Currency
WeekEnding
23rd
Sep2011
Week
Ago
Month
Ago
Aug
2010
%
Change2010/11
US Dollar 110.31 110.10 109.89 112.55 -1.99
Sterling Pound 169.89 173.97 181.25 176.29 -3.63Euro 149.17 152.54 157.40 150.87 -1.13
Japanese Yen 1.45 1.44 1.44 1.33 9.02
Indian Rupee 2.22 2.32 2.41 2.48 -10.48
Source: Central Bank of Sri LankaRupee appreciated against Sterling Pound, Euro and Indian Rupee whiledepreciated against US Dollar and Japanese Yen during this week.
104.00
106.00
108.00
110.00
112.00
114.00
116.00
118.00
J a n u a r y ‐ 0 9
F e b r u a r y
M a r c h
A p r i l
M a y
J u n e
J u l y
A u g u s t
S e p t e m b e r
O c t o b e r
N o v e m b e r
D e c e m b e r
J a n u a r y ‐ 1 0
F e b r u a r y
M a r c h
A p r i l
M a y
J u n e
J u l y
A u g u s t
S e p t e m b e r
O c t o b e r
N o v e m b e r
D e c e m b e r
J a n u a r y ‐ 1 1
F e b r u a r y
M a r c h
A p r i l
M a y
J u n e
J u l y
A u g u s t
R s p e r U
S $
Exchange Rate Movements 2009‐2011
8/3/2019 Treasury Economic Report
http://slidepdf.com/reader/full/treasury-economic-report 4/13
iv
SHARE MARKE
Source: Colombo Stock Exchange
Week ending 22nd Sep
WeekAgo
YearAgo
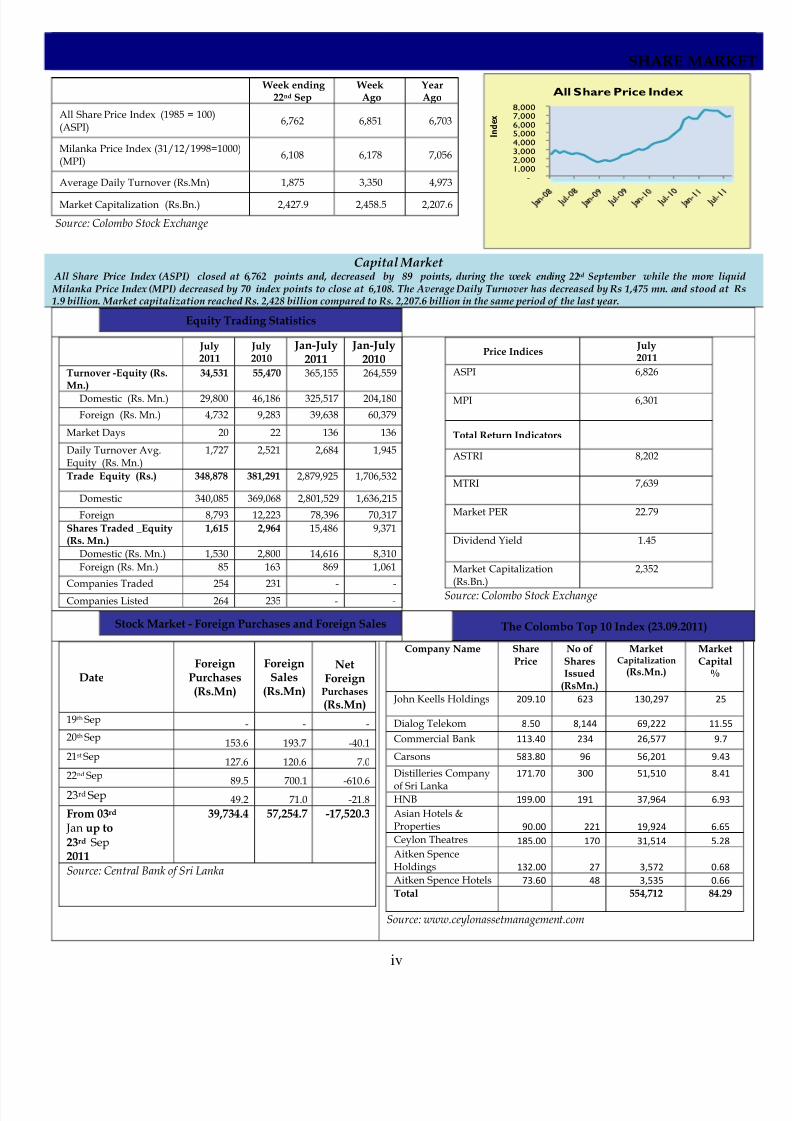
All Share Price Index (1985 = 100)(ASPI)
6,762 6,851 6,703
Milanka Price Index (31/12/1998=1000)(MPI)
6,108 6,178 7,056
Average Daily Turnover (Rs.Mn) 1,875 3,350 4,973
Market Capitalization (Rs.Bn.) 2,427.9 2,458.5 2,207.6
-
1,000
2,000
3,000
4,000
5,000
6,000
7,000
8,000
I n d e x
All Share Price Index
Capital Market All Share Price Index (ASPI) closed at 6,762 points and, decreased by 89 points, during the week ending 22nd September while the more liqui Milanka Price Index (MPI) decreased by 70 index points to close at 6,108. The Average Daily Turnover has decreased by Rs 1,475 mn. and stood at R1.9 billion. Market capitalization reached Rs. 2,428 billion compared to Rs. 2,207.6 billion in the same period of the last year.
Equity Trading Statistics
July2011
July2010
Jan-July2011
Jan-July2010
Turnover -Equity (Rs.Mn.)
34,531 55,470 365,155 264,559
Domestic (Rs. Mn.) 29,800 46,186 325,517 204,180
Foreign (Rs. Mn.) 4,732 9,283 39,638 60,379
Market Days 20 22 136 136
Daily Turnover Avg.Equity (Rs. Mn.)
1,727 2,521 2,684 1,945
Trade Equity (Rs.) 348,878 381,291 2,879,925 1,706,532
Domestic 340,085 369,068 2,801,529 1,636,215
Foreign 8,793 12,223 78,396 70,317Shares Traded _Equity(Rs. Mn.)
1,615 2,964 15,486 9,371
Domestic (Rs. Mn.) 1,530 2,800 14,616 8,310Foreign (Rs. Mn.) 85 163 869 1,061
Companies Traded 254 231 - -Companies Listed 264 235 - -
Price Indices July2011
ASPI 6,826
MPI 6,301
Total Return Indicators
ASTRI 8,202
MTRI 7,639
Market PER 22.79
Dividend Yield 1.45
Market Capitalization
(Rs.Bn.)
2,352
Source: Colombo Stock Exchange
Stock Market - Foreign Purchases and Foreign Sales The Colombo Top 10 Index (23.09.2011)
DateForeign
Purchases(Rs.Mn)
ForeignSales
(Rs.Mn)
NetForeign
Purchases
(Rs.Mn)19th Sep - - -
20th Sep153.6 193.7 -40.1
21st Sep127.6 120.6 7.0
22nd Sep89.5 700.1 -610.6
23rd Sep 49.2 71.0 -21.8
From 03rd Jan up to23rd Sep 2011
39,734.4 57,254.7 -17,520.3
Source: Central Bank of Sri Lanka
Company Name SharePrice
No ofSharesIssued
(RsMn.)
MarketCapitalization
(Rs.Mn.)
MarketCapital
%
John Keells Holdings 209.10 623 130,297 25
Dialog Telekom 8.50 8,144 69,222 11.55
Commercial Bank 113.40 234 26,577 9.7
Carsons 583.80 96 56,201 9.43
Distilleries Company
of Sri Lanka
171.70 300 51,510 8.41
HNB 199.00 191 37,964 6.93
Asian Hotels &Properties 90.00 221 19,924 6.65 Ceylon Theatres 185.00 170 31,514 5.28 Aitken SpenceHoldings 132.00 27 3,572 0.68 Aitken Spence Hotels 73.60 48 3,535 0.66 Total 554,712 84.29
Source: www.ceylonassetmanagement.com

8/3/2019 Treasury Economic Report
http://slidepdf.com/reader/full/treasury-economic-report 5/13
v
COMMODITY PRICES
INTERNATIONAL COMMODITY PRIC
Month
MilkPowderAverage
PriceUS$/MT
GasAverage
PriceUS$/MT
RiceThai,100
%US$/MT
Wheat(HRW)
US$/MT
Jan-10 3,300 736 601 215
Feb-10 3,137 735 575 207
Mar-10 3,175 719 543 206
Apr-10 3,633 718 500 200
May-10 3,962 718 478 196 Jun-10 3,850 670 474 183
Jul-10 3,375 622 466 205
Aug-10 3,150 589 472 268
Sep-10 3,312 644 499 304
Oct-10 3,463 698 509 290Nov-10 3,513 791 541 292
Dec-10 3,550 933 564 290
Jan-11 3,801 924 542 340
Feb-11 4,169 813 554 362
Mar-11 4,592 848 524 332
Apr-11 4,088 886 507 359
May-11 4,075 980 500 362 June-11 3,938 904 518 347
July-11 3,825 843 548 308Aug-11 3,585 870 582 331
Sep-11 n.a. 842 596 356
Source: FAO Web Sites
Gas
Rice
Wheat
0
200
400
600
800
1000
1200
U S $ / M T
Annual Averages Quarterly Averages Monthly Averages
Commodity Unit Jan-Aug
Jan-Dec
Jan-Dec
Apr- Jun
Jul-Sep
Oct-Dec
Jan-Mar
Apr- June
June July Au
2011 2010 2009 2010 2010 2010 2011 2011 2011 2011 2011
Non Energy,Agriculture, Beverages
Cocoa ¢/kg 318.5 313.3 288.9 321 306.2 296.6 334.3 307.4 301.6 316.7 306.4
Coffee, Arabica ¢/kg 619.5 432 317.1 392 468.5 513.8 620.0 636.5 606.2 590.9 595.2
Tea, auctions (3) average ¢/kg 297.4 288.5 272.5 274.5 297.8 303.7 288.7 299.7 301.8 311.7 304.0
Tea, Colombo auctions ¢/kg 331.6 329 313.7 316.1 322.1 342.4 356.3 319.7 311.8 309.6 315.7
Food, Fats & OilsCoconut oil $/mt 1,916 1,124 725 955 1,162 1,546 2,073 1,996 1,803 1,663 1,454
Copra $/mt 1,284 750 480 634 772 1,038 1,379 1,342 1,186 1,121 985
Palm oil $/mt 1,171 901 683 813 873 1,108 1,251 1,147 1,133 1,088 1,083
Grains
Barley $/mt 205.5 158.4 128.3 146.9 161.9 181.1 198.1 209.5 210.1 215.5 206.1
Other Food
Meat, beef ¢/kg 405.0 335.1 263.6 342.4 330.9 353.2 410.0 406.0 390.0 399.0 399.0
Meat, chicken ¢/kg 190.6 172.1 171.7 173 176.0 172.10 188.2 191.0 191.7 192.6 194.3
Sugar, world ¢/kg 58.65 46.93 39.91 34.93 42.94 58.01 62.70 52.56 55.58 62.21 61.18
Raw Materials, Timber
Plywood ¢/sheets 600.9 569.1 564.6 566.3 572.3 580.5 588.5 603.2 607.7 612.7 619.2
Woodpulp $/mt 924.5 867.6 616.2 881.5 916.8 900.8 891.5 942.0 950.4 948.0 940.0
Other Raw Materials
Rubber RSS3, US ¢/kg 531.4 365.4 192.1 372.7 337.5 432.8 573.2 530.1 493.4 473.2 467.6
Fertilizers
Phosphate rock $/mt 177.2 123 121.7 125.0 125.0 140.0 158.3 182.5 182.5 197.5 197.5
TSP $/mt 525.8 381.9 257.4 354.4 388.6 463.8 486.3 544.2 549.5 555.0 560.0
Urea $/mt 404.5 288.6 249.6 237.2 280.4 357.0 353.4 407.9 485.9 474.8 477.5
Metals and Minerals
Aluminum $/mt 2,530 2,173 2,110 2,096 2,090 2,343 2,501 2,611 2,558 2,525 2,379
Gold $/toz 1,500 1,225 973 1,196 1,227 1,367 1,384 1,507 1,529 1,572 1,757
Steel wire rod $/mt 747 712 970 767 678 653 684 782 790 790 790
Source: The World Bank¢= US cent $= US dollars

8/3/2019 Treasury Economic Report
http://slidepdf.com/reader/full/treasury-economic-report 6/13
vi
CRUDE OIL PRICES - SINGAPORE PLATTES PRICES (US$/bb
Sep 23 Sep 22 Sep 21 Sep 20 Sep 19 Week
AgoMonth
AgoYearAgo
Brent (New York ClosingPrices) (US $/bbl.)
111.47 111.51 117.56 116.49 114.99 117.19 109.95 77.88
WTI (US$/bbl.) 79.64 80.16 85.80 86.76 85.67 87.97 86.18 74.71
Singapore Plattes Prices (Refined Petroleum Products) (US $/bbl
Petrol 118.10 119.10 122.88 121.80 123.70 124.51 118.97 80.31
Diesel 119.35 119.85 123.20 123.05 125.05 124.71 122.84 86.74
Kerosene 120.50 120.55 123.65 123.65 125.20 125.41 124.65 87.63
Source: Central Bank of Sri Lanka
CRUDE OIL PRICES (Monthly Averag
Month WTI European Market
(US$/bbl)Brent (US$/bbl)
Jan-2010 78.32 76.73
Feb 76.38 74.07Mar 80.97 78.90Apr 84.38 84.59May 73.71 75.69
June 72.91 72.46 July 76.13 76.23Aug 71.52 72.79
Sep 75.23 78.25Oct 82.17 83.97Nov 84.23 85.91Dec 89.12 92.24
Jan -2011 89.25 97.33FebMarAprMay
June JulyAugSep*
88.63102.86109.45102.21101.54
97.1986.3286.69
103.70115.39124.41117.54116.85
117.35111.14116.37
2009
2010
2011
30
50
70
90
110
130
Jan Feb Mar Apr May Jun Jul Aug Sep Oct Nov Dec
U S $ b n
Brent Crude Oil Prices
Oil prices have been volatile since second half of 2010 and reached US $ 116.37 /bbat 23rd Sep. The increase in prices has mainly driven by geo-political issues in
Middle East and the North Africa at the beginning of the year. The recent fall in prices could be mainly attributed to concerns about sovereign risk of some Europcountries, concerns over the US economy and the possible slowdown of the growth
global economy..
* Up to 23rd Sep 2011 Source: Central Bank of Sri Lanka
MONTHLY AVERAGE REFINED PRODUCT PRICES – 2010/2011 Singapore Plattes Prices (US$/b
* Up to 23rd Sep 2011Source: Central Bank of Sri Lanka
Month Petrol Diesel Kerosene
Jan-2010 84.80 84.30 85.97
Feb 83.72 82.52 82.46Mar 88.54 87.23 86.75
Apr 91.80 94.60 94.54
May 83.34 87.96 88.14
June 79.56 83.93 85.13 July 80.48 84.83 85.45
Aug 80.67 80.85 86.93
Sep 80.60 87.06 87.87Oct 87.07 92.93 93.97
Nov 91.26 96.66 97.41
Dec 100.19 102.84 103.73
Jan -2011
FebMarAprMay
June JulyAugSep*
104.24
109.78115.39128.25123.91
121.90123.54119.84123.50
108.16
117.51130.68137.91127.47126.70128.38123.04123.94
109.76
120.21132.25138.67128.54127.76129.17124.93124.61
30
50
70
90
110
130
150
U S $ p e r b b l
Refined Petrol Prices

8/3/2019 Treasury Economic Report
http://slidepdf.com/reader/full/treasury-economic-report 7/13
vii
WEEKLY WHOLESALE COMMODITY PRIC
Pettah Market
Dambulla Mark Week Ending –21st Sep 2011 (Rs /K
Average Wholesale Prices
WeekEnding 22/09/11
WeekAgo
MonthAgo
YearAgo
Rice (Rs/Kg)SambaKekulu (Red)
58.5046.00
60.5045.00
60.5047.75
64.2952.70
VegetableBeansCabbageCarrotsTomatoesPumpkinsSnake GourdBrinjalsAsh Plantains
100.0030.0080.0060.0050.0050.0030.0050.00
80.0035.0060.0018.0020.0020.0025.0040.00
101.2525.6351.2517.5019.5023.7535.0035.00
97.7848.8782.6372.1130.6641.6245.1660.79
Red-Onions (Local)Potatoes (N’Eliya)Dried Chilies
(Imported)Dhal (Indian)Eggs (Red) (Each)Coconut (Each)
82.5085.00
253.00
100.009.80
32.00
77.50112.50250.00
95.009.30
29.00
61.25103.33251.50
106.2511.0632.00
94.0183.14
160.89
135.8512.7528.42
Fish (Rs/Kg)
KelawallaBalayaSalayaParaw (Small)
380.00255.00120.00500.00
418.00270.00140.00675.00
387.50272.50137.50462.50
326.54224.78105.68371.57
Item WeekEnding 23/09/11
WeekAgo
MonthAgo
YearAgo
SambaSudu KekuluRaw RedNadu
51.7341.8542.5044.50
52.6441.7042.6745.65
53.1046.0342.1047.88
64.1255.6254.3556.31
Source: Central Bank of Sri Lanka
Food Item Wholesale(Average)
Rice (Rs/Kg)SambaKekulu (Red)
54.0041.00
VegetablesPumpkinsSnake GourdAsh PlantainsBeansCarrotsTomatoes
42.1324.2538.7571.0056.6328.50
Other Foods
Potatoes (N’Eliya)Dried Chilies (Imported)Red-Onions (Local)Coconut (Each)
86.50251.3876.2525.25
Marandagahamula Average Price of Rice (Rs /K g)
Source: Central Bank of Sri Lanka
The wholesale prices of Samba, Raw Red and Nadu further decreased during this week. The wholesale prices of most vegetable varieincreased against previous week while the prices of most fish varieties decreased. Prices of other commodities, such as Red -Oni(Local), Dhal, Coconut and dried chilies, increased during the corresponding period.
WEEKLY RETAIL COMMODITY PRICES

8/3/2019 Treasury Economic Report
http://slidepdf.com/reader/full/treasury-economic-report 8/13
viii
WEEKLY RETAIL COMMODITY PRICES - 03rd Week of September 201Colombo Rs.
ItemUnit
This Week
PriceRange
WeekAgo
MonthAgo
YearAgo
RiceSamba(Avg.) 1 kg 65.42 54.00-72.00 66.07 65.99 65.11
No. 1 1 kg 68.29 65.00-72.00 68.55 68.21 68.23No. 2 1kg 62.55 54.00-70.00 63.60 63.76 61.99
Nadu Red 1kg 60.09 55.00-65.00 59.68 59.53 60.41
Raw Red (Avg) 1kg 53.10 43.00-60.00 54.56 54.26 52.09No. 1 1kg 56.11 55.00-60.00 58.40 57.33 55.22
No. 2 1kg 50.09 43.50-60.00 50.71 51.18 48.96Wheat Flour 1 kg 84.60 80.00-90.00 85.17 85.15 74.17
Bread 450g 48.96 45.00-50.00 48.95 48.95 42.10Sugar 1 kg 97.12 93.00-100.00 97.02 97.37 89.41
Anchor 400g 264.00 264.00-264.00 264.00 264.00 244.00Potatoes (Impor) 1 kg 101.92 80.00-120.00 105.38 87.78 80.18Potatoes (Local) 1kg 120.87 100.00-140.00 125.72 134.73 104.85Red Dhal 1kg 133.71 110.00-160.00 137.17 141.02 157.49
Cowpea (Avg) 1kg 229.76 200.00-280.00 229.79 230.65 180.30Gree Gram(Avg) 1kg 180.51 160.00-200.00 183.19 190.05 222.14
Kadalai (Avg) 1kg 208.58 160.00-250.00 210.67 211.47 156.27Meat
Beef 1kg 466.84 450.00-500.00 465.00 458.00 451.92
Chicken
Fresh 1kg 487.00 450.00-500.00 477.00 453.64 483.28Broiler 1kg 350.00 350.00-350.00 350.00 350.00 351.53
Fresh FishParaw 1 kg 736.19 600.00-800.00 725.00 734.50 716.77Balaya 1 kg 476.47 400.00-560.00 464.29 485.83 466.87
Kelawalla 1 kg 652.22 490.00-720.00 657.08 691.92 635.36Salaya 1 kg 158.15 120.00-200.00 166.67 159.94 150.29
Dried Fish
Sprats 1 kg 373.59 300.00-400.00 373.19 380.78 363.02
Eggs Each 10.74 9.00-13.00 10.06 11.43 15.20Coconut Each 34.48 25.00-45.00 34.99 34.66 32.36Coconut Oil 750ml 172.17 150.00-200.00 164.07 183.24 158.19Red Onions 1 kg 110.25 90.00-120.00 109.62 97.59 90.68
B- Onions (Impo) 1 kg 71.00 70.00-72.00 72.38 95.91 75.99Brinjal 1kg 71.54 60.00-98.00 78.27 72.31 89.26
Beans Green 1 kg 117.23 110.00-140.00 116.59 131.19 125.79Cabbage 1 kg 63.41 50.00-80.00 65.27 65.20 98.97Leeks 1 kg 61.33 40.00-80.00 60.63 69.33 115.71
Beet Root 1kg 74.24 60.00-100.00 74.51 75.19 89.75
Carrot 1kg 87.46 60.00-100.00 87.39 82.44 97.47
Tomatoe 1kg 69.70 50.00-80.00 64.10 54.23 106.27
Radish 1kg 68.81 50.00-80.00 68.29 67.81 69.01
Vetakolu 1kg 76.90 60.00-80.00 78.06 76.37 92.79
Snake Gourd 1kg 70.23 50.00-80.00 68.51 68.19 74.92
Bandakka 1kg 89.00 70.00-100.00 86.68 77.82 91.91
Kolikuttu Each 15.11 12.00-18.00 14.72 15.00 14.86
Papaw 1kg 67.59 60.00-80.00 78.63 92.27 51.74
Pineapple 1kg 94.37 75.89-127.00 105.05 104.42 125.62
Kerosene oil 1 liter 61.00 61.00 61.00 61.00 51.00
Diesel (CPC) 1 liter 76.00 76.00 76.00 76.00 73.00Petrol 1 liter 125.00 125.00 125.00 125.00 115.00
Gas (Litro) 12.5kg 2046.00 2046.00 2046.00 1890.00 1550.00
Source: Department of Census and Statistics
64.5
65
65.5
66
66.5
Year Ago MonthAgo
Week Ago This week
R s p e r k g .
Rice Prices
120125130135140145150155160
Year Ago Month Ago Week Ago This wee
R s p e r k g .
Average Retail Prices of Dhal
405060708090
100110120130140
Year Ago Month Ago Week Ago This week
R s p e r k g .
Retail Prices of Potatoes
Potatoes (Local)
Potatoes (Imported)
The average retail prices of most ricevarieties declined further during this week.Prices of most of the vegetables remainedmixed performance. Most fresh fish varietiesretail prices have mixed performance.
8/3/2019 Treasury Economic Report
http://slidepdf.com/reader/full/treasury-economic-report 9/13
ix
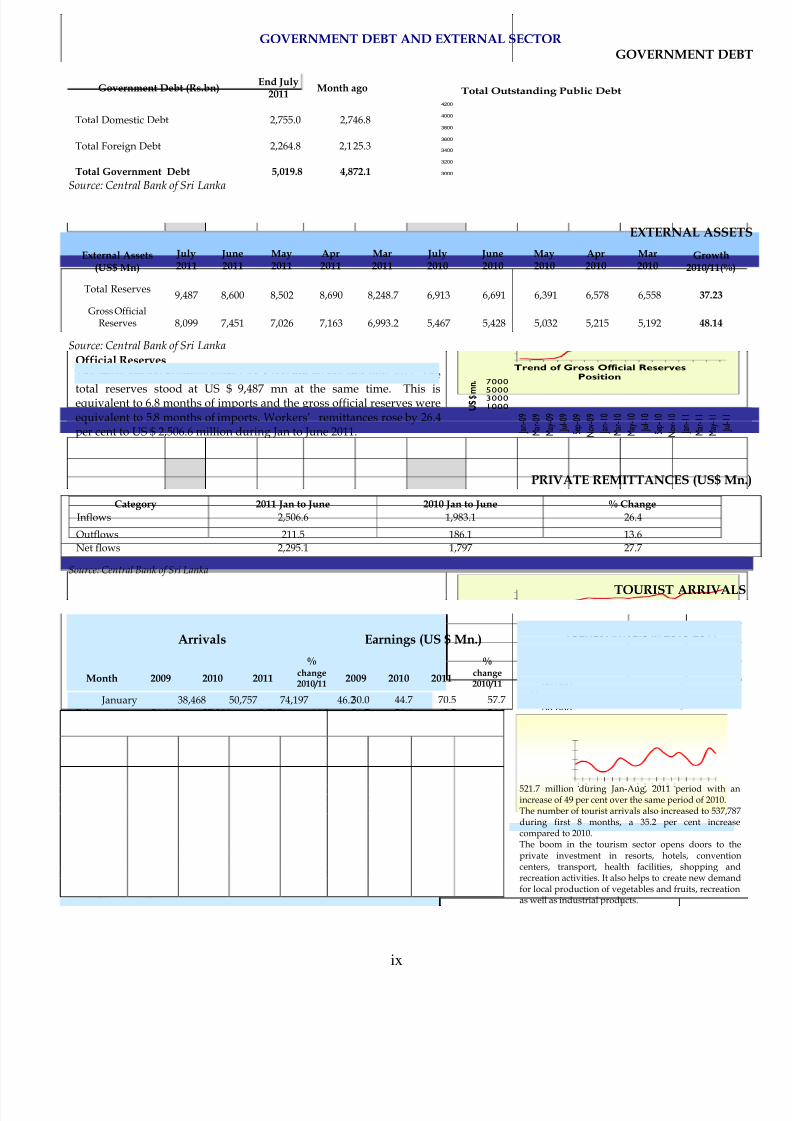
Category 2011 Jan to June 2010 Jan to June % Change
Inflows 2,506.6 1,983.1 26.4
Outflows 211.5 186.1 13.6
Net flows 2,295.1 1,797 27.7
Source: Central Bank of Sri Lanka
TOURIST ARRIVAL
Source: Sri Lanka Tourism Development Authority.* Change in first eight months
Arrivals Earnings (US $ Mn.)
Month 2009 2010 2011
%change2010/11
2009 2010 2011
%change 2010/11
January 38,468 50,757 74,197 46.230.0 44.7 70.5 57.7February 34,169 57,300 65,797 14.8 26.7 50.4 62.5 24.0March 34,065 52,352 75,130 43.51 26.5 46.1 76.2 65.3April 26,054 38,300 63,835 66.67 20.4 33.7 61.9 83.7May 24,739 35,213 48,943 38.99 19.3 31.0 47.0 51.6
June 30,234 44,730 53,636 19.0023.5 39.3 52.0 32.3
July 42,227 63,339 83,786 32.2833.0 55.8 81.3 45.7August 41,207 55,898 72,463 29.63 32.1 49.1 70.3 43.2September 37,983 47,339 30.2 41.7October 37,571 52,370 28.7 46.1November 44,311 72,251 34.6 63.6December 56,862 84,627 79.1 74.4
Total 447,890 654,476 537,787 35.2* 349.5 575.9 521.7 49.0*
20,000
40,000
60,000
80,000
100,000
J a n u
F e
b r
M a r c
h
A p r i l
M a y
J u n e
J u
l y
A u g u s
t
S e p
t
O c
t o
N o v e
D e c e
J a n u
F e
b r
M a r c
h
A p r i l
M a y
J u n e
J u
l y
A u g u s
t
N o .
Tourist Arrivals in 2010-2011
Tourism
Tourism sector enjoyed with total earnings of US $521.7 million during Jan-Aug, 2011 period with anincrease of 49 per cent over the same period of 2010.The number of tourist arrivals also increased to 537,787during first 8 months, a 35.2 per cent increasecompared to 2010.The boom in the tourism sector opens doors to theprivate investment in resorts, hotels, conventioncenters, transport, health facilities, shopping andrecreation activities. It also helps to create new demandfor local production of vegetables and fruits, recreationas well as industrial products.
GOVERNMENT DEBT AND EXTERNAL SECTOR
GOVERNMENT DEB
Government Debt (Rs.bn)End July
2011Month ago
Total Domestic Debt 2,755.0 2,746.8
Total Foreign Debt 2,264.8 2,125.3
Total Government Debt 5,019.8 4,872.1
Source: Central Bank of Sri Lanka
Total Outstanding Public Debt
3000
3200
3400
3600
3800
4000
4200
EXTERNAL ASSET
External Assets(US$ Mn)
July2011
June2011
May2011
Apr2011
Mar2011
July2010
June2010
May2010
Apr2010
Mar2010
Growth2010/11(%)
Total Reserves9,487 8,600 8,502 8,690 8,248.7 6,913 6,691 6,391 6,578 6,558 37.23
Gross OfficialReserves 8,099 7,451 7,026 7,163 6,993.2 5,467 5,428 5,032 5,215 5,192 48.14
Source: Central Bank of Sri Lanka
Official ReservesThe gross official reserves were US$ 8,099 mn by the end July 2011. The
total reserves stood at US $ 9,487 mn at the same time. This isequivalent to 6.8 months of imports and the gross official reserves wereequivalent to 5.8 months of imports. Workers’ remittances rose by 26.4per cent to US $ 2,506.6 million during Jan to June 2011.
100030005000
7000
J a n - 0 9
M a r - 0 9
M a y - 0 9
J u l - 0 9
S e p - 0 9
N o v - 0 9
J a n - 1 0
M a r - 1 0
M a y - 1 0
J u l - 1 0
S e p - 1 0
N o v - 1 0
J a n - 1 1
M a r - 1 1
M a y - 1 1
J u l - 1 1
U S $ m
n .
Trend of Gross Official Reserves
Position
PRIVATE REMITTANCES (US$ Mn
8/3/2019 Treasury Economic Report
http://slidepdf.com/reader/full/treasury-economic-report 10/13
x
EXTERNALTRADE
Category July2011
(US$ Mn)
July2010
(US$ Mn)
GrowthRate
(%)
Jan-July2011
Cumulative(US$ Mn.)
Jan-July2010
Cumulative(US$ Mn.)
Growth
2010/11(%)
Exports957.56 875.55 9.37 6,014.38 4,617.22 30.26
Agricultural 205.39 213.07 -3.60 1,333.92 1,172.30 13.79Tea 127.67 153.23 -16.68 832.31 802.40 3.73
Other 77.72 59.84 29.88 501.61 369.90 35.61Industrial 743.46 655.72 13.38 4,606.99 3,390.37 35.88
Food, Beverages and Tobacco52.12 55.43 -5.97 340.28 314.90 8.06
Textiles and Garments 385.37 367.05 4.99 2,405.03 1,866.45 28.86Rubber products
80.73 62.88 28.39 492.21 283.90 73.37Diamond and Jewellery
44.75 23.87 87.47 218.91 185.70 17.88Other
180.49 146.49 23.21 1,150.50 739.42 55.59Mineral 8.70 6.76 28.70 73.40 54.51 34.65Unclassified 0.01 0.01 0.00 0.07 0.05 40.00
Imports1,777.02 1,123.54 58.16 11,091.20 7,477.24 48.33
Consumer goods341.03 245.18 39.09 2,432.22 1,583.65 53.58
Food & Drink 162.05 131.85 22.90 1,285.19 1,019.35 26.08Other Consumer Goods
178.97 113.33 57.92 1,147.03 564.30 103.27Motor Cars & Cycles 87.29 50.67 72.27 574.74 186.41 208.32
Intermediate goods999.28 632.49 57.99 6,177.17 4,200.85 47.05
Petroleum441.86 187.46 135.71 2,492.63 1,788.42 39.38
Fertilizer53.59 20.01 167.82 204.69 144.24 41.91
Chemicals39.30 29.71 32.28 286.73 219.06 30.89
Textiles & Clothing176.37 161.37 9.30 1,290.60 902.48 43.01
Diamonds49.73 37.41 32.93 241.20 155.67 54.94
Other Intermediate Goods238.43 196.53 21.32 1,661.32 990.98 67.64
Investment goods 383.83 236.73 62.14 2,398.98 1,553.40 54.43Machinery & Equipment
178.18 99.06 79.87 1,085.90 618.09 75.69Transport Equipment
53.47 50.01 6.92 475.54 317.97 49.55Building Materials
104.65 62.43 67.63 589.57 451.24 30.66Other Investment Goods 47.52 25.23 88.35 247.96 166.10 49.28
Unclassified 52.88 9.15 477.92 82.83 139.35 -40.56Trade Balance -819.46 -247.99 230.44 -5,076.82 -2,860.02 77.51
Source: Central Bank of Sri Lanka
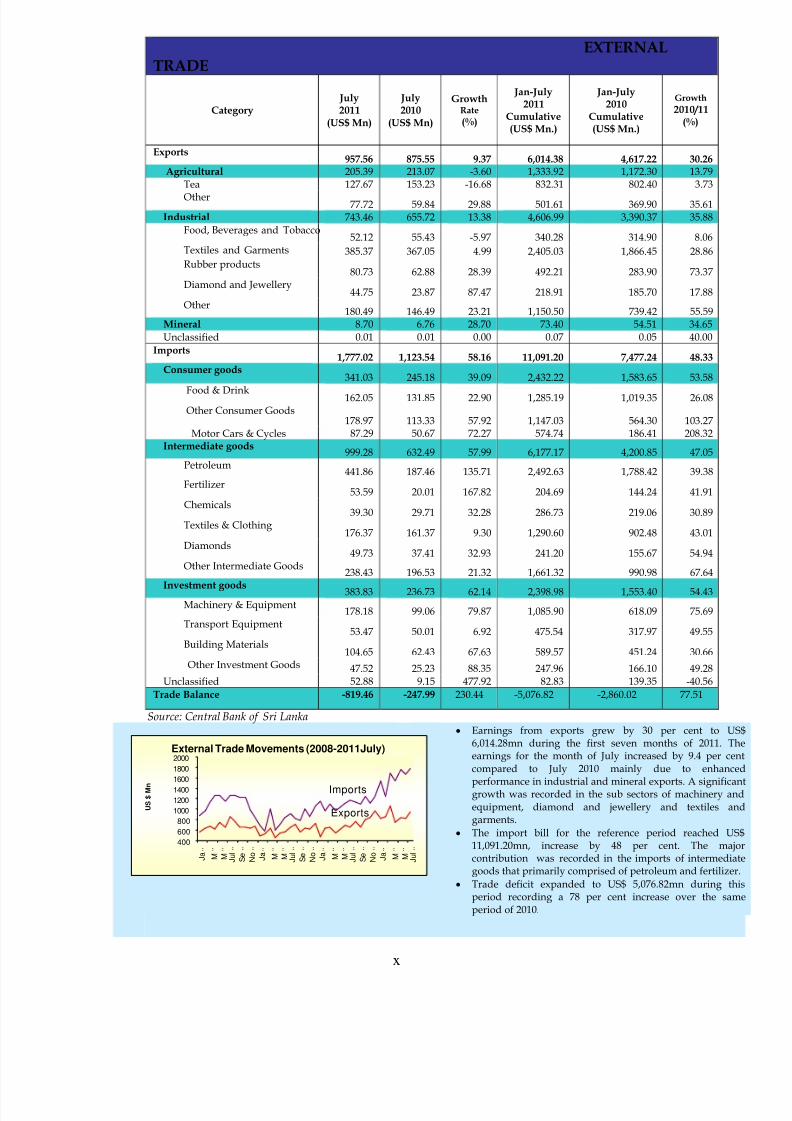
• Earnings from exports grew by 30 per cent to US6,014.28mn during the first seven months of 2011. Thearnings for the month of July increased by 9.4 per cencompared to July 2010 mainly due to enhance
performance in industrial and mineral exports. A significangrowth was recorded in the sub sectors of machinery andequipment, diamond and jewellery and textiles angarments.
• The import bill for the reference period reached US11,091.20mn, increase by 48 per cent. The majocontribution was recorded in the imports of intermediatgoods that primarily comprised of petroleum and fertilizer.
• Trade deficit expanded to US$ 5,076.82mn during thiperiod recording a 78 per cent increase over the samperiod of 2010.
Exports
Imports
400
600
800
1000
1200
14001600
1800
2000
J a M M J
u l
S e
N o
J a M M J
u l
S e
N o
J a M M J
u l
S e
N o
J a M M J
u l
U S $ M n
External Trade Movements (2008-2011July)

8/3/2019 Treasury Economic Report
http://slidepdf.com/reader/full/treasury-economic-report 11/13
xi
PRODUCTION
QUARTERLY GDP GROWTH (%)
1st Q 2nd Q 3rd Q 4th Q Annual
2005 5.2 6.4 6.9 6.4 5.6 Agriculture (1.3) 1.7 4.6 2.8 11.0
Industry 8.6 6.8 7.7 8.8 23.7
Service 5.2 7.3 7.0 6.0 14.82006 7.8 7.7 7.7 7.4 6.9
Agriculture 9.8 5.6 4.0 5.5 6.1
Industry 7.2 8.3 8.4 8.5 8.4
Service 7.7 7.8 8.2 7.3 7.82007 6.1 6.4 7.0 7.6 7.4
Agriculture 0.5 3.7 3.8 6.4 3.3
Industry 6.9 7.5 7.5 8.5 7.6
Service 7.2 6.5 7.4 7.4 7.12008 6.2 7.0 6.3 4.3 6.0
Agriculture 5.9 7.4 12.4 4.0 7.5
Industry 6.0 6.9 5.6 5.2 5.9
Service 6.4 6.9 5.5 3.8 5.62009 1.6 2.1 4.2 6.1 3.5
Agriculture 3.6 5.0 (0.5) 5.5 3.2
Industry 1.9 3.0 4.4 7.3 4.2
Service 1.0 1.2 5.1 5.6 3.32010 7.1 8.5 8.0 8.6 8.0
Agriculture 9.1 6.3 6.2 6.3 7.0
Industry 6.9 9.2 8.8 8.9 8.4
Service 6.7 8.6 8.0 8.8 8.02011 7.9 8.2
Agriculture (5.1) 1.9
Industry 11.1 9.4
Service 9.5 8.8
0
2
4
6
8
10
%
Growth Rate
1st 2nd 3rd 4th
GDP grows at a faster paceThe Sri Lankan economy is estimated to have grown by 8.0% in
the first half of 2011 compared to the growth rate of 7.8%
recorded in the first half of 2010, particularly with the support of
the improved domestic and external demand. The Industry and
Services sectors grew by 10.3% and 9.1%, respectively during
the first half of 2011. The buoyant performance particularly in
manufacturing and factory industries, external trade, tourism,
banking and financial services, hotel and restaurants, power
generation, private sector services and transport &
communication sub sectors contributed mainly to this improvedperformance. The Agriculture sector contributed negatively by
recording a growth rate of -1.8% mainly reflecting the weather
related setback experienced in the first quarter of the year,
followed by a gradual recovery in the second quarter.
Source: Department of Census & Statistics
Labour Force StatisticsEmployment 2010 1st
Quarter2011 1stQuarter
2010Annual
0
2
4
6
8
10
2 0 04 2 0 05 2 0 06 2 0 07 2 0 08 2 0 09 2 0 10 2 01 1 1Q
R a t e
Unemployment Rate
Labour Force Participation Rate 49.1 48.8 48.6Unemployment Rate 5.1 4.3 4.9Source: Department of Census & Statistics
PADDY STATISTICS
Category2009 2010 2011
2008/2009Maha
2009 YalaTotal
2009/2010 Maha
2010*Yala Total
2010/2011 Maha
Production
Mn.Mt 2.38 1.26 3.65 2.6 1.67 4.27 1.9
Bushels mn. 114 61 175 126 80 206 95
Harvested Area
Hectares (‘000) 605 338 943 643 376 1,019 591Acres (‘000) 1,494 834 2,328 1,590 929 2,519 1,462
Average Yieldkg per ha 4,421 4,186 4,304 4,599 4,444 4,522 3,796
Source: Department of Census & StatisticsThe paddy production in 2010 increased by 17 percent to around 4.3 million mt. compared to the 2009 production of 3.7 millionmt, recording a highest ever paddy production since 1952, benefiting from increased extent in cultivation, increased average yieldby 5 percent, supported by favorable weather conditions and continuation of fertilizer subsidy. The total extent harvested alsoincreased by 8 percent over 2009. The paddy production in 2010/2011 Maha season decreased by 27 percent to around 1.9 millionmt compared to the 2009/2010 Maha season due to severe flood damage in the Eastern and the Central parts of the country inearly 2011.
8/3/2019 Treasury Economic Report
http://slidepdf.com/reader/full/treasury-economic-report 12/13
xii
TEA, RUBBER & COCONUT PRODUCTION
Category 2011 Jan-July 2010 Jan-July % ChangeTea (Mn. Kg) 195.7 196.7 -0.5
Rubber (Mn. Kg) 93.5 85.0 10.0Coconut (Mn. Nuts) 1,203 1,553 -22.5
Source: Central Bank of Sri Lanka
EXTENT, PRODUCTION AND COST OF PRODUCTION - Tea, Rubber &Coconut
Year Tea Rubber Coconut
Extent(Hectares)
ProductionMT
COP(Rs./Kg)
Extent(Hectares)
ProductionMT
COP(Rs./Kg)
Extent(Hectare
s)
Production MT
COP(Rs./1000
nuts)
2002 212,715 310,030 121.97 116,478 90,520 55.74 394,836 2,459 3,584
2003 212,715 303,229 126.72 116,478 92,009 59.76 394,836 2,512 4,135
2004 212,715 308,089 133.09 116,478 94,700 65.98 394,836 2,590 4,774
2005 212,715 317,200 149.13 116,478 104,352 72.56 394,836 2,515 4,870
2006 212,715 310,800 161.98 116,478 109,135 87.65 394,836 2,684 5,436
2007 212,715 304,600 210.75 116,478 117,600 102.31 394,836 2,805 6,124
2008 221,969 318,700 231.49 116,478 129,243 119.89 394,836 2,909 8,795
2009 221,969 290,000 269.01 124,000 136,000 135.83 394,836 2,859 9,166
Source: Department of Census & Statistics
Cow and Buffalo Milk Production 2000 - 2010
Year
Average Monthly MilkProduction (Liters)
TotalMonthly
MilkProduction
(Liters)
Annual Milk Production(Liters) Total Annual
Milk Production(Liters)Cow
MilkBuffaloe
MilkCow Milk
BuffaloeMilk
2000 12,603,800 2,517,512 15,121,312 151,245,600 30,210,148 181,455,748
2001 12,730,400 2,521,900 15,252,300 152,764,800 30,262,800 183,027,600
2002 12,736,740 2,529,510 15,266,250 152,840,880 30,354,120 183,195,000
2003 13,045,500 2,521,500 15,567,000 156,546,000 30,258,000 186,804,000
2004 13,308,000 2,550,000 15,858,000 159,696,000 30,600,000 190,296,000
2005 13,484,700 2,577,100 16,061,800 161,816,400 30,925,200 192,741,600
2006 13,748,100 2,637,180 16,385,280 164,977,200 31,646,160 196,623,360
2007 14,144,000 2,690,100 16,834,100 169,728,000 32,281,200 202,009,200
2008 14,370,200 2,970,890 17,341,091 172,442,406 35,650,685 208,093,090
2009 15,338,740 4,104,280 19,443,020 184,064,880 49,251,360 233,316,240
2010 15,993,300 4,636,200 20,629,500 191,919,600 55,634,400 247,554,000
Source: Department of Census & Statistics
8/3/2019 Treasury Economic Report
http://slidepdf.com/reader/full/treasury-economic-report 13/13
xiii
PRODUCTION OF CEREALS, PULSES & VEGETABLES
2009 2010
Extent (Hectares)Production (MT)
Extent(Hectares Production (MT)
2008/09Maha
2009Yala
2009Total
2008/09Maha
2009Yala
2009Total 2009/10 Maha
Cereals
Maize 44,786 6,070 50,856 114,660 15,110 129,770 127,760 48,890
Kurakkan 5,024 880 5,904 5,570 860 6,430 6,210 5,540
Sorghum 108 30 138 140 40 180 80 60
Meneri 10 20 30 10 10 20 10 20
Pulses
Green gram 6,674 1,900 8,574 7,520 1,740 9,260 7,590 6,890
Cowpea 8,488 2,950 11,438 10,060 3,420 13,480 8,140 7,860
Black gram 7,496 370 7,866 6,600 480 7,080 9,240 9,080
Red onions 2,175 2,320 4,495 21,040 25,190 46,230 31,730 2,520
Soya Beans 425 1,230 1,655 800 2,990 3,790 1,350 710
Oil SeedsGroundNuts 6,877 2,130 9,007 10,200 2,870 13,070 11,260 7,330
Gingelly 2,412 8,470 10,882 1,480 7,050 8,530 1,700 2,600
Musterd 323 40 363 280 20 300 400 350Roots &Tubers
Manioc 14,706 9,160 23,866 178,710 99,140 277,850 178,630 14,050
Sweet Potatoes 3,513 2,490 6,003 26,990 20,280 47,270 25,780 3,270
Big Onions 182 4,900 5,082 1,350 80,360 81,710 1,970 240
Ginger (Raw) 1,892 1,892 10,780 10,780 12,050 2,070Turmaric(Raw) 997 997 7,750 7,750 8,300 1,000
Low Country Vegetables
Luffa 2,562 1,755 4,317 17,824 16,011 33,835 2,638 23,444
Bandakka 4,364 3,237 7,601 28,053 24,075 52,128 4,192 33,928
Snake Gourd 1,956 1,449 3,405 16,756 15,516 32,272 1,921 20,339
Brinjals 6,781 4,661 11,442 60,690 43,474 104,164 6,535 67,374Bitter Groud 2,736 1,798 4,534 20,820 17,125 37,945 2,476 23,789
Cucumber 1,891 1,362 3,253 17,553 13,508 31,061 1,774 18,540
Ash Pumpkin 744 402 1,146 6,374 3,503 9,877 666 6,396
Red Pumpkin 5,147 2,590 7,737 54,003 33,219 87,222 5,661 65,028
Ash Plantain 5,343 4,060 9,403 39,311 39,088 78,399 5,121 44,981
Up Country Vegetables
Tomatoes 4,185 3,549 7,734 48,496 36,202 84,698 4,020 41,930
Cabbage 2,634 1,825 4,459 49,638 27,290 76,928 2,316 35,682
Beans 4,685 3,378 8,063 25,662 16,900 42,562 4,615 24,009
Leeks 911 769 1,680 14,281 12,842 27,123 861 12,657
Beetroot 1,152 1,218 2,370 13,621 12,257 25,878 1,336 12,732
Knolkhol 733 778 1,511 8,742 7,150 15,892 683 5,428
Carrot 1,795 1,230 3,025 24,165 15,850 40,015 1,615 18,919
Raddish 2,047 1,505 3,552 21,475 16,355 37,830 1,996 18,822
Capsicum 2,016 1,462 3,478 9,062 5,849 14,911 1,818 8,324
Other
Chillies (Green) 9,883 4,920 14,803 33,405 17,598 51,003 9,479 33,246
Cigar Tobacco 500 329 829 789 538 1,327 613 403
Beedi/Chewing Tobacco 1,045 257 1,302 2,005 433 2,438 1,546 880Source: Department of Census & Statistics