Treasury A Perspective into Markets and Dealing. The Business Issues Introduction to Derivatives The...
29
Treasury A Perspective into Markets and Dealing
-
Upload
madison-bell -
Category
Documents
-
view
213 -
download
0
Transcript of Treasury A Perspective into Markets and Dealing. The Business Issues Introduction to Derivatives The...

Treasury
A Perspective into Markets and Dealing
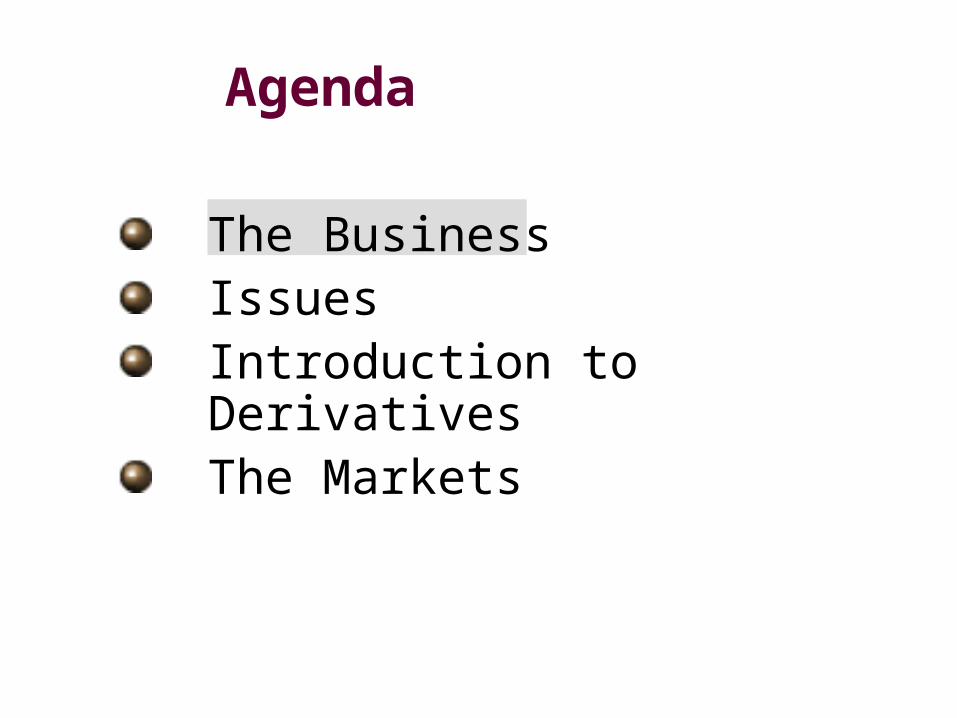
The Business Issues Introduction to DerivativesThe Markets
Agenda
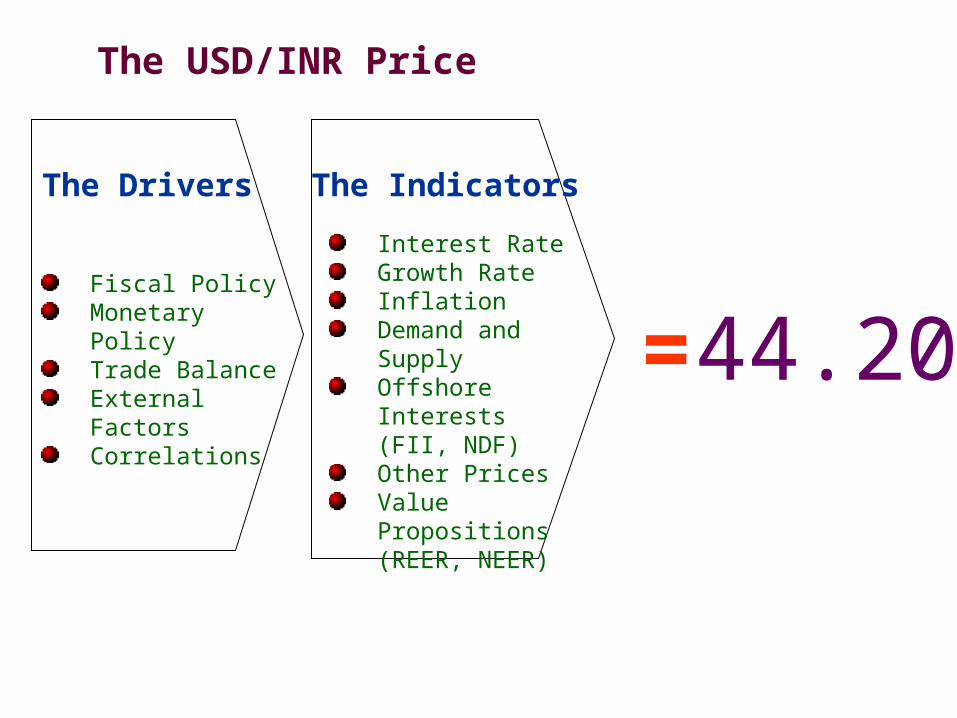
The USD/INR Price
The Drivers
Fiscal PolicyMonetary PolicyTrade BalanceExternal FactorsCorrelations
The Indicators
Interest RateGrowth RateInflationDemand and SupplyOffshore Interests (FII, NDF)Other PricesValue Propositions (REER, NEER)
= 44.20

Retails Oil
Oil Seller
Buys Oil at $60 per Barrel
Gives INR
Buy USD
(at Spot Rate)
Where are the risks?
Receives INR
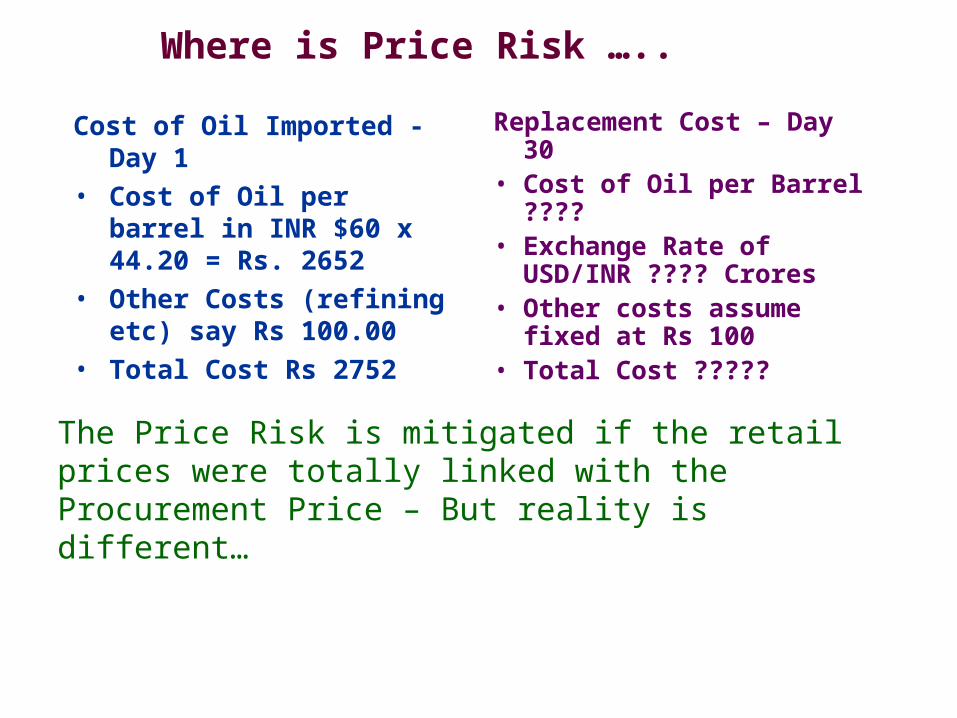
Where is Price Risk …..
Cost of Oil Imported - Day 1
• Cost of Oil per barrel in INR $60 x 44.20 = Rs. 2652
• Other Costs (refining etc) say Rs 100.00
• Total Cost Rs 2752
Replacement Cost – Day 30• Cost of Oil per Barrel ????• Exchange Rate of
USD/INR ???? Crores• Other costs assume fixed at
Rs 100• Total Cost ?????
The Price Risk is mitigated if the retail prices were totally linked with the Procurement Price – But reality is different…

The Reality is
1000
1500
2000
2500
3000
3500
1015202530354045505560657075
Procurement Price
WTC Oil
USD/INR
Retail Price
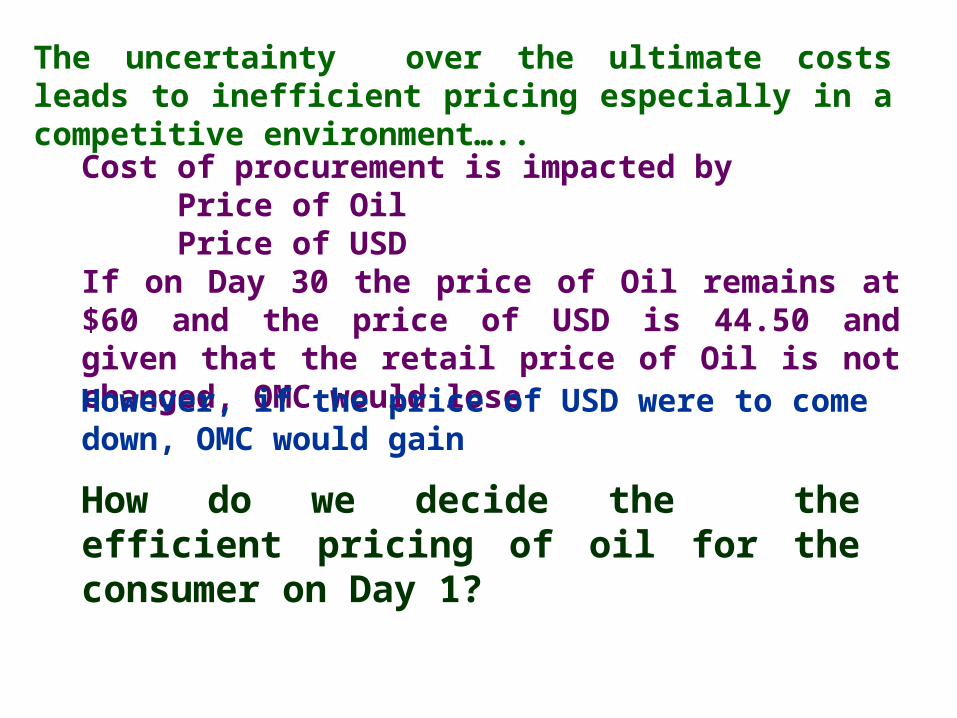
The uncertainty over the ultimate costs leads to inefficient pricing especially in a competitive environment…..
Cost of procurement is impacted byPrice of OilPrice of USD
If on Day 30 the price of Oil remains at $60 and the price of USD is 44.50 and given that the retail price of Oil is not changed, OMC would lose
How do we decide the the efficient pricing of oil for the consumer on Day 1?
However, if the price of USD were to come down, OMC would gain
The Business IssueIntroduction to DerivativesThe Markets
Agenda

Issues• Business accruals in INR• Procurement in USD• Two factor pricing (Oil and USD)• Inability to link Retail Pricing to
ProcurementNeed Identified• Minimize the impact of the Price
Risk between retail and procurement
Solution• Use customized hedges to suit
requirement
Issues, Need and Solution

Effect
Business accruals in INR
Price Risk covered for the period of Forward Hedge
Achieve more efficient pricing

Classical Interest Rate Parity
Spot FX
Forward FX
Interest Rate 1Currency 1
Currency 2 Interest Rate 2
Therefore the Hedging “Cost” is nothing else but the Interest Rate Differential
between the two Currencies

Hedging – Some Issues
When To HedgeArrive at the Cost of Operations + Margins
= Net Cost
As and when levels are seen over the Net
Cost
View Based
What period to hedgeHedge price risk for the period of resetting
of Retail Prices

“ To my knowledge no model projecting movements in rates is superior to tossing a coin”
Alan Greenspan
Former Chairman Federal Reserve

USD/INR NYMEX OIL

The Business IssueIntroduction to DerivativesThe Markets
Agenda

Financial instruments whose value is DERIVED from some other Underlying AssetExamples of Derivatives
•Futures and Forwards •Swaps •Options
Types of Underlying Assets include:Equity SharesInterest Rates (including
Government Bonds)Foreign Exchange Commodities

Buyer - acquires the Right but not the
obligation
Seller – sells the right but has the obligation
Option is a contract where the Buyer buys the Right but not the Obligation….
CONFIDENCE
HIGH LOW
USD FIRMING
FORWARD RATE TO BE LOCKED IN
BUY AN USD CALL
OPTION
V I E
W
USD FALLING
KEEP THE EXPOSURE
OPEN
BUY AN USD
CALL OPTION
CONFIDENCE
HIGH LOW
USD FIRMING
FORWARD RATE TO BE LOCKED IN
BUY AN USD CALL
OPTION
V I E
W
USD FALLING
KEEP THE EXPOSURE
OPEN
BUY AN USD
CALL OPTION

46
FORWARDUSD/INR
48
47
43
44
42
45
USD/INR
CALL
ITM CALL
ATM CALL
OTM CALL
Illustration

Illustration
CALL
PREMIUM 46
FORWARDUSD/INR
48
47
43
44
42
45
ITM CALL
ATM CALL
OTM CALL
PremiumLower
PremiumHigher

Zero Cost Strategy
44.0044.00
46.0046.00
BUY CALL
SELL PUT
Buy from the Bank
Losses Limited
Buy from the Market
Unlimited Profit potential
Exercise CALLBuy USD @ 46.00
Exercise PUTBuy USD @ 44.00
Sacrifice Profits Below 44.00
The Business IssueIntroduction to DerivativesThe Markets
Agenda
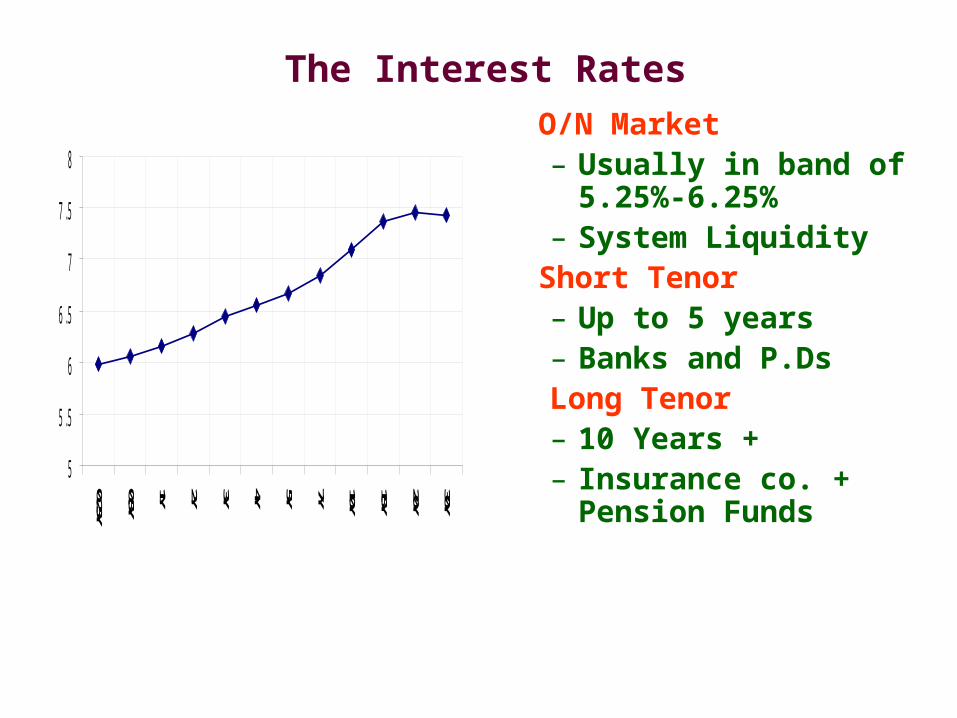
The Interest Rates
5
5 . 5
6
6 . 5
7
7 . 5
8
0.25Y0.5Y1Y 2Y 3Y 4Y 5Y 7Y 10Y 15Y 20Y 30Y
O/N Market– Usually in band of
5.25%-6.25%– System Liquidity
Short Tenor– Up to 5 years– Banks and P.DsLong Tenor– 10 Years +– Insurance co. +
Pension Funds

Global Interest Rates
– US • “number of rate increases…probably not be large..” – FOMC
minutes.
– UK• BoE Cut policy rate in response to weakening economic activity.
– Euro• ECB hiking and may continue until inflation no longer exceeds
target 2.0% (currently 2.3%)
– Japan• Mild deflation continues. (-0.3%)

Inflation – the Drivers
Inflation ExpectationsWPI Components
02468
101214
Mar'03 Sep'03 Mar'04 Sept'04 Mar,05 Sept'05 Dec'05
Primary Articles Manufactured products
Fuel, Power, Light and Lubricants
Month End
WPI Inflation
Dec’05 4.40%
Jan’06 4.78%
Feb’06 5.09%
Mar’06 4.96%
Apr’06 4.16%
May’06 4.42%
Indian Inflation is OIL driven

CorrelationsC o r r e l a t i o n : I N R / $ V s E u r / $
1 . 1 5
1 . 2
1 . 2 5
1 . 3
1 . 3 5
1 . 4
Ja
n-0
5
Ja
n-0
5
Fe
b-0
5
Fe
b-0
5
Ma
r-05
Ma
r-05
Ap
r-05
Ap
r-05
Ma
y-0
5
Ma
y-0
5
Ju
n-0
5
Ju
n-0
5
Ju
n-0
5
Ju
l-05
Ju
l-05
Au
g-0
5
Au
g-0
5
Se
p-0
5
Se
p-0
5
Oc
t-05
Oc
t-05
No
v-0
5
No
v-0
5
No
v-0
5
De
c-0
5
De
c-0
5
Ja
n-0
6
0 . 0 2 1 5
0 . 0 2 1 7
0 . 0 2 1 9
0 . 0 2 2 1
0 . 0 2 2 3
0 . 0 2 2 5
0 . 0 2 2 7
0 . 0 2 2 9
0 . 0 2 3 1
0 . 0 2 3 3E u r / $ IN R / $
• High Correlation with Dollar movements in international markets.

Exchange Rate
I N R / $
0 . 0 2 0 5
0 . 0 2 1
0 . 0 2 1 5
0 . 0 2 2
0 . 0 2 2 5
0 . 0 2 3
0 . 0 2 3 5
13-Jan-04
13-Mar-04
13-May-04
13-Jul-04
13-Sep-04
13-Nov-04
13-Jan-05
13-Mar-05
13-May-05
13-Jul-05
13-Sep-05
13-Nov-05
Rupee +ve– FII/FDI Inflows
– External Commercial Borrowings
– Service Exports
Rupee –ve– Trade Deficit
• OIL

The Trade Flows
Current Account
-10000
-5000
0
5000
10000
15000
20000
Apr'04-Jun'04
Jul'04-Sept'04
Oct'04-Dec'04
Jan'05-Mar'05
Apr'05-Jun'05
Current Account Trade Deficit Invisibles Surplus
I n d i a ' s E x t e r n a l F l o w s
- 1 0 0 0 0
- 5 0 0 0
0
5 0 0 0
1 0 0 0 0
1 5 0 0 0
Ap
r'0
4-
Ju
n'0
4
Ju
l'04
-
Se
pt'
04
Oc
t'0
4-
De
c'0
4
Ja
n'0
5-
Ma
r'0
5
Ap
r'0
5-
Ju
n'0
5
C u r r e n t A c c o u n t C a p i ta l A c c o u n t
Commodity Imports
• Oil is 32% of India’s commodity Imports. Growth in Oil imports =
43%• Growth in import of
machinery goods = 44%
Overall, merchandise trade deficit
Surpassed Invisibles surplus
The SBI advantage
• Largest in – Size , Network and Market Presence
• Total understanding of the PSU Environment
• Is the Business Partner in the growth of the Indian PSU Incorporated
• Has large pool of Expert Resources available for advice
• Preferred choice of major Corporates
• Transparent working
• Relationship based on Trust

Thank You