TRC Q2 2017 Earnings Slides
23
www.trcsolutions.com Q2 Fiscal 2017 Investor Review February 2, 2017 Chris Vincze Tom Bennet Chairman & CEO Chief Financial Officer TRR
-
Upload
trcsolutions -
Category
Investor Relations
-
view
723 -
download
4
Transcript of TRC Q2 2017 Earnings Slides

www.trcsolutions.com
Q2 Fiscal 2017 Investor Review
February 2, 2017Chris Vincze Tom BennetChairman & CEO Chief Financial Officer
T R R

Safe Harbor Statement
2
Certain statements in this presentation may be forward-looking statements within the meaning of Section 27A of the Securities Act of
1933 and Section 21E of the Securities Exchange Act of 1934. You can identify these statements by forward-looking words such as
"may," "expects," "plans," "anticipates," "believes," "estimates," or other words of similar import. You should consider statements that
contain these words carefully because they discuss TRC’s future expectations, contain projections of the Company’s future results of
operations or of its financial condition, or state other "forward-looking" information. TRC believes that it is important to communicate
its future expectations to its investors. However, there may be events in the future that the Company is not able to accurately predict
or control and that may cause its actual results to differ materially from the expectations described in its forward-looking statements.
Investors are cautioned that all forward-looking statements involve risks and uncertainties, and actual results may differ materially
from those discussed as a result of various factors, including, but not limited to, circumstances which could create large cash outflows,
such as contract losses, litigation, uncollectible receivables and income tax assessments; regulatory uncertainty; the availability of
funding for government projects; the level of demand for TRC’s services; product acceptance; industry-wide competitive factors; the
ability to continue to attract and retain highly skilled and qualified personnel; the availability and adequacy of insurance; capital
availability and project investment by our clients; and general political or economic conditions. Furthermore, market trends are subject
to changes which could adversely affect future results. See the risk factors and additional discussion in TRC’s Annual Report on Form
10-K for the fiscal year ended June 30, 2016, Quarterly Reports on Form 10-Q, and other factors detailed from time to time in the
Company’s other filings with the Securities and Exchange Commission.
These slides are intended as a visual aid to TRC’s commentary on the Second Quarter Fiscal Year 2017 Financial Results Conference
Call. As such, they should be considered in the full context of that commentary, the transcript of that conference call and TRC’s second
quarter 2017 Form 10-Q and Financial Results Press Release. Also, this presentation contains references to non-GAAP metrics such as
EBITDA, gross margin, free cash flow and various adjusted metrics. A reconciliation of GAAP to non-GAAP metrics can be found on
slides 17-21.

Q2 Fiscal 2017 Overview
3
NSR1 increased 14% YOY to $127.4MPower +1%, Environmental -2%, Infrastructure +7%, Oil & Gas NSR of $21.3M
NSR backlog increased 2% YOY to $350MPower +16%, Environmental -3%, Infrastructure -16%, Oil & Gas backlog of $43M
(1) TRC believes net service revenue (gross revenue less subcontractor costs and other direct reimbursable charges) best reflects the value of services provided to its customers and is the most meaningful indicator of its revenue performance.
Operating cash flow of $21.4MDSO performance provides strong cash position
Net income increased 2% YOY to $4.0MStrong Infrastructure performance aided earnings, offset by $1.5M amortization expense increase
EBITDA increased 20% YOY to $11.4MAdjusted EBITDA increased 6% YOY
Envi
ronm
enta
l Seg
men
t
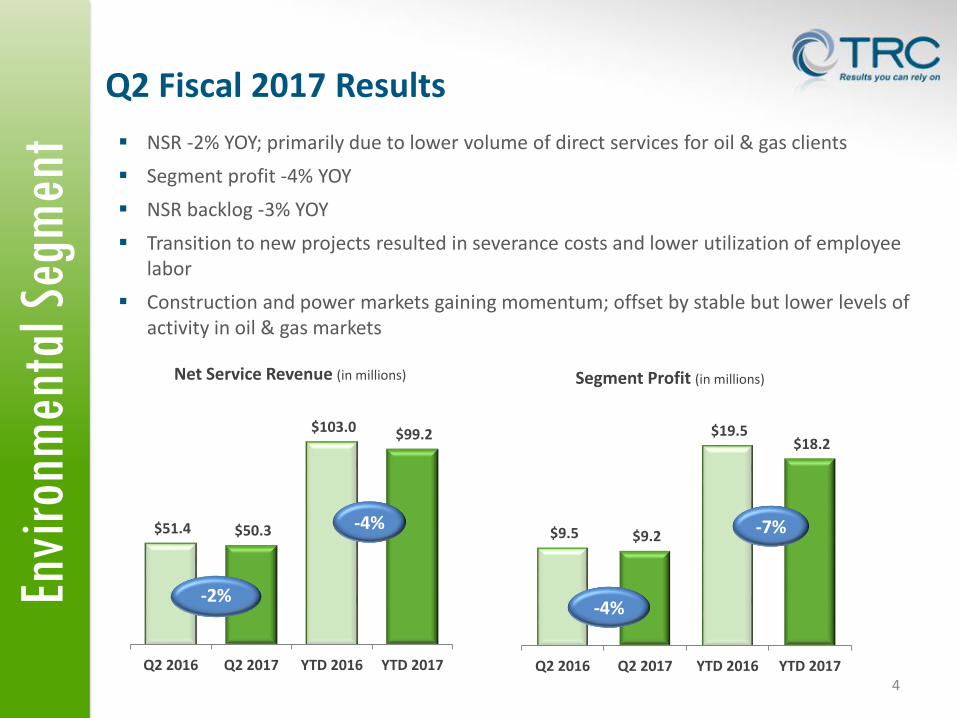
$9.5 $9.2
$19.5 $18.2
Q2 2016 Q2 2017 YTD 2016 YTD 2017
Segment Profit (in millions)
-7%
-4%
$51.4 $50.3
$103.0 $99.2
Q2 2016 Q2 2017 YTD 2016 YTD 2017
Net Service Revenue (in millions)
-2%
-4%
4
NSR -2% YOY; primarily due to lower volume of direct services for oil & gas clients
Segment profit -4% YOY
NSR backlog -3% YOY
Transition to new projects resulted in severance costs and lower utilization of employee labor
Construction and power markets gaining momentum; offset by stable but lower levels of activity in oil & gas markets
Q2 Fiscal 2017 Results

Pow
er S
egm
ent
5
NSR +1% YOY
Segment profit unchanged YOY
NSR backlog +16% YOY on program management project increase
Increasing demand for energy efficiency, testing / commissioning, and distribution engineering services
$39.8 $40.3
$74.1 $77.4
Q2 2016 Q2 2017 YTD 2016 YTD 2017
Net Service Revenue (in millions)
+4%$9.5 $9.5
$16.8 $17.5
Q2 2016 Q2 2017 YTD 2016 YTD 2017
Segment Profit (in millions)
+4%
Unchanged+1%
Q2 Fiscal 2017 Results

Infr
astr
uctu
re S
egm
ent
6
Q2 Fiscal 2017 Results
NSR +7% YOY, driven by large, ongoing PPP projects
Segment profit +37% YOY
NSR backlog -16% YOY; delay in timing of several large contract awards
Benefitting from increased scale and project size
Private investment and state-level legislation expanding PPP programs
$13.7 $14.6
$27.3
$31.2
Q2 2016 Q2 2017 YTD 2016 YTD 2017
Net Service Revenue (in millions)
+15%
$2.5
$3.5
$5.4
$7.8
Q2 2016 Q2 2017 YTD 2016 YTD 2017
Segment Profit (in millions)
+37%
+43%
+7%

Oil
& G
as S
egm
ent
7
NSR $21.3 million
Segment profit of $1.5 million, improved by cost reduction initiatives
NSR backlog $43 million
Increasing stability in oil & gas market
Consistent segment performance led by pipeline integrity-related services
$21.5 $20.8 $21.3 $21.3
$42.7
Q3 2016 Q4 2016 Q1 2017 Q2 2017 YTD 2017
Net Service Revenue (in millions)
Q2 Fiscal 2017 Results
$(3.1) $(3.2)
$1.4 $1.5
$2.8
Q3
20
16
Q4
20
16
Q1
20
17
Q2
20
17
YTD
20
17
Segment Profit (in millions)
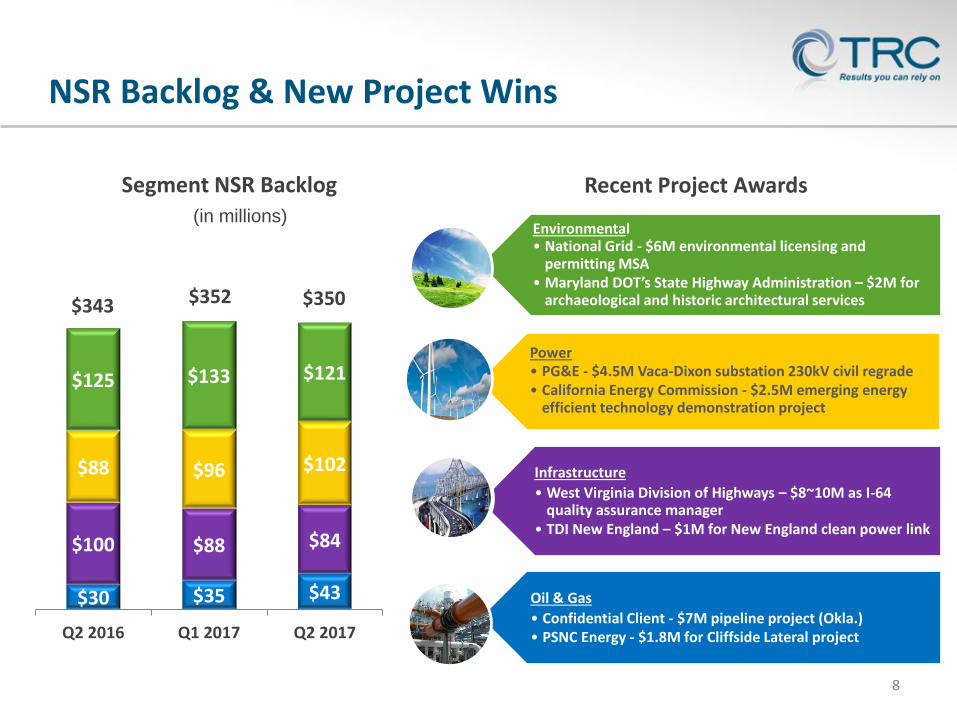
$30 $35 $43
$100 $88 $84
$88 $96 $102
$125 $133 $121
Q2 2016 Q1 2017 Q2 2017
Segment NSR Backlog
$350
NSR Backlog & New Project Wins
8
(in millions)
$343 $352
Power• PG&E - $4.5M Vaca-Dixon substation 230kV civil regrade• California Energy Commission - $2.5M emerging energy
efficient technology demonstration project
Environmental• National Grid - $6M environmental licensing and
permitting MSA• Maryland DOT’s State Highway Administration – $2M for
archaeological and historic architectural services
Infrastructure
• West Virginia Division of Highways – $8~10M as I-64 quality assurance manager
• TDI New England – $1M for New England clean power link
Oil & Gas
• Confidential Client - $7M pipeline project (Okla.)• PSNC Energy - $1.8M for Cliffside Lateral project
Recent Project Awards

9
Applied Energy Group (N.J. Office) Acquisition
TRC pursuing strategic acquisitions to expand our platform in key North
American markets
Acquired New Brunswick, N.J. office of Applied Energy Group (AEG) from
Ameresco in January 2017
Administrator of New Jersey Clean Energy Program
Broadening capabilities to support diverse portfolio of energy sources
Enhances TRC’s leadership position as growing, national leader in the
energy efficiency services market

Key Strategies and Initiatives
10
Invest in organic growth opportunities; new five-year profitable growth strategy
Increase focus on strategic markets:
Power / Utility – Continued investment to modernize gas & electric systems; significant renewable generation investment and focus on energy efficiency
Public policy promoting strong investment in distributed generation and microgrids; expected to expand to other utilities across the nation
Infrastructure – Bipartisan and Administration support for significant infrastructure investment, focusing on transportation
Oil & Gas – Changing midstream and LDC market dynamics resulting in focus on repair / maintenance, upgrade and monitoring of existing assets using technology based solutions
Increased permitting / planning and capital project commitments expected with new Administration support for pipeline projects
Path to new PHMSA rules expected to continue due to enhanced safety benefits
Pursue acquisitions that provide geographic expansion and enhanced technical capabilities or new adjacent services
Continue focus on improving margin and operating cash flow
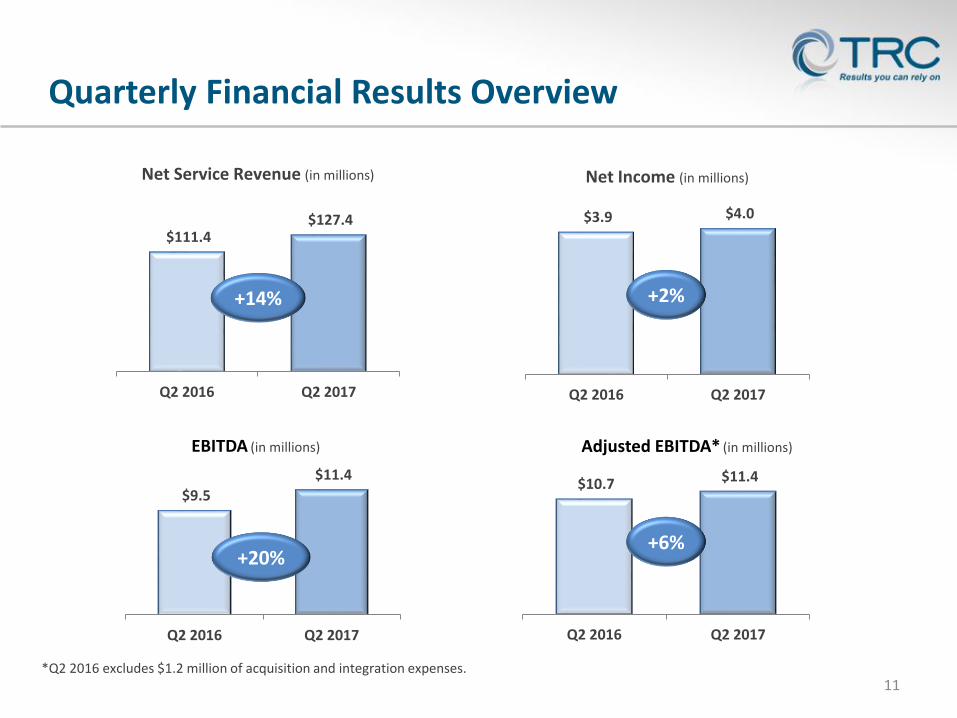
$9.5
$11.4
Q2 2016 Q2 2017
EBITDA (in millions)
Quarterly Financial Results Overview
11
$111.4 $127.4
Q2 2016 Q2 2017
Net Service Revenue (in millions)
+14%
$10.7 $11.4
Q2 2016 Q2 2017
Adjusted EBITDA* (in millions)
+6%
*Q2 2016 excludes $1.2 million of acquisition and integration expenses.
+20%
$3.9 $4.0
Q2 2016 Q2 2017
Net Income (in millions)
+2%

Q2 2016
$111.4
$1.1
$93.7
15.9%
$8.0
7.2%
$1.2
$6.7
$7.9
$9.5
8.5%
$10.7
9.6%
$3.9
$4.7
$0.13
$0.15
Q2 2017
$127.4
$0.7
$105.6
17.1%
$11.0
8.7%
--
$7.0
$7.0
$11.4
9.0%
$11.4
9.0%
$4.0
$4.0
$0.13
$0.13
12
(In millions, except per share data)
Quarterly Income Statement Highlights
84.1%82.9%
Q2 2016 Q2 2017
Cost of Services as % of NSR
7.2%
8.7%
Q2 2016 Q2 2017
G&A Expenses as % of NSR
Net service revenue
Insurance recoverables and other income
Cost of services (COS)
Gross margin %
General and administrative expenses
G&A as % of NSR
Acquisition and integration expenses
Operating income
Adjusted operating income1
EBITDA
EBITDA as a % of NSR
Adjusted EBITDA1
Adjusted EBITDA as a % of NSR
Net income
Adjusted net income1, 2
Diluted earnings per common share
Adjusted diluted earnings per common share1, 2
1Q2 2016 excludes $1.2 million of acquisition and integration expenses. 2Excludes acquisition and integration-related expense in note 1, net of an income tax benefit of $0.5 million.

$19.4 $21.9
YTD 2016 YTD 2017
EBITDA (in millions)
YTD 2017 Financial Results Overview
13
$211.5
$251.7
YTD 2016 YTD 2017
Net Service Revenue (in millions)
+19%
$21.5 $21.9
YTD 2016 YTD 2017
Adjusted EBITDA* (in millions)
+2%+13%
$8.4 $7.6
YTD 2016 YTD 2017
Net Income (in millions)
-9%
*YTD 2016 excludes $2.1 million of acquisition and integration expenses.

YTD 2016$211.5
$1.8
$176.7
16.5%
$15.2
7.2%
$2.1
$14.4
$16.5
$19.4
9.2%
$21.5
10.2%
$8.4
$9.7
$0.27
$0.31
YTD 2015
$192.5
$5.5
$163.8
14.9%
$16.4
$12.9
$17.8
9.2%
$7.5
$0.2514
(In millions, except per share data)
YTD 2017 Income Statement Highlights
83.5% 83.2%
YTD 2016 YTD 2017
Cost of Services as % of NSR
7.2%
8.7%
YTD 2016 YTD 2017
G&A Expenses as % of NSR
1Excludes $2.1 million of acquisition and integration expenses. 2Excludes acquisition and integration-related expense in note 1, net of an income tax benefit of $0.8 million.
Net service revenue
Insurance recoverables and other income
Cost of services (COS)
Gross margin %
General and administrative expenses
G&A as % of NSR
Acquisition and integration expense
Operating income
Adjusted operating income1
EBITDA
EBITDA as a % of NSR
Adjusted EBITDA1
Adjusted EBITDA as a % of NSR
Net income
Adjusted net income1, 2
Diluted earnings per common share
Adjusted diluted earnings per common share1, 2
YTD 2017
$251.7
$1.4
$209.3
16.8%
$21.9
8.7%
--
$13.0
$13.0
$21.9
8.7%
$21.9
8.7%
$7.6
$7.6
$0.24
$0.24

Credit Facility Update
15
$73
$180 $27
$70
$75
$27 $6
PreviousFacility
DebtRepaid Nov.
2015-Dec. 2016
NewFacility
Term Loan Payment
Revolver Payment
Term Loan Drawn
Revolving Credit Facility Draw
Unused Amount
Previous$175M Facility
New$250M facility2
Used for Willbros
acquisition
New $250 million facility1
Five-year tenor, all revolver format
Borrowing capacity linked to trailing 12 month Consolidated EBITDA
Citizens Bank led eight-member bank group
Term loan component eliminated All-revolver structure aids tactical
management of cash flow and borrowings
Flexibility for future interest rate hedging
Existing borrowing spreads maintained Borrowing rates tied to one- to six-month
LIBOR plus 1.5% to 2.75%, depending on current leverage ratio
2Q leverage ratio of 1.4x, results in borrowing rate of LIBOR plus 1.5%
$15 million of balance sheet cash applied at closing, reducing leverage to 1.11x
Key element of growth strategy
Supports working capital, organic growth and acquisition initiatives
1 Subject to leverage limit of 3x trailing 12-month Consolidated EBITDA2 Prior to additional debt repayment conducted as part of the closing process for the new facility

16
Balance Sheet Highlights
Cash and cash equivalents
Days sales outstanding (DSO)
Acquisition-related debt repayment
Acquisition-related debt balance
Cash Flow Highlights
Cash flow from operations
Capital expenditures
Free cash flow
Q2 2016
--
--
$(1.0)
$(2.0)
$(3.0)
Q2 2017
$(1.4)
$68.4
$21.4
$(1.0)
$20.4
(In millions)
Balance Sheet and Cash Flow Highlights
YTD 2016
$9.5
78 days
$13.4
$(4.0)
$9.4
YTD 2017
$26.7
79 days
$(2.8)
$68.4
$18.2
$(2.6)
$15.6

17
Reconciliation of Non-GAAP Measures
Item Q2 - 2017 Q2 - 2016
Net income applicable to TRC Companies, Inc.'s common shareholders 3,998$ 3,937$
Interest expense 841 461
Interest income (286) (137)
Provision for income taxes 2,473 2,439
Depreciation and amortization 4,371 2,780
Net loss applicable to noncontrolling interest 10 (2)
EBITDA 11,407 9,478
Less: Acquisition and integration expenses - 1,240
Adjusted EBITDA 11,407 10,718
Less: Stock-based compensation expense 2,286 1,511
Less: Other Adjustments 450 (18)
Consolidated Adjusted EBITDA Under the Citizens Credit Agreement 14,143$ 12,211$
Item Q2 - 2017 Q2 - 2016
Net service revenue 127,356$ 111,382$
Cost of services 105,613 93,676
Gross Margin 21,743$ 17,706$
Gross Margin % 17.1% 15.9%
Earnings Before Interest, Taxes, Depreciation, Amortization and Acquisition & Integration Expenses
Gross Margin and Gross Margin %

18
Reconciliation of Non-GAAP Measures
Item YTD - 2017 YTD - 2016
Net income applicable to TRC Companies, Inc.'s common shareholders 7,637$ 8,429$
Interest expense 1,686 489
Interest income (564) (137)
Provision for income taxes 4,204 5,596
Depreciation and amortization 8,875 5,044
Net loss applicable to noncontrolling interest 30 (6)
EBITDA 21,868 19,415
Less: Acquisition and integration expenses - 2,118
Adjusted EBITDA 21,868 21,533
Less: Stock-based compensation expense 3,743 2,780
Less: Other Adjustments (23) (44)
Consolidated Adjusted EBITDA Under the Citizens Credit Agreement 25,588$ 24,269$
Item YTD - 2017 YTD - 2016
Net service revenue 251,661$ 211,545$
Cost of services 209,289 176,660
Gross Margin 42,372$ 34,885$
Gross Margin % 16.8% 16.5%
Earnings Before Interest, Taxes, Depreciation, Amortization and Acquisition & Integration Expenses
Gross Margin and Gross Margin %

19
Reconciliation of Non-GAAP Measures
Item Q2 - 2017 Q2 - 2016
Net cash provided by operating activities 21,403$ (952)$
Additions to property and equipment (1,037) (1,974)
Free Cash Flow 20,366$ (2,926)$
Free Cash Flow
Item YTD - 2017 YTD - 2016
Net cash provided by operating activities 18,217$ 13,436$
Additions to property and equipment (2,662) (4,013)
Free Cash Flow 15,555$ 9,423$
Free Cash Flow

20
Reconciliation of Non-GAAP Measures
Item Q2 - 2017 Q2 - 2016
Operating income 7,036$ 6,698$
Acquisition and integration expenses - 1,240
Adjusted Operating Income 7,036$ 7,938$
Item Q2 - 2017 Q2 - 2016
Net income applicable to TRC Companies, Inc.'s common shareholders 3,998$ 3,937$
Acquisition and integration expenses - 1,240
Tax effect of acquisition and integration expenses - (475)
Adjusted Net Income Applicable to TRC Companies, Inc's Common Shareholders 3,998$ 4,702$
Item Q2 - 2017 Q2 - 2016
Net income applicable to TRC Companies, Inc.'s common shareholders 3,998$ 3,937$
Acquisition and integration expenses - 1,240
Tax effect of acquisition and integration expenses - (475)
Adjusted Net Income Applicable to TRC Companies, Inc's Common Shareholders 3,998$ 4,702$
Diluted shares outstanding (as disclosed) 31,966 31,369
Add back for dilutive shares - -
Adjusted diluted shares outstanding 31,966 31,369
Adjusted Diluted Earnings per Common Share 0.13$ 0.15$
Adjusted Diluted Earnings per Common Share
Adjusted Net Income Applicable to TRC Companies, Inc.'s Common Shareholders
Adjusted Operating Income

21
Reconciliation of Non-GAAP Measures
Item YTD - 2017 YTD - 2016
Operating income 12,993$ 14,371$
Acquisition and integration expenses - 2,118 Adjusted Operating Income 12,993$ 16,489$
Item YTD - 2017 YTD - 2016
Net income applicable to TRC Companies, Inc.'s common shareholders 7,637$ 8,429$
Acquisition and integration expenses - 2,118
Tax effect of acquisition and integration expenses - (845)
Adjusted Net Income Applicable to TRC Companies, Inc's Common Shareholders 7,637$ 9,702$
Item YTD - 2017 YTD - 2016Net income applicable to TRC Companies, Inc.'s common shareholders 7,637$ 8,429$
Acquisition and integration expenses - 2,118
Tax effect of acquisition and integration expenses - (845)
Adjusted Net Income Applicable to TRC Companies, Inc's Common Shareholders 7,637$ 9,702$
Diluted shares outstanding (as disclosed) 31,783 31,347
Add back for dilutive shares - -
Adjusted diluted shares outstanding 31,783 31,347
Adjusted Diluted Earnings per Common Share 0.24$ 0.31$
Adjusted Operating Income
Adjusted Net Income Applicable to TRC Companies, Inc.'s Common Shareholders
Adjusted Diluted Earnings per Common Share

22
Earnings Before Interest, Taxes, Depreciation, Amortization (EBITDA)
The Company presents EBITDA because it believes that it is a useful tool for the Company, its lenders
and its investors to measure the Company’s ability to meet debt service, capital expenditure and
working capital requirements. As used in the presentation, EBITDA is operating income plus
depreciation and amortization.
Adjusted Earnings Before Interest, Taxes, Depreciation, Amortization (Adjusted EBITDA)
As used in the presentation, Adjusted EBITDA is defined as EBITDA plus acquisition and integration
expenses.
Consolidated Adjusted Earnings Before Interest, Taxes, Depreciation, Amortization
(Consolidated Adjusted EBITDA Under the Citizens Credit Agreement)
As used in the Citizens Credit Agreement, Consolidated Adjusted EBITDA is defined as EBITDA plus
acquisition and integration expenses, stock based compensation expense, and interest and penalties
on federal and state income taxes, less interest expense on excluded indebtedness.
Gross Margin and Gross Margin %
The Company presents Gross Margin and Gross Margin % to allow investors to better evaluate short-
term and long-term profitability trends. The definition of Gross Margin is equal to Net Service Revenue
less Cost of Services. Gross Margin % is equal to Gross Margin Divided by Net Service Revenue.
Definitions for Non-GAAP Measures

23
Free Cash Flow
The Company presents free cash flow, and ratios based on it, to conduct and evaluate its business
because, although it is similar to cash flow from operations, the Company believes it is a useful
measure of cash flows since purchases of fixed assets are a necessary component of ongoing
operations. The definition of Free Cash Flow is equal to net cash provided by (used in) operating
activities plus additions to property and equipment.
Adjusted Operating Income
The Company presents Adjusted Operating Income because it believes that it is a useful tool for the
Company, its lenders and its investors to measure the Company’s underlying operating performance.
As used in the presentation, Adjusted Operating Income is defined as operating income plus
acquisition and integration expenses and the amount of the goodwill impairment.
Adjusted Net Income
The Company presents Adjusted Net Income because it believes that it is a useful tool for the
Company, its lenders and its investors to measure the Company’s financial performance. As used in
the presentation, Adjusted Net Income is defined as net income applicable to TRC Companies, Inc.
plus the tax effected acquisition and integration expenses and the amount of the goodwill impairment.
The Company utilizes its effective tax rate for the period in calculating the tax effect.
Adjusted Diluted Earnings Per Share (Adjusted Diluted EPS)
The Company presents Adjusted Diluted EPS because it believes that it is a useful tool for the
Company, its lenders and its investors to measure the Company’s financial performance. As used in
the presentation, Adjusted Diluted EPS is defined as Adjusted Net Income divided by diluted weighted
average shares outstanding.
Definitions for Non-GAAP Measures