TRB Transportation Applications Conference Congestion-Free Freeways US Department of Transportation ...
29
TRB Transportation Applications Conference Congestion-Free Freeways US Department of Transportation www.fightgridlocknow.gov Establishing a Metropolitan Network of Congestion-Free Freeways Eliminating Freeway Bottlenecks in the Short-Term Without Major Construction Patrick DeCorla-Souza Federal Highway Administration TRB Transportation Applications Conference May, 2007
-
Upload
gary-brown -
Category
Documents
-
view
219 -
download
0
Transcript of TRB Transportation Applications Conference Congestion-Free Freeways US Department of Transportation ...

TRB Transportation Applications Conference
Congestion-Free Freeways
US Department of Transportation
www.fightgridlocknow.gov
Establishing a Metropolitan Network of Congestion-Free Freeways
Eliminating Freeway Bottlenecks in the Short-Term Without Major Construction
Patrick DeCorla-Souza
Federal Highway Administration
TRB Transportation Applications Conference
May, 2007

TRB Transportation Applications Conference
Congestion-Free Freeways
US Department of Transportation
www.fightgridlocknow.gov
Overview
• The freeway congestion dilemma
• Addressing traffic flow breakdown with a new approach to transportation system operation
• Costs, revenues and benefits
TRB Transportation Applications Conference
Congestion-Free Freeways
US Department of Transportation
www.fightgridlocknow.gov
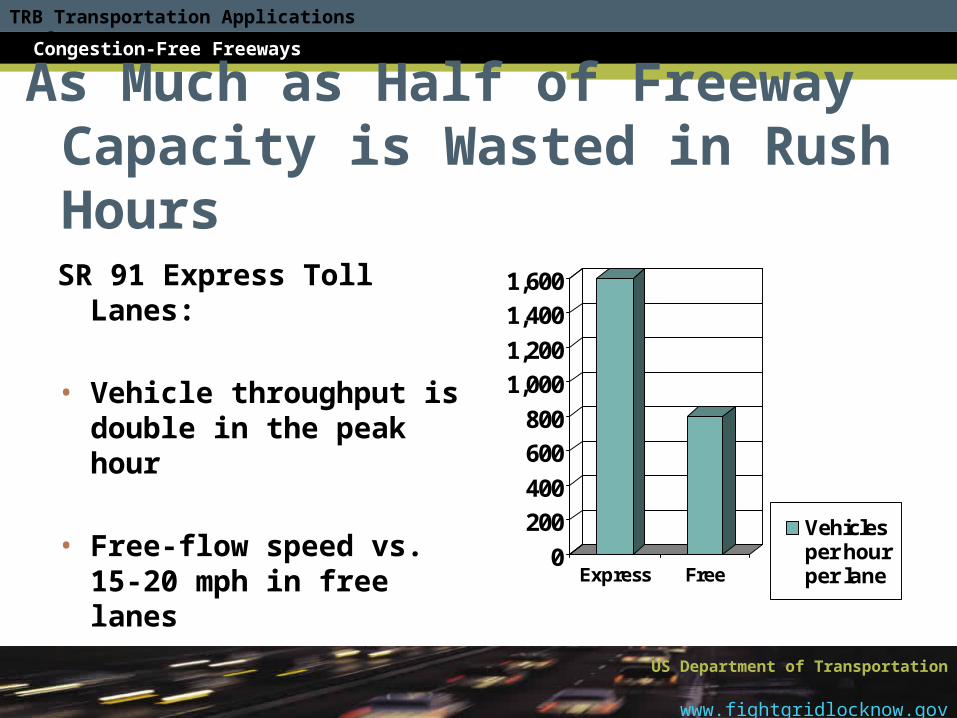
As Much as Half of Freeway Capacity is Wasted in Rush Hours
SR 91 Express Toll Lanes:
• Vehicle throughput is double in the peak hour
• Free-flow speed vs. 15-20 mph in free lanes
0
200
400
600
800
1,000
1,200
1,400
1,600
Express Free
Vehiclesper hourper lane

TRB Transportation Applications Conference
Congestion-Free Freeways
US Department of Transportation
www.fightgridlocknow.gov
Eastbound I-66, Northern VA – Monday Morning, March 5, 2007
5:00 a.m.
6:00 a.m.
8:00 a.m.
9:00 a.m. 7:00 a.m.
Outside Capital Beltway

TRB Transportation Applications Conference
Congestion-Free Freeways
US Department of Transportation
www.fightgridlocknow.gov
Travel Time on Eastbound I-66: 7am to 10 am
Traffic Volume
Speed (mph)
Travel Time per Mile (min.)
•7:00-8:00 am
•8:00-9:00 am
•9:00-10:00 am
7,000
6,000
6,000
19,000
30.0
25.0
30.0
14,000
14,40
12,000
40,400

TRB Transportation Applications Conference
Congestion-Free Freeways
US Department of Transportation
www.fightgridlocknow.gov
Travel Time with No Flow Breakdown(for the same 19,000 vehicles)
Traffic Volume
Speed (mph)
Travel Time per Mile (min.)
•7:00-8:00 am
•8:00-9:00 am
•9:00-10:00 am
8,000
8,000
3,000*
19,000*
55.0
55.0
55.0
8,720
8,720
3,270
20,710*Previous freeway traffic only. Recovered capacity of 5,000 vehicles will attract additional drivers

TRB Transportation Applications Conference
Congestion-Free Freeways
US Department of Transportation
www.fightgridlocknow.gov
Annual Benefits of Free Flow on I-66Per Mile
Avg. Trip Length
Total Savings*
•Daily time savings
•Annual savings (total, AM and PM)
•Monetary value**
19,690 10 mi. 196,900 min.
1.64 million hours
$20 million
*Additional benefits anticipated 9 – 10 am due to recovered capacity (5,000 vehicles), including: (1) benefits to 5,000 vehicles; (2) congestion reduction on alternative routes.
**At $12 per hour

TRB Transportation Applications Conference
Congestion-Free Freeways
US Department of Transportation
www.fightgridlocknow.gov
The Problem is Solvable• Keeping a small number of vehicles from
arriving at critical times can prevent flow breakdown
• Evidence:▫ Washington DC in August▫ State holiday in California▫ Jewish holiday in Boston
• In each case less than 10% fewer vehicles

TRB Transportation Applications Conference
Congestion-Free Freeways
US Department of Transportation
www.fightgridlocknow.gov
Can a Few Vehicles Shift Arrival Time?
• National Household travel Survey:▫ 20% of vehicle trips made during peak travel
periods are made SOLELY to shop▫ Total non-work travel** constitutes:
49% of vehicle trips in AM peak period 75% of vehicle trips in PM peak period
*Source: USDOT, FHWA – National Household Travel Survey 2001
** Includes only trips not made during a commute “tour”

TRB Transportation Applications Conference
Congestion-Free Freeways
US Department of Transportation
www.fightgridlocknow.gov
Can a Few Vehicles Shift Arrival Time?
• Options for work trips:1. Shift to transit2. Vanpool or carpool3. Use flextime, or telecommute
• Key is to get a few vehicles off the freeway during the critical period

TRB Transportation Applications Conference
Congestion-Free Freeways
US Department of Transportation
www.fightgridlocknow.gov
Can We Prevent Flow Breakdown?
• The three “pull” strategies (transit, ridesharing and flextime/telecommuting) are necessary but not sufficient:
▫ Any reduction in delays due to such shifts will cause “replacement” of reduced traffic by those who had previously been deterred by congestion
▫ Must ensure that user-borne cost of driving stays about the same as before
• Two ways: (1) ramp metering; (2) congestion pricing

TRB Transportation Applications Conference
Congestion-Free Freeways
US Department of Transportation
www.fightgridlocknow.gov
(1) Ramp Metering
• Controls merging traffic at freeway entrance ramps, using time delay as a “price” to enter the freeway
• Main issues:
▫ Queues can back up onto arterials and cause congestion
▫ Drivers frustrated by long waits
▫ Those living further out have advantage over those living in central city
▫ Motorists may choose to divert to alternate routes

TRB Transportation Applications Conference
Congestion-Free Freeways
US Department of Transportation
www.fightgridlocknow.gov
(2) Congestion Pricing
• Variable toll “price” to manage demand for use of freeway:
▫ Unlike time “price” in ramp metering, user-borne toll cost is not a “wasted” resource – revenue can generate additional benefits
• Main issues:
▫ Motorist perceives that “free” service will be taken away
▫ Some drivers may be made worse off

TRB Transportation Applications Conference
Congestion-Free Freeways
US Department of Transportation
www.fightgridlocknow.gov
(3) “Super HOT” Congestion Pricing
• Toll-bypass lane plus modal choices, gives options :
▫ Wait in toll-bypass lane and “pay” with time
▫ Go to transfer area and take fast, discounted transit
▫ Ride toll-free in a certified vanpool or carpool
▫ Pay variable toll and get guaranteed premium service
▫ Pay lower tolls or no toll by traveling earlier or later

TRB Transportation Applications Conference
Congestion-Free Freeways
US Department of Transportation
www.fightgridlocknow.gov
“Super HOT” Pricing• Dynamic pricing:
▫ Can manage flow for optimum throughput in real time
▫ Can respond immediately when spare capacity is available by reducing toll rates, benefiting the motorist
• ALL lanes priced:
▫ When only one or two lanes are priced, tolls must be high enough to “price off” a majority of users
▫ When all lanes are priced, only about 10% of users must be priced off at the critical “breakdown” time– so tolls are a lot lower, and 90% are willing to pay them

TRB Transportation Applications Conference
Congestion-Free Freeways
US Department of Transportation
www.fightgridlocknow.gov
“Super HOT” Incident Management
• Overhead lane controls at short intervals:
▫ During incident, one “clear” lane restricted for buses and HOVs
▫ Any spare capacity in the restricted lane managed for free-flow using an “additional” variable toll for SOVs willing to pay for premium service
▫ All other vehicles credited with amount of toll paid, if guaranteed speed is not experienced

TRB Transportation Applications Conference
Congestion-Free Freeways
US Department of Transportation
www.fightgridlocknow.gov
Toll-Bypass Lanes• With 10-15% of travelers shifted to other modes or
times-of-day, all remaining vehicles could be accommodated, so toll-bypass lanes would have zero delays to begin with
• This would encourage more drivers to use the lane, until the queue is long enough that queue-delay “cost,” as perceived by those with the lowest value of time, would be equal to the toll rate
• Assuming a 5 min. queue delay, and a queue
discharge rate of 15 vehicles per min., the toll-bypass lane would need to accommodate 75 vehicles

TRB Transportation Applications Conference
Congestion-Free Freeways
US Department of Transportation
www.fightgridlocknow.gov
“Super HOT” Concept Summary
• Manage traffic flow on all lanes of a freeway
• Variable tolls:▫ At bottleneck locations only▫ During peak periods only
• Complementary strategies▫ Operations – ramp metering, toll collection, lane controls▫ Discounted transit services▫ Certified vanpools and carpools – toll-free▫ Telecommuting and flextime▫ Multi-modal traveler information

TRB Transportation Applications Conference
Congestion-Free Freeways
US Department of Transportation
www.fightgridlocknow.gov
Advantages• Reduces congestion now on whole freeway network
• Creates an HOV network and a “fixed guideway” transit network practically overnight
• Advantages relative to priced lane networks:▫ Costs lower – less right-of-way, pavement, easier
freeway-to-freeway connections ▫ Capacity per lane higher▫ Safety – less weaving▫ User cost - lower toll for premium service▫ Entire facility congestion-free

TRB Transportation Applications Conference
Congestion-Free Freeways
US Department of Transportation
www.fightgridlocknow.gov
Feasibility of a Super HOT Highway Network
• Toll rates• Costs to implement• Revenues• Social benefits

TRB Transportation Applications Conference
Congestion-Free Freeways
US Department of Transportation
www.fightgridlocknow.gov
Prototypical Urban Network
• 100-mile, severely congested freeway network, avg. 6 lanes
• Price all lanes – peak periods only
• New express bus services with heavily discounted transit fares
• Park-and-ride at transit transfer sites
• Toll-bypass lanes at toll gantries at about 5-mile intervals

TRB Transportation Applications Conference
Congestion-Free Freeways
US Department of Transportation
www.fightgridlocknow.gov
Average Peak Period Toll Rate for 10-mile Freeway Segment
•Prior peak period avg. speed
•Time saved over 10 miles
•Willingness-to-pay of 50% of travelers (20 cents/min. saved*)
30 mph
10 min.
$2.00*
*Based on average value of time of $12.00, 50% of travelers value their time equal to or higher than $12.00 per hour

TRB Transportation Applications Conference
Congestion-Free Freeways
US Department of Transportation
www.fightgridlocknow.gov
Annual Highway Costs for 100-mile Network (million $)
Annualized capitalAnnual O & M costTotal
$ 10 * $ 20$ 30
*Based on total capital cost of $127 million, covering operations technology and toll-bypass lanes

TRB Transportation Applications Conference
Congestion-Free Freeways
US Department of Transportation
www.fightgridlocknow.gov
Annual Transit Costs for 100-Mile Network (million $)
Transit fare subsidy
Parking at park-and-ride lots
Total
$49
$8*
$57
*Annualized cost, including annualized capital cost plus annual maintenance costs

TRB Transportation Applications Conference
Congestion-Free Freeways
US Department of Transportation
www.fightgridlocknow.gov
Annual Costs for 100-mile Multimodal Network (million $)
Highway
Transit and park-and -ride
TOTAL
$30
$57
$87

TRB Transportation Applications Conference
Congestion-Free Freeways
US Department of Transportation
www.fightgridlocknow.gov
Annual Benefits for 100-mile Multimodal Network (million $)
Delay reduction*
Reduction in wasted fuel
TOTAL**
$250
$120
$370
*At $12 per hour
**Freeway only – does not include potential reductions due to reduced arterial congestion

TRB Transportation Applications Conference
Congestion-Free Freeways
US Department of Transportation
www.fightgridlocknow.gov
What This Means
• Use of congestion delay to allocate scarce roadway space during rush hours costs $370 million a year
• Using a “Super HOT” pricing system instead would cost only $87 million annually, and would in addition provide other economic and quality of life benefits

TRB Transportation Applications Conference
Congestion-Free Freeways
US Department of Transportation
www.fightgridlocknow.gov
Costs vs. Revenues and Benefits (million $)
CostsRevenuesSurplus
BenefitsB/C ratio ($380 M./$122 M.)
$87$200$113
$3704.4

TRB Transportation Applications Conference
Congestion-Free Freeways
US Department of Transportation
www.fightgridlocknow.gov
What This Means
• “Super HOT” highway network can be financially self-sufficient
• Benefits will exceed costs by a 4 to1 ratio (conservatively estimated).
• Potential to get public acceptance since no one is actually made worse off – although some could still perceive differently