
Travel 2016 Key Insights: International Outlook
11
TRAVEL 2016 KEY INSIGHTS INTERNATIONAL OUTLOOK OCTOBER 2016
-
Upload
euromonitor-international -
Category
Business
-
view
434 -
download
0
Transcript of Travel 2016 Key Insights: International Outlook

TRAVEL 2016 KEY INSIGHTS
INTERNATIONAL OUTLOOK
OCTOBER 2016
SHOCKS, SPILLS AND THRILLS
BREXIT: BOOM OR BUST?
DISRUPTION BREEDS GROWTH

© Euromonitor International
3
Flight
- Refugees and migrants seeking safety and fleeing war
zones and poverty
- Puts stress on existing infrastructure
- Avoidance of destinations affected by terrorism
Financial stress
- Global economic stagnation
- Economic uncertainty and job losses leading to
consumers’ falling out of the middle classes
Fright
- Pandemics cause major consumer alarm, eg Zika
- Social unrest and protests
- Growing inequality
- Radicalisation
Political fracture
- Potential collapse of political unions and trading blocs, eg
EU and Brexit
- Democracy in question, eg in the US with Trump polarising opinion and challenging the
status quo
Travel flies in the face of fear SHOCKS, SPILLS AND THRILLS
Quadrant of Fear Factors
US$2.5 trnTRAVEL PRODUCT SALES
+45%ONLINE TRAVEL PENETRATION 2020
4% CAGRGLOBAL OUTBOUND TRIPS 2015-2020
CAGR = Compound annual growth rate

© Euromonitor International
4
0
100
200
300
400
500
600
2001 2006 2010 2015 2020
Mill
ion
Tri
ps
World Arrivals by Region in Trips 2001-2020
Asia Pacific
Australasia
Eastern Europe
Latin America
Middle East andAfricaNorth America
Western Europe
Tourism demand yet to peakSHOCKS, SPILLS AND THRILLS
Global demand has grown consistently over the past 20 years, shows very little signs of slowing
By 2020, it is expected that 1.5 billion international trips will be taken
While Western Europe remains the most popular region, Asia’s ascent is at the expense of Europe

© Euromonitor International
5
Destinations on a geopolitical rollercoasterSHOCKS, SPILLS AND THRILLS
Visible substitution effect where shifting capacity to more stable countries
Sharp declines in Egypt, Tunisia and Turkey as consumers opt for safer shores of Spain, Portugal & Croatia
Source: Euromonitor International from UNWTO
© Euromonitor International
6
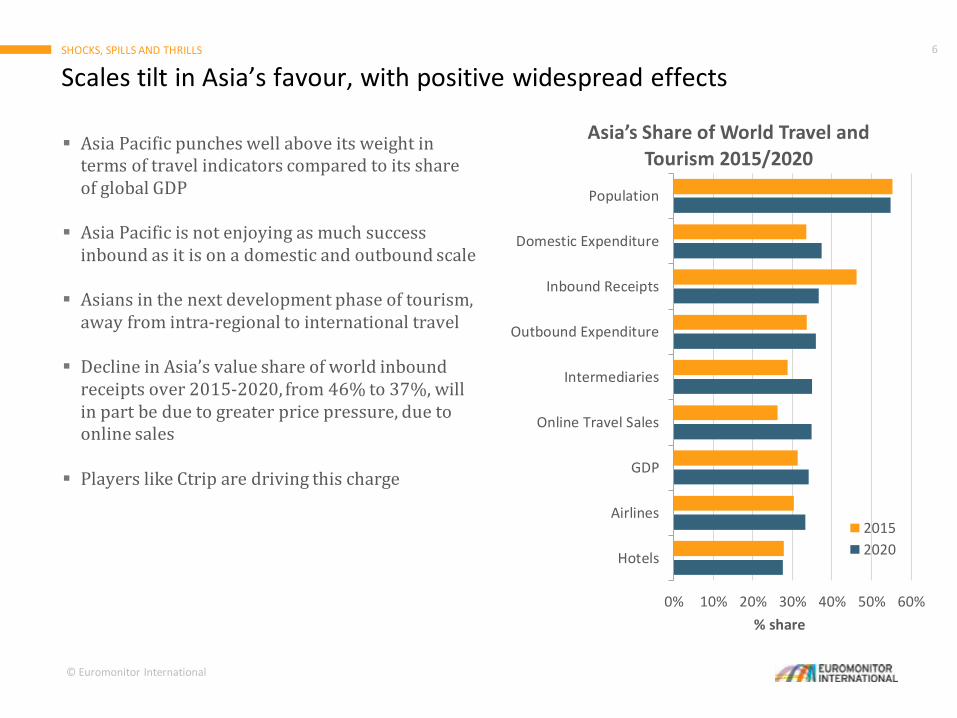
Asia Pacific punches well above its weight in terms of travel indicators compared to its share of global GDP
Asia Pacific is not enjoying as much success inbound as it is on a domestic and outbound scale
Asians in the next development phase of tourism, away from intra-regional to international travel
Decline in Asia’s value share of world inbound receipts over 2015-2020, from 46% to 37%, will in part be due to greater price pressure, due to online sales
Players like Ctrip are driving this charge
Scales tilt in Asia’s favour, with positive widespread effectsSHOCKS, SPILLS AND THRILLS
0% 10% 20% 30% 40% 50% 60%
Hotels
Airlines
GDP
Online Travel Sales
Intermediaries
Outbound Expenditure
Inbound Receipts
Domestic Expenditure
Population
% share
Asia’s Share of World Travel and Tourism 2015/2020
2015
2020

© Euromonitor International
7
By 2018, Chinese outbound departures expected to reach the 100 million mark
By 2030, 200 million outbound Chinese travellers
Large steady supply from China will gravitate to Asia
Japan and South Korea have enjoyed the strongest demand from China, aided by visa programmes
Chinese hard landing scenario would knock 250,000 trips off China to US , but still growing strong at 26% CAGR 2016/2020
CAGR = Compound annual growth rate
China outbound is a great opportunity but not a panacea SHOCKS, SPILLS AND THRILLS
China to US 2020: 3.5mn 30% CAGR
-
5
10
15
20
25
30
Ho
ng
Ko
ng,
Ch
ina
Thai
lan
d
Mac
au
Jap
an
Sou
th K
ore
a
Taiw
an US
Vie
tnam
Sin
gap
ore
Mal
aysi
a
Fran
ce
Mya
nm
ar
Ge
rman
y
Ind
on
esia
Au
stra
lia
Ru
ssia
De
par
ture
s (m
illio
n)
China Outbound Departures
2000/2010/2020
2000 2010 2020

© Euromonitor International
8
The Chinese government has so far avoided an economic hard landing
Economic fundamentals proving better than expected, with real GDP growth forecast at 6.4% in 2016
China takes the leading share of outbound Asian expenditure, with 41% in 2015, compared to much lower shares for advanced economies like Japan (4%) and South Korea (8%) & India (6%)
Work still needs to be done in India to encourage outbound travel as to become the world’s most populous nation by 2025
Important to look at other emerging markets with rising disposable incomes - India, Indonesia, Mexico, Malaysia, Turkey and Poland
Looking to China and beyond for long-term growthSHOCKS, SPILLS AND THRILLS
-
100
200
300
400
500
600
2015 2020
US$
bill
ion
Asia Outbound Expenditure2015/2020
Other Asia China Hong Kong
India Indonesia Japan
Singapore South Korea Taiwan

© Euromonitor International
9
Looking into India’s futureSHOCKS, SPILLS AND THRILLS

© Euromonitor International
10
WinnersDepartures '000 2020
Ranking 2020
Ranking position change 2015/2020
India 26,379 15 6
Indonesia 13,280 27 6
Singapore 27,094 13 4
Turkey 11,065 33 4
Malaysia 23,083 19 3
Thailand 14,003 26 3
China 116,484 2 2
South Korea 29,868 11 2
US 119,471 1 1
LosersDepartures '000 2020
Ranking 2020
Ranking position change 2015/2020
UK 95,749 4 -1
Russia 30,878 10 -1
Australia 20,908 20 -1
Belgium 26,814 14 -2
Germany 113,317 3 -3
Switzerland 24,971 17 -3
Japan 24,380 18 -3
Ukraine 18,079 22 -4
Brazil 9,135 39 -8
Continued diversification to safeguard tourism demandSHOCKS, SPILLS AND THRILLS
Asia Pacific will be key to tourism strategies; India, Indonesia, Singapore, Malaysia and China will see big jumps in their importance to global tourism as a % share of departures
Conflict and economic strife will see Russia, Ukraine and Brazil continue to lose momentum
UK to US will continue to grow at 3% per year but challenges ahead post-Brexit

THANK YOU FOR LISTENINGTHANK YOU FOR LISTENINGThis is a redacted version. For the full presentation, please email [email protected]..