TRANSPORTATION SYSTEM CONGESTION MANAGEMENT
52
SOUTHERN CALIFORNIA ASSOCIATION OF GOVERNMENTS ADOPTED ON SEPTEMBER 3, 2020 TECHNICAL REPORT CONGESTION MANAGEMENT TRANSPORTATION SYSTEM
Transcript of TRANSPORTATION SYSTEM CONGESTION MANAGEMENT

SOUTHERN CALIFORNIA ASSOCIATION OF GOVERNMENTS
ADOPTED ON SEPTEMBER 3, 2020
TECHNICAL REPORT
CONGESTION MANAGEMENT
TRANSPORTATION SYSTEM

ADOPTED ON SEPTEMBER 3, 2020
connectsocal.org
TECHNICAL REPORTCONGESTION MANAGEMENT
EXECUTIVE SUMMARY 1
INTRODUCTION 1
REGULATORY FRAMEWORK 2
ANALYTICAL APPROACH 6
STRATEGIES 24
NEXT STEPS 48
CONCLUSION 48

TRANSPORTATION SYSTEM
Congestion Management
1
EXECUTIVE SUMMARYThis technical report details SCAG’s responsibilities and its actions and programs to fulfill the state and federal congestion management requirements. This report details the state and federal regulatory framework, tracks and discusses congestion performance measures, describes strategies to reduce congestion, and finishes with next steps and implementing the congestion management goals and objectives of 2020 Connect SoCal.
INTRODUCTION
VISION AND PURPOSEWith one of the most congested metropolitan areas in the United States and the world, SCAG has long recognized that roadway capacity expansion by itself is not the solution. Therefore, in addressing its federal and state congestion management requirements, SCAG employs an array of congestion management and reduction techniques. This report measures the congestion in our region, and also describes different actions and programs to manage and reduce congestion. 2020 Connect SoCal showcases an array of transportation investments across all transportation modes to reduce congestion and create a more mobile and sustainable future in our region through 2045 and beyond.

Congestion ManagementConnect SoCal 2
Communities Strategy (RTP/SCS) and the Federal Transportation Improvement Program (FTIP).
The CMP is part of SCAG’s integrated approach to improving and optimizing the transportation system, shown graphically as the Mobility Pyramid (FIGURE 1), to provide for the safe and effective management of the regional transportation system through the use of monitoring and maintenance, demand reduction, land-use, operational management strategies and strategic capacity enhancements.
ORGANIZATION OF THE REPORTThis report is organized as follows:
z Regulatory Framework
z Congestion Management Process (CMP) and Connect SoCal
z Analytical Approach
z Existing Conditions
z Strategies
z Next Steps
z Conclusion
LINK TO MAIN PLAN AND OTHER REPORTSSCAG’s CMP is also discussed in Chapter 2, Chapter 3 and Chapter 5 in the main 2020 Connect SoCal report. In addition, more detailed information on the different transportation modes and their role in congestion management as discussed in this report, such as transit, passenger rail and active transportation can be found in other technical reports under their subject areas.
REGULATORY FRAMEWORKFederal regulations for Metropolitan Transportation Planning and Programming require the development, establishment and implementation of a CMP which is fully integrated into the regional planning process (23 CFR §450.322).
The Federal Highway Administration (FHWA) defines the CMP as a “systematic approach . . . that provides for effective management and operation, based on a cooperatively developed and implemented metropolitan-wide strategy, of new and existing transportation facilities eligible for funding under title 23 U.S.C., and title 49 U.S.C., through the use of operational management strategies.”
In compliance with Federal law [23 U.S.C. 134 and 49 U.S.C. 5303–5305], SCAG has made the CMP an integral part of the regional transportation planning process, including the Regional Transportation Plan/Sustainable
OperationalImprovements
Intelligent Transportation SystemsTraveler Information/Traffic Control
Incident Management
Smart Land UseDemand Management/Value Pricing
Maintenance and Preservation
System Monitoring and Evaluation
SystemCompletion
and Expansion
Figure 1 Mobility Pyramid
FEDERAL PERFORMANCE MANAGEMENTThe Moving Ahead for Progress in the 21st Century Act, MAP-21, requires the Federal Highway Administration (FHWA) to establish rules for implementing transportation system performance management planning at a national level. FHWA rule-making in support of MAP-21 and the Fixing America’s Surface Transportation (FAST) Act has provided performance management and target-setting guidance in three performance management (PM) packages:
Source: Caltrans

Congestion ManagementConnect SoCal 3
PM 1: Transportation System Safety
PM 2: Pavement and Bridge Condition (National Highway System)
PM 3: National Highway System, Freight Movement, and Congestion Mitigation and Air Quality (CMAQ)
Program Performance
The Analytical Approach section of this report discusses this process in more detail.
FEDERAL CONGESTION MANAGEMENT PROCESS AND CONNECT SOCALThe FHWA’s CMP Guidebook outlines eight actions that are considered to be the core of the CMP. SCAG, as the Metropolitan Planning Organization (MPO), implements, monitors and evaluates these actions as part of its RTP/SCS process. These eight actions and how SCAG implements them are described below.
1. Develop Regional Objectives for Congestion Management – CMP objectives should be developed in coordination with the MPO’s long-range plan, and should guide the decisions made throughout the CMP and the broader MPO planning process.
SCAG’s Implementation: As part of each RTP/SCS development process, SCAG meets CMP requirements by performing an exhaustive objectives development effort with hundreds of stakeholders across the region to identify regional objectives for a host of transportation planning areas, including congestion management. Adopted RTP/SCS goals address mobility, accessibility, reliability and productivity.
2. Define CMP Network – This step defines the geographic area to be covered by the CMP, as well as the CMP network and its transportation facilities that will be analyzed, including transit, bicycle, pedestrian and freight facilities.
SCAG’s Implementation: As part of each RTP/SCS development
process, SCAG meets the CMP requirements by defining the six-county geographic area to be covered by the RTP/SCS, and all transportation facilities that will be analyzed, including freeway, highway, arterial, transit, bicycle, pedestrian, and freight facilities.
3. Develop Multimodal Performance Measures –The performance measures a MPO selects for use in the CMP should address the congestion management objectives identified above, addressing a wide variety of congestion-related issues.
SCAG’s Implementation: As part of each RTP/SCS development process, SCAG meets the CMP requirements by developing multimodal performance measures addressing a wide variety of congestion-related issues, including but not limited to mobility, accessibility, location efficiency, air quality and public health. Regarding congestion, SCAG evaluates person delay, truck delay and travel time.
4. Collect Data/Monitor System Performance – This step involves collecting and monitoring data to assess the CMP network’s performance.
SCAG’s Implementation: As part of each RTP/SCS development process, SCAG meets the CMP requirements by updating and calibrating the regional travel demand model and activity-based model process utilizing existing conditions, allowing it to provide an accurate representation of the performance of the existing highway and arterial system. Data sources include: Caltrans freeway Performance Monitoring System (PeMS), Caltrans Highway Performance Monitoring Program (HPMS), Mobility Performance Report (MPR) and private sector data sources. In addition, SCAG collects a host of data on the performance of other modes of transportation, including transit, rail and goods movement.
5. Analyze Congestion Problems and Needs – This step identifies the congestion problems that are present in the region, and those that are anticipated based on the data collected for the RTP/SCS. This step also identifies sources of “unacceptable” congestion.
SCAG’s Implementation: As part of each RTP/SCS development process,

Congestion ManagementConnect SoCal 4
SCAG meets the CMP requirements by performing an assessment of congestion levels in the base year (2016 for the 2020 RTP/SCS) as existing conditions and the baseline future “no build” conditions scenarios. SCAG then performs an alternatives analysis process utilizing model runs to tests various modal strategies and their ability to address the identified congestion issues. This process ultimately results in the selection of the preferred plan scenario.
6. Identify and Assess Strategies – This step involves developing strategies that are appropriate to mitigate the congestion identified in Steps 4 and 5. A wide variety of strategies, should be considered, including transportation demand management, operational improvements, and multimodal facilities and services.
SCAG’s Implementation: As part of each RTP/SCS development process, SCAG meets the CMP requirements by considering a comprehensive range of strategies, including transportation systems management, transportation demand management, and investments in multimodal capital and operational improvements.
7. Program and Implement Strategies – This step involves programming and implementing fiscally constrained projects through the MTP and TIP processes, to mitigate the identified congestion. CMP performance measures should be used as a tool for project prioritization.
SCAG’s Implementation: As part of each FTIP update and amendment development process, SCAG meets the CMP requirements by implementing projects and strategies identified in the FTIP and RTP/SCS in collaboration with the county transportation commissions (CTCs).
8. Evaluate Strategy Effectiveness – This step involves the evaluation of how well the CMP strategies are working, whether further improvements are needed, and whether the strategies should be implemented elsewhere in the region.
SCAG’s Implementation: SCAG meets the CMP requirements by evaluating how its implemented strategies mitigate and reduce the identified congestion over time at the system level, using performance measures and monitoring.
STATE CONGESTION MANAGEMENT PROGRAM AND CONNECT SOCALUnder California law passed in 1990, urbanized areas must prepare a Congestion Management Program. These are comprised of several elements which are described in this section and must be updated every two years. In the SCAG region the Los Angeles County Metropolitan Transportation Authority (Metro), Orange County Transportation Authority (OCTA), Riverside County Transportation Commission (RCTC), San Bernardino County Transportation Authority (SBCTA) and Ventura County Transportation Commission (VCTC) are the designated Congestion Management Agencies (CMAs) for their respective counties and are subject to the state requirements. While Imperial County is not participating in the state program, related activities there are accomplished through the development of the RTP/SCS and the FTIP by the Imperial County Transportation Commission (ICTC).
California Government Code Section 65088.3 provides that if a majority of local jurisdictions representing a majority of a county’s population adopts resolutions requesting to opt out of the state Congestion Management Program, they may do so without penalty. In August 2019, Metro announced that 55 local jurisdictions representing 8.4 million people had adopted resolutions electing to be exempt from the state Congestion Management Program requirements, thereby satisfying the threshold. While the provisions of the state program are no longer applicable to Los Angeles County, SCAG continues to work cooperatively with Metro on monitoring congestion and identifying solutions to manage and reduce congestion in Los Angeles County.
SCAG has a state-mandated role in reviewing the county programs for inter-county compatibility and consistency, as well as for consistency with the adopted RTP/SCS. Because the magnitude of congestion and degree of urbanization differ among the counties in SCAG’s region, each county program differs slightly in form and local procedure. The required program elements are described below.
Roadway Performance – Each CMA monitors the performance of a county-designated freeway, highway and arterial system. This monitoring allows each county to track how their system, and its individual components, is performing

Congestion ManagementConnect SoCal 5
against established standards, and how performance changes over time.
Multi-Modal Performance – In addition to roadway performance, each county program contains an element to evaluate the performance of other transportation modes, especially transit.
Transportation Demand Management (TDM) – Each county program contains a TDM component geared at reducing travel demand and promoting alternative transportation methods.
Land Use Programs and Analysis – Each county program incorporates a program for analyzing the effects of local land use decisions on the regional transportation system.
Capital Improvement Program (CIP) – Using data and performance measures developed through the activities identified above, each county program develops a CIP. This becomes the first step in developing the County Transportation Improvement Program (TIP).
Deficiency Plans – The county programs contain provisions for “deficiency plans” to address unacceptable levels of congestion. Deficiency plans can be developed for specific problem areas or on a system-wide basis. Projects implemented through the deficiency plans must, by statute, have both mobility and air quality benefits. In many cases, the deficiency plans capture the benefits of transportation improvements that occur outside the county TIPs and FTIP such as non-traditional strategies and/or non-regionally significant projects.
The regional transportation planning process and the county congestion management process should be compatible with one another. To ensure consistency, SCAG and the CMAs have developed the Regional Consistency and Compatibility Criteria. Information on the county activities and resulting data is updated on a biennial basis by each CMA and supplied to SCAG and air quality management districts.
SCAG REGIONAL CMP NETWORKEach CMA monitors the performance of their identified program network. This allows each county to track how their network and its individual components are performing against its established performance measures, and how the network’s performance changes over time. At a minimum, all freeways and state highways are required to be monitored. The California Department of Transportation (Caltrans) monitors state highways and the Interstate system within the SCAG region. All the CMAs include major arterials in their networks as well. Once a roadway becomes part of the network, it cannot be removed.
The SCAG regional CMP Network consists of all the county networks combined. It includes all freeways, state highways and key arterials. In each county’s program, the level of service is recorded for all roadways in the CMP network in accordance with California Government Code Section 65089. Imperial County also includes levels of service on major roadways in its Long Range Transportation Plan. Each county is required to update its program every two years.
SCAG CMP’S RELATION TO OTHER DOCUMENTSThrough Connect SoCal, SCAG identifies strategies to reduce and mitigate congestion which are incorporated into the FTIP. These FTIP projects are programmed through the CTCs, as all of these projects are incorporated in CTC long range plans.
The SCAG CMP is also an important part of the South Coast Air Quality Management District’s (AQMD) Air Quality Management Plan (AQMP). The FTIP and RTP/SCS contain congestion-mitigating projects that are transportation control measures (TCMs) which are incorporated into the AQMP to reduce air pollution emissions. These measures contribute toward attaining the National Ambient Air Quality Standards (NAAQS). Federal funds may not be programmed in the carbon monoxide and ozone non-attainment areas of TMAs for any project resulting in significant increase in SOV capacity unless that project is addressed through the CMP. SCAG’s FTIP process flags these SOV capacity-enhancing projects upon submittal by the CTCs and has a process to ensure

Congestion ManagementConnect SoCal 6
that these projects meet the CMP requirements.
With the exception of the non-desert portions of Riverside and San Bernardino counties, all counties contained within the TMA are designated as ozone non-attainment areas. In addition, the entire South Coast Air Basin (SCAB), which comprises Los Angeles County, Orange County, and the non-desert portions of Riverside and San Bernardino Counties, is designated as a carbon monoxide non-attainment area. Imperial County, which does not yet have the population to fall under state congestion management requirements, is also in a non-attainment status for ozone.
ROLES AND RESPONSIBILITIES OF PARTNER AGENCIESFive of the six counties in the SCAG region (all but Imperial County) fall under the state congestion management requirements, and are responsible for monitoring their respective networks and producing a report every two years. SCAG in turn has a state-mandated role in reviewing the county programs for inter-county compatibility and consistency, as well as for consistency with the adopted RTP/SCS. In the SCAG region, Los Angeles, Orange, Riverside, San Bernardino, and Ventura counties are contained within the TMA. The CTCs also work with SCAG to program their projects incorporated in their long range plans in to the FTIP and RTP/SCS. Many of these projects are TCMs that are incorporated in to the AQMP, and the SCAQMD and SCAG work together to ensure the region improves its air quality. Finally, the FHWA monitors and reviews SCAG to make sure it meets CMP requirements.
Outside of state congestion management requirements, federal regulations require establishment of a traffic monitoring system (TMS). It is the responsibility of the state and Caltrans, working with the MPOs and local agencies, to develop a TMS. Caltrans, in accordance with AB 1963 (Katz), is required to monitor the level of service (LOS) on the federal interstate and state highway systems. LOS on arterials that are part of county networks or otherwise are provided by CMAs or local agencies. Immigration and Customs Enforcement monitors border crossings.
Caltrans, in conjunction with the California Highway Patrol (CHP), has created Transportation Management Centers (TMCs) to monitor daily traffic conditions and non-recurring congestion. With the help of electronic technologies such as electronic sensors in the pavement, freeway call boxes, video cameras, 911 calls, officers on patrol, Caltrans highway crews, ramp meter sensors, earthquake monitors, motorist cellular calls and commercial traffic reports, the TMC provides coordinated transportation management for normal commutes, special events and incidents affecting traffic. Much of the data is archived through Los Angeles County’s Regional Integration of ITS Systems (RIITS) which should provide greater accuracy in the data collected and modeled. The TMCs are operated within each Caltrans district. For the SCAG region, Districts 7, 8, 11, and 12 all have TMCs.
The CMP is integral in the work that SCAG does and in forming the RTP/SCS because it is the culmination of so many aspects of the work that our member cities and counties do. While SCAG is not an implementing agency, it is an agency that coordinates and funds the works of local implementers. It’s critical for the region’s cities and counties to be working in concert to reduce congestion, Vehicle Miles Traveled (VMT) and greenhouse gas emissions. While each locality is committed to these goals, there would be discrepancies without coordination. SCAG’s CMP work ensures that there are no such discrepancies and that each county is supported in its work.
ANALYTICAL APPROACH
PERFORMANCE MEASURES FOR 2020 CONNECT SOCALSCAG uses a variety of multi-modal performance measures at both the regional and local level to measure congestion. They include roadway measures, transit measures and active transportation measures. 2020 Connect SoCal is a performance-based plan, and SCAG has a comprehensive set of adopted performance measures to evaluate how well 2020 Connect SoCal addresses the adopted goals and performance outcomes. Please see TABLE 1 and the Performance Measures appendix for more information.

Congestion ManagementConnect SoCal 7
Outcome Performance Measure Description Supports RTP Goals
LOCATION EFFICIENCY
Share of regional household growth ocurring in HQTAs
Percentage of the region’s total growth in households ocurring within HQTAs
Encourage development of diverse housing types in areas well supported by multiple transportation options
Share of regional employment growth ocurring in HQTAs
Percentage of the region’s total growth in employment ocurring within HQTAs
Adapt to a changing climate and support an integrated regional development pattern and transportation network
Land consumption Total acreage of previously greenfield or otherwise rural land use converted to urban use
Promote conservation of natural and agricultural lands and restoration of critical habitats
VMT per capita Daily vehicle miles driven per person (automobiles and light trucks)
Reduce greenhouse gas emissions and improve air quality
Average distance traveled for work and non-work trips
Average distance (in miles) travelled for work and non-work trips
Improve mobility, accessibility, reliability, and travel safety for people and goods
Percent of trips less than 3 miles Percentage of work and non-work trips which are less than 3 miles in length
Improve mobility, accessibility, reliability, and travel safety for people and goods
Work trip length distribution Statistical distribution of of work trip length (10 miles or less/25 miles or less)
Improve mobility, accessibility, reliability, and travel safety for people and goods
MOBILITY AND ACCESSIBILITY
Person delay per capita Daily amount of delay experienced per capita due to traffic congestion
Increase person and goods throughput and travel choices within the transportation system
Person hours of delay by facility type (mixed flow/ HOV/arterials)
Excess travel time resulting from the difference between a reference speed and actual speed
Increase person and goods throughput and travel choices within the transportation system
Truck delay by facility type (highways/arterials)Excess travel time for heavy duty trucks resulting from the difference between a reference speed and actual speed
Increase person and goods throughput and travel choices within the transportation system
Travel time distribution by mode Travel time distribution for transit, SOV, and HOV modes
Leverage new transportation technologies and data-driven solutions that result in more efficient travel
Transit mode share Percentage of total trips that use transit (work and non-work trips)
Adapt to a changing climate and support an integrated regional development pattern and transportation network
Mean commute time Average travel time to workLeverage new transportation technologies and data-driven solutions that result in more efficient travel
Table 1 2020 Connect SoCal Performance Measures

Congestion ManagementConnect SoCal 8
Outcome Performance Measure Description Supports RTP Goals
SAFETY AND PUBLIC HEALTH
Collision fatality rate Rate of collisions involving fatalities per 100 million Vehicle Miles Traveled
Improve mobility, accessibility, reliability, and travel safety for people and goods
Collision serious injury rate Rate of collisions involving serious injuries per 100 million Vehicle Miles Traveled
Improve mobility, accessibility, reliability, and travel safety for people and goods
Air pollution-related health measures Pollution-related respiratory disease incidence and cost Support healthy and equitable communities
Physical activity-related health measures Physical activity/weight related health issues and cost Support healthy and equitable communities
Mode share for walking and biking Percentage of trips using walking or biking (work and non-work trips)
Adapt to a changing climate and support an integrated regional development pattern and transportation network
ENVIRONMENTAL QUALITY
Greenhouse gas (GHG) emissions reduction Percent reduction in GHG emissions per capita (from 2005 levels)
Reduce greenhouse gas emissions and improve air quality
Criteria pollutant emissions CO, NOx, PM2.5, NO2, and ROG emissions (tons per day)
Reduce greenhouse gas emissions and improve air quality
Non-SOV mode share Percentage of total trips using a mode other than driving alone
Increase person and goods throughput and travel choices within the transportation system
ECONOMIC OPPORTUNITY
New jobs supported by improved economic competitiveness
Number of new jobs added to the regional economy as a result of improved transportation conditions
Encourage regional economic prosperity and global competitiveness
New jobs supported by transportation system investments
Number of new jobs added to the regional economy as a result of transportation expenditures
Encourage regional economic prosperity and global competitiveness
INVESTMENT EFFECTIVENESS
Transportation system investment benefit/cost ratio
Ratio of monetized user and social benefits to transportation system investment costs
Encourage regional economic prosperity and global competitiveness
TRANSPORTATION SYSTEM SUTAINABILITY
Cost per capita to preserve multimodal transportation system in current state of good repair
Annual cost per capita required to preserve the regional multimodal transportation system to current conditions
Enhance the preservation, security, and resilience of the regional transportation system
Interstate highway pavement condition Percent of interstate lane miles in ‘Good’ and ‘Poor’ condition
Enhance the preservation, security, and resilience of the regional transportation system
Non-interstate National Highway System pavement condition
Percent of non-interstate National Highway System lane miles in ‘Good’ and ‘Poor’ condition
Enhance the preservation, security, and resilience of the regional transportation system
National Highway System bridge condition Percent of National Highway System bridges in ‘Good’ and ‘Poor’ condition
Enhance the preservation, security, and resilience of the regional transportation system
ENVIRONMENTAL JUSTICE
See Table 1 in Environmental Justice Technical Report.
Table 1 2020 Connect SoCal Performance Measures - Continued

Congestion ManagementConnect SoCal 9
ROADWAYSRoadways include freeways, state highways and arterials. The five CMA counties in the SCAG region each have a state congestion management program-defined roadway network that is monitored for LOS every two years. These include freeways, state highways and arterials and their volume to capacity is measured for a LOS grade. The LOS is a required measure by California Government Code §65089.
While LOS is still used to measure performance in county CMPs, recent state legislation and emerging best practices have encouraged a shift towards measuring VMT – Vehicle Miles Traveled. VMT is a better indicator of greenhouse gas emissions and movement of people, rather than vehicles. It is possible that a roadway might carry more people with a worse LOS, and vice versa, depending on how many people are in each vehicle. VMT does a better job indicating how efficient a roadway is, rather than simply how fast vehicles are moving.
SCAG uses additional performance measures to determine congestion levels of the roadway network in its travel demand model which include:
z Average Daily Speed
z Average Daily Delay
z Average Daily Heavy Duty Truck Delay
z Average Person Trip Length
This technical report also identifies and reports on the top congested corridors in the SCAG region, including major bottleneck areas, congestion trends, and non-recurring congestion at the regional and county level.
TRANSIT AND RAIL PERFORMANCE MEASURESEach county examines performance measures related to transit performance as well. OCTA uses four performance indicators which include vehicle headway, to measure how often service is available to transit patrons; load factor, measuring how many standees there are on a transit vehicle; on-time performance (OTP);
and service accessibility, which measures the percentage of the population that has access to their service. Metro has a “mobility index” that is a composite index of passenger throughput times speed.
For 2020 Connect SoCal, SCAG’s six congestion performance analysis measures for transit and rail are:
z speed of service
z transit and rail modal share
z mileage of transit service by mode (e.g., local, express, BRT/BRT Light, urban rail)
z bus lane mileage
z mileage of one-track operation for commuter rail
z availability to transit and rail
These performance measures are measured by SCAG’s travel demand model. Transit and rail accessibility are also reported on in the 2020 Connect SoCal (accessibility of population, households and employment to different types of transit [e.g., local bus, express bus, rapid bus, rail, etc.]).
ACTIVE TRANSPORTATION MEASURESActive Transportation includes biking and walking. For 2020 Connect SoCal, SCAG’s two congestion performance analysis measures for Active Transportation are:
z modal share
z mileage of bicycle facilities (e.g., Classes 1, 2 and 3)
Modal share is measured by SCAG’s travel demand model, as well as mileage of bicycle facilities.
FEDERAL PM 1 AND 3Two of the federal PM packages are relevant to congestion management and are discussed in further detail in this section:

Congestion ManagementConnect SoCal 10
PM 1: Transportation System Safety
PM 3: National Highway System, Freight Movement, and CMAQ Program Performance
Each of the federal performance management focus areas include an associated set of performance measures for which statewide and regional targets must be set. The specific performance measures include:
Transportation System Safety (PM 1)
z Total number of motor vehicle collision fatalities
z Rate of motor vehicle collision fatalities per 100 million VMT
z Total number of motor vehicle collision serious injuries
z Rate of motor vehicle collision serious injuries per 100 million VMT
z Total number of non-motorized fatalities and serious
National Highway System (NHS) Performance (PM 3)
z Percent of interstate system mileage reporting reliable person-mile travel times
z Percent of non-interstate NHS mileage reporting reliable person-mile travel times
Freight Movement (PM 3)
z Percent of interstate system mileage reporting reliable truck travel times
CMAQ Program (PM 3)
z Annual hours of peak hour excessive delay per capita
z Total emissions reduction by criteria pollutant (PM10, PM2.5, Ozone, CO)
z Non-SOV mode share injuries
MAP-21 rule-making provides MPOs with the option to either accept the statewide performance targets or to develop a separate set of targets specific to the region. Since SCAG has been actively involved in the development of
the statewide targets for all three of the MAP-21 performance management packages, SCAG opted to support the statewide targets for the initial performance monitoring period, which started on Jan. 1, 2018, for most of the measures. MAP-21 establishes a four year performance target setting and reporting cycle, with a two year mid-term progress evaluation point. The initial four year MAP-21 reporting cycle will end on Dec. 31, 2021. The statewide and/or regional performance targets may be revised at the two year mid-term evaluation if re-calibration is determined to be appropriate. The targets are illustrated and discussed in detail in the Performance Management report.
CAUSES OF CONGESTION - GENERALThere are many causes of congestion. Paramount among them is a dependence on personal vehicles in our region. Additional factors are jobs/housing ratio issues, natural impediments such as mountains and waterways, outdated road technology, etc. In the SCAG region, the jobs/housing ratio is particularly an issue given the geography and urban sprawl of our region. Many residents have traditionally continued to move farther and farther inland for cheaper housing, thereby adding to VMTs in our region. In addition, Southern California’s top commute mode, by far, is single-occupancy vehicles. Another cause of congestion is gaps in the road network and bottlenecks where capacity is reduced at pinch points.
The FHWA defines four different types of congestion:1
z Intensity – The relative severity of congestion that affects travel. Intensity has traditionally been measured through indicators such as V/C ratios or LOS measures that consistently relate the different levels of congestion experienced on roadways.
z Duration – The amount of time the congested conditions persist before returning to an uncongested state.
z Extent – The number of system users or components (e.g. vehicles,
1 FHWA (2011), Congestion Management Process: A Guidebook

Congestion ManagementConnect SoCal 11
pedestrians, transit routes, lane miles) affected by congestion, for example the proportion of system network components (roads, bus lines, etc.) that exceed a defined performance measure target.
z Variability – The changes in congestion that occur on different days or at different times of day. When congestion is highly variable due to non-recurring conditions, such as a roadway with a high number of traffic accidents causing delays, this has an impact on the reliability of the system.
CAUSES OF CONGESTION – SCAG REGION
AGGREGATE REGIONAL AND COUNTY TRENDSCaltrans publishes an annual traffic congestion report called the Mobility Performance Report (MPR). Data are presented here for the Caltrans Districts 7, 8, and 12 (covering Los Angeles-Ventura, Riverside-San Bernardino, and Orange Counties, respectively) with respect to traffic congestion, in terms of vehicle hours of delay (VHD), and productivity, in terms of equivalent lost lane miles. The performance results are based on data collected by automated vehicle detector stations on the state highway system. Congestion is presented at two thresholds established by Caltrans based on engineering experience: severe congestion delay from vehicles traveling below 35 mph, and all congestion delay from vehicles traveling below 60 mph. Lost productivity represents the conversion of lost vehicle throughput, where speeds drop below 35 mph, into equivalent lost lane-miles. As described in the MPR, these lost lane-miles “represent a theoretical level of capacity that would be needed to achieve maximum throughput during the most congested time periods.”
FIGURE 2 and TABLE 2 depicts the vehicle hours of delay experienced in the SCAG region on an average weekday from 2005 to 2017. The graphics show that congestion declined from 2006 to 2009, reflecting the Great Recession and a region-wide decline in travel. However, yearly data shows that congestion has been increasing year over year since 2011, and this includes three Caltrans districts. (Imperial County, which is part of Caltrans District 11 with San Diego, is not included in this report.)

Congestion ManagementConnect SoCal 12
Figure 2 Annual Vehicle Hours of Delay (Millions) at 35mph, by Caltrans District
Source: Caltrans PeMS Data
2005 2006 2007 2008 2009 2010 2011 2012 2013 2014 2015 2016 2017
District 7 District 8 District 12 Total
5.05
9.40 8.80
4.74 4.55 5.47 5.21 5.06 4.866.27
7.65 7.108.46
10.59
13.9316.26 15.21
9.7412.31
10.1812.36
10.6512.63
14.16 13.0310.68
44.29
47.62
37.138.86 39.44
49.21
38.0440.82
44.64
48.33
57.9
62.63 63.64
5.05
9.40 8.80
4.74 4.55 5.47 5.21 5.06 4.866.27
7.65 7.108.46
10.59
13.9316.26 15.21
9.7412.31
10.1812.36
10.6512.63
14.16 13.0310.68
59.94
70.95
62.16
58.82
53.72
66.99
53.43
58.2460.15
67.23
79.71
82.75 82.78

Congestion ManagementConnect SoCal 13
in TABLE 3 and EXHIBIT 1. Most bottlenecks are active in the a.m. or p.m. peak periods, or both, and all are active mid-day. The most active time for bottlenecks is the p.m. peak period. The top three ranked bottlenecks in the SCAG region are all located on the San Diego Freeway, (I-405). The top ranked bottleneck is where National Blvd. meets the Santa Monica Freeway (I-10) in Los Angeles. It results in over 1.7 million annual hours of vehicle delay. The second ranked is where the San Diego Freeway intersects with Nordhoff Street in Los Angeles’s North Hills, and the third is where it intersects with Wilmington Avenue in Carson. They represent 1.24 million and 1.17 million hours of annual vehicle delay respectively. The large majority of the locations are in Los Angeles County, with 19 in Orange County, three in Riverside County and three in San Bernardino County. There are no bottlenecks in Imperial and Ventura Counties. The length of the bottleneck queues also varies, with severity and lane configuration as major factors.
Source: Caltrans PeMS Data
Table 2 Annual Vehicle Hours of Delay (Millions) at 35mph, by Caltrans District
Year District 7 District 8 District 12 Total2005 44.29 5.05 10.59 59.94
2006 47.62 9.4 13.93 70.95
2007 37.1 8.8 16.26 62.16
2008 38.86 4.74 15.21 58.82
2009 39.44 4.55 9.74 53.72
2010 49.21 5.47 12.31 66.99
2011 38.04 5.21 10.18 53.43
2012 40.82 5.06 12.36 58.24
2013 44.64 4.86 10.65 60.15
2014 48.33 6.27 12.63 67.23
2015 57.9 7.65 14.16 79.71
2016 62.63 7.1 13.03 82.75
2017 63.64 8.46 10.68 82.78
Source: Caltrans PeMS Data
235.27
365.07
420.38 434.59
391.13356.14
466.10
544.98564.20
507.78
AM Peak Period PM Peak Period
2012 2014 2015 2016 Plan 2045
Figure 3 Weekday Average Equivalent Lost Lane-Miles
FIGURE 3 depicts lost lane-miles from 2012 to the 2016 base year and the 2045 Plan. In 2016, the SCAG region lost an equivalent of 999 lane-miles of highway capacity on an average weekday in the a.m. and p.m. peak periods due to congestion. This is very significant as it compares to 10,820 total lane miles in the SCAG region, or 9.2 percent (excluding HOV lane miles). The 2045 Plan increases productivity by 10 percent in the a.m. and p.m. peak periods.
EXISTING CONDITIONS
MAJOR BOTTLENECKSThere are many major bottlenecks in the SCAG region that further increase congestion and delay. An analysis was done using PeMS data for 2016. They are categorized as “very active,” “somewhat active” or “not active.” The top 100 locations were ranked by annual hours of vehicle delay and are illustrated

Exhibit 1 Title
!
!
!
!
!
!
!
!
!
!
!
!
!
!
!
!
!
!
!
!
!
!
!!
!
!
!
!
!
!
!
!
!
!
!
!
!
!
!!
!
!
!
!
!
!
!
!
!
!
!
!
!
!
!
!
!
!
!
!
!
!
!
!
!
!
!
!
!
!
!
!
!
!
!
!
!
!
!
!!
!
!
!
!!
!
!
!
!
!
!
!
!
!
!
!
!
!!
405
15
15
215
105
10
210
5
605
710105
5
5
5
10
15
15
10
San BernardinoCounty
RiversideCounty
VenturaCounty
Los AngelesCounty
OrangeCounty
San Diego County
Kern County
SimiValley
ThousandOaks
CamarilloOxnard
Yucaipa
Yucca Valley
Victorville
Adelanto
Redlands
Fontana
ChinoHills
RanchoCucamonga
Barstow
Upland
Chino
Ontario
Hesperia
Apple Valley
Calimesa
NorcoRiverside
Corona
Murrieta
Lake Elsinore
San Jacinto
La Quinta
Wildomar
Banning
Perris
Menifee
Moreno Valley
Jurupa Valley
Temecula
HemetIndio
PalmSprings
Santa Ana
Fullerton
Anaheim
SealBeach
Brea
Irvine
Lancaster
Palmdale
Santa Clarita
Los Angeles GlendalePasadena
Burbank
Calabasas
Pomona
Carson
Long Beach
101
101
395
101
241
5791
60
73
22
14
60
118
126
170
138
71
74
58
79
138
18
55
91
23
12633
210210
215
Source: Caltrans 2016 PeMS Data
O:\=RTP\=rtp2020\mxds\Congestion Management\Major Road Bottlenecks.mxd | Date: 2/27/2020Map Title: Major Road Bottlenecks
° 0 10 205Miles
San BernardinoCounty
RiversideCounty
ImperialCounty
ARIZONA
San DiegoCounty
62
8
10
10
40
40
Service Layer Credits: Copyright:(c) 2014 Esri, Esri, Garmin, GEBCO, NOAA NGDC, and other contributors
Pacific Ocean
Freeway ! 2016 SCAG Top 20 Bottlenecks ! 2016 SCAG Top 21-100 Bottlenecks
exhibiT 1 Top 100 Bottlenecks (Map)

Congestion ManagementConnect SoCal 15
Table 3 Top 100 Bottlenecks
Rank County Rte DirApproximate
Bottleneck Location
Absolute Postmiles (approximate) Lat/Long
(approximate)Total Annual
Delay
Active During…
Bottleneck Queue End AM Mid-day PM
1 LA 405 N I-10/National Blvd 53.4 53.2 34.0235389, -118.4272827 1,713,900 z z
2 LA 405 N Nordhoff St 68.7 69.5 34.237367, -118.472933 1,241,600 z
3 LA 405 S S Wilmington Ave 33.7 42.5 33.826193, -118.24972 1,171,700 z
4 LA 10 E I-110 12.3 12.2 34.0370218, -118.2854395 938,300 z z
5 LA 5 N SR-110 137.8 141.9 34.086881, -118.233611 926,500 z z
6 LA 101 S Glendale Blvd (jno I-110) 3.8 7.3 34.070002,
-118.262279 901,000 z z z
7 LA 210 E I-605 37.5 37.9 34.130657, -117.946351 881,000 z
8 LA 105 E Long Beach Blvd 12.0 13.5 33.922422, -118.20466 812,000 z
9 LA 10 E West Covina Pkwy 33.0 34.8 34.072075, -117.943345 796,800 z
10 LA 170 S US-101 2.2 6.4 34.163266, -118.382094 759,900 z
11 LA 405 N Wilshire On/Sunset Off 56.0 55.8 34.059173,
-118.4547775 747,300 z
12 LA 405 N Inglewood 42.2 43.1 33.8911915, -118.3614745 720,300 z
13 LA 10 E La Brea Blvd 8.6 8.9 34.0341453, -118.3502248 704,700 z
14 LA 405 S Howard Hughes Pkwy 48.6 54.0 33.976541,
-118.387273 701,600 z
15 ORA 57 S Chapman 6.4 10.5 33.872312, -117.880462 700,800 z
!
!
!
!
!
!
!
!
!
!
!
!
!
!
!
!
!
!
!
!
!
!
!!
!
!
!
!
!
!
!
!
!
!
!
!
!
!
!!
!
!
!
!
!
!
!
!
!
!
!
!
!
!
!
!
!
!
!
!
!
!
!
!
!
!
!
!
!
!
!
!
!
!
!
!
!
!
!
!!
!
!
!
!!
!
!
!
!
!
!
!
!
!
!
!
!
!!
405
15
15
215
105
10
210
5
605
710105
5
5
5
10
15
15
10
San BernardinoCounty
RiversideCounty
VenturaCounty
Los AngelesCounty
OrangeCounty
San Diego County
Kern County
SimiValley
ThousandOaks
CamarilloOxnard
Yucaipa
Yucca Valley
Victorville
Adelanto
Redlands
Fontana
ChinoHills
RanchoCucamonga
Barstow
Upland
Chino
Ontario
Hesperia
Apple Valley
Calimesa
NorcoRiverside
Corona
Murrieta
Lake Elsinore
San Jacinto
La Quinta
Wildomar
Banning
Perris
Menifee
Moreno Valley
Jurupa Valley
Temecula
HemetIndio
PalmSprings
Santa Ana
Fullerton
Anaheim
SealBeach
Brea
Irvine
Lancaster
Palmdale
Santa Clarita
Los Angeles GlendalePasadena
Burbank
Calabasas
Pomona
Carson
Long Beach
101
101
395
101
241
5791
60
73
22
14
60
118
126
170
138
71
74
58
79
138
18
55
91
23
12633
210210
215
Source: Caltrans 2016 PeMS Data
O:\=RTP\=rtp2020\mxds\Congestion Management\Major Road Bottlenecks.mxd | Date: 2/27/2020Map Title: Major Road Bottlenecks
° 0 10 205Miles
San BernardinoCounty
RiversideCounty
ImperialCounty
ARIZONA
San DiegoCounty
62
8
10
10
40
40
Service Layer Credits: Copyright:(c) 2014 Esri, Esri, Garmin, GEBCO, NOAA NGDC, and other contributors
Pacific Ocean
Freeway ! 2016 SCAG Top 20 Bottlenecks ! 2016 SCAG Top 21-100 Bottlenecks

Congestion ManagementConnect SoCal 16
Rank County Rte DirApproximate
Bottleneck Location
Absolute Postmiles (approximate) Lat/Long
(approximate)Total Annual
Delay
Active During…
Bottleneck Queue End AM Mid-day PM
16 LA 101 S White Oak Ave (jwo I-405) 21.4 24.0 34.171108,
-118.517031 675,300 z z
17 LA 605 S Telegraph Rd 13.0 17.2 33.958207, -118.087265 655,600 z z
18 LA 405 S Getty Center Dr/N Sepulveda Ave 58.4 62.0 34.096057,
-118.47685 633,400 z
19 LA 605 N Florence Ave 11.5 13.0 33.936927, -118.098751 614,700 z z z
20 LA 605 S Florence Ave 11.1 14.4 33.935212, -118.099885 590,300 z z
21 ORA 405 N Beach Blvd 16.6 17.4 33.734759, -117.992088 583,900 z
22 LA 110 S Gage Ave 17.2 20.9 33.980182, -118.281036 556,100 z
23 ORA 55 N Edinger Ave 9.5 11.6 33.726049, -117.83503 525,100 z
24 LA 5 S Lakewood Blvd 124.7 132.5 33.956897, -118.110532 508,600 z
25 LA 110 S Vernon 18.7 22.3 34.002226, -118.28122 508,100 z z
26 LA 210 W Hill 26.7 31.1 34.152357, -118.123714 499,300 z z z
27 LA 60 W Soto 0.5 3.3 34.029636, -118.217534 468,200 z
28 ORA 405 N Brookhurst 13.8 14.5 33.707312, -117.956518 467,500 z
29 LA 101 S Garey St 1.7 4.7 34.053512, -118.232514 433,800 z
30 LA 60 E Fullerton 20.1 20.1 33.9940875, -117.8993527 427,700 z
Table 3 Top 100 Bottlenecks - Continued

Congestion ManagementConnect SoCal 17
Rank County Rte DirApproximate
Bottleneck Location
Absolute Postmiles (approximate) Lat/Long
(approximate)Total Annual
Delay
Active During…
Bottleneck Queue End AM Mid-day PM
31 LA 110 N Staduim 24.5 27.8 34.067909, -118.23795 421,500 z z
32 ORA 5 N Jamboree 99.9 100.7 33.719344, -117.7944745 420,900 z
33 LA 405 S Ventura 61.8 66.9 34.1418377, -118.4715383 415,600 z
34 ORA 405 S Warner 14.4 18.7 33.714839, -117.965935 405,200 z
35 LA 110 S I-405 8.5 12.0 33.855273, -118.2849 399,200 z
36 LA 5 S SR-2 139.2 142.4 34.104544, -118.252924 395,900 z z z
37 LA 10 W Marengo 21.2 25.8 34.071793, -118.143409 393,800 z
38 ORA 5 N SR-55 102.8 102.7 33.7402897, -117.832405 391,900 z
39 LA 57 N Pathfinder 15.3 16.2 33.988721, -117.842841 385,800 z
40 LA 10 W Robertson 5.6 9.5 34.029948, -118.392928 376,800 z z
41 LA 110 N 3rd St 23.2 24.9 34.057029, -118.254921 367,600 z z
42 ORA 5 N 1st 103.2 103.5 33.744413, -117.841283 360,900 z
43 SBD 15 S Jurupa 107.6 109.5 34.047527, -117.550244 359,800 z z
44 LA 60 E Greenwood Ave 7.9 9.5 34.035659, -118.095917 334,400 z
45 LA 91 E Cherry Ave 7.4 8.5 33.875898, -118.166089 329,300 z
Table 3 Top 100 Bottlenecks - Continued

Congestion ManagementConnect SoCal 18
Rank County Rte DirApproximate
Bottleneck Location
Absolute Postmiles (approximate) Lat/Long
(approximate)Total Annual
Delay
Active During…
Bottleneck Queue End AM Mid-day PM
46 LA 405 S Avalon 34.9 40.4 33.838786, -118.263002 326,300 z
47 LA 405 S Sunset On/Wilshire Off 56.1 62.8 34.0700959,
-118.4644172 319,200 z z
48 LA 134 W Vineland Ave 0.3 2.5 34.153052, -118.36974 316,900 z
49 LA 405 S Jefferson 49.5 53.3 33.986242, -118.398076 316,400 z z
50 ORA 405 N Euclid 12.7 13.1 33.69816, -117.940729 315,900 z
51 LA 91 E Pioneer 12.1 13.7 33.876317, -118.084773 310,300 z
52 LA 605 S I-5 11.7 13.7 33.942967, -118.095825 307,000 z z
53 LA 91 W Cherry Ave 6.9 11.2 33.876459, -118.1704 305,400 z
54 LA 5 N Orr - Day 122.9 125.8 33.93311, -118.091005 304,500 z z
55 LA 101 N Lankershim 11.5 12.2 34.135151, -118.358579 302,200 z
56 LA 5 N Fletcher 139.9 142.4 34.108429, -118.258982 298,700 z z
57 LA 5 S Buena Vista 147.9 151.2 34.200916, -118.339473 294,700 z
58 LA 210 E I-605 37.0 37.6 34.133397, -117.954412 293,300 z
59 LA 101 S Laurel Canyon 14.0 16.1 34.154314, -118.394541 289,700 z z
60 LA 101 N Universal 11.1 12.3 34.133337, -118.352345 287,700 z
Table 3 Top 100 Bottlenecks - Continued

Congestion ManagementConnect SoCal 19
Rank County Rte DirApproximate
Bottleneck Location
Absolute Postmiles (approximate) Lat/Long
(approximate)Total Annual
Delay
Active During…
Bottleneck Queue End AM Mid-day PM
61 LA 10 E Western 10.2 11.6 34.036382, -118.319158 287,300 z
62 LA 710 N Willow St 3.2 0.0 33.806183, -118.207214 278,000 z z
63 LA 101 S Melrose 6.0 8.5 34.082786, -118.297762 275,800 z z
64 LA 57 N Pathfinder 15.9 19.2 33.998678, -117.837798 275,300 z z
65 LA 405 S La Tijera 47.9 53.2 33.971543, -118.377669 274,800 z
66 LA 134 E Brand 7.5 8.5 34.156268, -118.25012 274,600 z
67 LA 101 S Edgeware 3.3 7.4 34.067067, -118.254688 274,300 z
68 ORA 55 N Dyer 8.2 8.4 33.709839, -117.8503385 272,800 z z
69 LA 5 S Garnish 124.3 132.1 33.952949, -118.105163 272,000 z
70 ORA 405 S Culver 5.2 7.0 33.6692375, -117.82242 271,600 z
71 LA 110 N 21st St 21.0 22.3 34.031804, -118.274441 269,700 z
72 ORA 91 E Gypsum 35.1 36.1 33.868014, -117.708584 264,100 z
73 ORA 5 S Main 105.1 107.0 33.766429, -117.866976 261,500 z
74 LA 210 E Azusa 40.1 40.6 34.120654, -117.905646 260,500 z
75 LA 110 N 11th St 22.1 24.0 34.046357, -118.268913 258,700 z z
Table 3 Top 100 Bottlenecks - Continued

Congestion ManagementConnect SoCal 20
Rank County Rte DirApproximate
Bottleneck Location
Absolute Postmiles (approximate) Lat/Long
(approximate)Total Annual
Delay
Active During…
Bottleneck Queue End AM Mid-day PM
76 ORA 55 N Lincoln 17.2 18.3 33.837111, -117.834992 258,600 z
77 RIV 215 S Martin Luther King 32.6 35.2 33.96725, -117.327701 255,600 z
78 ORA 57 N Tonner 11.4 12.6 33.940872, -117.875138 254,100 z
79 RIV 215 N Martin Luther King 33.0 34.3 33.969488, -117.328982 253,200 z
80 ORA 405 S Jeffrey 3.5 5.5 33.6632197, -117.7950246 250,900 z
81 LA 710 S Atlantic 16.8 19.5 33.997066, -118.176999 250,300 z
82 LA 710 N Miller Way 12.8 14.3 33.939137, -118.171805 248,700 z z
83 LA 605 S Slauson 13.5 16.2 33.966467, -118.083807 245,500 z z
84 RIV 15 N Philadelphia 106.9 107.5 34.033324, -117.550033 244,400 z z z
85 LA 5 N Los Feliz 141.3 145.6 34.123398, -118.272271 241,500 z
86 SBD 15 N 4th St 110.1 111.1 34.079216, -117.544634 240,600 z
87 LA 210 E Pasadena Ave 40.3 40.6 34.120955, -117.902358 237,600 z
88 LA 210 E Santa Anita 32.4 33.1 34.146752, -118.029146 235,200 z
Table 3 Top 100 Bottlenecks - Continued

Congestion ManagementConnect SoCal 21
Rank County Rte DirApproximate
Bottleneck Location
Absolute Postmiles (approximate) Lat/Long
(approximate)Total Annual
Delay
Active During…
Bottleneck Queue End AM Mid-day PM
89 LA 210 E Pennsylvania 17.1 18.1 34.221426, -118.245718 235,000 z
90 LA 5 N SR-2 139.1 139.7 34.100954, -118.248419 231,900 z z
91 LA 110 S Third St 22.9 26.7 34.055433, -118.256754 230,900 z
92 ORA 22 E Lewis 11.0 11.7 33.778512, -117.895881 226,800 z z
93 ORA 55 S I-5 10.3 12.8 33.7407055, -117.833892 224,700 z
94 LA 405 N Moraga 57.3 57.8 34.077939, -118.470493 224,300 z
95 LA 101 N Lankershim 12.0 14.8 34.139643, -118.365139 223,100 z
96 LA 101 S Alvarado 4.0 5.8 34.071462, -118.265891 223,100 z z z
97 ORA 91 W Lakeview 28.3 30.2 33.849591, -117.816135 222,700 z z
98 LA 105 E Wilmington 9.8 10.5 33.928223, -118.240518 222,700 z
99 LA 10 E Walnut Grove 24.9 25.6 34.071945, -118.082543 222,200 z z
100 LA 10 E Hauser 7.7 8.5 34.033741, -118.361383 221,900 z
Table 3 Top 100 Bottlenecks - Continued
z Very Active Somewhat Active Not Active
Source: Caltrans PeMS Data

Congestion ManagementConnect SoCal 22
PERFORMANCE MEASURES – METRICS AND STATISTICS
REGIONAL AND COUNTY CONGESTION TRENDSDue to increased development sprawl, continued dependence on single occupancy vehicles, and low unemployment in the region, congestion has increased substantially since the 2016 RTP/SCS. For example, the top three bottlenecks have nearly doubled in the amount of congestion over the last four years, and virtually all bottlenecks are active all day.
Congestion increased in all counties, resulting in lost productivity and hundreds of millions of hours of delay. While Los Angeles County contained the large majority of the region’s congestion, Orange County accounted for a higher share of congestion and bottlenecks than in 2012. For example, the number of bottlenecks in Orange County increased from 11 in 2012 to 19 in 2016.
As depicted in EXHIBIT 1 and TABLE 3, one of the main freeway connections between Orange and Los Angeles Counties, the San Diego Freeway (I-405), accounted for the top three bottlenecks in the region, and 24 of the top 100.
COUNTY CONGESTION MANAGEMENT PROGRAM TRENDSThrough the state Congestion Management Program, five of six counties in the SCAG region monitor a county-designated state Congestion Management Program network for LOS performance. In addition to freeways and state highways, which must be included in the network, the counties choose various arterials as part of the network. For example, OCTA includes the arterials that are part of its “Smart Street” network. The CMP biennial monitoring allows each county to track how their system and its individual components are performing against established baseline and historical standards, and how this performance changes over time. State statute requires that the LOS on the county network perform at a grade of E or better, unless the baseline grade for that facility was not performing at that level.
OCTA is the latest CTC to have completed a state Congestion Management Program network analysis in 2019. Orange County’s latest performance, using an average intersection capacity utilization (ICU) analysis rating, shows an improvement over their 1991 baseline. Between 1991 and 2019, the average AM peak-period ICU improved from 0.67 to 0.60, a ten percent improvement, and the average PM peak-period ICU improved from 0.72 to 0.63, a 12.5 percent improvement.
RCTC completed its last state program analysis in December of 2011. Like OCTA, RCTC’s minimum LOS standard is E. Their 2011 analysis indicated that four freeway segments (three on I-15 and one on I-215) and three arterial segments were operating at LOS F levels. All seven of these locations however had programmed projects in RCTC’s Capital Improvement Program (CIP) where were expected to improve the LOS to E or better.
SBCTA completed their 2016 CMP. This includes a novel web-based tool to allow users to monitor congestion levels on their county network. The 2016 CMP includes one freeway segment that is performing at LOS F. This segment is the northbound I-15 freeway between I-10 and Fourth Street in the City Ontario, and was at LOS C for the 2007 CMP. However, SBCTA has categorized this segment as exempt due to 1) its large volume of interregional trips (>65 percent for trucks and >40 percent for vehicles), and 2) it is impacted by Caltrans’ ramp metering. In addition, this segment of I-15 is programmed for express lanes which will help manage and reduce congestion. SBCTA has performed an analysis of the 2016 CMP Roadway System with the 2007 CMP results and found that in general, the LOS has improved, especially on the freeway and highway portions.
In the late 2000s and early 2010s, LACMTA had been studying a congestion mitigation fee for possible implementation as part of their state program requirements. The potential fee would link the transportation/land use nexus in order to fund transportation improvements in the future. However, the Metro Board authorized its staff to pursue the CMP opt-out process in June 2018. Pursuant to California Government Code §65088.3 (Attachment A, C.G.C. §65000 et seq.), jurisdictions within a county may opt out of the CMP requirement without penalty, if a majority of local jurisdictions representing a

Congestion ManagementConnect SoCal 23
majority of the county’s population formally adopt resolutions requesting to opt out of the program. As a result, Los Angeles County officially opted-out of the state requirements in the summer of 2019. This does not affect SCAG’s state and federal congestion management responsibilities, as SCAG will continue to review and certify state Congetion Management Programs from the remaining counties in its region, and will continue to perform its role in the federal CMP for all its counties including Los Angeles, as described in this technical report.
NON-RECURRENT CONGESTIONNon-recurrent delay is congestion caused by collisions, adverse weather, special events or other atypical incidents.
Data from the Caltrans Performance Measurement System (PeMS) is used to assess the level of non-recurrent delay on regional freeways using the ‘congestion pie’ feature of PeMS. This module categorizes total reported freeway congestion into its recurrent and non-recurrent components. Non-recurrent congestion is further analyzed in PeMS by disaggregating the data into two categories: ‘Accidents’ and ‘Miscellaneous’. Non–recurrent congestion due to collisions is estimated using the Caltrans ‘Traffic Accident Surveillance and Analysis System’ (TASAS). TASAS overlays highway congestion data reported by roadway sensors with collision data. If excessive congestion is reported at a time and location where TASAS indicates a collision occurred, that congestion is classified in the ‘Accident’ category. If roadway sensors report excessive congestion where there is no corresponding collision information, that supplemental congestion is classified in the ‘Miscellaneous’ category of non-recurrent congestion.
As depicted in FIGURE 4, about 48 percent of freeway congestion experienced in the SCAG region in 2015 (the year of the most recent data) was of the non-recurrent variety, although levels vary significantly by county. Accordingly, more than half (52 percent) of congestion in the SCAG region is recurrent. More suburban or rural areas with less overall congestion have a higher percentage of total congestion represented by non-recurring events. Ventura County, for example, was estimated to have the majority (85 percent) of its congestion caused by non-recurrent events. Non-recurrent congestion also comprises the
majority of delay experienced in San Bernardino (72 percent) and Riverside (55 percent) counties. By contrast, the more intensively urbanized counties of Los Angeles and Orange each had approximately 45 percent of its total congestion represented by non-recurring incidents.
Non-recurrent delay may be mitigated or reduced by improving highway incident management strategies. Other uses of intelligent transportation technologies, such as traffic signal coordination and the provision of real-time traffic information allow travelers to make better informed decisions regarding the availability of transportation alternatives, including transit. Primary strategies for ameliorating recurrent congestion focus on reducing dependency on single occupancy vehicle travel and on improving the coordination of regional land use and transportation planning efforts. Enhanced coordination of local and regional land use planning and decision-making with transportation system planning will provide the foundation for a more efficient and sustainable urban living and commuting environment.
Source: Caltrans PeMS Data
Figure 4 Recurrent vs. Non-Recurrent Congestion
N/A
55%
45%
55%
45% 45%
55%
28%
72%
15%
85%
52%48%
Imperial Los Angeles Orange Riverside San Bernardino SCAG RegionVentura
Recurrent Delay Non-Recurrent Delay

Congestion ManagementConnect SoCal 24
STRATEGIES
ITS AND TRANSPORTATION SYSTEMS MANAGEMENT
DESCRIPTION OF TSMTransportation Systems Management (TSM) employs a series of techniques designed to maximize the capacity and efficiency of the existing transportation system and its facilities by increasing its supply via Intelligent Transportation Systems (ITS) and Transportation Demand Management (TDM), and also to reduce the dependence on single-occupancy vehicle (SOV) travel. The common goals of TSM are to reduce traffic congestion, improve air quality, and reduce or eliminate the need to construct new and expensive transportation infrastructure. The following sections describe TSM in the SCAG region, including ITS and TDM elements.
CORRIDOR SYSTEM MANAGEMENT PLANSIn 2006, California initiated the Corridor Mobility Improvement Account (CMIA) to improve the state highway system. CMIA program guidelines require the development of Corridor System Management Plans (CSMPs) for those projects receiving CMIA funding, to ensure that mobility improvements are maintained over time.
CSMPs provide a framework for long-term corridor management, with a focus on operational improvements. The intention of the CSMP effort is to continually monitor system performance and identify system improvements that are lower-cost, relatively quick to implement, and less capital-intensive than major corridor widening and expansion projects.
In the SCAG region, CSMPs were developed by Caltrans for I-5 (two segments), I-210 and I-405 in Los Angeles County; I-5, SR-57, SR-91, and SR-22/I-405/I-605 in Orange County; I-15, SR-91 and I-215 in Riverside County; I-15, I-10 and I-215 in San Bernardino County; and US-101 in Ventura County . SCAG contributed
funding towards the I-405 CSMP in Los Angeles County, as well as towards the I-210 CSMP undertaken as part of the Governor’s Go California initiative.
The CSMP development efforts began with a comprehensive assessment of corridor performance and the identification of congestion points called bottlenecks. This information was shared and verified with the stakeholders along the corridors. To address the bottlenecks, operational and minor capacity improvement projects were developed with input from stakeholders. These proposed improvements were analyzed using microsimulation models that were created specifically for the corridors. The potential improvements include ITS technologies, ramp metering, auxiliary lanes, ramp and interchange improvements, and incident management.
Including improvements proposed in the CSMPs, the 2020 RTP/SCS includes $13.7 billion for TSM improvements, including extensive advanced ramp metering, enhanced incident management, bottleneck removal to improve flow (e.g. auxiliary lanes), the expansion of the integration of our traffic signal synchronization network, and data collection to monitor system performance.
SYSTEM MANAGEMENT INITIATIVESCaltrans, SCAG, and county partners have worked together to improve the efficiency of our highways and arterials. Initiatives related to maximizing the productivity of our roadways include:
z In southern Los Angeles County, SCAG completed a Caltrans-funded Corridor Sustainability Study on the multimodal performance of Interstate 105. This went beyond a typical freeway study to examine the surrounding corridor from a multimodal perspective, in an effort to improve overall mobility and safety. It incorporated complete streets concepts, transit alternatives, active transportation, managed lanes, arterial street improvements and advanced operational strategies.
z In Orange County, Caltrans completed the Corridor System Management Plans (CSMPs) which identify operational strategies to improve the productivity on highway corridors. CSMPs were

Congestion ManagementConnect SoCal 25
completed for State Route 55 and Interstate 5 in Orange County.
z In Los Angeles, Caltrans, in coordination with Los Angeles Metro and various cities have embarked on the first Integrated Corridor Management project on Interstate 210. This project aims to minimize congestion due to accidents and is referred to as the Connected Corridors initiative. Over the next 10 years, Caltrans plans to implement similar projects on 25 additional congested corridors statewide.
z Arterial Signal Synchronization projects have been completed on various arterials through the Region to optimize traffic flow.
Various efforts have been completed to inform the traveling public of expected travel times to various destinations and in some cases provide travel time comparisons with transit.
INTELLIGENT TRANSPORTATION SYSTEMSIntelligent Transportation Systems (ITS) make use of advanced detection, communications, and computing technology to improve the safety and efficiency of our surface transportation network. ITS is a program of technology applications and integration that allows system operators and users to better manage and optimize the use of transportation system capacity. ITS allows for the use of information technologies to collect data about the status of our highways, traffic signals, transit vehicles, freight vehicles, passenger trains and shared-ride vehicles and integrates that data in ways that affect and improve the efficiency of the system.
ITS is not new to the SCAG region. Systems like the City of Los Angeles Automated Traffic Surveillance and Control (ATSAC) computer-based signal system have been in place since first installed around the L.A. Coliseum for the 1984 Olympics. ATSAC assists in optimizing signal timing to accommodate varying traffic demands throughout the day. Metro implemented its first Metro Rapid lines in 2000 that use Transit Signal Priority (TSP) technology in the City of Los Angeles and other agencies in Los Angeles County. These technologies have advanced to provide Automatic Vehicle Location (AVL) services for dispatching and operations management of public transit buses, taxicabs,
Uber, Lyft and many other transportation systems. They also now provide very accurate traffic speed and incident information for travel time and routing options, and provide transit and shared-ride users accurate, real-time arrival and departure information. In addition, the four Caltrans Districts (7, 8, 11, and 12) and most medium to large sized jurisdictions have Traffic Management Centers (TMCs) to monitor their traffic signal systems and ITS devices, and to manage natural and man-made disasters if that need were to arise.
ITS IN THE SCAG REGIONSeveral examples of ITS exist in the SCAG region, all of which are run by state or local agencies, such as transit agencies, counties, municipalities and Caltrans. Additionally, SCAG developed a Regional ITS Architecture in 2005, which was updated in 2019.
Some examples of ITS in the SCAG region are:
z Changeable message (amber) signs
z Freeway ramp meters
z Transit signal priority
z Positive train control – GPS-enabled safety braking
z Goods movement, airport and seaport technology
A more exhaustive list of ITS Examples in the SCAG region can be found in county ITS Architectures. For example, Los Angeles County’s ITS Architecture, named “Connect-IT” has been updated and posted on a website for easy access.
It is SCAG’s role to not only coordinate, but study and report upon these local and state activities. SCAG recently completed a report and updated its regional architecture in order to guide other agencies in making their ITS activities more effective and increase cooperation between cities and counties.

Congestion ManagementConnect SoCal 26
ARTERIAL, HIGHWAY AND FREEWAY ITS STRATEGIESSystem Management - System Management is a multi-pronged approach to addressing congestion that includes: maintaining its infrastructure, investing in and encouraging the use of alternate modes such as transit and rail, and Transportation Management Systems (TMS) and strategies. System management aims to restore lost capacity by adopting operational improvement investments that control highway infrastructure to reduce bottlenecks.
Transportation Management Systems (TMS) - TMS strategies essential for improved operations include: traffic control, traveler information, and incident management.
z Ramp metering is a signal control traffic strategy for managing traffic flow on freeways by regulating the entering the freeway or moving from one freeway to another through the use of control devices on entrance ramps or freeway connectors.
z Adaptive ramp metering is a traffic response type of ramp metering that seeks to optimize a multiple-ramp section of a highway, often with the control of flow through a bottleneck as the ultimate goal. In a coordinated metering plan, the metering rates of a ramp are determined based on the prevailing traffic conditions of an extended section of roadway.
z Advanced Traffic Management systems are operational improvement strategies with business processes that rely heavily on technology to manage growing congestion. These processes include traffic control, traveler information, and incident management.
z Variable Speed Limits are speed limits that change using electronic signs based on road, traffic, and weather conditions intended to reduce secondary collisions
Integrated Corridor Management (ICM) - ICM is the integration and operational coordination of multiple transportation networks and cross-network connections comprising a corridor and the institutional coordination
of those agencies and entities responsible for corridor mobility. It enables agencies to see the overall impact of multimodal transportation network management decisions and to optimize the movement of people and goods within the corridor instead of just on individual networks.
Active Traffic Management (ATM) is a congestion management approach that dynamically manages recurrent and non-recurrent congestion based on prevailing traffic conditions. This congestion management approach consists of a combination of operational strategies that, when implemented in concert, fully optimize the existing infrastructure and provide measureable benefits to the transportation network and the motoring public. These strategies include speed harmonization, temporary shoulder use, junction control, and dynamic signing and rerouting.
Arterial Management Systems – Arterial Management Systems manage traffic along arterial roadways, employing traffic detectors, traffic signals, and various means of communicating information to travelers. These systems make use of information collected by traffic surveillance devices to smooth the flow of traffic along travel corridors.
z Advanced Signal Actuation strategies include coordinated signal operations across neighboring jurisdictions with freeway ramp meters, as well as centralized control of traffic signals.
z Coordinated Signal Timing/Signal Synchronization is a traffic signal operations strategy that promotes the smooth flow of traffic along an arterial to minimize stops, avoid congestion, and minimize fuel consumption and air quality impacts resulting from the acceleration and idling of vehicles. This is done by calculating the arrival time for a group of vehicles at each intersection traveling at a specified speed, and then the traffic signals are strategically timed to turn green just as the group of vehicles arrives at each intersection. In order for the traffic signals to be synchronized, a group of signals must all be set to run on the same cycle length.
z Traffic Signal Priority and Preemption are strategies of giving special signal timing treatment to transit vehicles or emergency vehicles at signalized intersections. For signal preemption, normal

Congestion ManagementConnect SoCal 27
operation of traffic lights is preempted green to allow emergency vehicle s to help reduce response times and enhance safety. For signal priority, transit vehicles are allowed priority access through intersections or at crossings to prevent collisions and increase passenger throughput.
z Central Traffic Control Systems are centralized adaptive traffic signal control systems used by most counties and many cities in the SCAG region, including the City of Los Angeles Automated Traffic Surveillance and Control (ATSAC) system. These systems provide real-time monitoring and adjustment of signal timing.
Incident Management Systems – Incident Management Systems are a combination of policies and strategies that effectively coordinate the available resources to reduce incident durations. Incident management strategies include enhanced incident management systems that entail upgrading or enhancing the current incident management system to include deployment of ITS field devices, central control/communications software, communications medium (e.g., fiber optics), advanced traveler information systems, and/or freeway service patrols to reduce incident detection, verification response, and clearance times.
Traveler Information Systems – Traveler Information Systems provide travelers with information in two categories: pre-trip and en-route using existing and evolving technologies, such as changeable message signs, weather detection/warning, information kiosks, highway advisory radio, etc. Advanced Traveler Information Systems (ATIS) include traveler information dispensed through 511 and other mobile systems that empower travelers to manage their trips in the most efficient manner.
Regional Integration of Intelligent Transportation Systems (RIITS) – RIITS compiles data from ITS systems throughout Southern California to produce data on multi-modal transportation operations across boundaries, agencies and private partners. This supplemental data is sometimes known as a “system of systems” because it combines other regional systems. Some of the systems that comprise RIITS are ports, commercial vehicles, freeway operations, transit, airports and active transportation. The information can be tailored to virtually
any consumer or agency’s need. It is an important component of the panoply of data which agencies in the region may access.
RAIL ITS STRATEGIESPositive Train Control (PTC) – PTC is a set of highly advanced technologies designed to automatically stop a train before certain types of accidents occur. Specifically, PTC, as mandated by Congress in the Rail Safety Improvement Act of 2008 (RSIA), must prevent train-to-train collisions, derailments caused by excessive speed, unauthorized incursions by trains onto sections of track where maintenance activities are taking place, and movement of a train through a track switch left in the wrong position. PTC will not prevent accidents caused as a result of track or equipment failure, improper vehicular movement through a grade crossing, trespassing on railroad tracks, and some types of train operator error.
PTC is a sophisticated, predictive system that works to prevent accidents. The technology must account for a number of factors to measure the appropriate train stopping distance, including train information (weight, length), track composition (curvature, terrain), train speed and train authority (authorization to move across a stretch of track) . There are three main elements of a PTC system, which are integrated by a wireless communications system:
z Onboard or Locomotive System – This system monitors the train’s position and speed and activates braking as necessary to enforce speed restrictions and unauthorized train movement into new sections of track.
z Wayside System – The wayside system monitors railroad track signals, switches and track circuits to communicate authorization for movement to the locomotive.
z Back Office Server (BOS) – The BOS is the storehouse for all information related to the rail network and trains operating across it — speed limits, track composition, speed of individual locomotives, train composition, etc. — and transmits the authorization for

Congestion ManagementConnect SoCal 28
individual trains to move into new segments of track.2
In the SCAG region, Metrolink has fully implemented its PTC system.
TRANSIT ITS STRATEGIESAutomatic Vehicle Location (AVL) – AVL systems detect bus locations, direction, speed, and arrival and departure information. AVL systems enable:
z the monitoring of bus performance to increase operational efficiency,
z improved safety and security, and
z Enhanced customer information such as real-time arrival and departure information and trip planning that increase ridership and customer satisfaction.
AVL systems are often used in conjunction with TSP systems to improve running times and reduce delays to reduce operational costs and inefficiencies, and are a primary component of BRT and BRT Light systems.
Transit Signal Priority (TSP) – TSP gives transit vehicles signal priority to improve passenger throughput and bus speed. These are either hard-wired loop detection systems or wireless systems. Most commonly, the green phase is extended to allow a transit vehicle through the intersection.
Advanced Passenger Counting Systems (APCs) – These systems automatically count boarding and alighting passengers. The boardings are acquired through the fare payment transactions or with APCs, while the alightings must be acquired through APCs. APCs allow for a total population of boardings and alightings to be recorded by a transit operator, resulting in optimal route scheduling and planning.
Smart Cards/Electronic Fare Systems – Smart card systems speed boarding, reduce stop dwell time and reduce fraud and fare evasion. They also improve in origin/destination information for optimal planning and scheduling.
2 Association of American Railroads, Freight Railroads and Positive Train Control.
Smart cards may also have a cash purse that can be used for non-transit, retail transactions.
Traveler Information Systems - Traveler Information Systems include trip planning software, and real-time arrival and departure information for the transit customer.
CONNECTED AND AUTOMATED VEHICLESConnected and automated vehicle technologies involve less driver input and, in the future, completely driverless vehicles will have the potential to reduce congestion through better optimization of transportation facility supply by enabling more vehicles to use existing infrastructure. This will also have the potential to improve safety, as most collisions are due to human error. Some connected and automated vehicle technologies are already available, but these are only a fraction of what will be available in the future. Automated vehicle technology includes the ability to rely on digital maps and on-board sensing to operate with minimal or without any driver input, and connected vehicle operation is where vehicles communicate with each other and roadway infrastructure such as traffic signals and roadway sensors.
Connected vehicles are vehicles that use communication technologies to communicate with the driver, other vehicles (vehicle-to-vehicle), roadside infrastructure (vehicle-to-infrastructure), and the Cloud. Connected and automated vehicles improve vehicle efficiency, commute times and safety. The U.S. Department of Transportation’s National Highway Traffic Safety Administration (NHTSA) has defined vehicle automation into five levels:
z No-Automation (Level 0) - The driver is in complete and sole control of the primary vehicle controls – brake, steering, throttle, and motive power – at all times.
z Driver Assistance (Level 1) - Automation at this level involves one or more specific control functions. Examples include electronic stability control or pre-charged brakes, where the vehicle automatically assists with braking to enable the driver to regain control of the vehicle or stop faster than possible by acting alone.

Congestion ManagementConnect SoCal 29
z Partial Automation (Level 2) - This level involves automation of at least two primary control functions designed to work in unison to relieve the driver of control of those functions. An example of combined functions enabling a Level 2 system is adaptive cruise control in combination with lane centering.
z Conditional Automation (Level 3) - Vehicles at this level of automation enable the driver to cede full control of all safety-critical functions under certain traffic or environmental conditions and in those conditions to rely heavily on the vehicle to monitor for changes in those conditions requiring transition back to driver control. The driver is expected to be available for occasional control, but with sufficiently comfortable transition time.
z High Automation (Level 4) - The vehicle is designed to perform all safety-critical driving functions and monitor roadway conditions for an entire trip. Such a design anticipates that the driver will provide destination or navigation input, but is not expected to be available for control at any time during the trip. This includes both occupied and unoccupied vehicles. Vehicles with Level 4 automation may also be referred to autonomous vehicles.
z Full Automation (Level 5) – The vehicle is capable of performing all driving functions under all conditions. The driver may have the option to control the vehicle.
Only Level 3 is currently in operation at this time, however, the federal government and manufacturers are now developing, and testing Level 4 automation technologies on public roads in certain states that have passed enabling legislation which includes California.3
3 Center for Advanced Automotive Technology, Connected and Automated Vehicles
EXISTING SYSTEM PERFORMANCE
FREEWAYS/HIGHWAYS AND ARTERIALSThe Southern California freeway system has an extensive ITS network that covers most of the urbanized portion of our region. Loop detectors in the pavement and video cameras provide information on speed and volume, and identify congestion and incidents which are fed to Caltrans/California Highway Patrol (CHP) TMCs. The TMCs are staffed 24/7 by CHP and Caltrans personnel, and monitor and respond to changes in traffic conditions, including both planned events and emergencies. Information is conveyed to the public via radio, the Internet, and through changeable message signs located throughout the freeway system. These capabilities allow Caltrans to respond quickly to incidents and allow the public to adjust their travel plans. In addition to these “hard-wired” systems, freeway, highway and arterial speeds and incidents are provided by cell phone providers and companies such as Google.
Arterial ITS networks are in place throughout the SCAG region as well. Local arterial systems include advanced signal synchronization capabilities to increase vehicular throughput which also have the ability to detect and respond to changes in traffic volume or direction of travel, and manage incidents. Like the freeway network, these systems include loop and video detection and also rely on wireless data such as that provided by Google.
TRANSITMost medium to large scale fixed-route and Dial-a-Ride operators have implemented four of the five transit ITS components, with the exception of TSP. TSP however is an integral part of Metro’s Metro Rapid program, that has 18 routes. Santa Monica’s Big Blue Bus, Culver City Bus and Torrance Transit have either Rapid or local lines that employ TSP as well. Gardena’s G-Trans and Pasadena Transit have TSP in development for local lines. These TSP systems are a combination of hard-wired loop technology as well as wireless technology.
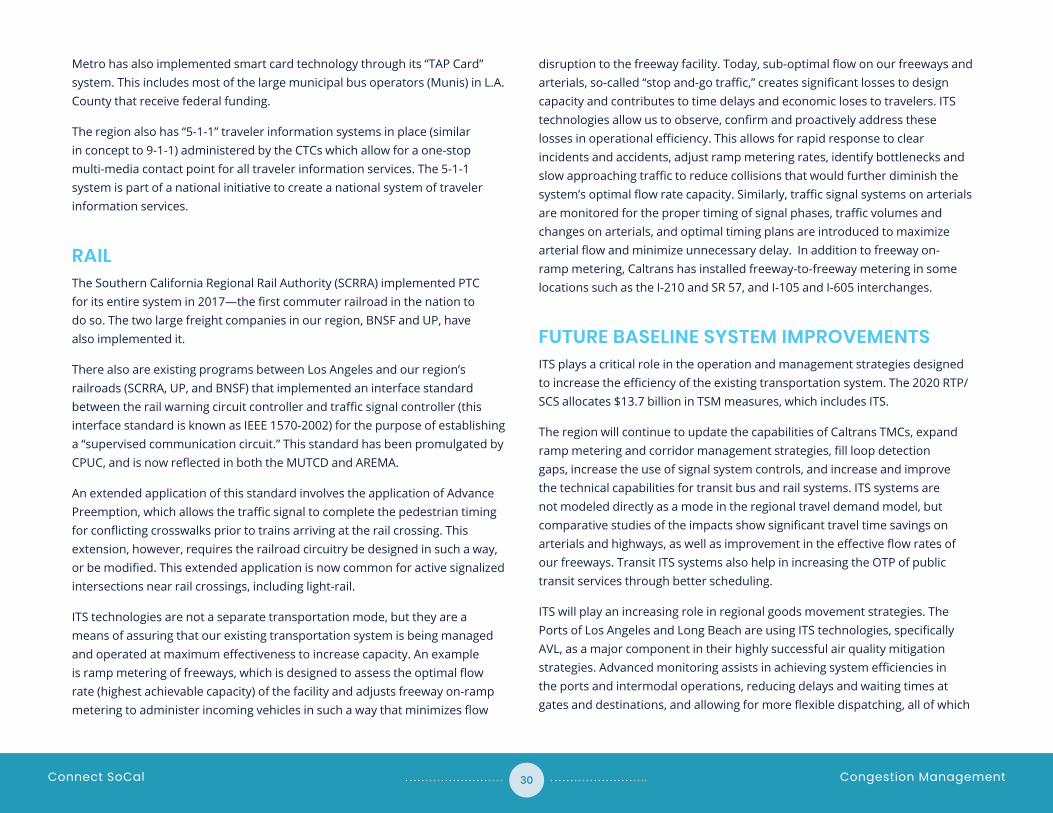
Congestion ManagementConnect SoCal 30
Metro has also implemented smart card technology through its “TAP Card” system. This includes most of the large municipal bus operators (Munis) in L.A. County that receive federal funding.
The region also has “5-1-1” traveler information systems in place (similar in concept to 9-1-1) administered by the CTCs which allow for a one-stop multi-media contact point for all traveler information services. The 5-1-1 system is part of a national initiative to create a national system of traveler information services.
RAILThe Southern California Regional Rail Authority (SCRRA) implemented PTC for its entire system in 2017—the first commuter railroad in the nation to do so. The two large freight companies in our region, BNSF and UP, have also implemented it.
There also are existing programs between Los Angeles and our region’s railroads (SCRRA, UP, and BNSF) that implemented an interface standard between the rail warning circuit controller and traffic signal controller (this interface standard is known as IEEE 1570-2002) for the purpose of establishing a “supervised communication circuit.” This standard has been promulgated by CPUC, and is now reflected in both the MUTCD and AREMA.
An extended application of this standard involves the application of Advance Preemption, which allows the traffic signal to complete the pedestrian timing for conflicting crosswalks prior to trains arriving at the rail crossing. This extension, however, requires the railroad circuitry be designed in such a way, or be modified. This extended application is now common for active signalized intersections near rail crossings, including light-rail.
ITS technologies are not a separate transportation mode, but they are a means of assuring that our existing transportation system is being managed and operated at maximum effectiveness to increase capacity. An example is ramp metering of freeways, which is designed to assess the optimal flow rate (highest achievable capacity) of the facility and adjusts freeway on-ramp metering to administer incoming vehicles in such a way that minimizes flow
disruption to the freeway facility. Today, sub-optimal flow on our freeways and arterials, so-called “stop and-go traffic,” creates significant losses to design capacity and contributes to time delays and economic loses to travelers. ITS technologies allow us to observe, confirm and proactively address these losses in operational efficiency. This allows for rapid response to clear incidents and accidents, adjust ramp metering rates, identify bottlenecks and slow approaching traffic to reduce collisions that would further diminish the system’s optimal flow rate capacity. Similarly, traffic signal systems on arterials are monitored for the proper timing of signal phases, traffic volumes and changes on arterials, and optimal timing plans are introduced to maximize arterial flow and minimize unnecessary delay. In addition to freeway on-ramp metering, Caltrans has installed freeway-to-freeway metering in some locations such as the I-210 and SR 57, and I-105 and I-605 interchanges.
FUTURE BASELINE SYSTEM IMPROVEMENTSITS plays a critical role in the operation and management strategies designed to increase the efficiency of the existing transportation system. The 2020 RTP/SCS allocates $13.7 billion in TSM measures, which includes ITS.
The region will continue to update the capabilities of Caltrans TMCs, expand ramp metering and corridor management strategies, fill loop detection gaps, increase the use of signal system controls, and increase and improve the technical capabilities for transit bus and rail systems. ITS systems are not modeled directly as a mode in the regional travel demand model, but comparative studies of the impacts show significant travel time savings on arterials and highways, as well as improvement in the effective flow rates of our freeways. Transit ITS systems also help in increasing the OTP of public transit services through better scheduling.
ITS will play an increasing role in regional goods movement strategies. The Ports of Los Angeles and Long Beach are using ITS technologies, specifically AVL, as a major component in their highly successful air quality mitigation strategies. Advanced monitoring assists in achieving system efficiencies in the ports and intermodal operations, reducing delays and waiting times at gates and destinations, and allowing for more flexible dispatching, all of which

Congestion ManagementConnect SoCal 31
reduce emissions. Weigh-in motion systems and enhanced detection will allow for better enforcement of commercial vehicles rules, reducing pavement damage, and identifying critical paths for goods movement planning in the future. For more information on ITS strategies for goods movement, please see the Goods Movement Technical Report.
ITS systems allow for enhanced capabilities to protect the transportation system and respond to emergencies. One goal of the 2020 RTP/SCS is to integrate transportation system information into a shared use capacity with emergency service responders. Visual safety systems, detection, AVL, and the ability to share this information with public safety agencies will assist in deterring, preparing for, responding to, and recovering from manmade security events and natural disasters. These technologies, although in place to manage the transportation system, can assist in providing a deterrence to crime and terrorism, as well as assist in major incident responses such as road closure or other events requiring the close coordination of evacuation vehicles.
RECOMMENDED STRATEGIES z Maintain and update the Regional ITS Architecture to assure
eligibility of federal funding from state-of-the-art ITS technologies for regional stakeholders.
z Continue the development of a Regional Configuration Management process among CTCs, Caltrans Districts, ports and local governments to assure consistent and compatible integration of ITS technologies and interoperable operations.
z Identify funding sources for transportation system operations and management strategies, including ITS, to ensure optimal operation of the existing and future transportation system in the region. This will be coordinated with the CTCs, Caltrans and other agencies implementing ITS technology.
z Implement near-term ITS priorities to improve the safety and efficiency of the current transportation system, including: ramp metering, increased freeway detection, monitoring of goods movement operations, advanced traveler information systems/5-1-1/
goods movement information systems, transit vehicle location and real-time schedule adherence, Rapid Bus systems, computer-based signal timing systems, interconnection between roadway traffic signals and railroad signal systems, automated fare collection and toll collection technologies.
z Identify ITS base systems for future integrated freeway and corridor management strategies, including potential congestion pricing systems and High Occupancy Toll Lanes.
z Mainstream ITS investments and make ITS systems part of the capital investment in new projects to assure optimal operations of new transportation investments.
SCAG’S ROLESCAG has a critical role in the development and management of ITS in the region. As the MPO, SCAG is charged with developing and maintaining the Southern California Regional ITS Architecture. This architecture is the regional planning tool for ensuring a cooperative process to prioritize and deploy ITS technologies and for identifying critical data connections between institutional stakeholders. This architecture assists the region in deploying ITS systems that are truly integrated and able to share information among many agencies in consistent and compatible formats to achieve improved safety and efficiency of transportation operations. SCAG works closely with the CTCs, local governments, and Caltrans Districts to update and maintain the regional architecture, and assure the use of required systems, engineering requirements, and applicable standards, which is required when federal funds are used on ITS projects.
In 2019, SCAG completed an update of its multi-county Regional ITS Architecture. It is the product of coordination between major stakeholders in the region, including all six counties. It incorporates recent updates to the National ITS Architecture, which is now an integrated framework called the Architecture Reference for Cooperative and Intelligent Transportation (ARC-IT) and incorporates the previously separate Connected Vehicle Reference Implementation Architecture. The SCAG update effort took an exhaustive

Congestion ManagementConnect SoCal 32
account of our current ITS security assets, as well as needs, challenges, opportunities and plans for the future of ITS security in the region.
At the same time, Metro debuted its update to the Los Angeles County ITS Architecture, called “Connect-IT,” with an accompanying website that identifies all ITS projects in the county. Available on the website for all residents, local governments and other stakeholders to access are: a report that takes a full view of the county’s ITS architecture, a database that details the interconnectivity of the ITS elements and data flows, and an online search portal that serves as a way for anyone to access the basic elements of the ITS architecture and its interconnectivity.
Table 4 Planned ITS Projects
Project Name Project Description Project Status Timeframe
Arterial InterfacesDevelop special event management systems to coordinate seasonal traffic, emergency management, disaster operations, and wide area evacuation by sharing of real-time traffic conditions across county boundaries by local agencies.
Planned 6+ years
Border Crossing Upgrades ICTC/Caltrans - border crossings Planned 1-6 years
Connected Vehicle Arterial ApplicationsPossible arterial connected vehicle V2I applications includeSignal Phase and Timing (SPAT), Restricted Lane Warnings, Pedestrian Safety, Intersection Safety Warning and Collision Avoidance
Planned 6+ years
Connected Vehicle Highway ApplicationsPossible highway connected vehicle V2I applications include Queue Warning, Curve Speed Warning, Road Weather Motorist Alert and Warning, Speed Harmonization, and In-Vehicle Signing.
Planned 3-8 years
Critical Transportation Infrastructure Surveillance and Information Dissemination
Implement traffic management systems and field elements on corridors with security concern or significances and or identified critical transportation infrastructure that are monitored and controlled by local agencies including CCTV, HAR, RWIS, DMS, vehicle detection stations, communications infrastructure, related to surveillance or information dissemination.
Planned 1-6 years
OVERVIEW OF PLANNED ITS PROJECTS IN SCAG REGIONSCAG’s updated Regional ITS Architecture defines a number of planned elements, interfaces and information flows. As regional plans are developed, these parts of the Architecture will be implemented by a series of projects, including those related to connected vehicle applications, transit signal priority, emergency response, express lanes, and goods movement. TABLE 4 provides a summary of these regional projects that have been identified through the architecture update process. The full architecture contains many additional planned interfaces that represent possible future interfaces that have not yet been defined in projects. Over time, additional projects will be developed to address further aspects of the architecture.
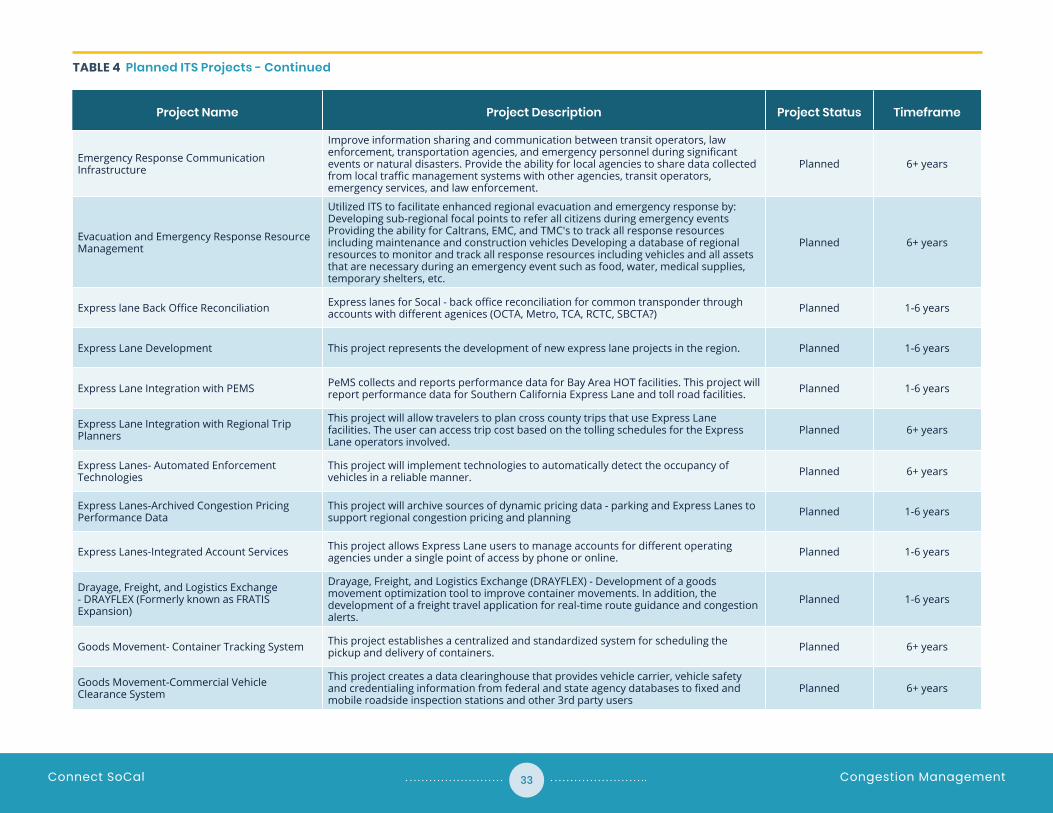
Congestion ManagementConnect SoCal 33
Table 4 Planned ITS Projects - Continued
Project Name Project Description Project Status Timeframe
Emergency Response Communication Infrastructure
Improve information sharing and communication between transit operators, law enforcement, transportation agencies, and emergency personnel during significant events or natural disasters. Provide the ability for local agencies to share data collected from local traffic management systems with other agencies, transit operators, emergency services, and law enforcement.
Planned 6+ years
Evacuation and Emergency Response Resource Management
Utilized ITS to facilitate enhanced regional evacuation and emergency response by: Developing sub-regional focal points to refer all citizens during emergency events Providing the ability for Caltrans, EMC, and TMC's to track all response resources including maintenance and construction vehicles Developing a database of regional resources to monitor and track all response resources including vehicles and all assets that are necessary during an emergency event such as food, water, medical supplies, temporary shelters, etc.
Planned 6+ years
Express lane Back Office Reconciliation Express lanes for Socal - back office reconciliation for common transponder through accounts with different agenices (OCTA, Metro, TCA, RCTC, SBCTA?) Planned 1-6 years
Express Lane Development This project represents the development of new express lane projects in the region. Planned 1-6 years
Express Lane Integration with PEMS PeMS collects and reports performance data for Bay Area HOT facilities. This project will report performance data for Southern California Express Lane and toll road facilities. Planned 1-6 years
Express Lane Integration with Regional Trip Planners
This project will allow travelers to plan cross county trips that use Express Lane facilities. The user can access trip cost based on the tolling schedules for the Express Lane operators involved.
Planned 6+ years
Express Lanes- Automated Enforcement Technologies
This project will implement technologies to automatically detect the occupancy of vehicles in a reliable manner. Planned 6+ years
Express Lanes-Archived Congestion Pricing Performance Data
This project will archive sources of dynamic pricing data - parking and Express Lanes to support regional congestion pricing and planning Planned 1-6 years
Express Lanes-Integrated Account Services This project allows Express Lane users to manage accounts for different operating agencies under a single point of access by phone or online. Planned 1-6 years
Drayage, Freight, and Logistics Exchange - DRAYFLEX (Formerly known as FRATIS Expansion)
Drayage, Freight, and Logistics Exchange (DRAYFLEX) - Development of a goods movement optimization tool to improve container movements. In addition, the development of a freight travel application for real-time route guidance and congestion alerts.
Planned 1-6 years
Goods Movement- Container Tracking System This project establishes a centralized and standardized system for scheduling the pickup and delivery of containers. Planned 6+ years
Goods Movement-Commercial Vehicle Clearance System
This project creates a data clearinghouse that provides vehicle carrier, vehicle safety and credentialing information from federal and state agency databases to fixed and mobile roadside inspection stations and other 3rd party users
Planned 6+ years

Congestion ManagementConnect SoCal 34
Table 4 Planned ITS Projects - Continued
Project Name Project Description Project Status Timeframe
Goods Movement-Disseminate Real Time CVO Information
Delivers real time information from multiple data sources and ITS services that is tailored to trucks. Information such as incident and road closures and terminal queue times supports the coordination of vehicle dispatch and route guidance to make turn times more reliable and predictable.
Planned 1-6 years
Goods Movement-Truck Fleet Communications Program
This project outfits truck fleets with two-way communications and mobile data terminals to collect and disseminate truck specific data to enhance commercial vehicle operations and provide public agencies with data for performance monitoring and incident management.
Planned 1-6 years
Goods Movement-Truck Fleet Data IntegrationAs part of the truck fleet communications program, this project integrates various data sources and companies providing technology to monitor truck location, speed and other valuable truck specific data.
Planned 1-6 years
Goods Movement-Truck Inspection Stations (Physical and Virtual)
Deployment of truck inspection stations in the SCAG region. These may include physical and/or virtual stations, over time. Planned 6+ years
IE511 Upgrades Expansion of Inland Empire 511 capabilities Planned 1-6 years
Integrated Corridor Management (ICM) Integrated multimodal transportation management and traveler information. Planned 1-6 years
ITS Data Repository
Develop and implement a web-based regional education tool for transit agencies, transportation agencies, law enforcement, and emergency responders to provide relevant data, links, and contact information to enhance awareness and use of existing ITS related data including traffic information, emergency preparedness and response, and evacuation plans.
Planned 1-6 years
Local Transit System TSP Expansion of TSP for local transit systems Planned 1-6 years
Metro BRT Expansion of BRT with TSP Planned 1-6 years
Multi Transportation Agency Regional Interfaces
Develop special event management systems to coordinate seasonal traffic, emergency management, disaster operations, and wide area evacuation by sharing traffic information among the Southern California Caltrans districts and transportation agencies to support a regional control strategy. Provide the ability to relinquish control of local agency signals to regional TMC during significant events or natural disasters to maintain regional traffic flows.
Planned 6+ years
Multi-agency Video Sharing and Distribution
Establish a common web enabled and secure clearing house for transportation video surveillance for use by multiple transportation and security agencies for security and event preparation, response, and evacuation. Provide the ability for images to be converted to a common selected and web capable format and then distributed through secure Internet and commercial wireless channels.
Planned 6+ years

Congestion ManagementConnect SoCal 35
Table 4 Planned ITS Projects - Continued
Project Name Project Description Project Status Timeframe
Non- Motorized Vehicles This project covers traffic management related efforts to provide support for non-motorized vehicles such as bicycles. Planned 6+ years
Ports Security
Enhance existing Port security systems through sensor and surveillance equipment to monitor all entrance points, critical infrastructure, perimeter security, and to track commercial vehicles/freight equipment, monitoring identities, monitoring freight equipment, and monitor commercial vehicles.
Existing 1-6 years
Ports Traffic Information
Enhance existing Port traffic information dissemination through Closed Circuit Television (CCTV) cameras, Changeable Message Signs (CMS), and gate queue detectors. Enable the ports to receive real-time traffic conditions from local agencies and disseminating real-time port information and traffic conditions to local agencies and to Commercial Vehicle Operators.
Planned 6+ years
Rail Automated Maintenance Support Long-term goal as funding becomes available. Relationship to PTC: This project would be supported by the restriction of train movements in work zone areas. Planned 6+ years
Rail GPS Train Location System
Project is underway and will be on-going for some time. The completion of the fiber communication is of importance. Human interpretation of information remains of importance in understanding train delays before posting of information. There is no fully automated on-time performance system. Relationship to PTC: This project would be supported by the deployment of onboard PTC equipment.
Planned 1-6 years
Rail Information DisseminationFuture real-time information projects including PDAs, e-mail and pagers, displays in trains. The current website has only static displays. Relationship to PTC: This project could be supported by data collected on real-time train movements.
Planned 6+ years
Rail Infrastructure Security
Install ITS devices including communication backbone to monitor and secure trains, rail cars, fixed assets (tracks, wayside equipment), highway-rail intersections and personnel with interfaces to traffic and emergency management centers. Relationship to PTC: This project would access data collected from various onboard and wayside PTC devices. Data shared using communication interfaces between the railroad operations centers and regional TMCs.
Planned 1-6 years
Rail Location and Notification
Provide the ability for rail operators (UP, BNSF) to notify public agencies in SCAG region of manifest data within 24hrs of receiving the data to allow first responders to properly respond in an emergency event. Implement necessary ITS elements to share train location and ID data with public agencies.
Existing 1-6 years
Rail Quad Gate Synchronization
Investigate alternate means of clearing the crossing by detecting vehicles that are still in the crossing as the first barrier is lowered and synchronize actions with traffic signal systems in the vicinity. Relationship to PTC: This project would be supported by PTC devices that monitor at-grade crossing safety. Events could trigger alerts that are communicated to the train operator by the computer aided dispatch (CAD) system or wayside signaling system. Onboard computers on the locomotives could apply brakes automatically if alerts or warnings are not acted on.
Planned 1-6 years
Regional Integrated GIS Database
SCAG shall offer a regional repository of GIS data for use by local agencies in emergency planning, and response, in a standardized format. Relationship to PTC: This project would include track geometries, location of wayside elements and other spatial data maintained by the PTC back office systems.
Planned 6+ years

Congestion ManagementConnect SoCal 36
Table 4 Planned ITS Projects - Continued
Project Name Project Description Project Status Timeframe
Regional Rail Grade Crossing Security
Improve rail grade crossing security and response to emergency events by: “ Using sensors and surveillance to monitor at-grade rail crossings “ Improving highway-railroad intersections with train detectors, advance warning systems and link train detectors to traffic signal system and EMS dispatch “ Utilizing ITS elements to direct vehicles to alternate routes at and in advance of blocked at-grade rail crossings on major arterials during train events (HAZMAT, derailment, train-vehicle collision) “ Providing the ability to view and control CCTV through a Windows based system that is compatible with Intelligent Roadway / Rail Interface System (IR/RIS) program and sub-regional ATMS and ATIS. Relationship to PTC: This project would be supported by PTC monitoring of at-grade crossing safety. Regional emergency response could be coordinated by exchanging data between the rail operations centers and regional TMCs.
Planned 6+ years
Regional Traveler Information
A general project category that covers potential multi-agency initiatives to increase integrated dissemination of traveler information as widely as possible throughout the Southern California Region. Relationship to PTC: This project would integrate real-time train location and predictive train arrival data obtained from PTC components.
Planned 1-6 years
Regional Traveler Information for Evacuation Routing and Emergency Diversion
This project should provide the ability to implement a multi-jurisdictional Advanced Traveler Information System (ATIS) to collect, process, validate, and disseminate both pre-trip and en route real-time information to public agencies, private stakeholders, and the public including: -Emergency and evacuation information regionally to inform travelers of an emergency event, affected areas, and evacuation instructions -Freeway/arterial congestion, video images, and links to alternative transportation services via web page(s) -Interstate/inter-region traveler information covering a wide area (targeted to CVO) This effort should support the MATIS system.
Existing 1-6 years
RIITS
The Regional Integration of Intelligent Transportation System (RIITS) network is the core project within the LA County Regional ITS Architecture that integrates different sources of transportation data from multiple agencies. The RIITS network features interfaces with MTA Bus, MTA Rail and Long Beach Transit for real-time transit arrival times and static schedules. The interface with Caltrans District 7 provides freeway and incident data. The RIITS network distributes the data to users through a XML data feed. The RIITS network currently supplies data to the MATIS traveler information service, local agencies, and information services providers who distribute the data to the public through a variety of applications. Future plans include data interfaces with Caltrans District 8 and 12 in neighboring counties, the Los Angeles County IEN, CHP, Foothill Transit and an archived data management system. LA Metro is currently developing an Archived Data Management Service (ADMS) that that will capture real-time data transmitted through the RIITS network. The ADMS will store three years of historical data for all modes of transportation from the various participating agencies. The ADMS database could be used to monitor system performance, support regional and corridor-level planning efforts and provide input for project funding applications. The ADMS is expected to support the MATIS program and support performance evaluation for future Express Lane operations.
Existing/Planned Ongoing

Congestion ManagementConnect SoCal 37
Source: SCAG
Table 4 Planned ITS Projects - Continued
Project Name Project Description Project Status Timeframe
Security Threat and Guidance Clearinghouse
Develop a SCAG database and GIS resources with a security threat and response guidance expert system and information process. Allow for the receipt of generalized threat information from federal, state, and regional law enforcement and security agencies, and then translate it into meaningful areas of security focus for transportation agencies. Include a combination of upfront threat identification and risk classification to allow for generalized threats as an input. Provide a series of guidelines and expert input to boil threats down into key focus areas and suggestions distributed to transportation agencies via e-mail, fax, and/or web.
Planned 6+ years
Smart Parking Technology initiatives to improve on street and garage parking Planned 1-6 years
SoCal511 Upgrades Expansion of 511 capabilities Planned 1-6 years
Traffic Control and Management Systems
Implement traffic control and management systems to enhance emergency response and evacuation including: -Providing centralized Traffic Control Systems (TCS) to cities for signal monitoring and control, incident management, event management, transit coordination, ITS element control and provide connection to sub-regional TMC and adjacent cities. -Implement an Advanced Traffic Management System (ATMS) to detect and monitor signal status, identify traffic congestion and incidents, and display information through a fully integrated mapping function. -Provide ATMS data sharing capability to coordinate operations with Caltrans and adjacent cities and provide arterial information to a traveler information system covering a larger area and multiple modes.
Planned 6+ years
Universal Fare System (UFS)
The UFS will consolidate fare and revenue collection for Metro bus, Metro rail and municipal transit operators throughout Los Angeles County. The Transit Access Pass (TAP) will serve as the regional smartcard that transit users could use to pay for fares on services operated by agencies participating in the UFS. The UFS deployment includes TAP readers on buses, barrier gates / TAP readers at Metro Rail stations and a clearinghouse service center to process fare transactions. Though the TAP program serves transit users in Los Angeles County, there is potential for future interactions with Metrolink or transit providers in neighboring counties.
Planned 1-6 years
Upgraded Rail Passenger Information Signs
Includes future capital projects entailing the following: Electronic passenger information system Relationship to PTC: This project would use real-time train location data to provide predictive train arrival information. The information could be distributed to the public through regional traveler information services such as Go511 and Inland Empire 511.

Congestion ManagementConnect SoCal 38
TRANSPORTATION DEMAND MANAGEMENTThe Federal Highway Administration (FHWA) defines TDM as “a set of strategies aimed at reducing the demand for roadway travel, particularly in single occupancy vehicles (SOVs).” TDM investments reduce congestion and shift trips from SOVs to other modes through projects that often cost significantly less than roadway or transit capital expansion projects. TDM strategies and options add transportation choices that improve sustainability, public health and the quality of life by reducing congestion, air pollution and greenhouse gases.
Transportation Demand Management (TDM) and the related TSM rose to prominence in the 1970’s and 1980’s as cost-effective alternatives to road capacity expansions. TDM strategies are of two kinds: voluntary, or “soft,” strategies— like preferential parking for carpoolers—that aim to lure some to alter their travel behavior in response to voluntary inducements, and “hard” strategies—like increased parking pricing—that shift the behavior of a large number of travelers by changing the price of travel. TDM also can include regulatory strategies, such as regional employer ridesharing mandates. The SCAG region has been home to some of the more innovative and successful TDM efforts over the years. Some examples include rideshare programs, parking cash out and park-and-ride lots.
Careful evaluations of these efforts, and others around the U.S., have shown that soft TDM strategies can be very effective in reducing SOV travel at the scale of a large employment site, but that the staying power of soft TDM strategies can fade over time without constant attention from employers or the accompaniment of hard TDM strategies. Hard TDM strategies, like road and parking pricing, have been shown to influence travel behavior more durably and, depending on the application, over much larger geographies.
This does not mean that soft TDM strategies should be dismissed and hard TDM strategies implemented. Precisely because the travel behavior effects are so significant, hard strategies can be controversial and require significant analysis, consensus building, and public education prior to implementation. However, pricing benefits have proven to be more sustainable over time and complement the integrated land use strategies adopted by the region.
In general, TDM strategies complement each other. More employees might use a transit subsidy or carpool and vanpool if a guaranteed ride home (GRH) program were in place in the event of a family emergency or unscheduled overtime. If the employer were to also implement a parking cash-out program, the number of transit users would likely increase further.
Effective TDM programs can increase choices for travelers, and reduce per capita non-renewable energy consumption and emissions. When transit usage, carpooling, biking and walking increase, transportation system efficiency tends to increase, bringing many benefits to the region. Thus, these benefits can justify substantial public expenditures on effectively implemented soft TDM programs, even absent regional congestion benefits. A following appendix, created as part of the TDM Strategic Plan, outlines recommended TDM strategies that could be employed in Southern California.
In summary, Connect SoCal commits $7.3 billion through 2045 to fully implement TDM strategies throughout the region. There are three main areas of focus:
z Reduce the number of SOV trips and overall VMT through ridesharing, which includes carpooling and vanpooling, and supportive policies for shared ride services such as Uber and Lyft, to provide first/last mile services to/from transit.
z Redistribute or eliminate vehicle trips from peak demand periods through incentives for telecommuting and alternative work schedules.
z Reduce the number of SOV trips through use of other modes of travel such as transit, rail, bicycling and walking, or new micromobility services.
TDM strategies are particularly applicable for regional job centers, which are locations with significantly higher existing employment density than the areas around them. As discussed in Connect SoCal, SCAG identified over 60 job centers containing roughly one-third of the region’s employment, where prioritized growth can take advantage of existing density and multi-modal infrastructure. Investment in TDM within a select group of 21 of these locations can support a shift to alternative modes of travel other than single occupancy

Congestion ManagementConnect SoCal 39
vehicles, thereby increasing average vehicle ridership up to 1.5.
Recent efforts further support the expansion of TDM in the SCAG region. In 2018, SCAG initiated a study to develop a TDM Strategic Plan that provided an objectives-driven, performance-based planning process to identify and promote TDM strategies and programs that increase the efficiency of the transportation system through alternative modes of travel to the SOV. Also in 2018, California enacted AB 2548, which authorizes Metro to adopt a commute benefit ordinance that requires employers in Los Angeles County with 50 or more employees to offer employee commute benefits covering transit passes and vanpool charges. Through these and other employee commute trip reduction programs, TDM-supportive policies and incentives such as those recommended in the TDM Strategic Plan, and the TDM investments called for in Connect SoCal, SCAG estimates a 2.8 percent reduction of drive-alone work trips by 2045.
TDM STRATEGIC PLANTo develop the TDM Strategic Plan, SCAG formed a technical advisory committee that included CTCs, local jurisdictions and private sector stakeholders to provide feedback and expertise.
The TDM Strategic Plan builds off TDM strategies, programs and planning processes in the current 2016 RTP/SCS and directly support development of Connect SoCal. Major study tasks included:
z assessing the current state of TDM planning and implementation in the region,
z identifying best practices and opportunities for improvement and expansion of TDM,
z understanding the impact and opportunities provided by new mobility and technology innovations,
z developing regional TDM goals and objectives that align with state and federal mandates including congestion reduction, air quality, and sustainability; and
z developing performance measures to evaluate the effectiveness of
corridor level, local and regional TDM strategies.
An existing conditions and SWOT analysis was conducted for the strategic plan which resulted in several key findings. They are:
1. Regulation, when enforced, is a major driver in shaping TDM strategy and the level of investment put forth by both the public and private sectors.
2. Lack of sufficient of standardized data collection makes evaluation of program effectiveness very difficult.
3. Technological advances provide an opportunity to collect better data and improve user experience for TDM programs in the SCAG region.
Strategies to address these issues include establishing a regional standard for performance measurement and helping agencies collect useful data; providing guidance to municipalities and transit agencies that want to partner with the private sector; and supporting updates to municipal programs that require regular monitoring and enforcement of TDM requirements.
The completed TDM Strategic Plan offered recommendations to improve TDM practice and prevalence in the SCAG region. They are categorized into five subject areas and are as follows.
DISSEMINATION1. Create a dedicated page on SCAG’s website to share the TDM
Strategic Plan’s deliverables, such as the updated TDM Toolbox of Strategies, their potential application to congested corridors and areas, and TDM best practices.
2. Convene periodic TDM training sessions/seminars in each of SCAG’s six counties for various stakeholders including city and employer staff.
MEASUREMENT1. Establish a TDM regional data clearinghouse.
2. Formalize performance metrics and facilitate data collection

Congestion ManagementConnect SoCal 40
and reporting.
PARTNERSHIPS1. Convene regional forums designed for TDM policymakers
and implementers.
2. Support county efforts to consolidate ridematching databases.
3. Facilitate partnerships between the public and private sectors, through trainings and template agreements, to support collaboration between local governments/agencies and private providers of technology and new mobility services.
4. Facilitate the development of Transportation Management Agencies (TMAs) and Transportation Management Organizations (TMOs).
POLICY1. Provide training workshops for local jurisdictions on best practices
to incorporate TDM into different policy instruments such as general plans, specific plans and overlay districts, and how to update legacy TDM ordinances. Also provide training workshops to developers and property managers who must comply with local requirements.
2. Support development of new or updated TDM ordinances with stronger monitoring and enforcement elements, and share best practices and lessons learned.
3. Support development of state and national policy to encourage TDM delivery.
PROGRAMMING1. Conduct a study to develop comprehensive understanding of
incentives on mode choice and behavior change to support identification of the most effective TDM incentive programs.
2. Encouragement of telework policy in the region.
3. Recognize successful TDM programs through an annual TDM award.
4. Support the consideration of goods movement/delivery services in TDM planning.
5. Provide and promote TDM grant opportunities.
RIDESHARINGThe SCAG region continues to invest heavily in High Occupancy Vehicle (HOV) and express lane (High Occupancy Toll) infrastructure that provide incentives for commuters to share rides with others or take express transit services. CTCs and large employers in our region provide carpool and vanpool matching services and sometimes subsidies. Many large employers have guaranteed ride home (GRH) programs to act as an additional incentive for employees to carpool and vanpool. If they need to get home early due to an emergency of for some other reason, or have to stay late, they don’t have to worry about not having their car at work.
CARPOOLING AND VANPOOLINGCarpooling is commonly defined as when two or more people share a ride, traditionally to work, but also for other trip purposes. Carpooling has been a TDM strategy for a long time, and can save people significant amounts of financial resources since one car is being used instead of two or three. In the case where two people would be using two cars for the same trip, VMTs are reduced by half, with the resulting decrease in congestion and air pollution and VMTs. CTCs in our region provide carpool matching services through their 511 databases. Many employers also provide employees with a financial incentive such as a monthly stipend.
Vanpooling is similar to carpooling, but vanpools generally involve more people. A vanpool is generally a group of five to 15 people who regularly travel together to work usually around 30 miles or more (roundtrip) in a comfortable van at least 13 days out of the month. Typically, riders pay a monthly fare and maintenance fee, while drivers ride at a discounted rate in exchange for driving and maintaining the van. Many employers and CTCs have vanpool programs and subsidize them. Subsidy rates typically range from 20 percent to

Congestion ManagementConnect SoCal 41
50 percent of the vanpool lease cost, or up to $400 in the case of Los Angeles and Orange counties.
CARSHARECarshare involves membership-based programs where individuals can sign up to have hourly access to a pool of vehicles and then return them to the same or a different place from where they were picked up. Unlike traditional car rentals, vehicles can be picked up at designated spots around the city, usually in public parking lots. Zipcar is one of the more popular roundtrip platforms. One-way carshare allows members to take a vehicle and leave it at a different station, or anywhere within allowed boundaries. Zipcar provides one-way service, and another company, Car2go, also has programs in San Diego and our region.
There is also private car rental services where owners rent out their cars for certain periods of the day or month. Companies such as RelayRides and Getaround are facilitating this service. The most quoted analysis of the impact of carshare services shows that nine to 13 vehicles are taken off the road for each car sharing vehicle.
SCAG and its partners will strengthen their efforts to encourage ridesharing and other trip reducing strategies that aim to reduce vehicle trips, energy consumption, air pollution and GHGs. These efforts include:
z Encourage local governments to require parking cash out programs, where feasible.
z Encourage cities to reconsider minimum parking requirements in zoning ordinances.
z Encourage the development and viability of Transportation Management Organizations/Agencies at major employment locations throughout the region.
z Program public funds in the FTIP to educate employers and expand the GRH Program.
z Provide seamless intra- and inter-county vanpool and carpool services to the regional traveler.
z Encourage park-and-ride lots along suburban corridors, and in bedroom communities.
z Identify current dedicated funding sources and work with CTCs and partners on identifying additional new funding sources.
z Increase the number of commuter vanpools through more effective marketing and the provision of non-monetary public sector incentives.
z Maintain and sustain a regionally coordinated marketing strategy among the public and private sectors to enhance vanpool programs, increase ridership and improve outreach efforts.
INTELLIGENT PARKINGIntelligent parking assists drivers in efficiently locating parking spots through ITS and smart phone apps. Through a smart phone app, a driver can locate vacant or soon-to-be-vacant parking spots in parking facilities such as structures and on-street parking managed by cities. Intelligent parking can:
z reduce traffic congestion,
z decrease air pollution and GHG emissions, and
z improve safety (drivers not distracted by hunting for spaces).
Intelligent parking can also increase parking supply through variable peak-period pricing. This variable peak-period pricing coupled with advance information about parking availability may encourage mode shift to transit or active transportation as drivers may determine the price to be too high or learn in advance the challenge in finding available parking. In addition to parking location and supply information, intelligent parking smart apps can allow drivers to purchase parking remotely through their smart phones. Intelligent parking includes Automated Parking, which improves the efficiency of parking structures by increasing capacity versus conventional parking structures. While increasing parking supply alone could result in an increase in personal vehicles trips, it reduces the need for conventional parking spaces in high parking demand areas, thus freeing much-needed real estate for other uses. Automated parking systems can be implemented together with intelligent parking and pricing to minimize negative externalities associated with increasing parking supply.

Congestion ManagementConnect SoCal 42
TELECOMMUTING/WORK-AT-HOME/FLEXIBLE WORK SCHEDULESIncreasing the number of workers who work-at-home (self-employed, home-based business owners) or who telecommute/telework (wage and salary employees conducting some or all of their work from home or remotely) decreases home-based work trips, VMT, congestion, air pollution and GHGs.
Telecommuting/teleworking can be defined as working outside the traditional office or workplace, usually at home, but also remotely while traveling, at client/customer workplaces, libraries and other Internet accessible locations.
Flexible work schedules involve adjusting hours an employee works, for example working 7:00 to 3:30, or 10:00 to 6:30 instead of 9:00 to 5:30. It also includes 9/80 and 10/40 schedules where employees work nine, nine hour days a pay period or eight, 10 hour days per pay period.
According to the AQMD Rule 2202 Employee Commute Reduction Program (ECRP) data, roughly eight to nine percent of all workers in the South Coast Air Basin utilized a flexible work schedule in the last 15 years.
SCAG defines three types of teleworkers based on their home and primary work locations:
z Self-employed home workers, for whom home is their primary work location;
z Remote employee home workers, who work remotely from home and do not regularly commute to their firm’s location; and
z Telecommuters, who are defined by one travel behavior characteristic on the teleworking day: they do not make a commute tour (i.e., a minimum of two trips that begin or end at home, with a stop at a regular work location in between these home ends).
According to the American Communities Survey, the percentage of employees who work from home in the SCAG region has grown from 2.64 percent in 1990 to 5.67 percent in 2017. The growth has been more pronounced since 2010, especially in the last few years.
Some literature argues that while flexible work schedules and telecommuting may reduce (or, in the case of satellite offices, reroute) SOV commute trips, it may actually increase SOV trips for other trip purposes, such as errands and trips for lunch while an employee is working from home (although not necessarily during peak congestion periods). This is known as the rebound effect. It is also contended that telecommuting may encourage people to live farther from their workplaces than they would otherwise. Results of these studies vary significantly. Some studies suggest there is no conclusive evidence that telecommuters have more non-work travel than on non-telecommuting days, while other studies estimate rebounding VMT between 10 percent and 25 percent.
SCAG FUTURE OF THE WORKPLACE STUDYSCAG’s Future of the Workplace study, a part of SCAG’s Future Communities Initiative, began in 2018 in order to inform 2020 Connect SoCal and beyond. Tasks included a comprehensive literature review on teleworking, including variants of teleworking such as telecommuting, home working, and home-based businesses. The study also analyzed all available data sources for SCAG’s modeling assumptions and provided current and future estimates of teleworking while also reviewing the linkages between telework and VMT reduction.
In addition, the study seeks to better understand teleworkers and the impact of emerging trends in the nature of the workplace. The study included a review of co-working spaces and a survey of users of co-working spaces in the SCAG region. Another survey of teleworkers in the SCAG region was conducted in order to understand characteristics not present in existing data including detailed information about travel patterns, household characteristics, work arrangements, reasons for teleworking, and how teleworking impacts choices for living and working locations. Finally, the study investigated the potential long-term impacts of structural changes in the nature of work including the potential for workplace automation and the rise of the gig economy.

Congestion ManagementConnect SoCal 43
COWORKINGCoworking means sharing a space with other professionals, even if they do not work in the same industry or company. Coworking spaces are usually membership-based workspaces where freelancers, startup employees or entrepreneurs, remote workers, and other independent professionals work together in a shared, communal environment either occasionally or on a full-time basis. A variety of names have been used to describe these shared coworking spaces, including serviced offices, executive suites, business centers, flexible workspaces, or workspace-as-a-service. According to the Pew Research Center, four percent of Americans have worked in a coworking site.
While shared workspaces have grown at incredible rates4 (200 percent) over the past five years, this may be more reflective of the supply rather than the demand for such spaces. Emergent Research has forecasted a 14.7 percent average annual growth rate in the number of coworking site members between 2018 and 2022.
THE GIG ECONOMYThe gig, sharing, or online economy refers to emerging markets for temporary work arrangements that are enabled through online work marketplaces and web-based gig work platforms. Gig work implies non-traditional work arrangements such as TNC drivers that are understood to be temporary and performed on-demand. This growth is being enabled through web platforms and apps that directly connect workers seeking gig work to individuals and businesses.
The gig economy is expected to be a rapidly changing and evolving sector of the overall economy, with significant and unforeseen effects on the future of the workplace and VMTs. A Pew Center piece from 2016, titled “Gig Work, Online Selling and Home Sharing” revealed eight percent of Americans have “earned money in the last year using digital platforms to take on a job or task.”
4 AllWork. Coworking is the New Normal, and These Stats Prove It. Cecilia Amador. March 15, 2018. https://allwork.space/2018/03/coworking-is-the-new-normal-and-these-stats-prove-itt/
TRANSIT AND RAILChanges in land use patterns around our transit investments, referred to as Transit Oriented Development (TOD), reduce SOV travel and VMT through increased transit use and Active Transportation, and provide better access to local jobs and services. Many TOD projects have been built in our region since the 2016 RTP/SCS, and many more are under construction and planned. These projects will play a significant role in reducing SOV travel and VMTs.
Significant transit investment has been made since the 2016 RTP/SCS, primarily based on voter-approved county sales tax measures. Following are major transit projects in various stages of planning and construction:
z Purple Line extension to Westwood
z Gold Line extension to Montclair (2B) and possibly Ontario International Airport (2C)
z Speed and service improvements on the LOSSAN Corridor and Metrolink Network
z CA High-Speed Train Phase One
z Orange County Streetcar
z New BRT services in Orange, Riverside and San Bernardino Counties
z Redlands Rail Arrow Service
z Metro’s 28 by 28 Measure M-funded projects.
Some of the benefits of investing in transit and rail are:
z New and enhanced transit services that provide new commute choices for commuters and residents
z Cleaner air and reduced congestion, VMTs and GHGs
z Facilitation of current and future smart growth and sustainable communities
z The ability for residents to choose a healthier, more active lifestyle
z The ability for residents who do not own a vehicle to remain mobile and active

Congestion ManagementConnect SoCal 44
ACTIVE TRANSPORTATION AND FIRST/LAST MILEActive Transportation and First/Last Mile strategies also play a crucial role in SCAG’s Congestion Management Process. These include notable strategies like pedestrian facility and safety improvements, bikeshare, which continues to expand throughout our region, and wayfinding improvements. For a detailed discussion of these strategies, please refer to the Active Transportation report.
LAND USEThe Baseline Growth Forecast in 2020 Connect SoCal links housing to transportation planning, considering both needs simultaneously. SCAG undertook a regional growth forecast effort to provide the foundation for 2020 Connect SoCal and the Regional Housing Needs Assessment for the next housing element cycle. Forecasts for the 2021 through 2029 planning years were developed through a bottom-up approach, wherein SCAG staff worked with local jurisdictions to attain the most up to date data.
This approach ensures that the resulting assumptions are consistent with planned transportation infrastructure. The baseline growth forecast provides the basis for developing the land use assumptions at the regional and small-area levels which build 2020 Connect SoCal Plan Alternative.
HIGH-QUALITY TRANSIT CORRIDORS (HQTCS) AND MAJOR TRANSIT STOPS2020 Connect SoCal is placing a major emphasis on TOD and smart growth projects around HQTCs and major transit stops. A HQTC is a corridor with fixed route bus service with service intervals no longer than 15 minutes during peak commute hours. A major transit stop is a transit stop that is a rail transit station, a ferry terminal served by either a bus or rail transit service, or the intersection of two or more major bus routes with a frequency of service interval of 15 minutes or less during the morning and afternoon peak commute periods.
The Sustainable Communities and Climate Protection Act of 2008, SB 375, created residential or mixed-use residential projects that may be exempt from,
or subject to a limited review of, CEQA. The bill specifically states that these “transit priority projects” should:
z contain at least 50 percent residential use, based on total building square footage and, if the project contains between 26 percent and 50 percent nonresidential uses, a floor area ratio of not less than 0.75;
z provide a minimum net density of at least 20 dwelling units per acre; and
z be within one-half mile of a major transit stop or high-quality transit corridor (HQTC).
A project is considered to be within one-half mile of a major transit stop or HQTC if all parcels within the project have no more than 25 percent of their area farther than one-half mile from the stop or corridor and if not more than 10 percent of the residential units or 100 units, whichever is less, in the project are farther than one-half mile from the stop or corridor.
SB 743 was signed into law in 2013 and provides further opportunities for CEQA exemption and streamlining to facilitate transit oriented development (TOD). Specifically, certain types of projects within “transit priority areas” (TPAs) can benefit from a CEQA exemption if they are also consistent with an adopted specific plan and the regional Sustainable Communities Strategy (SCS). A TPA is an area within one-half mile of a major transit stop that is existing or planned, if the planned stop is scheduled to be completed within the planning horizon included in a Transportation Improvement Program adopted pursuant to Section 450.216 or 450.322 of Title 23 of the Code of Federal Regulations. In addition, aesthetic and parking impacts of certain infill projects within a TPA shall not be considered a significant impact on the environment. Finally, SB 743 also provides CEQA relief for a larger infill opportunity zone.
CONGESTION PRICINGConsistent with SCAG’s emphasis on system management as embodied in the mobility pyramid, SCAG planning efforts have focused on strategies such as the integration of pricing to reduce congestion, more efficiently utilize existing capacity and offer travelers greater choices and improved travel time reliability.

Congestion ManagementConnect SoCal 45
In 2013, SCAG conducted the Express Travel Choices Study, which reviewed a variety of congestion pricing options and their potential applicability to the SCAG region based on mobility, economic and equity impacts. Three promising strategies were identified, two of which were incorporated into the 2012 RTP/SCS and subsequent RTP/SCS updates:
z A network of express lanes, which connects and expands express lanes already in place or in progress and can accommodate ever-growing inter-county travel, and
z A mileage-based user fee to establish a structurally sound funding source for taking care of our aging infrastructure and expanding travel options.
The third promising strategy, cordon/area pricing, required additional analysis to identify the most promising geographic area and system design for initial testing. Cordon/area pricing involves charging a variable or fixed fee to drive into or within a highly congested area. This led in 2019 to SCAG’s Mobility Go Zone & Pricing Feasibility Study, which examined the potential application of cordon pricing to the Westside, located in the Cities of Los Angeles and Santa Monica. The report states that historically, pricing of transportation facilities in the region has been used primarily to generate revenue for the operator of the facility to cover the costs of construction and/or ongoing operations. More recently, pricing has been implemented as a demand management tool. Pricing a transportation facility can make users more aware of the direct and indirect costs of their travel choices and encourage a change in travel behavior. Creating a more balanced transportation network through pricing can lead to improved mobility for all users.
Recent technological advancements related to fee collection have allowed for increasingly more sophisticated pricing strategies. Pricing strategies in the SCAG region began with the State Route (SR) 91 Express Lanes that employ variable time-of-day pricing along a single corridor so that paying customers can utilize the facility at a high level of service. Recent pricing tools in Los Angeles transportation enabled by technology are the Metro ExpressLanes, which employ dynamic pricing using FasTrak® transponders, and LA Express Park, which sets parking prices based on demand.
Pricing is an effective demand management tool because travelers will generally search for the quickest, cheapest, and most direct route to get to their destination. As traffic increases along preferred routes, travel time generally increases and makes those routes less desirable. Travelers will then alter their mode and/or take alternative routes that might be longer in distance. As these alternative routes become more utilized and thereby congested, they will lose their advantage over the preferred route. If improvements are made to the alternate routes, then travel times will be quickest on the new routes, until other travelers recognize this and shift their travel patterns to utilize the improved routes. Eventually, the improved routes will also become congested and provide no benefit compared to the original route. Transportation economist Anthony Downs calls this result “triple convergence” due to the (1) spatial convergence of drivers switching their routes to other roadways; (2) time convergence of drivers altering their time-of-day travel; and (3) modal convergence of travelers switching between driving and transit depending on the faster alternative.5 Congestion pricing can address this triple convergence by managing demand so that the relative advantages of the preferred and alternative routes remain consistent. Pricing also makes users more conscious of all the potential impacts that their travel choices may have on the entire transportation network.
MOBILITY GO ZONE & PRICING FEASIBILITY STUDYIn 2019, SCAG evaluated the concept of a Mobility Go Zone, a geographic area with a suite of mobility service options for commuters, visitors and residents to reduce dependency on personal automobiles. This expanded mobility ecosystem can include increased local bus circulator routes including micro-transit options, express commuter buses, bike share and enhanced active transportation infrastructure, enhanced pedestrian infrastructure, and incentive methods including a decongestion fee on vehicles entering during peak traffic periods (particularly for single-occupant trips) to encourage
5 Downs, Anthony (1992). Stuck in Traffic, p. 27-29
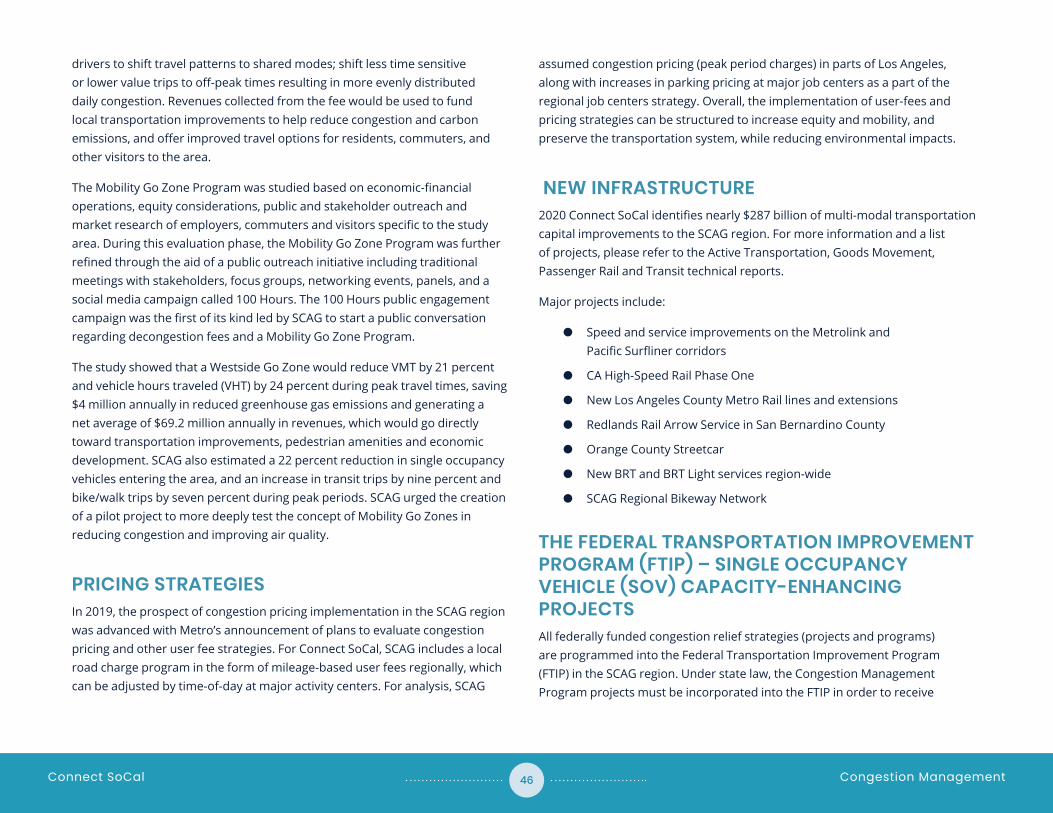
Congestion ManagementConnect SoCal 46
drivers to shift travel patterns to shared modes; shift less time sensitive or lower value trips to off-peak times resulting in more evenly distributed daily congestion. Revenues collected from the fee would be used to fund local transportation improvements to help reduce congestion and carbon emissions, and offer improved travel options for residents, commuters, and other visitors to the area.
The Mobility Go Zone Program was studied based on economic-financial operations, equity considerations, public and stakeholder outreach and market research of employers, commuters and visitors specific to the study area. During this evaluation phase, the Mobility Go Zone Program was further refined through the aid of a public outreach initiative including traditional meetings with stakeholders, focus groups, networking events, panels, and a social media campaign called 100 Hours. The 100 Hours public engagement campaign was the first of its kind led by SCAG to start a public conversation regarding decongestion fees and a Mobility Go Zone Program.
The study showed that a Westside Go Zone would reduce VMT by 21 percent and vehicle hours traveled (VHT) by 24 percent during peak travel times, saving $4 million annually in reduced greenhouse gas emissions and generating a net average of $69.2 million annually in revenues, which would go directly toward transportation improvements, pedestrian amenities and economic development. SCAG also estimated a 22 percent reduction in single occupancy vehicles entering the area, and an increase in transit trips by nine percent and bike/walk trips by seven percent during peak periods. SCAG urged the creation of a pilot project to more deeply test the concept of Mobility Go Zones in reducing congestion and improving air quality.
PRICING STRATEGIESIn 2019, the prospect of congestion pricing implementation in the SCAG region was advanced with Metro’s announcement of plans to evaluate congestion pricing and other user fee strategies. For Connect SoCal, SCAG includes a local road charge program in the form of mileage-based user fees regionally, which can be adjusted by time-of-day at major activity centers. For analysis, SCAG
assumed congestion pricing (peak period charges) in parts of Los Angeles, along with increases in parking pricing at major job centers as a part of the regional job centers strategy. Overall, the implementation of user-fees and pricing strategies can be structured to increase equity and mobility, and preserve the transportation system, while reducing environmental impacts.
NEW INFRASTRUCTURE2020 Connect SoCal identifies nearly $287 billion of multi-modal transportation capital improvements to the SCAG region. For more information and a list of projects, please refer to the Active Transportation, Goods Movement, Passenger Rail and Transit technical reports.
Major projects include:
z Speed and service improvements on the Metrolink and Pacific Surfliner corridors
z CA High-Speed Rail Phase One
z New Los Angeles County Metro Rail lines and extensions
z Redlands Rail Arrow Service in San Bernardino County
z Orange County Streetcar
z New BRT and BRT Light services region-wide
z SCAG Regional Bikeway Network
THE FEDERAL TRANSPORTATION IMPROVEMENT PROGRAM (FTIP) – SINGLE OCCUPANCY VEHICLE (SOV) CAPACITY-ENHANCING PROJECTSAll federally funded congestion relief strategies (projects and programs) are programmed into the Federal Transportation Improvement Program (FTIP) in the SCAG region. Under state law, the Congestion Management Program projects must be incorporated into the FTIP in order to receive

Congestion ManagementConnect SoCal 47
federal and state funds. Under federal law, the FTIP must be updated every two years for funding.
In non-attainment and maintenance areas, the FTIP projects as a whole, including congestion relief projects, must be analyzed for the Transportation Conformity requirements. In project-level analysis, the projects requiring federal action (funding or approval) are subject to environmental impact study (EIS) through the National Environmental Policy Act (NEPA). This is an evaluation and analysis of the alternatives. The selected alternative will be incorporated into the FTIP for implementation.
The federal government regulates the monitoring of projects that significantly increase SOV capacity in the region through 23 CFR §450.322 subsections d and e, which states, in part:
(d) In a TMA designated as non-attainment area for ozone or carbon monoxide pursuant to the Clean Air Act, Federal funds may not be programmed for any project that will result in a significant increase in the carrying capacity for SOVs (i.e., a new general purpose highway on a new location or adding general purpose lanes, with the exception of safety improvements or the elimination of bottlenecks), unless the project is addressed through a congestion management process meeting the requirements of this section.
(e) In TMAs designated as non-attainment for ozone or carbon monoxide, the congestion management process shall provide an appropriate analysis of reasonable (including multimodal) travel demand reduction and operational management strategies for the corridor in which a project that will result in a significant increase in capacity for SOVs (as described in paragraph (d) of this section) is proposed to be advanced with Federal funds.
All identified reasonable travel demand reduction and operational management strategies shall be incorporated into the SOV project or committed to by the State and MPO for implementation.
MONITORING PROJECTS FOR COMPLIANCE WITH THE CMPSCAG uses the following process to monitor compliance with the CMP.
1. Identify all SOV capacity increasing projects that are fully or partially funded by federal sources.
2. Identify and determine projects that are 1) safety and/or operational improvements and 2) bottleneck relief projects, as these are exempted from the CMP process.
3. Identify SOV capacity increasing projects that are at least one-mile in length, as this is the primary criterion that determines the need for CMP review.
4. Collect from the SOV capacity increasing project sponsors documentation upon project submittal that demonstrates that alternative TSM/TDM strategies were considered for the project in question during the alternatives analysis process. Acceptable documentation includes:
� Alternatives Analysis study and/or other relevant project planning study with specific reference to
� Environmental Impact Statement/E Environmental Impact Statement (EIS/EIR)
� Statement of overriding consideration explaining why consideration of TSM/TDM strategies were irrelevant, infeasible or impractical (e.g., arterial widening in rural area)
5. Create list of all SOV capacity increasing projects subject to the CMP. The list will include a description of the project along with its submitted documentation with a link.
All SOV capacity increasing projects are incorporated in to an appendix of the biennial FTIPs. FIGURE 5 is a flowchart showing the required information needed for projects subject to the CMP.

Congestion ManagementConnect SoCal 48
Figure 5 FTIP Congestion Management Process NEXT STEPS
IMPLEMENTATION MONITORINGSCAG will continue to monitor the congestion management programs and activities highlighted in the report. The federal congestion management process is continuously implemented in SCAG’s FTIP and RTP/SCS documents. SCAG also will continue to monitor the state CMP as its member counties update their CMPs.
Of particular importance is the update to the regional ITS architecture. This will provide implementation and monitoring tools to better manage our freeway and arterial system.
SCAG will also implement the TDM Strategic Plan, working to increase TDM in the region and mode share of the different TDM elements. The updated TDM toolbox will provide a valuable tool for stakeholders and jurisdictions in the SCAG region.
CONCLUSIONTaken together, SCAG’s congestion management process, and its TSM, ITS and TDM components, are an integral part of 2020 Connect SoCal, and significantly manage and reduce congestion, VMTs, air pollution and GHGs in the SCAG region. This Congestion Management report demonstrates a path forward to meet the goals and objectives of 2020 Connect SoCal, and improve mobility, sustainability and the quality of life in the SCAG region.
All capacity enhancing project codes that do not already include mitigation measures:
If “Project Code” does not include TCMs, Active Transportation or other travel demand reduction and operational management strategies, provide the following dialogue boxes:
Project is not significant for
SCAG CMP purposes
CAX76, CAX60, CAX61, CAX62, CAX63, CART1. CAXT1, CAXT2,CAXT3, CARH3, CAXT4, CAX65, CAX67, CAX68, CAX70, CAXT6,
CAXT8, CAX59, CAN77
Is project -->One Mile?
Attach e-copy of environmental analysis document signed by
Caltrans and specific page #. Or use the CMP Amendment Comment
Field to reference any other document with page # and/or web
link where the document can be viewed.
If no CMP measures, justification is necessary. Use the CMP
Amendment Comment Field to justify why no CMP measures are
feasible or warranted.
CMP measures as part of the Capacity Increasing Project (click all that apply):HOT LanesHOV LanesTruck Climbing LanesRamp MetersPark and Ride LotsTraffic Signal SynchronizationParking Management SystemsBus Priority SystemReversible LanesWide shoulders for bikes/peds in rural areasDedicated Bus LaneBicycle FacilitiesPedestrian Facilities/ADA StandardsOther Measure(s) Not Listed-Please List
No
Yes, markCMP Checkbox
Does not include Mitigation Measures
IncludesMitigation?
Source: SCAG


PLEASE RECYCLE 2907 2020.09.14
ADOPTED ON SEPTEMBER 3, 2020
connectsocal.org
TECHNICAL REPORTCONGESTION MANAGEMENT
MAIN OFFICE900 Wilshire Blvd., Ste. 1700 Los Angeles, CA 90017 Tel: (213) 236-1800
REGIONAL OFFICES
IMPERIAL COUNTY1405 North Imperial Ave., Ste.104 El Centro, CA 92243 Tel: (213) 236-1967
ORANGE COUNTYOCTA Building 600 South Main St., Ste. 741 Orange, CA 92868 Tel: (213) 236-1997
RIVERSIDE COUNTY3403 10th St., Ste. 805 Riverside, CA 92501 Tel: (951) 784-1513
SAN BERNARDINO COUNTY1170 West 3rd St., Ste. 140 San Bernardino, CA 92410 Tel: (213) 236-1925
VENTURA COUNTY4001 Mission Oaks Blvd., Ste. L Camarillo, CA 93012 Tel: (213) 236-1960