TRANSPORTATION RESEARCH RECORD 1105 …onlinepubs.trb.org/Onlinepubs/trr/1986/1105/1105-002.pdf ·...
9
TRANSPORTATION RESEARCH RECORD 1105 15 Brighton Avenue Bridge Replacement Supported on Spread Foundations PAUL F. BYRNE AND HUGH S. LACEY The replacement of a 70-year-old railroad bridge with a new, longer span over an Improved and widened urban street required an extensive geotecbnical study to determine the optimum foundation type for the site. Traditional deep founda- tion solutions of driven piles and concrete caissons were inves- tigated, along with the ultimate selection-spread foundations on a pressure-grouted bedrock, described as a thinly bedded calcerous shale with varying degrees of decomposition. Pre- sented are planning, design, and construction considerations. Discussed in this paper are the planning, design, and con- struction of a 94-ft span, through-girder, steel railroad bridge in a tightly confined urban setting, with emphasis on techniques to reduce foundation costs while maintaining traffic on adjacent transportation arteries. Described in particular is how pressure grouting was used to improve the existing bedrock foundation by filling voids and joints, thus avoiding the necessity of a more expensive pile foundation. Demolition of an existing railroad bridge and construction of the new bridge and appurtenances at a cost of $1.1 million was one phase of a $9.2 million highway reconstruction project that also included replacement of another bridge, an upstation high- way crossing of the same railroad NEED FOR PROJECT The necessity of replacing the existing 70-year old, 45-ft, single-span, plate-girder railroad bridge over Brighton Avenue in Syracuse, New York, was dictated by the following condi- tions: • Bridge condition: The steel plate girder superstructure with riveted joints was in serviceable condition, but after 70 years of weathering and quarry train traffic, there was severe rusting and loss of section on some secondary members. In addition, the roller joints were nonfunctional. • Layout: The northbound highway traffic approached the structure on a 1,100-ft downgrade of 6 percent, and the south- bound traffic passed under the grade separation on a 19.1- degree (300-ft radius) curve. • Vertical clearance: The vertical clearance between Brighton Avenue and the lower flange of the existing bridge was 12 ft, whereas the maximum state legal vehicle height is 13 ft 6 in. • Lateral clearance: In the northbound lane, the lateral clear- ance from the edge of the 20-ft roadway to the abutment was 1 P. F. Byrne, Calocerinos & Spina Consulting Engineers, 1020 7th North St., New York, N.Y. 13088. H. S. Lacey, Mueser Rutledge Consulting Engineers, 708 Third Ave., New York, N.Y. 10017. ft. In the southbound lane, there was a 4-ft wide sidewalk without curb between the edge of pavement and the abutment. The paved roadway narrowed from 48 ft to 20 ft at the bridge within a distance of 120 ft. • Roadway capacity: Under preconstruction (1980) condi- tions, the adjusted average daily traffic (AADT) of 12,200 vehicles exceeded the existing roadway capacity, and the pre- diction for the year 2010 showed an increase to 16,200 AADT. Thus, the bridge contributed to a traffic restriction, which, if left uncorrected would only become worse with the increased traffic associated with the anticipated population growth in the city's southern suburbs. • Sight distances: Vehicles approaching the bridge from both directions had a substantially obstructed view of the road ahead. • Safety: According to research conducted by the New York State Department of Transportation (NYSDOT), the accident rates in 1973 and 1974 on the stretch along Brighton Avenue near the bridge were 10.1and9.7 accidents per million vehicle miles, respectively. This rate is more than twice the statewide average of 3.68 accidents per million vehicle miles for two- lane urban roads. Inspections of the old stone block bridge abutments revealed evidence of numerous bridge-vehicle colli- sions, the majority of which occurred without being officially reported. SITE CONSTRAINTS The location of the bridge, spanning a major arterial into the city, was one of the elements dictating its replacement. Its location also contributed to logistical and construction diffi- culties. The project site is located in a congested urban neigh- borhood with mixed residential, light industrial, and commer- cial use. Brighton Avenue, the city street crossed by the bridge, carries a steady volume of local traffic (15 percent trucks), as well as commuter traffic between the city and the expanding southern suburbs. The northbound lane of Interstate 81 is about 55 ft from the west wingwalls, and property had to be acquired from New York State for the construction of the abutments, wingwalls, and an adjacent retaining wall. The major physical constraint, however, was the Binghamton-Syracuse Branch line of the Consolidated Rail Corporation (Conrail). The new railroad main line was constructed less than 20 ft from the old main line without interruption of rail service, which was essential for the operation of the local Allied Chemical Corporation plant. Fig- ure 1, which shows the new bridge abutments under con- struction, provides a perspective of Interstate-81 in the fore- ground and the existing railroad bridge in the background.
-
Upload
trinhthien -
Category
Documents
-
view
216 -
download
0
Transcript of TRANSPORTATION RESEARCH RECORD 1105 …onlinepubs.trb.org/Onlinepubs/trr/1986/1105/1105-002.pdf ·...
TRANSPORTATION RESEARCH RECORD 1105 15
Brighton Avenue Bridge Replacement Supported on Spread Foundations PAUL F. BYRNE AND HUGH S. LACEY
The replacement of a 70-year-old railroad bridge with a new, longer span over an Improved and widened urban street required an extensive geotecbnical study to determine the optimum foundation type for the site. Traditional deep foundation solutions of driven piles and concrete caissons were investigated, along with the ultimate selection-spread foundations on a pressure-grouted bedrock, described as a thinly bedded calcerous shale with varying degrees of decomposition. Presented are planning, design, and construction considerations.
Discussed in this paper are the planning, design, and construction of a 94-ft span, through-girder, steel railroad bridge in a tightly confined urban setting, with emphasis on techniques to reduce foundation costs while maintaining traffic on adjacent transportation arteries. Described in particular is how pressure grouting was used to improve the existing bedrock foundation by filling voids and joints, thus avoiding the necessity of a more expensive pile foundation.
Demolition of an existing railroad bridge and construction of the new bridge and appurtenances at a cost of $1.1 million was one phase of a $9.2 million highway reconstruction project that also included replacement of another bridge, an upstation highway crossing of the same railroad
NEED FOR PROJECT
The necessity of replacing the existing 70-year old, 45-ft, single-span, plate-girder railroad bridge over Brighton Avenue in Syracuse, New York, was dictated by the following conditions:
• Bridge condition: The steel plate girder superstructure with riveted joints was in serviceable condition, but after 70 years of weathering and quarry train traffic, there was severe rusting and loss of section on some secondary members. In addition, the roller joints were nonfunctional.
• Layout: The northbound highway traffic approached the structure on a 1,100-ft downgrade of 6 percent, and the southbound traffic passed under the grade separation on a 19.1-degree (300-ft radius) curve.
• Vertical clearance: The vertical clearance between Brighton Avenue and the lower flange of the existing bridge was 12 ft, whereas the maximum state legal vehicle height is 13 ft 6 in.
• Lateral clearance: In the northbound lane, the lateral clearance from the edge of the 20-ft roadway to the abutment was 1
P. F. Byrne, Calocerinos & Spina Consulting Engineers, 1020 7th North St., New York, N.Y. 13088. H. S. Lacey, Mueser Rutledge Consulting Engineers, 708 Third Ave., New York, N.Y. 10017.
ft. In the southbound lane, there was a 4-ft wide sidewalk without curb between the edge of pavement and the abutment. The paved roadway narrowed from 48 ft to 20 ft at the bridge within a distance of 120 ft.
• Roadway capacity: Under preconstruction (1980) conditions, the adjusted average daily traffic (AADT) of 12,200 vehicles exceeded the existing roadway capacity, and the prediction for the year 2010 showed an increase to 16,200 AADT. Thus, the bridge contributed to a traffic restriction, which, if left uncorrected would only become worse with the increased traffic associated with the anticipated population growth in the city's southern suburbs.
• Sight distances: Vehicles approaching the bridge from both directions had a substantially obstructed view of the road ahead.
• Safety: According to research conducted by the New York State Department of Transportation (NYSDOT), the accident rates in 1973 and 1974 on the stretch along Brighton Avenue near the bridge were 10.1and9.7 accidents per million vehicle miles, respectively. This rate is more than twice the statewide average of 3.68 accidents per million vehicle miles for twolane urban roads. Inspections of the old stone block bridge abutments revealed evidence of numerous bridge-vehicle collisions, the majority of which occurred without being officially reported.
SITE CONSTRAINTS
The location of the bridge, spanning a major arterial into the city, was one of the elements dictating its replacement. Its location also contributed to logistical and construction difficulties. The project site is located in a congested urban neighborhood with mixed residential, light industrial, and commercial use. Brighton Avenue, the city street crossed by the bridge, carries a steady volume of local traffic (15 percent trucks), as well as commuter traffic between the city and the expanding southern suburbs.
The northbound lane of Interstate 81 is about 55 ft from the west wingwalls, and property had to be acquired from New York State for the construction of the abutments, wingwalls, and an adjacent retaining wall. The major physical constraint, however, was the Binghamton-Syracuse Branch line of the Consolidated Rail Corporation (Conrail). The new railroad main line was constructed less than 20 ft from the old main line without interruption of rail service, which was essential for the operation of the local Allied Chemical Corporation plant. Figure 1, which shows the new bridge abutments under construction, provides a perspective of Interstate-81 in the foreground and the existing railroad bridge in the background.

16
FIGURE 1 Brighton Avenue railroad bridge under construction.
BRIDGE SITE OPTIONS
During the planning stage, the following options were considered:
1. Change the alignment of Brighton Avenue so as to remove the steep grade and curve at the bridge and reuse the existing superstructure. This option was given only brief consideration because the existing 20-ft roadway was substandard for even a two-lane roadway, and the fixed distance between abutments would not permit a roadway that could adequately handle the anticipated traffic volume. Thus, the bottleneck would remain.
2. Under the second option, a temporary railroad bridge would be constructed, the existing bridge would be demol-
TRANSPORTATION RESEARCH RECORD 1105
ished, and the new bridge would be constructed on the site of the original bridge.
3. The third option provided for the construction of a new bridge adjacent to the old bridge while it remained in use.
After initial consideration. Option 1 was rejected and only Options 2 and 3 were seriously evaluated. Option 2 had the advantage of minimal additional track work beyond the bridge site. However, a cost comparison of the two options revealed that, despite the additional track work, the city would save approximately $1 million by eliminating the temporary structure and building the new structure adjacent to the existing bridge. In addition. critical construction time was reduced by approximately 3 months. Therefore, Option 3 as shown in Figure 2 was selected.
GEOTECHNICAL CONDITIONS
The field geotechnical investigation for this project was conducted in two stages:
1. In 1979, the Soil Mechanics Bureau of the New York State Department of Transportation took four borings in the vicinity of the bridge to a depth of between 30 and 40 ft.
2. In 1982, Geotechnical Drilling and Testing, Inc. of Castleton, New York, under the direction of Calocerinos & Spina, took an additional 11 borings. The majority of the borings were to a depth of 30 to 40 ft, with one deep boring advanced to 75 ft.
The additional borings confirmed the findings of the soil mechanics bureau and also provided data for the development of subgrade profiles and the determination of rock surface topography.
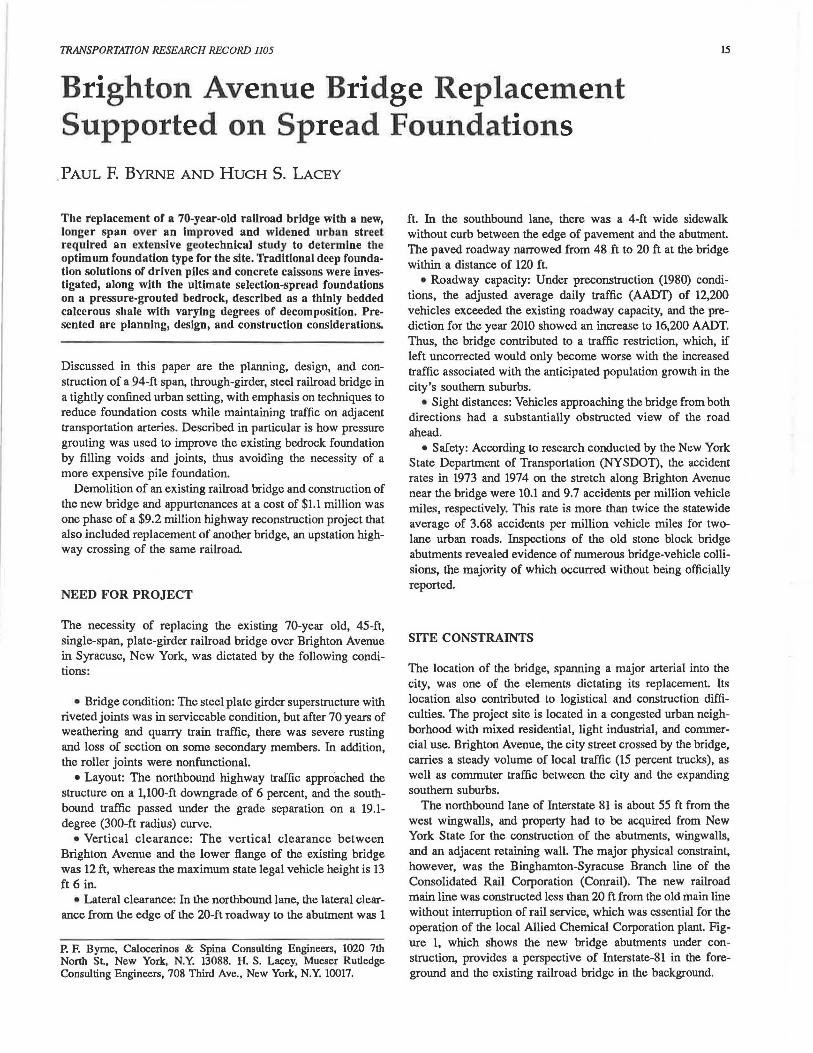
The geologic sections of the site, shown in Figures 3 and 4, reveal about 5 to 7 ft of loose to compact granular mixed fill
PLAN- RE.CONSTRUCTION OF 812/GHTON AVtNUe f3RI06E.
<iR,APHIC $CAL~
O lc.. 1 201
40 1 d0 1
FIGURE 2 Site plan.
BYRNE AND LACEY 17
AK)RTH ABl/Tf'ft:NT I 1
- - [ /<AILROAO TTCAGl<S
l i NU/ STREET ~
I I t::ORl61NAL 5TREc!l{dd
lffM::;h/_ I I I ; n;a ma >qt J/ii$M:.
I
SeCTIOAI A-A
CtRAPHK! :SCA.Le. IO' O to' 20' "10 1
FIGURE 3 Geological section.
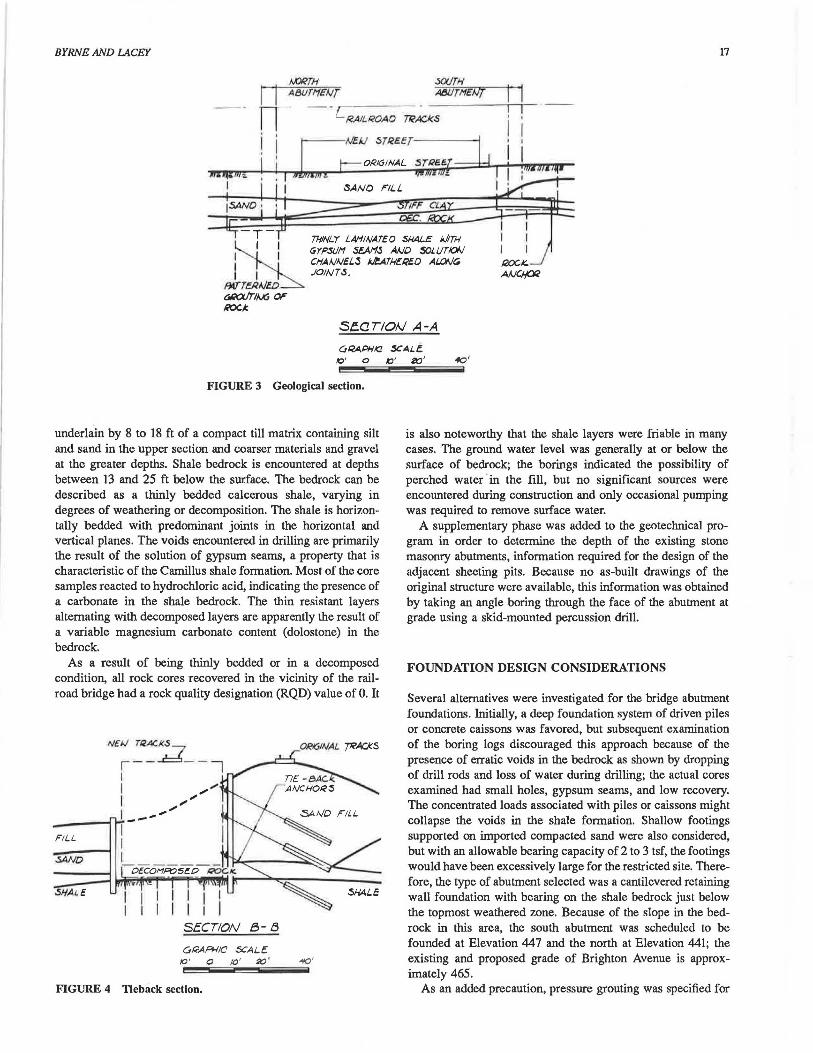
underlain by 8 to 18 ft of a compact till matrix containing silt and sand in the upper section and coarser materials and gravel at the greater depths. Shale bedrock is encountered at depths between 13 and 25 ft below the surface. The bedrock can be described as a thinly bedded calcerous shale, varying in degrees of weathering or decomposition. The shale is horizontally bedded with predominant joints in the horizontal and vertical planes. The voids encountered in drilling are primarily the result of the solution of gypsum seams, a property that is characteristic of the Camillus shale formation. Most of the core samples reacted to hydrochloric acid, indicating the presence of a carbonate in the shale bedrock. The thin resistant layers alternating with decomposed layers are apparently the result of a variable magnesium carbonate content (dolostone) in the bedrock.
As a result of being thinly bedded or in a decomposed condition, all rock cores recovered in the vicinity of the railroad bridge had a rock quality designation (RQD) value of 0. It
F ILL
SANO
SECTION B- !3
GRAPWIC :SCALE IO ' a 10' XI ' ifO'
FIGURE 4 Tieback section.
is also noteworthy that the shale layers were friable in many cases. The ground water level was generally at or below the surface of bedrock; the borings indicated the possibility of perched water · in the fill, but no significant sources were encountered during construction and only occasional pumping was required to remove surface water.
A supplementary phase was added to the geotechnical program in order to determine the depth of the existing stone masonry abutments, information required for the design of the adjacent sheeting pits. Because no as-built drawings of the original structure were available, this information was obtained by taking an angle boring through the face of the abutment at grade using a skid-mounted percussion drill.
FOUNDATION DESIGN CONSIDERATIONS
Several alternatives were investigated for the bridge abutment foundations. Initially, a deep foundation system of driven piles or concrete caissons was favored, but subsequent examination of the boring logs discouraged this approach because of the presence of erratic voids in the bedrock as shown by dropping of drill rods and loss of water during drilling; the actual cores examined had small holes, gypsum seams, and low recovery. The concentrated loads associated with piles or caissons might collapse the voids in the shale formation. Shallow footings supported on imported compacted sand were also considered, but with an allowable bearing capacity of 2 to 3 tsf, the footings would have been excessively large for the restricted site. Therefore, the type of abutment selected was a cantilevered retaining wall foundation with bearing on the shale bedrock just below the topmost weathered zone. Because of the slope in the bedrock in this area, the south abutment was scheduled to be founded at Elevation 447 and the north at Elevation 441; the existing and proposed grade of Brighton Avenue is approximately 465.
As an added precaution, pressure grouting was specified for
18
the bedrock at both abutments to permit an increase in the bearing capacity from 8 to 15 tsf and fill any collapse-susceptible voids and joints. The estimated possible settlement from collapsing voids was in the range of from 1 to 6 in., which was unacceptable. In addition, the drilling and grouting operation would provide an indication of the presence of large voids that might warrant further investigation. Selection of the 20-ft depth for rock drilling of grout holes was based on the level of the majority of the voids as indicated in the borings and on the goal to reduce the loading at the base of the grouted rock zone to less than 8 tsf.
The abutments were designed with a safety factor of 2.0 for overturning and 1.5 for sliding. This was easily achieved by the mass of the footing and the quantity of backfill on the northern abutment. However, for the shallower south abutment, there was no room to increase the toe length without encroaching on the existing road, which had to be kept in service for its full width. Analysis showed that, for the critical load condition during construction, before placement of bridge girders, the resultant was outside the middle third of the abutment. Although the allowable rock pressure was not exceeded under this condition, the safety factor against overturning was closer to 1 than 2. To increase the safety factor to the desired level, a row of rock anchors (embedded No. 11 bars) was specified for the heel end of the footing. The 20-ft long anchors with a 17.5-ton design load were sized using an allowable grout-rock bond stress of 20 psi and a length sufficient to mobilize a cone of rock equal to 110 percent of the design load. This contributed little additional cost because the drill rigs were already on-site
f STRUC TURIE
""' DltlVIEN SOLDllER PILES HP 14 a 73
'
TRANSPORTATION RESEARCH RECORD 1105
for the pressure grouting of the bedrock. This approach saved additional rock excavation and an equivalent volume of reinforced concrete.
After the decision was made to keep the existing railroad bridge in service while constructing the new one adjacent to it, the major concern was providing temporary support for the existing abutments and embankments while advancing an adjacent 40-ft-deep excavation. Because of the critical need for rigid support of adjacent ground, Mueser Rutledge Consulting Engineers designed the system of temporary support for the excavation. The system was fully detailed on the contract drawings and vital time was saved by eliminating the usual contractor design and engineer review process. In addition, early approval from the reviewing agencies was facilitated.
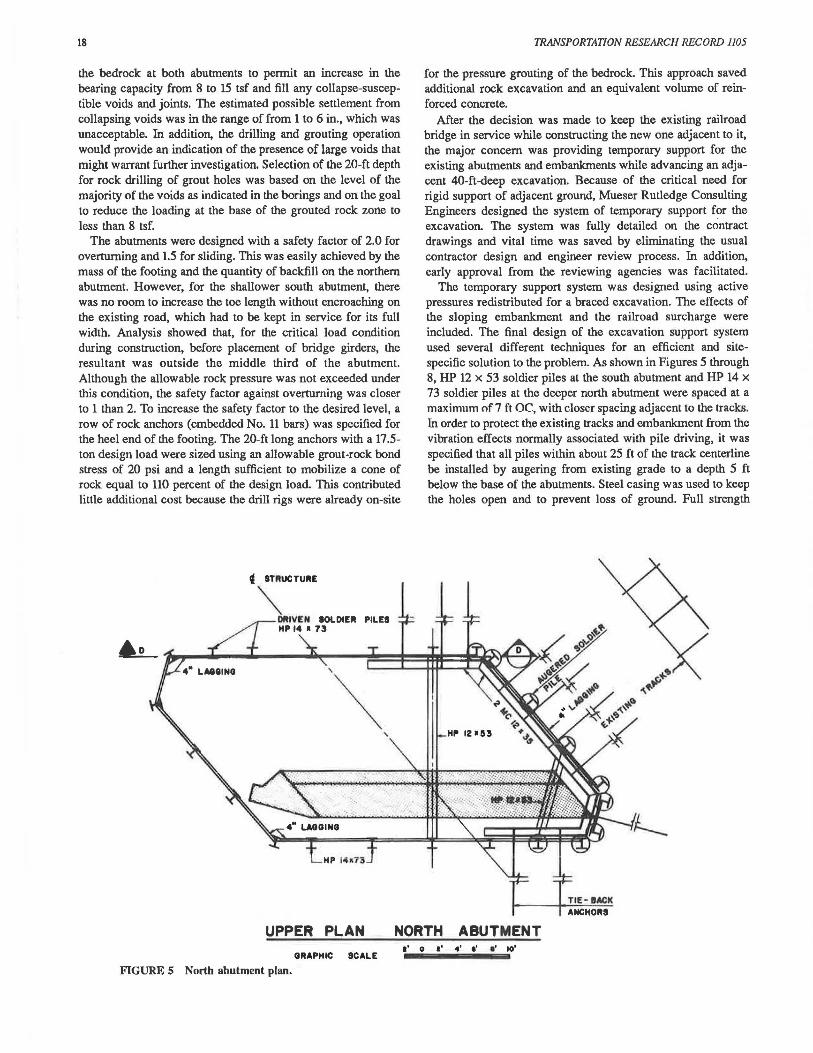
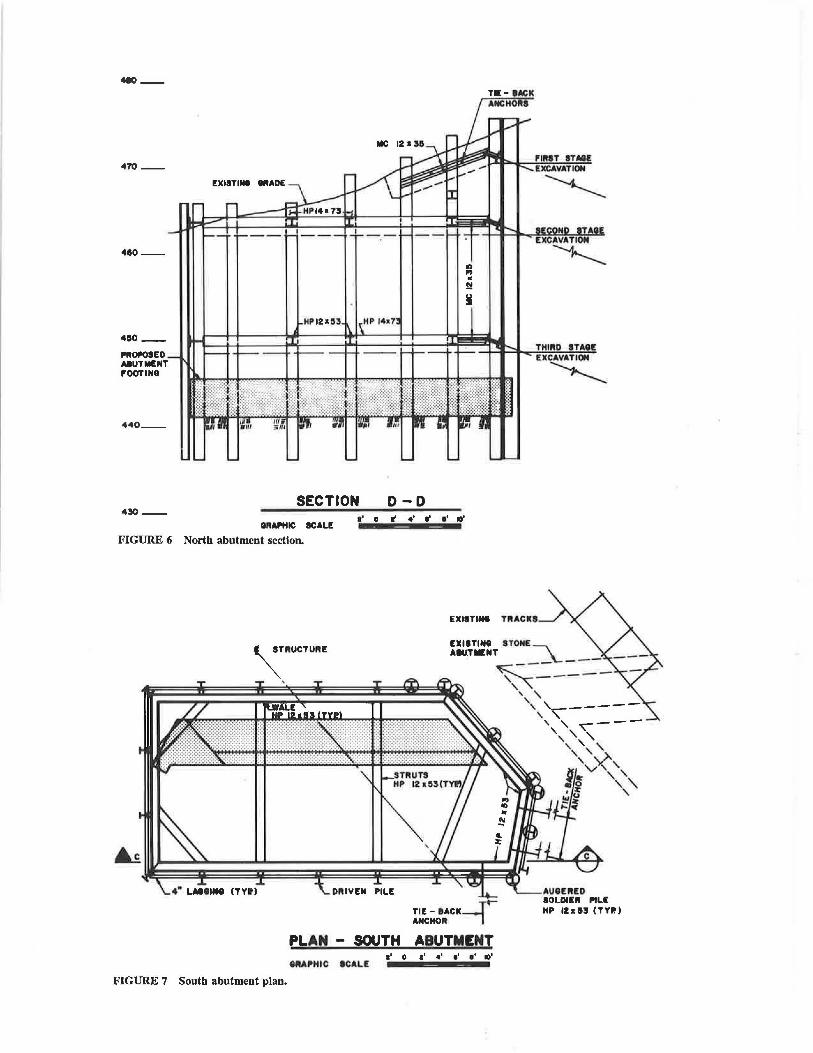
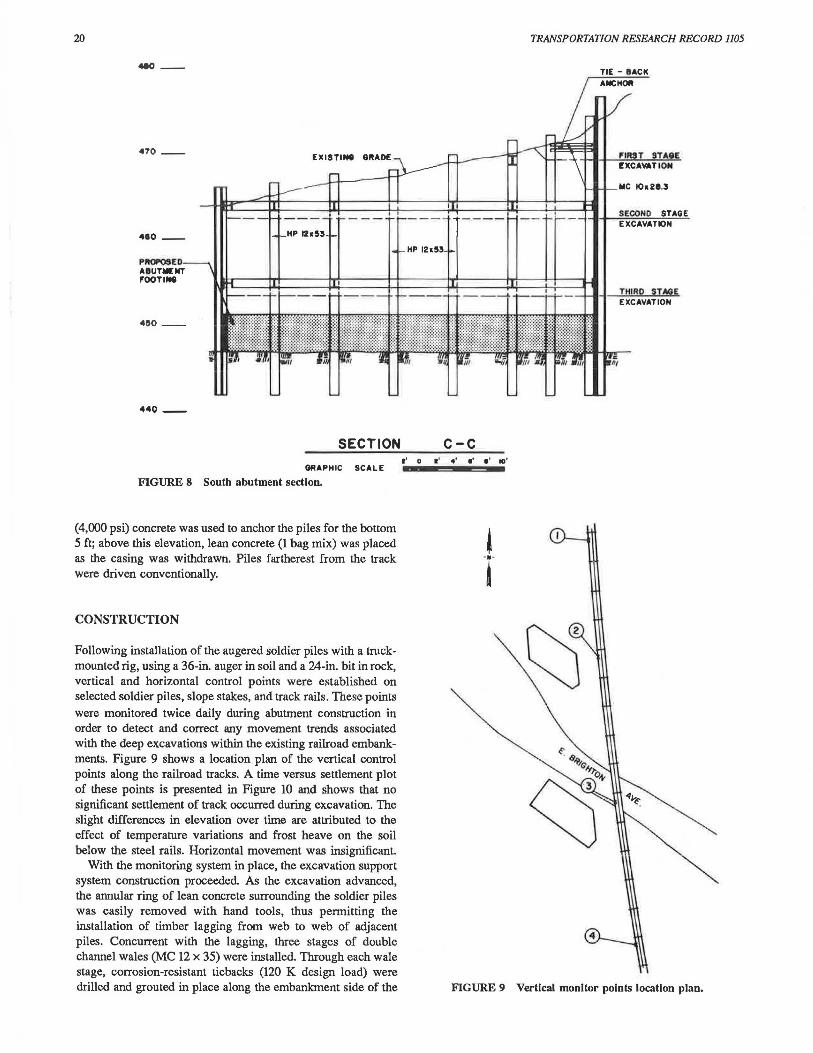
The temporary support system was designed using active pressures redistributed for a braced excavation. The effects of the sloping embankment and the railroad surcharge were included. The final design of the excavation support system used several different techniques for an efficient and sitespecific solution to the problem. As shown in Figures 5 through 8, HP 12 x 53 soldier piles at the south abutment and HP 14 x 73 soldier piles at the deeper north abutment were spaced at a maximum of 7 ft OC, with closer spacing adjacent to the tracks. In order to protect the existing tracks and embankment from the vibration effects normally associated with pile driving, it was specified that all piles within about 25 ft of the track centerline be installed by augering from existing grade to a depth 5 ft below the base of the abutments. Steel casing was used to keep the holes open and to prevent loss of ground. Full strength
HP 12•&3
TIE - BACK
ANCHORS
UPPER PLAN NORTH ABUTMENT •• 0 •. 4' •• •• 101
GRAPHIC SCALE
FIGURE S North abutment plan.
..., __
470 __
410--
4110 __
Pft°"°SEO MUTllll:NT ,OOTING
440 __
SECTION o-o 430 __
GltAPHIC SCALE
FIGURE 6 North abutment section.
1'0~4'11 l'll01
THlltO STAH EXCAVATION
~
EICISTIN8 TRACKS
FIGURE 7 South abutment plan.
TIE-IACK-r ANCHOlt
PLAN - SOUTH ABUTMENT 1 1 0 1 1 4 1 11 1 1 IO'
.,_Al'HIC ICALE
20
490 --
470 __
I
EXISTIN8 81tAD£~;:::~
r
I 111
TRANSPORTATION RESEARCH RECORD 1105
TIE - llACK
-flRST 9TA8E EXCAVATION
:1 ...._ _ __ _ ___ , - __ _ '- - - ---- ____ - __ ,... __ · -+-4l-+---'S"'E""CO.:..N""D'"=S.,_T ... A~G~E
EXCAVATION
,. - HP 12155.,..
II _I I
---____ ,__ ----· - -- o-' __ __.. ....---.--.- __ -+-4l-l---'T.!!H:.:;IR""0-"-9T:..::AG=E
4!10 __
440--
SECTION
GRAPHIC SCALE
FIGURE 8 South abutment section.
(4,000 psi) concrete was used to anchor the piles for the bottom 5 ft; above this elevation, lean concrete (1 bag mix) was placed as the casing was withdrawn. Piles fartherest from the track were driven conventionally.
CONSTRUCTION
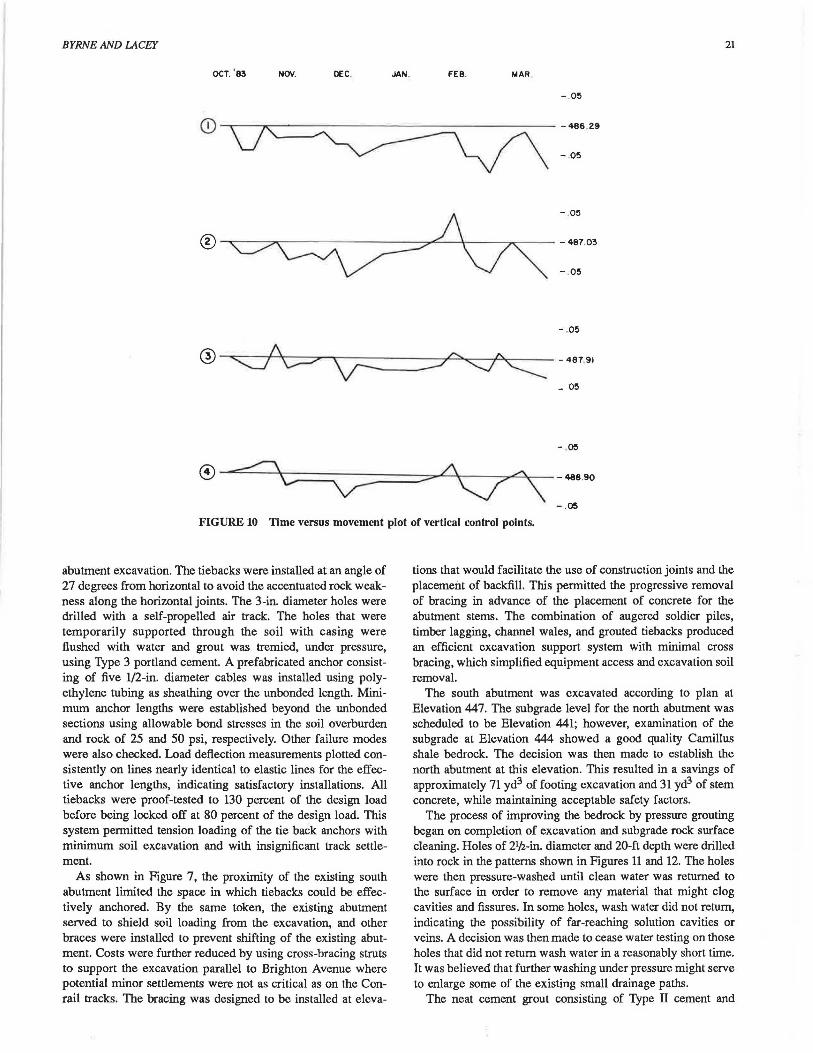
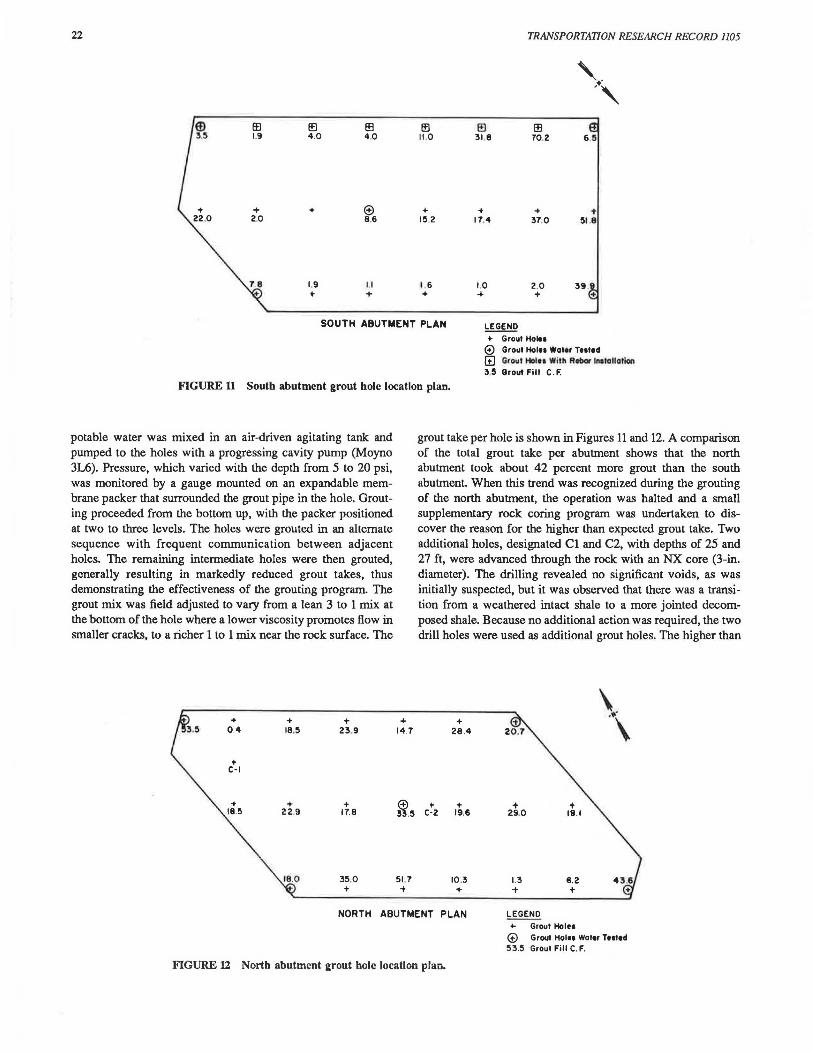
Following installation of the augered soldier piles with a truckmounted rig, using a 36-in. auger in soil and a 24-in. bit in rock, vertical and horizontal control points were established on selected soldier piles, slope stakes, and track rails. These points were monitored twice daily during abutment construction in order to detect and correct any movement trends associated with the deep excavations within the existing railroad embankments. Figure 9 shows a location plan of the vertical control points along the railroad tracks. A time versus settlement plot of these points is presented in Figure 10 and shows that no significant settlement of track occurred during excavation. The slight differences in elevation over time are attributed to the effect of temperature variations and frost heave on the soil below the steel rails. Horizontal movement was insignificant.
With the monitoring system in place, the excavation support system construction proceeded As the excavation advanced, the annular ring of lean concrete surrounding the soldier piles was easily removed with hand tools, thus permitting the installation of timber lagging from web to web of adjacent piles. Concurrent with the lagging, three stages of double channel wales (MC 12 x 35) were installed. Through each wale stage, corrosion-resistant tiebacks (120 K design load) were drilled and grouted in place along the embankment side of the
EXCAVATION
c-c 11 0 •• 4 1
• • •• to'
FIGURE 9 Vertical monitor points location plan.
BYRNE AND LACEY 21
OCT. 0
83 NOV. DEC. JAN . FEB. MAR .
- .05
Q) --.-V'-----...---~----------------- -486 .29
~ - .05
- .05
}\ ® ~~~---------:7""----\----v-----,..-~- -487.03
. . v ""' - .05
- .05
@ --.<zj:;;:---;/\'--\v--------::r--.:\;::::-------...,,LC>.~--/."~~-- - 487.91 "'---' v - -_./ "-1 '----= - 05
- .~
(A\ ~ /\ 6 -~-,\;:-:===--------:::;;;>":::>"""Y\7.----,, .... 6~\- - 48e.9o v- "-1 -.~
FIGURE 10 Time versus movement plot of vertical control points.
abutment excavation. The tiebacks were installed at an angle of 27 degrees from horizontal to avoid the accentuated rock weakness along the horizontal joints. The 3-in. diameter holes were drilled with a self-propelled air track. The holes that were temporarily supported through the soil with casing were flushed with water and grout was tremied, under pressure, using Type 3 portland cement. A prefabricated anchor consisting of five 1/2-in. diameter cables was installed using polyethylene tubing as sheathing over the unbonded length. Minimum anchor lengths were established beyond the unbonded sections using allowable bond stresses in the soil overburden and rock of 25 and 50 psi, respectively. Other failure modes were also checked. Load deflection measurements plotted consistently on lines nearly identical to elastic lines for the effective anchor lengths, indicating satisfactory installations. All tiebacks were proof-tested to 130 percent of the design load before being locked off at 80 percent of the design load. This system permitted tension loading of the tie back anchors with minimum soil excavation and with insignificant track settlement.
As shown in Figure 7, the proximity of the existing south abutment limited the space in which tiebacks could be effectively anchored. By the same token, the existing abutment served to shield soil loading from the excavation, and other braces were installed to prevent shifting of the existing abutment. Costs were further reduced by using cross-bracing struts to support the excavation parallel to Brighton Avenue where potential minor settlements were not as critical as on the Conrail tracks. The bracing was designed to be installed at eleva-
tions that would facilitate the use of construction joints and the placement of backfill. This permitted the progressive removal of bracing in advance of the placement of concrete for the abutment stems. The combination of augered soldier piles, timber lagging, channel wales, and grouted tiebacks produced an efficient excavation support system with minimal cross bracing, which simplified equipment access and excavation soil removal.
The south abutment was excavated according to plan at Elevation 447. The subgrade level for the north abutment was scheduled to be Elevation 441; however, examination of the subgrade at Elevation 444 showed a good quality Camillus shale bedrock. The decision was then made to establish the north abutment at this elevation. This resulted in a savings of approximately 71 yd3 of footing excavation and 31 yd3 of stem concrete, while maintaining acceptable safety factors.
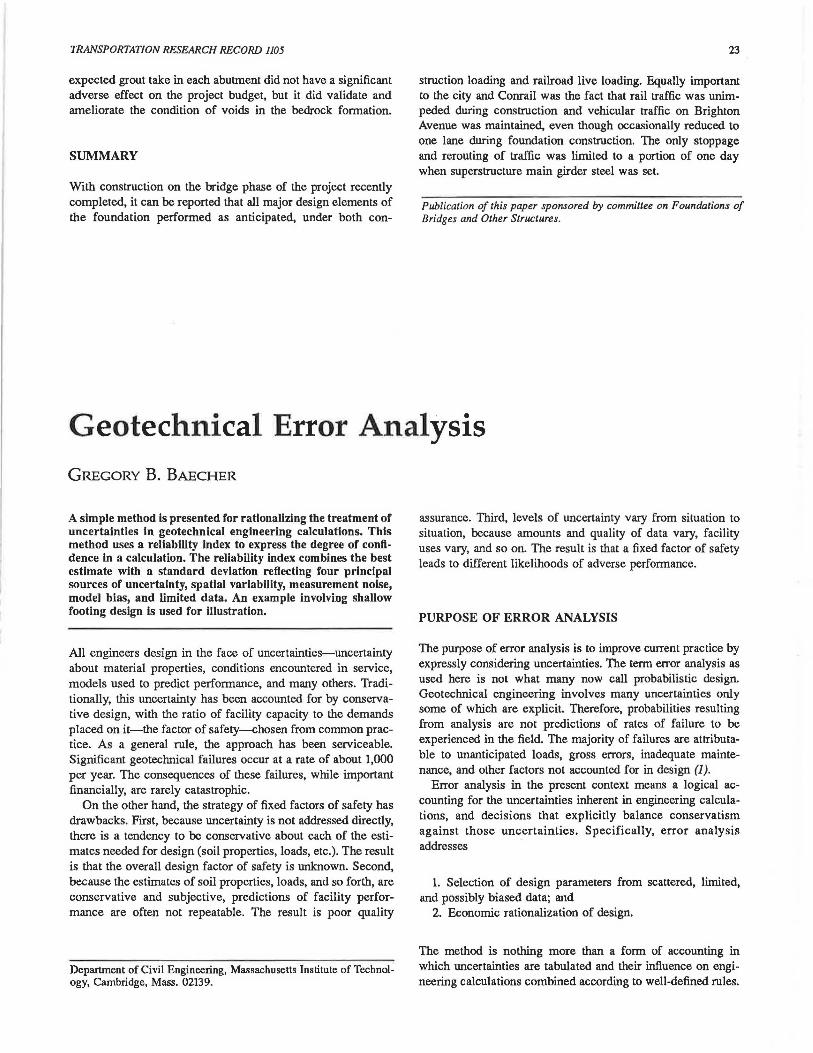
The process of improving the bedrock by pressure grouting began on completion of excavation and subgrade rock surface cleaning. Holes of 21/2-in. diameter and 20-ft depth were drilled into rock in the patterns shown in Figures 11 and 12. The holes were then pressure-washed until clean water was returned to the surface in order to remove any material that might clog cavities and fissures. In some holes, wash water did not return, indicating the possibility of far-reaching solution cavities or veins. A decision was then made to cease water testing on those holes that did not return wash water in a reasonably short time. It was believed that further washing under pressure might serve to enlarge some of the existing small drainage paths.
The neat cement grout consisting of Type II cement and
22
EE 1.9
+ 2.0
7.8
(:fl 4 .0
+
1.9 ..
!!3 40
@ 8.6
I.I +
ffi 11 .0
+ 1!5 .2
16 +
ffi 318
+ 17.4
1,0 +
TRANSPORTATION RESEARCH RECORD 1105
ffi 70 2
+ 37.0
2.0 +
6.1!
.. 51.8
39. +
SOUTH ABUTMENT PLAN LEGEND
+ Grout HolH G) Grout HolH Water Teated (!] Grout Hoitt With Rtbot lnetallolion 3.5 Grout Fill C. F.
FIGURE 11 South abutment grout hole location plan.
potable water was mixed in an air-driven agitating tank and pumped to the holes with a progressing cavity pump (Moyno 3L6). Pressure, which varied with the depth from 5 to 20 psi, was monitored by a gauge mounted on an expandable membrane packer that surrounded the grout pipe in the hole. Grouting proceeded from the bottom up, with the packer positioned at two to three levels. The holes were grouted in an alternate sequence with frequent communication between adjacent holes. The remaining intermediate holes were then grouted, generally resulting in markedly reduced grout takes, thus demonstrating the effectiveness of the grouting program. The grout mix was field adjusted to vary from a lean 3 to 1 mix at the bottom of the hole where a lower viscosity promotes How in smaller cracks, to a richer 1 to 1 mix near the rock surface. The
+ + + 0.4 18.!5 23.9
.. C-1
... + + 18.!I 22.9 17.8
18.0 3!5.0 +
+ 14.7
@ 33.5
51 ,7 +
grout take per hole is shown in Figures 11 and 12. A comparison of the total grout take per abutment shows that the north abutment took about 42 percent more grout than the south abutment. When this trend was recognized during the grouting of the north abutment, the operation was halted and a small supplementary rock coring program was undertaken to discover the reason for the higher than expected grout take. Two additional holes, designated Cl and C2, with depths of 25 and 27 ft, were advanced through the rock with an NX core (3-in. diameter). The drilling revealed no significant voids, as was initially suspected, but it was observed that there was a transition from a weathered intact shale to a more jointed decomposed shale. Because no additional action was required, the two drill holes were used as additional grout holes. The higher than
\ . + \ 28.4
.. + + C-2 19.5 29.0
10.3 1.3 6.2 + + +
NORTH ABUTMENT PLAN LEGEND +- Grout Holes
© Grout Holes Water THltd 53.5 Grout Fill C. F.
FIGURE 12 North abutment grout hole location plan.
TRANSPORTATION RESEARCH RECORD 1105
expected grout take in each abutment did not have a significant adverse effect on the project budget, but it did validate and ameliorate the condition of voids in the bedrock formation.
SUMMARY
With construction on the bridge phase of the project recently completed, it can be reported that all major design elements of the foundation performed as anticipated, under both con-
23
struction loading and railroad live loading. Equally important to the city and Conrail was the fact that rail traffic was unimpeded during construction and vehicular traffic on Brighton Avenue was maintained, even though occasionally reduced to one lane during foundation construction. The only stoppage and rerouting of traffic was limited to a portion of one day when superstructure main girder steel was set.
Publication of this paper sponsored by committee on Foundations of Bridges and Other Structures.
Geotechnical Error Analysis GREGORY B. BAECHER
A simple method Is presented for rationalizing the treatment of uncertainties In geotechnlcal engineering calculations. This method uses a reliability Index to express the degree of confidence In a calculation. The reliability index combines the best estimate with a standard deviation reflecting four principal sources of uncertainty, spatial variability, measurement noise, model bias, and limited data. An example Involving shallow footing design is used for Illustration.
All engineers design in the face of uncertainties-uncertainty about material properties, conditions encountered in service, models used to predict performance, and many others. Traditionally, this uncertainty has been accounted for by conservative design, with the ratio of facility capacity to the demands placed on it-the factor of safety--chosen from common practice. As a general rule, the approach has been serviceable. Significant geotechnical failures occur at a rate of about 1,000 per year. The consequences of these failures, while important financially, are rarely catastrophic.
On the other hand, the strategy of fixed factors of safety has drawbacks. First, because uncertainty is not addressed directly, there is a tendency to be conservative about each of the estimates needed for design (soil properties, loads, etc.). The result is that the overall design factor of safety is unknown. Second, because the estimates of soil properties, loads, and so forth, are conservative and subjective, predictions of facility performance are often not repeatable. The result is poor quality
Department of Civil Engineering, Massachusetts Institute of Technology, Cambridge, Mass. 02139.
assurance. Third, levels of uncertainty vary from situation to situation, because amounts and quality of data vary, facility uses vary, and so on. The result is that a fixed factor of safety leads to different likelihoods of adverse performance.
PURPOSE OF ERROR ANALYSIS
The purpose of error analysis is to improve current practice by expressly considering uncertainties. The term error analysis as used here is not what many now call probabilistic design. Geotechnical engineering involves many uncertainties only some of which are explicit. Therefore, probabilities resulting from analysis are not predictions of rates of failure to be experienced in the field. The majority of failures are attributable to unanticipated loads, gross errors, inadequate maintenance, and other factors not accounted for in design (1).
Error analysis in the present context means a logical accounting for the uncertainties inherent in engineering calculations, and decisions that explicitly balance conservatism against those uncertainties. Specifically, error analysis addresses
1. Selection of design parameters from scattered, limited, and possibly biased data; and
2. Economic rationalization of design.
The method is nothing more than a form of accounting in which uncertainties are tabulated and their influence on engineering calculations combined according to well-defined rules.