
Transportation Problem for a Beverage Firm in Kumasi, Ghana
12
Mathematical Theory and Modeling www.iiste.org ISSN 2224-5804 (Paper) ISSN 2225-0522 (Online) Vol.5, No.2, 2015 6 Transportation Problem for a Beverage Firm in Kumasi, Ghana Frank Osei Frimpong*, Akwasi Poku Asare Lecturer, Department of Mathematics and Statistics, P.O. Box 854, Kumasi Polytechnic, Ghana. * Email: [email protected] Abstract This paper seeks to find the optimal transportation cost of a beverage firm in Kumasi-Ashanti Region, Ghana, using POM-QM for Windows 4 (Software for Quantitative Methods, Production and Operation Management by Howard J. Weiss) with Vogel’s Approximation Method (VAM) as the initial method. An administered questionnaire was used for data collection from the firm. The results of the analysis revealed that, optimal transportation cost of the beverage firm is GHȼ3, 174635.00 if it transports 769785, 615410 and 1014805 numbers of cases of bottles with drinks from Plant 1 to Accra, Tamale and Kumasi respectively. Again, if they transport 667887, 698463, and 633650 numbers of cases of bottles with drinks to Accra, Techiman and Sunyani from Plant 2, and also from Plant 3, with 11273 and 988727 number of cases of bottles with drinks to Accra and Koforidua respectively. The company’s transportation cost will reduce from GHȼ3,209,897.86 to GHȼ3, 174635.00 if it transports beverage (in cases) from the sources to the various destinations as in the optimal tableau (, Appendix 1, Table 3). It is believed that if the beverage firm applies this mathematical model then, it can save as much as GHȼ35262.86 equivalent to US$ 11,020.00 which could be used in other areas of the firm to boost production. Keywords: Transportation, Beverage firm, Optimal Tableau, Production, Optimal transportation cost. Introduction The production and transportation have crucial role simultaneously to balance the overall supply chain of manufacturing companies. Whenever any product is produced by industry it has to reach to its end users. Consumers may lie far away from the industry. Therefore, transportation is essential to keep the end users in access of various goods and services produced. Transportation maintains the flow of production and consumption regularly, thus causing nation to develop and improve. Transportation makes goods and services available at where and when they are needed by consumers and this eventually expands trade. The performance of a company depends both on its technological expertise and its managerial and organizational effectiveness. Transportation management is an important part of the process for manufacturing companies or firms. Akot-Danso (2009) is of the view that transportation plays a vital role in life of region. It is that aspect of economic activity which provides for the carriage of goods and persons from one place to another. The transportation system of a country therefore is the circulatory system of that area. The networks of transportation in a country, thus, form the veins and arteries through which the activities of the country take place. One of the most important features of transportation, therefore, is that, it is important element in production and services. This is because production is not complete until the finished goods get to the final consumer. Transportation problem is concerned with distributing any commodity from any group of supply centers called sources to any group of receiving centers called destinations, in such a way as to minimize the total distribution cost. Transportation entails the allocation of finished product so as to satisfy customer demands over a specific time horizon. As such transportation problems are inherently optimization problems where the objective is to develop a plan that meets demand at minimum cost or that fills the demand that maximize profit subject to constraints. In real world application, the supply and demand quantities in transportation problem are sometimes hardly specified precisely because of changing economic conditions. Transportation providers utilize resources to make possible the physical movement of the goods, and they must recover the cost of providing this service -transportation cost. To be more specific, “transportation cost includes the rates, minimum weights, loading and unloading facilities, packaging and blocking, damage in transit, and special services available from a carrier -for example, stopping in transit” (Coyle, et al., 2003, p. 342) Saumis et al; (1991) considered a problem of preparing a minimum cost transportation plan by simultaneously solving the following two sub-problems: first the assignment of units available at a series of origins to satisfy demand at a series of destinations and second, the design of vehicle tours to transport these units, when the vehicle has to be brought back to their departure point. The original cost minimization mathematical model was constructed, which is converted into a relaxed total distance optimization, then finally vehicle problem, and an empty vehicle problem.
Transcript of Transportation Problem for a Beverage Firm in Kumasi, Ghana
Mathematical Theory and Modeling www.iiste.org
ISSN 2224-5804 (Paper) ISSN 2225-0522 (Online)
Vol.5, No.2, 2015
6
Transportation Problem for a Beverage Firm in Kumasi, Ghana
Frank Osei Frimpong*, Akwasi Poku Asare
Lecturer, Department of Mathematics and Statistics, P.O. Box 854, Kumasi Polytechnic, Ghana.
* Email: [email protected]
Abstract
This paper seeks to find the optimal transportation cost of a beverage firm in Kumasi-Ashanti Region, Ghana,
using POM-QM for Windows 4 (Software for Quantitative Methods, Production and Operation Management by
Howard J. Weiss) with Vogel’s Approximation Method (VAM) as the initial method. An administered
questionnaire was used for data collection from the firm. The results of the analysis revealed that, optimal
transportation cost of the beverage firm is GHȼ3, 174635.00 if it transports 769785, 615410 and 1014805
numbers of cases of bottles with drinks from Plant 1 to Accra, Tamale and Kumasi respectively. Again, if they
transport 667887, 698463, and 633650 numbers of cases of bottles with drinks to Accra, Techiman and Sunyani
from Plant 2, and also from Plant 3, with 11273 and 988727 number of cases of bottles with drinks to Accra and
Koforidua respectively.
The company’s transportation cost will reduce from GHȼ3,209,897.86 to GHȼ3, 174635.00 if it transports
beverage (in cases) from the sources to the various destinations as in the optimal tableau (, Appendix 1, Table 3).
It is believed that if the beverage firm applies this mathematical model then, it can save as much as
GHȼ35262.86 equivalent to US$ 11,020.00 which could be used in other areas of the firm to boost production.
Keywords: Transportation, Beverage firm, Optimal Tableau, Production, Optimal transportation cost.
Introduction
The production and transportation have crucial role simultaneously to balance the overall supply chain of
manufacturing companies. Whenever any product is produced by industry it has to reach to its end users.
Consumers may lie far away from the industry. Therefore, transportation is essential to keep the end users in
access of various goods and services produced. Transportation maintains the flow of production and
consumption regularly, thus causing nation to develop and improve. Transportation makes goods and services
available at where and when they are needed by consumers and this eventually expands trade. The performance
of a company depends both on its technological expertise and its managerial and organizational effectiveness.
Transportation management is an important part of the process for manufacturing companies or firms.
Akot-Danso (2009) is of the view that transportation plays a vital role in life of region. It is that aspect of
economic activity which provides for the carriage of goods and persons from one place to another. The
transportation system of a country therefore is the circulatory system of that area. The networks of transportation
in a country, thus, form the veins and arteries through which the activities of the country take place. One of the
most important features of transportation, therefore, is that, it is important element in production and services.
This is because production is not complete until the finished goods get to the final consumer.
Transportation problem is concerned with distributing any commodity from any group of supply centers called
sources to any group of receiving centers called destinations, in such a way as to minimize the total distribution
cost. Transportation entails the allocation of finished product so as to satisfy customer demands over a specific
time horizon. As such transportation problems are inherently optimization problems where the objective is to
develop a plan that meets demand at minimum cost or that fills the demand that maximize profit subject to
constraints. In real world application, the supply and demand quantities in transportation problem are sometimes
hardly specified precisely because of changing economic conditions.
Transportation providers utilize resources to make possible the physical movement of the goods, and they must
recover the cost of providing this service -transportation cost. To be more specific, “transportation cost includes
the rates, minimum weights, loading and unloading facilities, packaging and blocking, damage in transit, and
special services available from a carrier -for example, stopping in transit” (Coyle, et al., 2003, p. 342)
Saumis et al; (1991) considered a problem of preparing a minimum cost transportation plan by simultaneously
solving the following two sub-problems: first the assignment of units available at a series of origins to satisfy
demand at a series of destinations and second, the design of vehicle tours to transport these units, when the
vehicle has to be brought back to their departure point. The original cost minimization mathematical model was
constructed, which is converted into a relaxed total distance optimization, then finally vehicle problem, and an
empty vehicle problem.
Mathematical Theory and Modeling www.iiste.org
ISSN 2224-5804 (Paper) ISSN 2225-0522 (Online)
Vol.5, No.2, 2015
7
Firms enter product markets to distribute final goods with the goal of minimizing distribution costs (Connor &
Schiek, 1997). Product markets are also the source of final demand (Henderson & McNamara, 2000). Closeness
to product markets is more important for demand- oriented food processing firms because most of the total
production costs of these firms are associated with distribution of final products (Henderson & McNamara,
2000)
Firms typically outsource a variety of activities in order to achieve specific objective, which includes reducing
costs (Aimi, 2007; Jiang, Frazier, & Prater, 2006; Lau & Zhang, 2006), improving product quality (Bardhan,
Whitaker, & Mithas, 2006), improving flexibility (Lau & Zhang, 2006), increasing market coverage (Skjoett-
Larsen, 2002), or perhaps to gain ready access to additional capacity (Linder, 2004; Mason, Cole, Ulrey, & Yan,
2002). According to Elliott (2006, p. 22), however, “in most cases the objective of outsourcing is a targeted 20%
cost reduction, with actual savings coming from direct labor and variable costs.”
Business and Industries are practically faced with economic optimization such as cost minimization of non-
economic items that are vital to the existence of their firms. Transportation problem is a Linear Programming
problem that is concerned with the optimal pattern of the distribution of goods from several points of origin to
several different destinations, with the specified requirements at each destination.
Transportation problem is a linear programming problem based on a network structure consisting of a finite
number of nodes and arcs attached to them. Lui(2003). In transportation problem, when the demand and supply
quantities are varying, a pair of mathematical problem is formulated to calculate the objective value. The derived
result is also in range, where the total transportation cost would appear. In addition to allowing for simultaneous
changes in supply and demand values, the total cost bounds are calculated directly. Due to the structure of the
transportation problem, the largest total transportation cost may not occur at the highest total quantities shipped.
Since the total cost bounds are derived, it would be beneficial to decision making.
Transportation problems faced by government or a business firm, are not balanced, thus, supply is less than
demand and vice-versa due to paucity of funds. Sometimes, it becomes necessary to transport a certain
percentage of commodities (demand) irrespective of the transportation cost. Almost all decision makers dealing
with transport management are interested in minimization of total transportation cost and total time to each
destination.
In this paper, transportation cost is the expenses involved in moving the finished products from the sources to the
various warehouses in allocation of finished products so as to satisfy customers’ demands over a specific time
horizon. The objective of this study seeks to find the optimal transportation cost of a beverage firm in Kumasi-
Ashanti Region, Ghana, using POM-QM for Window 4 (Software for Quantitative Methods, Production and
Operation Management by Howard J. Weiss) with Vogel’s Approximation Method (VAM) as the initial method.
Methodology
The data used in this study is obtained from a self administered questionnaire designed by the researchers in the
firm to extract from the company, information on their level of supply at each source, level of demand at each
destination and the unit transportation cost from each source to each destination as in (Appendix 2 Tables). The
analysis was based on the information from the management of the firm. The total supply was 5400000 cases of
drinks from three different plants and transported to six different depots (warehouses) with total demand of
5876382 cases of drinks. The total transportation cost was given as GHȼ3,209,897.86 and the unit transportation
cost of a case of drink from a source to a destination as found in (Appendix 1, table 1). Since the total demand
exceeds total supply by 476382 cases, a fictitious source (supply) was created such that the unit cost from this
source to every depot is zero to produce a balanced transportation tableau.
We therefore formulate the linear programming problem based on the above information to minimize the firm’s
transportation (distribution) cost.
Modeling Technique
The transportation model is thus a linear programming problem that can be solved by the regular simplex
method, but of special structure. A balanced transportation problem is where the total supply equals to the total
demand. POM-QM for Windows 4 (Software for Quantitative Methods, Production and Operation Management)
was used to implement the transportation algorithm in this paper with the Vogel’s approximation method (VAM)
as the initial method. The transportation model seeks the determination of a transporting plan for a single
commodity from a number of sources (factories) to a number of destinations (warehouses).The data of the model
should include;
i. The level of supply at each source and amount of demand at each destination.
ii. The unit transportation cost of the commodity from each source to each destination.
Mathematical Theory and Modeling www.iiste.org
ISSN 2224-5804 (Paper) ISSN 2225-0522 (Online)
Vol.5, No.2, 2015
8
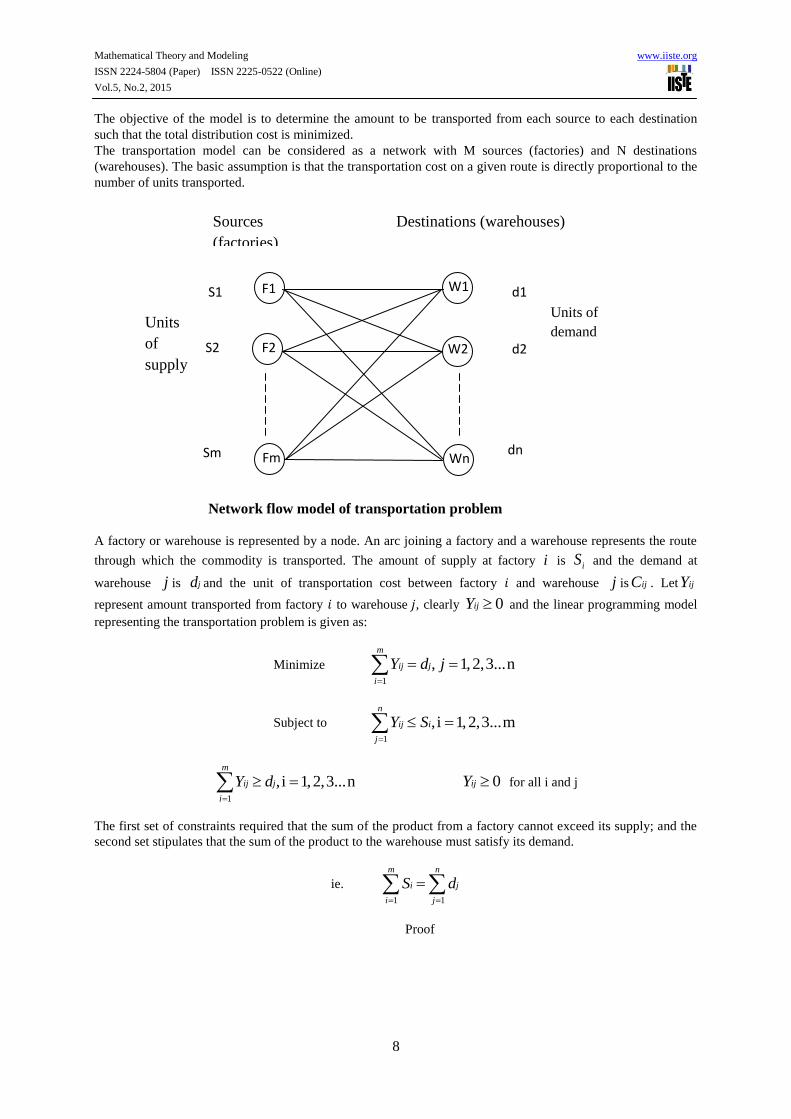
The objective of the model is to determine the amount to be transported from each source to each destination
such that the total distribution cost is minimized.
The transportation model can be considered as a network with M sources (factories) and N destinations
(warehouses). The basic assumption is that the transportation cost on a given route is directly proportional to the
number of units transported.
A factory or warehouse is represented by a node. An arc joining a factory and a warehouse represents the route
through which the commodity is transported. The amount of supply at factory i is iS and the demand at
warehouse j is jd and the unit of transportation cost between factory 𝑖 and warehouse j is ijC . Let ijY
represent amount transported from factory 𝑖 to warehouse 𝑗, clearly 0ijY and the linear programming model
representing the transportation problem is given as:
Minimize
1
, 1,2,3...nm
ij j
i
Y d j
Subject to
1
, i 1,2,3...mn
ij i
j
Y S
1
, i 1,2,3...nm
ij j
i
Y d
0ijY for all i and j
The first set of constraints required that the sum of the product from a factory cannot exceed its supply; and the
second set stipulates that the sum of the product to the warehouse must satisfy its demand.
ie.
1 1
m n
i j
i j
S d
Proof
F1
Fm Wn
1
W2
1
F2
W1
dn
d2
d1
Sm
S2
S1
Units of
demand
Sources
(factories)
Units
of
supply
Destinations (warehouses)
Network flow model of transportation problem
Mathematical Theory and Modeling www.iiste.org
ISSN 2224-5804 (Paper) ISSN 2225-0522 (Online)
Vol.5, No.2, 2015
9
,
1
,
1
i 1,2,3...m
j 1,2,3...n
n
ij i
j
m
ij j
i
Y S
Y d
Summing the first constraints over 𝑖, We obtain
1 1 1
n m m
ij i
j i i
Y S
(1)
Also summing the second constraints over 𝑗,
We obtain
1 1 1
n m n
ij j
j i j
Y d
(2)
This follows from (1) and (2) that
1 1
m n
i j
i j
S d
When the total supply equal the total demand the resulting formulation is called a balanced transportation model.
It differs from the above model only in the fact that all the constraints are equations.
Thus
,
1
,
1
i 1, 2,3...m
i 1,2,3...n
n
ij i
j
m
ij j
i
Y S
Y d
If
1 1
m n
i j
i j
S d
the problem is said to be balanced
,
1
,
1
i 1,2,3...m
i 1,2,3...n
n
ij i
j
m
ij j
i
Y S
Y d
Suppose for some 𝑎 we have
1
n
ai a
j
Y S
Then
1 1 1 1
n m n m
j ij i
j i j i
d Y S
Mathematical Theory and Modeling www.iiste.org
ISSN 2224-5804 (Paper) ISSN 2225-0522 (Online)
Vol.5, No.2, 2015
10
Therefore
1
n
i ij
j
S Y
Also suppose that for some b
db
1
m
ij
i
Y
Then
1 1 1 1
m n m m
b ij i
i j i i
d Y S
Therefore
1
m
j ij
i
d Y
Otherwise the model is said to be unbalanced. However, a transportation model can always be balanced by
adding either dummy source (factory) or destination (warehouse) with a unit transportation cost of zero. This is
one of the special structures of the transportation model.
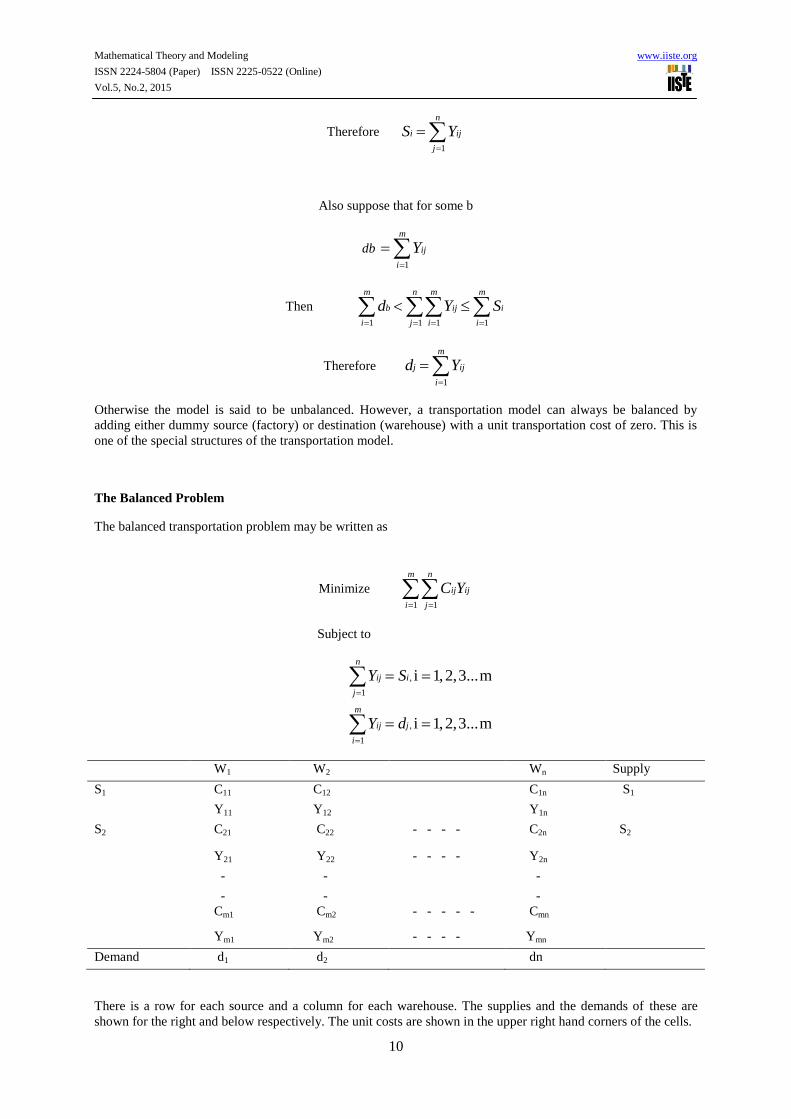
The Balanced Problem
The balanced transportation problem may be written as
Minimize
1 1
m n
ij ij
i j
C Y
Subject to
,
1
,
1
i 1,2,3...m
i 1,2,3...m
n
ij i
j
m
ij j
i
Y S
Y d
W1 W2 Wn Supply
S1 C11 C12 C1n S1
Y11 Y12 Y1n
S2 C21 C22 - - - - C2n S2
Y21 Y22 - - - - Y2n
- - -
- - -
Cm1 Cm2 - - - - - Cmn
Ym1 Ym2 - - - - Ymn
Demand d1 d2 dn
There is a row for each source and a column for each warehouse. The supplies and the demands of these are
shown for the right and below respectively. The unit costs are shown in the upper right hand corners of the cells.
Mathematical Theory and Modeling www.iiste.org
ISSN 2224-5804 (Paper) ISSN 2225-0522 (Online)
Vol.5, No.2, 2015
11
We observe that
i. The coefficient of each variable Yij in each constraint is either 1 or 0.
ii. The constant on the right hand side of each constraint is an integer.
iii. The coefficient matrix A has a certain pattern of 1’s and 0’s.
It can be shown that any linear programming problem with these properties has the following properties:
Thus if the problem has a feasible solution then there exist feasible solution in which all the variables are
integers. It is this property on which the modification of the Simplex method that provides efficient solution
algorithms is based.
We note the following (m + n) conditions
,
1
,
1
i 1,2,3...m
i 1,2,3...n
n
ij i
j
m
ij j
i
Y S
Y d
are not independent since
1 1 1 1
m n m n
i ij j
i j i j
S Y d
Thus the effective number of constraints on the balanced transportation problem is m+n-1.
We therefore expect a basic feasible solution of the balanced transportation problem to have (m+n-1) non
negative entries.
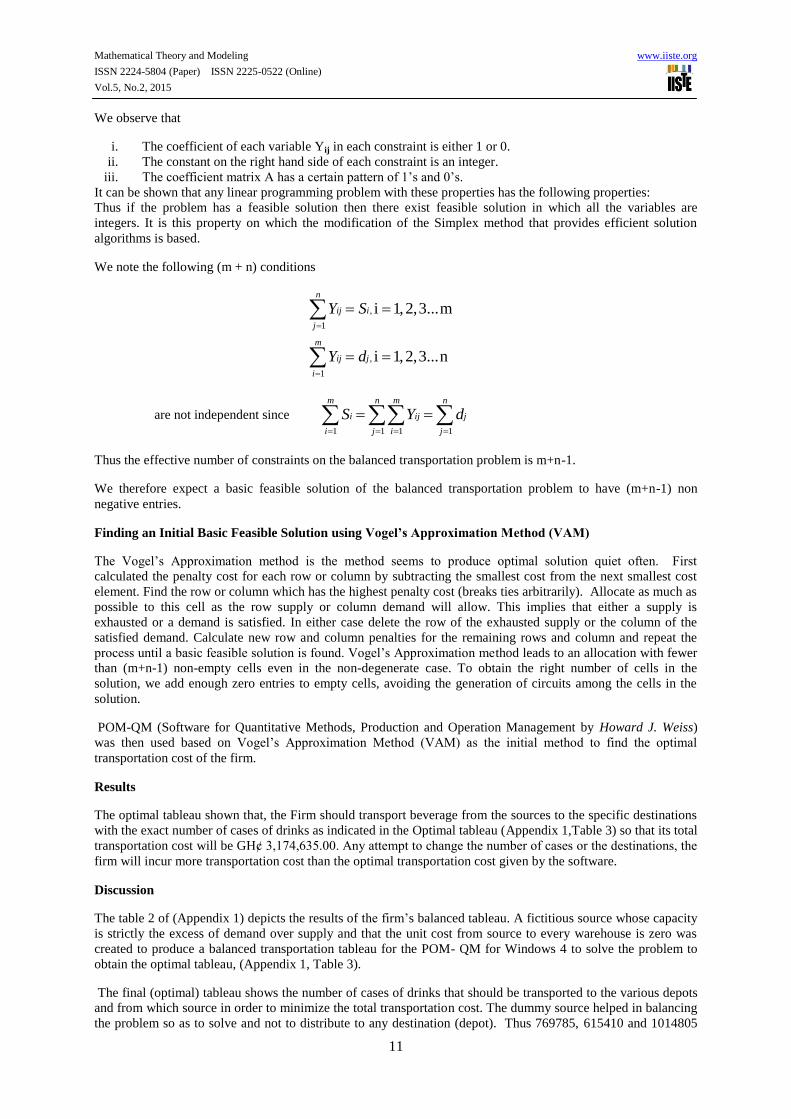
Finding an Initial Basic Feasible Solution using Vogel’s Approximation Method (VAM)
The Vogel’s Approximation method is the method seems to produce optimal solution quiet often. First
calculated the penalty cost for each row or column by subtracting the smallest cost from the next smallest cost
element. Find the row or column which has the highest penalty cost (breaks ties arbitrarily). Allocate as much as
possible to this cell as the row supply or column demand will allow. This implies that either a supply is
exhausted or a demand is satisfied. In either case delete the row of the exhausted supply or the column of the
satisfied demand. Calculate new row and column penalties for the remaining rows and column and repeat the
process until a basic feasible solution is found. Vogel’s Approximation method leads to an allocation with fewer
than (m+n-1) non-empty cells even in the non-degenerate case. To obtain the right number of cells in the
solution, we add enough zero entries to empty cells, avoiding the generation of circuits among the cells in the
solution.
POM-QM (Software for Quantitative Methods, Production and Operation Management by Howard J. Weiss)
was then used based on Vogel’s Approximation Method (VAM) as the initial method to find the optimal
transportation cost of the firm.
Results
The optimal tableau shown that, the Firm should transport beverage from the sources to the specific destinations
with the exact number of cases of drinks as indicated in the Optimal tableau (Appendix 1,Table 3) so that its total
transportation cost will be GHȼ 3,174,635.00. Any attempt to change the number of cases or the destinations, the
firm will incur more transportation cost than the optimal transportation cost given by the software.
Discussion
The table 2 of (Appendix 1) depicts the results of the firm’s balanced tableau. A fictitious source whose capacity
is strictly the excess of demand over supply and that the unit cost from source to every warehouse is zero was
created to produce a balanced transportation tableau for the POM- QM for Windows 4 to solve the problem to
obtain the optimal tableau, (Appendix 1, Table 3).
The final (optimal) tableau shows the number of cases of drinks that should be transported to the various depots
and from which source in order to minimize the total transportation cost. The dummy source helped in balancing
the problem so as to solve and not to distribute to any destination (depot). Thus 769785, 615410 and 1014805

Mathematical Theory and Modeling www.iiste.org
ISSN 2224-5804 (Paper) ISSN 2225-0522 (Online)
Vol.5, No.2, 2015
12
should be transported from Plant 1 to Accra, Tamale and Kumasi respectively. Again 667887, 698463, and
633650 cases of drinks should go to Accra, Techiman and Sunyani from Plant 2. And from Plant 3, 11273 and
988727 number of cases of drinks should be transported to Accra and Koforidua respectively. Distribution of
beverage in this order to the various depots bring the total transportation cost to GH¢ 3174635.00. Any attempt
to change the number of cases or the destinations, the firm will incur more transportation cost than the optimal
transportation cost given by the software in optimal tableau.
Akot-Danso (2009) said production is not complete until the finished goods get to the final consumer. Firms
enter product markets to distribute final goods with the goal of minimizing distribution costs (Connor & Schiek,
1997). Closeness to product markets is more important for demand- oriented food processing firms because
most of the total production costs of these firms are associated with distribution of final products (Henderson &
McNamara, 2000)
So the transportation cost should be minimal in that the consumer will be satisfied with the price of the drinks at
wherever he/she found himself or herself.
Conclusion
This paper sought to find the optimal transportation cost of a beverage firm in Kumasi-Ashanti Region, Ghana,
using POM-QM(Software for Quantitative Methods, Production and Operations Management) with Vogel’s
approximation method (VAM) as the initial method. An administered questionnaire was used for data collection
from the firm. The results of the analysis revealed that, optimal transportation cost of the beverage firm is
GHȼ3, 174635.00 if it transports 769785, 615410 and 1014805 numbers of cases of drinks from Plant 1 to
Accra, Tamale and Kumasi respectively. Again, if they transport 667887, 698463, and 633650 numbers of cases
of bottles with drinks to Accra, Techiman and Sunyani from Plant 2, and also from Plant 3, with 11273 and
988727 number of cases of bottles with drinks to Accra and Koforidua respectively.
The company’s transportation cost was reduced from GHȼ3,209,897.86 to GHȼ3, 174635.00 if it transports
beverage (in cases) from the sources to the various destinations as in the optimal tableau (table 3). It is believed
if the beverage firm applies this mathematical model then, the firm can save as much as GHȼ35262.86
equivalent to US$ 11020.00which could be used in other areas of the firm to boost production.
The manufacturing firm should reduce the needless cost which is losses in the conversion process to improve the
productive time; they have to afford to produce and transport an output with minimum unit cost for sustaining
the profit for business survival too.
Acknowledgement
The authors will like to thank Dr. Bashiru I.I. Saeed, Dean, Faculty of Applied Science at Kumasi Polytechnic
for reviewing an earlier version. All errors and omissions remain with authors.
References
Altiparmak F., Karaoglan I (2008).The journal of operation research society, (ISSN: 0160 – 5682 codenjorsdz)
volume (59, (3), pp 331- 341).
Amano K., Tsukamoto N. (1999). Journal of Osaka Sangyo University; Natural Sciences (vol:, No.107; pp 15 –
26). Amimo E.(2013) , Location Decisions by Food Manufacturing Firms in Kenya
Amponsah S.K. (2007). Optimization Techniques I,(pp 144 – 188, ISBN 9988 – 8359-3-0) Kumasi.
Arora S., Puru M.C (1997).Optimization, volume (39,(4), pp 383-403).
Bai G. et al., (2004). Kybernetes.Grey Transportation Problem, Volume (33,(2), pp 219- 224) ISBN0368-492X.
Emerald Group Publishing Limited.
Bardi et al(2006).Management of Transportation. Thomson South - Western (ISBN 0 – 324 - 31443).
Bookbinder J.H., Sethi S.(1980). The Dynamic Transportation Problem, Naval Research Logistics Quarterly (27,
(1), pp 65-87).
Mathematical Theory and Modeling www.iiste.org
ISSN 2224-5804 (Paper) ISSN 2225-0522 (Online)
Vol.5, No.2, 2015
13
Butzer P. L. et al., (1998).The Mathematical Art, Charlemagne and his Heritage volume (2, pp 379 – 409).
Brepols Turnhout, Belgium.
Chopra et al.,(1998). Tourism Principles and Practices.(2nd ed.). Harlow: Longman.
(ISBN 0-582-31275-6).
Chopra et al.,(2007). Supply Chain Management. Pearson (ISBN 0-13-208608-5).
Currin D.C.(1986).Journal of Operational Research Society, volume (37, pp 387 – 396).
Dangalchev C.A. (1997). International Transactions in Operation Research, Volume (4,(4), pp 259-271(13)).
Denardo et al.,(1988).Management Science, (ISSN: 0025 -1909).
Dwived, R.K et al., (2009). Interactive Decision Making in Prioritized Unbalanced Transportation Problem, The
Lcfai university journal of operations management, Volume (8,(1), pp 67 - 76 ).
Ho W., Ji P (2005). International Journal of Computer Applications in Technology Volume (22, (4), pp 190 -
197)
Ikuma H. (1999). Doro Kensetsu, (vol:, No 622 pp 12 - 14).
Kenyon N.G and Meixell J.M(2011) Success factors and cost management strategies for logistics outsourcing .
Journal of Management and Marketing Research (Vol.7)
Liu L., Lil L.(2007). Fuzzy Fixed Charge Solid Transportation Problem and its Algorithm Volume(3, pp 585-
589).Fourth International Conference on Fuzzy System and Knowledge Discovery.
Liu,S. (2003).Omega volume (31,(4), pp 247 – 251).
McGraw-Hill Dictionary of Scientific & Technical Terms, 6E, Copyright © 2003 by The McGraw-Hill
Companies, Inc
Sang L.M., Laurence M.J.(1973). IIE Transactions, volume (5,(4), pp 333 – 338).
Stopford M.(1997). Maritime Economics. London: Routledge (ISBN 0 - 415- 15310-7)
APPENDIX 1
Table 1. The total number of cases of drinks with different labels distributed over the various depots for
six months and the unit transportation cost of each case. (Data from the firm )
ACCRA TAMALE KUMASI TECHIMAN KOFORIDUA SUNYANI SUPPLY
PLANT 1 0.9 1.0 0.2 0.34 0.52 0.34 2400000
PLANT 2 1.0 1.0 0.2 0.31 0.57 0.31 2000000
PLANT 3 1.0 1.12 0.2 0.32 0.5 0.3 1000000
DEMAND 1925327 615410 1014805 698463 988727 633650

Mathematical Theory and Modeling www.iiste.org
ISSN 2224-5804 (Paper) ISSN 2225-0522 (Online)
Vol.5, No.2, 2015
14
Table 2.The Firm’s Balanced Tableau
ACCRA TAMALE KUMASI TECHIMAN KOFORIDUA SUNYANI SUPPLY
PLANT 1 0.9 1.0 0.2 0.34 0.52 0.34 2400000
PLANT 2 1.0 1.0 0.2 0.31 0.57 0.31 2000000
PLANT 3 1.0 1.12 0.2 0.32 0.5 0.3 1000000
DUMMY 0 0 0 0 0 0 476382
DEMAND 1925327 615410 1014805 698463 988727 633650
Table 3.The Optimal Tableau
Using the POM- QM for Windows 4, the optimal transportation tableau is shown as below.
APPENDIX 2
INFORMATION FROM THE FIRM
Table 1: TRANSPORTATION COST PER CASE
ACCRA TAMALE KUMASI TECHIMAN KOFORIDUA SUNYANI
PLANT 1 0.9 1.0 0.2 0.34 0.52 0.34
PLANT 2 1.0 1.0 0.2 0.31 0.57 0.31
PLANT 3 1.0 1.12 0.2 0.32 0.5 0.3
MINIMUM TRANSPORTATION COST Solution
Optimal
Solution Value
=
GH¢
3174635.00
ACCRA
TAMALE
KUMASI
TECHIMAN
KOFORIDU
A
SUNYANI
PLANT 1 769785 615410 1014805
PLANT 2 667887 698463 633650
PLANT 3 11273 988727
DUMMY 476382
Mathematical Theory and Modeling www.iiste.org
ISSN 2224-5804 (Paper) ISSN 2225-0522 (Online)
Vol.5, No.2, 2015
15
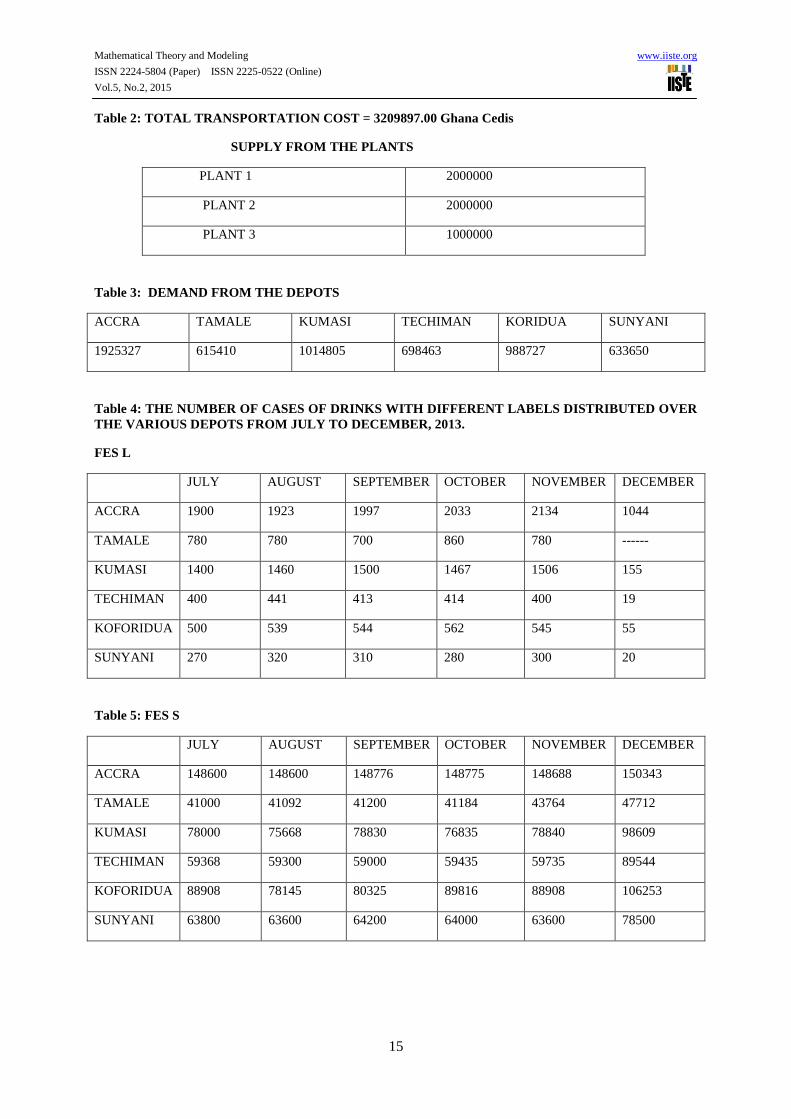
Table 2: TOTAL TRANSPORTATION COST = 3209897.00 Ghana Cedis
SUPPLY FROM THE PLANTS
PLANT 1 2000000
PLANT 2 2000000
PLANT 3 1000000
Table 3: DEMAND FROM THE DEPOTS
ACCRA TAMALE KUMASI TECHIMAN KORIDUA SUNYANI
1925327 615410 1014805 698463 988727 633650
Table 4: THE NUMBER OF CASES OF DRINKS WITH DIFFERENT LABELS DISTRIBUTED OVER
THE VARIOUS DEPOTS FROM JULY TO DECEMBER, 2013.
FES L
JULY AUGUST SEPTEMBER OCTOBER NOVEMBER DECEMBER
ACCRA 1900 1923 1997 2033 2134 1044
TAMALE 780 780 700 860 780 ------
KUMASI 1400 1460 1500 1467 1506 155
TECHIMAN 400 441 413 414 400 19
KOFORIDUA 500 539 544 562 545 55
SUNYANI 270 320 310 280 300 20
Table 5: FES S
JULY AUGUST SEPTEMBER OCTOBER NOVEMBER DECEMBER
ACCRA 148600 148600 148776 148775 148688 150343
TAMALE 41000 41092 41200 41184 43764 47712
KUMASI 78000 75668 78830 76835 78840 98609
TECHIMAN 59368 59300 59000 59435 59735 89544
KOFORIDUA 88908 78145 80325 89816 88908 106253
SUNYANI 63800 63600 64200 64000 63600 78500
Mathematical Theory and Modeling www.iiste.org
ISSN 2224-5804 (Paper) ISSN 2225-0522 (Online)
Vol.5, No.2, 2015
16
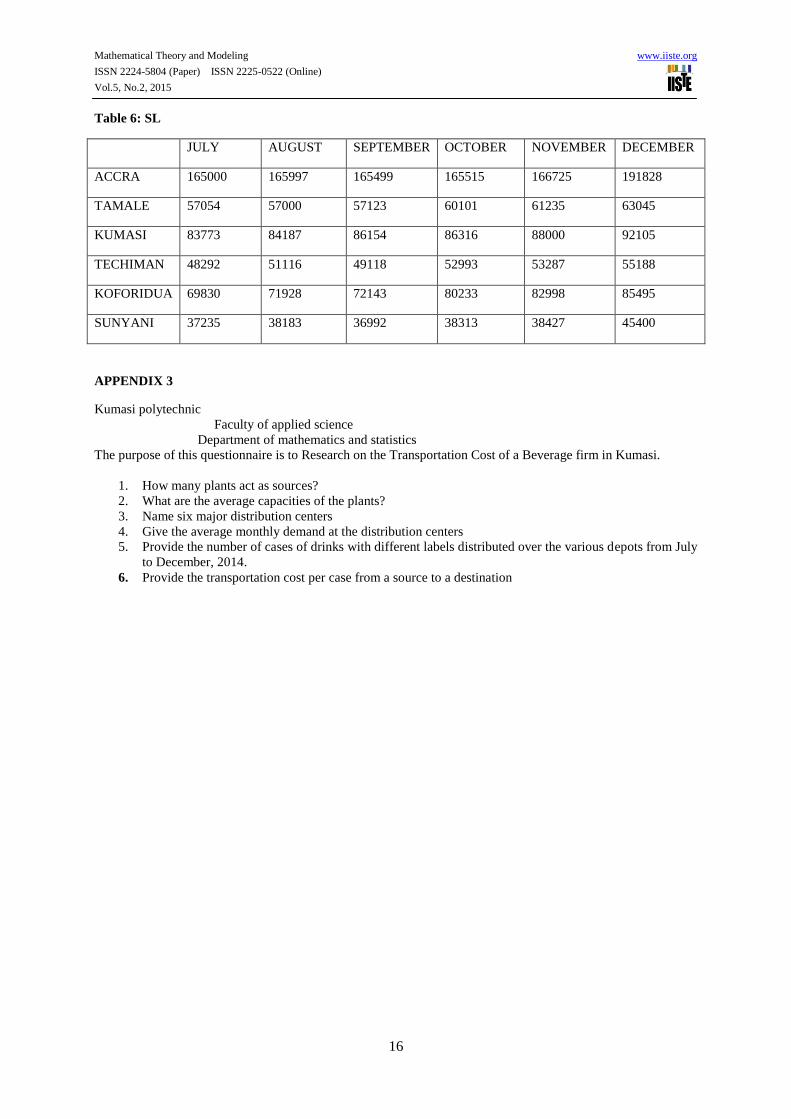
Table 6: SL
JULY AUGUST SEPTEMBER OCTOBER NOVEMBER DECEMBER
ACCRA 165000 165997 165499 165515 166725 191828
TAMALE 57054 57000 57123 60101 61235 63045
KUMASI 83773 84187 86154 86316 88000 92105
TECHIMAN 48292 51116 49118 52993 53287 55188
KOFORIDUA 69830 71928 72143 80233 82998 85495
SUNYANI 37235 38183 36992 38313 38427 45400
APPENDIX 3
Kumasi polytechnic
Faculty of applied science
Department of mathematics and statistics
The purpose of this questionnaire is to Research on the Transportation Cost of a Beverage firm in Kumasi.
1. How many plants act as sources?
2. What are the average capacities of the plants?
3. Name six major distribution centers
4. Give the average monthly demand at the distribution centers
5. Provide the number of cases of drinks with different labels distributed over the various depots from July
to December, 2014.
6. Provide the transportation cost per case from a source to a destination

The IISTE is a pioneer in the Open-Access hosting service and academic event management.
The aim of the firm is Accelerating Global Knowledge Sharing.
More information about the firm can be found on the homepage:
http://www.iiste.org
CALL FOR JOURNAL PAPERS
There are more than 30 peer-reviewed academic journals hosted under the hosting platform.
Prospective authors of journals can find the submission instruction on the following
page: http://www.iiste.org/journals/ All the journals articles are available online to the
readers all over the world without financial, legal, or technical barriers other than those
inseparable from gaining access to the internet itself. Paper version of the journals is also
available upon request of readers and authors.
MORE RESOURCES
Book publication information: http://www.iiste.org/book/
Academic conference: http://www.iiste.org/conference/upcoming-conferences-call-for-paper/
IISTE Knowledge Sharing Partners
EBSCO, Index Copernicus, Ulrich's Periodicals Directory, JournalTOCS, PKP Open
Archives Harvester, Bielefeld Academic Search Engine, Elektronische Zeitschriftenbibliothek
EZB, Open J-Gate, OCLC WorldCat, Universe Digtial Library , NewJour, Google Scholar