Transportation Network and Temporal Analysis with ArcGIS
42
Transcript of Transportation Network and Temporal Analysis with ArcGIS

Agenda
• GIS for Transportation Systems and Networks
• Network Datasets
– Data model
• Network Analyst
– Solvers
• Historic Traffic Speeds
• Time Rendering and Animation
2

GIS for Transportation
• Manage and edit road and asset data
• Dynamically model realistic network conditions
• Solve vehicle routing problems
3

4
Network Datasets

Network datasets vs. Geometric networks
5
Network datasets Geometric networks
Usage Transportation Electric, Gas, Rivers
Flow Type Undirected Directed
Network
Elements
Network elements:
Edges, junctions, and turns
Network features:
Edges and junctions
Source Data GDB feature classes,
shapefiles,
or StreetMap data
GDB feature classes only
ConnectivityUser controls when
connectivity is builtSystem manages connectivity
Attribute
model
More robust attribute
(weight) model
Weights based on feature
attribute fields

SourcesLine features
Point features
Turn features
6
Connectivity
End Point / Any
Vertex
Z-Elevation fields
Connectivity groups
Attributes
Cost
Descriptor
Restriction
Hierarchy
Directions
Primary str names
Alternate str names
Highway shields
Boundary field
Signpost data
Review – what is in a Network Dataset?

Connectivity
7
Four types of network attributes
• Cost
• Restriction
• Hierarchy
• Descriptor
UC 2009 Tech Session 8
1 = Highway
2 = Major Road
3 = Local Street
65
Distance = 1000 m
Drivetime = 5 min
Walktime = 20 min

Common fields on street data
• Used by field evaluator
• Can be specific to the digitized direction of the street
UC 2009 Tech Session 9
Field name Data type Application
Oneway Text Helps determine one way
streets
Length Double Calculate shortest route
FT_Minutes Double Travel time in from-to direction
TF_Minutes Double Travel time in to-from direction
Speed Integer May be used to calculate
travel time
Street name or
Address data
Text Helps generate network
locations and directions
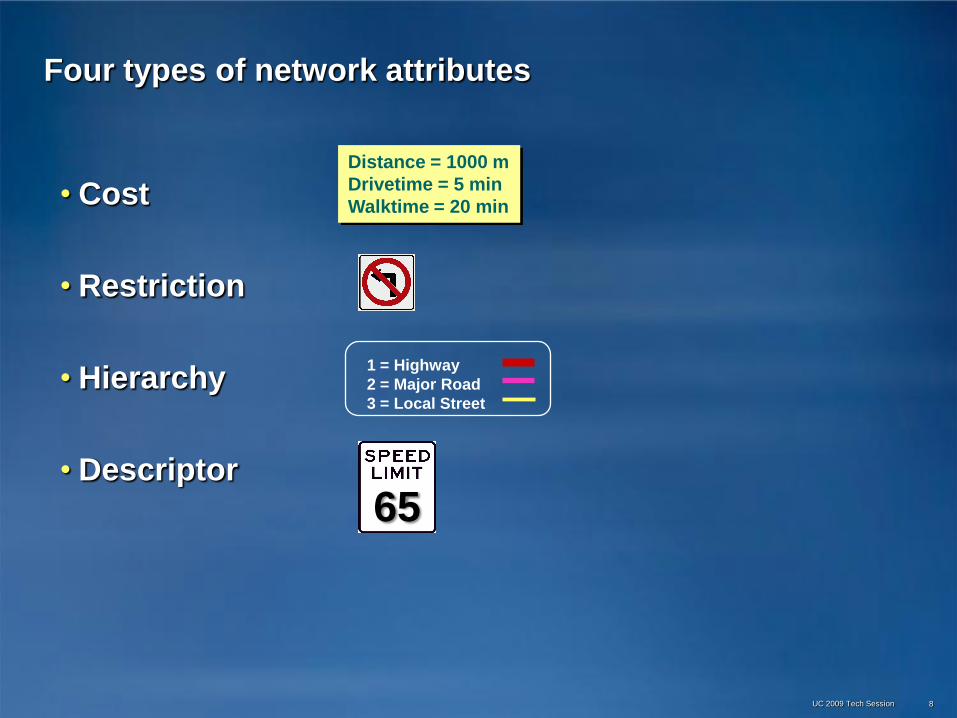
Common fields on street data
• Used by field evaluator
• Can be specific to the digitized direction of the street
UC 2009 Tech Session 10
Field name Data type Application
Oneway Text Helps determine one way
streets
Length Double Calculate shortest route
FT_Minutes Double Travel time in from-to direction
TF_Minutes Double Travel time in to-from direction
Speed Integer May be used to calculate
travel time
Street name or
Address data
Text Helps generate network
locations and directions

Cost attributes
• Value that is accumulated as you traverse a network element
– Examples: Distance, driving time, walking time
• Values are apportioned along edges
UC 2009 Tech Session 11
Distance = 1000 m
Drivetime = 5 min
Walktime = 20 min
Distance = 1000 m
12
Distance = 600 m

Restriction attributes
• A Boolean condition that has one of two values:
–Restricted (true) or Traversable (false)
• Model one-way streets, restricted turns, etc.
12

Hierarchy attributes
• Integer values representing ranks
• Enables multi-level classification of edge elements
• Used when finding paths in a network dataset
1 = Highway
2 = Major Road
3 = Local Street
UC 2009 Tech Session
13

Descriptor attributes
• Description that is true for the entire length of the
network element
• Used for detailed driving directions or to help derive
other attributes
UC 2009 Tech Session 14
65

Parameters on restriction attributes
• Add parameters on restriction attributes
• Determine which network elements can be used by a vehicle
15

Attributes and edge directionality
•For edge elements, attribute values are
defined for both directions of travel
– Relative to the digitized direction of the edge
16
FROMendpoint
TOendpoint
60 Min
20 Min

Turn features
• Line features in a specialized feature class
• Two methods to generate
– Load from turn table
– Create/edit in ArcMap
• Models additional cost and/or restrictions in the network
• Complex turn movements supported
17

Elevation fields (Z-levs)
• Attributes that specify the “level” at endpoints
• Applied to line features with coincident endpoints
18
0
0
0
0
0
0
0
0
0
1
0
0
0
1
0
0
Intersection
Overpass

Elevation fields
19
Z-Levels are necessary to prevent an
overpass from becoming an intersection

Multimodal example
UC 2009 Tech Session 20
local street
exit points
rail line
Yellow bus station
rail station
highway
Yellow bus line
ramp
Blue bus station
walking path
Blue bus line

Multimodal connectivity
21

22
DEMO
Explore the network dataset

What is Network Analyst?
• Extension for analyzing transportation networks
– Uses Network Datasets
– New solver added at 10: Location-Allocation
Route Closest Facility
Service AreaOrigin-Destination
(OD) Cost Matrix
Vehicle Routing
Problem
Location
Allocation

Specialized layers
• Network layer
–References a network dataset
–Appears in table of contents
and Network Analyst toolbar
• Network analysis layer
–Composite layer for
network solver
–Appears in table of contents
and Network Analyst Window
UC 2009 Tech Session 27
Network
Layer
Network
Analysis
Layer

Network Analyst in ArcMap
UC 2009 Tech Session 28
Network Analyst
Window
Network Analyst
toolbar
Network Analyst Tools
Toolbox

29
Network Analyst Solvers

Route solver
• Finds the best route that minimizes travel cost through a series of stops
• Options– Impedance
–Time windows
–Find best sequence
–Directions
–Start time
–Multiple routes
• Applications–Point to point routing
–Traveling salesperson
UC 2009 Tech Session 30

Closest facility solver
• Finds the best route(s) to the closest facility or set of
facilities from an incident or set of incidents
• Options
– Impedance
–Cutoff value
–Number of facilities to find
–Direction of travel
–Directions
• Applications
–Emergency vehicle dispatch
–Customer to stores
UC 2009 Tech Session 31

Vehicle routing problem (VRP) solver
• Route fleets of heterogeneous vehicles
• Applications
–Distribution
– Inspectors
–Assessors
–Technicians
–Para-transit
• Benefits
–Reduce operation costs
–Reduce gas consumption
–Optimize a fleet
UC 2009 Tech Session 32

Service area solver
• Finds areas you can reach from one or more
locations
• Options
– Impedance
–Multiple break values
–Direction of travel
–Polygon and line options
• Applications
–Fire response zones
–Customer service areas
UC 2009 Tech Session 34
Polygons
Lines

Origin-destination cost matrix solver
• Generates an “OD” matrix of the cost from each origin
to each destination
• Multiple origins to multiple destinations
• Application
–Travel time matrix
• Options
– Impedance
–Cutoff value
–Number of
destinations
UC 2009 Tech Session 35
Origin
DestinationDestinations - Stores
Ori
gin
s -
Wa
reh
ou
se
s
1 2 3
A 29.4 24.2 31.3
B 21.5 11.5 18.7
C 17.3 5.67 19.1

Location Allocation solver
• A solver that determines the best place to locate or remove one or more facilities from a set of possible facility locations
• Applications– Depots
• Minimize Distance
– Retail sites
• Maximize Market Share
– Fire Stations
• Locate ten fire stations
such that all residences are
within four minutes of a fire station
UC 2009 Tech Session 36

Directions
• Generated from Route, VRP, and Closest Facility solver results
• Options
– Expandable inset maps
– Reported units
• Distance
• Travel time
– Running total of
time and distance
– Time windows
– Print options
UC 2009 Tech Session 37

Barriers
• Restrict traversability
• Does not require editing the underlying network
UC 2009 Tech Session 38
With a Barrier
No Barrier

Barrier Types
• Point Barriers
– Restriction or Additive cost (new)
– Temporarily slow down due to traffic accident
• Line Barriers
– New input class for all solvers
– Restrict traversal through a geo-fence
– Temporarily slow down roads under construction
• Polygon Barriers
– Used to model inaccessible
areas or slower areas
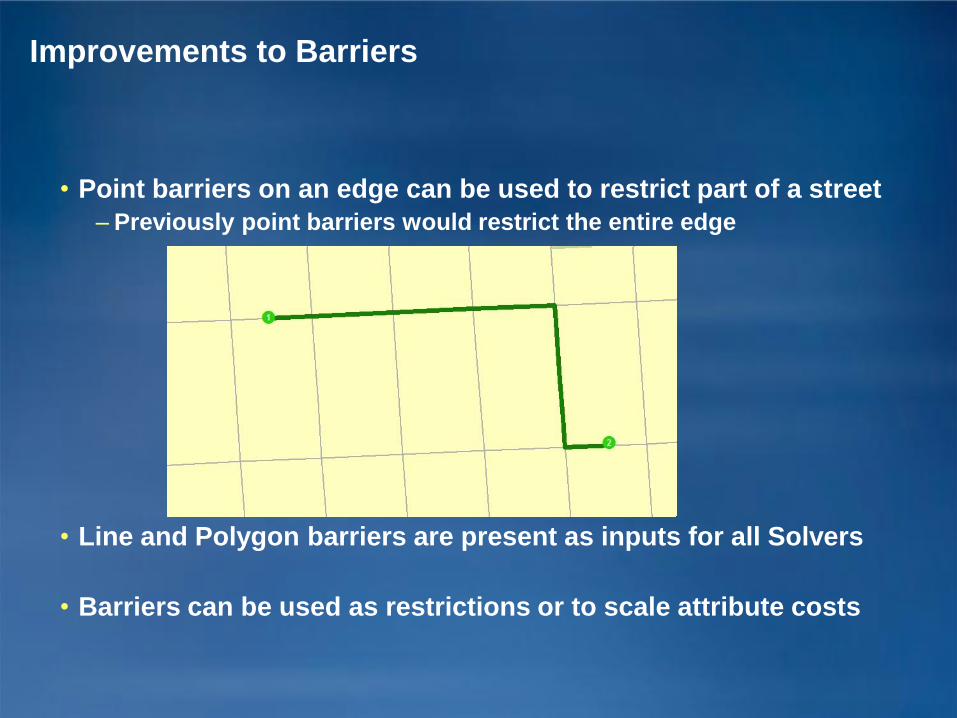
• Point barriers on an edge can be used to restrict part of a street
– Previously point barriers would restrict the entire edge
• Line and Polygon barriers are present as inputs for all Solvers
• Barriers can be used as restrictions or to scale attribute costs
Improvements to Barriers

41
DEMO
Routing
Barriers
Location Allocation
Service Areas
Vehicle Routing Problem

Historical Traffic Data
• Historical traffic data (GDB, StreetMap)
– TeleAtlas 5 minute intervals
– Navteq 15/60 minute intervals
• Traffic Renderer in Network Layer
• Route solver time-aware
• VRP Solver time-aware after sequencing phase

Time in ArcGIS
• Simple temporal mapping
– The map is now time aware
– Time is set by time-slider control
– Time-enabled layers respond to map time
• Enhances the existing ArcGIS system
– Time definition from layer properties
– Simple time properties (existing attributes)
– Desktop, Server, Engine products
Temporal Visualization is part of ArcGIS

63
DEMO
Historical traffic data
Time aware crash data

Summary
• GIS plays a large role in transportation network planning and
analysis
• Network Datasets aim to model real world transportation
infrastructures
• Network Analyst provides the tools to handle the analysis
73

74
Questions and comments?

![Python and ArcGIS Enterprise - static.packt-cdn.com€¦ · Python and ArcGIS Enterprise [ 2 ] ArcGIS enterprise Starting with ArcGIS 10.5, ArcGIS Server is now called ArcGIS Enterprise.](https://static.fdocuments.us/doc/165x107/5ecf20757db43a10014313b7/python-and-arcgis-enterprise-python-and-arcgis-enterprise-2-arcgis-enterprise.jpg)