Transportation Infrastructure and the Decentralization … · layout of cities and the organization...
29
1 Transportation Infrastructure and the Decentralization of Chinese Cities * Nathaniel Baum-Snow 1 and Matthew A. Turner 2 February 24, 2017 Abstract: It is widely believed that transportation infrastructure has important impacts on the development of cities. Until recently, however, there has been little systematic evidence with which to evaluate claims about the effects of transportation infrastructure on the development of cities and regions. In this paper, we describe the evolution of Chinese transportation infrastructure and how it relates to the evolution of location patterns of population and production in Chinese cities and surrounding regions. We summarize empirical evidence from our work with Loren Brandt, Vernon Henderson and Qinghua Zhang on the causal effects of various types of transportation infrastructure on the decentralization of Chinese cities. Finally, we put our results in context of the existing literature on the effects of infrastructure on productivity and the allocation of resources across locations. J.E.L.: R4, O2 Keywords: China, Roads, Railroads, Infrastructure * We are grateful to the Inter-Governmental Council grant #RA-2009-11-013 for generously funding this research. Turner is grateful to the Canadian Social Science and Humanities Research Council for funding. We also thank the many research assistants who helped on this project: Magda Besiada, Rong Zhang Wang, Jie Ciao, Huaihong Su, Yujin Cao, Hyunjoo Wang, Xiaolu Li and particularly Zhi Li and Zhi Wang. We are also grateful to Byron Moldofsky, the University of Toronto Cartography lab and the Neptis Foundation for their support and for their assistance with GIS data. 1 Rotmann School of Business, University of Toronto. 2 Department of Economics, Box B, Brown University, Providence, RI 02906. (email: [email protected])
Transcript of Transportation Infrastructure and the Decentralization … · layout of cities and the organization...
1
Transportation Infrastructure and the Decentralization of Chinese Cities* Nathaniel Baum-Snow1
and Matthew A. Turner2
February 24, 2017
Abstract: It is widely believed that transportation infrastructure has important impacts
on the development of cities. Until recently, however, there has been little systematic evidence
with which to evaluate claims about the effects of transportation infrastructure on the
development of cities and regions. In this paper, we describe the evolution of Chinese
transportation infrastructure and how it relates to the evolution of location patterns of
population and production in Chinese cities and surrounding regions. We summarize empirical
evidence from our work with Loren Brandt, Vernon Henderson and Qinghua Zhang on the causal
effects of various types of transportation infrastructure on the decentralization of Chinese cities.
Finally, we put our results in context of the existing literature on the effects of infrastructure on
productivity and the allocation of resources across locations.
J.E.L.: R4, O2 Keywords: China, Roads, Railroads, Infrastructure
* We are grateful to the Inter-Governmental Council grant #RA-2009-11-013 for generously funding this research. Turner is grateful to the Canadian Social Science and Humanities Research Council for funding. We also thank the many research assistants who helped on this project: Magda Besiada, Rong Zhang Wang, Jie Ciao, Huaihong Su, Yujin Cao, Hyunjoo Wang, Xiaolu Li and particularly Zhi Li and Zhi Wang. We are also grateful to Byron Moldofsky, the University of Toronto Cartography lab and the Neptis Foundation for their support and for their assistance with GIS data. 1 Rotmann School of Business, University of Toronto. 2 Department of Economics, Box B, Brown University, Providence, RI 02906. (email: [email protected])
2
1. Introduction
Over the past two decades China has made huge investments in highways and railroads.
Between 1990 and 2010, an average Chinese prefecture saw its railroad network length increase from
151 km to 218 km. More dramatically, in 1990 there were no limited access highways in China, but by
the end of 2010, there were 215km of limited access highways in an average prefecture. China is not
alone. All over the world, developing countries are making enormous investments in transportation
infrastructure. The importance of infrastructure has been recognized by aid agencies. In 2007,
approximately 20% of the World Bank's lending was for the construction and maintenance of
transportation infrastructure in poor countries.
It is widely believed that transportation infrastructure has important impacts on the
development of cities. Specifically, we expect that improvements to urban transport infrastructure
change location incentives for people and firms and influence the amount of driving and mode choice
conditional on residential and firm location. Such infrastructure improvements may ultimately generate
welfare benefits by reducing commuting and shipping costs. However, they may also affect the physical
layout of cities and the organization of activities within cities, yet what evidence we have is primarily for
the effects of roads on cities in the developed world (Baum-Snow, 2007, 2017; Duranton & Turner,
2011; Garcia-Lopez et al., 2015; Hsu & Zhang, 2014). There has been little empirical investigation of
these phenomena in a developing country context. Moreover, there is almost no evidence about the
effects of modern railroads or the configuration of urban road and rail networks for promoting urban
development.
This paper has two main goals. The first is to describe the evolution of location patterns of
Chinese transportation infrastructure, population and production, and how it is allocated between cities
and their surrounding regions. The second is to describe our work with Loren Brandt, Vernon Henderson
and Qinghua Zhang (Baum-Snow et al. 2017, henceforth BBHTZ) on the effects of transportation
infrastructure on the spatial distribution of population and production in Chinese urban areas. Finally,
we put our estimates in the context of the existing literature on the effects of infrastructure on urban
and regional development. In sum, we describe the state of infrastructure and cities in China, and
summarize what is known about the ways that infrastructure affects the development of cities in China.
3
The decentralization of cities is of interest for several reasons. First, the expansion of
cities has immediate implications for land use, travel behavior and the availability of agricultural
land. Secondly, the decentralization of cities appears to be an important part of the process of
economic development. Early in the industrial revolution, Western cities tended to be dense
and highly centralized: workers typically travelled under their own power to centrally located
factories. With the advent of the internal combustion engine, manufacturing moved to urban
peripheries where land was cheaper, allowing less land intensive business services to occupy
central business districts. In Western countries, incomes have increased many times over since
the beginning of the industrial revolution and, while our understanding of this growth process is
incomplete, it is now widely accepted that much of the innovation responsible for this growth
happens in the densest parts of cities. See Rosenthal & Strange (2004) for a review of the
empirical evidence on local spillovers. More specifically, there is evidence that large cities with
centers occupied by diverse and predominantly white collar industries are engines of economic
growth. Thus, our interest in the role of infrastructure in the decentralization of cities is justified
by the importance of the effects that centralization has on land use and travel demand, but also
by the likely importance of decentralization in the evolution of cities from places organized
around manufacturing into places organized around innovation.
Beyond these general motivations, understanding the effects of transportation
infrastructure on the decentralization of Chinese cities in particular is of interest for three
reasons. First, over the past 20 years more than one hundred million Chinese have migrated
from the countryside to cities, one of the largest human migrations in history. This has naturally
led to very high population densities in Chinese cities, and is probably partly to blame for the
current restrictions on internal migration. These restrictions, known as `hukou', restrict access
to schools and health care for rural migrants and limit rural dwellers' ability to access urban
housing markets and work in urban labor markets. To the extent that transportation
infrastructure facilitates the decentralization of cities, it may also reduce crowding and make
Chinese cities more open to rural migrants. Second, Chinese cities have a history of centrally
planned land allocation. A legacy of the planning economy is that some cities have centers
dominated by large manufacturing establishments. An important feature of the process of
urban growth and development is the decentralization of manufacturing to urban peripheries to
be replaced by younger more dynamic industries that are less land intensive and benefit more
from local productivity spillovers and the availability of a broader range of inputs and ideas. If
4
infrastructure can help Chinese cities to overcome this legacy of planning and become centers of
innovation, then it is important to learn what elements of the transport network are most effective at
facilitating industrial decentralization. Third, Chinese policy makers are particularly interested in food
security. To the extent that transportation infrastructure causes conversion of agricultural land to urban
use, such transport expansions may also reduce food production.
Baum-Snow (2007) finds the extent of population decentralization due to radial urban highways
in the United States to have been slightly larger in magnitude than our estimates for Chinese cities.
Given the higher incomes and associated much higher rates of auto commuting in the United States, this
higher estimate is not surprising. This study indicates that radial highways in Chinese cities may increase
in value as incomes rise. Also using data from the United States, Duranton & Turner (2011) shows that
the amount of driving responds very closely to the amount of road capacity available. Indeed, we have
seen this even in current Chinese cities, in which newly constructed highways quickly become
congested. Duranton & Turner (2012) find that highways draw population to cities, consistent with our
arguments for Chinese cities showing how highways can accommodate more urban residents.
There exists a relevant descriptive literature about the process of the decentralization of
industrial production as countries grow and establish additional infrastructure. Henderson, Kuncoro &
Nasution (2011) show how manufacturing facilities near Jakarta, Indonesia decentralized with the
establishment of a highway linking the city to nearby hinterlands. Deng et al. (2008) descriptively shows
how a similar process has occurred in several Chinese cities. That is, the narrative that industry
decentralizes first to allow cities to specialize in less land intensive and more productive activities has
been documented empirically, though descriptively, in several contexts.
While there remains much ongoing research and debate about the most relevant mechanisms, a
number of recent papers argue convincingly that reductions in transport costs promote economic
growth. Using lights at night data, Storeygard (2016) shows that as the costs of shipping between
interior African cities and nearby markets fall, these interior cities grow. Donaldson (2015) finds very
large effects of roads and rails on growth in Indian cities of the late 19th and early 20th centuries.
Banerjee, Duflo & Qian (2012) find moderate effects of railroads on rural GDP levels but not growth in
China. Michaels (2008) finds consistent evidence for the United States that roads affect factor shares
and output levels in rural counties, also consistent with Chandra and Thompson’s (2000) evidence.
Duranton and Turner (2012) find small effects of roads on urban population growth, suggesting small
effects on productivity in US 1980-2000. They also find that marginal roads in the U.S. are probably not
welfare improving. Ángel Garcia-López et al. (2015) find similar results for modern Spain. This is broadly
5
consistent with Duranton, Morrow and Turner’s (2014) evidence indicating that roads do not affect the
value of intercity trade in US in 2007. The dominant mechanism considered in these papers is that
transport infrastructure lowers trade costs, thereby allowing cities to specialize better in the production
activities for which they have comparative advantages. In general, evidence from the literature suggests
that returns to infrastructure are large in poor countries, and decline with income and the extent of the
network.
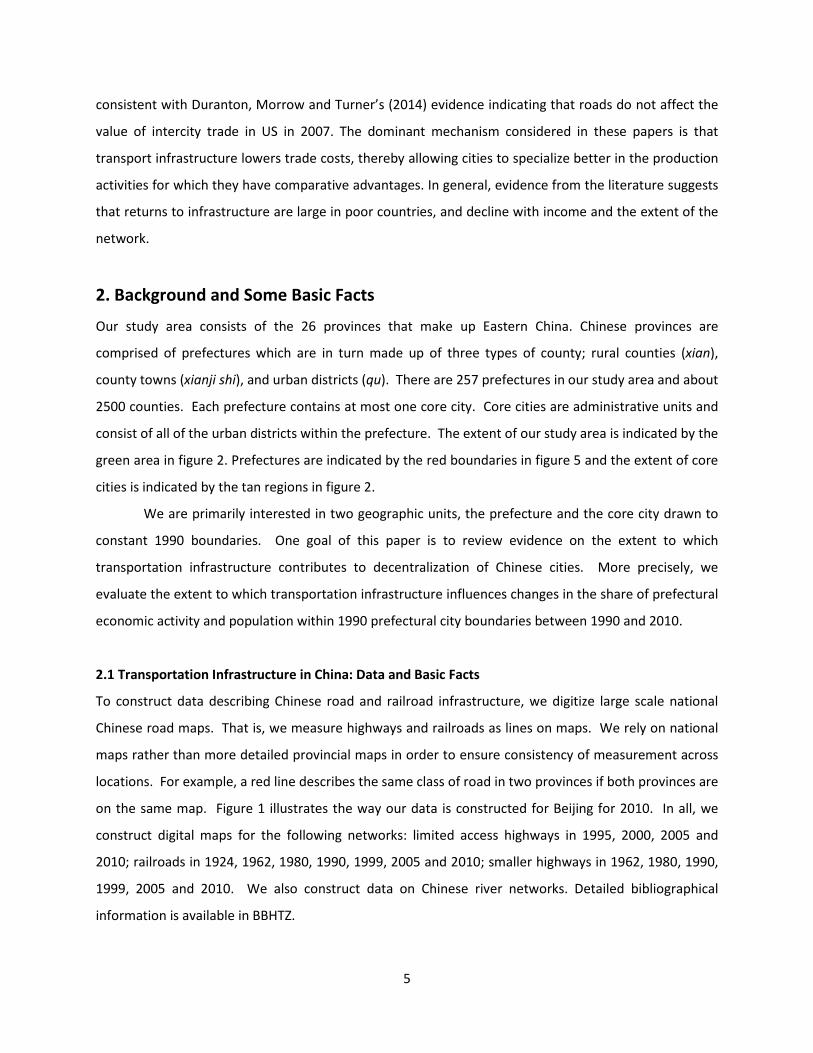
2. Background and Some Basic Facts
Our study area consists of the 26 provinces that make up Eastern China. Chinese provinces are
comprised of prefectures which are in turn made up of three types of county; rural counties (xian),
county towns (xianji shi), and urban districts (qu). There are 257 prefectures in our study area and about
2500 counties. Each prefecture contains at most one core city. Core cities are administrative units and
consist of all of the urban districts within the prefecture. The extent of our study area is indicated by the
green area in figure 2. Prefectures are indicated by the red boundaries in figure 5 and the extent of core
cities is indicated by the tan regions in figure 2.
We are primarily interested in two geographic units, the prefecture and the core city drawn to
constant 1990 boundaries. One goal of this paper is to review evidence on the extent to which
transportation infrastructure contributes to decentralization of Chinese cities. More precisely, we
evaluate the extent to which transportation infrastructure influences changes in the share of prefectural
economic activity and population within 1990 prefectural city boundaries between 1990 and 2010.
2.1 Transportation Infrastructure in China: Data and Basic Facts
To construct data describing Chinese road and railroad infrastructure, we digitize large scale national
Chinese road maps. That is, we measure highways and railroads as lines on maps. We rely on national
maps rather than more detailed provincial maps in order to ensure consistency of measurement across
locations. For example, a red line describes the same class of road in two provinces if both provinces are
on the same map. Figure 1 illustrates the way our data is constructed for Beijing for 2010. In all, we
construct digital maps for the following networks: limited access highways in 1995, 2000, 2005 and
2010; railroads in 1924, 1962, 1980, 1990, 1999, 2005 and 2010; smaller highways in 1962, 1980, 1990,
1999, 2005 and 2010. We also construct data on Chinese river networks. Detailed bibliographical
information is available in BBHTZ.
6
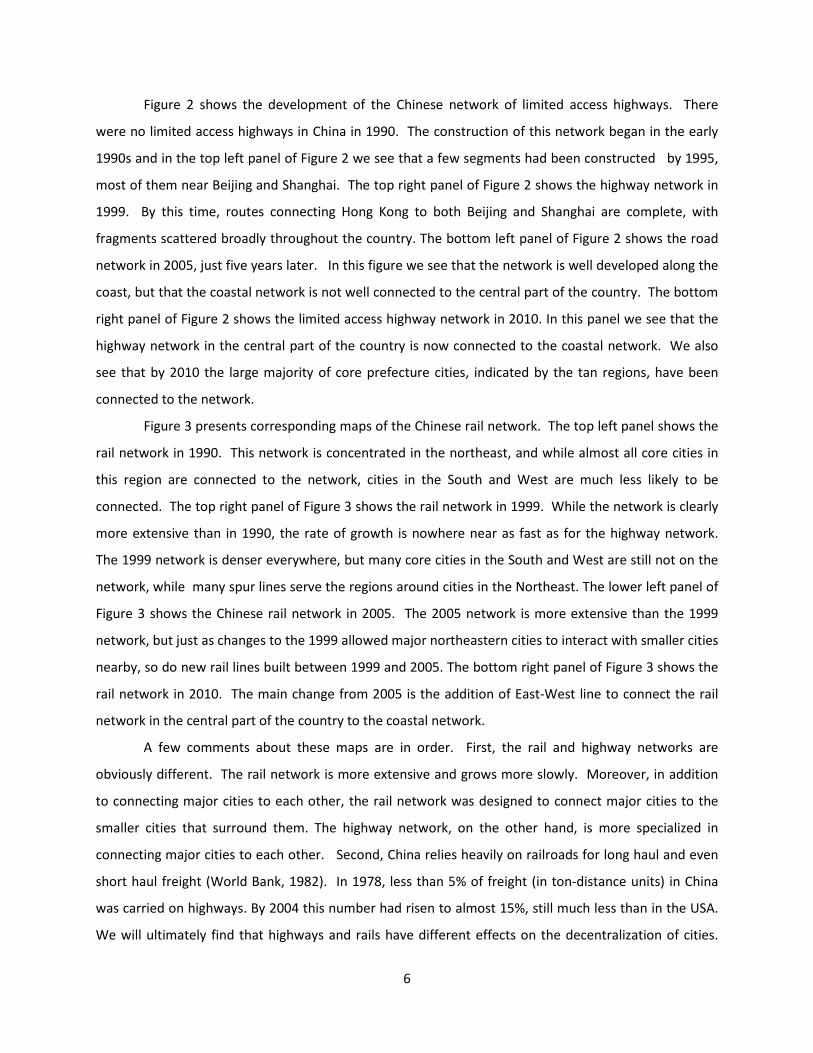
Figure 2 shows the development of the Chinese network of limited access highways. There
were no limited access highways in China in 1990. The construction of this network began in the early
1990s and in the top left panel of Figure 2 we see that a few segments had been constructed by 1995,
most of them near Beijing and Shanghai. The top right panel of Figure 2 shows the highway network in
1999. By this time, routes connecting Hong Kong to both Beijing and Shanghai are complete, with
fragments scattered broadly throughout the country. The bottom left panel of Figure 2 shows the road
network in 2005, just five years later. In this figure we see that the network is well developed along the
coast, but that the coastal network is not well connected to the central part of the country. The bottom
right panel of Figure 2 shows the limited access highway network in 2010. In this panel we see that the
highway network in the central part of the country is now connected to the coastal network. We also
see that by 2010 the large majority of core prefecture cities, indicated by the tan regions, have been
connected to the network.
Figure 3 presents corresponding maps of the Chinese rail network. The top left panel shows the
rail network in 1990. This network is concentrated in the northeast, and while almost all core cities in
this region are connected to the network, cities in the South and West are much less likely to be
connected. The top right panel of Figure 3 shows the rail network in 1999. While the network is clearly
more extensive than in 1990, the rate of growth is nowhere near as fast as for the highway network.
The 1999 network is denser everywhere, but many core cities in the South and West are still not on the
network, while many spur lines serve the regions around cities in the Northeast. The lower left panel of
Figure 3 shows the Chinese rail network in 2005. The 2005 network is more extensive than the 1999
network, but just as changes to the 1999 allowed major northeastern cities to interact with smaller cities
nearby, so do new rail lines built between 1999 and 2005. The bottom right panel of Figure 3 shows the
rail network in 2010. The main change from 2005 is the addition of East-West line to connect the rail
network in the central part of the country to the coastal network.
A few comments about these maps are in order. First, the rail and highway networks are
obviously different. The rail network is more extensive and grows more slowly. Moreover, in addition
to connecting major cities to each other, the rail network was designed to connect major cities to the
smaller cities that surround them. The highway network, on the other hand, is more specialized in
connecting major cities to each other. Second, China relies heavily on railroads for long haul and even
short haul freight (World Bank, 1982). In 1978, less than 5% of freight (in ton-distance units) in China
was carried on highways. By 2004 this number had risen to almost 15%, still much less than in the USA.
We will ultimately find that highways and rails have different effects on the decentralization of cities.
7
Highways affect the locations of people within urban areas, while railroads affect the locations of
manufacturing. These different effects may reflect the intrinsic comparative advantages of railroads and
highways for moving goods and people. Alternatively, they may also reflect the fact that the road and
rail networks were laid out to serve different purposes. While the data in BBHTZ do not permit
distinguishing between the two possibilities, the second alternative seems consistent with an inspection
of the way the networks are laid out.
To proceed with our investigation of how transportation infrastructure affects the
decentralization of Chinese cities, we need measures that quantify the road and rail networks in each
core city and its surrounding region. To do this, we construct three variables for each network. The first
is simply the length of each network in kilometers in each prefecture and in each 1990 core city. The
second and third are radial and ring road indexes. The radial road index describes the ability of a
network to carry traffic radially in and out of the central business district, while the ring index measures
the ability of a network to carry traffic in a circle around the central business district.
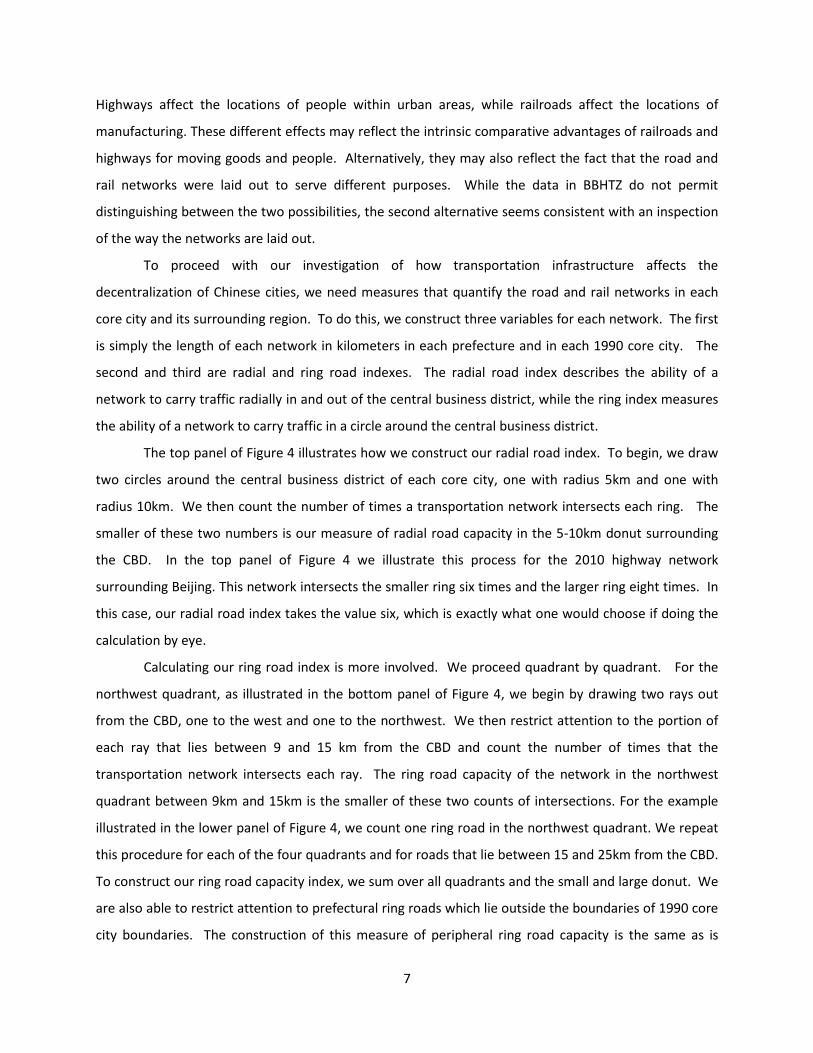
The top panel of Figure 4 illustrates how we construct our radial road index. To begin, we draw
two circles around the central business district of each core city, one with radius 5km and one with
radius 10km. We then count the number of times a transportation network intersects each ring. The
smaller of these two numbers is our measure of radial road capacity in the 5-10km donut surrounding
the CBD. In the top panel of Figure 4 we illustrate this process for the 2010 highway network
surrounding Beijing. This network intersects the smaller ring six times and the larger ring eight times. In
this case, our radial road index takes the value six, which is exactly what one would choose if doing the
calculation by eye.
Calculating our ring road index is more involved. We proceed quadrant by quadrant. For the
northwest quadrant, as illustrated in the bottom panel of Figure 4, we begin by drawing two rays out
from the CBD, one to the west and one to the northwest. We then restrict attention to the portion of
each ray that lies between 9 and 15 km from the CBD and count the number of times that the
transportation network intersects each ray. The ring road capacity of the network in the northwest
quadrant between 9km and 15km is the smaller of these two counts of intersections. For the example
illustrated in the lower panel of Figure 4, we count one ring road in the northwest quadrant. We repeat
this procedure for each of the four quadrants and for roads that lie between 15 and 25km from the CBD.
To construct our ring road capacity index, we sum over all quadrants and the small and large donut. We
are also able to restrict attention to prefectural ring roads which lie outside the boundaries of 1990 core
city boundaries. The construction of this measure of peripheral ring road capacity is the same as is
8
described above, but considers only roads outside the boundaries of the 1990 core city. As we discuss
below, these peripheral ring roads appear to have been most important in shaping Chinese cities since
1990.
Table 1 uses our three city level statistics of total kilometers, radial roads and ring roads, to
describe the evolution of transportation infrastructure in prefectures and their core cities. Panel A
describes the rail network. In 1962 an average prefecture had about 99 km of rail, of which 32 km was in
the core city. The rail network grew steadily between 1962 and 2005, at which point an average
prefecture contained about 214 km of rail, 55 km of which was in the core city. There is little change in
the network between 2005 and 2010. In all, the top panel of Table 1 bears out what we see in Figure 2.
The rail network increased steadily over the 1990 to 2005 period, with much of the expansion devoted
to rail lines that connect core cities to satellite cities just outside their administrative boundaries.
Table 1 Panel A also describes the configuration of the rail network in an average prefecture. In
1962 an average core city had one radial rail line and about half of all core cities had no rail lines. By
1990, the first year illustrated in Figure 2, the average core city had about 1.5 radial rail lines and only
one-third of core cities had zero. By 2005, radial railroads in core cities increase only marginally. An
average core city in 2005 had about 1.8 radial rail lines and the share of core cities without radial rail
lines declined to about one-quarter.
The final four rows of Table 1 Panel A show that prefectures typically have little ring rail
capacity. In 1990 an average prefecture had 0.20 units of ring rail capacity. This means that an average
prefecture city in 1990 has a rail line which travelled about 18 degrees around its perimeter. With this
said, only 18% of core cities have ring rail capacity at all. Thus, Table 1 tells us that almost all of the cities
with ring rail capacity had exactly one unit, i.e., a rail line travelling about 90 degrees around their CBD.
Suburban ring rail capacity is even scarcer. In 1990 an average core city has 0.03 units of peripheral ring
rail capacity and only about five core cities have any peripheral ring rails at all. Ring rail capacity
increases gradually until 2005. Between 2005 and 2010 ring rail capacity actually drops. This appears to
reflect measurement error. Our rail maps are hand drawn so the location of any given rail line will move
slightly from year to year. Since our ring road algorithm is sensitive to such small changes, we can
observe year to year variation in the ring index even when, as is the case for 2005 and 2010, the
underlying network is little changed.
Data reported in Table 1 Panel B is analogous to that in Panel A except it describes the evolution
of China's road network. Roads in our data were of different qualities in different years depending on
what appears on the national maps that we digitized. In 1962 and 1980, almost all roads were single
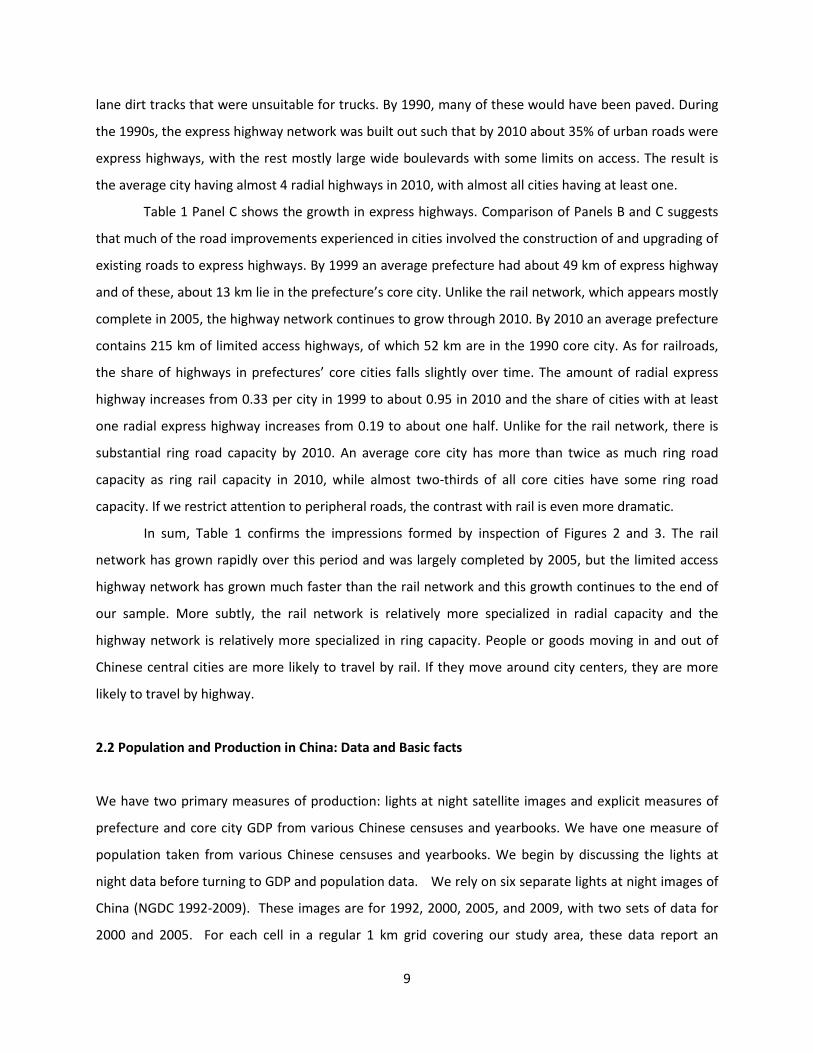
9
lane dirt tracks that were unsuitable for trucks. By 1990, many of these would have been paved. During
the 1990s, the express highway network was built out such that by 2010 about 35% of urban roads were
express highways, with the rest mostly large wide boulevards with some limits on access. The result is
the average city having almost 4 radial highways in 2010, with almost all cities having at least one.
Table 1 Panel C shows the growth in express highways. Comparison of Panels B and C suggests
that much of the road improvements experienced in cities involved the construction of and upgrading of
existing roads to express highways. By 1999 an average prefecture had about 49 km of express highway
and of these, about 13 km lie in the prefecture’s core city. Unlike the rail network, which appears mostly
complete in 2005, the highway network continues to grow through 2010. By 2010 an average prefecture
contains 215 km of limited access highways, of which 52 km are in the 1990 core city. As for railroads,
the share of highways in prefectures’ core cities falls slightly over time. The amount of radial express
highway increases from 0.33 per city in 1999 to about 0.95 in 2010 and the share of cities with at least
one radial express highway increases from 0.19 to about one half. Unlike for the rail network, there is
substantial ring road capacity by 2010. An average core city has more than twice as much ring road
capacity as ring rail capacity in 2010, while almost two-thirds of all core cities have some ring road
capacity. If we restrict attention to peripheral roads, the contrast with rail is even more dramatic.
In sum, Table 1 confirms the impressions formed by inspection of Figures 2 and 3. The rail
network has grown rapidly over this period and was largely completed by 2005, but the limited access
highway network has grown much faster than the rail network and this growth continues to the end of
our sample. More subtly, the rail network is relatively more specialized in radial capacity and the
highway network is relatively more specialized in ring capacity. People or goods moving in and out of
Chinese central cities are more likely to travel by rail. If they move around city centers, they are more
likely to travel by highway.
2.2 Population and Production in China: Data and Basic facts
We have two primary measures of production: lights at night satellite images and explicit measures of
prefecture and core city GDP from various Chinese censuses and yearbooks. We have one measure of
population taken from various Chinese censuses and yearbooks. We begin by discussing the lights at
night data before turning to GDP and population data. We rely on six separate lights at night images of
China (NGDC 1992-2009). These images are for 1992, 2000, 2005, and 2009, with two sets of data for
2000 and 2005. For each cell in a regular 1 km grid covering our study area, these data report an
10
intensity of nighttime lights ranging from 0-63. The codes 0-62 indicate intensity, while 63 is a topcode.
Although it is common in developed countries, topcoding is rare in China during our study period.
Henderson, Storeygard and Weil (2012) show that lights at night are a good proxy for GDP at the
national level. As we discuss below, lights and GDP are also strongly correlated at the Chinese
prefecture level. While lights at night are clearly related to production, they are surely also related to
other human activities, including those occurring in residences, which may not be directly related to
production. Thus, while lights at night give us a more detailed picture of where activity occurs than is
available from administrative data, some caution in interpreting these images is required.
Figure 5 presents lights at night images for our study area for 1992, 1999, 2005 and 2009. In
these images, lighter shades indicate higher nighttime intensity of light and red indicates prefecture
boundaries. These figures show that lights are concentrated in the northeastern part of the country, in
much the same area where the early railroad network is concentrated. Over time, lights expand to the
whole country, but light in the region between Beijing and Shanghai expands most rapidly while the
West grows less dramatically. While the major cities such as Beijing, Shanghai and Hong Kong clearly
grow over our study period, growth is not confined to these cities. Small cities all over the country grow
rapidly as well.
Panel A of Table 2 quantifies this growth in lights. The first row of this table reports the total
amount of light in our study area, with 1992 normalized to one. Consistent with inspection of the
images in Figure 5, we see steady, rapid increase in the total amount of light in the China, with almost
2.5 times as much light in 2010 as in 1992. The second row of panel A in Table 2 reports the share of all
lights that lie in 1990 core cities. We see a gradual decrease in the share of lights in core cities, from
38% in 1990 to 32% in 2010. Thus, as with the road and rail networks, lights increase faster outside the
1990 boundaries of core cities than inside.
We now turn our attention to direct GDP measures. For 1990, we use GDP and industrial sector
GDP information from various national and provincial printed data year books (China Statistics Press,
1992b & 1992c). For 2000-2010, we use output information from the University of Michigan’s Online
China Data Archive at the rural county, county city or core prefecture city levels according to
contemporaneous definitions. We supplement these data with prefecture level printed yearbooks. We
note that prefecture level GDP data is not available for our full sample in all years. As a consequence,
reports on GDP in Table 2 Panel B uses a sample of 189 prefectures. More detail about data construction
is available in BBHTZ.
11
The top panel of Figure 6 describes our GDP data. This figure shows the percent change in GDP
between 1990 and 2010 for constant boundary core cities and for the residual portion of each
prefecture. Gray signifies missing data. For cities and prefectures, rates of GDP growth are assigned to
one of six categories, less than 600%, less than 800%, less than 1000%, less than 1200%, less than 1400%
and at least 1400%, each of which is color coded. Lighter colors indicate lower growth rates. While our
GDP map is somewhat incomplete, as expected, it shows that development has been faster along the
coasts, both in prefecture cities and in the surrounding prefectures. Close inspection does not suggest a
pattern of either decentralization or centralization. In many cases, central cities appear to grow more
quickly than the surrounding prefecture, and conversely.
We separately observe the industrial component of GDP in the tabular data. Indeed, we believe
that industrial GDP is better measured than overall GDP, especially in earlier years. For this reason, and
because GDP results can be inferred from industrial GDP results as described below, the regression
analysis will only look at industrial GDP. Industrial GDP accounts for 46% of measured total GDP in 1990,
rising to 51% in 2010. Table 2 Panel B describes these data. Between 1990 and 2010, prefecture mean
GDP increases by about a factor of 12. We also see that between 1990 and 2010 there was a marked
decentralization of industrial production. The 59% share of industrial GDP in 1990 core cities decreases
to 46% in 2000 and 44% in 2010. This decentralization is more rapid than for overall GDP, which has a
stable central city share of about 45 percent throughout our study period.
Overall, Table 2 bears out our inspection of figure 6 and results based on lights at night data.
There is rapid overall increase in GDP and a decentralization of economic activity focused on industry.
Together with the lights data, the GDP data suggest that Chinese cities are adopting the modern form of
organization often seen in the West. Much production activity occurs in the centers of Western cities,
but as countries become wealthier, manufacturing moves to the periphery of big cities.
Finally, we consider population growth and migration. We assemble population data from the
1990, 2000 and 2010 Chinese censuses of population. For 1990, we rely primarily on the 100% count
Chinese census data aggregated to prefecture core city, rural county or county city level (China Statistics
Press, 1992a). For 2000 and 2010, our census data are the 100% count aggregated to urban district and
rural unit levels (China Statistics Press, 2002 & http://www.luqyu.cn, 2012). We note that in 1990,
Chinese census data reports place of legal residence (hukou) rather than place of actual residence, so
using census data to figure out the resident population is somewhat subtle. More detail on data
construction is available in BBHTZ.
12
The bottom panel of Figure 6 uses our data to illustrate population changes in China between
1990 and 2010. This figure is similar to the top panel of figure 6. 1990 core cities are outlined in blue.
Lighter colors indicate lower rates of population growth.
Unsurprisingly, this figure shows high rates of population growth near Hong Kong, Beijing and
Shanghai. More generally, it shows high rates of population growth along the East coast. Perhaps more
surprising, it shows a number of regions with high population growth in the interior and the West as
well. Thus, the widely reported coastal migration of the Chinese population appears to be only a part of
the story of migration in China. A second pattern is also clear. 1990 core cities experience higher rates of
population growth than do surrounding areas of prefectures. Thus, while the large scale patterns of
migration appear to be complicated, at a small scale they are clear. People are moving from the country
to the city.
Panel C of Table 2 further describes our population data. The first row reports mean population
for entire prefectures in 1990, 2000 and 2010. In 1990 an average prefecture was home to about 4
million people. This number grows to 4.6 million by 2010. The second line of this table reports the share
of an average prefecture's population within the boundaries of the 1990 core city. The share of
population in the 1990 core cities increases between 1990 and 2000 and between 2000 and 2010. In
1990, one person in four lived in a core city. By 2010, it is one person in three. Thus, consistent with
what we saw in Figure 6, the population in core cities is growing much more rapidly than in the
surrounding areas. Some simple calculations illuminate the scale of the rural to urban migration
underlying these data. In 1990, an average core city had a population very close to 1 million. By 2010,
this figure increases to about 1.5 million. With 257 prefectures in our primary sample, this suggests that
the population of 1990 core cities increases by about 127 million between 1990 and 2010.
3. Transportation infrastructure and the decentralization of Chinese cites
3.1 Econometric Method
Our data describe three large changes in the Chinese economy between 1990 and 2010. First, we see a
large increase in GDP. Second, we see a huge migration of people from the countryside into the major
cities. Third, we see a dramatic decentralization of manufacturing. That this decentralization is so much
13
larger than for total GDP suggests a countervailing centralization of sevices. During the same time
period, our data indicate a dramatic increase in the extent of the railroad network and the wholesale
creation of a network of limited access highways. We now describe the results of BBHTZ on the role that
highways and railroads played in the centralization of population and the decentralization of
manufacturing in Chinese cities between 1990 and 2010.
3.1 Econometric Method
BBHTZ investigate the extent to which the road and rail network contributed to the decentralization of
Chinese cities using an instrumental variable regressions analysis. We begin by describing our approach
and providing some intuition about how it works.
BBHTZ conduct regressions of the following form using information for prefectures indexed by i:
(1) ∆𝑡𝑡ln (𝑂𝑂𝑂𝑂𝑂𝑂𝑂𝑂𝑂𝑂𝑂𝑂𝑂𝑂𝑖𝑖) = 𝐴𝐴 + 𝐵𝐵 × (𝐼𝐼𝐼𝐼𝐼𝐼𝐼𝐼𝐼𝐼𝐼𝐼𝑂𝑂𝐼𝐼𝑂𝑂𝑂𝑂𝑂𝑂𝑂𝑂𝐼𝐼𝑂𝑂𝑖𝑖𝑡𝑡) + 𝐶𝐶 × 𝐶𝐶𝑂𝑂𝐼𝐼𝑂𝑂𝐼𝐼𝑂𝑂𝐶𝐶𝐼𝐼𝑖𝑖 + 𝑂𝑂𝐼𝐼𝐼𝐼𝑂𝑂𝐼𝐼𝑖𝑖.
Here, ∆t indicates the 1990-2010 difference and outcomes of interest are core city population and
industrial GDP. The infrastructure measure is one (or more) of our measures of road or rail
infrastructure described in Panels A and B of Table 1, measured as of 2010. B is the parameter of
interest. Control variables include the 1990-2010 change in log prefecture population, which we include
so that B captures the extent to which infrastructure reallocates economic activity between cities and
prefecture remainders holding the total scale constant. Excluding this control would make B capture a
combination of the effects of infrastructure on prefecture size and the allocation of economic activity
between central cities and prefecture remainders. Other control variables measure city and prefecture
size plus 1982 prefecture economic conditions. Reasons for including these variables are explained
below in our discussion of the identification strategy.
The coefficient of interest, B, is the percent of central city population or industrial GDP displaced
to prefecture remainders for each unit change in the infrastructure variable. For highways, we treat the
number of 2010 rays as identical to the 1990-2010 change because the types of roads that appear on
our map in 2010 are of much higher quality than those on the 1990 map.3 However, considerable
railroad infrastructure existed in 1990. As is discussed in BBHTZ, we use 2010 as the measurement year
for railroads as well because in 1990 the central planning regime in China rendered any market
responses to the location of transport infrastructure impossible at that time. Only after 1990 did market
forces begin to influence the allocation of land to different uses in urban areas
3 The empirical analysis in BBHTZ uses 2010 radial and ring road capacity for all types of roads we observe on the map, not just express highways.

14
We must be fundamentally concerned that infrastructure was assigned to prefectures in ways
that are driven by or correlated with unobserved factors in the error term that drive shifts in the
allocation of economic activity between central cities and prefecture remainders. For example, suppose
that highways are assigned to prefectures by a planning authority to anticipate growth in core city
population. In this case, estimates of Equation 1 will yield a positive coefficient: roads are built in
prefectures where core city population grows. Alternatively, suppose that roads are assigned to
prefectures at random. In this case, we expect estimation of equation 1 to return negative estimates of
B. That is, we expect that by reducing transportation costs, additional roads allow population to
decentralize and the share of core city population in the prefecture to decline.
Therefore, the process by which roads are assigned to cities is fundamental to this investigation.
To understand the extent to which infrastructure causes decentralization, it is important to examine
cases in which infrastructure was either assigned randomly or by a process that is unrelated to variables
for which we cannot control but may affect outcomes of interest. To resolve this problem, BBHTZ rely on
instrumental variables (IV) estimation. Our implementation of this technique essentially randomizes
across cities the amount of infrastructure that is received by relying on variation in historical
infrastructure networks to predict modern networks. This process can be thought of as occurring in two
stages. The first stage of this process picks out infrastructure that was assigned to cities in a way that is
plausibly unrelated to unobservables that predict central city growth or decentralization. We use
infrastructure variables measured as of 1962 as instruments.
As is discussed at length in BBHTZ, 1962 roads were of low quality and primarily existed to move
local agricultural goods to market and not to facilitate travel within urban areas. However, their
existence established rights of way over which modern highways could be built at lower cost. Credible IV
estimation in this case thus requires inclusion of control variables that may be correlated with
prefecture agricultural productivity, as this may predict subsequent city or prefecture growth. Similarly,
because 1962 railroads were disproportionately allocated to serve provincial capitals and manufacturing
oriented cities, we control for these two factors as well. All such control variables use measures from
1982. The second estimation stage uses quasi-randomized infrastructure measures that come out of the
first estimation stage to recover estimates of B that are `as if' infrastructure was assigned at random.
Our IV estimates capture the extent of decentralization in prefectures that received more 2010
infrastructure relative to those that received less only because of 1962 infrastructure differences,
holding constant the prefecture industry mix, historical population and central city area. To the extent
that roads or railroads cause cities of different profiles to decentralize at different rates, we can only
15
recover one particular local average treatment effect (LATE) (Imbens & Angrist, 1994) per type of
infrastructure with this procedure. Wrapped into these LATEs are likely to be cocktails of treatment
effects that depend on underlying observed and unobserved prefecture heterogeneity. That is, our
estimated treatment effects apply only to the set of prefectures for which 1962 infrastructure affected
2010 infrastructure. Attempts to unpack which types of prefectures are most affected by infrastructure
reveals that more developed areas in the East experience larger decentralization effects of
infrastructure than other areas. Moreover, infrastructure responses primarily occur within 10 years of
construction. However, our results are not driven by the largest cities. Limited statistical power
precludes us from disaggregating heterogeneity in treatment effects much further. We note that as with
any IV estimator in which the treatment is not truly randomized with full compliance, our estimates
apply only to the types of cities that experienced infrastructure upgrades because of the 1962
infrastructure in place. It may well be that some cities with low gains from upgrades chose not to do so,
even though 1962 roads and rails gave them lower cost infrastructure upgrade options. That is, we can
only recover “treatment on the treated” type estimates.
We note that while IV estimation is subtle, it is pervasive in applied microeconomics. Moreover,
similar IV estimation strategies have been successfully employed in other papers looking at the effects
of transport infrastructure, including Baum-Snow (2007), Duranton, Morrow and Turner (2014),
Duranton and Turner (2011), Duranton and Turner (2012), Hsu and Zhang (2011) and Michaels (2008).
This collection of papers gives us enough experience with this general estimation strategy to be
confident that BBHTZ provide credible estimates of the causal effects of infrastructure on the spatial
organization of Chinese cities.
3.2 The Effects of Infrastructure on Population Decentralization in Chinese Cities
In regressions like (1) where the outcome variable is change in log core city population between 1990
and 2010 and the infrastructure measure is the index of radial road capacity for major highways, BBHTZ
find that each highway ray causes between a 4 and a 6 percent decrease in core city population,
depending on the details of the regression. The existence of some ring road capacity additionally
decentralizes about 25 percent of core city population to prefecture remainders. We find no discernable
effects of any other transport measures studied, including radial rail capacity, the extent of the
prefecture road network, the extent of the rail prefecture network, or ring rail capacity on population
decentralization.
16
Consistent with evidence for the U.S. in Baum-Snow (2007) and Duranton and Turner (2012),
differences between OLS and IV highway rays coefficients suggest that 1999 and 2010 radial road indices
are not assigned to cities at random. Specifically, more roads are assigned to cities whose populations
grow faster relative to the surrounding prefecture. Thus, more roads were built in prefectures
containing rapidly growing core cities, even as these roads were causing population to decentralize from
these cities. Results in BBHTZ show that while more rapidly growing Chinese cities received more
transport infrastructure of various types, the decentralization that occurred because of this
infrastructure is overwhelmed by the growth that precipitated the construction of this infrastructure.
3.3 The Effects of Infrastructure on Production Decentralization in Chinese Cities
BBHTZ next investigate the effects of transportation infrastructure on the decentralization of production
from central cities. Specifically, BBHTZ estimate versions of Equation 1 in which the outcome variable is
the change in log industrial GDP between 1990 and 2010. With industrial GDP measured much more
precisely than entire GDP in 1990, we focus on estimating effects on the industrial GDP measure. To
maintain consistency in regression specification, we use the same set of control variables as in the
population analysis described in Section 3.2. We lose 16 prefectures from the sample for which we do
not observe 1990 GDP information.
Results indicate that neither highway rays nor network length have measurable effects on the
decentralization of core city economic activity. However, railroads cause economic activity to
decentralize. Each railroad ray is estimated to displace 24-34 percent of core city industrial GDP.
Because industrial GDP is about half of full GDP, and we find that these effects primarily apply to the
industrial sector, rail’s effects on full GDP are about half as large. Similar strong results hold for
prefecture railroad network length, however BBHTZ do not have the statistical power to jointly estimate
the effects of these two railroad network measures in one regression. BBHTZ find large additional
statistically significant negative effects of the existence of a ring road on prefecture city economic
activity that come in addition to the effects of rail rays. The estimated effect of peripheral ring road
capacity on industrial GDP is -0.710 log points in addition to -0.236 log points for each radial railroad.
These estimates are robust to including other transportation measures in the regression and to changes
in the details of the regression equation. As with highways and population, results reported in BBHTZ
suggest that more railroads have been assigned to central cities with more rapid GDP growth.
We believe that railroads are important for industrial decentralization because they dominate
trucking as the primary intercity shipping mode. More radial railroads provide more options for
17
manufacturers to move out of central cities and maintain access to the national railroad network
through sidings and ring road connections. Industrial decentralization is likely a desired reorganization of
urban production activities since cheaper land and rural labor is well-suited for the land intensive low
skilled manufacturing sector. At the same time, CBD land can be repurposed toward services which are
less space intensive and typically benefit more from local agglomeration spillovers.
3.4 Employment versus Population
Evidence in BBHTZ indicates that radial roads cause population decentralization, radial railroads cause
decentralization of industry and ring roads cause both. While these results might seem to be
contradictory, since industrial employment that has decentralized because of railroads must require
more suburban workers, these results can be squared by looking at decentralization effects on
employment by industry. Estimated effects of roads and railroads on the number of working residents
are very similar to those reported in Section 3.2 for population. However, estimated effects on
employment in manufacturing only are similar to those reported for industrial GDP in Section 3.3,
whether this employment is aggregated to residential or work locations. This suggests that railroads did
indeed cause some people to decentralize (or not move to cities when they otherwise would have)
whereas radial roads promoted either more intensive commuting from suburbs to central cities or
decentralization of non-manufacturing jobs. Altogether, we thus have evidence that highways promote
decentralization of service jobs and workers while rails promote decentralization of manufacturing jobs
and workers. That railroads do not affect the allocation of the total working population between cities
and suburbs means that railroads likely promote central city shifts toward the service sector. Ring roads
decentralize all types of activities.
3.5 Other effects of infrastructure
BBHTZ make two further findings. The first, is that neither road nor railroad infrastructure influences
prefecture population levels. In a regression like (1) where the dependent variable is change in
prefectural population, rather than central city population, the coefficient on radial highways is small
and statistically indistinguishable from zero. They obtain similar results for other infrastructure
measures.
18
This clarifies the interpretation of their results in an important way. Regressions showing
changes in central city share of population or GDP could reflect increases in suburban population or
GDP, decreases in central city population or GDP, or the migration of activity from the center to the
suburbs. The fact that the overall level of prefectural population and GDP does not depend on within-
prefecture measures of infrastructure tells us the effects of this infrastructure are purely redistributive.
Within-prefecture infrastructure appears to operate primarily by reorganizing activity within the
prefecture, specifically by encouraging the radial migration of population and GDP that we have
discussed at length.
Finally, BBHTZ investigate the extent to which the effects of infrastructure on industry location
differ by industry. To accomplish this, they perform regressions like those for industrial GDP, i.e., like
equation (1), where the dependent variable is change in sectoral employment decentralization. They
partition manufacturing sectors into three groups on the basis of the weight of a given value of output
on the basis of data given in Duranton, Morrow and Turner (2014). Thus, for example, primary metals
and wood and paper processing is in the heavy category, fabricated metals and furniture are in the
`medium’ category, and textiles and high-tech are in the `low’ category.
Given our results for overall industrial output, we expect that particular industries decentralize
in response to radial railroads and ring highway capacity, but do not respond to other infrastructure
measures. This is broadly true, though the more disaggregated analysis suggests a slightly subtler story.
All three weight classes respond to radial railroads, although light goods respond more than medium
which in turn respond more than heavy goods. The effect of ring roads on decentralization is most
pronounced for high tech goods. Medium weight goods also decentralize in response to radial highways.
This suggests that heavy goods manufacture is often stuck in place by big immobile capital investment,
while other classes of manufacturing are more footloose and able to decentralize to find cheaper land.
5. Policy Implications and Broader Lessons We have so far described how the spatial organizations of population, production and infrastructure
have evolved in Chinese cities between 1990 and 2010. We have also reported our findings from BBHTZ
on the extent to which transportation infrastructure has affected the organization of population and
production in Chinese cites. Broadly, we find that radial railroads and ring roads have caused
decentralization of economic activity, while radial roads and ring roads have caused the decentralization
of population. There is some heterogeneity across industries in how they respond to infrastructure.
There is no evidence that prefecture level infrastructure affects the level of population or GDP within a
19
prefecture. Thus, the decentralization effect described in BBHTZ probably reflects the radial migration
of central city population and manufacturing.
The data conspire against a compelling welfare assessment of 1990-2010 Chinese infrastructure
contruction. Consider the following two facts. First, we have established above that there are high
levels of mobility in China. We estimated above that about 127 million people migrated into Chinese
central cities between 1990 and 2010. Second, as we describe above, there is no evidence that
prefectural level infrastructure affects the overall level of prefecture population. If we take the high
rates of population mobility as evidence that mobility costs are low, then the fact that people are not
attracted to prefectures with better infrastructure should indicate that these policy innovations are not
making the prefectures better places to live. That is, that infrastructure investments are not improving
welfare, at least at the margin.
On the other hand, we from table 1 we can calculate that in 2010 urban GDP per person are
nearly double rural GDP per person. This ratio is much high relative to the rural-urban wage gap in
developed countries (World Bank 2006) and if, as the high mobility figure suggest, mobility was not
costly, such a high gap can be sustained only if Chinese cities are `sufficiently more unpleasant’ than the
countryside to offset wage difference, or if there is some institutional barrier to migration. Given the
existence of the Hukou system, it is natural to suspect that institutional barriers to migration help to
preserve the large rural-urban wage gap. However, this calls into question the logic of the preceding
paragraph. If people are not able to move to exploit the large rural-urban wage gap, then prefectural
level infrastructure could, in principle, have large effects on welfare without affecting prefectural level
population. Until we are able to resolve these conflicting lines of argument, any welfare analysis of
the Chinese infrastructure expansion is necessarily quite speculative.
With this said, on a purely theoretical basis, there is good reason to think that the Chinese
infrastructure expansion improved welfare. Transportation infrastructure reduces transportation costs
and allows firms and people to consume more land holding the cost of travel constant. This reduction in
land costs reduces both the costs of housing and production, to increase real income and profit. Using
US data and a simulation model, Baum-Snow (2007b) indicates welfare gains of 2-3% per additional
highway ray for U.S. cities as a consequence of these effects. It is not clear whether we should expect
these effects to be larger or smaller than those for China. Similarly, we expect an analogous effect on
production, but have no basis for quantifying its magnitude.
More generally, while it is clear on theoretical grounds that improvements to infrastructure
increase welfare, it less clear if this increase is sufficient to justify its costs.
20
References Imbens, G. and J. Angrist, 1994. Identification and estimation of local average treatment effects, Econometrica, 62:2, 467-475. Banerjee, A., E. Duflo and N. Qian, 2012. On the Road: Transportation Infrastructure and Economic Development, NBER Working Paper 17897. Baum-Snow, N., L. Brandt, J.V. Henderson, M. Turner and Q. Zhang, 2016. Roads, Railroads and Decentralization of Chinese Cities, Review of Economics and Statistics, forthcoming. Baum-Snow, N., 2007. Did highways cause suburbanization? Quarterly Journal of Economics 122:2, 775–805. Chandra, A. and E. Thompson, 2000. Does public infrastructure affect economic activity? Evidence from the rural interstate highway system, Regional Science and Urban Economics, 30:4, 457–490. China Statistics Press, 1992a. 1990 Provincial Census Books. China Statistics Press, 1992b. 1990 China Urban Statistical Yearbooks. China Statistics Press, 1992c. 1990 Provincial Statistical Yearbooks.
China Statistics Press, 2002. 2000 Census County Statistics. Deng, X., J. Huang, S. Rozelle and E. Uchida, 2008. Growth, population and industrialization, and urban land expansion of China, Journal of Urban Economics, 63, 96–115.
Donaldson, D., forthcoming. Railroads of the Raj: Estimating the Impact of Transportation Infrastructure, American Economic Review. Duranton, G., P. M. Morrow, and M. A. Turner, 2014. Roads and trade: Evidence from US cities, Review of Economic Studies, 81:2, 681-724. Duranton, G. and M. A. Turner, 2011. The fundamental law of road congestion: Evidence from US cities. American Economic Review, 101:6, 2616-2652.
Duranton, G. and M. A. Turner, 2012. Urban growth and transportation, Review of Economic Studies, 79:4, 1407-1440. Henderson, J.V., A. Kuncoro and D. Nasution, 1996. The Dynamics of Jabotabek Development, Bulletin of Indonesian Economic Studies.
21
Henderson, J. V., A. Storeygard and D. Weil, 2012. Measuring Economic Growth from Outer Space, American Economic Review, 102:2, 994-1028. Miquel-Ángel Garcia-López, Adelheid Holl and Elisabet Viladecans-Marsal, 2015, Suburbanization and highways in Spain when the Romans and the Bourbons still shape its cities, Journal of Urban Economics, 85(Jan.):52-67. Hsu, W-T and H. Zhang, 2014. The Fundamental Law of Highway Congestion Revisited: Evidence from National Expressways in Japan, Journal of Urban Economics, 81:65-76. Lianxinwang Web Site, 2012. Compendium of reports from local statistics bureaus, http://www.luqyu.cn/index.asp. Michaels, G., 2008. The effect of trade on the demand for skill Evidence from the Interstate Highway System, Review of Economics and Statistics, 90:4, 683–701. National Geophysical Data Center, 4 DMSP-OLS Nighttime Lights Time Series, 1992-2005. Rosenthal, S. and W. Strange, 2004. Evidence on the Nature and Sources of Agglomeration Economies in Handbook of Urban and Regional Economics, Vol. 4 V. Henderson & J. Thisse eds., Elsevier. Storeygard, A., forthcoming. Farther on down the road: transport costs, trade and urban growth in sub-Saharan Africa, Review of Economic Studies.
World Bank, 1982. China – Socialist economic development (Vol. 7 of 9): Annex F: The transport sector.
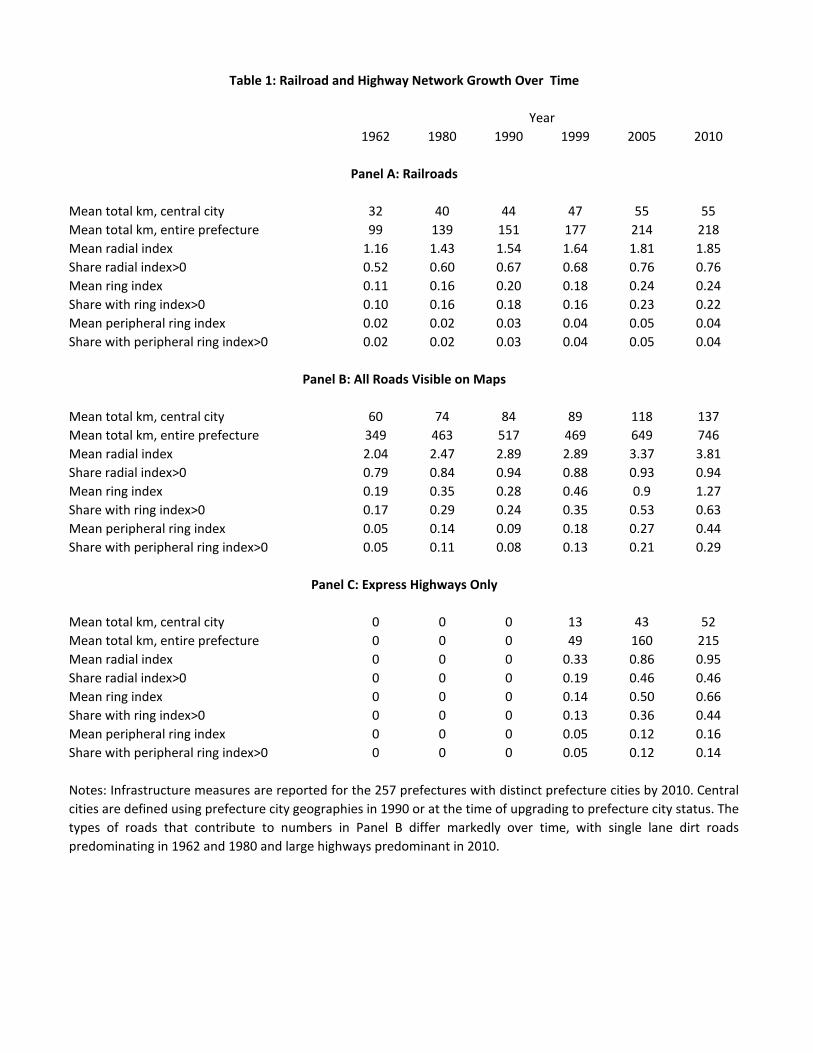
1962 1980 1990 1999 2005 2010
Mean total km, central city 32 40 44 47 55 55Mean total km, entire prefecture 99 139 151 177 214 218Mean radial index 1.16 1.43 1.54 1.64 1.81 1.85Share radial index>0 0.52 0.60 0.67 0.68 0.76 0.76Mean ring index 0.11 0.16 0.20 0.18 0.24 0.24Share with ring index>0 0.10 0.16 0.18 0.16 0.23 0.22Mean peripheral ring index 0.02 0.02 0.03 0.04 0.05 0.04Share with peripheral ring index>0 0.02 0.02 0.03 0.04 0.05 0.04
Mean total km, central city 60 74 84 89 118 137Mean total km, entire prefecture 349 463 517 469 649 746Mean radial index 2.04 2.47 2.89 2.89 3.37 3.81Share radial index>0 0.79 0.84 0.94 0.88 0.93 0.94Mean ring index 0.19 0.35 0.28 0.46 0.9 1.27Share with ring index>0 0.17 0.29 0.24 0.35 0.53 0.63Mean peripheral ring index 0.05 0.14 0.09 0.18 0.27 0.44Share with peripheral ring index>0 0.05 0.11 0.08 0.13 0.21 0.29
Mean total km, central city 0 0 0 13 43 52Mean total km, entire prefecture 0 0 0 49 160 215Mean radial index 0 0 0 0.33 0.86 0.95Share radial index>0 0 0 0 0.19 0.46 0.46Mean ring index 0 0 0 0.14 0.50 0.66Share with ring index>0 0 0 0 0.13 0.36 0.44Mean peripheral ring index 0 0 0 0.05 0.12 0.16Share with peripheral ring index>0 0 0 0 0.05 0.12 0.14
Panel A: Railroads
Panel B: All Roads Visible on Maps
Year
Table 1: Railroad and Highway Network Growth Over Time
Notes: Infrastructure measures are reported for the 257 prefectures with distinct prefecture cities by 2010. Centralcities are defined using prefecture city geographies in 1990 or at the time of upgrading to prefecture city status. Thetypes of roads that contribute to numbers in Panel B differ markedly over time, with single lane dirt roadspredominating in 1962 and 1980 and large highways predominant in 2010.
Panel C: Express Highways Only
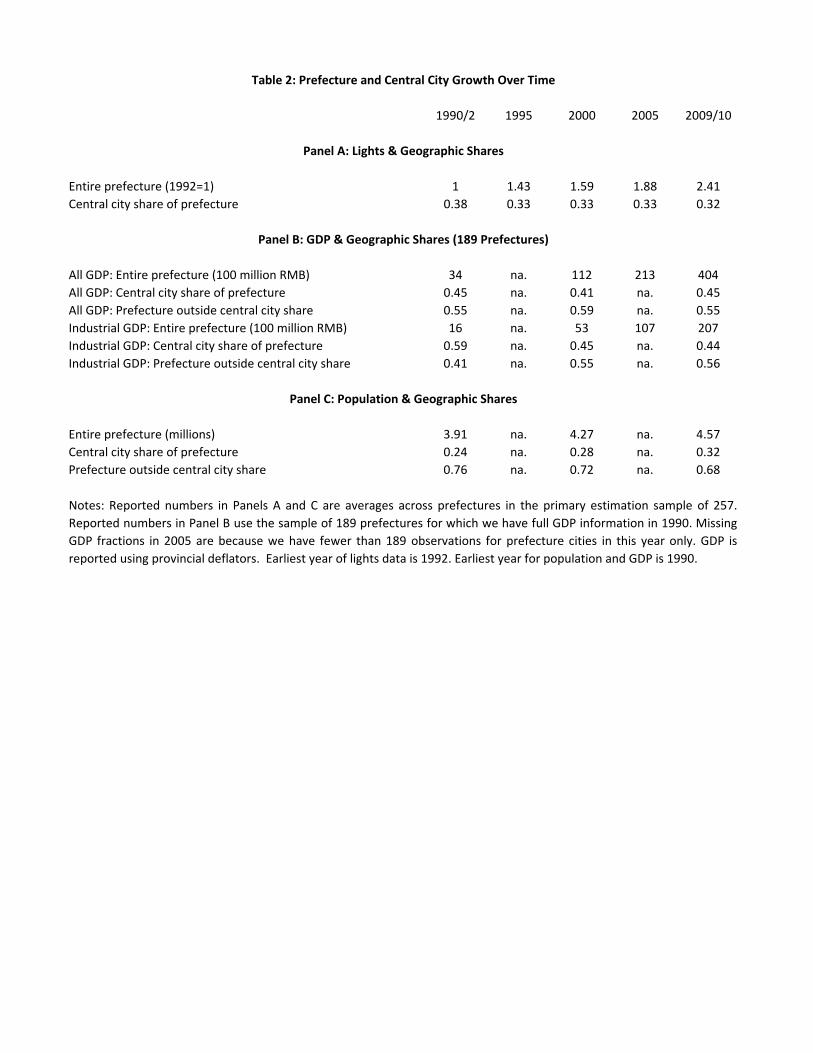
1990/2 1995 2000 2005 2009/10
Entire prefecture (1992=1) 1 1.43 1.59 1.88 2.41Central city share of prefecture 0.38 0.33 0.33 0.33 0.32
All GDP: Entire prefecture (100 million RMB) 34 na. 112 213 404All GDP: Central city share of prefecture 0.45 na. 0.41 na. 0.45All GDP: Prefecture outside central city share 0.55 na. 0.59 na. 0.55Industrial GDP: Entire prefecture (100 million RMB) 16 na. 53 107 207Industrial GDP: Central city share of prefecture 0.59 na. 0.45 na. 0.44Industrial GDP: Prefecture outside central city share 0.41 na. 0.55 na. 0.56
Entire prefecture (millions) 3.91 na. 4.27 na. 4.57Central city share of prefecture 0.24 na. 0.28 na. 0.32Prefecture outside central city share 0.76 na. 0.72 na. 0.68
Table 2: Prefecture and Central City Growth Over Time
Panel A: Lights & Geographic Shares
Panel B: GDP & Geographic Shares (189 Prefectures)
Panel C: Population & Geographic Shares
Notes: Reported numbers in Panels A and C are averages across prefectures in the primary estimation sample of 257.Reported numbers in Panel B use the sample of 189 prefectures for which we have full GDP information in 1990. MissingGDP fractions in 2005 are because we have fewer than 189 observations for prefecture cities in this year only. GDP isreported using provincial deflators. Earliest year of lights data is 1992. Earliest year for population and GDP is 1990.
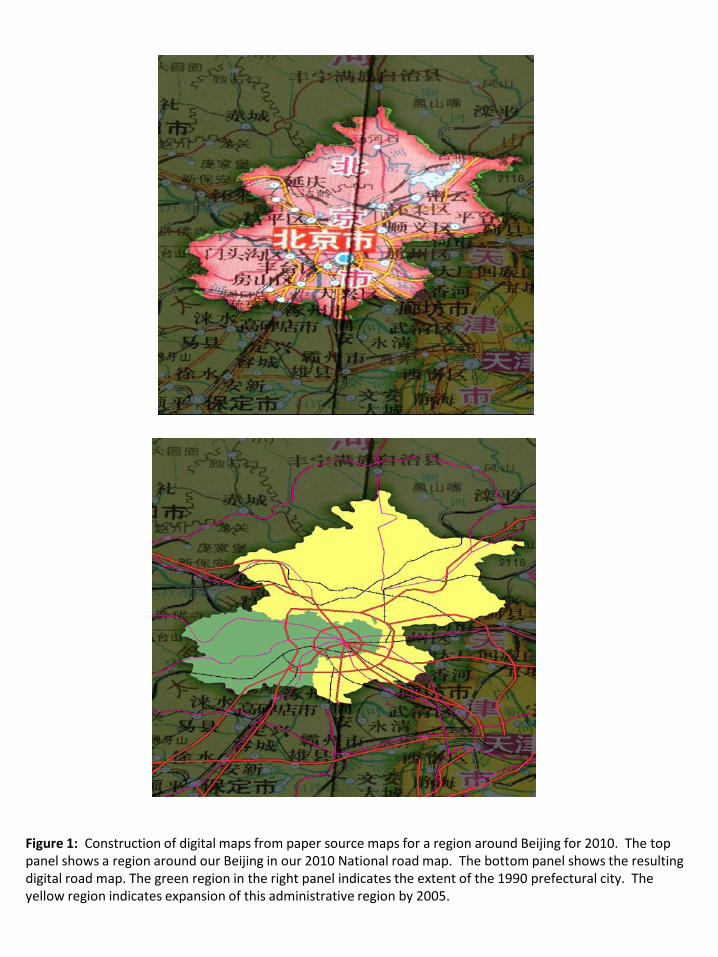
Figure 1: Construction of digital maps from paper source maps for a region around Beijing for 2010. The top panel shows a region around our Beijing in our 2010 National road map. The bottom panel shows the resulting digital road map. The green region in the right panel indicates the extent of the 1990 prefectural city. The yellow region indicates expansion of this administrative region by 2005.
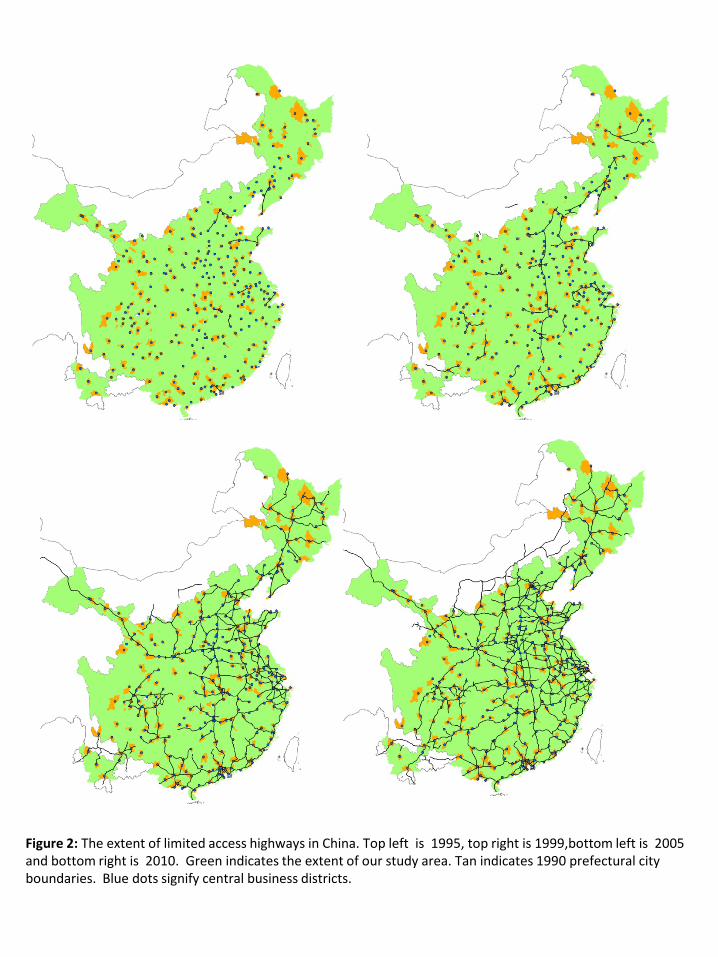
Figure 2: The extent of limited access highways in China. Top left is 1995, top right is 1999,bottom left is 2005 and bottom right is 2010. Green indicates the extent of our study area. Tan indicates 1990 prefectural city boundaries. Blue dots signify central business districts.
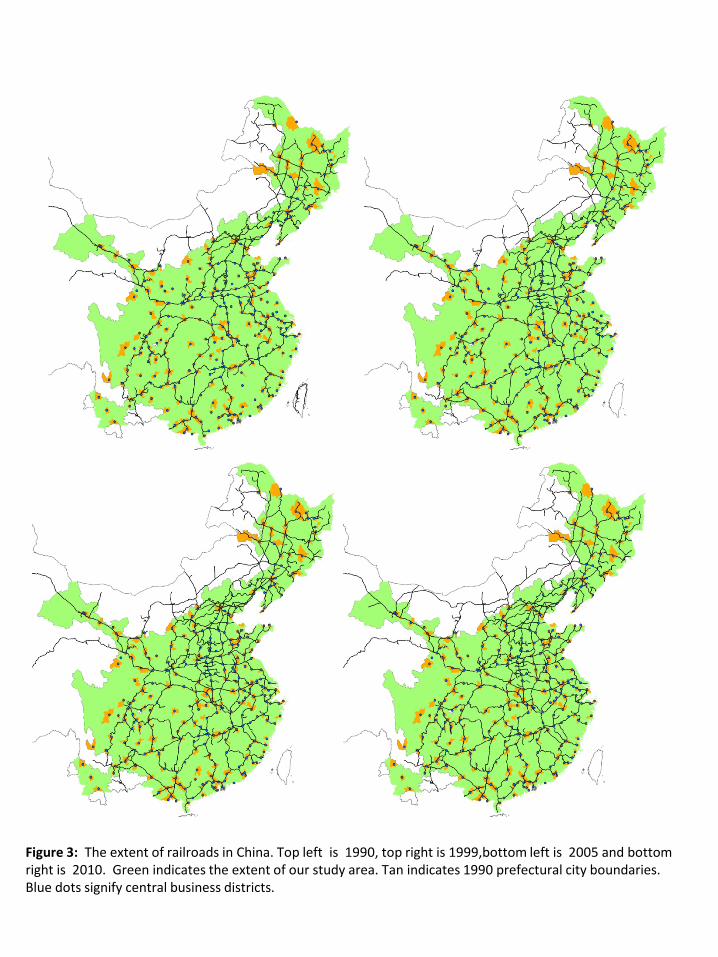
Figure 3: The extent of railroads in China. Top left is 1990, top right is 1999,bottom left is 2005 and bottom right is 2010. Green indicates the extent of our study area. Tan indicates 1990 prefectural city boundaries. Blue dots signify central business districts.
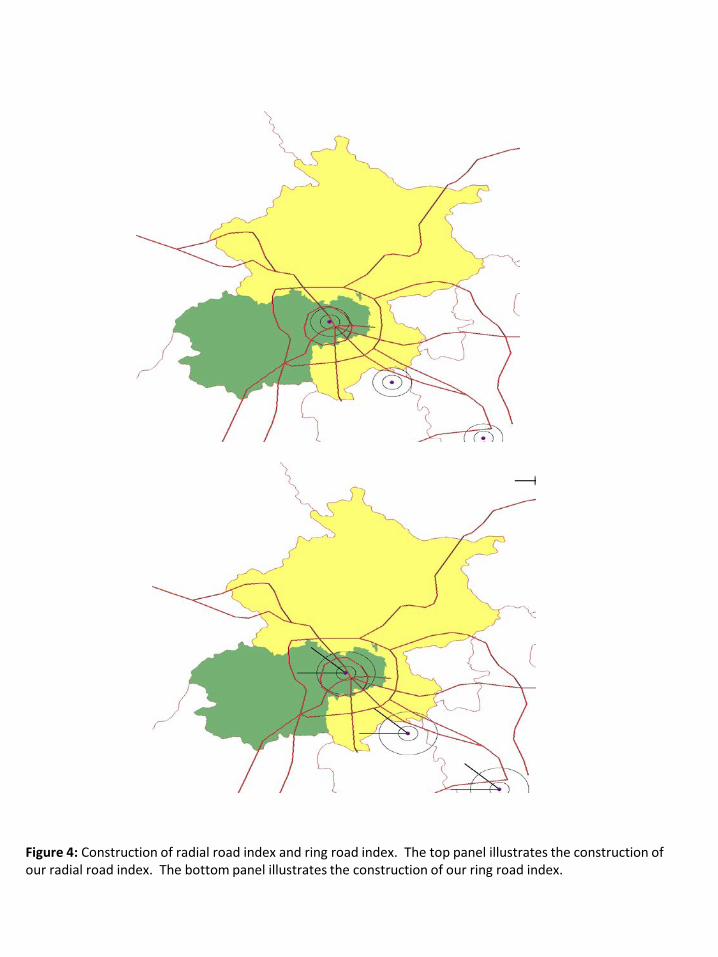
Figure 4: Construction of radial road index and ring road index. The top panel illustrates the construction of our radial road index. The bottom panel illustrates the construction of our ring road index.
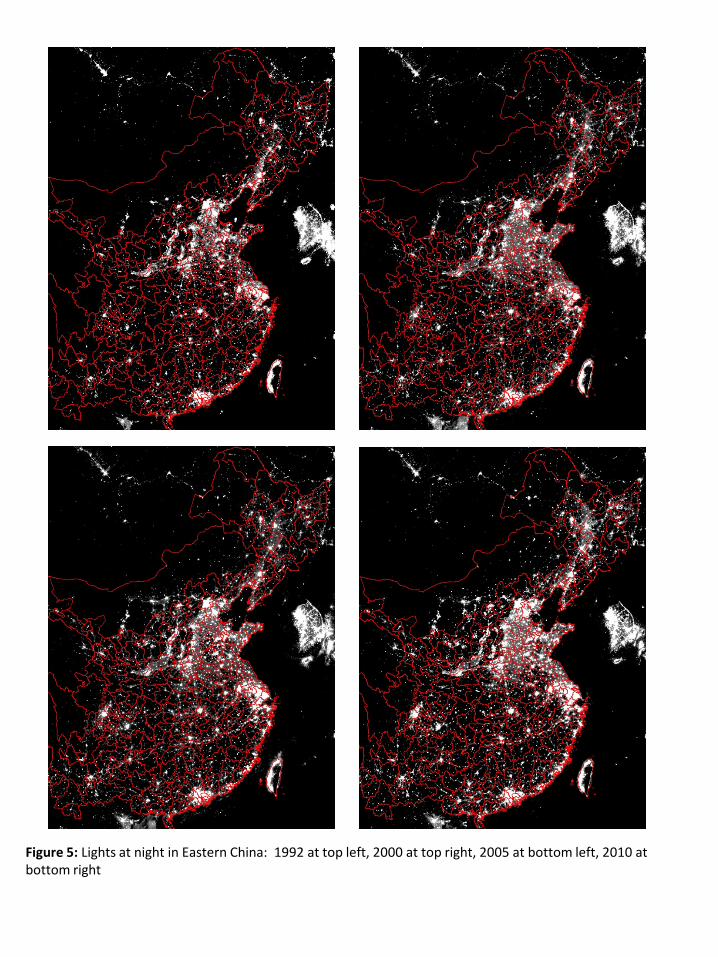
Figure 5: Lights at night in Eastern China: 1992 at top left, 2000 at top right, 2005 at bottom left, 2010 at bottom right
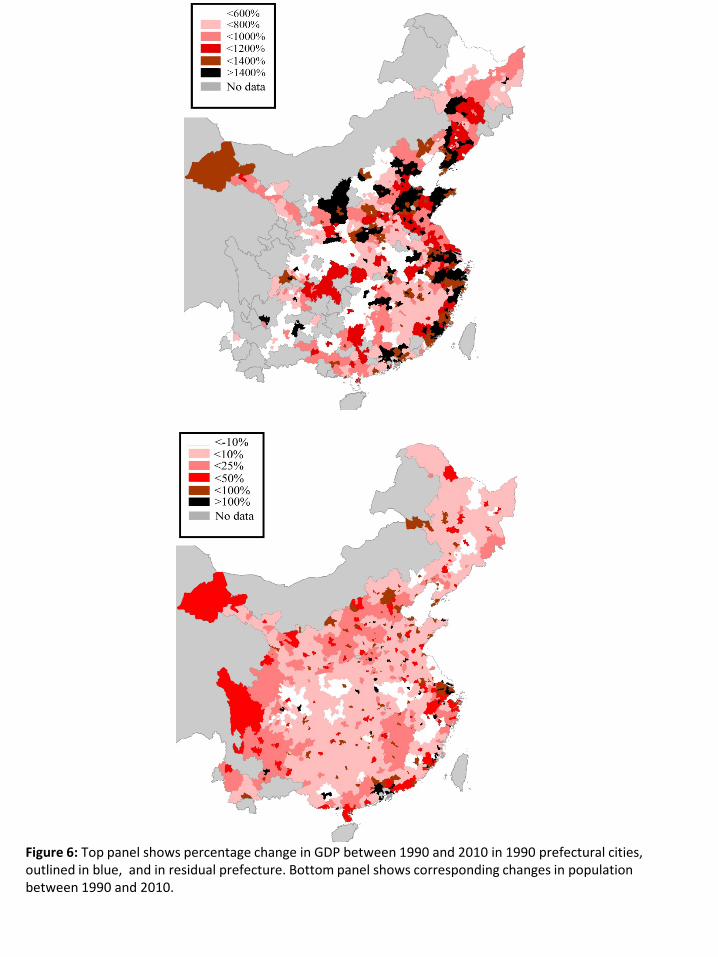
Figure 6: Top panel shows percentage change in GDP between 1990 and 2010 in 1990 prefectural cities, outlined in blue, and in residual prefecture. Bottom panel shows corresponding changes in population between 1990 and 2010.