Transportation in Canada 2020
109
Transportation in Canada STATISTICAL ADDENDUM 20 20
Transcript of Transportation in Canada 2020

Transportation in Canada
STATISTICAL ADDENDUM 2020

StatiStical addendum2020II

List of tabLes and figures
itranSportation in canada2020
Transportation and the Economy General Table EC1: Economic Indicators, 2020 1Table EC2: Transportation Sector GDP and GDP Shares by Province and Territory, 2017 2Table EC3: Aggregate Household Final Consumption Expenditures on Transportation, 2020 3Table EC4: Volume of Goods in Domestic Trade, by Sector and Mode of Transport, 2009–2018 4Merchandise Trade Table EC5: Modal Shares in Canada’s International Trade, 2011–2020 5Table EC6: Modal Shares in Canada-United States Trade, 2011–2020 6Table EC7: Modal Shares in Canada-Other Countries Trade, 2011–2020 7Table EC8: Canada–United States Trade, by Main Trade Flows, 2019–2020 8Table EC9: Canada’s Exports and Imports, by Origin, Destination and Mode of Transport, 2020 9Table EC10: Canada’s Merchandise Trade–Top 25 Partners, 2019–2020 10Travel and Tourism Table EC11: Visits by Canadians to All Countries, 2016–2017 11Table EC12: Canada - United States Travel, by Mode of Transport and by Purpose, 2017 12Table EC13: Canada - Overseas Travel, by Mode of Transport and by Purpose, 2017 12Labour Table EC14: Employment in the Transportation Sector, 2011–2020 13Figure EC15: Labour in Transportation Modes in Canada, by Age Range, 2020 14Table EC16: Average Weekly Earnings by Selected Transportation Industries, 2011–2020 15Table EC17: Labour Actions in the Transport Sector, by Mode, 2010–2019 16Price Performance of Transport Table EC18: Average Crude Oil Prices - Canadian and U.S. $ per Barrel, 2011–2020 16Table EC19: Retail Price of Regular Road Gasoline and Diesel For Selected Cities, 2011–2020 17Table EC20: Price of Other Transportation Fuels, 2011–2020 17Table EC21: Price and Output Indicators, Transport Industries, 2014–2019 18Table EC22: Efficiency Indicators, Transport Industries, 2014–2019 19Table EC23: Cost Structure of Transport Industries, 2016–2019 19Table EC24: Financial Performance of Transportation Industries, 2013–2019 20
Government Spending and Revenues on Transportation Table G1: Summary of Transportation Expenditures and Revenues by Level of Government, 2010/11–2019/20 21Table G2: Transportation Expenditures and Revenues by Mode and Level of Government, 2010/11–2019/20 22Table G3: Detailed Federal Transport Expenditures, by Mode and by Department/Agency, 2010/11–2019/20 23Table G4: Government Revenues from Transport Users, 2010/11–2019/20 31Table G5: Summary of Provincial Transport Expenditures by Province/Territory, 2010/11–2019/20 34Table G6: Detailed Provincial/Territorial Expenditures by Mode and by Province/Territory, 2010/11–2019/20 35
Environment and Energy Figure EN1: Greenhouse Gas Emissions, by Economic Sector, 2018 43Figure EN2: Greenhouse Gas Intensity of End-Use Sectors, 2009 and 2018 44Table EN3: Transportation Energy Consumption, by Type and Mode, 2010–2019 45Table EN4: Total Transportation Greenhouse Gas Emissions, All Modes, 2000–2018 46Table EN5: Air Pollutant Emissions from the Transportation Sector, by Type of Pollutant, 2010–2019 46Figure EN6: Transportation Mode Share of Air Pollutant Emissions, 2019 47Table EN7: Aviation Greenhouse Gas Emission Intensity, by Region of Operation, 2009–2018 47Table EN8: Aviation Fuel Consumption, by Region of Operation, 2009–2018 47Table EN9: National Aerial Surveillance Program Key Metrics, 2010/11–2019/20 48Table EN10: Rail Greenhouse Gas Emission Intensity, by Type of Operation, 2009–2018 48Table EN11: Railway Fuel Consumption, 2010–2019 48Figure EN12: Zero Emission Vehicle (ZEV) Market Share, 2016–2020 48

StatiStical addendum2020
liSt of tableS and figureS
ii
Transportation Safety and Security General Table S1: Summary of Transportation Safety Statistics for Aviation, Marine, Rail, Road and TDG, 2011–2020 49Figure S2: Accidents and Accident Rates per Activity Measure for Rail, Road, Marine and Aviation, 2010–2020 50Rail Occurences Table S3: Railways Under Federal Jurisdiction, Accidents and Incidents, 2011–2020 51Table S4: Railways Under Federal Jurisdiction, Accidents by Province/Territory, 2011–2020 52Table S5: Railways Under Federal Jurisdiction, Crossing and Trespasser Accidents, 2011–2020 53Road Occurences Table S6: Road Casualty Collisions, Fatalities and Injuries, with Rates (per 10,000 MVR and Billion Vehicle-Kilometres), 2010–2019 53Table S7: Road Casualty Rates (Fatalities and Injuries per Billion Vehicle-Kilometres) by Province/Territory, 2018–2019 54Table S8: Commercial and Other Vehicles Involved in Fatal Collisions, by Vehicle Type, 2014–2019 54Table S9: Fatalities Resulting from Commercial and Other Vehicles Involved in Fatal Collisions, by Vehicle Type, 2014–2019 55Table S10: Fatalities by Road User Class, 2014–2019 55Table S11: Vehicles Involved in Fatal Collisions, by Vehicle Type, 2014–2019 56Marine Occurences Table S12: Marine Occurrences, 2010–2020 57Table S13: Small Canadian Vessels Engaged in Commercial Activity–Marine Occurrences, 2010–2019 58Table S14: Small Canadian Vessels Engaged in Commercial Fishing Activity, Marine Occurrences, 2010–2020 59Air Occurences Table S15: Aviation Occurrences and Casualties Involving Aircraft Operating Under CARs, 2015–2020 60Table S16: Summary of Aviation Occurrences Reported to the Transportation Safety Board, 2015–2020 61Table S17: Canadian-Registered Aircraft (CRA) Accident Rates for Aircraft Operating Under CARs, 2015–2020 61Table S18: Accidents Involving Aircraft Operating under CARs, by Province/Territory, 2015–2020 62Dangerous Goods Occurences Table S19: Reportable Accidents Involving Dangerous Goods by Mode and Phase of Transport, 2010–2019 63Table S20: Deaths and Injuries Attributed to the Dangerous Goods at Reportable Accidents, 2010–2019 64
Air Transportation Airports Table A1: Number of Aerodromes in Canada 2011–2020 65Table A2: Airport Capital Assistance Program Expenditures, by Province/Territory 2011/12–2020/21 65Table A3: Airport Authorities Financial Performance, 2019 66Table A4: Airport Improvement Fees (AIF) at National Airport System (NAS) Airports 2011–2020 67Table A5: Air Travellers Security Charge (ATSC) 2002–2020 67Table A6: Top 10 Busiest Canadian Airports in Terms of Aircraft Movements 2011–2020 68Aircraft and Licences Table A7: Licence Authorities Held by Air Carriers as of December 31, 2020 69Table A8: Civil Aviation Personnel Licences and Permits by Category as of December, 2020 69Table A9: Personnel Licences and Permits, by Province/Territory, as of December, 2019–2020 69Table A10: Total Operating Revenues of Canadian Air Carriers, 2010–2019 70Table A11: Annual Labour Costs per Employee of Canadian Air Carriers, 2008–2019 70Table A12: Average Scheduled Daily Seat-Kilometres, by Air Carrier, Domestic Sector, 2019–2020 71Passenger Traffic Table A13: Competition in the Top, 25 Domestic Air Markets as of December 31, 2020 72Table A14: Top, 20 Busiest Canadian Airports in Terms of Enplaned/Deplaned Revenue Passengers, 2011–2020 73Table A15: Top 10 Busiest Canadian Airports in Terms of Enplaned/Deplaned Revenue Passengers, by Sector, 2011–2020 74Freight Traffic Table A16: Volume of Traffic Carried by Canadian Air Carriers, 2011–2020 75Table A17: Top 10 Busiest Canadian Airports in Terms of Loaded/Unloaded Revenue Cargo, by Sector, 2011–2020 76Table A18: Air Exports and Imports, by World Region, 2019–2020 77Table A19: Main Commodity Groups Shipped by Air in Canada’s International Trade, 2019–2020 78
Marine Transportation Ports Table M1: Port Classifications, as of December 31, 2020 79Table M2: Number of Port Sites Under the Control and Administration of Transport Canada, by Province, 2011–2020 79Table M3: Status of Transport Canada Port Facilities, 2020 80Financial Profiles Table M4: Canada Port Authorities (CPA) Financial Results, 2019 80Table M5: Canada Port Authorities (CPA) Financial Comparison, 2018–2019 81Table M6: Financial Results for Transport Canada Ports, 2011/12–2020/21 81Table M7: St. Lawrence Seaway Financial Performance, 2009/10–2018/19 82Table M8: Pilotage Authorities Financial Results, 2011–2020 82Fleet and Pilotage Table M9: Total Pilotage Assignments and Assignments Per Pilot, 2011–2020 83Table M10: Canadian-Registered Fleet, by Vessel Type, 2000, 2010, and 2020 83

tranSportation in canada2020
liSt of tableS and figureS
iii
Vessel Movements Table M11: Vessel Trips in Canadian Waters, by Vessel Type, 2016–2020 84Table M12: Vessel Trips in Canadian Waters, by Vessel Flag, 2016–2020 84Freight Traffic Table M13: Total Tonnage Handled by Canada’s Port Authorities (CPAs), 2011–2020 85Table M14: St. Lawrence Seaway Cargo Traffic, 2011–2020 85Table M15: St. Lawrence Seaway Traffic, by Commodity, 2011–2020 85Table M16: International Cruise Ship Traffic at Selected Canadian Ports, 2011–2020 85Table M17: Canada’s Marine Traffic Handled by Canada Port Authorities (CPAs), 2011–2020 86Table M18: Canada’s Leading Ports Handling Containerized Freight, 2011–2020 86Table M19: Main Commodities Shipped in Canada’s International Marine Trade, by Market, 2020 87Table M20: End-to-End Transit Times from Shanghai to Toronto via British Columbia Ports using a Direct Rail Model, 2011–2020 88Table M21: Key Performance Indicators for Selected Intermodal Container Ports, 2018–2020 88
Rail Transportation Railway Profile Table RA1: Length of Railways in Canada, 2019 89Table RA2: Railway Revenues, 2008–2019 89Table RA3: Railway Fleet, 2010–2019 90Figure RA4: Average Monthly Train Velocity, by Rail Carrier, 2020 91Table RA5: Revenue Tonne-Kilometres, by Railway Sector, 2010–2019 91Freight Traffic Table RA6: Overall Rail Traffic Characteristics, 2011–2020 92Table RA7: Traffic Received and Forwarded by Canadian-Based Class II Carriers, 2011–2020 92Table RA8: Volume of Rail Exports and Imports, by Commodity, 2011–2020 93Table RA9: Value of Rail Exports and Imports by Commodity, 2011–2020 94Table RA10: Dangerous Goods Shipments on Rail, 2010–2020 95Table RA11: Volume of Rail Exports and Imports, by Province/Territory of Origin, 2011–2020 96Table RA12: Value of Rail Exports by Port of Exit and Clearance, 2011–2020 96Table RA13: Volume of Rail Marine Exports and Imports, 2011–2020 97Table RA14: Volume of Rail Marine Exports and Imports, by Commodity, 2010–2019 97Table RA15: CN and CPR Intermodal Traffic, 2011–2020 98Passenger Traffic Table RA16: Passenger and Passenger-Kms for VIA Rail Canada and Other Carriers 2011–2020 98
Road Transportation Road Network Table RO1: Length of the National Highway System, 2017 99Table RO2: Length of the Public Road Network in Canada, 2019 99Truck - Profile and Activity Table RO3: Traffic Volume by Canadian For-Hire Carriers, 2014–2018 100Table RO4: Canadian International Trade Value Shipped by Trucks, by Commodity Groups, 2019–2020 100Table RO5: Canada’s Road Trade with the United States, by Busiest Border Crossing Points, 2019–2020 101Table RO6: Twenty Busiest Border Crossings for Cars/Other Vehicles, 2016–2020 101Table RO7: Twenty Busiest Border Crossings for Trucks, 2016–2020 102Table RO8: Border Wait Times for Southbound Trucks at Selected Crossings, 2020 102Table RO9: Annual Trucking Bankruptcies, by Region, 2011–2020 103Bus and Urban Transit - Profile and Activity Table RO10: Bus Industry Revenues by Service Lines, 2009–2018 103Table RO11: Urban Transit Passengers Carried and Vehicle-Kilometres, 2010–2019 104Table RO12: Urban Transit Fleet Composition, 2010–2019 104Table RO13: Average Annual Compensation in the Bus Industry, 2009–2018 104Table RO14: Selected Provincial Systems Indicators For Urban Transit, 2019 104

StatiStical addendum20201
transportation and the economy
Table EC1: Economic Indicators, 2020
2020 (level)
2019 to 2020(percentage
change)2015 to 2019
(CAGR)2020 Share of total GDP (percentage)
GDP at Basic Prices (millions of constant 2012 dollars)1
All industries 1,885,999 (5.2) 2.3 100.0Goods-Producing Industries 553,420 (6.0) 1.9 29.3Manufacturing 180,411 (9.3) 1.3 9.6Mining, quarrying, and oil and gas extraction 146,942 (8.5) 3.8 7.8Construction 137,899 (3.4) 0.2 7.3Agriculture, forestry, fishing and hunting 45,982 5.3 3.9 2.4
Service-Producing Industries 1,332,579 (4.9) 2.4 70.7Real estate and rental and leasing 256,458 1.5 2.5 13.6Wholesale Trade 100,554 (2.1) 2.1 5.3Retail trade 97,328 (2.4) 2.2 5.2Transportation (core) 58,011 (23.8) 3.0 3.1
Air transportation 2,555 (74.1) 6.6 0.1Rail transportation 7,952 (7.1) 2.1 0.4Water transportation 1,919 0.5 2.1 0.1Truck transportation 20,471 (10.9) 3.4 1.1Urban transit systems 2,421 (56.6) 0.1 0.1Taxi and limousine services 782 (36.5) 7.3 0.0Other ground and sightseeing 1,546 (28.0) 0.4 0.1Support activities for transportation 13,351 (22.8) 3.5 0.7Postal service and couriers and messengers 7,014 6.4 0.5 0.4
Pipelines 10,062 (4.4) 3.9 0.5Warehousing and storage 4,103 4.3 10.1 0.2Transportation and warehousing (NAICS) 72,176 (20.4) 3.4 3.8
GDP at Basic Prices (millions of chained 2012 dollars)1All industries 1,875,796 (5.3) 2.1
Goods-producing sector 543,357 (6.2) 1.4Service-producing sector 1,329,780 (4.9) 2.4
Transportation and Warehousing (NAICS) 71,979 (19.8) 3.2Air transportation 2,592 (73.7) 6.5Rail transportation 7,894 (7.1) 1.9Water transportation 1,760 (2.9) 1.3Truck transportation 20,450 (10.5) 3.3
Real GDP (millions of 2012 chained dollars)2 1,988,721 (5.4) 2.1
Merchandise Trade (Customs basis, millions of current dollars)3
Exports 522,527 (11.8) (0.1)Imports 541,999 (9.9) 0.3
Services Trade (Balance of Payments basis, millions of current dollars)4
Transportation servicesReceipts (exports) 13,630 (26.6) 4.5Payments (imports) 23,347 (28.0) 5.3
Travel servicesReceipts (exports) 15,099 (59.4) 9.3Payments (imports) 16,219 (65.8) 2.4
Tourism Indicators (Thousands of persons)5
Canadian residents returning from abroad 14,605 (74.0) 0.1U.S. visitors to Canada 3,991 (84.0) 3.1Non-U.S. visitors to Canada 1,078 (85.6) 8.0
Canadian Dollar, Foreign Exchange (CDN cents per US$)6 134.2 1.1 0.9
Population (Thousands)7 38,005 1.1 1.3
Employment (Thousands)8 17,999 (5.2) 1.6

tranSportation in canada2020 2
tranSportation and the economy
Household Income and Consumption (current dollars)Household disposable income per capita9 36,825 8.8 1.7Household final consumption per capita (total)10 32,394 (6.3) 2.4Household final consumption per capita (transportation)10 4,334 (20.2) 3.0
Price indicesGDP implicit deflator (2012=100)2 1.1 0.8 1.7Terms of trade (2012 = 100)11 85.8 (3.7) (0.1)Consumer Price Index (2002=100)12
All-items 137.0 0.7 1.8Transportation 141.2 (0.2) 2.9
Notes: CAGR= Compound Annual Growth Rate. GDP= Gross Domestic Product. NAICS= North American Industry Classification System. BOP= Balance of Payments.
Sources:1 Statistics Canada, Table 36-10-0434-012 Statistics Canada, Table 36-10-0104-013 Transport Canada, adapted from Statistics Canada, International Trade Database4 Statistics Canada, Table 12-10-0134-015 Statistics Canada, Table 24-10-0041-016 Bank of Canada Annual Exchange Rates7 Statistics Canada, Table 17-10-0009-018 Statistics Canada, Table 14-10-0327-019 Derived from Statistics Canada, Tables 36-10-0112-01 and 17-10-0009-0110 Derived from Statistics Canada, Tables 36-10-0124-01 and 17-10-0009-01. Includes transport insurance. 11 Statistics Canada, Table 12-10-0128-01. Calculated based on merchandise trade, customs, unadjusted, Laspeyres basis.12 Statistics Canada, Table 18-10-0004-01
Table EC2: Transportation Sector GDP and GDP Shares by Province and Territory, 2017Transport Sector1 GDP
(millions of current dollars) Share of National Total Transport Share of Overall
Prov./Terr. GDPNewfoundland and Labrador 986.1 1.2 3.2Prince Edward Island 216.7 0.3 3.5Nova Scotia 1,290.7 1.6 3.3New Brunswick 1,551.3 1.9 4.8Quebec 16,628.0 20.8 4.3Ontario 28,562.3 35.8 3.7Manitoba 3,210.8 4.0 4.9Saskatchewan 2,124.8 2.7 2.8Alberta 11,014.3 13.8 3.5British Columbia 13,814.0 17.3 5.3Yukon 89.4 0.1 3.2Northwest Territories 242.9 0.3 5.4Nunavut 69.0 0.1 2.3Total 79,800.3 100.0
Notes: GDP= Gross Domestic Product. Current dollar estimates. 1. Transport Sector, excluding both Pipelines & Warehousing and Storage
Source: Statistics Canada, Table 36-10-0402-01

StatiStical addendum2020
tranSporation and the economy
3
Table EC3: Aggregate Household Final Consumption Expenditures on Transportation, 2020
2020 (millions of current dollars)
Per cent share of transportation
expensesPer cent change
(2019 to 2020)CAGR
(2015 to 2019)New and Used Transportation Equipment
New passenger cars 11,064 6.7 (26.8) (5.7)New trucks, vans and sport utility vehicles 44,935 27.3 (4.9) 7.5 Used motor vehicles 17,056 10.4 (11.0) 7.5 Other vehicles 4,110 2.5 19.4 3.7 Subtotal 77,165 46.8 (9.2) 4.3
Fuels and lubricants 33,103 20.1 (26.8) 3.4
Repair and Maintenance (including parts)Spare parts and accessories for vehicles 18,464 11.2 (4.4) 6.1 Maintenance and repair of vehicles 10,919 6.6 (7.7) 4.5 Subtotal 29,383 17.8 (5.6) 5.4
Other Motor Vehicle Related Services Passenger vehicle renting 936 0.6 (32.0) 3.9 Insurance related to transport 7,900 4.8 4.0 1.4 Parking 2,765 1.7 (20.2) 4.7 Other services related to the operation of transport equipment 2,157 1.3 (21.8) 4.0 Subtotal 13,758 8.4 (9.4) 2.8
Commercial TransportationUrban transit 2,347 1.4 (52.4) 3.6 Railway transport 90 0.1 (74.0) 8.5 Interurban bus 344 0.2 (66.3) (4.7)Air transport 4,550 2.8 (72.1) 7.0 Water transport 332 0.2 (34.0) 3.5 Taxi and limousine 1,246 0.8 (14.5) 4.8 Other transport services 2,405 1.5 (23.0) 3.7 Subtotal 11,314 6.9 (59.2) 5.3
Transport (including insurance) 164,723 100.0 (19.3) 4.3
Note: CAGR= Compound Annual Growth Rate.
Source: Statistics Canada, Table 36-10-0124-01

tranSportation in canada2020
tranSportation and the economy
4
Table EC4: Volume of Goods in Domestic Trade, by Sector and Mode of Transport, 2009–2018
(Millions of tonnes)
Intraprovincial Movements
Mode of Transport Modal Share in Per CentYear For-Hire Trucking Rail Marine Air Total For-Hire Trucking Rail Marine Air2009 383.8 40.8 36.1 N/A 460.8 83.3 8.9 7.8 N/A2010 425.7 49.5 38.2 N/A 513.3 82.9 9.6 7.4 N/A2011 447.8 52.6 40.7 N/A 541.1 82.8 9.7 7.5 N/A2012 494.4 56.3 N/A N/A 550.8 89.8 10.2 N/A N/A2013 518.3 56.6 N/A N/A 574.9 90.2 9.8 N/A N/A2014 550.2 53.5 N/A N/A 603.7 91.1 8.9 N/A N/A2015 545.3 53.0 N/A N/A 598.3 91.1 8.9 N/A N/A2016 579.0 49.8 N/A N/A 628.8 92.1 7.9 N/A N/A2017 569.7 52.7 N/A N/A 622.4 91.5 8.5 N/A N/A2018P 574.8 52.2 N/A N/A 627.0 91.7 8.3 N/A N/A
Interprovincial Movements
Mode of Transport Modal Share in Per CentFor-Hire Trucking Rail Marine Air Total For-Hire Trucking Rail Marine Air
2009 66.9 115.5 18.0 N/A 200.4 33.4 57.7 9.0 N/A2010 69.4 121.5 20.1 N/A 211.1 32.9 57.6 9.5 N/A2011 72.4 125.0 21.5 N/A 218.9 33.1 57.1 9.8 N/A2012 78.5 126.1 N/A N/A 204.6 38.4 61.6 N/A N/A2013 74.6 120.4 N/A N/A 195.0 38.3 61.7 N/A N/A2014 78.0 128.4 N/A N/A 206.4 37.8 62.2 N/A N/A2015 81.9 132.4 N/A N/A 214.3 38.2 61.8 N/A N/A2016 74.0 130.7 N/A N/A 204.7 36.2 63.8 N/A N/A2017 84.4 133.6 N/A N/A 218.0 38.7 61.3 N/A N/A2018P 84.5 136.3 N/A N/A 220.8 38.3 61.7 N/A N/A
Total Domestic Movements
Mode of Transport Modal Share in Per CentFor-Hire Trucking Rail Marine Air Total For-Hire Trucking Rail Marine Air
2009 450.7 156.3 54.1 0.5 661.6 68.1 23.6 8.2 0.12010 495.1 170.9 58.3 0.6 724.9 68.3 23.6 8.0 0.12011 520.2 177.6 62.2 0.5 760.5 68.4 23.4 8.2 0.12012 572.9 182.4 N/A 0.5 755.8 75.8 24.1 N/A 0.12013 592.9 177.0 N/A 0.5 770.4 77.0 23.0 N/A 0.12014 628.3 181.9 N/A 0.5 810.7 77.5 22.4 N/A 0.12015 627.2 185.4 N/A 0.5 813.1 77.1 22.8 N/A 0.12016 653.0 180.5 N/A 0.5 834.0 78.3 21.6 N/A 0.12017 654.2 186.3 N/A 0.6 841.0 77.8 22.1 N/A 0.12018P 659.3 188.5 N/A 0.6 848.4 77.7 22.2 N/A 0.1
Notes: P= Preliminary data. N/A= Not available.
Source: Transport Canada, adapted from Statistic Canada, various publications on transportation

StatiStical addendum2020
tranSporation and the economy
5
Table EC5: Modal Shares in Canada’s International Trade, 2011–2020
Canadian Exports
(Millions of dollars)
---------------------------------- Total Exports1 ---------------------------------------- ------------------------- Share of Total (%) --------------------All Modes Road Rail Marine Air Other Road Rail Marine Air Other
2011 446,707 152,464 67,483 99,368 47,511 79,881 34.1 15.1 22.2 10.6 17.92012 455,171 157,384 73,115 98,063 46,880 79,729 34.6 16.1 21.5 10.3 17.52013 471,947 161,872 77,142 94,971 49,558 88,404 34.3 16.3 20.1 10.5 18.72014 526,773 184,666 80,376 98,602 55,003 108,127 35.1 15.3 18.7 10.4 20.52015 524,066 211,852 83,640 93,337 59,075 76,163 40.4 16.0 17.8 11.3 14.52016 516,772 223,559 81,841 89,314 58,811 63,248 43.3 15.8 17.3 11.4 12.22017 546,087 219,943 84,270 101,564 60,101 80,208 40.3 15.4 18.6 11.0 14.72018R 584,295 226,028 92,147 113,350 63,313 89,457 38.7 15.8 19.4 10.8 15.32019R 592,646 233,414 87,820 109,828 69,563 92,020 39.4 14.8 18.5 11.7 15.52020P 522,527 213,785 73,343 102,675 65,233 67,492 40.9 14.0 19.6 12.5 12.9
Canadian Imports
(Millions of dollars)
---------------------------------- Total imports2 ---------------------------------------- ------------------------ Share of Total (%) --------------------All Modes Road Rail Marine Air Other Road Rail Marine Air Other
2011 446,666 228,037 34,192 106,040 62,694 15,702 51.1 7.7 23.7 14.0 3.52012 462,072 239,868 39,436 106,551 61,623 14,594 51.9 8.5 23.1 13.3 3.22013 475,661 250,929 40,494 106,216 61,956 16,065 52.8 8.5 22.3 13.0 3.42014 512,200 275,976 45,821 111,848 61,980 16,575 53.9 8.9 21.8 12.1 3.22015 536,152 298,872 43,830 111,940 69,321 12,187 55.7 8.2 20.9 12.9 2.32016 533,251 295,386 46,436 107,203 66,935 17,291 55.4 8.7 20.1 12.6 3.22017 562,029 306,079 51,881 116,624 70,571 16,874 54.5 9.2 20.8 12.6 3.02018R 595,886 313,663 51,285 138,195 75,645 17,097 52.6 8.6 23.2 12.7 2.92019R 601,685 316,375 52,789 137,496 79,852 15,174 52.6 8.8 22.9 13.3 2.52020P 541,999 288,423 41,703 121,996 79,254 10,623 53.2 7.7 22.5 14.6 2.0
Total Canadian Trade
(Millions of dollars)
---------------------------------- Total exports and imports -------------------------- ----------------------- Share of Total (%) ---------------------All Modes Road Rail Marine Air Other Road Rail Marine Air Other
2011 893,373 380,501 101,675 205,408 110,206 95,583 42.6 11.4 23.0 12.3 10.72012 917,243 397,252 112,551 204,614 108,503 94,322 43.3 12.3 22.3 11.8 10.32013 947,608 412,801 117,636 201,187 111,514 104,470 43.6 12.4 21.2 11.8 11.02014 1,038,973 460,642 126,196 210,450 116,983 124,701 44.3 12.1 20.3 11.3 12.02015 1,060,218 510,724 127,470 205,277 128,396 88,350 48.2 12.0 19.4 12.1 8.32016 1,050,023 518,944 128,276 196,517 125,746 80,539 49.4 12.2 18.7 12.0 7.72017 1,108,116 526,023 136,151 218,188 130,672 97,081 47.5 12.3 19.7 11.8 8.82018R 1,180,180 539,691 143,433 251,545 138,957 106,554 45.7 12.2 21.3 11.8 9.02019R 1,194,331 549,790 140,609 247,324 149,415 107,194 46.0 11.8 20.7 12.5 9.02020P 1,064,526 502,208 115,046 224,671 144,487 78,114 47.2 10.8 21.1 13.6 7.3
Notes: R= Revised data. P= Preliminary data.1 For exports, the mode of transport represents the mode of transport by which the international boundary is crossed. This may be different from the mode of transport within
Canada. Total exports are the sum of domestic exports and re-exports.2 For imports, the mode of transport represents the last mode of transport by which the cargo was transported to the port of clearance in Canada and is derived from the cargo
control documents of customs. This may not be the mode of transport by which the cargo arrived at the Canadian port of entry in the case of inland clearance. This may, therefore, lead to some underestimation of Canadian imports by the marine and air transport modes.
Source: Transport Canada, adapted from Statistics Canada, International Trade Database

tranSportation in canada2020
tranSportation and the economy
6
Table EC6: Modal Shares in Canada-United States Trade, 2011–2020
Canadian Exports to the U.S.
(Millions of dollars)
------------------------------------ Total exports1 ----------------------------------------- ------------------- Share of Total (%) --------------------All Modes Road Rail Marine Air Other Road Rail Marine Air Other
2011 328,975 148,051 65,646 23,561 12,236 79,482 45.0 20.0 7.2 3.7 24.22012 339,183 152,728 71,163 23,410 13,028 78,854 45.0 21.0 6.9 3.8 23.22013 357,915 157,099 75,015 23,575 14,464 87,761 43.9 21.0 6.6 4.0 24.52014 404,711 179,605 78,288 22,516 16,892 107,410 44.4 19.3 5.6 4.2 26.52015 402,171 206,382 81,181 19,174 19,824 75,610 51.3 20.2 4.8 4.9 18.82016 394,183 217,654 79,218 15,192 19,004 63,116 55.2 20.1 3.9 4.8 16.02017 414,184 214,457 81,613 19,405 18,562 80,147 51.8 19.7 4.7 4.5 19.42018R 437,848 219,690 89,441 20,239 19,074 89,403 50.2 20.4 4.6 4.4 20.42019R 446,604 225,798 85,604 22,130 21,094 91,979 50.6 19.2 5.0 4.7 20.62020P 383,795 207,967 71,626 14,916 21,833 67,453 54.2 18.7 3.9 5.7 17.6
Canadian Imports from the U.S.
(Millions of dollars)
------------------------------------- Total imports2 ---------------------------------------- ----------------- Share of Total (%) ---------------------All Modes Road Rail Marine Air Other Road Rail Marine Air Other
2011 221,424 162,313 27,530 8,276 15,222 8,083 73.3 12.4 3.7 6.9 3.72012 233,889 172,139 31,063 8,118 14,947 7,622 73.6 13.3 3.5 6.4 3.32013 247,796 177,872 32,910 13,100 15,064 8,850 71.8 13.3 5.3 6.1 3.62014 278,510 191,932 36,342 19,936 17,307 12,993 68.9 13.0 7.2 6.2 4.72015 285,345 204,636 33,794 16,106 20,769 10,039 71.7 11.8 5.6 7.3 3.52016 278,206 199,903 37,326 8,751 19,324 12,902 71.9 13.4 3.1 6.9 4.62017 288,857 203,129 40,752 10,131 19,197 15,648 70.3 14.1 3.5 6.6 5.42018R 304,591 208,543 40,696 17,875 21,552 15,925 68.5 13.4 5.9 7.1 5.22019R 305,191 208,297 41,888 18,776 21,750 14,480 68.3 13.7 6.2 7.1 4.72020P 264,121 188,802 33,786 11,651 19,796 10,086 71.5 12.8 4.4 7.5 3.8
Total Canada-U.S. Trade
(Millions of dollars)
------------------------------ Total exports and imports ---------------------------------- -------------------- Share of Total (%) -------------------All Modes Road Rail Marine Air Other Road Rail Marine Air Other
2011 550,400 310,364 93,176 31,837 27,458 87,565 56.4 16.9 5.8 5.0 15.92012 573,072 324,867 102,227 31,528 27,975 86,476 56.7 17.8 5.5 4.9 15.12013 605,711 334,971 107,925 36,675 29,529 96,611 55.3 17.8 6.1 4.9 16.02014 683,220 371,537 114,630 42,452 34,199 120,403 54.4 16.8 6.2 5.0 17.62015 687,516 411,018 114,975 35,280 40,593 85,649 59.8 16.7 5.1 5.9 12.52016 672,390 417,557 116,544 23,943 38,328 76,018 62.1 17.3 3.6 5.7 11.32017 703,041 417,586 122,365 29,536 37,759 95,795 59.4 17.4 4.2 5.4 13.62018R 742,439 428,234 130,137 38,113 40,626 105,328 57.7 17.5 5.1 5.5 14.22019R 751,795 434,095 127,492 40,906 42,843 106,458 57.7 17.0 5.4 5.7 14.22020P 647,916 396,770 105,412 26,568 41,629 77,538 61.2 16.3 4.1 6.4 12.0
Notes: R= Revised data. P= Preliminary data.1 For exports, the mode of transport represents the mode of transport by which the international boundary is crossed. This may be different from the mode of transport within
Canada. Total exports are the sum of domestic exports and re-exports.2 For imports, the mode of transport represents the last mode of transport by which the cargo was transported to the port of clearance in Canada and is derived from the cargo
control documents of customs. This may not be the mode of transport by which the cargo arrived at the Canadian port of entry in the case of inland clearance. This may, therefore, lead to some underestimation of Canadian imports by the marine and air transport modes.
Source: Transport Canada, adapted from Statistics Canada, International Trade Database

StatiStical addendum2020
tranSporation and the economy
7
Table EC7: Modal Shares in Canada-Other Countries Trade, 2011–2020
Canadian Exports to Other Countries (excluding the U.S.)
(Millions of dollars)
---------------------------------- Total exports1 ----------------------------------------- ---------------------- Share of Total (%) ---------------------All Modes Road Rail Marine Air Other Road Rail Marine Air Other
2011 117,731 4,413 1,837 75,807 35,276 398 3.7 1.6 64.4 30.0 0.32012 115,988 4,656 1,952 74,654 33,852 875 4.0 1.7 64.4 29.2 0.82013 114,032 4,773 2,126 71,396 35,094 643 4.2 1.9 62.6 30.8 0.62014 122,062 5,061 2,088 76,085 38,111 717 4.1 1.7 62.3 31.2 0.62015 121,895 5,470 2,459 74,163 39,251 553 4.5 2.0 60.8 32.2 0.52016 122,588 5,905 2,623 74,122 39,807 133 4.8 2.1 60.5 32.5 0.12017 131,902 5,486 2,657 82,159 41,539 61 4.2 2.0 62.3 31.5 0.02018R 146,447 6,338 2,706 93,111 44,238 53 4.3 1.8 63.6 30.2 0.02019R 146,042 7,617 2,216 87,698 48,470 41 5.2 1.5 60.0 33.2 0.02020P 138,732 5,817 1,717 87,758 43,401 39 4.2 1.2 63.3 31.3 0.0
Canadian Imports from Other Countries (excluding the U.S.)
(Millions of dollars)
------------------------------------ Total imports2 ---------------------------------------- ---------------------- Share of Total (%) --------------------All Modes Road Rail Marine Air Other Road Rail Marine Air Other
2011 225,242 65,724 6,662 97,764 47,472 7,619 29.2 3.0 43.4 21.1 3.42012 228,183 67,729 8,373 98,433 46,677 6,972 29.7 3.7 43.1 20.5 3.12013 227,865 73,057 7,585 93,116 46,892 7,215 32.1 3.3 40.9 20.6 3.22014 233,690 84,044 9,479 91,913 44,673 3,582 36.0 4.1 39.3 19.1 1.52015 250,807 94,236 10,037 95,834 48,552 2,148 37.6 4.0 38.2 19.4 0.92016 255,045 95,483 9,110 98,453 47,611 4,389 37.4 3.6 38.6 18.7 1.72017 273,172 102,950 11,130 106,493 51,373 1,226 37.7 4.1 39.0 18.8 0.42018R 291,294 105,120 10,589 120,321 54,093 1,172 36.1 3.6 41.3 18.6 0.42019R 296,494 108,078 10,901 118,719 58,102 694 36.5 3.7 40.0 19.6 0.22020P 277,878 99,621 7,917 110,345 59,458 537 35.9 2.8 39.7 21.4 0.2
Total Canada-Other Countries Trade
(Millions of dollars)
----------------------------- Total exports and imports ----------------------------------- ----------------------- Share of Total (%) ---------------------All Modes Road Rail Marine Air Other Road Rail Marine Air Other
2011 342,973 70,137 8,499 173,571 82,748 8,017 20.4 2.5 50.6 24.1 2.32012 344,171 72,385 10,324 173,086 80,529 7,847 21.0 3.0 50.3 23.4 2.32013 341,897 77,830 9,711 164,512 81,985 7,858 22.8 2.8 48.1 24.0 2.32014 355,752 89,105 11,566 167,998 82,784 4,299 25.0 3.3 47.2 23.3 1.22015 372,702 99,706 12,495 169,997 87,803 2,701 26.8 3.4 45.6 23.6 0.72016 377,633 101,388 11,732 172,574 87,418 4,522 26.8 3.1 45.7 23.1 1.22017 405,074 108,436 13,786 188,652 92,913 1,287 26.8 3.4 46.6 22.9 0.32018R 437,742 111,457 13,295 213,432 98,331 1,226 25.5 3.0 48.8 22.5 0.32019R 442,536 115,695 13,117 206,417 106,572 735 26.1 3.0 46.6 24.1 0.22020P 416,611 105,438 9,634 198,103 102,858 576 25.3 2.3 47.6 24.7 0.1
Notes: R= Revised data. P= Preliminary data.1 For exports, the mode of transport represents the mode of transport by which the international boundary is crossed. This may be different from the mode of transport within
Canada. Total exports are the sum of domestic exports and re-exports.2 For imports, the mode of transport represents the last mode of transport by which the cargo was transported to the port of clearance in Canada and is derived from the cargo
control documents of customs. This may not be the mode of transport by which the cargo arrived at the Canadian port of entry in the case of inland clearance. This may, therefore, lead to some underestimation of Canadian imports by the marine and air transport modes.
Source: Transport Canada, adapted from Statistics Canada, International Trade Database

tranSportation in canada2020
tranSportation and the economy
8
Table EC8: Canada–United States Trade, by Main Trade Flows, 2019–2020
(Millions of dollars)
Exports Imports Total Total Percentage Share of Main Modes Usedfrom to Trade Trade Change Total (%) (Per cent of total value)
Canadian Region U.S. Region1 Canada Canada 2020P 2019R 2020/19 2020 2020P
Ontario Central 75,065 79,132 154,197 186,400 (17.3) 23.8 Road (78), Rail (17)Ontario South 32,993 48,402 81,395 89,871 (9.4) 12.6 Road (74), Rail (15)Ontario North-East 32,422 31,815 64,237 64,788 (0.9) 9.9 Road (87), Air (9)Ontario West 38,261 15,861 54,122 54,684 (1.0) 8.4 Road (51), Rail (36)Alberta Central 39,774 5,809 45,583 61,290 (25.6) 7.0 Pipeline (82), Rail (11)Quebec North-East 21,690 8,243 29,932 35,067 (14.6) 4.6 Road (73), Air (13)Quebec South 18,532 9,397 27,929 34,357 (18.7) 4.3 Road (55), Rail (16)Manitoba and Saskatchewan Central 11,861 14,033 25,894 28,581 (9.4) 4.0 Road (61), Rail (20)British Columbia West 12,694 11,569 24,263 24,652 (1.6) 3.7 Road (71), Pipeline (14)Alberta West 18,436 3,616 22,051 27,713 (20.4) 3.4 Pipeline (44), Road (31)Alberta South 15,239 3,548 18,787 25,973 (27.7) 2.9 Rail (40), Pipeline (37)Quebec Central 13,810 3,948 17,758 20,638 (14.0) 2.7 Road (66), Rail (15)Atlantic provinces North-East 11,793 1,639 13,432 18,731 (28.3) 2.1 Marine (51), Road (38)Manitoba and Saskatchewan South 6,091 6,796 12,887 15,054 (14.4) 2.0 Road (61), Rail (23)Subtotal 348,660 243,807 592,467 687,801 (13.9) 91.4 Other 35,135 20,314 55,449 63,994 (13.4) 8.6 Total Canada/U.S. 383,795 264,121 647,916 751,795 (13.8) 100.0 Road (61), Rail (16)
Notes: R= Revised data. P= Preliminary data.1 U.S. Central region includes states of Michigan, Ohio, Indiana, Illinois, Wisconsin, Minnesota, Iowa, Missouri, North Dakota, South Dakota, Nebraska and Kansas. U.S. North-East region includes New England states and states of New York, Pennsylvania and New Jersey. U.S. South region includes states from Atlantic to Gulf of Mexico. U.S. West region includes states of New Mexico, Colorado, Arizona, Utah, Nevada, Wyoming, Idaho, Montana and the Pacific states.
Source: Transport Canada, adapted from Statistics Canada, International Trade Database

StatiStical addendum2020
tranSporation and the economy
9
Table EC9: Canada’s Exports and Imports, by Origin, Destination and Mode of Transport, 2020
(Millions of dollars)
Origin3
Total Exports1 Eastern Western Total Main Modes UsedRegions of Destination Provinces Provinces 2020P (per cent of total value)United States 259,971 123,824 383,795 Road (54), Rail (19)Other Regions 81,228 57,504 138,732 Marine (63), Air (31)
Asia 21,959 36,267 58,227 Marine (84), Air (15)Western Europe 42,353 8,060 50,414 Air (57), Marine (43)Latin America 7,436 6,380 13,816 Marine (50), Road (26)Middle East 4,381 2,596 6,977 Marine (61), Air (22)Africa 1,642 2,343 3,985 Marine (74), Air (24)Eastern Europe 1,989 717 2,706 Marine (60), Air (37)Oceania 1,442 1,140 2,583 Marine (48), Air (35)Other 24 1 25 Marine (84), Air (16)
Total 341,199 181,328 522,527
Destination3
Total Imports2 Eastern Western Total Main Modes UsedRegions of Origin Provinces Provinces 2020P (Per cent of total value)United States 207,861 56,259 264,121 Road (71), Rail (13)Other Regions 227,375 50,503 277,878 Marine (40), Road (36)Asia 101,431 32,232 133,663 Marine (45), Road (39)Western Europe 60,917 8,189 69,106 Marine (45), Air (33)Latin America 41,784 6,151 47,935 Road (54), Air (19)Eastern Europe 7,032 819 7,852 Marine (59), Air (19)Middle East 6,079 659 6,738 Marine (54), Air (30)Africa 5,171 204 5,374 Marine (43), Air (42)Oceania 1,664 1,529 3,194 Marine (48), Road (34)Other 3,297 721 4,017 Road (58), Air (38)Total 435,237 106,763 541,999
Notes: P= Preliminary data. 1 Total exports including domestic exports and re-exports. For exports, mode of transport information represents the mode of transport by which the international boundary is
crossed. This may be different from the mode of transport within Canada.2 For imports, the mode of transport represents the last mode of transport by which the cargo was transported to the port of clearance in Canada and is derived from the cargo con-
trol documents of customs. This may not be the mode of transport by which the cargo arrived at the Canadian port of entry in the case of inland clearance. This may, therefore, lead to some underestimation of Canadian imports by the marine and air transport modes.
3 Province of origin for exports. Province of clearance for imports as the final destination in unknown. Eastern provinces include the Atlantic provinces, Quebec and Ontario. Western provinces include the Prairie provinces, British Columbia, and the Territories (Yukon, Northwest Territories, and Nunavut).
Source: Transport Canada, adapted from Statistics Canada, International Trade Database

tranSportation in canada2020
tranSportation and the economy
10
Table EC10: Canada’s Merchandise Trade – Top 25 Partners, 2019–2020
(Millions of dollars)
Total Total Percentage Total Total Trade Country Cumulative Trade Change
Countries Exports Ranking Imports Ranking 2020P Ranking Share in % Share in % 2019R 2020/2019United States 383,795 1 264,121 1 647,916 1 60.9 60.9 751,795 (13.8)China, People’s Republic 25,163 2 76,480 2 101,642 2 9.5 70.4 98,284 3.4 Mexico 6,133 6 29,865 3 35,998 3 3.4 73.8 44,311 (18.8)United Kingdom (UK) 19,911 3 7,838 9 27,749 4 2.6 76.4 29,029 (4.4)Japan 12,359 4 13,570 5 25,929 5 2.4 78.8 29,109 (10.9)Germany 6,367 5 17,304 4 23,671 6 2.2 81.1 25,626 (7.6)South Korea 4,688 8 9,582 6 14,270 7 1.3 82.4 15,053 (5.2)Italy 3,692 10 9,002 7 12,694 8 1.2 83.6 12,712 (0.1)France 3,708 9 6,467 11 10,174 9 1.0 84.5 12,333 (17.5)Vietnam 735 32 8,145 8 8,881 10 0.8 85.4 7,982 11.3 Brazil 2,143 14 6,573 10 8,716 11 0.8 86.2 7,667 13.7 India 3,677 11 4,964 14 8,641 12 0.8 87.0 10,124 (14.6)Netherlands 5,409 7 3,188 20 8,596 13 0.8 87.8 9,851 (12.7)Switzerland 1,798 17 5,883 12 7,681 14 0.7 88.5 6,381 20.4 Taiwan 1,781 19 5,632 13 7,413 15 0.7 89.2 7,997 (7.3)Belgium 2,574 12 4,351 15 6,925 16 0.7 89.9 8,183 (15.4)Peru 872 28 3,664 17 4,536 17 0.4 90.3 4,359 4.1 Spain 1,409 22 3,095 21 4,504 18 0.4 90.7 5,012 (10.1)Australia 2,135 15 2,358 23 4,493 19 0.4 91.2 4,601 (2.3)Thailand 798 29 3,533 18 4,331 20 0.4 91.6 4,625 (6.3)Canada1 4,008 16 4,008 21 0.4 91.9 4,580 (12.5)Ireland 672 35 3,198 19 3,870 22 0.4 92.3 3,865 0.1 Malaysia 768 31 3,051 22 3,819 23 0.4 92.7 3,650 4.6 Norway 2,537 13 1,177 40 3,714 24 0.3 93.0 3,673 1.1 Indonesia 1,783 18 1,614 31 3,398 25 0.3 93.3 3,744 (9.2)Other countries 27,621 43,335 70,956 6.7 100.0 79,786 (11.1)
Grand Total Trade 522,527 541,999 1,064,527 100.0 1,194,330 (10.9)
Total APEC 447,040 432,202 879,243 995,933 (11.7)Total BRIC 31,599 89,212 120,811 118,603 1.9 Total EU (including UK) 47,684 67,715 115,399 125,746 (8.2)Total OECD 464,114 403,860 867,974 995,027 (12.8)
Notes: R= Revised data. P= Preliminary data. EU= European Union. APEC= Asia-Pacific Economic Cooperation. OECD= Organisation for Economic Cooperation and Development.BRIC: Brazil, Russia, India and China. 1 Imports from Canada to Canada are goods that were produced in Canada, exported to another country, and returned to Canada for any number of reasons (e.g. wrong size,
wrong colour, did not sell).
Source: Transport Canada, adapted from Statistics Canada, International Trade Database

StatiStical addendum2020
tranSporation and the economy
11
Table EC11: Visits by Canadians to All Countries, 2016–2017
(Thousands of person-visits)
Same Day Overnight Total
2016 2017 2016 2017 2016 2017Percentage Change
2017/16Per Cent of Total
2017United States 28,228 29,320 25,993 26,905 54,221 56,225 3.7 73.8
New York 6,507 6,726 3,086 3,210 9,593 9,936 3.6 13.0Washington 6,448 6,573 2,509 2,503 8,957 9,076 1.3 11.9Michigan 5,763 6,039 1,323 1,354 7,086 7,393 4.3 9.7Florida 220 159 3,345 3,448 3,565 3,607 1.2 4.7Maine 2,111 2,086 745 740 2,856 2,826 (1.1) 3.7Other 7,179 7,737 14,985 15,650 22,164 23,387 5.5 30.7
Europe 1,088 1,185 6,674 7,443 7,762 8,628 11.2 11.3United Kingdom 121 118 1,261 1,490 1,382 1,608 16.4 2.1France 122 121 1,150 1,262 1,272 1,383 8.7 1.8Germany 158 186 578 634 736 820 11.4 1.1Italy 118 113 487 516 605 629 4.0 0.8Spain 16 14 450 503 466 517 10.9 0.7Netherlands 87 111 280 332 367 443 20.7 0.6Ireland 1 1 274 285 275 286 4.0 0.4Portugal 51 50 200 211 251 261 4.0 0.3Other 414 471 1,994 2,210 2,408 2,681 11.3 3.5
Africa 138 138 658 725 796 863 8.4 1.1South Africa 22 33 145 183 167 216 29.3 0.3Other 116 105 513 542 629 647 2.9 0.8
Asia and Oceania 159 164 2,752 3,100 2,911 3,264 12.1 4.3China 1 7 497 500 498 507 1.8 0.7India 7 7 247 308 254 315 24.0 0.4Hong Kong 9 5 271 282 280 287 2.5 0.4Australia 3 2 208 222 211 224 6.2 0.3Japan 23 38 100 127 123 165 34.1 0.2Thailand 28 32 100 116 128 148 15.6 0.2Other 88 73 1,329 1,545 1,417 1,618 14.2 2.1
Caribbean 742 667 2,935 2,911 3,677 3,578 (2.7) 4.7Cuba 0 0 858 881 858 881 2.7 1.2Dominican Republic 44 44 505 512 549 556 1.3 0.7Bahamas 133 117 224 197 357 314 (12.0) 0.4Jamaica 87 57 221 231 308 288 (6.5) 0.4Barbados 25 28 172 163 197 191 (3.0) 0.3Other 453 421 955 927 1,408 1,348 (4.3) 1.8
Mexico, Central and South America 526 406 3,193 3,210 3,719 3,616 (2.8) 4.7
Mexico 222 187 2,033 2,053 2,255 2,240 (0.7) 2.9Costa Rica 64 43 181 191 245 234 (4.5) 0.3Peru 0 0 142 142 142 142 0.0 0.2Other 240 176 837 824 1,077 1,000 (7.1) 1.3
Total non-US 2,653 2,560 16,212 17,389 18,865 19,949 5.7 26.2 Grand Total 30,881 31,880 42,205 44,294 73,086 76,174 4.2 100.0
Notes: Including side trips from the United States.New data was unavailable at source prior to publication.
Source: Statistics Canada, International Travel Survey unpublished data

tranSportation in canada2020
tranSportation and the economy
12
Table EC12: Canada - United States Travel, by Mode of Transport and by Purpose, 2017
(Thousands of person-trips)----------------- Same Day --------------- --------------- Overnight --------------- Trip Duration (Percentage)
Primary Trip Purpose Primary Trip PurposeTotal Non-business Business Total Non-business Business Total Same Day Overnight
Canadian ResidentsAutomobile 32,183 20,208 1,273 21,481 10,153 549 10,702 66.7 33.3Airplane 8,566 13 29 42 5,606 2,918 8,524 0.5 99.5Bus 827 315 10 325 485 17 502 39.3 60.7Rail 31 0 0 0 30 1 31 0.0 100.0Boat 156 3 0 3 149 4 153 1.9 98.1Other modes 343 43 2 45 288 10 298 13.1 86.9Total 42,106 20,582 1,314 21,896 16,711 3,499 20,210 52.0 48.0
U.S. ResidentsAutomobile 16,188 7,593 607 8,200 7,605 383 7,988 50.7 49.3Airplane 5,660 496 387 883 2,472 2,305 4,777 15.6 84.4Bus 899 492 3 495 373 31 404 55.1 44.9Rail 140 26 0 26 103 11 114 18.6 81.4Boat 1,021 402 5 407 598 16 614 39.9 60.1Other modes 427 21 25 46 325 56 381 10.8 89.2Total 24,335 9,030 1,027 10,057 11,476 2,802 14,278 41.3 58.7
Canadian and U.S. ResidentsAutomobile 48,371 27,801 1,880 29,681 17,758 932 18,690 61.4 38.6Airplane 14,226 509 416 925 8,078 5,223 13,301 6.5 93.5Bus 1,726 807 13 820 858 48 906 47.5 52.5Rail 171 26 0 26 133 12 145 15.2 84.8Boat 1,177 405 5 410 747 20 767 34.8 65.2Other modes 770 64 27 91 613 66 679 11.8 88.2Total 66,441 29,612 2,341 31,953 28,187 6,301 34,488 48.1 51.9
Note: New data was unavailable at source prior to publication.
Source: Statistics Canada, International Travel Survey unpublished data
Table EC13: Overseas Travel, by Mode of Transport and by Purpose, 2017
(Thousands of person-trips)-------------- Same Day --------------- --------------- Overnight ---------------- Trip Duration (Percentage) Primary Trip Purpose Primary Trip Purpose
Total Non-business Business Total Non-business Business Total Same Day OvernightCanadian ResidentsAutomobile 7 0 0 0 6 1 7 0.0 100.0Airplane 12,809 0 0 0 9,577 3,232 12,809 0.0 100.0Boat 34 0 0 0 33 1 34 0.0 100.0Total 12,850 0 0 0 9,616 3,234 12,850 0.0 100.0
Foreign Residents1
Automobile 498 22 3 25 398 75 473 5.0 95.0Airplane 5,813 300 9 309 4,630 874 5,504 5.3 94.7Bus 113 3 0 3 102 8 110 2.7 97.3Rail 35 0 0 0 35 0 35 0.0 100.0Boat 132 19 0 19 104 9 113 14.4 85.6Other modes 69 4 2 6 48 15 63 8.7 91.3Total 6,660 348 14 362 5,317 981 6,298 5.4 94.6
Canadian and Foreign ResidentsAutomobile 505 22 3 25 404 76 480 5.0 95.0Airplane 18,622 300 9 309 14,207 4,106 18,313 1.7 98.3Bus 113 3 0 3 102 8 110 2.7 97.3Rail 35 0 0 0 35 0 35 0.0 100.0Boat 166 19 0 19 137 10 147 11.4 88.6Other modes 69 4 2 6 48 15 63 8.7 91.3Total 19,510 348 14 362 14,933 4,215 19,148 1.9 98.1
Notes: New data was unavailable at source prior to publication. 1 Excludes U.S. residents.
Source: Statistics Canada, International Travel Survey unpublished data

StatiStical addendum2020
tranSporation and the economy
13
Table EC14: Employment in the Transportation Sector, 2011–2020
(Number of people)
2011 2012 2013 2014 2015 2016 2017 2018 2019 2020Transportation and related servicesScheduled air transportation 52,498 54,490 56,026 57,627 57,470 59,344 61,698 59,428 61,962 56,538Non-scheduled air transportation 11,940 12,085 12,301 12,323 12,760 12,137 11,674 11,646 12,698 12,059Support activities for air transportation 26,584 28,050 28,201 29,722 30,775 30,916 31,447 32,192 32,700 26,387Sub-total for Air 91,022 94,625 96,528 99,672 101,005 102,397 104,819 103,266 107,360 94,984
Marine shipping and support activities1 19,486 18,967 22,745 23,846 21,699 22,594 21,747 25,366 25,931 24,705
Rail transportation 37,286 38,095 37,607 37,073 37,456 37,437 37,203 36,889 35,744 35,268Support activities for rail transportation 2,615 2,620 2,947 3,727 4,039 4,370 3,479 3,913 3,989 4,165Sub-total for Rail 39,901 40,715 40,554 40,800 41,495 41,807 40,682 40,802 39,733 39,433
Truck transportation 175,518 182,446 189,381 192,924 195,965 195,841 200,821 206,137 208,495 193,791Support activities for road transportation 21,807 22,864 23,615 24,134 24,707 26,614 27,169 28,002 28,610 29,014Post office plus private couriers and messengers1 116,022 122,898 117,681 108,672 107,673 110,238 106,665 120,888 126,043 124,127Waste collection2 10,576 12,373 12,849 13,953 15,110 15,702 16,631 19,191 19,443 17,642Sub-total for Trucking and related activities2 323,923 340,581 343,526 339,683 343,455 348,395 351,286 374,218 382,591 364,574
Urban transit systems 58,794 59,540 61,309 60,918 61,396 63,124 62,159 63,154 65,317 63,688School and employee bus transportation 31,487 32,230 32,825 33,487 33,433 33,779 34,645 35,331 35,906 30,528Interurban and rural bus transportation 4,329 5,138 5,657 4,974 4,915 4,865 4,284 4,066 3,741 3,134Charter bus industry 5,010 5,030 5,172 4,945 4,899 4,965 5,239 5,590 5,687 3,093Other transit and ground passenger transportation 4,384 5,097 5,203 5,628 5,984 5,890 6,649 6,475 6,193 4,979Sub-total for Buses and urban transit 104,004 107,035 110,166 109,952 110,627 112,623 112,976 114,616 116,844 105,422
Taxi and limousine service 11,952 11,880 11,727 11,708 11,425 10,994 11,010 10,492 10,749 7,446Logistics and other freight support services 38,037 39,065 39,333 40,817 41,714 42,214 41,517 43,448 45,054 40,940Travel arrangement and sightseeing services1,2 40,655 39,060 38,740 39,442 40,619 38,505 40,661 37,624 40,968 27,551Sub-total for Arrangement and other support services2 90,644 90,005 89,800 91,967 93,758 91,713 93,188 91,564 96,771 75,937
Self-employment1 144,164 145,436 156,426 174,988 179,591 177,614 171,600 170,074 200,223 202,804
TOTAL - Transportation and related services 813,144 837,364 859,745 880,908 891,630 897,143 896,298 919,906 969,453 907,859
NAICS Transportation and warehousing employment not included above:3 50,159 49,546 46,459 39,765 40,798 45,899 60,491 84,232 75,086 65,627
Transportation manufacturing, commercial services and constructionAerospace product and parts manufacturing 44,324 46,440 47,613 49,303 47,259 45,683 43,980 46,540 51,349 47,421Ship and boat building 6,045 6,457 6,480 6,482 6,876 7,233 7,872 8,128 8,252 7,879Railroad rolling stock manufacturing 4,016 3,703 3,354 3,461 4,150 3,889 3,771 3,545 4,358 4,026Motor vehicle manufacturing 37,401 37,207 38,880 40,161 41,417 43,209 43,673 44,122 44,277 36,660Parts and other motor vehicle manufacturing 74,415 77,980 78,534 81,339 83,987 83,666 87,266 92,851 90,356 80,567Other transportation equipment manufacturing 6,568 6,535 7,114 6,415 7,434 8,221 9,099 9,914 10,541 8,070Sub-total for Transportation equipment manufacturing 172,769 178,322 181,975 187,161 191,123 191,901 195,661 205,100 209,133 184,623
Motor vehicle wholesalers 60,123 62,031 62,404 63,801 65,047 63,300 62,319 63,476 65,035 59,061Motor vehicle retailers 185,202 189,159 196,118 204,593 207,295 210,853 215,736 222,013 226,409 195,509Transport equipment rental and leasing4 24,417 25,043 26,038 27,064 28,065 27,613 28,123 28,268 29,069 21,919Gasoline stations 80,281 78,885 78,536 80,838 81,642 82,565 84,048 84,704 83,269 77,048Automotive repair and maintenance 94,978 96,657 98,120 101,628 104,485 106,024 108,517 111,572 113,787 100,858Sub-total for Transportation-related commercial services 445,001 451,775 461,216 477,924 486,534 490,355 498,743 510,033 517,569 454,395
Highway, street and bridge construction 57,187 59,563 57,812 56,302 54,850 54,441 4,915 4,865 4,284 4,066TOTAL - Transportation manufacturing, com-mercial services and construction 674,957 689,660 701,003 721,387 732,507 736,697 747,705 769,070 781,473 690,890
Notes: NAICS= North American Industry Classification SystemData for transportation-related local government employment are not collected.
1 Transport Canada estimate.2 Includes employment from sectors outside of NAICS 48-49 Transportation and warehousing.3 Transport Canada estimate of paid and self-employment in the Pipeline and Warehousing industries.4 Transport Canada estimate of transportation equipment segment of this industry.
Sources: Transport Canada estimates derived from Statistics Canada, Tables 14-10-0202-01 and 14-10-0027-01, Canada Post Annual Reports, and other sources

tranSportation in canada2020
tranSportation and the economy
14
Figure EC15: Labour in Transportation Modes in Canada, by Age Range, 2020
0
5
10
15
20
25
30
35
Transportation andWarehousing
Air Transportation Rail Transportation Water Transportation Truck Transportation Transit & GroundPassenger
Transportation
Shar
e of
Indu
stry
Em
ploy
men
t (pe
r ce
nt)
15 to 24 years 25 to 34 years 35 to 44 years 45 to 54 years 55 to 64 years 65 years and over
Source: Statistics Canada, Labour Force Survey (LFS), custom tabulation

StatiStical addendum2020
tranSporation and the economy
15
Table EC16: Average weekly earnings1 by selected industries, 2011–2020
(Current Dollars)
2011 2012 2013 2014 2015 2016 2017 2018 2019 2020Transportation and Warehousing2 914 928 969 1,001 1,027 1,010 1,034 1,035 1,091 1,158
Air transportationScheduled air transportation 1,012 1,063 1,097 1,100 1,199 1,065 1,163 1,064 1,217 1,267Non-scheduled air transportation 1,100 1,100 1,150 1,181 1,247 1,122 1,198 1,187 1,268 1,279Support activities for air transportation 1,200 1,153 1,207 1,199 1,247 1,232 1,271 1,282 1,312 N/A
Marine transportationMarine N/A N/A N/A N/A N/A N/A N/A N/A N/A N/ASupport activities for marine transportation 1,145 1,174 1,291 1,259 1,324 N/A 1,328 1,502 1,441 1,700
Rail transportationRail transportation 1,284 1,369 1,353 1,308 1,496 1,415 1,490 1,375 1,682 1,809Support activities for rail transportation N/A N/A N/A N/A N/A N/A N/A N/A N/A N/A
Truck transportationGeneral freight trucking 842 858 866 889 883 894 917 965 1,015 1,068Specialized freight trucking 925 961 982 1,050 1,032 983 1,011 1,067 1,101 1,135Support activities for road transportation 856 853 893 928 879 883 917 1,002 1,027 1,067Postal service N/A N/A N/A N/A N/A N/A N/A N/A N/A N/ACouriers and messengers 711 675 749 757 801 790 864 878 854 896Waste collection 912 883 905 925 949 1,002 992 1,040 1,070 1,218
Buses and urban transitUrban transit systems 979 982 1,143 1,268 1,315 1,330 1,306 1,206 1,327 1,424Interurban and rural bus transportation N/A N/A N/A N/A N/A 903 1,049 N/A N/A N/ASchool and employee bus transportation 518 522 523 545 551 539 517 546 595 645Charter bus industry 589 589 N/A N/A N/A N/A 624 N/A N/A N/AOther transit and ground passenger transportation 552 N/A N/A N/A 556 585 578 578 584 621
Other transport-related industriesTaxi and limousine service 420 439 430 N/A 473 459 472 N/A N/A 551Freight transportation arrangement 911 965 996 1,021 1,000 1,018 1,020 1,102 1,158 1,184Other support activities for transportation N/A N/A N/A N/A N/A N/A N/A N/A N/A N/ATravel arrangement and reservation services 778 771 735 764 N/A 837 856 858 940 936Scenic and sightseeing transportation N/A N/A N/A N/A N/A N/A N/A N/A N/A N/AAutomotive repair and maintenance 750 760 781 806 800 832 847 870 905 946Highway, street and bridge construction 1,185 1,262 1,342 1,363 1,357 1,335 1,321 1,347 1,392 1,416Pipeline transportation N/A N/A N/A N/A N/A N/A N/A N/A N/A N/AWarehousing and storage 760 783 835 862 820 909 920 921 963 1,050Transit and ground passenger transportation 760 767 847 915 948 955 935 894 976 N/A
Notes: NAICS= North American Industry Classification System. N/A= Data not available.1 Gross average weekly earnings, including overtime, before deductions, for employees paid by the hour and salaried employees paid a fixed salary. Self-employment earnings
are not included.2 Weighted average for N/AICS Sector 48-49 “Transportation and Warehousing.”
Source: Statistics Canada, Table 14-10-0204-01

tranSportation in canada2020
tranSportation and the economy
16
Table EC18: Average Crude Oil Prices - Canadian and U.S. $ per Barrel, 2011–2020Per cent change
2011 2012 2013 2014 2015 2016 2017 2018 2019 2020 2017/18 2018/19 2019/20WTI (Cushing, Oklahoma) $US/Bbl 95.0 94.2 98.0 93.0 48.8 43.3 51.0 64.8 57.0 39.4 27.1 (12.0) (30.9)WTI (Cushing, Oklahoma) $CDN/Bbl 93.8 94.1 100.9 102.7 62.3 57.4 66.1 83.9 75.7 52.8 27.0 (9.8) (30.2)Brent (UK) $US/Bbl 111.2 111.4 108.5 99.5 53.6 45.0 54.8 71.5 64.2 43.2 30.5 (10.3) (32.7)Brent (UK) $CDN/Bbl 109.9 111.3 111.7 109.9 68.5 59.6 71.1 92.7 85.1 57.9 30.4 (8.1) (32.0)Western Canada Select $CDN/Bbl 77.1 73.1 74.9 81.1 44.8 38.9 50.2 52.3 58.8 35.6 4.2 12.3 (39.4)Hardisty (Bow River) $CDN/Bbl 78.3 74.4 76.2 81.7 45.3 39.2 50.6 53.1 59.1 35.9 5.0 11.3 (39.2)Exchange Rate $US/$Cdn 1.0 1.0 1.0 0.9 0.8 0.8 0.8 0.8 0.8 0.7 0.1 (2.3) (1.0)
Notes: WTI= West Texas Intermediate. UK= United Kingdom.
Source: Sproule Associates Limited
Table EC17: Labour Actions in the Transport Sector, by mode, 2011–2020
2011 2012 2013 2014 2015 2016R 2017 2018 2019R 2020Number of Stoppages
Air1 3 2 2 2 1 0 2 0 2 1Marine1,2 5 1 0 0 5 2 2 2 2 4Rail1 1 3 0 0 3 0 0 1 3 0Truck 2 0 0 0 2 1 0 2 2 0Bus/transit3 9 7 3 3 1 7 1 3 4 2Taxi/limousine 1 1 0 1 1 0 0 0 0 0Other4 2 2 0 2 4 1 0 2 2 0Total 23 16 5 8 17 11 5 10 15 7
Number of Workers InvolvedAir1 4,222 102 110 475 56 0 730 0 84 71Marine1,2 418 17 0 0 285 250 54 84 61 1,360Rail1 109 4,529 0 0 4,137 0 0 3,200 3,681 0Truck 86 0 0 0 126 90 0 155 148 0Bus/transit3 906 1,591 168 549 48 615 602 564 208 771Taxi/limousine 142 754 0 22 240 0 0 0 0 0Other4 48,100 131 0 75 249 48 0 50,500 39 0Total 53,983 7,124 278 1,121 5,141 1,003 1,386 54,503 4,221 2,202
Person-days Not WorkedAir1 17,440 9,280 14,980 25,280 40 0 41,090 0 161 1,700Marine1,2 6,270 100 0 0 3,910 27,330 540 8,280 4,553 29,678Rail1 14,400 54,450 0 0 22,990 0 0 3,200 25,164 0Truck 610 0 0 0 3,060 960 0 420 162 0Bus/transit3 29,420 41,410 1,180 9,570 240 4,830 1,810 3,770 4,000 10,380Taxi/limousine 12,440 18,320 0 770 21,590 0 0 0 0 0Other4 418,200 1,350 0 10,340 15,420 770 0 142,680 2,210 0Total 498,780 124,910 16,160 45,960 67,250 33,890 43,440 158,350 36,250 41,758
Notes: R= Revised data. Transportation industries based on NAICS definition. NAICS= North American Industry Classification System.1 Includes support activities.2 Includes marine sightseeing.3 Includes urban transit systens, interurban and rural bus transport, school buses, charter bus transport, land sightseeing and other transit and ground passenger transportation.4 Includes freight forwarders, support services for ground transport, other sightseeing, pipelines, postal service, couriers and messengers, and warehousing.
Source: Transport Canada, adapted from Employment and Social Development Canada (ESDC) special tabulation

StatiStical addendum2020
tranSporation and the economy
17
Table EC20: Price of Other Transportation Fuels, 2011–2020
(Cents per litre)
2011 2012 2013 2014 2015 2016 2017 2018 2019 2020Jet Fuel (Turbo)1 78.3 80.7 79.6 78.7 51.5 43.7 53.6 69.1 65.8 39.0Aviation Gasoline2 110.8 116.3 119.3 N/A N/A N/A N/A N/A N/A N/AMarine Bunker3 76.2 83.8 81.8 88.4 N/A N/A N/A N/A N/A N/ARail Diesel (Proxy)4 82.8 86.2 86.0 85.9 60.2 51.3 60.9 75.7 72.0 48.2
Notes: R= Revised data. P= Preliminary data. N/A= Not available.1 U.S. Gulf Coast spot price converted to Canadian dollars.2 Average U.S. retail price converted to Canadian dollars, to which the Canadian federal excise tax was added (11.5¢ per litre).3 New York Harbor Residual Fuel Oil 1.0 % Sulfur LP Spot Price CIF, converted to Canadian dollars, to which the Canadian federal excise tax of 4¢ per litre was added.4 FOB Spot Price of No 2 Diesel Ultra-Low Sulfur Spot Price in New York Harbour, converted to Canadian dollars, to which the Canadian federal excise tax of 4¢ per litre was
added.
Source: Transport Canada estimates based on U.S. Department of Energy data
Table EC19: Retail Price of Regular Road Gasoline and Diesel For Selected Cities, 2011–2020
(Cents per litre)
2011 2012 2013 2014 2015 2016 2017 2018 2019 2020Regular GasolineSt John’s 129.1 132.6 129.9 131.4 109.6 114.5 125.2 127.1 134.1 106.9Charlottetown 118.8 123.9 129.3 131.2 105.8 99.0 108.8 121.2 128.2 96.9Halifax 125.4 131.4 131.2 131.1 105.9 99.1 108.4 119.0 118.2 92.5Saint John 121.7 127.7 127.1 127.7 104.1 98.7 108.9 120.4 129.7 96.6Montreal 130.5 136.9 137.9 137.5 115.7 108.0 119.0 131.9 128.0 106.4Toronto 124.0 126.7 127.8 128.2 106.7 101.2 113.6 127.0 118.2 99.9Winnipeg 114.0 117.9 120.5 117.5 97.1 92.5 97.7 113.1 120.0 93.8Regina 121.6 122.2 120.1 120.7 100.4 92.0 98.8 114.4 117.7 97.0Calgary 111.0 111.8 112.9 115.3 99.1 92.0 101.9 119.9 116.6 94.9Vancouver 131.6 135.1 137.5 137.7 124.2 118.8 134.7 150.1 136.9 125.4Canada 123.9 127.5 128.1 128.3 108.8 102.8 114.6 128.8 123.1 103.1
Road DieselSt John’s 133.8 137.6 138.5 139.9 115.7 108.4 121.6 138.3 122.0 108.8Charlottetown 123.2 127.2 137.7 141.2 114.0 103.1 113.8 132.2 114.8 102.7Halifax 126.2 131.5 132.5 133.9 105.2 94.1 104.5 121.8 114.1 90.8Saint John 128.8 134.2 135.5 137.2 111.1 101.9 112.5 129.3 118.1 102.1Montreal 132.0 137.3 138.9 139.9 116.6 103.1 112.4 131.7 125.7 107.9Toronto 127.9 125.2 125.8 130.7 107.8 93.8 107.9 125.6 117.4 100.8Winnipeg 116.5 119.3 124.7 131.9 100.5 92.7 103.3 121.2 109.1 104.2Regina 118.0 118.4 123.2 132.4 99.9 90.9 101.3 119.5 110.6 100.1Calgary 113.4 113.6 118.5 127.7 99.6 90.5 106.0 126.2 105.7 98.6Vancouver 132.1 138.6 141.9 145.7 122.1 111.9 121.0 139.7 149.2 114.5Canada 124.5 125.4 128.5 134.1 109.2 97.7 110.2 128.8 120.9 103.8
Note: Additional cities (not shown here) are included in the sample used to calculate the national average.
Source: Kent Group Ltd.

tranSportation in canada2020
tranSportation and the economy
18
Table EC21: Price and Output Indicators, Transport Industries, 2014–2019Price Changes
(Annual per cent change)Output Changes
(Annual per cent change)
2015/14R 2016/15R 2017/16R 2018/17R 2019/18 2015/14R 2016/15R 2017/16R 2018/17R 2019/18CN and CP Agriculture 3.4 (1.8) 2.9 3.9 4.5 1.4 (2.8) 3.9 2.9 1.8 Other Bulk 2.6 0.8 2.1 5.5 4.5 (1.9) 2.3 0.1 1.0 (2.8) Other Commodities 2.9 (0.2) 0.9 7.7 4.7 (2.3) (9.1) 9.2 7.6 1.2 Intermodal (3.6) 0.2 0.9 (0.2) 4.3 3.1 (1.2) 9.5 8.3 (1.7) Total Transportation Activities 1.1 (0.2) 1.5 4.1 4.5 (0.1) (3.9) 6.6 6.1 -0.2
Airline Industry Passenger (3.7) (7.4) 0.5 4.7 3.1 7.1 9.9 11.7 5.6 2.1 Freight 1.1 (11.2) (2.7) 16.2 (5.6) (1.4) 13.0 24.6 7.2 (4.0) Total Transportation Activities (3.7) (7.4) 0.5 4.7 3.1 6.8 10.0 12.1 5.6 1.8
Business Carriers1
Freight 1.1 (0.7) 1.3 4.5 3.9 (0.2) (3.2) 7.5 6.4 -0.4 Passenger (3.7) (7.4) 0.5 4.7 3.1 7.1 9.9 11.7 5.6 2.1 Total Transportation Activities (1.6) (4.6) 0.8 4.6 3.5 3.8 4.0 9.9 5.9 1.0
VIA Rail Corridor 3.8 6.5 11.9 4.7 0.2 1.2 (0.8) 2.4 6.7 6.6 Long Haul 13.0 16.5 (5.5) 16.2 (3.2) (4.2) 7.2 21.0 (16.8) (0.1) Remote-Regional 1.3 (10.9) (1.9) (0.3) 1.2 12.8 11.4 (26.5) (26.0) 71.0 Total Transportation Activities 5.6 8.2 7.3 7.1 (0.5) 0.3 1.1 6.0 0.5 5.7
Transit Passenger 3.4 2.3 (1.4) 2.4 4.6 (0.5) (1.3) 3.7 2.4 1.8
Public Carriers Total Transportation Activities 3.5 2.7 (0.8) 2.8 4.2 (0.5) (1.2) 3.9 2.3 2.1
All Carriers Listed Above Total Transportation Activities (1.0) (3.7) 0.6 4.4 3.5 3.3 3.3 9.1 5.5 1.2
Overall Economy (0.9) 0.8 2.5 1.8 1.7 0.6 0.8 3.5 2.8 1.8
Notes: R= Revised data. CN = Canadian National. CP = Canadian Pacific.1 CN and CP, and the airline industry.
Source: Transport Canada, based on Statistics Canada and carriers’ files

StatiStical addendum2020
tranSporation and the economy
19
Table EC23: Cost Structure of Transport Industries, 2016–2019
(Percentage of Total Costs)
Business Carriers1 Public Carriers Total Carriers
2016R 2017R 2018R 2019 2016R 2017R 2018R 2019 2016R 2017R 2018R 2019Variable 75.5 76.5 80.1 80.3 69.6 69.4 68.6 70.0 73.7 74.4 76.8 77.2 Labour 22.9 21.6 23.1 23.0 43.9 44.0 43.1 44.2 29.3 28.2 28.9 29.5 Fuel 17.0 19.6 23.7 23.0 5.1 5.2 5.3 4.9 13.4 15.4 18.4 17.5 Other 35.6 35.2 33.3 34.3 20.5 20.2 20.2 20.8 31.0 30.8 29.5 30.2
Capital 24.5 23.5 19.9 19.7 30.4 30.6 31.4 30.0 26.3 25.6 23.2 22.8
Notes: R= Revised data. CN = Canadian National. CP = Canadian Pacific.1 CN and CP, and the airline industry.
Source: Transport Canada, based on Statistics Canada and carriers’ files
Table EC22: Efficiency Indicators, Transport Industries, 2014–2019
Productivity (Annual per cent change) Unit Costs (Annual per cent change)
2015/14R 2016/15R 2017/16R 2018/17R 2019/18 2015/14R 2016/15R 2017/16R 2018/17R 2019/18CN and CP Labour 3.7 6.3 3.4 (3.0) 2.4 (1.0) (9.5) (6.9) 17.2 (1.3) Fuel 4.0 3.2 (0.9) 1.5 2.2 (29.5) (14.2) 17.1 21.1 (7.1) Capital (6.2) (5.9) 3.6 1.9 (7.6) 1.8 5.7 (4.4) (11.6) 1.8 Total 3.0 3.2 2.3 (0.2) (4.1) (8.3) (6.0) (0.7) 6.2 3.1
Airline Industry Labour 4.5 5.5 2.1 (3.8) (2.4) (0.3) (5.9) (3.9) 6.6 3.9 Fuel 3.9 1.9 1.3 0.0 (2.0) (28.2) (19.6) 14.6 27.5 1.2 Capital 2.8 (10.1) 5.9 3.2 0.5 6.9 19.5 (4.6) (11.3) 0.3 Total 1.9 (0.5) 3.1 1.8 (0.4) (6.5) (1.5) (0.2) 3.7 1.5
Business Carriers1
Labour 4.1 5.9 2.7 (3.4) (0.2) (0.7) (7.6) (5.2) 11.2 1.5 Fuel 2.9 (0.0) 0.2 0.6 (0.8) (28.5) (18.3) 15.2 25.9 (0.8) Capital (0.8) (8.6) 5.2 2.8 (2.2) 4.9 14.4 (4.5) (11.4) 0.8 Total 2.3 0.7 2.8 1.2 (1.6) (7.2) (3.0) (0.3) 4.4 2.0
Via Rail Labour 1.0 (5.5) 2.5 (3.1) (1.3) 10.7 0.8 2.4 6.8 (0.4) Fuel (3.3) (1.4) (0.0) (1.8) 5.4 2.2 (15.8) 9.3 (5.9) 3.2 Capital (2.0) 4.6 8.0 1.3 6.2 14.3 1.6 (3.3) (7.2) 5.8 Total (8.1) (10.8) 8.4 (0.3) (5.8) 14.8 9.9 (4.0) 1.1 8.7
Transit Labour 1.7 (3.6) 8.0 (0.3) 1.4 6.5 2.3 (0.4) 1.0 11.5 Fuel 0.5 (2.2) 17.4 2.3 (6.6) (8.0) (8.8) 0.9 6.5 (0.5) Capital (11.8) (9.0) (7.4) (8.1) (5.3) 7.7 8.6 0.5 6.4 3.4 Total (4.2) (5.7) 3.0 (3.4) (1.4) 5.9 3.7 (0.1) 3.6 7.8
Total Transport Business Carriers 2.3 0.7 2.8 1.2 (1.6) (7.2) (3.0) (0.3) 4.4 2.0 Public Carriers (4.4) (6.1) 3.3 (3.3) (1.7) 6.4 4.0 (0.3) 3.4 7.9 Total 0.3 (1.4) 3.0 (0.1) (1.6) (3.4) (0.9) (0.3) 4.1 3.7
Notes: R = Revised data. CN = Canadian National. CP = Canadian Pacific.1 CN and CP, and the airline industry.
Source: Transport Canada, based on Statistics Canada and carriers’ files

tranSportation in canada2020
tranSportation and the economy
20
Table EC24: Financial Performance of Transportation Industries, 2013–2019
(millions of dollars)
2013R 2014R 2015R 2016R 2017R 2018R 2019CN and CP – Canadian Operations
Operating Revenues 11,704 12,945 13,090 12,589 13,600 14,971 16,010Operating Expenses 8,631 9,274 8,456 7,563 8,052 9,560 10,088Operating Profit (Loss) 3,073 3,670 4,634 5,027 5,549 5,411 5,922Operating Ratio1 73.7 71.6 64.6 60.1 59.2 63.9 63.0
Regional Railways2
Operating Revenues 385 379 327 257 153 194 289Operating Expenses 251 235 260 254 139 159 216Operating Profit (Loss) 134 143 67 3 14 36 73 Operating Ratio1 65.1 62.2 79.5 98.7 90.9 81.7 74.7
Short Line Railways3
Operating Revenues 373 449 660 502 440 424 429Operating Expenses 326 422 552 473 376 349 372Operating Profit (Loss) 47 27 108 29 64 74 57 Operating Ratio1 87.5 94.0 83.6 94.2 85.5 82.5 86.7
Air Canada and AffiliatesOperating Revenues 11,536 12,318 12,914 13,243 14,712 16,322 16,548Operating Expenses 10,782 11,319 11,245 11,884 13,163 14,807 15,016Operating Profit (Loss) 754 999 1669 1359 1549 1515 1532 Operating Ratio1 93.5 91.9 87.1 89.7 89.5 90.7 90.7
WestJetOperating Revenues 3,662 3,977 4,029 4,123 4,507 4,733 5,147Operating Expenses 3,263 3,501 3,460 3,683 4,074 4,534 4,756Operating Profit (Loss) 400 475 570 440 433 199 391 Operating Ratio1 89.1 88.0 85.9 89.3 90.4 95.8 92.4
VIA RailOperating Revenues 258 265 281 307 349 375 394Operating Subsidies 308 317 280 268 265 273 281Operating Expense 599 567 659 741 756 785 906Operating Ratio1 231.7 214.0 234.7 241.3 216.7 209.4 230.0
Transit IndustryOperating Revenues 4,107 4,240 4,385 4,439 4,579 4,803 5,150Operating Subsidies 3,843 4,044 4,405 4,469 5,119 5,039 5,861Total Costs 10,083 10,592 11,262 11,564 12,070 12,810 14,207Cost Recovery Ratio4 40.7 40.0 38.9 38.4 37.9 37.5 36.3
Notes: R= Revised data. CN = Canadian National. CP = Canadian Pacific.1 Operating Expenses divided by Operating Revenues.2 Ontario Northland, Algoma Central, QNSL and BC Rail and Canadian connectors to U.S. railroads.3 All other Class II railroads except carriers which provide incomplete information.4 Operating Revenues divided by Total Costs.
Source: Transport Canada, based on Statistics Canada and carriers’ files

StatiStical addendum202021
government spending and revenues on transportation
Table G1: Summary of Transportation Expenditures and Revenues by Level of Government, 2010/11 - 2019/20201
(Millions of dollars)
2010/11 2011/12 2012/13 2013/14 2014/15 2015/16 2016/17 2017/18R 2018/19R 2019/20P
Transport Canada Operating 882.9 873.6 753.9 826.5 923.4 942.5 795.6 895.4 923.5 974.2 Capital 84.4 69.2 58.2 75.6 124.1 119.2 89.6 97.6 105.6 132.6 Transfer payments 411.0 426.7 608.0 526.4 646.9 591.0 379.2 277.0 276.1 487.0 Gross expenditures 1,378.3 1,369.4 1,420.1 1,428.5 1,694.3 1,652.7 1,264.4 1,270.0 1,305.2 1,593.8
Licences and fees 5.0 4.8 4.0 3.9 3.0 1.5 1.3 1.4 1.5 1.4 User fees and other revenues 425.1 441.9 434.4 435.4 443.1 455.9 541.0 517.6 539.5 757.8 Total revenues 430.1 446.7 438.4 439.3 446.1 457.4 542.3 519.0 541.0 759.2 Expenditures net of revenues 948.2 922.7 981.7 989.2 1,248.3 1,195.3 722.1 751.1 764.2 834.6
Other federal departments/agenciesOperating 2,213.1 2,068.1 2,090.9 2,316.2 2,382.5 2,963.0 3,092.5 2,793.5 3,217.5 3,464.2 Capital 498.8 347.7 334.2 308.3 418.8 962.1 1,040.2 1,732.9 1,863.6 2,740.7 Transfer payments 3,401.3 2,152.3 1,675.2 1,280.7 1,274.2 1,382.3 1,367.6 1,295.5 2,491.7 2,256.2 Gross expenditures 6,113.2 4,568.1 4,100.2 3,905.2 4,075.6 5,307.5 5,500.4 5,821.9 7,572.9 8,495.0
Fuel taxes 5,342.1 5,328.3 5,380.5 5,486.4 5,527.9 5,564.8 5,634.1 5,738.7 5,802.3 5,683.1 Sales taxes 5,674.5 5,925.7 6,118.8 6,407.8 6,567.1 6,487.9 6,740.8 7,416.5 7,743.3 7,898.2 Licences and fees 0.0 0.0 0.0 0.0 0.0 30.3 28.0 32.8 27.5 30.2 User fees and other revenues 642.3 673.4 768.9 822.6 922.9 1,020.6 1,097.5 1,097.1 1,253.6 1,239.6 Total revenues 11,658.8 11,927.4 12,268.2 12,716.7 13,018.0 13,103.5 13,500.4 14,285.0 14,826.7 14,851.0 Expenditures net of revenues2 (5,545.6) (7,359.3) (8,168.0) (8,811.5) (8,942.4) (7,796.1) (8,000.0) (8,463.1) (7,253.7) (6,355.2)
Provinces and territoriesOperating 4,435.9 4,669.5 6,499.3 9,029.2 9,233.7 7,957.0 7,177.7 8,152.5 6,573.8 7,070.6 Capital 8,454.4 8,042.9 8,746.1 8,670.1 8,270.5 10,185.8 10,208.1 10,214.5 9,884.3 9,571.4 Transfer payments 3,445.5 3,386.5 4,563.6 4,782.2 5,118.2 6,056.3 5,926.9 8,351.4 8,073.1 8,743.4 Gross expenditures 16,335.8 16,098.8 19,809.0 22,481.6 22,622.4 24,199.1 23,312.7 26,718.4 24,531.1 25,385.4 Federal transfers to provinces/territories3 (1,330.6) (966.4) (1,066.0) (728.8) (854.3) (2,577.4) (2,586.4) (3,155.4) (3,569.3) (3,372.6)Expenditures net of transfers 15,005.2 15,132.4 18,743.0 21,752.7 21,768.1 21,621.6 20,726.4 23,562.9 20,961.8 22,012.8
Fuel taxes 8,147.1 8,610.2 8,639.9 9,198.0 9,157.7 9,700.9 10,166.7 10,297.5 10,341.2 10,316.9 Sales taxes 7,176.8 8,209.6 8,676.4 9,126.8 9,490.2 9,623.1 10,114.9 10,946.9 11,411.1 11,517.2 Licences and fees 3,348.7 3,331.0 3,570.5 3,968.8 4,227.3 4,484.8 4,866.0 5,197.0 5,338.8 5,509.9 User fees and other revenues 48.2 890.5 957.7 1,139.8 1,328.1 1,360.7 1,457.6 2,221.2 2,056.9 1,895.3 Total revenues 18,720.9 21,041.3 21,844.5 23,433.4 24,203.2 25,169.6 26,605.1 28,662.5 29,148.0 29,239.3 Expenditures net of revenues2 (3,715.7) (5,908.9) (3,101.5) (1,680.6) (2,435.1) (3,547.9) (5,878.8) (5,099.5) (8,186.1) (7,226.5)
Combined federal and provincial/territorial governmentsExpenditures net of transfers Federal government (gross expenditures) 7,491.5 5,937.6 5,520.3 5,333.7 5,769.9 6,960.2 6,764.7 7,091.9 8,878.1 10,089.6 Provincial/territorial governments (expenditures net of transfers) 15,005.2 15,132.4 18,743.0 21,752.7 21,768.1 21,621.6 20,726.4 23,562.9 20,961.8 22,012.8 Overall 22,496.7 21,070.0 24,263.4 27,086.4 27,538.0 28,581.8 27,491.1 30,654.9 29,839.9 32,102.4
RevenuesFederal government revenues3 12,088.9 12,374.1 12,706.6 13,156.0 13,464.1 13,560.9 14,042.7 14,804.0 15,367.7 15,610.1 Provincial/territorial government revenues 18,720.9 21,041.3 21,844.5 23,433.4 24,203.2 25,169.6 26,605.1 28,662.5 29,148.0 29,239.3 Overall 30,809.8 33,415.5 34,551.1 36,589.4 37,667.3 38,730.5 40,647.8 43,466.5 44,515.6 44,849.5
Revenues (not including sales taxes)Federal government revenues (not including sales taxes) 6,414.4 6,448.4 6,587.8 6,748.2 6,896.9 7,073.1 7,301.9 7,387.6 7,624.4 7,712.0 Provincial/territorial government revenues (not including sales taxes) 11,544.1 12,831.7 13,168.1 14,306.6 14,713.1 15,546.5 16,490.2 17,715.6 17,736.8 17,722.1 Overall4 17,958.5 19,280.2 19,755.9 21,054.8 21,610.0 22,619.5 23,792.1 25,103.2 25,361.2 25,434.1
Notes: R= Revised, P= Preliminary
1. The tables in this section (G) cover the 10 fiscal years up to the end of March, 2020. Data are presented on a modified cash (public accounts) basis.2. Brackets indicate revenues exceed expenditures.3. Estimation of transportation-related transfer payments received (as reported by provincial/territorial respondents).4. Provided for comparison with past years’ reports.
Sources: S urvey responses from provincial/territorial governments and selected federal government departments and agencies; Public Accounts; Departmental Performance Reports (including supplementary tables); Department of Finance tax expenditure reports; Statistics Canada data. Some amounts have been imputed for non-response/missing data. For detailed results, see tables G3, G4 and G6.

tranSportation in canada2020 22
government Spending and revenueS on tranSportation
Table G2: Transportation Expenditures and Revenues by Mode and Level of Government, 2010/11 - 2019/20
(Millions of dollars)
2010/11 2011/12 2012/13 2013/14 2014/15 2015/16 2016/17 2017/18R 2018/19R 2019/20P
Federal Operating Expenditures, Capital Expenditures and Transfers1
Air Mode 934.4 847.7 811.2 885.1 984.8 1,003.8 1,048.2 1,081.5 1,183.7 1,261.6 Marine Mode 1,494.8 1,235.7 1,279.5 1,329.5 1,267.2 2,044.2 1,972.1 2,059.2 2,920.0 2,728.9 Rail Mode 581.0 544.0 470.1 448.8 451.5 499.7 396.3 412.9 615.0 616.8 Road Mode 2,420.1 1,336.9 1,166.4 752.4 1,006.4 1,371.6 1,604.2 1,995.1 1,759.4 3,103.4 Transit 1,149.3 1,051.0 775.7 846.2 751.4 820.5 813.6 640.9 1,558.0 1,295.3 Other Modes 911.8 922.3 1,017.4 1,071.7 1,308.7 1,220.4 930.4 903.5 843.0 1,087.1 Sub-Total 7,491.5 5,937.6 5,520.3 5,333.7 5,769.9 6,960.2 6,764.7 7,093.1 8,879.1 10,093.2
Provincial/Territorial Expenditures (before deducting federal transfers)Air Mode 218.2 189.2 184.8 263.5 279.7 356.5 284.9 313.8 298.9 314.7 Marine Mode 428.4 487.4 496.2 479.8 544.3 568.3 524.9 627.6 1,076.7 797.9 Rail Mode 78.5 81.5 91.6 117.8 92.7 99.4 86.1 85.3 95.4 92.0 Road Mode 13,182.2 12,713.6 12,978.8 14,794.4 14,572.5 17,456.1 16,873.2 17,986.4 15,565.2 16,244.6 Transit 2,096.6 2,278.6 5,633.3 6,476.1 6,784.1 5,170.7 5,001.1 7,209.3 6,986.1 7,459.2 Other Modes 331.9 348.5 424.2 349.9 349.2 548.0 542.5 495.9 508.8 477.0 Sub-Total 16,335.8 16,098.8 19,809.0 22,481.6 22,622.4 24,199.1 23,312.7 26,718.4 24,531.1 25,385.4
Provincial/Territorial Expenditures Net of Federal Transfers2
Air Mode 211.9 185.4 164.8 237.7 261.5 343.0 279.7 297.9 295.1 302.6 Marine Mode 400.9 459.4 467.6 449.0 514.9 538.6 495.8 593.1 1,045.9 760.3 Rail Mode 74.6 77.5 84.2 108.6 85.2 99.4 86.1 84.3 95.4 92.0 Road Mode 11,939.9 11,857.2 11,974.8 14,147.8 13,829.6 16,665.1 15,984.1 16,969.3 14,482.7 14,820.5 Transit 2,045.9 2,205.3 5,633.3 6,459.7 6,727.7 3,427.4 3,338.0 5,122.4 4,534.0 5,560.4 Other Modes 331.9 347.6 418.3 349.9 349.2 548.0 542.5 495.9 508.8 477.0 Sub-Total 15,005.2 15,132.4 18,743.0 21,752.7 21,768.1 21,621.6 20,726.4 23,562.9 20,961.8 22,012.8
Total Expenses: (Gross) Federal plus (Net) Provincial/Territorial Government LevelsAir Mode 1,146.3 1,033.0 976.0 1,122.8 1,246.3 1,346.8 1,328.0 1,379.4 1,478.8 1,564.2 Marine Mode 1,895.7 1,695.1 1,747.1 1,778.5 1,782.1 2,582.8 2,467.9 2,652.4 3,965.8 3,489.2 Rail Mode 655.6 621.5 554.3 557.4 536.7 599.2 482.4 497.1 710.4 708.9 Road Mode 14,360.1 13,194.1 13,141.2 14,900.2 14,836.0 18,036.7 17,588.4 18,964.4 16,242.1 17,923.9 Transit 3,195.3 3,256.3 6,409.0 7,305.9 7,479.0 4,247.9 4,151.6 5,763.3 6,092.0 6,855.7Other Modes 1,243.7 1,269.9 1,435.7 1,421.6 1,657.9 1,768.4 1,472.9 1,399.4 1,351.8 1,564.1 Sub-Total 22,496.7 21,070.0 24,263.4 27,086.4 27,538.0 28,581.8 27,491.1 30,656.1 29,840.9 32,106.0
Federal RevenuesAir Mode 1,129.7 1,193.9 1,238.2 1,271.2 1,322.2 1,339.3 1,461.9 1,536.9 1,665.2 1,573.2 Marine Mode 81.1 84.1 142.0 158.4 142.2 217.5 258.7 184.9 320.1 552.1 Rail Mode 13.8 15.5 16.8 19.6 17.5 17.8 17.4 21.9 22.1 27.1 Road Mode 9,690.9 9,901.3 10,133.5 10,479.6 10,668.4 10,656.8 11,041.2 11,700.0 11,959.5 12,053.6 Transit 0.0 0.0 0.0 0.0 0.0 0.1 0.0 0.2 0.3 0.3 Other Modes 1,173.4 1,179.4 1,176.1 1,227.2 1,313.8 1,329.5 1,263.4 1,360.1 1,400.5 1,403.9 Sub-Total 12,088.9 12,374.1 12,706.6 13,156.0 13,464.1 13,560.9 14,042.7 14,804.0 15,367.7 15,610.1
Provincial/Territorial RevenuesAir Mode 86.1 111.0 115.7 119.9 124.1 133.7 141.0 168.0 177.7 178.0 Marine Mode 0.0 0.0 0.0 0.0 20.8 22.3 25.2 57.0 62.3 50.0 Rail Mode 0.0 0.0 0.0 11.4 11.5 11.2 10.6 11.0 11.9 11.5 Road Mode3 18,507.4 19,864.1 20,626.2 22,036.3 22,760.9 23,838.9 25,199.0 26,520.6 27,097.6 27,378.3 Transit 40.0 943.3 977.3 1,144.6 1,164.8 992.6 1,029.8 1,289.9 1,285.5 1,212.0 Other Modes 87.4 122.9 125.3 121.1 121.2 170.9 199.6 615.9 512.9 409.6 Sub-Total 18,720.9 21,041.3 21,844.5 23,433.4 24,203.2 25,169.6 26,605.1 28,662.5 29,148.0 29,239.3
Total Revenues: Federal plus Provincial/Territorial Government LevelsAir Mode 1,215.8 1,304.9 1,353.9 1,391.1 1,446.3 1,473.0 1,602.9 1,704.9 1,842.9 1,751.1 Marine Mode 81.1 84.1 142.0 158.4 163.0 239.8 283.9 241.9 382.5 602.1 Rail Mode 13.8 15.5 16.8 31.0 29.0 29.1 28.0 32.9 34.0 38.6 Road Mode 28,198.3 29,765.4 30,759.8 32,516.0 33,429.3 34,495.7 36,240.2 38,220.6 39,057.1 39,431.9 Transit4 40.0 943.3 977.3 1,144.6 1,164.8 992.7 1,029.8 1,290.1 1,285.8 1,212.3 Other Modes 1,260.8 1,302.3 1,301.4 1,348.3 1,435.0 1,500.4 1,463.0 1,976.1 1,913.4 1,813.5 Sub-Total 30,809.8 33,415.5 34,551.1 36,589.4 37,667.3 38,730.5 40,647.8 43,466.5 44,515.6 44,849.5
Notes: R= Revised, P= Preliminary
1. Tax expenditures are also included.2. Excludes estimated transportation-related transfer payments received (as reported by provincial/territorial respondents).3. Some provinces/territories were unable to split out road versus non-road fuel tax revenues. In these cases, all fuel tax revenues were allocated to the road mode.4. Transit revenues and expenses for Quebec have been adjusted to reflect transfers (in/out) for 2016/17 - 2018/19. Sources: Survey responses from provincial/territorial governments and selected federal government departments and agencies; Public Accounts; Departmental Performance
Reports (including supplementary tables); Department of Finance tax expenditure reports; Statistics Canada data. Some amounts have been imputed for non-response/missing data. For detailed results, see tables G3, G4 and G6.

StatiStical addendum2020
government Spending and revenueS on tranSportation
23 202023
Table G3: Detailed Federal Transport Expenditures, by Mode and by Department/Agency, 2010/11 - 2019/20201 (cont)
(Millions of dollars)
2010/11 2011/12 2012/13 2013/14 2014/15 2015/16 2016/17 2017/18R 2018/19R 2019/20P
AIR MODETransport Canada2
Operating 283.2 272.6 238.7 238.0 256.4 242.1 219.1 241.8 246.9 261.5Capital 7.9 5.0 3.8 4.4 7.8 11.2 5.0 11.7 9.9 15.6Transfer payments 10.9 31.8 31.3 13.0 0.2 0.2 0.2 0.2 0.1 0.1Gross expenditures 302.1 309.4 273.8 255.5 264.4 253.4 224.2 253.8 256.9 277.3
Transportation Safety Board3
Operating 14.3 14.4 13.7 14.7 15.0 13.1 12.9 0.0 0.0 0.0Gross expenditures 14.3 14.4 13.7 14.7 15.0 13.1 12.9 0.0 0.0 0.0
Canadian Air Transport Security AuthorityOperating 573.1 515.0 513.4 559.1 623.9 656.7 725.3 723.4 817.8 847.9Gross expenditures 573.1 515.0 513.4 559.1 623.9 656.7 725.3 723.4 817.8 847.9
Infrastructure CanadaTransfer payments 39.4 6.9 0.3 0.0 0.9 1.3 6.9 6.0 3.3 6.6Gross expenditures 39.4 6.9 0.3 0.0 0.9 1.3 6.9 6.0 3.3 6.6
Environment and Climate Change Canada Capital 0.0 0.0 0.0 0.0 0.6 4.7 3.1 0.0 8.0 12.0Gross expenditures 0.0 0.0 0.0 0.0 0.6 4.7 3.1 0.0 8.0 12.0
Public Services and Procurement CanadaOperating 0.0 0.0 9.2 1.0 16.9 11.6 12.8 21.1 21.4 37.5Gross expenditures 0.0 0.0 9.2 1.0 16.9 11.6 12.8 21.1 21.4 37.5
Atlantic Canada Opportunities AgencyTransfer payments 1.2 0.3 0.2 0.1 1.0 2.2 1.3 1.1 2.0 6.9Gross expenditures 1.2 0.3 0.2 0.1 1.0 2.2 1.3 1.1 2.0 6.9
Economic Development Agency of Canada for the Regions of QuebecTransfer payments 1.8 1.0 0.0 2.6 0.0 2.3 1.8 4.0 0.2 0.0Gross expenditures 1.8 1.0 0.0 2.6 0.0 2.3 1.8 4.0 0.2 0.0
FedDev Ontario (federal economic development agency for Southern Ontario)Transfer payments 0.0 0.0 0.0 0.8 0.8 1.9 3.2 4.8 9.0 5.7Gross expenditures 0.0 0.0 0.0 0.8 0.8 1.9 3.2 4.8 9.0 5.7
FedNor (federal economic development agency for Northern Ontario)Transfer payments 0.8 0.5 0.6 1.2 1.3 1.0 0.4 0.4 0.9 1.1Gross expenditures 0.8 0.5 0.6 1.2 1.3 1.0 0.4 0.4 0.9 1.1
Western Economic DiversificationTransfer payments 0.3 0.2 0.0 0.4 0.1 0.0 0.9 8.7 8.4 11.0Gross expenditures 0.3 0.2 0.0 0.4 0.1 0.0 0.9 8.7 8.4 11.0
Canadian Northern Economic Development AgencyTransfer payments 1.3 0.0 0.0 0.0 0.0 0.0 0.0 0.0 0.2 0.0Gross expenditures 1.3 0.0 0.0 0.0 0.0 0.0 0.0 0.0 0.2 0.0
Statistics CanadaOperating 0.0 0.0 0.0 1.4 1.8 1.9 1.7 2.4 2.0 2.6Gross expenditures 0.0 0.0 0.0 1.4 1.8 1.9 1.7 2.4 2.0 2.6
National Research Council CanadaOperating 0.0 0.0 0.0 19.4 24.9 22.5 16.8 20.0 17.8 20.1Capital 0.0 0.0 0.0 8.0 8.3 7.4 10.7 9.2 7.4 5.2Transfer payments 0.0 0.0 0.0 0.1 0.4 0.8 0.3 0.1 0.0 0.2Gross expenditures 0.0 0.0 0.0 27.5 33.7 30.7 27.8 29.3 25.2 25.4
Natural Sciences and Engineering Research CouncilTransfer payments 0.0 0.0 0.0 20.8 24.4 22.8 25.8 26.4 28.2 27.6Gross expenditures 0.0 0.0 0.0 20.8 24.4 22.8 25.8 26.4 28.2 27.6
Total (federal government departments and agencies)Operating 870.7 802.1 775.0 833.6 938.9 948.0 988.7 1,008.8 1,105.9 1,169.6Capital 7.9 5.0 3.8 12.5 16.7 23.3 18.8 20.9 25.3 32.8Transfer payments 55.8 40.6 32.4 39.1 29.1 32.5 40.8 51.8 52.5 59.2Gross expenditures 934.4 847.7 811.2 885.1 984.8 1,003.8 1,048.2 1,081.5 1,183.7 1,261.6
Table G3 continues on the next page
StatiStical addendum

tranSportation in canada2020
government Spending and revenueS on tranSportation
24
MARINE MODE
Transport Canada2
Operating 111.3 104.3 97.3 96.3 112.4 102.2 89.5 122.4 148.5 150.9Capital 2.6 2.1 1.2 2.7 3.7 5.9 6.0 6.2 5.1 16.7Transfer payments 3.9 1.8 0.7 0.5 5.1 9.4 12.6 4.4 8.8 23.8Gross expenditures 117.8 108.2 99.2 99.5 121.2 117.6 108.1 133.0 162.4 191.4
Transportation Safety Board3
Operating 4.5 4.6 5.8 5.5 4.9 5.2 5.0 0.0 0.0 0.0Gross expenditures 4.5 4.6 5.8 5.5 4.9 5.2 5.0 0.0 0.0 0.0
Department of Finance CanadaTransfer payments 0.1 0.0 0.0 0.0 0.0 0.0 0.0 0.0 0.0 0.0Gross expenditures 0.1 0.0 0.0 0.0 0.0 0.0 0.0 0.0 0.0 0.0
Marine AtlanticOperating 210.9 183.3 184.9 154.4 127.5 350.9 99.0 146.7 125.9 130.9Gross expenditures 210.9 183.3 184.9 154.4 127.5 350.9 99.0 146.7 125.9 130.9
Infrastructure CanadaTransfer payments 114.7 20.8 4.5 1.0 1.7 4.1 15.1 18.3 56.3 45.9Gross expenditures 114.7 20.8 4.5 1.0 1.7 4.1 15.1 18.3 56.3 45.9
Canadian Coast GuardOperating 567.1 539.4 562.4 620.0 529.9 652.3 700.5 782.7 869.6 978.6Capital 248.2 187.8 219.2 200.6 241.9 450.3 423.3 483.5 1,046.4 460.1Transfer payments 5.2 11.5 10.5 5.1 5.1 5.6 5.6 8.2 11.2 13.9Gross expenditures 820.5 738.7 792.1 825.7 776.9 1,108.2 1,129.5 1,274.4 1,927.3 1,452.6
Department of Fisheries and Oceans - Small Craft HarboursOperating 112.4 102.5 67.4 61.7 63.7 50.2 56.8 50.8 68.3 97.1Capital 86.8 51.9 40.8 32.0 37.5 165.4 234.9 156.9 96.0 124.4Transfer payments 7.2 9.2 7.1 5.0 3.2 2.3 4.5 3.4 4.0 9.2Gross expenditures 206.4 163.6 115.3 98.7 104.5 217.9 296.2 211.1 168.3 230.8
Parks Canada Agency Operating 5.5 6.4 8.2 13.3 32.2 32.8 30.5 32.1 37.6 34.8Capital 8.3 6.1 1.2 10.2 20.9 54.1 92.0 126.5 194.1 286.8Gross expenditures 13.8 12.5 9.3 23.5 53.1 86.9 122.5 158.6 231.7 321.6
Public Services and Procurement CanadaOperating 0.0 0.0 60.1 99.6 59.8 135.2 177.2 98.9 229.0 339.6Capital 0.0 0.0 1.3 0.3 0.5 0.3 0.6 2.0 0.0 2.3Gross expenditures 0.0 0.0 61.4 99.9 60.3 135.5 177.8 100.9 229.0 341.9
Atlantic Canada Opportunities AgencyTransfer payments 0.3 1.2 1.0 2.5 4.8 5.1 8.5 3.6 10.1 6.4Gross expenditures 0.3 1.2 1.0 2.5 4.8 5.1 8.5 3.6 10.1 6.4
Economic Development Agency of Canada for the Regions of QuebecTransfer payments 3.2 2.2 3.9 4.6 0.1 0.1 1.0 1.1 0.0 0.0Gross expenditures 3.2 2.2 3.9 4.6 0.1 0.1 1.0 1.1 0.0 0.0
FedDev Ontario (federal economic development agency for Southern Ontario)Transfer payments 0.0 0.0 0.0 2.4 0.1 0.0 0.1 0.2 0.0 0.0Gross expenditures 0.0 0.0 0.0 2.4 0.1 0.0 0.1 0.2 0.0 0.0
FedNor (federal economic development agency for Northern Ontario)Transfer payments 2.5 0.0 0.6 0.6 0.5 2.4 0.6 0.4 0.6 0.8Gross expenditures 2.5 0.0 0.6 0.6 0.5 2.4 0.6 0.4 0.6 0.8
Western Economic DiversificationTransfer payments 0.0 0.6 1.3 5.5 5.3 3.9 1.7 2.4 1.1 3.1Gross expenditures 0.0 0.6 1.3 5.5 5.3 3.9 1.7 2.4 1.1 3.1
Canadian Northern Economic Development AgencyTransfer payments 0.1 0.1 0.0 0.0 0.0 0.0 0.0 0.0 0.0 0.0Gross expenditures 0.1 0.1 0.0 0.0 0.0 0.0 0.0 0.0 0.0 0.0
Statistics CanadaOperating 0.0 0.0 0.0 0.0 0.0 0.0 0.4 0.5 0.1 0.0Gross expenditures 0.0 0.0 0.0 0.0 0.0 0.0 0.4 0.5 0.1 0.0
2010/11 2011/12 2012/13 2013/14 2014/15 2015/16 2016/17 2017/18R 2018/19R 2019/20P
Table G3 continues on the next page

StatiStical addendum2020
government Spending and revenueS on tranSportation
25 202025
Table G3 continues on the next page
National Research Council CanadaOperating 0.0 0.0 0.0 5.3 5.8 5.7 6.1 7.7 6.0 2.8Capital 0.0 0.0 0.0 0.2 0.2 0.3 0.3 0.1 0.2 0.1Transfer payments 0.0 0.0 0.0 0.1 0.1 0.3 0.0 0.0 0.2 0.0Gross expenditures 0.0 0.0 0.0 5.6 6.2 6.3 6.4 7.9 6.3 3.0
Natural Sciences and Engineering Research CouncilTransfer payments 0.0 0.0 0.0 0.1 0.1 0.1 0.1 0.1 1.0 0.6Gross expenditures 0.0 0.0 0.0 0.1 0.1 0.1 0.1 0.1 1.0 0.6
Total (federal government departments and agencies)Operating 1,011.7 940.4 986.1 1,056.0 936.3 1,334.4 1,164.9 1,241.8 1,485.1 1,734.7Capital 346.0 248.0 263.8 246.0 304.7 676.3 757.1 775.3 1,341.7 890.3Transfer payments 137.1 47.3 29.6 27.5 26.3 33.4 50.0 42.2 93.2 103.8Gross expenditures 1,494.8 1,235.7 1,279.5 1,329.5 1,267.2 2,044.2 1,972.1 2,059.2 2,920.0 2,728.9
RAIL MODE
Transport Canada2
Operating 20.7 21.2 20.7 21.7 25.4 100.3 22.3 29.0 26.8 63.8Capital 2.5 2.6 1.3 0.4 1.3 1.1 1.1 1.2 1.1 1.9Transfer payments 8.0 9.0 12.4 7.4 8.8 9.3 9.7 16.3 18.4 18.1Gross expenditures 31.1 32.8 34.4 29.5 35.5 110.8 33.1 46.4 46.3 83.7
Transportation Safety Board3
Operating 4.6 5.1 4.7 6.9 6.1 5.7 5.8 0.0 0.0 0.0Gross expenditures 4.6 5.1 4.7 6.9 6.1 5.7 5.8 0.0 0.0 0.0
VIA Rail CanadaOperating 527.2 493.8 420.0 405.7 406.2 365.5 348.4 357.5 496.2 506.3Gross expenditures 527.2 493.8 420.0 405.7 406.2 365.5 348.4 357.5 496.2 506.3
Infrastructure CanadaTransfer payments 13.5 9.2 10.1 3.6 0.0 11.6 0.1 0.0 0.0 0.0Gross expenditures 13.5 9.2 10.1 3.6 0.0 11.6 0.1 0.0 0.0 0.0
Economic Development Agency of Canada for the Regions of QuebecTransfer payments 4.7 2.5 0.9 0.1 0.0 0.1 0.1 0.1 0.1 0.3Gross expenditures 4.7 2.5 0.9 0.1 0.0 0.1 0.1 0.1 0.1 0.3
FedDev Ontario (federal economic development agency for Southern Ontario)Transfer payments 0.0 0.0 0.0 0.3 0.0 1.8 2.1 2.9 3.3 0.0Gross expenditures 0.0 0.0 0.0 0.3 0.0 1.8 2.1 2.9 3.3 0.0
FedNor (federal economic development agency for Northern Ontario)Transfer payments 0.0 0.0 0.0 0.0 0.0 0.0 0.1 0.0 0.0 0.0Gross expenditures 0.0 0.0 0.0 0.0 0.0 0.0 0.1 0.0 0.0 0.0
Western Economic DiversificationTransfer payments 0.0 0.5 0.1 0.2 0.0 0.0 0.8 0.5 64.1 20.3Gross expenditures 0.0 0.5 0.1 0.2 0.0 0.0 0.8 0.5 64.1 20.3
Statistics CanadaOperating 0.0 0.0 0.0 0.2 0.2 0.4 0.4 0.3 0.5 0.4Gross expenditures 0.0 0.0 0.0 0.2 0.2 0.4 0.4 0.3 0.5 0.4
National Research Council CanadaOperating 0.0 0.0 0.0 1.8 2.6 3.2 4.3 4.2 3.1 4.3Gross expenditures 0.0 0.0 0.0 1.8 2.6 3.2 4.3 4.2 3.1 4.3
Natural Sciences and Engineering Research CouncilTransfer payments 0.0 0.0 0.0 0.7 0.8 0.6 1.1 1.0 1.3 1.4Gross expenditures 0.0 0.0 0.0 0.7 0.8 0.6 1.1 1.0 1.3 1.4
Total (federal government departments and agencies)Operating 552.5 520.1 445.4 436.2 440.6 475.2 381.2 391.0 526.7 574.9Capital 2.5 2.6 1.3 0.4 1.3 1.1 1.1 1.2 1.1 1.9Transfer payments 26.1 21.3 23.4 12.3 9.6 23.4 14.0 20.6 87.2 40.1Gross expenditures 581.0 544.0 470.1 448.8 451.5 499.7 396.3 412.9 615.0 616.8
Table G3: Detailed Federal Transport Expenditures, by Mode and by Department/Agency, 2010/11 - 2019/20201 (cont)
(Millions of dollars)
2010/11 2011/12 2012/13 2013/14 2014/15 2015/16 2016/17 2017/18R 2018/19R 2019/20P
StatiStical addendum

tranSportation in canada2020
government Spending and revenueS on tranSportation
26
Table G3 continues on the next page
ROAD MODE
Transport Canada2
Operating 25.5 22.5 19.6 21.4 21.2 19.6 20.1 21.5 47.8 67.4Capital 12.7 1.9 2.8 4.6 3.7 2.5 2.4 1.2 1.7 3.0Transfer payments 9.1 4.7 4.4 4.4 4.4 3.0 3.5 3.3 53.1 0.0Gross expenditures 47.3 29.0 26.9 30.5 29.4 25.2 26.0 26.0 102.6 70.4
Department of Finance CanadaTransfer payments 15.1 10.1 10.1 10.1 10.1 10.1 10.1 11.3 15.1 15.1Gross expenditures 15.1 10.1 10.1 10.1 10.1 10.1 10.1 11.3 15.1 15.1
Infrastructure CanadaOperating 0.0 0.0 0.0 0.0 25.8 19.4 8.5 72.8 9.6 28.0Capital 0.0 0.0 0.0 0.0 14.9 46.9 19.7 568.1 109.1 1,204.9Transfer payments 1,935.5 915.8 749.0 247.0 298.9 296.3 248.7 292.6 496.1 572.4Gross expenditures 1,935.5 915.8 749.0 247.0 339.6 362.6 276.9 933.5 614.8 1,805.3
Federal Bridge CorporationOperating 0.4 14.0 18.2 13.2 8.1 20.1 41.8 20.0 3.5 0.0Gross expenditures 0.4 14.0 18.2 13.2 8.1 20.1 41.8 20.0 3.5 0.0
The Jacques Cartier and Champlain BridgesOperating 90.0 97.3 109.1 151.6 245.0 247.3 284.3 133.0 116.4 106.7Capital 0.0 0.0 0.0 0.0 0.0 0.0 0.0 46.3 50.4 48.9Gross expenditures 90.0 97.3 109.1 151.6 245.0 247.3 284.3 179.2 166.8 155.6
Windsor-Detroit Bridge AuthorityOperating 0.0 0.0 0.0 0.0 8.1 138.5 334.5 64.0 146.0 126.2Capital 0.0 0.0 0.0 0.0 0.0 0.0 0.0 120.0 184.5 441.3Gross expenditures 0.0 0.0 0.0 0.0 8.1 138.5 334.5 184.0 330.5 567.6
Natural Resources CanadaOperating 0.0 0.0 0.0 0.0 7.8 9.8 10.8 10.4 12.8 12.8Capital 0.0 0.0 0.0 0.0 0.0 2.4 4.4 1.8 1.8 1.8Transfer payments 0.0 0.0 0.0 0.0 6.2 4.4 6.6 34.0 22.8 22.8Gross expenditures 0.0 0.0 0.0 0.0 14.0 16.6 21.8 46.2 37.4 37.4
Indigenous and Northern Affairs CanadaOperating 0.3 0.3 0.1 0.0 0.0 0.0 0.0 0.1 0.2 0.1Capital 0.0 0.0 0.0 0.0 0.0 0.0 0.0 0.9 3.6 2.9Transfer payments 100.1 107.2 96.9 81.2 112.9 119.5 154.5 175.6 139.8 128.6Gross expenditures 100.4 107.5 97.0 81.2 113.0 119.6 154.5 176.6 143.6 131.6
National Capital CommissionOperating 1.4 1.4 2.0 5.0 3.9 4.7 0.0 0.0 0.0 0.7Capital 0.8 0.8 1.0 0.0 0.0 0.0 5.6 4.7 6.9 26.3Gross expenditures 2.2 2.2 3.0 5.0 3.9 4.7 5.6 4.7 6.9 26.9
Parks Canada Agency Operating 35.4 29.1 33.0 51.2 28.0 26.1 32.3 31.5 41.0 29.8Capital 101.3 53.5 41.9 34.7 69.0 188.8 201.0 209.9 147.3 121.0Transfer payments 0.0 0.0 0.0 0.0 0.0 0.0 0.0 0.1 0.3 0.0Gross expenditures 136.7 82.7 74.9 85.9 97.0 214.9 233.3 241.5 188.6 150.8
Public Services and Procurement CanadaOperating 35.4 30.3 48.5 51.0 56.4 102.8 98.1 97.8 76.6 51.7Capital 53.4 25.4 27.0 14.7 16.4 35.2 36.0 0.0 0.0 0.0Gross expenditures 88.8 55.6 75.5 65.7 72.8 138.0 134.1 97.8 76.6 51.7
PPP CanadaCapital 0.0 22.2 1.7 0.0 0.0 0.0 0.0 0.0 0.0 0.0Gross expenditures 0.0 22.2 1.7 0.0 0.0 0.0 0.0 0.0 0.0 0.0
Atlantic Canada Opportunities AgencyTransfer payments 0.0 0.1 0.1 1.6 2.4 4.3 3.3 3.8 3.3 8.5Gross expenditures 0.0 0.1 0.1 1.6 2.4 4.3 3.3 3.8 3.3 8.5
Economic Development Agency of Canada for the Regions of QuebecTransfer payments 0.2 0.0 0.0 0.0 2.9 1.4 0.5 1.3 0.0 0.1Gross expenditures 0.2 0.0 0.0 0.0 2.9 1.4 0.5 1.3 0.0 0.1
FedDev Ontario (federal economic development agency for Southern Ontario)Transfer payments 0.0 0.0 0.0 4.9 0.0 17.1 15.2 8.7 11.2 16.0Gross expenditures 0.0 0.0 0.0 4.9 0.0 17.1 15.2 8.7 11.2 16.0
2010/11 2011/12 2012/13 2013/14 2014/15 2015/16 2016/17 2017/18R 2018/19R 2019/20P

StatiStical addendum2020
government Spending and revenueS on tranSportation
27 202027
Table G3 continues on the next page
FedNor (federal economic development agency for Northern Ontario)Transfer payments 0.0 0.2 0.3 0.1 0.3 0.2 0.8 0.5 0.2 0.4Gross expenditures 0.0 0.2 0.3 0.1 0.3 0.2 0.8 0.5 0.2 0.4
Western Economic DiversificationTransfer payments 0.0 0.0 0.0 0.0 0.2 0.1 0.3 3.5 1.8 11.2Gross expenditures 0.0 0.0 0.0 0.0 0.2 0.1 0.3 3.5 1.8 11.2
Canadian Northern Economic Development AgencyOperating 0.0 0.0 0.0 0.0 0.0 0.0 0.0 0.0 0.0 0.1Capital 0.0 0.0 0.0 0.0 0.0 0.0 0.0 0.0 0.1 0.1Transfer payments 3.6 0.3 0.6 0.6 1.0 0.3 1.8 0.6 0.5 1.6Gross expenditures 3.6 0.3 0.6 0.6 1.0 0.3 1.8 0.7 0.6 1.8
Statistics CanadaOperating 0.0 0.0 0.0 1.6 2.0 1.9 1.5 2.4 2.5 2.1Gross expenditures 0.0 0.0 0.0 1.6 2.0 1.9 1.5 2.4 2.5 2.1
National Research Council CanadaOperating 0.0 0.0 0.0 20.2 19.8 19.2 20.9 21.9 17.8 16.1Capital 0.0 0.0 0.0 4.5 7.3 5.7 7.3 2.5 4.6 3.7Transfer payments 0.0 0.0 0.0 0.2 0.2 0.2 0.0 0.0 0.7 0.4Gross expenditures 0.0 0.0 0.0 24.9 27.3 25.1 28.3 24.4 23.0 20.2
Natural Sciences and Engineering Research CouncilTransfer payments 0.0 0.0 0.0 28.5 29.6 23.6 29.8 28.9 30.6 30.9Gross expenditures 0.0 0.0 0.0 28.5 29.6 23.6 29.8 28.9 30.6 30.9
Total (federal government departments and agencies)Operating 188.4 194.9 230.5 315.3 426.0 609.5 852.8 475.4 474.1 441.7Capital 168.2 103.7 74.4 58.6 111.3 281.5 276.5 955.4 509.9 1,853.9Transfer payments 2,063.6 1,038.3 861.5 378.6 469.1 480.6 475.0 564.3 775.3 807.9Gross expenditures 2,420.1 1,336.9 1,166.4 752.4 1,006.4 1,371.6 1,604.2 1,995.1 1,759.4 31,03.4
TRANSIT
Department of Finance CanadaTransfer payments 320.0 332.5 345.0 362.5 373.8 386.3 371.3 212.5 221.3 227.5Gross expenditures 320.0 332.5 345.0 362.5 373.8 386.3 371.3 212.5 221.3 227.5
Infrastructure CanadaTransfer payments 829.3 718.5 430.7 482.3 376.7 433.3 440.7 426.0 1,333.4 1,063.7Gross expenditures 829.3 718.5 430.7 482.3 376.7 433.3 440.7 426.0 1,333.4 1,063.7
Natural Resources CanadaTransfer payments 0.0 0.0 0.0 0.0 0.0 0.0 0.0 1.2 1.0 1.0Gross expenditures 0.0 0.0 0.0 0.0 0.0 0.0 0.0 1.2 1.0 1.0
FedDev Ontario (federal economic development agency for Southern Ontario)Transfer payments 0.0 0.0 0.0 0.3 0.0 0.0 0.0 0.0 0.0 0.0Gross expenditures 0.0 0.0 0.0 0.3 0.0 0.0 0.0 0.0 0.0 0.0
Western Economic DiversificationTransfer payments 0.0 0.0 0.0 0.0 0.0 0.0 0.0 0.0 0.0 0.1Gross expenditures 0.0 0.0 0.0 0.0 0.0 0.0 0.0 0.0 0.0 0.1
Statistics CanadaOperating 0.0 0.0 0.0 0.5 0.5 0.6 0.5 0.4 0.6 0.5Gross expenditures 0.0 0.0 0.0 0.5 0.5 0.6 0.5 0.4 0.6 0.5
National Research Council CanadaTransfer payments 0.0 0.0 0.0 0.0 0.0 0.0 0.0 0.0 0.2 0.0Gross expenditures 0.0 0.0 0.0 0.0 0.0 0.0 0.0 0.0 0.2 0.0
Natural Sciences and Engineering Research CouncilTransfer payments 0.0 0.0 0.0 0.6 0.4 0.4 1.1 0.8 1.6 2.6Gross expenditures 0.0 0.0 0.0 0.6 0.4 0.4 1.1 0.8 1.6 2.6
Total (federal government departments and agencies)Operating 0.0 0.0 0.0 0.5 0.5 0.6 0.5 0.4 0.6 0.5Transfer payments 1149.3 1051.0 775.7 845.7 750.8 820.0 813.1 640.5 1,557.4 1,294.9Gross expenditures 11,49.3 1,051.0 775.7 846.2 751.4 820.5 813.6 640,9 1,557.0 1,295.3
Table G3: Detailed Federal Transport Expenditures, by Mode and by Department/Agency, 2010/11 - 2019/20201 (cont)
(Millions of dollars)
2010/11 2011/12 2012/13 2013/14 2014/15 2015/16 2016/17 2017/18R 2018/19R 2019/20P
StatiStical addendum

tranSportation in canada2020
government Spending and revenueS on tranSportation
28
Table G3 continues on the next page
OTHER MODES
Transport Canada Operating 442.2 453.1 377.6 449.0 508.0 478.3 444.6 480.7 453.5 430.6Capital 58.7 57.5 49.0 63.5 107.6 98.4 75.1 77.3 87.9 95.4Transfer payments 379.0 379.4 559.2 501.0 628.3 569.0 353.2 252.8 195.7 445.0Gross expenditures 880.0 890.0 985.8 1,013.6 1,243.9 1,145.8 872.9 810.8 737.1 971.0
Canadian Transportation AgencyOperating 28.8 29.3 28.7 29.0 28.8 28.3 26.9 29.1 33.1 35.3Gross expenditures 28.8 29.3 28.7 29.0 28.8 28.3 26.9 29.1 33.1 35.3
Transportation Appeal Tribunal of CanadaOperating 1.7 1.9 1.6 1.2 0.4 0.2 0.3 0.3 0.4 0.4Gross expenditures 1.7 1.9 1.6 1.2 0.4 0.2 0.3 0.3 0.4 0.4
Transportation Safety BoardOperating 0.0 0.0 0.0 0.0 0.0 5.7 6.0 32.4 32.1 35.7Gross expenditures 0.0 0.0 0.0 0.0 0.0 5.7 6.0 32.4 32.1 35.7
Infrastructure CanadaTransfer payments 0.0 0.0 0.1 0.0 0.0 0.0 0.0 0.0 0.0 0.0Gross expenditures 0.0 0.0 0.1 0.0 0.0 0.0 0.0 0.0 0.0 0.0
Environment and Climate Change Canada Operating 0.0 0.0 0.0 19.2 23.2 23.0 19.4 25.2 25.2 24.9Capital 0.0 0.0 0.0 2.9 1.3 0.6 1.3 0.5 3.3 0.8Transfer payments 0.0 0.0 0.0 0.6 0.5 0.5 0.2 0.4 0.3 0.2Gross expenditures 0.0 0.0 0.0 22.7 25.0 24.1 20.9 26.1 28.8 25.9
Indigenous and Northern Affairs CanadaTransfer payments 0.0 0.0 0.0 0.0 0.0 0.0 0.0 0.0 0.0 1.5Gross expenditures 0.0 0.0 0.0 0.0 0.0 0.0 0.0 0.0 0.0 1.5
Public Services and Procurement CanadaOperating 0.0 0.0 0.0 0.0 0.0 0.0 0.3 0.2 0.4 0.0Gross expenditures 0.0 0.0 0.0 0.0 0.0 0.0 0.3 0.2 0.4 0.0
Atlantic Canada Opportunities AgencyTransfer payments 0.4 0.6 0.5 0.1 0.1 2.3 0.0 0.1 0.0 1.5Gross expenditures 0.4 0.6 0.5 0.1 0.1 2.3 0.0 0.1 0.0 1.5
Economic Development Agency of Canada for the Regions of QuebecTransfer payments 0.0 0.0 0.0 0.0 0.0 0.0 0.1 0.1 0.0 0.0Gross expenditures 0.0 0.0 0.0 0.0 0.0 0.0 0.1 0.1 0.0 0.0
FedDev Ontario (federal economic development agency for Southern Ontario)Transfer payments 0.0 0.0 0.0 1.9 6.3 11.6 0.0 0.0 1.6 7.3Gross expenditures 0.0 0.0 0.0 1.9 6.3 11.6 0.0 0.0 1.6 7.3
FedNor (federal economic development agency for Northern Ontario)Transfer payments 0.0 0.0 0.0 0.0 0.0 0.0 0.3 0.2 0.1 0.4Gross expenditures 0.0 0.0 0.0 0.0 0.0 0.0 0.3 0.2 0.1 0.4
Western Economic DiversificationTransfer payments 0.9 0.5 0.8 0.3 0.9 0.1 0.0 0.6 5.3 5.1Gross expenditures 0.9 0.5 0.8 0.3 0.9 0.1 0.0 0.6 5.3 5.1
Statistics CanadaOperating 0.0 0.0 0.0 0.5 0.6 0.3 0.1 1.0 1.3 0.0Gross expenditures 0.0 0.0 0.0 0.5 0.6 0.3 0.1 1.0 1.3 0.0
National Research Council CanadaTransfer payments 0.0 0.0 0.0 0.1 0.1 0.0 0.0 0.0 0.2 0.1Gross expenditures 0.0 0.0 0.0 0.1 0.1 0.0 0.0 0.0 0.2 0.1
Natural Sciences and Engineering Research CouncilOperating 0.0 0.0 0.0 2.4 2.5 2.1 2.4 2.5 2.6 2.9Gross expenditures 0.0 0.0 0.0 2.4 2.5 2.1 2.4 2.5 2.6 2.9
Total (federal government departments and agencies)Operating 472.8 484.2 407.9 501.2 563.5 537.8 500.1 571.5 548.7 529.7Capital 58.7 57.5 49.0 66.4 108.9 99.0 76.4 77.8 91.2 96.2Transfer payments 380.3 380.5 560.5 504.0 636.2 583.5 353.9 254.2 203.1 461.1Gross expenditures 911.8 922.3 1,017.4 1,071.7 1,308.7 1,220.4 930.4 903.5 843.0 1,087.1
2010/11 2011/12 2012/13 2013/14 2014/15 2015/16 2016/17 2017/18R 2018/19R 2019/20P

StatiStical addendum2020
government Spending and revenueS on tranSportation
29 202029
Table G3 continues on the next page
TOTAL (ALL MODES)
Transport Canada2
Operating 882.9 873.6 753.9 826.5 923.4 942.5 795.6 895.4 923.5 974.2Capital 84.4 69.2 58.2 75.6 124.1 119.2 89.6 97.6 105.6 132.6Transfer payments 411.0 426.7 608.0 526.4 646.9 591.0 379.2 277.0 276.1 487.0Gross expenditures 1,378.3 1,369.4 1,420.1 1,428.5 1,694.3 1,652.7 1,264.4 1,270.0 1,305.2 1,593.8
Canadian Transportation AgencyOperating 28.8 29.3 28.7 29.0 28.8 28.3 26.9 29.1 33.1 35.3Gross expenditures 28.8 29.3 28.7 29.0 28.8 28.3 26.9 29.1 33.1 35.3
Transportation Appeal Tribunal of Canada4
Operating 1.7 1.9 1.6 1.2 0.4 0.2 0.3 0.3 0.4 0.4Gross expenditures 1.7 1.9 1.6 1.2 0.4 0.2 0.3 0.3 0.4 0.4
Transportation Safety Board3
Operating 23.4 24.2 24.2 27.0 26.1 29.7 29.7 32.4 32.1 35.7Gross expenditures 23.4 24.2 24.2 27.0 26.1 29.7 29.7 32.4 32.1 35.7
Department of Finance Canada5
Transfer payments 335.2 342.6 355.1 372.6 383.8 396.3 381.3 223.8 236.3 242.6Gross expenditures 335.2 342.6 355.1 372.6 383.8 396.3 381.3 223.8 236.3 242.6
Canadian Air Transport Security AuthorityOperating 573.1 515.0 513.4 559.1 623.9 656.7 725.3 723.4 817.8 847.9Gross expenditures 573.1 515.0 513.4 559.1 623.9 656.7 725.3 723.4 817.8 847.9
Marine AtlanticOperating 210.9 183.3 184.9 154.4 127.5 350.9 99.0 146.7 125.9 130.9Gross expenditures 210.9 183.3 184.9 154.4 127.5 350.9 99.0 146.7 125.9 130.9
VIA Rail CanadaOperating 527.2 493.8 420.0 405.7 406.2 365.5 348.4 357.5 496.2 506.3Gross expenditures 527.2 493.8 420.0 405.7 406.2 365.5 348.4 357.5 496.2 506.3
Infrastructure CanadaOperating 0.0 0.0 0.0 0.0 25.8 19.4 8.5 72.8 9.6 28.0Capital 0.0 0.0 0.0 0.0 14.9 46.9 19.7 568.1 109.1 1,204.9Transfer payments 2,932.4 1,671.1 1,194.7 733.9 678.2 746.6 711.6 742.9 1,889.1 1,688.6Gross expenditures 2,932.4 1,671.1 1,194.7 733.9 718.9 812.9 739.8 1383.8 2,007.8 2,921.5
Federal Bridge CorporationOperating 0.4 14.0 18.2 13.2 8.1 20.1 41.8 20.0 3.5 0.0Gross expenditures 0.4 14.0 18.2 13.2 8.1 20.1 41.8 20.0 3.5 0.0
The Jacques Cartier and Champlain BridgesOperating 90.0 97.3 109.1 151.6 245.0 247.3 284.3 133.0 116.4 106.7Capital 0.0 0.0 0.0 0.0 0.0 0.0 0.0 46.3 50.4 48.9Gross expenditures 90.0 97.3 109.1 151.6 245.0 247.3 284.3 179.2 166.8 155.6
Windsor-Detroit Bridge Authority6
Operating 0.0 0.0 0.0 0.0 8.1 138.5 334.5 64.0 146.0 126.2Capital 0.0 0.0 0.0 0.0 0.0 0.0 0.0 120.0 184.5 441.3Gross expenditures 0.0 0.0 0.0 0.0 8.1 138.5 334.5 184.0 330.5 567.6
Canadian Coast Guard7
Operating 567.1 539.4 562.4 620.0 529.9 652.3 700.5 782.7 869.6 978.6Capital 248.2 187.8 219.2 200.6 241.9 450.3 423.3 483.5 1,046.4 460.1Transfer payments 5.2 11.5 10.5 5.1 5.1 5.6 5.6 8.2 11.2 13.9Gross expenditures 820.5 738.7 792.1 825.7 776.9 1,108.2 1,129.5 1,274.4 1,927.3 1,452.6
Department of Fisheries and Oceans - Small Craft HarboursOperating 112.4 102.5 67.4 61.7 63.7 50.2 56.8 50.8 68.3 97.1Capital 86.8 51.9 40.8 32.0 37.5 165.4 234.9 156.9 96.0 124.4Transfer payments 7.2 9.2 7.1 5.0 3.2 2.3 4.5 3.4 4.0 9.2Gross expenditures 206.4 163.6 115.3 98.7 104.5 217.9 296.2 211.1 168.3 230.8
Table G3: Detailed Federal Transport Expenditures, by Mode and by Department/Agency, 2010/11 - 2019/20201 (cont)
(Millions of dollars)
2010/11 2011/12 2012/13 2013/14 2014/15 2015/16 2016/17 2017/18R 2018/19R 2019/20P
StatiStical addendum

tranSportation in canada2020
government Spending and revenueS on tranSportation
30
Table G3 continues on the next page
Natural Resources CanadaOperating 0.0 0.0 0.0 0.0 7.8 9.8 10.8 10.4 12.8 12.8Capital 0.0 0.0 0.0 0.0 0.0 2.4 4.4 1.8 1.8 1.8Transfer payments 0.0 0.0 0.0 0.0 6.2 4.4 6.6 34.0 23.8 23.8Gross expenditures 0.0 0.0 0.0 0.0 14.0 16.6 21.8 46.2 38.4 38.4
Environment and Climate Change CanadaOperating 0.0 0.0 0.0 19.2 23.2 23.0 19.4 25.2 25.2 24.9Capital 0.0 0.0 0.0 2.9 1.9 5.3 4.4 0.5 11.3 12.8Transfer payments 0.0 0.0 0.0 0.6 0.5 0.5 0.2 0.4 0.3 0.2Gross expenditures 0.0 0.0 0.0 22.7 25.6 28.8 24.0 26.1 36.8 37.9
Indigenous and Northern Affairs CanadaOperating 0.3 0.3 0.1 0.0 0.0 0.0 0.0 0.1 0.2 0.1Capital 0.0 0.0 0.0 0.0 0.0 0.0 0.0 0.9 3.6 2.9Transfer payments 100.1 107.2 96.9 81.2 112.9 119.5 154.5 175.6 139.8 130.1Gross expenditures 100.4 107.5 97.0 81.2 113.0 119.6 154.5 176.6 143.6 133.1
National Capital CommissionOperating 1.4 1.4 2.0 5.0 3.9 4.7 0.0 0.0 0.0 0.7Capital 0.8 0.8 1.0 0.0 0.0 0.0 5.6 4.7 6.9 26.3Gross expenditures 2.2 2.2 3.0 5.0 3.9 4.7 5.6 4.7 6.9 26.9
Parks Canada Agency Operating 40.9 35.5 41.2 64.5 60.2 58.9 62.8 63.6 78.6 64.6Capital 109.6 59.6 43.1 44.9 89.9 242.9 293.0 336.4 341.4 407.8Transfer payments 0.0 0.0 0.0 0.0 0.0 0.0 0.0 0.1 0.3 0.0Gross expenditures 150.5 95.2 84.3 109.4 150.1 301.8 355.8 400.1 420.3 472.4
Public Services and Procurement CanadaOperating 35.4 30.3 117.8 151.6 133.1 249.6 288.4 218.0 327.4 428.8Capital 53.4 25.4 28.4 15.1 16.8 35.5 36.6 2.0 0.0 2.3Gross expenditures 88.8 55.6 146.2 166.7 149.9 285.1 325.0 220.0 327.4 431.1
PPP Canada8
Capital 0.0 22.2 1.7 0.0 0.0 0.0 0.0 0.0 0.0 0.0Gross expenditures 0.0 22.2 1.7 0.0 0.0 0.0 0.0 0.0 0.0 0.0
Atlantic Canada Opportunities AgencyTransfer payments 1.9 2.2 1.9 4.3 8.3 13.9 13.1 8.7 15.4 23.3Gross expenditures 1.9 2.2 1.9 4.3 8.3 13.9 13.1 8.7 15.4 23.3
Economic Development Agency of Canada for the Regions of QuebecTransfer payments 9.8 5.7 4.8 7.4 3.1 4.0 3.6 6.6 0.3 0.4Gross expenditures 9.8 5.7 4.8 7.4 3.1 4.0 3.6 6.6 0.3 0.4
FedDev Ontario (federal economic development agency for Southern Ontario)Transfer payments 0.0 0.0 0.0 10.6 7.2 32.4 20.6 16.6 25.1 29.1Gross expenditures 0.0 0.0 0.0 10.6 7.2 32.4 20.6 16.6 25.1 29.1
FedNor (federal economic development agency for Northern Ontario)Transfer payments 3.2 0.7 1.6 2.0 2.1 3.6 2.2 1.5 1.8 2.7Gross expenditures 3.2 0.7 1.6 2.0 2.1 3.6 2.2 1.5 1.8 2.7
Western Economic DiversificationTransfer payments 1.2 1.8 2.1 6.5 6.5 4.1 3.7 15.7 80.7 50.8Gross expenditures 1.2 1.8 2.1 6.5 6.5 4.1 3.7 15.7 80.7 50.8
Canadian Northern Economic Development AgencyOperating 0.0 0.0 0.0 0.0 0.0 0.0 0.0 0.0 0.0 0.1Capital 0.0 0.0 0.0 0.0 0.0 0.0 0.0 0.0 0.1 0.1Transfer payments 5.1 0.3 0.6 0.6 1.0 0.3 1.8 0.6 0.7 1.6Gross expenditures 5.1 0.3 0.6 0.6 1.0 0.3 1.8 0.7 0.8 1.8
Statistics CanadaOperating 0.0 0.0 0.0 4.1 5.2 5.1 4.7 7.0 7.0 5.6Gross expenditures 0.0 0.0 0.0 4.1 5.2 5.1 4.7 7.0 7.0 5.6
National Research Council CanadaOperating 0.0 0.0 0.0 46.6 53.1 50.7 48.1 53.8 44.6 43.3Capital 0.0 0.0 0.0 12.8 15.8 13.4 18.3 11.8 12.1 9.0Transfer payments 0.0 0.0 0.0 0.4 0.8 1.3 0.4 0.2 1.2 0.6Gross expenditures 0.0 0.0 0.0 59.9 69.8 65.3 66.8 65.8 58.0 52.9
2010/11 2011/12 2012/13 2013/14 2014/15 2015/16 2016/17 2017/18R 2018/19R 2019/20P

StatiStical addendum2020
government Spending and revenueS on tranSportation
31 202031
Natural Sciences and Engineering Research CouncilOperating 0.0 0.0 0.0 2.4 2.5 2.1 2.4 2.5 2.6 2.9Transfer payments 0.0 0.0 0.0 50.7 55.3 47.5 57.9 57.2 62.7 63.1Gross expenditures 0.0 0.0 0.0 53.1 57.8 49.6 60.3 59.7 65.3 66.0
Total (federal government departments and agencies)Operating 3,096.0 2,941.7 2,844.8 3,142.7 3,305.9 3,905.6 3,888.1 3,688.9 4,141.0 4,454.1Capital 583.2 416.9 392.4 383.8 542.9 1,081.3 1,129.8 1,830.5 1,969.2 2,875.1Transfer payments 3,812.3 2,579.0 2,283.2 1,807.2 1,921.1 1,973.3 1,746.8 1,573.6 2,768.8 2,767.0Gross expenditures 7,491.5 5,937.6 5,520.3 5,333.7 5,769.9 6960.2 6764.7 7,093.1 8,879.1 10,093.2
Notes: R= Revised, P= Preliminary 1. Data are reported on a public accounts (modified cash) basis, and are allocated to the department or agency making the final expenditure. Inter-departmental transfers are netted
out to eliminate double-counting. See notes for specific departments/agencies in the totals-by-department section at the end of this table.2. Due to changes in how the public accounts are structured, some mode allocation has been moved to other. 3. TSB stopped allocating funds to modes. Expense data is recorded under the other category in 2018.4. Effective November 1, 2014, reported under the Administrative Tribunals Support Service of Canada.5. Includes tax expenditures and trust fund allotments.6. Transferred from Transport Canada portfolio to Infrastructure Canada, effective November 4, 2015.Total transfers divided over last 3 years as no year provided. 7. Marine transportation activities only.8. PPP Canada has ceased operation at the end of 2017. There is no new information for 2016/17
Sources: Survey responses from selected federal government departments and agencies; Public Accounts; Departmental Performance Reports (including supplementary tables); Department of Finance4 tax expenditure reports; Statistics Canada data. Some amounts have been imputed for non-response/missing data.
Table G3: Detailed Federal Transport Expenditures, by Mode and by Department/Agency, 2010/11 - 2019/20201 (cont)
(Millions of dollars)
2010/11 2011/12 2012/13 2013/14 2014/15 2015/16 2016/17 2017/18R 2018/19R 2019/20P
Table G4: Government Revenues from Transport Users, 2010/11 - 2019/2020
(Millions of dollars)
2010/11 2011/12 2012/13 2013/14 2014/15 2015/16 2016/17 2017/18R 2018/19R 2019/20P
Federal fuel taxesAir Mode 88.6 83.9 97.2 82.3 86.5 78.4 66.8 93.1 126.6 107.6Road Mode 4,228.8 4,202.9 4,227.5 4,290.4 4,317.6 4,349.9 4,496.3 4,501.1 4,483.0 4453.3Other Modes1 1,024.6 1,041.5 1,055.8 1,113.7 1,123.9 1,136.5 1,071.0 1,144.5 1,192.7 1122.2Total 5,342.1 5,328.3 5,380.5 5,486.4 5,527.9 5,564.8 5,634.1 5,738.7 5,802.3 5683.1
Provincial/Territorial fuel taxes2
Newfoundland and Labrador 168.9 168.6 170.7 170.7 185.7 193.2 309.1 258.1 205.4 175.6Prince Edward Island 41.9 41.8 41.2 35.1 35.4 36.0 37.4 38.3 37.3 29.1Nova Scotia 255.4 250.2 243.4 246.8 248.3 247.6 271.7 266.4 263.4 266.5New Brunswick 210.8 246.6 239.5 240.1 242.8 284.5 285.5 289.5 255.0 282.7Quebec 1,832.8 2,064.0 2,030.6 2,293.0 2,200.4 2,176.0 2,336.0 2,302.5 2,326.9 2286.9Ontario 3,060.4 3,090.4 3,100.2 3,081.1 3,186.1 3,210.1 3,367.9 3,461.0 3,483.0 3590Manitoba 161.4 151.1 151.1 315.6 311.7 321.1 334.7 341.9 366.3 333.0Saskatchewan 463.1 475.5 496.0 509.8 515.4 479.2 488.6 525.1 555.6 507.9Alberta 661.8 849.3 898.2 925.0 944.0 1,370.0 1,343.0 1,399.0 1,394.0 1374British Columbia 1,260.4 1,240.8 1,236.9 1,350.2 1,256.2 1,346.0 1,354.0 1,373.0 1,407.5 1419Yukon 8.2 8.0 8.1 8.2 7.9 7.7 8.2 8.0 7.9 9.7Northwest Territories 16.1 18.9 18.6 17.7 18.4 20.5 21.3 20.7 20.9 18.9Nunavut 5.9 5.0 5.3 4.7 5.5 9.0 9.3 14.0 18.0 23.5Total (all provinces/territories) 8,147.1 8,610.2 8,639.9 9,198.0 9,157.7 9,700.9 10,166.7 10,297.5 10,341.2 10316.9
Federal transportation-related sales tax revenues3
Air Mode 129.7 141.6 152.4 161.2 172.3 179.3 185.0 203.0 219.2 223.6Road Mode 5,456.5 5,692.9 5,872.4 6,149.1 6,294.0 6,203.6 6,446.1 7,099.3 7,404.3 7552.3Other Modes4 88.4 91.2 94.0 97.5 100.9 105.0 109.7 114.2 119.8 122.2Transportation-related sales tax revenues 5,674.5 5,925.7 6,118.8 6,407.8 6,567.1 6,487.9 6,740.8 7,416.5 7,743.3 7898.2
Provincial/Territorial transportation-related sales tax revenues3
Newfoundland and LabradorAir Mode 6.1 6.8 7.4 7.9 8.5 9.7 11.2 12.6 13.1 13.4Road Mode 171.3 179.1 190.1 202.1 203.5 203.5 229.2 251.1 247.3 252.3Transit 0.6 0.6 0.7 0.7 0.7 0.7 0.7 0.8 0.8 0.8Other Modes4 2.1 2.3 2.4 2.5 2.5 2.6 3.0 3.3 3.5 3.5Transportation-related sales tax revenues 180.1 188.8 200.5 213.2 215.2 216.5 244.1 267.8 264.7 270.0
Table G4 continues on the next page
StatiStical addendum

tranSportation in canada2020
government Spending and revenueS on tranSportation
32
Table G4 continues on the next page
Prince Edward Island Air Mode 0.0 0.0 0.2 1.0 1.8 1.9 2.0 2.1 2.3 2.3Road Mode 29.1 29.4 35.5 49.3 54.3 54.7 59.9 67.3 69.1 70.4Transit 0.0 0.0 0.1 0.2 0.3 0.3 0.3 0.3 0.3 0.3Other Modes4 0.0 0.0 0.1 0.5 0.6 0.7 0.8 0.9 1.0 1.0Transportation-related sales tax revenues 29.1 29.4 35.9 51.1 57.0 57.5 63.0 70.6 72.6 74.1
Nova Scotia Air Mode 9.3 8.3 9.0 9.4 10.4 11.5 12.1 13.1 14.1 14.4Road Mode 303.8 337.2 353.4 376.9 378.9 367.6 377.5 405.5 409.8 418.0Transit 1.8 2.0 1.8 1.8 1.9 1.9 1.9 1.9 1.8 1.8Other Modes4 4.2 4.6 4.7 4.7 4.8 4.9 5.1 5.5 5.8 5.9Transportation-related sales tax revenues 319.0 352.1 368.9 392.8 396.0 386.0 396.5 425.9 431.4 440.0
New Brunswick Air Mode 3.8 3.4 3.9 4.7 5.0 5.8 6.6 7.9 8.4 8.5Road Mode 226.2 237.2 242.0 257.4 264.3 268.6 307.1 347.8 355.1 362.2Transit 0.6 0.6 0.5 0.4 0.5 0.4 0.5 0.5 0.5 0.5Other Modes4 1.9 2.0 2.1 2.0 2.0 2.2 2.4 2.8 3.0 3.0Transportation-related sales tax revenues 232.5 243.2 248.4 264.5 271.8 277.0 316.6 359.0 366.9 374.2
Quebec Air Mode 18.8 23.4 25.9 26.2 27.5 27.6 29.2 35.2 39.0 39.8Road Mode 2,179.6 2,517.5 2,768.6 2,852.3 2,870.8 2,827.9 2,910.2 3,115.8 3,268.1 3333.5Transit 15.2 16.9 18.8 19.8 20.5 20.2 20.0 19.7 18.7 19.0Other Modes4 29.5 34.6 38.4 39.4 40.6 42.4 44.4 46.9 50.1 51.1Transportation-related sales tax revenues 2,243.1 2,592.4 2,851.6 2,937.7 2,959.3 2,918.0 3,003.7 3,217.4 3,375.9 3443.4
Ontario Air Mode 32.8 50.4 52.7 51.7 54.9 59.4 61.0 68.1 73.8 75.3Road Mode 3,106.5 3,623.7 3,738.0 4,003.6 4,247.8 4,356.8 4,599.1 4,983.7 5,247.3 5352.2Transit 15.0 23.8 24.6 24.8 24.0 22.6 22.8 23.0 22.0 22.5Other Modes4 37.6 60.2 61.6 63.4 65.8 69.4 73.1 75.9 79.4 81.0Transportation-related sales tax revenues 3,191.8 3,758.1 3,876.9 4,143.5 4,392.5 4,508.1 4,756.0 5,150.6 5,422.5 5530.9
Manitoba Road Mode 169.5 176.0 190.4 215.6 236.4 238.9 243.1 263.1 263.8 269.1Transportation-related sales tax revenues 169.5 176.0 190.4 215.6 236.4 238.9 243.1 263.1 263.8 269.1
Saskatchewan Road Mode 95.5 103.1 111.1 120.2 126.4 129.1 135.9 159.9 159.9 163.0Transportation-related sales tax revenues 95.5 103.1 111.1 120.2 126.4 129.1 135.9 159.9 159.9 163.0
British Columbia Air Mode 15.4 18.8 16.8 3.9 0.0 0.0 0.0 0.0 0.0 0Road Mode 682.1 717.3 750.4 778.1 835.4 892.0 956.0 1,032.5 1,053.4 952.3Transit 6.9 11.4 9.7 2.3 0.0 0.0 0.0 0.0 0.0 0Other Modes4 12.1 19.2 16.0 4.0 0.1 0.1 0.1 0.1 0.1 0.1Transportation-related sales tax revenues 716.4 766.7 792.9 788.3 835.5 892.1 956.1 1,032.6 1,053.5 952.4
Total (all provinces/territories)6
Air Mode 86.1 111.0 115.7 104.7 108.1 115.8 122.0 139.0 150.7 153.7Road Mode 6,963.3 7,920.4 8,379.4 8,855.4 9,217.8 9,339.0 9,817.9 10,626.4 11,073.7 11173.0Transit 40.0 55.3 56.1 50.1 47.9 46.1 46.2 46.1 44.0 44.9Other Modes4 87.4 122.9 125.3 116.6 116.4 122.2 128.9 135.4 142.8 145.6Transportation-related sales tax revenues 7,176.8 8,209.6 8,676.4 9,126.8 9,490.2 9,623.1 10,114.9 10,946.9 11,411.1 11517.2
Federal transportation-related licences and feesAir Mode 0.0 0.0 0.0 0.0 0.0 15.9 13.2 16.8 14.5 16.9Marine Mode 0.0 0.0 0.0 0.0 0.0 3.4 2.2 3.6 2.3 1.2Rail Mode 0.0 0.0 0.0 0.0 0.0 2.9 4.6 4.6 3.0 4.3Road Mode7 5.0 4.8 4.0 3.9 3.0 9.6 9.4 9.3 9.1 9.2Total (federal government departments and agencies) 5.0 4.8 4.0 3.9 3.0 31.8 29.3 34.2 29.0 31.6
Provincial/Territorial transportation-related licences and fees2Newfoundland and Labrador 62.3 68.3 73.5 73.5 79.0 86.2 99.2 96.8 92.6 92.0Prince Edward Island 13.3 13.7 15.1 18.4 18.9 18.8 19.6 20.0 20.2 22.1Nova Scotia 80.5 83.2 113.4 120.5 123.0 121.5 127.5 134.5 134.2 135New Brunswick 103.5 113.7 120.0 125.7 127.9 132.0 138.3 143.0 144.5 146.6Quebec 941.7 848.7 914.4 940.1 963.0 1,056.4 1,252.0 1,303.0 1,318.1 1387.6Ontario 1,080.4 1,081.3 1,132.8 1,255.5 1,441.1 1,576.3 1,741.8 1,971.1 2,054.8 2126.6Manitoba 152.8 157.5 173.9 171.1 177.3 178.1 181.4 184.0 187.5 189.1
2010/11 2011/12 2012/13 2013/14 2014/15 2015/16 2016/17 2017/18R 2018/19R 2019/20P

StatiStical addendum2020
government Spending and revenueS on tranSportation
33 202033
Provincial/Territorial transportation-related licences and fees2 (continued)Saskatchewan 161.1 173.2 183.1 188.4 190.4 200.7 197.5 189.9 204.9 204.3Alberta 346.6 376.4 420.5 492.0 516.0 517.0 502.0 509.0 520.0 535British Columbia 397.6 405.9 415.0 568.9 575.0 581.0 589.0 623.7 638.6 648.1Yukon 4.6 4.6 4.5 4.9 5.8 6.1 6.9 6.7 7.2 8Northwest Territories 3.8 3.9 3.8 9.2 9.3 10.1 10.1 14.3 15.1 14.5Nunavut 0.5 0.6 0.5 0.6 0.6 0.6 0.7 1.0 1.1 0.1Total (all provinces/territories) 3,348.7 3,331.0 3,570.5 3,968.8 4,227.3 4,484.8 4,866.0 5,197.0 5,338.8 5509.9
Other federal transport-related revenues8
Transport CanadaAir Mode - user fees 13.3 14.0 15.7 15.5 15.0 14.2 15.4 14.5 14.8 14.6Air Mode - other 297.1 323.4 329.7 340.9 300.1 313.2 402.8 361.8 393.6 405.8Marine Mode - user fees 8.3 16.1 17.6 18.7 19.7 18.8 18.2 17.9 17.2 17.4Marine Mode - other 32.3 26.1 28.1 27.4 8.1 9.8 11.7 11.3 13.6 141.6Rail Mode - other 13.8 15.5 16.8 17.2 14.8 13.9 12.1 13.0 14.9 18.3Road Mode - other 0.2 0.3 0.4 0.4 (3.0) (1.5) (1.3) (1.4) (1.5) 1.2Other Modes - user fees 0.0 0.0 0.0 0.0 82.1 79.6 72.4 73.3 76.6 81.4Other Modes - other 60.1 46.5 26.1 15.3 6.3 7.8 9.6 27.2 10.3 77.5Total (Transport Canada) 425.1 441.9 434.4 435.4 443.1 455.9 541.0 517.6 539.5 757.8
Other federal departments/agencies Air Mode - user fees 601.0 631.0 634.0 653.0 708.0 723.0 764.0 823.0 871.0 764Air Mode - other 0.0 0.0 9.2 18.3 40.4 15.3 14.8 24.7 25.5 40.7Marine Mode - user fees 0.0 0.0 0.0 2.2 3.1 3.5 3.4 2.3 3.7 3.7Marine Mode - other 40.5 41.9 96.3 110.1 111.3 182.0 223.1 149.9 283.3 388.2Rail Mode - other 0.0 0.0 0.0 2.4 2.7 1.0 0.8 4.3 4.2 4.5Road Mode - user fees 0.5 0.3 0.0 0.0 0.0 0.0 0.0 0.0 0.0 0Road Mode - other 0.0 0.0 29.2 35.8 56.8 95.3 90.8 91.7 64.6 37.6Transit - other 0.0 0.0 0.0 0.0 0.0 0.1 0.0 0.2 0.3 0.3Other Modes - user fees 0.0 0.0 0.0 0.0 0.0 0.0 0.0 0.0 0.0 0Other Modes - other 0.3 0.2 0.2 0.7 0.6 0.5 0.6 1.0 1.1 0.6Total (other federal government departments and agencies) 642.3 673.4 768.9 822.6 922.9 1,020.6 1,097.5 1,097.1 1,253.6 1239.6
Other provincial/territorial transport-related revenuesNova Scotia - user fees 0.0 0.0 0.0 0.0 1.3 1.8 1.9 2.0 1.1 1.6Nova Scotia - other 0.0 0.0 10.2 10.3 16.3 18.6 15.9 19.3 11.7 12.8Quebec - user fees 0.0 809.4 842.2 913.5 960.2 1,192.2 1,228.5 1498.8 1500.1 1434.4Quebec - other 0.0 38.1 54.6 91.2 261.3 0.0 3.6 3.4 1.2 0.5Ontario - user fees 48.2 43.0 50.7 45.1 34.1 45.2 74.2 51.3 45.2 64.5Ontario - other 0.0 0.0 0.0 0.0 0.0 43.7 67.0 476.9 366.5 260.5British Columbia - other 0.0 0.0 0.0 70.7 45.4 50.5 57.6 118.7 76.7 78.4Northwest Territories - user fees 0.0 0.0 0.0 7.1 7.8 7.5 7.5 42.9 50.1 38.0Northwest Territories - other 0.0 0.0 0.0 1.8 1.7 1.2 1.3 0.9 4.3 3.8Nunavut - other 0.0 0.0 0.0 0.0 0.0 0.0 0.1 7.0 0.1 0.8Total (all provinces/territories) 48.2 890.5 957.7 1,139.8 1,328.1 1,360.7 1,457.6 2221.2 2056.9 1895.3
Notes: R= Revised, P= Preliminary
1. Road, rail and other diesel fuel (no breakdown by mode available).2. Only a few provinces/territories were able to break down this revenue category by mode, so we report a combined total for all modes for comparability. Most revenues in this
category are from the road mode.3. 2017/2018 was imputed.4. Includes rail, marine and other expenditure categories where no breakdown exists.5. Sales tax allocation moved from road to transit.6. Alberta, Yukon, Northwest Territories and Nunavut do not have provincial/territorial sales taxes.7. Revenues from the registrar of imported vehicles program.8. Data for 2014/15 and onwards are sourced from the Public Accounts. Prior to that, sourced mainly from the Departmental Performance Reports (the source table is no longer
published).
Sources: Survey responses from selected federal government departments and agencies; Public Accounts; Departmental Performance Reports (including supplementary tables); Department of Finance tax expenditure reports; Statistics Canada data. Some amounts have been imputed for non-response/missing data.
2010/11 2011/12 2012/13 2013/14 2014/15 2015/16 2016/17 2017/18R 2018/19R 2019/20P
StatiStical addendum
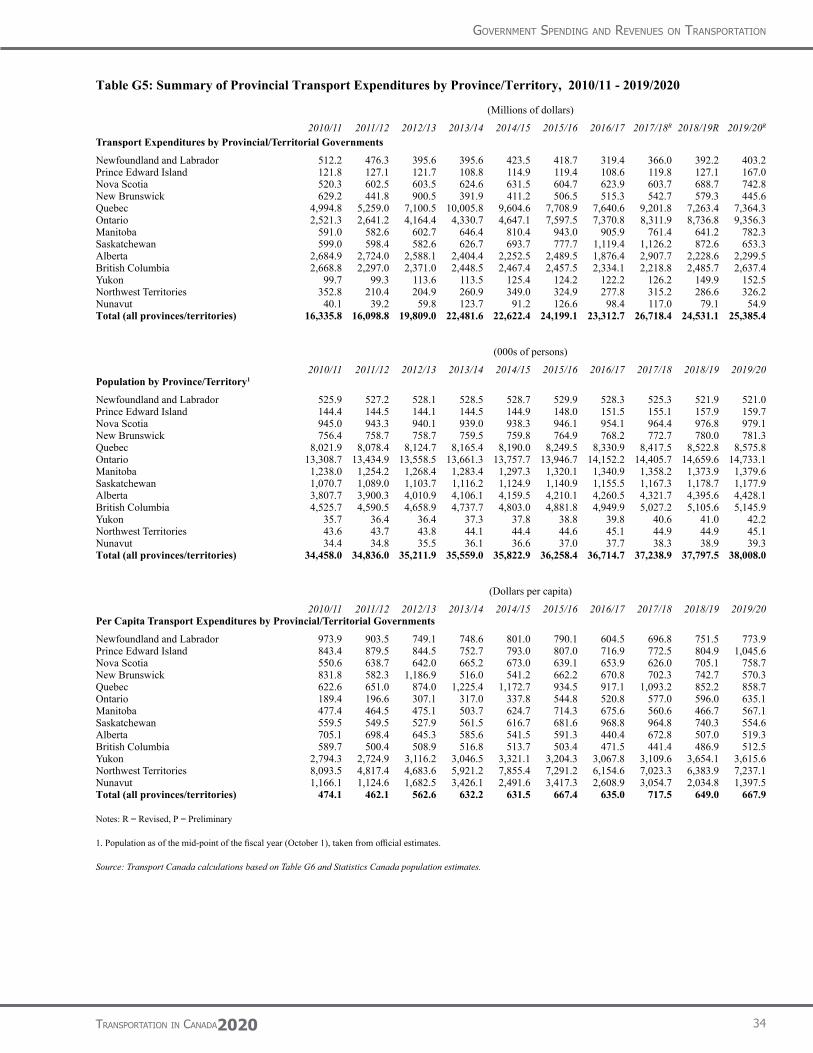
tranSportation in canada2020
government Spending and revenueS on tranSportation
34
Table G5: Summary of Provincial Transport Expenditures by Province/Territory, 2010/11 - 2019/2020
(Millions of dollars)
2010/11 2011/12 2012/13 2013/14 2014/15 2015/16 2016/17 2017/18R 2018/19R 2019/20R
Transport Expenditures by Provincial/Territorial Governments
Newfoundland and Labrador 512.2 476.3 395.6 395.6 423.5 418.7 319.4 366.0 392.2 403.2 Prince Edward Island 121.8 127.1 121.7 108.8 114.9 119.4 108.6 119.8 127.1 167.0 Nova Scotia 520.3 602.5 603.5 624.6 631.5 604.7 623.9 603.7 688.7 742.8 New Brunswick 629.2 441.8 900.5 391.9 411.2 506.5 515.3 542.7 579.3 445.6 Quebec 4,994.8 5,259.0 7,100.5 10,005.8 9,604.6 7,708.9 7,640.6 9,201.8 7,263.4 7,364.3 Ontario 2,521.3 2,641.2 4,164.4 4,330.7 4,647.1 7,597.5 7,370.8 8,311.9 8,736.8 9,356.3 Manitoba 591.0 582.6 602.7 646.4 810.4 943.0 905.9 761.4 641.2 782.3 Saskatchewan 599.0 598.4 582.6 626.7 693.7 777.7 1,119.4 1,126.2 872.6 653.3 Alberta 2,684.9 2,724.0 2,588.1 2,404.4 2,252.5 2,489.5 1,876.4 2,907.7 2,228.6 2,299.5 British Columbia 2,668.8 2,297.0 2,371.0 2,448.5 2,467.4 2,457.5 2,334.1 2,218.8 2,485.7 2,637.4 Yukon 99.7 99.3 113.6 113.5 125.4 124.2 122.2 126.2 149.9 152.5 Northwest Territories 352.8 210.4 204.9 260.9 349.0 324.9 277.8 315.2 286.6 326.2 Nunavut 40.1 39.2 59.8 123.7 91.2 126.6 98.4 117.0 79.1 54.9 Total (all provinces/territories) 16,335.8 16,098.8 19,809.0 22,481.6 22,622.4 24,199.1 23,312.7 26,718.4 24,531.1 25,385.4
(000s of persons)
2010/11 2011/12 2012/13 2013/14 2014/15 2015/16 2016/17 2017/18 2018/19 2019/20Population by Province/Territory1
Newfoundland and Labrador 525.9 527.2 528.1 528.5 528.7 529.9 528.3 525.3 521.9 521.0 Prince Edward Island 144.4 144.5 144.1 144.5 144.9 148.0 151.5 155.1 157.9 159.7 Nova Scotia 945.0 943.3 940.1 939.0 938.3 946.1 954.1 964.4 976.8 979.1 New Brunswick 756.4 758.7 758.7 759.5 759.8 764.9 768.2 772.7 780.0 781.3 Quebec 8,021.9 8,078.4 8,124.7 8,165.4 8,190.0 8,249.5 8,330.9 8,417.5 8,522.8 8,575.8 Ontario 13,308.7 13,434.9 13,558.5 13,661.3 13,757.7 13,946.7 14,152.2 14,405.7 14,659.6 14,733.1 Manitoba 1,238.0 1,254.2 1,268.4 1,283.4 1,297.3 1,320.1 1,340.9 1,358.2 1,373.9 1,379.6 Saskatchewan 1,070.7 1,089.0 1,103.7 1,116.2 1,124.9 1,140.9 1,155.5 1,167.3 1,178.7 1,177.9 Alberta 3,807.7 3,900.3 4,010.9 4,106.1 4,159.5 4,210.1 4,260.5 4,321.7 4,395.6 4,428.1 British Columbia 4,525.7 4,590.5 4,658.9 4,737.7 4,803.0 4,881.8 4,949.9 5,027.2 5,105.6 5,145.9 Yukon 35.7 36.4 36.4 37.3 37.8 38.8 39.8 40.6 41.0 42.2 Northwest Territories 43.6 43.7 43.8 44.1 44.4 44.6 45.1 44.9 44.9 45.1 Nunavut 34.4 34.8 35.5 36.1 36.6 37.0 37.7 38.3 38.9 39.3 Total (all provinces/territories) 34,458.0 34,836.0 35,211.9 35,559.0 35,822.9 36,258.4 36,714.7 37,238.9 37,797.5 38,008.0
(Dollars per capita)
2010/11 2011/12 2012/13 2013/14 2014/15 2015/16 2016/17 2017/18 2018/19 2019/20Per Capita Transport Expenditures by Provincial/Territorial Governments
Newfoundland and Labrador 973.9 903.5 749.1 748.6 801.0 790.1 604.5 696.8 751.5 773.9 Prince Edward Island 843.4 879.5 844.5 752.7 793.0 807.0 716.9 772.5 804.9 1,045.6 Nova Scotia 550.6 638.7 642.0 665.2 673.0 639.1 653.9 626.0 705.1 758.7 New Brunswick 831.8 582.3 1,186.9 516.0 541.2 662.2 670.8 702.3 742.7 570.3 Quebec 622.6 651.0 874.0 1,225.4 1,172.7 934.5 917.1 1,093.2 852.2 858.7 Ontario 189.4 196.6 307.1 317.0 337.8 544.8 520.8 577.0 596.0 635.1 Manitoba 477.4 464.5 475.1 503.7 624.7 714.3 675.6 560.6 466.7 567.1 Saskatchewan 559.5 549.5 527.9 561.5 616.7 681.6 968.8 964.8 740.3 554.6 Alberta 705.1 698.4 645.3 585.6 541.5 591.3 440.4 672.8 507.0 519.3 British Columbia 589.7 500.4 508.9 516.8 513.7 503.4 471.5 441.4 486.9 512.5 Yukon 2,794.3 2,724.9 3,116.2 3,046.5 3,321.1 3,204.3 3,067.8 3,109.6 3,654.1 3,615.6 Northwest Territories 8,093.5 4,817.4 4,683.6 5,921.2 7,855.4 7,291.2 6,154.6 7,023.3 6,383.9 7,237.1 Nunavut 1,166.1 1,124.6 1,682.5 3,426.1 2,491.6 3,417.3 2,608.9 3,054.7 2,034.8 1,397.5 Total (all provinces/territories) 474.1 462.1 562.6 632.2 631.5 667.4 635.0 717.5 649.0 667.9
Notes: R = Revised, P = Preliminary
1. Population as of the mid-point of the fiscal year (October 1), taken from official estimates.
Source: Transport Canada calculations based on Table G6 and Statistics Canada population estimates.

StatiStical addendum2020
government Spending and revenueS on tranSportation
35 202035
Table G6 continues on the next page
Table G6: Detailed Provincial/Territorial Expenditures by Mode and by Province/Territory, 2010/11 - 2019/20
(Millions of dollars)
2010/11 2011/12 2012/13 2013/14 2014/15 2015/16 2016/17 2017/18R 2018/19R 2019/20P
AIR MODENewfoundland and Labrador Operating 14.7 16.1 20.5 20.5 11.2 18.4 9.7 9.6 10.8 9.5Capital 56.0 34.3 1.9 1.9 40.6 17.9 0.9 0.3 0.2 0.9Operating and capital 70.7 50.4 22.4 22.4 51.8 36.3 10.6 9.9 11.0 10.4Transfer payments 0.7 0.2 1.2 1.2 0.0 0.0 0.0 0.0 0.0 0Gross expenditures 71.4 50.6 23.6 23.6 51.8 36.3 10.6 9.9 11.0 10.4Federal transfers to provinces/territories1 (0.3) (1.8) (1.2) (1.2) (2.6) (2.3) (1.2) (1.3) (0.9) (1.7)Net expenditures 71.1 48.8 22.4 22.4 49.2 34.0 9.4 8.6 10.1 8.7
Quebec Operating 26.7 32.6 35.0 29.0 18.4 70.8 70.4 78.8 100.0 106.3Capital 0.0 0.0 0.0 0.0 24.1 26.8 26.8 26.0 24.7 31Operating and capital 26.7 32.6 35.0 29.0 42.5 97.6 97.2 104.8 124.7 137.3Transfer payments 8.5 8.1 7.9 2.9 2.9 0.0 0.0 0.0 0.0 0Gross expenditures 35.2 40.7 42.9 31.9 45.4 97.6 97.2 104.8 124.7 137.3Federal transfers to provinces/territories1 (0.1) 0.4 0.0 0.0 0.2 0.0 0.0 0.0 0.0 0Net expenditures 35.1 41.1 42.9 31.9 45.6 97.6 97.2 104.8 124.7 137.3
Ontario Operating 6.6 6.5 8.1 12.3 11.4 11.7 11.8 11.3 11.5 12.2 Capital 8.2 3.7 5.4 4.6 1.9 2.9 0.6 1.4 1.3 2.6 Net expenditures 14.8 10.2 13.5 16.9 13.3 14.6 12.4 12.7 12.8 14.8
Manitoba Operating 1.6 8.1 8.8 11.6 13.4 12.8 13.5 12.8 12.7 13.4 Capital 2.4 1.2 2.9 0.9 1.1 0.5 1.4 5.9 2.5 0.3 Operating and capital 4.0 9.3 11.7 12.5 14.5 13.3 14.9 18.7 15.2 13.7 Transfer payments 0.1 0.1 0.1 0.0 0.0 0.0 0.0 0.0 0.0 0.0 Gross expenditures 4.1 9.4 11.8 12.5 14.5 13.3 14.9 18.7 15.2 13.7 Federal transfers to provinces/territories1 0.0 0.0 (0.3) (0.8) 0.0 (1.1) (0.9) (6.3) 0.0 (2.5)Net expenditures 4.1 9.4 11.5 11.7 14.5 12.2 14.0 12.4 15.2 11.2
Saskatchewan Operating 1.9 2.0 3.0 2.0 2.0 2.0 2.0 2.0 1.8 2.0 Capital 0.5 0.0 0.0 0.0 0.2 14.6 0.0 0.0 1.6 1.0 Operating and capital 2.4 2.0 3.0 2.0 2.2 16.6 2.0 2.0 3.4 3.0 Transfer payments 0.1 0.1 0.8 0.7 0.7 0.0 0.0 0.0 0.0 0.0 Net expenditures 2.5 2.1 3.8 2.7 2.9 16.6 2.0 2.0 3.4 3.0
Alberta Operating 0.0 0.0 0.0 0.0 0.0 0.0 0.0 0.0 1.9 2.0 Transfer payments 2.4 1.0 2.6 1.5 0.0 0.1 0.0 0.0 0.0 0.0 Net expenditures 2.4 1.0 2.6 1.5 0.0 0.1 0.0 0.0 1.9 2.0
British Columbia Transfer payments 0.0 0.0 0.0 0.0 0.0 3.7 5.9 10.7 5.3 7.0 Net expenditures 0.0 0.0 0.0 0.0 0.0 3.7 5.9 10.7 5.3 7.0
Yukon Operating 8.7 9.5 10.2 10.9 10.8 11.4 11.8 12.5 12.5 14.4 Capital 5.6 3.5 5.0 9.8 13.3 5.9 5.7 5.7 21.9 22.1 Operating and capital 14.3 12.9 15.2 20.7 24.1 17.2 17.5 18.2 34.4 36.5 Transfer payments 0.0 0.0 0.0 0.0 0.0 0.0 0.2 0.0 0.0 0.0 Gross expenditures 14.3 12.9 15.2 20.7 24.1 17.2 17.6 18.2 34.4 36.5 Federal transfers to provinces/territories1 (0.0) (0.2) (0.3) (0.1) (5.0) (1.8) (2.1) (1.9) (2.1) (3.6)Net expenditures 14.3 12.7 14.9 20.6 19.2 15.4 15.6 16.3 32.3 32.9
Northwest Territories Operating 23.2 24.1 16.2 29.6 26.2 30.0 27.6 29.8 30.6 28.5 Capital 20.4 10.7 6.6 4.3 6.0 2.4 4.4 2.0 4.9 10.4 Operating and capital 43.7 34.8 22.8 34.0 32.2 32.4 32.0 31.7 35.6 38.9 Transfer payments 0.0 0.0 0.0 0.3 7.4 1.6 1.0 3.4 0.3 4.0 Gross expenditures 43.7 34.8 22.8 34.2 39.6 34.0 33.0 35.1 35.9 43.0 Federal transfers to provinces/territories1 0.0 (0.3) (0.2) (0.3) (7.4) (1.6) (1.0) (3.4) (0.3) (4.0)Net expenditures 43.7 34.5 22.6 34.0 32.2 32.4 32.0 31.7 35.6 38.9
Nunavut Operating 17.7 17.6 22.3 24.2 21.9 24.5 24.7 30.0 41.8 42.0 Capital 6.3 8.1 8.3 71.8 62.7 91.8 66.6 68.7 12.0 4.8 Operating and capital 24.0 25.7 30.6 96.0 84.6 116.3 91.3 98.7 53.8 46.8 Transfer payments 5.9 1.9 18.0 23.5 3.4 6.7 0.0 3.0 0.5 0.3
StatiStical addendum

tranSportation in canada2020
government Spending and revenueS on tranSportation
36
Table G6 continues on the next page
2010/11 2011/12 2012/13 2013/14 2014/15 2015/16 2016/17 2017/18R 2018/19R 2019/20P
Nunavut (continued)Gross expenditures 29.9 27.5 48.6 119.5 88.0 123.0 91.3 101.7 54.3 47.1 Federal transfers to provinces/territories1 (5.9) (1.9) (18.0) (23.5) (3.4) (6.7) 0.0 (3.0) (0.5) (0.3)Net expenditures 24.0 25.7 30.6 96.0 84.6 116.3 91.3 98.7 53.8 46.8
Total (all provinces/territories)Operating 101.1 116.4 124.0 140.1 115.4 181.6 171.5 186.7 223.6 230.4 Capital 99.4 61.4 30.1 93.3 149.9 162.8 106.3 110.0 69.2 73.0 Operating and capital 200.6 177.8 154.2 233.4 265.3 344.4 277.8 296.7 292.8 303.4 Transfer payments 17.6 11.4 30.6 30.1 14.4 12.1 7.1 17.1 6.1 11.3 Gross expenditures 218.2 189.2 184.8 263.5 279.7 356.5 284.9 313.8 298.9 314.7 Federal transfers to provinces/territories1 (6.3) (3.8) (20.0) (25.9) (18.2) (13.5) (5.1) (15.9) (3.8) (12.1)Net expenditures 211.9 185.4 164.8 237.7 261.5 343.0 279.7 297.9 295.1 302.6
MARINE MODENewfoundland and Labrador Operating 66.4 82.5 77.7 77.7 87.8 79.5 84.0 76.6 79.5 80.1 Capital 27.6 5.9 5.4 5.4 31.1 25.0 5.2 9.1 7.3 2.4 Operating and capital 94.0 88.4 83.1 83.1 118.9 104.5 89.2 85.7 86.8 82.5 Federal transfers to provinces/territories1 0.0 0.0 0.0 0.0 0.0 0.0 0.0 (1.6) 0.0 0.0 Net expenditures 94.0 88.4 83.1 83.1 118.9 104.5 89.2 84.1 86.8 82.5
Nova Scotia Operating 10.5 10.2 10.2 10.5 10.2 10.5 10.4 11.9 12.5 12.7 Capital 0.0 0.0 0.6 0.7 3.9 4.1 3.4 1.5 3.2 4.5 Net expenditures 10.5 10.2 10.8 11.2 14.2 14.6 13.7 13.4 15.7 17.2
New Brunswick Operating 14.8 18.5 22.3 21.6 22.6 21.0 21.2 22.0 24.6 23.5 Capital 51.2 21.6 4.4 4.1 7.4 13.6 5.0 9.2 10.0 8.9 Net expenditures 66.0 40.1 26.7 25.7 30.0 34.6 26.2 31.2 34.6 32.4
Quebec Operating 0.9 91.2 96.0 95.3 120.7 139.7 118.5 137.4 157.0 183.8 Capital 0.0 0.0 0.0 0.0 0.0 0.0 0.0 9.3 373.6 64.5 Operating and capital 0.9 91.2 96.0 95.3 120.7 139.7 118.5 146.7 530.6 248.3Transfer payments 7.2 4.9 4.9 4.8 4.8 0.0 0.0 0.0 0.0 0.0 Net expenditures 8.1 96.1 100.9 100.1 125.5 139.7 118.5 146.7 530.6 248.3
Ontario Operating 11.6 11.6 13.1 12.0 12.3 12.0 12.3 13.5 14.6 16.9 Capital 0.0 0.0 0.0 0.0 0.0 15.6 14.8 50.9 52.0 46.2 Operating and capital 11.6 11.6 13.1 12.0 12.3 27.6 27.1 64.5 66.6 63.0 Transfer payments 5.3 6.3 6.1 6.4 6.9 9.0 11.8 8.7 9.4 6.6 Net expenditures 16.9 17.9 19.2 18.4 19.2 36.6 38.9 73.2 76.0 69.7
Manitoba Operating 0.0 0.0 1.0 3.8 3.5 3.9 3.8 3.7 3.5 3.6 Capital 0.0 0.0 2.7 0.0 0.0 0.0 0.0 0.0 0.0 0.0 Operating and capital 0.0 0.0 3.7 3.8 3.5 3.9 3.8 3.7 3.5 3.6 Transfer payments 4.0 5.0 0.0 0.3 0.0 1.1 0.0 0.0 0.0 0.0 Gross expenditures 4.0 5.0 3.7 4.1 3.5 5.0 3.8 3.7 3.5 3.6 Federal transfers to provinces/territories1 0.0 0.0 0.0 (2.3) (1.0) (1.0) 0.0 0.0 0.0 0.0 Net expenditures 4.0 5.0 3.7 1.8 2.5 4.0 3.8 3.7 3.5 3.6
Saskatchewan Operating 3.7 4.0 3.5 3.6 3.7 3.7 4.0 3.5 3.2 3.0 Capital 0.0 0.7 3.0 2.2 0.5 1.8 0.0 0.0 1.7 1.3 Net expenditures 3.7 4.7 6.6 5.8 4.2 5.5 4.0 3.5 4.9 4.3
Alberta Operating 2.0 2.2 2.0 1.6 2.1 1.5 1.8 1.9 2.2 2.1 Net expenditures 2.0 2.2 2.0 1.6 2.1 1.5 1.8 1.9 2.2 2.1
British Columbia Operating 19.0 20.7 21.3 20.8 22.6 24.6 25.6 26.8 28.6 30.9 Transfer payments 171.0 177.0 201.3 198.0 193.1 189.4 192.0 193.0 220.2 241.9 Gross expenditures 190.0 197.7 222.6 218.8 215.7 214.0 217.6 219.8 248.8 272.8 Federal transfers to provinces/territories1 (26.9) (27.5) (28.1) (28.5) (28.4) (28.7) (29.1) (29.8) (30.5) (31.3)Net expenditures 163.1 170.2 194.5 190.3 187.3 185.3 188.5 190.0 218.3 241.5
Yukon Operating 0.0 0.0 0.0 0.0 1.4 1.5 1.5 1.5 1.5 1.7 Capital 0.0 0.0 0.0 0.0 0.2 0.2 0.4 0.5 0.8 0.2 Net expenditures 0.0 0.0 0.0 0.0 1.6 1.7 1.9 2.0 2.3 1.8

StatiStical addendum2020
government Spending and revenueS on tranSportation
37 202037
Table G6 continues on the next page
Table G6: Detailed Provincial/Territorial Expenditures by Mode and by Province/Territory, 2010/11 - 2019/20 (cont)
(Millions of dollars)
2010/11 2011/12 2012/13 2013/14 2014/15 2015/16 2016/17 2017/18R 2018/19R 2019/20P
Northwest Territories Operating 5.1 5.9 5.0 8.1 7.8 8.7 7.6 37.4 54.5 52.1 Capital 20.4 10.7 6.6 1.0 1.0 1.0 0.3 4.2 2.0 0.6 Operating and capital 25.6 16.5 11.6 9.1 8.8 9.7 7.9 41.6 56.6 52.7 Northwest Territories (continued)Transfer payments 0.0 0.0 0.0 0.0 0.0 0.0 0.0 0.0 0.3 6.3 Gross expenditures 25.6 16.5 11.6 9.1 8.8 9.7 7.9 41.6 56.9 59.0 Federal transfers to provinces/territories1 0.0 0.0 0.0 0.0 0.0 0.0 0.0 0.0 (0.3) (6.3)Net expenditures 25.6 16.5 11.6 9.1 8.8 9.7 7.9 41.6 56.6 52.7
Nunavut Operating 0.7 0.2 0.2 0.2 0.2 0.3 0.5 0.3 0.3 0.2 Capital 6.3 8.1 8.3 1.7 0.4 0.6 0.9 1.6 14.1 4.0 Operating and capital 7.0 8.2 8.5 1.9 0.6 0.9 1.4 1.9 14.4 4.2 Transfer payments 0.6 0.5 0.5 0.0 0.0 0.0 0.0 3.1 0.0 0.0 Gross expenditures 7.6 8.7 9.0 1.9 0.6 0.9 1.4 5.0 14.4 4.2 Federal transfers to provinces/territories1 (0.6) (0.5) (0.5) 0.0 0.0 0.0 0.0 (3.1) 0.0 0.0 Net expenditures 7.0 8.2 8.5 1.9 0.6 0.9 1.4 1.9 14.4 4.2
Total (all provinces/territories)Operating 134.7 246.9 252.4 255.2 295.0 306.9 291.2 336.5 382.0 410.5 Capital 105.5 46.9 31.1 15.1 44.5 61.9 30.0 86.3 464.8 132.5 Operating and capital 240.2 293.8 283.4 270.3 339.5 368.8 321.1 422.9 846.8 543.1 Transfer payments 188.1 193.7 212.8 209.5 204.8 199.5 203.8 204.8 229.9 254.9 Gross expenditures 428.4 487.4 496.2 479.8 544.3 568.3 524.9 627.6 1,076.7 797.9 Federal transfers to provinces/territories1 (27.5) (28.0) (28.6) (30.8) (29.4) (29.7) (29.1) (34.5) (30.8) (37.6)Net expenditures 400.9 459.4 467.6 449.0 514.9 538.6 495.8 593.1 1,045.9 760.3
RAIL MODENew Brunswick Operating 0.4 0.4 0.5 0.5 0.4 0.5 0.4 0.5 0.5 0.5 Capital 0.0 0.1 0.1 0.2 0.1 0.2 0.2 0.0 0.1 0.2 Net expenditures 0.4 0.5 0.6 0.7 0.5 0.7 0.6 0.5 0.6 0.6
Quebec Operating 0.0 0.0 0.0 0.0 1.0 1.8 3.3 6.1 0.0 0.0 Capital 0.0 0.0 0.0 0.0 3.7 0.0 0.0 0.0 0.0 0.0 Operating and capital 0.0 0.0 0.0 0.0 4.7 1.8 3.3 6.1 0.0 0.0 Transfer payments 8.5 1.9 1.7 2.0 2.0 0.0 0.0 0.0 0.0 0.0 Gross expenditures 8.5 1.9 1.7 2.0 6.7 1.8 3.3 6.1 0.0 0.0 Federal transfers to provinces/territories1 (3.9) (4.0) (7.5) (7.5) (7.5) 0.0 0.0 0.0 0.0 0.0 Net expenditures 4.6 (2.1) (5.7) (5.5) (0.8) 1.8 3.3 6.1 0.0 0.0
Ontario Operating 1.4 1.0 0.7 0.7 1.0 0.8 1.3 1.6 1.5 1.6 Transfer payments 66.2 75.7 87.0 111.5 83.2 94.8 79.3 75.6 91.6 87.2 Net expenditures 67.6 76.7 87.7 112.2 84.2 95.6 80.6 77.2 93.1 88.8
Manitoba Operating 0.0 0.0 0.4 0.0 0.0 0.0 0.0 0.3 0.3 0.2 Capital 0.0 0.0 0.0 0.0 0.0 0.0 0.0 0.2 0.4 0.2 Operating and capital 0.0 0.0 0.4 0.0 0.0 0.0 0.0 0.5 0.7 0.5 Transfer payments 0.8 1.2 0.0 1.7 0.0 0.0 0.0 0.0 0.0 0.0 Gross expenditures 0.8 1.2 0.4 1.7 0.0 0.0 0.0 0.5 0.7 0.5 Federal transfers to provinces/territories1 0.0 0.0 0.0 (1.7) 0.0 0.0 0.0 (1.0) 0.0 0.0 Net expenditures 0.8 1.2 0.4 0.0 0.0 0.0 0.0 (0.6) 0.7 0.5
Saskatchewan Operating 1.2 1.2 1.2 1.2 1.3 1.3 1.6 1.0 1.0 2.2 Net expenditures 1.2 1.2 1.2 1.2 1.3 1.3 1.6 1.0 1.0 2.2
Total (all provinces/territories)Operating 3.0 2.6 2.8 2.4 3.7 4.4 6.6 9.5 3.4 4.5 Capital 0.0 0.1 0.1 0.2 3.8 0.2 0.2 0.2 0.5 0.4 Operating and capital 3.0 2.7 2.9 2.6 7.5 4.6 6.8 9.7 3.9 4.8 Transfer payments 75.5 78.8 88.7 115.2 85.2 94.8 79.3 75.6 91.6 87.2 Gross expenditures 78.5 81.5 91.6 117.8 92.7 99.4 86.1 85.3 95.4 92.0 Federal transfers to provinces/territories1 (3.9) (4.0) (7.5) (9.2) (7.5) 0.0 0.0 (1.0) 0.0 0.0 Net expenditures 74.6 77.5 84.2 108.6 85.2 99.4 86.1 84.3 95.4 92.0
StatiStical addendum

tranSportation in canada2020
government Spending and revenueS on tranSportation
38
Table G6 continues on the next page
2010/11 2011/12 2012/13 2013/14 2014/15 2015/16 2016/17 2017/18R 2018/19R 2019/20P
ROAD MODENewfoundland and Labrador Operating 211.5 202.1 170.0 170.0 152.8 189.4 180.9 159.3 170.0 159.3 Capital 135.3 135.2 118.9 118.9 100.0 88.5 38.7 111.1 124.4 151.0 Gross expenditures 346.8 337.3 288.9 288.9 252.8 277.9 219.6 270.4 294.4 310.3 Federal transfers to provinces/territories1 (37.5) (28.3) (17.3) (17.3) (3.3) (11.0) (58.0) (28.9) (40.6) (32.1)Net expenditures 309.3 309.0 271.6 271.6 249.5 266.9 161.6 241.5 253.8 278.2 Prince Edward Island Operating 62.0 88.3 82.3 69.7 76.3 70.3 68.3 70.4 74.3 81.2 Capital 59.6 38.7 39.3 39.0 38.5 49.0 39.2 49.0 52.6 85.6 Gross expenditures 121.6 127.0 121.6 108.7 114.8 119.3 107.5 119.4 126.9 166.8 Federal transfers to provinces/territories1 (5.8) (4.6) (3.1) (10.0) (9.1) (9.1) (13.7) (22.3) (17.5) (36.9)Net expenditures 115.8 122.4 118.5 98.7 105.7 110.2 93.8 97.1 109.4 129.9
Nova Scotia Operating 209.8 334.2 342.0 364.4 387.6 368.4 387.9 378.2 391.3 414.1 Capital 300.0 258.2 250.8 249.1 229.8 221.8 222.3 212.1 281.6 311.5 Gross expenditures 509.8 592.4 592.7 613.4 617.3 590.2 610.2 590.3 673.0 725.6 Federal transfers to provinces/territories1 0.0 (19.4) (20.5) (18.9) (22.5) (32.0) (23.7) (16.2) (38.0) (36.1)Net expenditures 509.8 573.0 572.3 594.5 594.8 558.1 586.5 574.1 634.9 689.5
New Brunswick Operating 156.6 156.1 152.8 129.5 137.2 128.0 130.7 144.3 160.0 155.0 Capital 406.2 245.1 720.4 236.0 243.5 343.2 357.7 366.7 384.1 257.7 Gross expenditures 562.8 401.2 873.2 365.5 380.7 471.2 488.5 511.0 544.1 412.6 Federal transfers to provinces/territories1 (54.7) (45.4) (221.3) (16.9) (7.8) (18.4) (13.6) (27.0) (28.4) (12.6)Net expenditures 508.1 355.8 651.9 348.6 372.9 452.8 474.9 484.0 515.7 400.0
Quebec Operating 753.2 805.4 847.3 3,014.1 3,110.0 3,721.5 3,014.2 3,942.7 2,128.9 2,564.2 Capital 3,369.1 3,455.2 3,191.1 3,279.9 2,801.7 2,438.9 3,159.8 2,795.0 2,338.1 2,305.1 Operating and capital 4,122.3 4,260.6 4,038.4 6,294.0 5,911.7 6,160.4 6,174.0 6,737.7 4,467.0 4,869.3 Transfer payments 200.9 199.2 138.6 203.3 203.3 0.0 0.0 0.0 0.0 0.0 Gross expenditures 4,323.1 4,459.8 4,177.0 6,497.3 6,115.0 6,160.4 6,174.0 6,737.7 4,467.0 4,869.3 Federal transfers to provinces/territories1 (80.2) (77.3) (112.3) (99.5) (75.2) (52.7) (49.7) (233.0) (302.1) (412.2)Net expenditures 4,242.9 4,382.4 4,064.7 6,397.8 6,039.8 6,107.7 6,124.3 6,504.7 4,164.9 4,457.1
Ontario Operating 466.5 453.7 468.8 472.2 495.7 515.3 522.8 576.5 654.9 642.5 Capital 722.3 791.2 929.7 1,049.6 988.6 3,285.0 2,994.6 3,171.1 3,149.3 3,420.4 Operating and capital 1,188.8 1,244.9 1,398.5 1,521.8 1,484.3 3,800.3 3,517.4 3,747.6 3,804.2 4,062.9 Transfer payments 29.5 23.5 27.3 22.5 44.3 34.1 77.3 51.5 73.2 70.6 Gross expenditures 1,218.3 1,268.4 1,425.8 1,544.3 1,528.6 3,834.4 3,594.7 3,799.1 3,877.4 4,133.5 Federal transfers to provinces/territories1 (43.0) (33.3) (33.4) (37.4) (35.0) (43.8) (67.0) 0.0 0.0 0.0 Net expenditures 1,175.3 1,235.1 1,392.4 1,506.9 1,493.6 3,790.6 3,527.7 3,799.1 3,877.4 4,133.5
Manitoba Operating 156.3 166.1 168.5 190.8 200.2 195.2 218.8 213.2 183.5 180.4 Capital 361.9 347.7 286.1 315.8 454.2 549.8 520.1 443.8 346.9 335.8 Operating and capital 518.2 513.8 454.6 506.6 654.4 745.0 738.9 657.0 530.4 516.2 Transfer payments 23.1 1.8 1.8 45.4 69.2 101.3 66.3 80.2 72.7 106.0 Gross expenditures 541.3 515.6 456.4 552.0 723.6 846.3 805.2 737.2 603.1 622.2 Federal transfers to provinces/territories1 0.0 0.0 (35.8) (68.1) (87.8) (76.1) (67.9) (65.1) (76.5) (137.1)Net expenditures 541.3 515.6 420.6 483.9 635.8 770.2 737.3 672.1 526.6 485.1
Saskatchewan Operating 219.8 268.4 233.6 233.6 258.2 229.6 236.2 205.4 214.8 230.6 Capital 302.3 295.3 296.3 347.1 390.9 501.0 851.5 887.5 624.5 388.1 Operating and capital 522.1 563.7 529.8 580.7 649.1 730.6 1,087.7 1,092.9 839.3 618.7 Transfer payments 69.5 26.8 41.3 36.3 36.2 23.7 24.1 26.8 24.0 25.1 Gross expenditures 591.7 590.5 571.1 617.0 685.3 754.3 1,111.8 1,119.7 863.3 643.8 Federal transfers to provinces/territories1 (90.0) (54.9) (23.5) (23.0) (28.0) (59.0) (131.2) (98.4) (53.1) (29.7)Net expenditures 501.7 535.6 547.6 594.0 657.3 695.3 980.6 1,021.3 810.2 614.1
Alberta Operating 475.0 520.9 598.3 640.8 661.9 591.3 609.7 652.6 637.2 598.2 Capital 1,235.8 1,298.3 1,198.9 1,034.5 1,127.4 1,432.2 904.2 1,108.2 1,045.3 987.3 Operating and capital 1,710.8 1,819.2 1,797.2 1,675.3 1,789.2 2,023.5 1,513.9 1,760.7 1,682.4 1,585.6 Transfer payments 866.1 665.0 656.0 476.6 221.7 214.1 221.5 308.5 250.1 503.8 Gross expenditures 2,576.9 2,484.2 2,453.2 2,151.9 2,010.9 2,237.6 1,735.4 2,069.2 1,932.6 2,089.4 Federal transfers to provinces/territories1 (577.2) (417.5) (342.9) (204.1) (286.5) (232.6) (268.1) (323.4) (454.3) (662.5)Net expenditures 1,999.7 2,066.7 2,110.3 1,947.8 1,724.5 2,005.0 1,467.3 1,745.8 1,478.3 1,426.9

StatiStical addendum2020
government Spending and revenueS on tranSportation
39 202039
Table G6 continues on the next page
Table G6: Detailed Provincial/Territorial Expenditures by Mode and by Province/Territory, 2010/11 - 2019/20 (cont)
(Millions of dollars)
2010/11 2011/12 2012/13 2013/14 2014/15 2015/16 2016/17 2017/18R 2018/19R 2019/20P
British Columbia Operating 930.5 759.5 715.5 714.3 903.0 837.0 808.0 896.0 921.7 929.4 Capital 1,084.7 925.3 1,008.9 1,020.0 826.0 873.0 827.6 711.0 856.0 957.2 Operating and capital 2,015.2 1,684.8 1,724.4 1,734.3 1,729.0 1,710.0 1,635.6 1,607.0 1,777.7 1,886.6 Transfer payments 19.6 19.5 37.4 19.4 24.9 77.5 56.8 84.0 100.0 54.7 Gross expenditures 2,034.8 1,704.3 1,761.8 1,753.7 1,753.9 1,787.5 1,692.4 1,691.0 1,877.7 1,941.3 Federal transfers to provinces/territories1 (296.9) (145.0) (146.4) (126.7) (93.0) (163.0) (112.0) (120.0) (29.0) (22.7)Net expenditures 1,737.9 1,559.3 1,615.4 1,627.0 1,660.9 1,624.5 1,580.4 1,571.0 1,848.7 1,918.6
Yukon Operating 39.4 41.5 44.3 48.7 50.3 53.1 52.9 52.3 52.9 51.0 Capital 45.9 44.8 54.0 43.2 48.8 51.5 49.1 52.4 59.8 62.7 Operating and capital 85.3 86.3 98.3 91.9 99.1 104.6 102.0 104.7 112.7 113.7 Transfer payments 0.0 0.0 0.0 1.0 0.4 0.4 0.5 0.8 0.4 0.5 Gross expenditures 85.3 86.3 98.4 92.9 99.4 105.0 102.5 105.5 113.1 114.2 Federal transfers to provinces/territories1 (13.2) (8.3) (7.8) (5.6) (14.1) (13.3) (19.1) (27.1) (11.6) (14.4)Net expenditures 72.1 78.1 90.5 87.3 85.3 91.8 83.4 78.4 101.5 99.8
Northwest Territories Operating 59.9 67.4 79.0 71.3 73.5 77.1 77.3 80.3 87.5 93.0 Capital 207.3 76.3 77.6 116.2 133.4 112.3 83.4 90.3 64.8 91.1 Operating and capital 267.2 143.7 156.6 187.4 206.9 189.3 160.7 170.6 152.3 184.1 Transfer payments 0.0 0.0 0.0 19.1 80.6 80.0 65.1 55.0 30.1 27.8 Gross expenditures 267.2 143.7 156.6 206.5 287.5 269.4 225.8 225.6 182.3 211.9 Federal transfers to provinces/territories1 (42.4) (22.4) (39.7) (19.1) (80.6) (80.0) (65.1) (55.0) (30.1) (27.8)Net expenditures 224.8 121.3 116.9 187.4 206.9 189.3 160.7 170.6 152.3 184.1
Nunavut Operating 0.7 2.9 2.2 2.3 2.6 2.7 3.0 6.7 5.5 3.6 Capital 0.5 0.0 0.0 0.0 0.0 0.0 2.7 2.8 3.5 0.0 Operating and capital 1.2 2.9 2.2 2.3 2.6 2.7 5.7 9.5 9.0 3.6 Transfer payments 1.3 0.0 0.0 0.0 0.0 0.0 0.0 0.8 1.4 0.0 Gross expenditures 2.6 2.9 2.2 2.3 2.6 2.7 5.7 10.3 10.4 3.6 Federal transfers to provinces/territories1 (1.3) 0.0 0.0 0.0 0.0 0.0 0.0 (0.8) (1.4) 0.0 Net expenditures 1.3 2.9 2.2 2.3 2.6 2.7 5.7 9.5 9.0 3.6
Total (all provinces/territories)Operating 3,741.2 3,866.4 3,904.5 6,121.7 6,509.3 6,978.7 6,310.7 7,377.9 5,682.4 6,102.5 Capital 8,231.0 7,911.3 8,171.9 7,849.2 7,382.6 9,946.2 10,050.9 10,001.0 9,330.9 9,353.5 Operating and capital 11,972.1 11,777.7 12,076.4 13,970.8 13,891.9 16,925.0 16,361.7 17,378.9 15,013.4 15,456.0 Transfer payments 1,210.0 935.9 902.4 823.6 680.5 531.1 511.5 607.6 551.8 788.6 Gross expenditures 13,182.2 12,713.6 12,978.8 14,794.4 14,572.5 17,456.1 16,873.2 17,986.4 15,565.2 16,244.6 Federal transfers to provinces/territories1 (1,242.2) (856.4) (1,004.0) (646.6) (742.9) (791.0) (889.0) (1,017.2) (1,082.5) (1,424.1)Net expenditures 11,939.9 11,857.2 11,974.8 14,147.8 13,829.6 16,665.1 15,984.1 16,969.3 14,482.7 14,820.5
TRANSITPrince Edward Island Operating 0.0 0.0 0.0 0.1 0.1 0.1 0.7 0.4 0.2 0.2 Transfer payments 0.0 0.0 0.0 0.0 0.0 0.0 0.4 0.0 0.0 0.0 Gross expenditures 0.0 0.0 0.0 0.1 0.1 0.1 1.1 0.4 0.2 0.2 Federal transfers to provinces/territories1 0.0 0.0 0.0 0.0 0.0 0.0 0.0 (0.2) 0.0 (0.1)Net expenditures 0.0 0.0 0.0 0.1 0.1 0.1 1.1 0.2 0.2 0.1
New Brunswick Federal transfers to provinces/territories1 (35.7) (58.3) 0.0 0.0 0.0 0.0 0.0 0.0 0.0 0.0 Net expenditures (35.7) (58.3) 0.0 0.0 0.0 0.0 0.0 0.0 0.0 0.0
Quebec Operating 0.0 0.0 1,603.1 1,922.9 1,696.3 0.0 0.0 0.0 0.0 0.0 Capital 0.0 0.0 475.3 707.5 684.4 0.0 0.0 0.0 0.0 0.0 Operating and capital 0.0 0.0 2,078.4 2,630.4 2,380.7 0.0 0.0 0.0 0.0 0.0 Transfer payments 486.2 510.1 552.9 600.5 787.7 1,001.6 939.8 1,890.4 1,820.5 1,808.8 Gross expenditures 486.2 510.1 2,631.3 3,230.9 3,168.4 1,001.6 939.8 1,890.4 1,820.5 1,808.8 Federal transfers to provinces/territories1 0.0 0.0 0.0 0.0 (54.9) (78.0) (31.5) (59.5) (10.6) (49.4)Net expenditures 486.2 510.1 2,631.3 3,230.9 3,113.5 923.6 908.3 1,830.9 1,809.9 1,759.4
Ontario Operating 0.0 0.0 0.0 0.0 0.0 0.0 0.0 3.4 7.9 0.7 Transfer payments 1,062.3 1,129.1 2,476.0 2,504.9 2,868.2 3,450.9 3,485.3 4,191.1 4,508.0 4,895.7 Gross expenditures 1,062.3 1,129.1 2,476.0 2,504.9 2,868.2 3,450.9 3,485.3 4,194.5 4,515.9 4,896.4 Federal transfers to provinces/territories1 0.0 0.0 0.0 0.0 0.0 (1,659.7) (1,625.7) (2,017.8) (2,408.6) (1,819.6)Net expenditures 1,062.3 1,129.1 2,476.0 2,504.9 2,868.2 1,791.2 1,859.6 2,176.7 2,107.3 3,076.8
StatiStical addendum

tranSportation in canada2020
government Spending and revenueS on tranSportation
40
Table G6 continues on the next page
2010/11 2011/12 2012/13 2013/14 2014/15 2015/16 2016/17 2017/18R 2018/19R 2019/20P
Manitoba Operating 27.1 32.7 25.8 0.0 0.0 0.0 0.0 0.0 0.0 0.0 Capital 7.0 9.6 17.5 0.0 0.0 0.0 0.0 0.0 0.0 0.0 Operating and capital 34.1 42.3 43.3 0.0 0.0 0.0 0.0 0.0 0.0 0.0 Transfer payments 0.0 2.2 3.0 48.2 40.9 50.5 52.6 1.3 18.7 142.3 Gross expenditures 34.1 44.5 46.3 48.2 40.9 50.5 52.6 1.3 18.7 142.3 Federal transfers to provinces/territories1 0.0 0.0 0.0 (16.4) (1.5) (5.6) (5.9) (9.4) (32.9) (29.7)Net expenditures 34.1 44.5 46.3 31.8 39.4 44.9 46.7 (8.1) (14.3) 112.6
Alberta Transfer payments 70.0 199.9 93.2 216.0 208.5 215.1 103.9 824.9 276.8 195.1 Net expenditures 70.0 199.9 93.2 216.0 208.5 215.1 103.9 824.9 276.8 195.1
British Columbia Operating 147.0 96.0 209.7 299.9 328.0 287.4 212.3 74.8 105.0 157.4 Transfer payments 297.0 299.0 176.9 176.1 169.8 164.9 205.9 222.5 248.9 258.9 Net expenditures 444.0 395.0 386.6 476.0 497.8 452.3 418.2 297.3 353.9 416.3
Yukon Capital 0.0 0.0 0.0 0.0 0.1 0.1 0.1 0.4 0.0 0.0 Transfer payments 0.0 0.0 0.0 0.0 0.1 0.1 0.1 0.1 0.1 0.0 Net expenditures 0.0 0.0 0.0 0.0 0.2 0.2 0.2 0.5 0.1 0.0
Nunavut Federal transfers to provinces/territories1 (15.0) (15.0) 0.0 0.0 0.0 0.0 0.0 0.0 0.0 0.0 Net expenditures (15.0) (15.0) 0.0 0.0 0.0 0.0 0.0 0.0 0.0 0.0
Total (all provinces/territories)Operating 174.1 128.7 1,838.6 2,222.9 2,024.4 287.5 213.0 78.6 113.1 158.3 Capital 7.0 9.6 492.8 707.5 684.5 0.1 0.1 0.4 0.0 0.0 Operating and capital 181.1 138.3 2,331.4 2,930.4 2,708.9 287.6 213.1 79.0 113.1 158.3 Transfer payments 1,915.5 2,140.3 3,301.9 3,545.7 4,075.2 4,883.1 4,788.0 7,130.2 6,873.0 7,300.8 Gross expenditures 2,096.6 2,278.6 5,633.3 6,476.1 6,784.1 5,170.7 5,001.1 7,209.3 6,986.1 7,459.2 Federal transfers to provinces/territories1 (50.7) (73.3) 0.0 (16.4) (56.4) (1,743.3) (1,663.1) (2,086.9) (2,452.2) (1,898.8)Net expenditures 2,045.9 2,205.3 5,633.3 6,459.7 6,727.7 3,427.4 3,338.0 5,122.4 4,534.0 5,560.4
OTHER MODESPrince Edward Island Operating 0.2 0.1 0.1 0.0 0.0 0.0 0.0 0.0 0.0 0.0 Net expenditures 0.2 0.1 0.1 0.0 0.0 0.0 0.0 0.0 0.0 0.0
Quebec Operating 99.1 128.6 119.6 113.4 113.4 0.0 0.0 0.0 0.0 0.0 Transfer payments 34.4 22.0 27.1 30.2 30.2 307.8 307.8 316.1 320.6 300.6 Net expenditures 133.5 150.5 146.7 143.6 143.6 307.8 307.8 316.1 320.6 300.6
Ontario Operating 138.5 134.9 141.9 133.4 133.0 154.7 142.6 138.9 145.5 141.2 Capital 2.9 4.0 0.3 0.6 0.6 10.7 16.3 16.4 16.0 12.0 Net expenditures 141.4 138.9 142.2 134.0 133.6 165.4 158.9 155.3 161.6 153.2
Manitoba Operating 2.5 2.4 74.4 0.0 0.0 0.0 0.0 0.0 0.0 0.0 Capital 0.0 0.0 9.8 0.0 0.0 0.0 0.0 0.0 0.0 0.0 Operating and capital 2.5 2.4 84.1 0.0 0.0 0.0 0.0 0.0 0.0 0.0 Transfer payments 4.2 4.5 0.0 27.9 27.9 27.9 29.4 0.0 0.0 0.0 Gross expenditures 6.7 6.9 84.1 27.9 27.9 27.9 29.4 0.0 0.0 0.0 Federal transfers to provinces/territories1 0.0 0.0 (5.7) 0.0 0.0 0.0 0.0 0.0 0.0 0.0 Net expenditures 6.7 6.9 78.4 27.9 27.9 27.9 29.4 0.0 0.0 0.0
Saskatchewan Federal transfers to provinces/territories1 0.0 (0.1) 0.0 0.0 0.0 0.0 0.0 0.0 0.0 0.0 Net expenditures 0.0 (0.1) 0.0 0.0 0.0 0.0 0.0 0.0 0.0 0.0
Alberta Operating 25.1 27.0 27.1 29.1 26.4 31.4 31.0 11.6 12.3 10.9 Capital 8.6 9.6 10.1 4.2 4.6 3.8 4.3 0.2 2.9 0.0 Net expenditures 33.7 36.6 37.2 33.3 31.0 35.1 35.3 11.7 15.1 10.9
Northwest Territories Operating 16.4 15.4 13.9 11.1 13.1 11.8 11.1 12.8 11.5 12.3 Gross expenditures 16.4 15.4 13.9 11.1 13.1 11.8 11.1 12.8 11.5 12.3 Federal transfers to provinces/territories1 0.0 (0.8) (0.2) 0.0 0.0 0.0 0.0 0.0 0.0 0.0 Net expenditures 16.4 14.6 13.7 11.1 13.1 11.8 11.1 12.8 11.5 12.3

StatiStical addendum2020
government Spending and revenueS on tranSportation
41 202041
Table G6 continues on the next page
Table G6: Detailed Provincial/Territorial Expenditures by Mode and by Province/Territory, 2010/11 - 2019/20 (cont)
(Millions of dollars)
2010/11 2011/12 2012/13 2013/14 2014/15 2015/16 2016/17 2017/18R 2018/19R 2019/20P
Total (all provinces/territories)Operating 281.8 308.4 376.9 287.0 285.9 197.9 184.7 163.3 169.3 164.4 Capital 11.5 13.6 20.2 4.8 5.2 14.5 20.6 16.6 18.9 12.0 Operating and capital 293.3 322.1 397.1 291.8 291.1 212.3 205.3 179.8 188.2 176.4 Transfer payments 38.6 26.5 27.1 58.1 58.1 335.7 337.2 316.1 320.6 300.6 Gross expenditures 331.9 348.5 424.2 349.9 349.2 548.0 542.5 495.9 508.8 477.0 Federal transfers to provinces/territories1 0.0 (0.9) (5.9) 0.0 0.0 0.0 0.0 0.0 0.0 0.0 Net expenditures 331.9 347.6 418.3 349.9 349.2 548.0 542.5 495.9 508.8 477.0
TOTAL (ALL MODES)Newfoundland and Labrador Operating 292.6 300.7 268.2 268.2 251.8 287.3 274.6 245.5 260.3 248.9 Capital 218.9 175.4 126.2 126.2 171.7 131.4 44.8 120.5 131.9 154.3 Operating and capital 511.5 476.1 394.4 394.4 423.5 418.7 319.4 366.0 392.2 403.2 Transfer payments 0.7 0.2 1.2 1.2 0.0 0.0 0.0 0.0 0.0 0.0 Gross expenditures 512.2 476.3 395.6 395.6 423.5 418.7 319.4 366.0 392.2 403.2 Federal transfers to provinces/territories1 (37.8) (30.1) (18.5) (18.5) (5.9) (13.3) (59.2) (31.8) (41.5) (33.8)Net expenditures 474.4 446.2 377.1 377.1 417.6 405.4 260.2 334.2 350.7 369.4
Prince Edward Island Operating 62.2 88.4 82.4 69.8 76.4 70.4 69.0 70.8 74.5 81.4 Capital 59.6 38.7 39.3 39.0 38.5 49.0 39.2 49.0 52.6 85.6 Operating and capital 121.8 127.1 121.7 108.8 114.9 119.4 108.2 119.8 127.1 167.0 Transfer payments 0.0 0.0 0.0 0.0 0.0 0.0 0.4 0.0 0.0 0.0 Gross expenditures 121.8 127.1 121.7 108.8 114.9 119.4 108.6 119.8 127.1 167.0 Federal transfers to provinces/territories1 (5.8) (4.6) (3.1) (10.0) (9.1) (9.1) (13.7) (22.5) (17.5) (37.0)Net expenditures 116.0 122.5 118.6 98.8 105.8 110.3 94.9 97.3 109.6 130.0
Nova Scotia Operating 220.3 344.3 352.2 374.9 397.8 378.9 398.3 390.1 403.8 426.8 Capital 300.0 258.2 251.3 249.8 233.7 225.9 225.6 213.6 284.8 316.0 Gross expenditures 520.3 602.5 603.5 624.6 631.5 604.7 623.9 603.7 688.7 742.8 Federal transfers to provinces/territories1 0.0 (19.4) (20.5) (18.9) (22.5) (32.0) (23.7) (16.2) (38.0) (36.1)Net expenditures 520.3 583.1 583.0 605.7 609.0 572.7 600.2 587.5 650.7 706.7
New Brunswick Operating 171.8 175.0 175.6 151.6 160.2 149.5 152.4 166.8 185.1 178.9 Capital 457.4 266.8 724.9 240.3 251.0 357.0 362.9 375.9 394.2 266.7 Gross expenditures 629.2 441.8 900.5 391.9 411.2 506.5 515.3 542.7 579.3 445.6 Federal transfers to provinces/territories1 (90.4) (103.7) (221.3) (16.9) (7.8) (18.4) (13.6) (27.0) (28.4) (12.6)Net expenditures 538.8 338.1 679.2 375.0 403.4 488.1 501.7 515.7 551.0 433.0
Quebec Operating 879.8 1,057.8 2,701.0 5,174.7 5,059.8 3,933.8 3,206.4 4,165.0 2,385.9 2,854.3 Capital 3,369.1 3,455.2 3,666.4 3,987.4 3,513.9 2,465.7 3,186.6 2,830.3 2,736.4 2,400.6 Operating and capital 4,249.0 4,512.9 6,367.4 9,162.1 8,573.7 6,399.5 6,393.0 6,995.3 5,122.3 5,254.9 Transfer payments 745.8 746.1 733.2 843.7 1,030.9 1,309.4 1,247.6 2,206.5 2,141.1 2,109.4 Gross expenditures 4,994.8 5,259.0 7,100.5 10,005.8 9,604.6 7,708.9 7,640.6 9,201.8 7,263.4 7,364.3 Federal transfers to provinces/territories1 (84.3) (80.9) (119.8) (107.0) (137.4) (130.7) (81.2) (292.5) (312.7) (461.6)Net expenditures 4,910.5 5,178.1 6,980.8 9,898.8 9,467.2 7,578.2 7,559.4 8,909.3 6,950.7 6,902.7
Ontario Operating 624.6 607.7 632.6 630.6 653.4 694.5 690.8 745.2 836.0 815.1 Capital 733.4 798.9 935.4 1,054.8 991.1 3,314.2 3,026.3 3,239.8 3,218.6 3,481.1 Operating and capital 1,358.0 1,406.6 1,568.0 1,685.4 1,644.5 4,008.7 3,717.1 3,985.1 4,054.6 4,296.2 Transfer payments 1,163.3 1,234.6 2,596.4 2,645.3 3,002.6 3,588.8 3,653.7 4,326.9 4,682.2 5,060.1 Gross expenditures 2,521.3 2,641.2 4,164.4 4,330.7 4,647.1 7,597.5 7,370.8 8,311.9 8,736.8 9,356.3 Federal transfers to provinces/territories1 (43.0) (33.3) (33.4) (37.4) (35.0) (1,703.5) (1,692.7) (2,017.8) (2,408.6) (1,819.6)Net expenditures 2,478.3 2,607.9 4,131.0 4,293.3 4,612.1 5,894.0 5,678.1 6,294.1 6,328.2 7,536.8
Manitoba Operating 187.5 209.3 278.8 206.2 217.1 211.9 236.1 230.0 200.0 197.7 Capital 371.3 358.5 318.9 316.7 455.3 550.3 521.5 449.9 349.8 336.3 Operating and capital 558.8 567.8 597.8 522.9 672.4 762.2 757.6 679.9 549.8 534.0 Transfer payments 32.2 14.8 4.9 123.5 138.0 180.8 148.3 81.5 91.3 248.4 Gross expenditures 591.0 582.6 602.7 646.4 810.4 943.0 905.9 761.4 641.2 782.3 Federal transfers to provinces/territories1 0.0 0.0 (41.8) (89.3) (90.3) (83.8) (74.7) (81.7) (109.4) (169.3)Net expenditures 591.0 582.6 560.9 557.1 720.1 859.2 831.2 679.7 531.7 613.0
StatiStical addendum
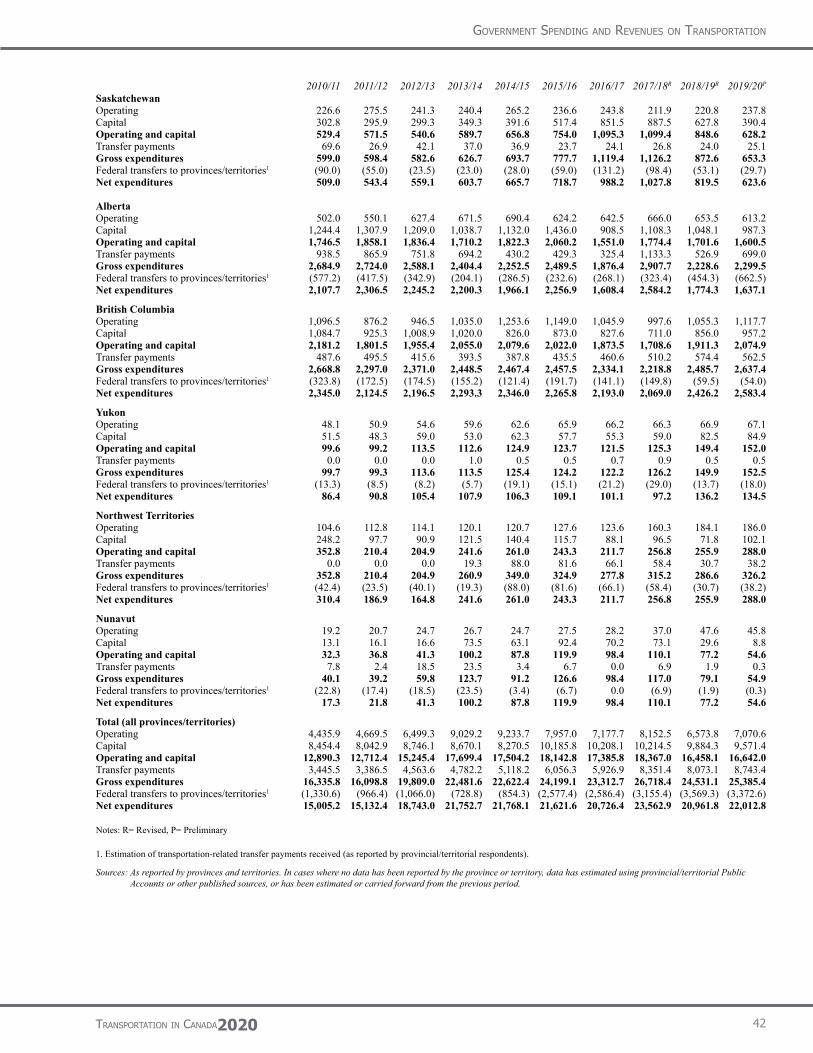
tranSportation in canada2020
government Spending and revenueS on tranSportation
42
2010/11 2011/12 2012/13 2013/14 2014/15 2015/16 2016/17 2017/18R 2018/19R 2019/20P
Saskatchewan Operating 226.6 275.5 241.3 240.4 265.2 236.6 243.8 211.9 220.8 237.8 Capital 302.8 295.9 299.3 349.3 391.6 517.4 851.5 887.5 627.8 390.4 Operating and capital 529.4 571.5 540.6 589.7 656.8 754.0 1,095.3 1,099.4 848.6 628.2 Transfer payments 69.6 26.9 42.1 37.0 36.9 23.7 24.1 26.8 24.0 25.1 Gross expenditures 599.0 598.4 582.6 626.7 693.7 777.7 1,119.4 1,126.2 872.6 653.3 Federal transfers to provinces/territories1 (90.0) (55.0) (23.5) (23.0) (28.0) (59.0) (131.2) (98.4) (53.1) (29.7)Net expenditures 509.0 543.4 559.1 603.7 665.7 718.7 988.2 1,027.8 819.5 623.6
Alberta Operating 502.0 550.1 627.4 671.5 690.4 624.2 642.5 666.0 653.5 613.2 Capital 1,244.4 1,307.9 1,209.0 1,038.7 1,132.0 1,436.0 908.5 1,108.3 1,048.1 987.3 Operating and capital 1,746.5 1,858.1 1,836.4 1,710.2 1,822.3 2,060.2 1,551.0 1,774.4 1,701.6 1,600.5 Transfer payments 938.5 865.9 751.8 694.2 430.2 429.3 325.4 1,133.3 526.9 699.0 Gross expenditures 2,684.9 2,724.0 2,588.1 2,404.4 2,252.5 2,489.5 1,876.4 2,907.7 2,228.6 2,299.5 Federal transfers to provinces/territories1 (577.2) (417.5) (342.9) (204.1) (286.5) (232.6) (268.1) (323.4) (454.3) (662.5)Net expenditures 2,107.7 2,306.5 2,245.2 2,200.3 1,966.1 2,256.9 1,608.4 2,584.2 1,774.3 1,637.1
British Columbia Operating 1,096.5 876.2 946.5 1,035.0 1,253.6 1,149.0 1,045.9 997.6 1,055.3 1,117.7 Capital 1,084.7 925.3 1,008.9 1,020.0 826.0 873.0 827.6 711.0 856.0 957.2 Operating and capital 2,181.2 1,801.5 1,955.4 2,055.0 2,079.6 2,022.0 1,873.5 1,708.6 1,911.3 2,074.9 Transfer payments 487.6 495.5 415.6 393.5 387.8 435.5 460.6 510.2 574.4 562.5 Gross expenditures 2,668.8 2,297.0 2,371.0 2,448.5 2,467.4 2,457.5 2,334.1 2,218.8 2,485.7 2,637.4 Federal transfers to provinces/territories1 (323.8) (172.5) (174.5) (155.2) (121.4) (191.7) (141.1) (149.8) (59.5) (54.0)Net expenditures 2,345.0 2,124.5 2,196.5 2,293.3 2,346.0 2,265.8 2,193.0 2,069.0 2,426.2 2,583.4
Yukon Operating 48.1 50.9 54.6 59.6 62.6 65.9 66.2 66.3 66.9 67.1 Capital 51.5 48.3 59.0 53.0 62.3 57.7 55.3 59.0 82.5 84.9 Operating and capital 99.6 99.2 113.5 112.6 124.9 123.7 121.5 125.3 149.4 152.0 Transfer payments 0.0 0.0 0.0 1.0 0.5 0.5 0.7 0.9 0.5 0.5 Gross expenditures 99.7 99.3 113.6 113.5 125.4 124.2 122.2 126.2 149.9 152.5 Federal transfers to provinces/territories1 (13.3) (8.5) (8.2) (5.7) (19.1) (15.1) (21.2) (29.0) (13.7) (18.0)Net expenditures 86.4 90.8 105.4 107.9 106.3 109.1 101.1 97.2 136.2 134.5
Northwest Territories Operating 104.6 112.8 114.1 120.1 120.7 127.6 123.6 160.3 184.1 186.0 Capital 248.2 97.7 90.9 121.5 140.4 115.7 88.1 96.5 71.8 102.1 Operating and capital 352.8 210.4 204.9 241.6 261.0 243.3 211.7 256.8 255.9 288.0 Transfer payments 0.0 0.0 0.0 19.3 88.0 81.6 66.1 58.4 30.7 38.2 Gross expenditures 352.8 210.4 204.9 260.9 349.0 324.9 277.8 315.2 286.6 326.2 Federal transfers to provinces/territories1 (42.4) (23.5) (40.1) (19.3) (88.0) (81.6) (66.1) (58.4) (30.7) (38.2)Net expenditures 310.4 186.9 164.8 241.6 261.0 243.3 211.7 256.8 255.9 288.0
Nunavut Operating 19.2 20.7 24.7 26.7 24.7 27.5 28.2 37.0 47.6 45.8 Capital 13.1 16.1 16.6 73.5 63.1 92.4 70.2 73.1 29.6 8.8 Operating and capital 32.3 36.8 41.3 100.2 87.8 119.9 98.4 110.1 77.2 54.6 Transfer payments 7.8 2.4 18.5 23.5 3.4 6.7 0.0 6.9 1.9 0.3 Gross expenditures 40.1 39.2 59.8 123.7 91.2 126.6 98.4 117.0 79.1 54.9 Federal transfers to provinces/territories1 (22.8) (17.4) (18.5) (23.5) (3.4) (6.7) 0.0 (6.9) (1.9) (0.3)Net expenditures 17.3 21.8 41.3 100.2 87.8 119.9 98.4 110.1 77.2 54.6
Total (all provinces/territories)Operating 4,435.9 4,669.5 6,499.3 9,029.2 9,233.7 7,957.0 7,177.7 8,152.5 6,573.8 7,070.6 Capital 8,454.4 8,042.9 8,746.1 8,670.1 8,270.5 10,185.8 10,208.1 10,214.5 9,884.3 9,571.4 Operating and capital 12,890.3 12,712.4 15,245.4 17,699.4 17,504.2 18,142.8 17,385.8 18,367.0 16,458.1 16,642.0 Transfer payments 3,445.5 3,386.5 4,563.6 4,782.2 5,118.2 6,056.3 5,926.9 8,351.4 8,073.1 8,743.4 Gross expenditures 16,335.8 16,098.8 19,809.0 22,481.6 22,622.4 24,199.1 23,312.7 26,718.4 24,531.1 25,385.4 Federal transfers to provinces/territories1 (1,330.6) (966.4) (1,066.0) (728.8) (854.3) (2,577.4) (2,586.4) (3,155.4) (3,569.3) (3,372.6)Net expenditures 15,005.2 15,132.4 18,743.0 21,752.7 21,768.1 21,621.6 20,726.4 23,562.9 20,961.8 22,012.8
Notes: R= Revised, P= Preliminary
1. Estimation of transportation-related transfer payments received (as reported by provincial/territorial respondents).
Sources: As reported by provinces and territories. In cases where no data has been reported by the province or territory, data has estimated using provincial/territorial Public Accounts or other published sources, or has been estimated or carried forward from the previous period.
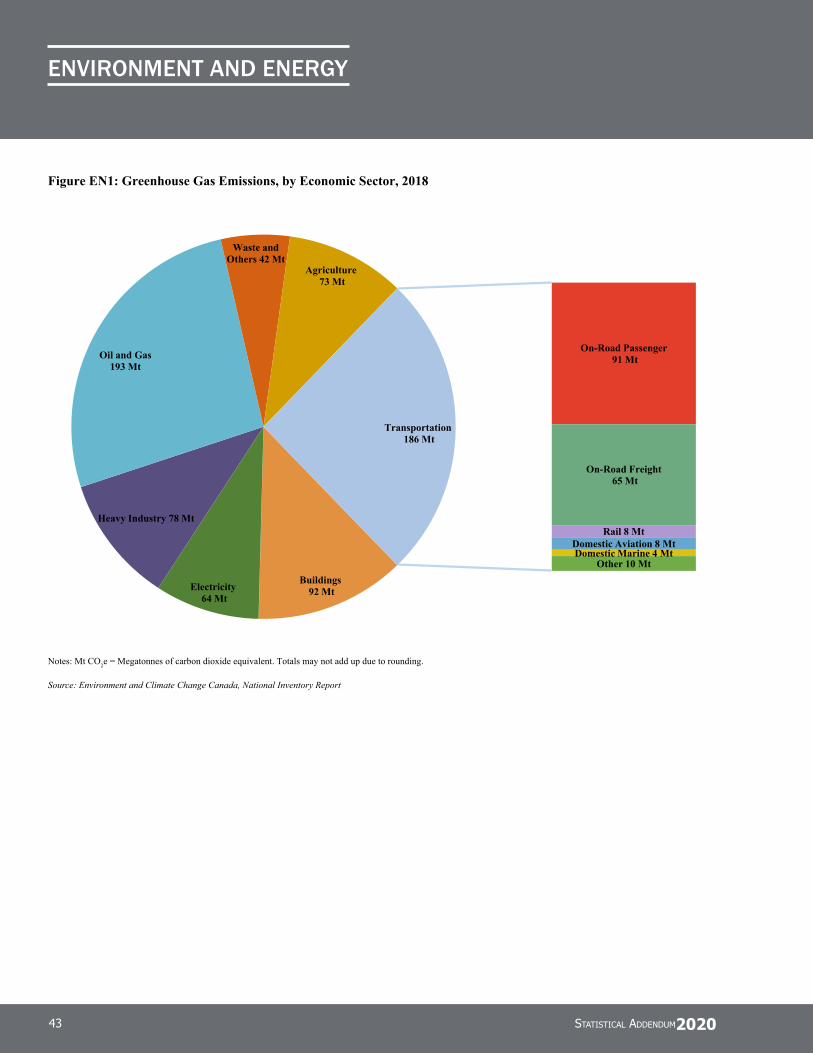
StatiStical addendum202043
environment and energy
Figure EN1: Greenhouse Gas Emissions, by Economic Sector, 2018
Buildings92 MtElectricity
64 Mt
Heavy Industry 78 Mt
Oil and Gas193 Mt
Waste and Others 42 Mt
Agriculture73 Mt
On-Road Passenger 91 Mt
On-Road Freight65 Mt
Rail 8 MtDomestic Aviation 8 MtDomestic Marine 4 Mt
Other 10 Mt
Transportation186 Mt
Notes: Mt CO2e = Megatonnes of carbon dioxide equivalent. Totals may not add up due to rounding.
Source: Environment and Climate Change Canada, National Inventory Report

tranSportation in canada2020 44
environment and energy
Figure EN2: Greenhouse Gas Intensity of End-Use Sectors, 2009 and 2018
0
10
20
30
40
50
60
70
80
Residential Commercial/Institutional Industrial Transportation Agriculture Canada Average
Kg
of C
O2e
/GJ
End-Use Sectors 2009 2018
Note: Kg of CO2e/GJ= Kilograms of carbon dioxide per gigajoule.
Source: Natural Resources Canada, Office of Energy Efficiency, Comprehensive Energy Use Database 2000-2018

StatiStical addendum2020
environment and energy
45
Table EN3: Transportation Energy Consumption, by Type and Mode, 2010–2019
(Petajoules, except where indicated)
2010R 2011R 2012R 2013R 2014R 2015R 2016R 2017R 2018R 2019R
Overall final energy demand (all sectors and fuels)1 7,604 7,959 7,940 8,163 8,268 8,247 8,155 8,473 8,852 8,882Transportation2 2,537 2,523 2,547 2,611 2,574 2,557 2,550 2,629 2,732 2,761Transportation share of overall demand (per cent) 33.4 31.7 32.1 32.0 31.1 31.0 31.3 31.0 30.9 31.1
Transportation subtotals by modeRailways 85 96 97 94 96 92 84 96 98 99Airlines 198 204 239 249 246 252 257 281 318 319Marine 129 104 98 94 84 77 67 72 73 84Road transport and urban transit3 421 424 446 434 444 426 386 382 403 380Retail pump sales 1,670 1,655 1,628 1,685 1,661 1,661 1,702 1,721 1,756 1,790Manufacturing/Commercial fleets 35 40 39 54 43 49 54 77 84 90
Transportation Demand: Breakdown by fuel and mode4
GasolineRetail pump sales 1,365 1,336 1,329 1,362 1,340 1,369 1,424 1,432 1,456 1,484Road transport, urban transit and other fleets5 67 66 75 79 79 85 81 87 87 81
DieselRetail pump sales 301 317 298 323 318 289 275 285 297 301Road transport, urban transit and other fleets5 369 376 386 390 389 373 339 353 381 370Railways 84 94 97 93 95 91 83 96 98 98Marine 36 37 32 30 29 33 33 33 34 38
Natural gasRetail pump sales and fleets 2 2 2 1 4 4 4 5 5 5
Gas plant natural gas liquids (NGL’s)Road transport and urban transit3 13 14 15 12 10 11 12 12 12 12
ElectricityRoad transport and urban transit3 4 4 4 4 4 4 4 4 4 4
Aviation fuelsAviation turbo fuels 196 202 237 248 244 250 256 279 316 317Aviation gasoline 1 1 1 1 1 2 2 2 2 2
Heavy fuel oilsMarine 86 61 63 59 51 41 N/A 37 39 45
Other fuelsAir, marine, rail and road transport 13 12 8 8 8 6 36 4 3 3
Notes: R= Revised data. P= Preliminary data. N/A= Not available. The entire data series was revised at source.1 Including both primary and secondary energy demand.2 In this sector, only the use of fuel by the transportation industry for transportation purposes are included, and not fuel used to power transportation structures and equipment.
Fuel used to power pipelines is excluded. Gasoline and diesel fuel use for fleets that are owned by manufacturing and commercial firms are included. Data cells that are sup-pressed by the source are not included in the subtotals.
3 Establishments primarily engaged in truck transport services, in the operation of urban, interurban and rural transit systems, school buses, charter and sightseeing buses, taxis and limousine services to airports and stations.
4 Components might not sum up to the total due to rounding, data suppressed by the source, statistical discrepancies, and immaterial alternative fuels that are not covered.5 Including manufacturing and commercial fleets as noted above. Agriculture, government and other sectors are excluded. Data cells that are suppressed by the source are
assumed to be zero.
Source: Statistics Canada. Supply and demand of primary and secondary energy in terajoules, annual. Table: 25-10-0029-01

tranSportation in canada2020
environment and energy
46
Table EN4: Total Transportation Greenhouse Gas Emissions, All Modes, 2000–2018
(Mt CO2e)
Year Domestic Aviation Rail Domestic Marine On-Road Passenger On-Road Freight Other Total2000 7.8 6.6 4.4 75.6 36.7 14.5 145.62001 7.1 6.6 4.5 78.5 39.1 11.5 147.42002 7.0 6.0 4.6 80.4 39.2 11.2 148.42003 7.1 6.1 4.7 81.6 41.9 11.0 152.42004 7.6 6.3 4.7 82.2 44.3 11.7 156.82005 7.7 6.7 4.8 83.6 47.9 10.0 160.72006 7.8 7.0 4.9 83.0 49.4 9.9 161.92007 7.9 7.5 4.9 83.2 52.0 10.1 165.62008 7.4 7.9 4.9 81.7 53.6 10.0 165.62009 6.5 6.8 5.0 82.2 52.0 9.8 162.32010 6.5 6.7 5.0 83.6 56.2 10.1 168.22011 6.4 7.5 4.8 82.7 59.2 8.5 169.22012 7.4 7.7 4.6 82.2 61.1 8.0 171.12013 7.7 7.4 4.4 83.8 62.8 8.2 174.32014 7.3 7.6 4.2 82.4 61.7 8.5 171.72015 7.2 7.3 3.9 84.6 60.4 8.8 172.22016 7.2 6.7 4.0 87.6 59.5 8.6 173.52017 7.5 7.6 4.1 88.2 62.1 9.1 178.62018 8.1 7.8 4.1 91.4 65.0 9.5 185.9
Notes: Historic data may be revised annually. Mt CO2e = Megatonnes of carbon dioxide equivalent.
Source: Environment and Climate Change Canada, National Inventory Report
Table EN5: Air Pollutant Emissions from the Transportation Sector, by Type of Pollutant, 2010–2019
(Kilotonnes)
Year SOX NOX PM2.5 VOC CO2010 31 1,020 56 502 4,0482011 31 980 49 386 3,6022012 30 910 44 350 3,3462013 29 867 42 329 3,2832014 29 802 39 310 3,1452015 7 752 35 299 3,0752016 7 708 31 277 3,0092017 7 741 33 285 3,0822018 7 773 34 292 3,1422019 6 778 34 289 3,154
Notes: Historic data may be revised annually. SOX= Sulphur oxide. NOX= Nitrogen oxide. PM2.5= Particulate matter less than or equal to 2.5 microns. VOC= Volatile organic compounds. CO= Carbon monoxide.
Source: Environment and Climate Change Canada, Air Pollutant Emissions Inventory

StatiStical addendum2020
environment and energy
47
Figure EN6: Transportation Mode Share of Air Pollutant Emissions, 2019
10%
20%
30%
40%
50%
60%
70%
ExcludingONS
IncludingONS
ExcludingONS
IncludingONS
ExcludingONS
IncludingONS
ExcludingONS
IncludingONS
ExcludingONS
IncludingONS
PM₂.₅ SOₓ NOₓ VOC CO
Heavy-Duty Vehicles Light-Duty Vehicles Marine Rail Aviation Off-Road and Other
Notes: ONS= Open and Natural Sources. SOX= Sulphur oxide. NOX= Nitrogen oxide. VOC= Volatile organic compounds. CO= Carbon monoxide. PM2.5= Particulate matter less than or equal to 2.5 microns.
Sources: Environment and Climate Change Canada, Air Pollutant Emissions Inventory
Table EN7: Aviation Greenhouse Gas Emission Intensity, by Region of Operation, 2009–2018
Region of Operation Units 2009 2010 2011 2012 2013 2014 2015 2016 2017 2018Domestic g CO2 eq/RTK N/A N/A N/A 1,161 1,151 1,100 1,089 1,047 1,053 1,019International g CO2 eq/RTK N/A N/A N/A 876 865 847 847 827 792 768Overall g CO2 eq/RTK 1,002 982 976 960 951 923 916 886 860 832
Notes: RTK= Revenue tonne-kilometre. RPK = Revenue passenger-kilometre. N/A= Not available.RTK includes the weight of cargo and passengers. Passenger RTK is calculated by multiplying RPK by 100kg, which is the industry’s conventional assumption of the average weight per passenger, including baggage.
Source: Canada’s Action Plan to Reduce Greenhouse Gas Emissions from Aviation, 2018 Annual Report
Table EN8: Aviation Fuel Consumption, by Region of Operation, 2009–2018
(millions of litres)
Region of Operation 2009 2010 2011 2012 2013 2014 2015 2016 2017 2018Domestic N/A N/A N/A 2,221 2,289 2,344 2,383 2,415 2,583 2,637International N/A N/A N/A 4,035 4,025 4,235 4,640 5,140 5,554 5,900Total 5,098 5,659 6,089 6,256 6,314 6,579 7,023 7,555 8,137 8,537
Note: N/A = Not available.
Source: Canada’s Action Plan to Reduce Greenhouse Gas Emissions from Aviation, 2018 Annual Report

tranSportation in canada2020
environment and energy
48
Table EN9: National Aerial Surveillance Program Key Metrics, 2010/11–2019/20
Fiscal Year Patrol Hours Vessel Over-Flights Pollution Sightings Oil Volume (litres)2010 - 2011 2,506 12,365 84 9,1892011 - 2012 2,063 12,032 135 1,0142012 - 2013 2,080 10,134 97 7,8132013 - 2014 3,877 19,989 214 4,4532014 - 2015 3,842 19,551 322 3,1732015 - 2016 2,931 17,427 380 7,9422016 - 2017 2,068 12,461 246 2,8702017 - 2018 3,995 23,410 458 3,7952018 - 2019 4,152 27,520 629 4,5342019 - 2020 3,954 31,335 631 3,670
Source: Transport Canada, Marine Safety
Table EN10: Rail Greenhouse Gas Emission Intensity, by Type of Operation, 2009–2018
Railway Operation Units 2009 2010 2011 2012 2013 2014 2015 2016 2017 2018Class I Freight kg CO2 eq/1,000 RTK 16.80 16.30 16.03 15.68 14.84 14.32 14.02 13.47 13.53 13.42Regional and Short Lines kg CO2 eq/1,000 RTK 14.08 15.09 14.76 13.33 13.47 11.07 16.7 16.09 14.04 14.98Intercity Passenger kg CO2 eq/RPK 0.132 0.123 0.122 0.109 0.099 0.100 0.102 0.101 0.097 0.097Commuter Rail kg CO2 eq/Passenger 1.93 2.04 2.17 2.14 2.06 2.06 2.34 2.23 2.42 2.37
Notes: RTK = Revenue Tonne-Kilometres. RPK = Revenue Passenger-Kilometre.
Source: Railway Association of Canada, Locomotive Emissions Monitoring Program
Table EN11: Railway Fuel Consumption, 2010–2019
(Millions of litres)
2010 2011 2012 2013 2014 2015 2016 2017 2018R 2019Class I 1,848.7 1,810.8 1,972.5 1,937.8 2,024.7 1,952.8 1,827.7 1,963.9 2,051.8 2,055.1Regional 35.7 39.1 38.8 37.4 35.3 34.7 34.1 35.4 35.2 43.9Short Line 48.6 50.6 47.0 47.1 47.7 48.8 46.4 47.2 55.7 50.9Total 1,933.0 1,900.6 2,058.3 2,022.2 2,107.6 2,036.3 1,908.2 2,046.5 2,142.7 2,149.9
Note: R = Revised data.
Sources: Transport Canada, Statistics Canada
Figure EN12: Canadian Zero Emission Vehicle (ZEV) Market Share, 2016–2020
0.6%
1.0%
2.3%
3.1%
3.8%
0.0%
0.5%
1.0%
1.5%
2.0%
2.5%
3.0%
3.5%
4.0%
2016 2017 2018 2019 2020
ZE
V a
s a
% o
f New
Lig
ht-D
uty
Veh
icle
Reg
istr
atio
ns
Source: IHS Markit Catalyst for Insight, New Registrations - Data as of December 31, 2020
Figures and information sourced to IHS Markit within this report (the “IHS Markit Materials”) are the copyrighted property and of IHS Markit Ltd. and its subsidiaries (“IHS Markit”) and represent data, research, or opinions of IHS Markit, and are notrepresentations of fact. The information and opinions expressed in the IHS Markit Materials are subject to change without notice and IHS Markit has no duty orresponsibility to update the IHS Markit Materials.

StatiStical addendum202049
transportation safety and security
Table S1: Summary of Transportation Safety Statistics for Aviation, Marine, Rail, Road and TDG, 2011–2020Year Aviation1 Marine2 Rail3 Road4 TDG5
Accidents 2020P 144 215 965 N/A 321 2019 189 201 1,256 105,791 437
2018 152 221 1,168 111,334 4402017 190 222 1,088 114,412 3882016 185 259 897 118,321 2912015 207 209 1,045 119,550 3342014 189 244 1,048 116,292 3832013 233 253 1,095 122,143 3962012 222 209 1,049 124,682 3952011 211 243 1,071 124,199 344
Fatalities 2020P 13 18 59 N/A 02019 54 12 72 1,761 02018 25 19 57 1,939 22017 27 8 76 1,861 22016 29 6 66 1,900 32015 36 18 46 1,887 42014 13 11 56 1,841 12013 53 16 124 1,951 472012 51 12 81 2,075 02011 57 13 71 2,023 0
Accident Rates 2020P 5.6 4.2 12.0 N/A N/A2019 3.9 3.6 14.1 0.69 N/A2018 3.0 5.6 13.3 0.77 N/A2017 4.0 11.1 13.1 0.76 N/A2016 4.1 15.4 11.3 0.78 N/A2015 4.8 12.4 12.3 0.79 N/A2014 4.4 10.6 12.0 0.78 N/A2013 5.4 10.2 13.0 0.85 N/A2012 5.1 15.8 12.1 0.93 N/A2011 4.9 16.7 12.6 0.91 N/A
Notes: Data for the years 2011 - 2019 have been revised. P=Preliminary data. E= Estimated data. N/A = Not available. TDG= Transportation of dangerous goods.
Comparing accident numbers between modes: The reader should be cautioned in making comparisons across modes as the source and criteria for reporting accidents/incidents can vary from mode to mode. For example, the definitions of a Transportation Safety Board (TSB) reportable accident and incident vary among aviation, marine and rail. The type of risk exposure, frequency and magnitude of an accident, including the impact on public perception of safety, also vary. The TDG program does not cover dangerous goods transported in bulk on marine vessels or by pipeline and therefore limits the type of data comparisons that can be made between in–transit TDG accidents across modes.Comparing accident rates within and between modes and data limitations: The available activity measures (also referred to as risk exposure or denominator data) and accident numbers (nominator) for determining the rate are also particular to each mode and have their own set of limitations. For marine, data are collected only for commercial vessels over 15 gross tons. In addition, there have been data collection changes over the years. The unit of million vessel-kilometres is being used for the ten–year accident rates for marine. For road, the available casualty rates are based on the number of registered vehicles rather than kilometres. For aviation, hours flown is more representative of risk exposure.The ten-year trend for rail is available per million train–miles. For all four modes, therefore, the available denominator for measuring activity ranges in the degree of representation of all modal accidents. In addition, some available denominators must be estimated to account for data reporting changes in a certain year or for data lag for the most recent year.Reliable activity level estimates (or denominator data) for the transportation of dangerous goods are not currently available. Comparing time periods: The data reported are preliminary for 2020, as accident/incident reports can be received or revised and updated after the annual report is finalized. The difference between the final and preliminary accident totals has historically been insignificant (e.g. about one per cent) for rail, marine and aviation. For road, collisions reported to the police are collected by the provinces/territories and provided to Transport Canada to develop the national casualty collision statistics. The one calendar year delay is due to the inherent difficulties in handling the collection and processing of high volumes of data (over 600,000 crash cases annually) and the compiling and release of statistics at the jurisdictional and then at the national levels.
In addition, the long–term comparisons can be affected to varying degrees by the industry, government or system–wide changes (e.g. industry restructuring, government devolution and commercialization of operations; regulatory changes, such as accident reporting requirements; and system improvements, including introduction of new technologies).Comparing fatality numbers: The ten–year trends on annual fatality totals for marine and aviation, which show high fluctuations for some years, may be indicative of the high impact of rare multi–casualty fatal accidents in that year. This is in contrast to road, where the impact of multi–casualty collisions (e.g. pile–ups) on the comparatively very high annual total fatalities is proportionately low. For rail, the total annual fatalities can be influenced by fluctuations in trespasser fatalities, which account for the highest share of the total among all categories of fatal rail accidents.1 Canadian–registered aircraft, other than ultra–lights, operating in Canada and based on the Canadian Aviation Regulations (CARs). Accidents involving aircraft are not operating in accordance with CARs (i.e. military and state aircraft) are not included. Accident rates per 100,000 hours flown. 2 Fatalities involving all Canadian commercial vessels and foreign vessels in Canadian waters. Accidents and Accident rates (per million vessel-kilometres) for all Canadian commercial vessels, excluding all fishing vessels, passenger vessels and vessels under 15 GT (gross tons). For statistics on all vessel accidents, see Table S12.3 Railways under federal jurisdiction. Accident rates are per million train–miles. Train–miles include main track-miles and yard switching-miles.4 Road accident rate refers to fatality rate per 10,000 motor vehicle registrations. Road accidents are casualty collisions, which exclude collisions in which only property is damaged.
5 TDG = Accidents where transportation of dangerous goods (TDG) was involved. Fatality data relate to only those deaths caused by the dangerous goods.The TDG program does not cover dangerous goods transported in bulk on marine vessels or by pipeline. Thresholds for reporting dangerous goods accidents have changed based on amendments to Part 8 of the TDG Regulations, which came into force on December 1, 2016. Now releases and anticipated releases must satisfy at least one of six specific criteria before requiring “30 day follow-up report “ completion to be considered a reportable accident.TDG accidents can occur while dangerous goods are being transported, while they are handled, or during temporary storage pending transport.
Sources: Transportation Safety Board, Transport Canada and Statistics Canada

tranSportation in canada2020 50
tranSportation Safety and Security
Figure S2: Accidents and Accident Rates per Activity Measure for Rail, Road, Marine and Aviation, 2010–2020
0
2
4
6
8
0
75
150
225
300
2011 2012 2013 2014 2015 2016 2017 2018 2019 2020
Acc
iden
t Rat
e
Num
ber
of A
ccid
ents
Air Accidents and Accident Rates, 2011-2020
Accidents for Canadian registered aircraft operating in Canada underCARs
0
5
10
15
20
0
500
1,000
1,500
2,000
2011 2012 2013 2014 2015 2016 2017 2018 2019 2020
Acc
iden
t Rat
e
Num
ber
of A
ccid
ents
Rail Accidents and Accident Rates, 2011–2020
Accidents for railways under federal jurisdiction
Accident rate per million train-miles*
0
5
10
15
20
25
0
30
60
90
120
150
2011 2012 2013 2014 2015 2016 2017 2018 2019 2020
Acc
iden
t Rat
e
Num
ber
of A
ccid
ents
Marine Vessel Accidents and Accident Rates, 2011–2020
Canadian vessel accidents (excluding vessels: fishing, passenger and all under 15GT)
Rate per million vessel KMs (excluding vessels: fishing, passenger and all under 15GT)
0.0
0.5
1.0
1.5
90,000
110,000
130,000
150,000
2010 2011 2012 2013 2014 2015 2016 2017 2018 2019
Fata
lity
Rat
e
Cas
ualty
Col
lisio
ns
Road Casualty Collisions and Fatality Rates, 2010–2019
Casualty collisions
Fatality rate per 10,000 motor vehicle registrations
Notes: Road data on accidents and casualties were not available for 2020. CARs= Canadian Aviation Regulations. GT = gross tons.* Train–miles include main track miles and yard switching miles.
Sources: Transportation Safety Board, Transport Canada and Statistics Canada

StatiStical addendum2020
tranSportation Safety and Security
51
Table S3: Railways Under Federal Jurisdiction, Accidents and Incidents, 2011–2020
AverageAccident Type 2011R 2012 2013 2014R 2015 2016R 2017R 2018R 2019R 2020P 2011 - 2020 Crossing collision 171 192 184 185 165 133 143 167 178 129 164.7 Trespasser accident 65 71 56 54 50 68 77 68 56 58 62.3 Main-track train derailment 110 67 84 100 75 58 81 87 93 70 82.5 Main-track train collision 3 6 4 9 4 5 3 5 4 7 5.0 Non-main-track train derailment 522 530 549 481 523 435 541 599 606 481 526.7 Non-main track train collision 89 101 93 106 92 69 103 101 112 67 93.3 Derailment involving track unit 10 7 18 7 11 7 24 16 19 14 13.3 Collision involving track unit 24 18 23 20 32 16 21 32 31 24 24.1 Employee accident 10 5 8 10 9 11 13 8 14 8 9.6 Passenger accident 1 2 0 3 6 5 4 5 1 0 2.7 Rolling stock with object 19 18 32 22 20 36 30 31 30 26 26.4 Rolling stock with abandoned vehicle 4 7 10 2 6 7 3 9 7 4 5.9 Rolling stock damage without derailment/collision 20 8 23 13 20 12 12 6 5 1 12.0 Fire 23 17 11 36 32 35 33 34 100 75 39.6 Other accidents 0 0 0 0 0 0 0 0 0 1 0.0Total Accidents 1,071 1,049 1,095 1,048 1,045 897 1,088 1,168 1,256 965 1,068.2
Incident Type Main-track switch in abnormal position 10 5 7 6 12 7 12 7 15 3 8.4 Movement exceeds limits of authority 118 120 98 129 142 133 122 138 136 151 128.7 Signal less restrictive than required 3 1 1 2 5 1 1 2 0 1 1.7 Unprotected overlap of authorities 7 5 4 5 6 4 2 11 6 3 5.3 Runaway rolling stock 16 13 14 11 14 10 14 15 16 19 14.2 Crew member incapacitated 0 1 6 1 2 1 4 5 0 1 2.1 Dangerous goods leakage 79 93 94 63 33 7 0 0 0 0 36.9 Main-track train derailment1 2 3 5 3 4 3 1 3.0 Non-main-track train derailment1 166 125 97 67 96 58 32 91.6 Non-main track train collision1 8 4 4 2 2 0 1 3.0 Derailment involving track unit1 7 10 13 5 5 7 9 8.0 Rolling stock with object2 6 10 14 3 0 1 0 4.9 Rolling stock with abandoned vehicle2 1 5 5 0 1 0 1 1.9 Other incidents 0 1 0 0 0 1 5 1.0Total Incidents 233 238 224 407 372 301 235 286 243 227 276.6
Million Train-Miles (MTM)3 85.3 86.6 84.3 87.4 85.0 79.6 82.9 88.0 87.9 80.4 84.7Accidents per MTM - Accident Rate 12.6 12.1 13.0 12.0 12.3 11.3 13.1 13.3 14.1 12.0 12.6
Accident Fatalities Crossing collision 25 33 30 21 15 19 19 19 28 18 22.7 Trespasser accident 43 44 42 32 30 47 53 34 38 39 40.2 Other 3 4 52 3 1 0 4 4 6 2 7.9Total Fatalities 71 81 124 56 46 66 76 57 72 59 70.8
Accident Injuries Crossing collision 22 32 27 29 18 24 22 42 31 12 25.9 Trespasser accident 21 22 10 21 17 20 22 30 17 19 19.9 Other 9 19 2 3 15 12 21 19 17 7 12.4Total Injuries 52 73 39 53 50 56 65 91 65 38 58.2
Dangerous Goods Involved in Accidents 120 120 141 143 126 99 115 123 169 81 123.7Passenger Train Accidents 68 47 45 48 46 57 51 67 47 32 50.8Passenger Train-Miles (PTM)4 6.5 6.3 6.1 6.0 6.1 6.5 5.9 6.8 6.9 2.8 5.9Passenger Rate 10.4 7.5 7.4 8.1 7.5 8.7 8.7 9.8 6.8 11.3 8.6
Notes: P = Preliminary. R = Revised.The reported occurrences cover only railways under federal jurisdiction. Final figures over preliminary and estimated figures historically have changed less than one per cent. Fatalities and serious injuries involved in incidents are not included in the Fatality and Serious Injury totals. For accident and reportable incident definitions, see Transportation Safety Board Regulation website.New TSB regulations came into effect on July 1, 2014, changing some reporting requirements: 1 = No Damage. 2 = No Derailment & No Damage3 Train-miles include main track-miles and yard switching miles.4 PTM = Passenger train-miles; figures are estimated.
Sources: Transport Canada, adapted from the Transportation Safety Board, Transport Canada (activity data)

tranSportation in canada2020
tranSportation Safety and Security
52
Table S4: Railways Under Federal Jurisdiction, Accidents by Province/Territory, 2011 – 2020
AverageProvince/Territory Data 2011R 2012 2013 2014R 2015 2016R 2017R 2018R 2019R 2020P 2011 - 2020Alberta Occurrences 210 271 275 247 186 152 198 240 244 200 222.3
Fatalities 7 12 13 7 6 8 8 8 11 15 9.5Injuries (serious) 9 12 6 10 10 10 11 10 15 5 9.8
British Columbia Occurrences 181 167 181 170 186 163 207 228 212 195 189.0Fatalities 8 8 8 11 8 17 11 12 11 10 10.4Injuries (serious) 14 10 4 10 14 10 15 10 10 10 10.7
Manitoba Occurrences 132 134 115 123 122 101 119 107 134 115 120.2Fatalities 3 5 2 2 2 4 3 3 7 6 3.7Injuries (serious) 4 9 1 8 2 7 8 10 2 4 5.5
New Brunswick Occurrences 24 13 9 26 24 21 12 12 17 10 16.8Fatalities 3 2 1 0 1 2 0 2 1 0 1.2Injuries (serious) 1 0 0 0 0 1 0 0 1 1 0.4
Newfoundland and Labrador Occurrences 3 4 3 0 9 14 17 14 10 11 8.5
Fatalities 0 0 0 0 0 0 0 0 0 0 0.0Injuries (serious) 0 0 0 0 0 0 0 0 2 0 0.0
Northwest Territories and Nunavut Occurrences 2 0 2 1 1 0 1 0 0 0 0.7
Fatalities 0 0 0 0 0 0 0 0 0 0 0.0Injuries (serious) 0 0 0 0 0 0 0 0 0 0 0.0
Nova Scotia Occurrences 4 6 3 5 6 6 12 10 6 16 7.4Fatalities 0 0 0 0 0 2 1 0 0 0 0.3Injuries (serious) 0 0 0 0 0 0 0 2 2 3 0.7
Ontario Occurrences 258 201 232 238 259 210 252 263 305 203 242.1Fatalities 36 33 39 20 18 22 33 21 28 16 26.6Injuries (serious) 14 31 18 9 12 14 19 23 20 10 17.0
Quebec Occurrences 130 129 110 114 149 135 162 140 186 122 137.7Fatalities 12 9 53 13 9 5 17 10 6 10 14.4Injuries (serious) 7 4 4 8 3 10 9 22 4 2 7.3
Saskatchewan Occurrences 127 124 165 124 103 95 108 154 142 93 123.5Fatalities 2 12 8 3 2 6 2 1 8 2 4.6Injuries (serious) 3 6 5 7 7 4 3 10 9 2 5.6
Total Occurrences 1,071 1,049 1,095 1,048 1,045 897 1,088 1,168 1,256 965 1,068.2Total Fatalities 71 81 124 56 46 66 75 57 72 59 70.7Total Injuries 52 72 38 52 48 56 65 87 65 37 57.2
Notes: P = Preliminary data. R = Revised data.
Source: Transport Canada, adapted from the Transportation Safety Board

StatiStical addendum2020
tranSportation Safety and Security
53
Table S5: Railways Under Federal Jurisdiction, Crossing and Trespasser Accidents, 2011–2020
Average2011R 2012 2013 2014 2015 2016R 2017R 2018R 2019R 2020P 2011 - 2020
Crossing Collisions 171 192 184 185 165 133 143 167 178 129 164.7Public automated 89 97 107 86 79 69 70 86 87 54 82.4Public passive 59 73 65 68 52 36 47 51 49 56 55.6Private 15 18 10 27 28 24 21 29 39 17 22.8Farm 8 4 2 4 6 4 5 1 3 2 3.9Unknown 0 0 0 0 0 0 0 0 0 0 0.0
Trespasser Accidents 65 71 56 54 51 68 77 68 56 58 62.4Fatalities 43 44 42 32 30 47 53 34 38 39 40.2Serious Injuries 21 22 10 21 17 20 22 30 17 19 19.9
Alberta 6 9 7 10 5 10 8 10 14 12 9.1British Columbia 13 11 8 13 12 21 17 12 8 11 12.6Manitoba 1 2 2 2 1 4 4 3 2 3 2.4New Brunswick 2 1 0 0 1 1 0 0 1 1 0.7Newfoundland and Labrador 0 0 0 0 0 0 0 0 0 0 0.0Nova Scotia 1 0 0 0 0 1 1 0 0 2 0.5Ontario 32 31 30 21 23 25 34 30 21 21 26.8Quebec 8 11 7 6 5 3 12 12 6 7 7.7Saskatchewan 2 6 2 2 4 3 1 1 4 1 2.6
Notes: P = Preliminary data. R = Revised data.
Source: Transport Canada, adapted from the Transportation Safety Board
Table S6: Road Casualty Collisions, Fatalities and Injuries, with Rates (per 10,000 MVR and Billion Vehicle-Kilometres), 2010–2019
YearCasualty
Collisions1R Fatalities2R Injuries3R MVR
(thousands)
Vehicle-Kilometres (millions)
Fatality Rate/10,000
MVR
Injury Rate/10,000
MVR
Fatality Rate/Billion
Vehicle-Kms
Injury RateR/Billion
Vehicle-Kms2010 125,636 2,238 172,081 21,848 335,900 1.0 78.8 6.7 512.32011 124,199 2,023 167,741 22,247 337,433 0.9 75.4 6.0 497.12012 124,682 2,075 166,727 22,366 340,475 0.9 74.5 6.1 489.72013 122,143 1,951 164,525 23,006 352,367 0.8 71.5 5.5 466.92014R 116,292 1,841 156,557 23,539 358,518 0.8 66.5 5.1 436.72015R 119,550 1,887 160,806 23,924 365,854 0.8 67.2 5.2 439.52016R 118,321 1,900 158,854 24,270 374,740 0.8 65.5 5.1 423.92017R 114,412 1,861 152,773 24,567 382,510 0.8 62.2 4.9 399.42018P 111,334 1,939 149,065 25,061 390,859 0.8 59.5 5.0 381.42019P 105,791 1,761 140,801 25,422 399,568 0.7 55.4 4.4 352.42010–2019 Average 118,236 1,948 158,993 23,625 363,822 0.8 67.6 5.4 439.9
Notes: MVR = Motor vehicle registrations. R= Revised data. E= Estimated data.Data for Ontario and Alberta are preliminary for 2018 and 2019. Data for New Brunswick were estimated.1 “Casualty collisions” exclude collisions involving property damage only.2 “Fatalities” include all those who died as a result of involvement in a reportable traffic collision within 30 days of its occurrence.3 “Injuries” include all those who suffered any visible injury or complained of pain.
Sources: Collision statistics: Transport Canada, Road Safety Programs, National Collision DatabaseMotor Vehicle Registrations: 2010–2019: Statistics Canada, Table 23-10-0067-01Vehicle-Kilometres: Statistics Canada, Catalogue No. 53-223-XIE, “Canadian Vehicle Survey”. Vehicle-kilometres are estimated for 2010–2019

tranSportation in canada2020
tranSportation Safety and Security
54
Table S7: Road Casualty Rates (Fatalities and Injuries per Billion Vehicle-Kilometres) by Province/Territory, 2018 and 2019
Fatalities1 Injuries2
2018R 2019P 2018R 2019P
Canada 5.0 4.4 381.4 352.4Newfoundland and Labrador 7.3 7.2 517.3 480.3Prince Edward Island 9.6 9.4 383.6 378.4Nova Scotia 6.7 5.9 354.5 590.3New Brunswick 5.6 5.5 301.1 294.5Quebec 4.5 4.1 444.4 429.3Ontario 4.1 3.8 343.3 311.8Manitoba 4.6 4.9 787.0 743.0Saskatchewan 8.6 4.6 262.0 270.1Alberta 4.5 3.7 265.2 228.5British Columbia 7.3 6.4 481.7 385.3Yukon 10.1 14.0 248.6 223.3Northwest Territories 4.7 13.9 235.8 177.8Nunavut 48.8 47.6 609.8 595.2
Notes: R = Revised data. E = Estimated data.Data for Ontario and Alberta are preliminary. Data for New Brunswick were estimated. Vehicle-kilometres are estimatedRate-based data in smaller jurisdictions have a high level of fluctuation due to their small sample size.1 “Fatalities” include all those who died as a result of involvement in a reportable traffic collision within 30 days of its occurrence.2 “Injuries” include all those who suffered any visible injury or complained of pain.
Sources: Collision statistics: Transport Canada, Road Safety Programs, National Collision Database
Table S8: Commercial and Other Vehicles Involved in Fatal Collisions by Vehicle Type, 2014–2019
Vehicle Type 2014R 2015R 2016R 2017R 2018R2014-2018
Average 2019E
Commercial Vehicles All buses 28 33 31 28 33 31 14 Straight trucks > 4,536 kg 143 122 122 140 135 132 127 Tractor-trailers 240 206 220 264 220 230 235
Total commercial vehicles 411 361 373 432 388 393 376Non-commercial vehicles involved with NSC vehicles1 394 340 374 373 353 367 362
Total vehicles in collisions involving commercial vehicles 805 701 747 805 741 760 738
Total all other vehicles involved 1,961 2,025 2,148 2,029 2,163 2,065 1,958
Total of all vehicles involved 2,766 2,726 2,895 2,834 2,904 2,825 2,696
Notes: R= Revised data. E= Estimated data.Data for Ontario and Alberta are preliminary for 2018 and 2019. Data for New Brunswick were estimated.1 NSC = National Safety Code. Heavy vehicles are regulated by the National Safety Code and are often referred to as NSC vehicles. The NSC is a code of minimum performance standards for the safe operation of commercial vehicles, agreed to by all jurisdictions in Canada. For more information on the NSC see: http://www.tc.gc.ca/eng/roadsafety/safevehicles-motorcarriers-safetycode-index-290.htm
Sources: Collision statistics: Transport Canada, Road Safety Programs, National Collision Database

StatiStical addendum2020
tranSportation Safety and Security
55
Table S9: Fatalities1 Resulting from Commercial and Other Vehicles Involved in Fatal Collisions by Vehicle Type, 2014–2019
Vehicle Type 2014 2015R 2016R 2017R 2018E2014-2018
Average 2019E
All buses 4 3 5 5 20 7 1Straight trucks > 4,536 kg 20 17 16 20 24 19 17Tractor-trailers 33 25 36 43 30 33 32Commercial vehicle occupant total 57 45 57 68 74 59 50Occupants of other vehicles involved with commercial vehicles 299 299 253 276 235 272 245Bicyclists 10 7 13 11 10 10 8Pedestrians 47 40 50 48 53 48 49Total fatalities in collisions involving commercial vehicles 413 391 373 403 372 389 352
Fatalities in all other collisions 1,428 1,496 1,527 1,458 1,567 1495 1,409
Total 1,841 1,887 1,900 1,861 1,939 1884 1,761
Notes: R= Revised data. E= Estimated data.Data for Ontario and Alberta are preliminary for 2018 and 2019. Data for New Brunswick were estimated.1 “Fatalities” include all those who died as a result of involvement in a reportable traffic collision within 30 days of its occurrence.
Sources: Collision statistics: Transport Canada, Road Safety Programs, National Collision Database
Table S10: Fatalities1 by Road User Class, 2014–2019
Road User Class 2014 2015R 2016R 2017R 2018R2014-2018
Average 2019E
Drivers 907 907 875 954 936 916 867Passengers 337 353 333 318 351 338 295Pedestrians 304 299 356 304 338 320 314Bicyclists 42 49 49 40 45 45 38Motorcyclists 191 211 214 199 206 204 187Not stated 60 68 73 46 63 62 60Total 1,841 1,887 1,900 1,861 1,939 1,886 1,761
Notes: R= Revised data. E= Estimated data.Data for Ontario and Alberta are preliminary for 2018 and 2019. Data for New Brunswick were estimated.1 “Fatalities” include all those who died as a result of involvement in a reportable traffic collision within 30 days of its occurrence.
Sources: Collision statistics: Transport Canada, Road Safety Programs, National Collision Database

tranSportation in canada2020
tranSportation Safety and Security
56
Table S11: Vehicles Involved in Fatal Collisions by Vehicle Type, 2014–2019
Vehicle Types 2014 2015R 2016R 2017R 2018R2014-2018
Average 2019E
Automobile 1,218 1,298 1,394 1,362 1414 1,337 1328Passenger vans 195 171 155 172 180 175 148Light utility vehicles 59 62 83 60 79 69 69Pickup trucks 405 351 370 349 354 366 327Cargo vans 35 31 30 38 31 33 27Other trucks/vans < 4,536kg 95 101 97 90 98 96 89Trucks:
Tractor-trailers 240 206 220 264 220 230 235Trucks > 4,536 kg 143 122 122 140 135 132 127
BusSchool 5 10 12 9 10 9 6Urban 13 11 8 9 11 10 2Intercity 2 4 1 2 2 2 2Bus unspecified 8 8 10 8 10 9 4
Motorcycles and mopeds 195 209 230 206 213 211 188Bicycles 45 51 58 40 46 48 43Farm and construction equipments 30 13 32 24 19 24 20Snowmobiles 10 16 8 9 6 10 9Streetcars 4 5 3 3 5 4 4Motorhomes 4 5 2 4 7 4 9Off-road vehicles 26 30 30 17 32 27 27Fire engines 0 1 0 0 2 1 1Others 13 14 12 13 8 12 15Unknown vehicle types 21 7 18 15 22 17 16
Total 2,766 2,726 2,895 2,834 2,904 2,825 2,696
Notes: R= Revised data. E= Estimated data.Data for Ontario and Alberta are preliminary for 2018 and 2019. Data for New Brunswick were estimated.
Sources: Collision statistics: Transport Canada, Road Safety Programs, National Collision Database

StatiStical addendum2020
tranSportation Safety and Security
57
Table S12: Marine Occurrences, 2010–2020
Average2010 - 2019Canadian Vessels 2010 2011 2012 2013 2014 2015 2016 2017 2018 2019R 2020P
Accidents 274 243 209 253 244 209 259 222 221 201 234 215Shipping Accidents 227 212 170 200 205 180 227 189 180 152 199 176
Abandoned 0 4 2 1 1 2 1 1 0 1Capsizes 8 2 6 7 1 9 5 4 7 2 5 3Collision 15 18 12 19 23 16 31 36 24 14 22 23Explosion 2 4 3 3 1 2 1 0 1 1 2 1Fire 45 43 28 24 27 26 43 26 29 24 32 34Grounding 88 64 57 60 50 54 58 47 50 42 59 43Sank 20 10 10 13 25 16 23 19 15 15 17 16Striking 33 47 41 41 41 29 42 31 37 36 38 44Sustains Damage Render Unseaworthy/Unfit For Purpose 16 20 11 32 36 26 23 25 17 18 23 12
Accident Aboard Ship 47 31 39 53 39 29 32 33 41 49 38 49
Fatalities 18 13 12 16 11 18 6 8 19 12 13 18Shipping Accident 11 3 4 10 4 12 6 4 14 1 8 6Accident Aboard Ship 7 10 8 6 7 6 0 4 5 11 6 12
Injuries 43 25 36 43 32 28 37 33 41 40 35 35Shipping Accident 4 2 6 0 1 4 5 3 3 5 3 2Accident Aboard Ship 39 23 30 43 31 24 32 30 38 35 32 33
Type of Vessels Involved in Shipping Accidents (by Vessel Category) 227 205 180 196 203 181 212 176 213 218 199 270
Commercial 111 111 99 114 107 98 130 106 144 138 113 175Barge 0 0 0 0 0 0 0 0 26 17 3 22Cargo - Liquid 6 5 1 3 7 4 4 7 2 5 4 6Cargo - Solid 30 26 28 31 29 18 20 13 30 36 25 40Ferry 19 23 18 10 18 17 19 11 11 20 16 18Passenger 11 12 13 13 11 11 14 13 14 19 12 30Survey/Research 1 1 3 1 3 2 2 1 3 2 6Service Ship 25 23 17 34 18 29 47 35 31 26 29 25Tanker 0 0 0 0 0 0 0 0 0Tug 16 15 18 20 20 17 21 25 30 10 20 26Sailing Vessel 2 1 0 1 1 0 3 1Ships Boat 1 5 1 1 0 0 0 0 1Other 0 0 0 0 0 0 0 0 2 0 2
Fishing 105 89 69 81 87 76 82 70 69 75 81 85Non-commercial 11 5 12 1 9 7 0 0 0 5 5 10
Commercial Accident RateCommercial vessel accidents (>15 GT, Canadian, non-fishing, non-passenger) 121 97 96 63 65 75 94 81 46 29 82 34Million vessel-kms 6.4 5.8 6.1 6.2 6.1 6.1 6.1 7.3 8.2 8.1 6.5 8.1
Accident Rate/million vessel-kms 19.0 16.7 15.8 10.2 10.6 12.4 15.4 11.1 5.6 3.6 12.7 4.2Vessel trips 25,539 28,269 28,800 29,000 28,700 28,550 28,700 24,949 28,127 27,229 27,848 27,229
Accident Rate/thousand vessel trips 4.7 3.4 3.3 2.2 2.3 2.6 3.3 3.2 1.6 1.1 2.9 1.2
Vessels Lost 25 22 22 20 18 23 17 9 7 2 18 2Commercial 2 1 1 2 2 8 3 2 1 0 2 0Fishing 23 21 21 18 16 15 14 7 6 2 16 2
Incidents 191 175 217 677 684 584 609 686 688 707 501 675
Foreign VesselsAccidents 63 52 59 46 57 39 48 56 69 66 54 47
Shipping Accident 47 42 46 38 44 33 37 44 53 55 43 42Accident Aboard Ship 16 10 13 8 13 6 11 12 16 11 12 5
Type of Vessels Involved in Shipping Accidents (by Vessel Category) 58 54 48 43 55 39 52 57 40 61 50 48
Commercial 56 50 46 41 54 37 49 50 36 57 47 44Fishing 2 4 2 2 1 2 3 7 4 4 3 4
Fatalities 0 3 2 2 1 1 1 3 3 5 2 0Shipping Accident 0 0 1 0 0 1 0 0 0 3 0 0Accident Aboard Ship 0 3 1 2 1 0 1 3 3 2 2 0
Injuries 32 7 12 6 14 14 11 13 20 13 14 6Shipping Accident 1 0 0 0 0 8 0 4 5 5 2 0Accident Aboard Ship 31 7 12 6 14 6 11 9 15 8 12 6
Vessels Lost 0 0 1 0 2 0 1 3 0 0 1 0
Incidents 33 41 53 57 63 123 159 196 243 240 108 240
Table S12 continues on the next page

tranSportation in canada2020
tranSportation Safety and Security
58
Total Marine Occurrences 2010 2011 2012 2013 2014 2015 2016 2017 2018 2019RAverage
2010 - 2019 2020P
Accidents 337 295 268 299 301 248 307 278 290 267 291 272Shipping Accident 274 254 216 238 249 213 264 233 233 207 242 218Accident Aboard Ship 63 41 52 61 52 35 43 45 57 60 50 54
Fatalities 18 16 14 18 12 19 7 11 22 17 15 18
Injuries 75 32 48 49 46 42 48 46 61 53 50 41
Vessels Involved in Shipping Accidents 285 259 228 239 258 220 264 233 253 279 249 318
Vessels Lost 25 22 23 20 20 23 18 12 7 2 19 2
Incidents (Mandatory reporting) 224 216 270 734 747 707 768 882 931 947 609 915
Notes: R= Revised data. P= Preliminary data. GT = Gross tons.
In 2014 the Transportation Safety Board (TSB) renewed their occurrence reporting regulations and introduced a new database to track occurrences. The use of new regulations and a new reporting system has lead to an increase in reported occurrences, primarily incidents. Canadian vessel statistics comprise all occurrences where at least one Canadian vessel was involved (may also include foreign vessels); foreign vessel statistics comprise occurrences in Canadian waters where no Canadian vessel was involved.The Accident Rate is calculated for shipping accidents of Canadian commercial vessels (excluding all fishing and passenger vessels and all vessels under 15GT) of >15 gross tons, as vessel activity is captured for these vessel sizes only. The Transport Canada (TC) rate differs slightly from the Transportation Safety Board (TSB) rate due to the capture of passenger vessels by Transport Canada.For international voyages, vessel-kilometres are calculated within the 12 nautical mile limit.Injuries include both serious and minor injuries.
All definitions can be found in the TSB annual report, Appendix B.
Source: Transportation Safety Board
Table S13: Small Canadian Vessels Engaged in Commercial Activity–Marine Occurrences, 2010–2019
2010 - 20192010 2011 2012 2013 2014 2015 2016 2017 2018 2019R Average 2020P
Total Accidents 88 90 63 80 79 71 97 69 58 55 77 56Shipping Accident 80 79 58 67 66 64 91 65 52 46 69 54Accident Aboard Ship 8 11 5 13 13 7 6 4 6 9 8 2
Vessels Involved in Shipping Accidents (By type of vessel) 76 76 57 67 65 64 91 65 52 46 68 54
Barge 0 0 0 0 0 0 0 0 1 1 0 0Cargo - Liquid 0 0 0 0 0 0 0 0 0 0 0 0Cargo - Solid 0 0 1 0 0 0 1 0 0 0 0 0Ferry 0 0 0 1 1 0 2 0 1Passenger 1 1 1 4 4 6 5 8 5 7 4 6Survey/Research 0 0 2 0 0 0 0 0 0 0 0 1Service Ship 10 11 11 17 3 15 17 18 7 11 12 8Tanker 0 0 0 0 0 0 0 0 0 0 0 0Tug 5 4 6 7 7 8 14 10 7 1 8 7Sailing Vessel 2 0 0 1 0 0 0 1 0 0 0 0Ships Boat 1 4 0 0 0 0 0 0 0 0 1 0Other 0 0 0 0 0 0 0 0 1 0 0Fishing 57 56 36 37 50 35 52 28 32 25 43 32
Fatalities 10 8 5 7 5 5 6 4 15 9 7 5
Injuries 9 8 9 10 11 10 10 5 6 10 9 5
Vessels Lost 11 12 12 9 9 9 10 5 0 0 9 0
Incidents 68 68 60 328 309 238 238 257 281 247 205 210
Notes: R= Revised data. P= Preliminary data.In 2014 the Transportation Safety Board renewed their occurrence reporting regulations and introduced a new database to track occurrences. This allowed TSB to capture more marine incidents.When the vessel activity was not reported, it is assumed that fishing is the intention of the voyage. The TSB estimates that the majority of vessels of unknown tonnage are under 15 GT, and these vessels are identified in this table.It should be noted that statistical figures can change from year to year, as the data are acquired from a live database that is updated as information is obtained. All data is publically available on the TBS website.
All definitions can be found in the TSB annual report, Appendix B.
Source: Transportation Safety Board

StatiStical addendum2020
tranSportation Safety and Security
59
Table S14: Small Canadian Vessels Engaged in Commercial Fishing Activity–Marine Occurrences, 2010–2020
2010 - 20192010 2011 2012 2013 2014 2015 2016 2017 2018 2019R Average 2020P
Total Accidents >15 GT and <=150 GTShipping Accident 46 33 34 37 30 38 24 40 42 36 36 45Shipping Accident Fatalities 4 1 0 6 0 0 0 1 2 0 2 6Accident aboard ship 9 7 13 15 11 14 13 11 12 13 12 12Accident aboard ship fatalities 0 4 3 2 4 2 0 2 1 2 2 4Vessels Lost 14 10 11 9 7 9 6 4 7 2 9 6
Vessels <=15 GTShipping Accident 45 46 28 22 40 30 46 24 52 46 37 54Shipping Accident Fatalities 3 1 1 4 2 3 6 0 12 1 4 5Accident aboard ship 2 5 3 4 6 4 4 2 6 9 4 2Accident aboard ship fatalities 3 5 2 3 2 2 0 0 3 8 2 0Vessels Lost 5 11 9 5 7 3 5 3 6 7 6 8
Vessels of Unknown GT1
Shipping Accident 12 10 8 15 10 5 6 4 6 3 8 4Shipping Accident Fatalities 0 0 1 1 1 3 4 0 0 0 1 1Accident aboard ship 2 2 1 3 2 0 0 0 1 0 1 0Accident aboard ship fatalities 1 2 0 1 0 0 0 0 1 0 1 0Vessels Lost 4 1 2 3 1 1 3 0 1 0 2 1
Total Shipping Accidents 103 89 70 74 80 73 76 68 100 85 81 103Total Shipping Accident Fatalities 7 2 2 11 3 6 10 1 14 1 6 12Total Accidents aboard ship 13 14 17 22 19 18 17 13 19 22 17 14Total Accident aboard ship fatalities 4 11 5 6 6 4 0 2 5 10 5 4Total Vessels Lost 23 22 22 17 15 13 14 7 14 9 16 15
Notes: R= Revised data. P= Preliminary data. GT = Gross tonnage.
The Transportation Safety Board considers vessels with an unknown Gross tonnage as under 15 GT. In this table, those vessels of unknown tonnage are reported separately, for greater clarity. In the rest of the report, vessels of unknown tonnage and vessels under 15 GT are included together.
It should be noted that statistical figures can change from year to year, as the data are acquired from a live database that is updated as information is obtained. All data is publicly available on the TSB website.
All definitions can be found in the TSB annual report, Appendix B.
Source: Transportation Safety Board

tranSportation in canada2020
tranSportation Safety and Security
60
Table S15: Aviation Occurrences and Casualties Involving Aircraft Operating Under CARs, 2015–2020
Average2015 2016 2017 2018 2019R 2015–2019 2020P
Canadian-Registered Aircraft Accidents1 207 185 190 152 189 184.6 144Type of Operation
Airliner 6 1 4 3 5 3.8 4Commuter 2 1 5 0 2 2.0 2Air taxi 18 19 20 19 26 20.4 13Aerial work 21 17 19 16 16 17.8 11Private operator passenger transportation 1 5 1 1 1 1.8 1Flight training 29 19 36 19 31 26.8 20
Private/Recreational Aviation Accidents2 135 125 106 95 110 114.2 93Airplanes 120 111 96 83 96 101.2 84Balloons 0 0 0 0 0 0.0 0Gliders 4 4 4 1 3 3.2 2Gyroplanes 1 1 1 2 0 1.0 1Helicopters 10 9 5 9 11 8.8 7
Canadian–Registered Basic and Advanced Ultralights 13 19 21 15 16 16.8 15Others3 0 0 0 0 0 0.0 1
Fatal Accidents Involving Canadian–Registered Aircraft 19 21 18 16 26 20.0 9Type of Operation
Airliner 0 0 1 0 0 0.2 0Commuter 0 0 0 0 0 0.0 0Air taxi 5 1 0 1 8 3.0 1Aerial work 3 3 2 3 0 2.2 1Private operator passenger transportation 0 1 0 1 0 0.4 0Flight training 1 0 5 0 4 2.0 0
Private/Recreational Aviation2
Aeroplanes 10 14 10 9 12 11.0 6Balloons 0 0 0 0 0 0.0 0Gliders 0 1 1 0 0 0.4 0Gyroplanes 0 0 0 0 0 0.0 0Helicopters 1 1 0 3 3 1.6 1
Canadian–Registered Basic and Advanced Ultralights 3 4 1 2 2 2.4 3Others3 0 0 0 0 0 0.0 0
Fatalities 36 29 27 25 54 34.2 13Type of Operation
Airliner 0 0 1 0 0 0.2 0Commuter 0 0 0 0 0 0.0 0Air taxi 12 1 0 3 24 8.0 1Aerial work 5 3 3 5 0 3.2 1Private operator passenger transportation 0 4 0 0 0 0.8 0Flight training 2 0 6 0 5 2.6 0
Private/Recreational Aviation2
Aeroplanes 16 18 16 12 18 16.0 10Balloons 0 0 0 0 0 0.0 0Gliders 0 1 1 0 0 0.4 0Gyroplanes 0 0 0 0 0 0.0 0Helicopters 1 2 0 5 7 3.0 1
Canadian–Registered Basic and Advanced Ultralights 3 4 1 2 3 2.6 3Others3 0 0 0 0 0 0.0 0
Notes: R= Revised data. P= Preliminary data. CARs= Canadian Aviation Regulations. As some accidents may involve multiple aircraft, the number of aircraft involved may differ slightly from the total number of accidents. For definitions regarding CARs, please visit the Civil Aviation website: http://www.tc.gc.ca/eng/acts-regulations/regulations-sor96-433.htm.1 Excludes aircraft accidents not operating in accordance with CARs (i.e. military and state aircraft). Ultralight aircraft are excluded.2 Recreational aviation comprises all privately registered aircraft except those operated in accordance with CAR 604.3 Includes State aircraft, Unmanned Air Vehicle and aircraft in the process of being registered in Canada.
Source: Transport Canada, adapted from the Transportation Safety Board, preliminary data as of March 12, 2021

StatiStical addendum2020
tranSportation Safety and Security
61
Table S16: Summary of Aviation Occurrences Reported to the Transportation Safety Board, 2015–2020
Average 2015–20192015 2016 2017R 2018R 2019R 2020P
Canadian–Registered Accidents1 227 200 208 173 200 202.0 150Accidents involving aircraft operating under CARs 207 186 191 153 189 185.2 144Other accidents2 20 14 17 20 11 16.4 6
Foreign–Registered Aircraft Accidents in Canada 8 8 7 11 10 8.8 0
Fatal accidents 2 1 0 0 4 1.4 0
Fatalities 3 7 0 0 11 4.2 0
Reportable Incidents 811 866 971 889 943 896.0 438Risk of collision/Loss of separation 111 139 172 144 139 141.0 49Declared emergency 334 314 350 341 367 341.2 190Engine failure 118 125 112 103 118 115.2 56Smoke/Fire 91 88 105 103 92 95.8 28Collision 8 18 25 26 32 21.8 9Other 149 182 207 172 195 181.0 106
Notes: R= Revised data. P= Preliminary data. CARs= Canadian Aviation Regulations. 1 Includes gliders, balloons and gyrocopters, but not ultralights.2 Foreign accidents, test flight accidents and non–revenue flights involved in accidents are not included in the Canadian–registered aircraft accidents for aircraft operating under CARs.
Source: Transport Canada, adapted from the Transportation Safety Board, preliminary data as of March 12, 2021
Table S17: Canadian-Registered Aircraft (CRA) Accident Rates for Aircraft Operating Under CARs, 2015-2020
2015-20192015 2016 2017 2018 2019R Moyenne 2020P
CRA Accidents1 207 185 190 152 189 184.6 144
Private/Recreational Aviation2 135 125 106 95 110 114.2 93Airplanes 120 111 96 83 96 101.2 84Balloons 0 0 0 0 0 0.0 0Gliders 4 4 4 1 3 3.2 2Gyroplanes 1 1 1 2 0 1.0 1Helicopters 10 9 5 9 11 8.8 7
Basic and Advanced Ultralights 13 19 21 15 16 16.8 15
Hours FlownR (thousands) 4,323 4,472 4,718 5,030 4,889 4,686.4 2,550
Accident Rate (per 100,000 hours flown) 4.8 4.1 4.0 3.0 3.9 3.9 5.6
Canadian Civil Aircraft Registered1 29,236 29,081 29,112 29,110 29,169 29,141.6 29,088Private/Recreational Aviation2 21,989 21,915 21,912 21,862 21,785 21,892.6 21,773
Airplanes 19,551 19,469 19,435 19,387 19,331 19,434.6 19,271Balloons 506 506 508 501 492 502.6 498Gliders 721 717 719 716 714 717.4 714Gyroplanes 222 226 229 230 230 227.4 229Helicopters 989 996 1,020 1,028 1,018 1,010.2 1,061
Basic and Advanced Ultralights 7,246 7,355 7,459 7,590 7,682 7,466.4 7,785
Accident Rate (per 1,000 Canadian civil aircraft registered) 7.1 6.4 6.5 5.2 6.5 6.3 5.0
Private/Recreational Aviation 6.0 5.7 4.8 4.3 5.0 5.2 4.3Airplanes 6.1 5.7 4.9 4.3 5.0 5.2 4.4Balloons 0 0 0.0 0 0 0.0 0Gliders 5.5 5.6 5.6 1.4 4.2 4.5 2.8Gyroplanes 4.6 4.4 4.4 8.7 0 4.4 4.4Helicopters 10.1 9 4.9 8.8 10.8 8.7 6.6
Basic and Advanced Ultralights 1.8 2.6 2.8 2.0 2.1 2.3 1.9
Notes: R= Revised data. P= Preliminary data. CARs= Canadian Aviation Regulations.Canadian–registered aircraft, other than ultra–lights, operating in Canada and based on the Canadian Aviation Regulations (CARs). Aircraft accidents not operating in accordance with CARs (i.e. military and state aircraft not operating under CARs) are excluded.1 Excludes aircraft accidents not operating in accordance with CARs. Ultralight aircraft are excluded.2 Recreational aviation comprises all privately registered aircraft except those operated in accordance with CAR 604.
Sources: Transport Canada, adapted from the Transportation Safety Board, preliminary data as of March 12, 2021

tranSportation in canada2020
tranSportation Safety and Security
62
Table S18: Accidents Involving Aircraft Operating under CARs by Province/Territory, 2015–2020
2015 2016 2017 2018 2019R2015-2019
Average 2020P
Accidents Newfoundland and Labrador 5 3 2 2 2 2.8 2Nova Scotia 3 2 2 1 1 1.8 1New Brunswick 2 5 5 1 8 4.2 2Prince Edward Island 0 0 1 0 0 0.2 0Quebec 41 26 39 25 42 34.6 27Ontario 64 40 46 40 44 46.8 31Manitoba 13 16 8 6 11 10.8 9Saskatchewan 12 10 12 13 12 11.8 16Alberta 21 34 32 28 26 28.2 21British Columbia 38 43 34 29 36 36.0 33Yukon 6 1 4 2 2 3.0 0Northwest Territories 2 3 2 4 4 3.0 1Nunavut 0 2 3 1 1 1.4 1Total 207 185 190 152 189 184.6 144
Fatal Accidents Newfoundland and Labrador 1 0 0 0 1 0.4 1Nova Scotia 0 0 0 0 0 0.0 0New Brunswick 0 1 0 0 1 0.4 0Prince Edward Island 0 0 0 0 0 0.0 0Quebec 6 5 4 2 6 4.6 3Ontario 5 1 3 4 5 3.6 0Manitoba 0 1 3 0 1 1.0 0Saskatchewan 2 2 2 1 0 1.4 0Alberta 3 4 3 4 5 3.8 2British Columbia 2 7 2 4 5 4.0 3Yukon 0 0 1 0 1 0.4 0Northwest Territories 0 0 0 1 1 0.4 0Nunavut 0 0 0 0 0 0.0 0Total 19 21 18 16 26 20.0 9
Fatalities Newfoundland and Labrador 1 0 0 0 7 1.6 1Nova Scotia 0 0 0 0 0 0.0 0New Brunswick 0 2 0 0 1 0.6 0Prince Edward Island 0 0 0 0 0 0.0 0Quebec 15 7 6 4 10 8.4 4Ontario 9 1 5 6 9 6.0 0Manitoba 0 2 4 0 3 3.0 0Saskatchewan 3 2 3 1 0 1.8 0Alberta 4 4 5 5 8 5.2 5British Columbia 4 11 3 6 12 7.2 3Yukon 0 0 1 0 2 0.6 0Northwest Territories 0 0 0 3 2 1.0 0Nunavut 0 0 0 0 0 0.0 0Total 36 29 27 25 54 34.2 13
Notes: R= Revised data. P= Preliminary data. CARs= Canadian Aviation Regulations.Canadian–registered aircraft, other than ultra–lights, operating in Canada and based on the Canadian Aviation Regulations (CARs). Aircraft accidents not operating in accordance with CARs (i.e. military and state aircraft) are excluded.
Source: Transport Canada, adapted from the Transportation Safety Board, preliminary data as of March 12, 2021

StatiStical addendum2020
tranSportation Safety and Security
63
Table S19: Reportable Accidents Involving Dangerous Goods by Mode and Phase of Transport, 2010–2019
---------------------------------------In-Transit------------------------------------
Year Road Rail Air Marine Subtotal Not In-Transit Total2010 94 5 1 0 100 203 3032011 89 3 3 0 95 249 3442012 84 1 1 0 86 309 3952013 106 8 5 0 119 277 3962014 110 6 3 0 119 264 3832015 86 9 3 0 98 236 3342016 92 5 4 2 103 188 2912017 226 10 4 0 240 148 3882018 241 21 5 2 269 171 4402019 250 50 1 2 303 134 4372010 - 2019 Average 137.8 11.8 3.0 0.6 153.2 217.9 371.1
Notes: Data for the years 2010 - 2018 have been revised. TDG= Transportation of Dangerous Goods.Thresholds for reporting dangerous goods accidents have changed based on amendments to Part 8 of the TDG Regulations, which came into force on December 1, 2016. Now releases and anticipated releases must satisfy at least one of six specific criteria before requiring “30 day follow-up report “ completion to be considered a reportable accident.The TDG program does not cover dangerous goods transported in bulk on marine vessels or by pipeline. TDG accidents can occur while dangerous goods are being transported, while they are handled, or during temporary storage pending transport. “In-transit” accidents include those that occur during actual transport. “Not-in-transit” accidents are those that take place at facilities where the goods are prepared for transport (handled prior to loading or unloading), unloaded or stored in the course of transport.
Source: Transport Canada, Dangerous Goods Accident Information System

tranSportation in canada2020
tranSportation Safety and Security
64
Table S20: Deaths and Injuries Attributed to the Dangerous Goods at Reportable Accidents, 2010–2019
-------------------------------------------Injuries---------------------------------------------Year Fatalities Major Moderate Minor Total Injuries2010 0 2 7 0 92011 0 2 7 1 102012 0 0 7 7 142013 47 0 18 5 232014 1 0 8 4 122015 4 0 2 81 832016 3 0 8 8 162017 2 1 37 4 422018 2 2 13 9 242019 0 0 4 8 122010 - 2019 Average 5.9 0.7 11.1 12.7 24.5
Notes: Data for the years 2010 - 2018 have been revised. TDG= Transportation of Dangerous Goods.Thresholds for reporting dangerous goods accidents have changed based on amendments to Part 8 of the TDG Regulations, which came into force on December 1, 2016. Now releases and anticipated releases must satisfy at least one of six specific criteria before requiring “30 day follow-up report” completion to be considered a reportable accident. TDG accidents can occur while dangerous goods are being transported, while they are handled, or during temporary storage pending transport. The TDG program does not cover dangerous goods transported in bulk on marine vessels or by pipeline. “In-transit” accidents include those that occur during actual transport. “Not-in-transit” accidents are those that take place at facilities where the goods are prepared for transport (handled prior to loading or unloading), unloaded or stored in the course of transport. Minor injuries refer to those injuries that require first-aid treatment; moderate injuries involve emergency hospital treatment, and major injuries require overnight hospitalization. The Lac-Mégantic, Que. rail accident on July 6, 2013 accounted for 47 of the deaths attributed to the dangerous goods.The Vancouver, B.C. marine terminal accident on March 4, 2015 involving Trichloroisocyanuric Acid, Dry resulted in 80 minor injuries, of which 46 were employees and 34 were private citizens. The Taber, Alta. two vehicle collision on May 4, 2016 involving a highway tank truck transporting diesel fuel and pickup truck caught fire and exploded killing both drivers.One employee died from asphyxiation after inhaling nitrogen vapours during tank truck cleaning and purging operations in Oakville, Ontario on January 27, 2017. The Leeds, Ont. multi-vehicle collision accident on March 14, 2017 involving tote tanks containing Fluorosilicic Acid resulted in one death, one major injury and 32 moderate injuries.
Source: Transport Canada, Dangerous Goods Accident Information System
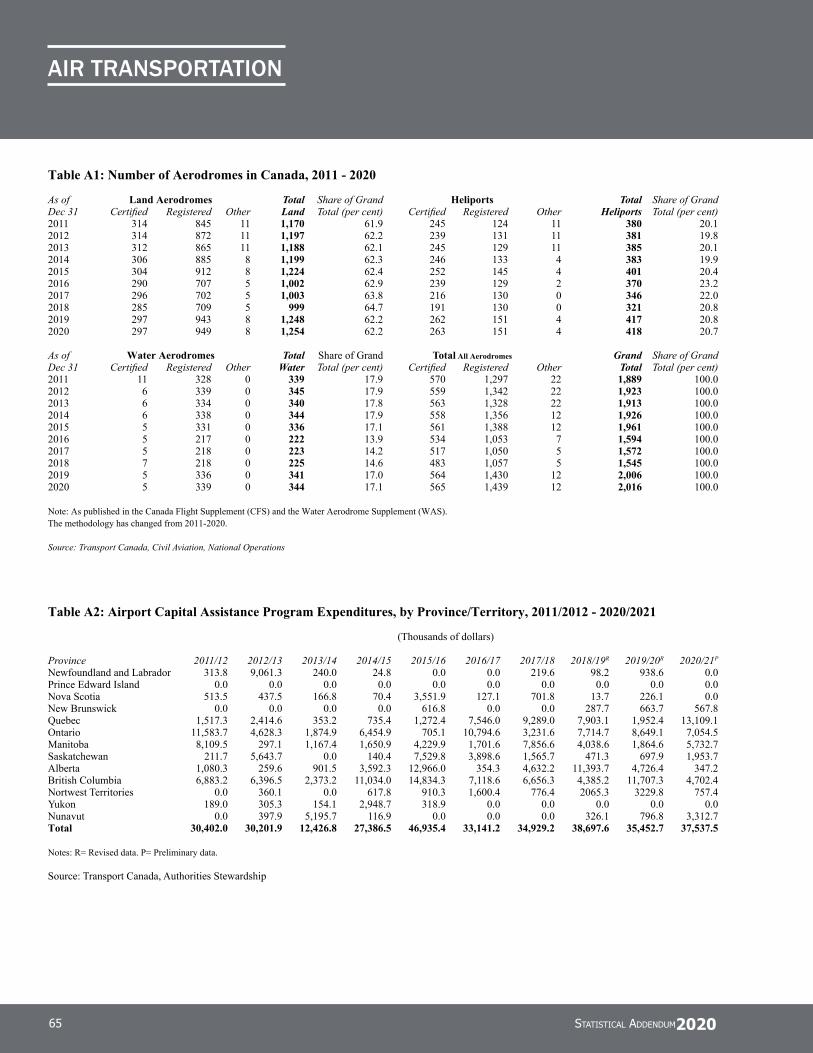
StatiStical addendum202065
air transportation
Table A1: Number of Aerodromes in Canada, 2011 - 2020
As of Land Aerodromes Total Share of Grand Heliports Total Share of GrandDec 31 Certified Registered Other Land Total (per cent) Certified Registered Other Heliports Total (per cent)2011 314 845 11 1,170 61.9 245 124 11 380 20.12012 314 872 11 1,197 62.2 239 131 11 381 19.82013 312 865 11 1,188 62.1 245 129 11 385 20.12014 306 885 8 1,199 62.3 246 133 4 383 19.92015 304 912 8 1,224 62.4 252 145 4 401 20.42016 290 707 5 1,002 62.9 239 129 2 370 23.22017 296 702 5 1,003 63.8 216 130 0 346 22.02018 285 709 5 999 64.7 191 130 0 321 20.82019 297 943 8 1,248 62.2 262 151 4 417 20.82020 297 949 8 1,254 62.2 263 151 4 418 20.7
As of Water Aerodromes Total Share of Grand Total All Aerodromes Grand Share of GrandDec 31 Certified Registered Other Water Total (per cent) Certified Registered Other Total Total (per cent)2011 11 328 0 339 17.9 570 1,297 22 1,889 100.02012 6 339 0 345 17.9 559 1,342 22 1,923 100.02013 6 334 0 340 17.8 563 1,328 22 1,913 100.02014 6 338 0 344 17.9 558 1,356 12 1,926 100.02015 5 331 0 336 17.1 561 1,388 12 1,961 100.02016 5 217 0 222 13.9 534 1,053 7 1,594 100.02017 5 218 0 223 14.2 517 1,050 5 1,572 100.02018 7 218 0 225 14.6 483 1,057 5 1,545 100.02019 5 336 0 341 17.0 564 1,430 12 2,006 100.02020 5 339 0 344 17.1 565 1,439 12 2,016 100.0
Note: As published in the Canada Flight Supplement (CFS) and the Water Aerodrome Supplement (WAS).The methodology has changed from 2011-2020.
Source: Transport Canada, Civil Aviation, National Operations
Table A2: Airport Capital Assistance Program Expenditures, by Province/Territory, 2011/2012 - 2020/2021
(Thousands of dollars)
Province 2011/12 2012/13 2013/14 2014/15 2015/16 2016/17 2017/18 2018/19R 2019/20R 2020/21P
Newfoundland and Labrador 313.8 9,061.3 240.0 24.8 0.0 0.0 219.6 98.2 938.6 0.0Prince Edward Island 0.0 0.0 0.0 0.0 0.0 0.0 0.0 0.0 0.0 0.0Nova Scotia 513.5 437.5 166.8 70.4 3,551.9 127.1 701.8 13.7 226.1 0.0New Brunswick 0.0 0.0 0.0 0.0 616.8 0.0 0.0 287.7 663.7 567.8Quebec 1,517.3 2,414.6 353.2 735.4 1,272.4 7,546.0 9,289.0 7,903.1 1,952.4 13,109.1Ontario 11,583.7 4,628.3 1,874.9 6,454.9 705.1 10,794.6 3,231.6 7,714.7 8,649.1 7,054.5Manitoba 8,109.5 297.1 1,167.4 1,650.9 4,229.9 1,701.6 7,856.6 4,038.6 1,864.6 5,732.7Saskatchewan 211.7 5,643.7 0.0 140.4 7,529.8 3,898.6 1,565.7 471.3 697.9 1,953.7Alberta 1,080.3 259.6 901.5 3,592.3 12,966.0 354.3 4,632.2 11,393.7 4,726.4 347.2British Columbia 6,883.2 6,396.5 2,373.2 11,034.0 14,834.3 7,118.6 6,656.3 4,385.2 11,707.3 4,702.4Nortwest Territories 0.0 360.1 0.0 617.8 910.3 1,600.4 776.4 2065.3 3229.8 757.4Yukon 189.0 305.3 154.1 2,948.7 318.9 0.0 0.0 0.0 0.0 0.0Nunavut 0.0 397.9 5,195.7 116.9 0.0 0.0 0.0 326.1 796.8 3,312.7Total 30,402.0 30,201.9 12,426.8 27,386.5 46,935.4 33,141.2 34,929.2 38,697.6 35,452.7 37,537.5
Notes: R= Revised data. P= Preliminary data.
Source: Transport Canada, Authorities Stewardship

tranSportation in canada2020 66
air tranSportation
Table A3: Airport Authorities Financial Performance, 2019
(Thousands of dollars, except where indicated)
Financial Information Calgary Vancouver Edmonton Montreal Toronto Ottawa Winnipeg Victoria Halifax Saskatoon Kelowna
Aeronautical Revenues 122,590 146,297 59,069 250,625 517,597 41,354 49,195 7,436 32,680 7,783 7,875 Non-Aeronautical Revenues 146,029 246,735 70,967 225,278 567,435 42,720 41,724 16,481 38,168 11,665 15,002 Airport Improvement Fees 163,344 170,981 98,616 236,438 448,082 53,988 48,862 14,226 43,527 13,376 16,609 Contributions 0 7,739 2,999 0 0 0 0 1,028 0 783 297 Total Revenues 431,963 571,752 231,651 712,341 1,533,114 138,062 139,781 39,171 114,375 33,607 39,783
Expenses(less Interest Charges) 354,149 413,892 168,558 436,823 915,345 101,913 93,748 28,072 79,462 23,745 23,927 Rent to Federal Government 43,778 60,288 19,999 76,658 170,803 10,553 9,730 1,851 8,449 1,397 0 Income 34,036 97,572 43,094 198,860 446,966 25,596 36,303 9,248 26,464 8,465 15,856
Interest Charges 102,899 31,470 40,830 102,017 307,147 20,531 32,894 5 14,968 0 816 Other gains/(losses) 9,287 9,500 (430) (3,540) 10,164 (1,494) 40 0 (3,983) 0 135 Net Income (59,576) 75,602 1,834 93,303 149,983 3,571 3,449 9,243 7,513 8,465 15,175
Acquisition of capital assets 76,577 610,639 38,925 283,293 421,864 36,300 60,131 26,369 35,090 22,390 14,773
Ratios:Expenses (incl interest) as a % of Rev. 105.8% 77.9% 90.4% 75.6% 79.7% 88.7% 90.6% 71.7% 82.6% 70.7% 62.2%Aeronautical Revenues as a % of Total 28.4% 25.6% 25.5% 35.2% 33.8% 30.0% 35.2% 19.0% 28.6% 23.2% 19.8%Non-Aeronautical Revenues as a % of Total 33.8% 43.2% 30.6% 31.6% 37.0% 30.9% 29.8% 42.1% 33.4% 34.7% 37.7%
Financial Information Quebec Regina St. John’sThunder
Bay London Moncton Saint JohnCharlotte-
town Gander FrederictonPrince
George TotalAeronautical Revenues 15,131 5,196 11,090 8,139 4,112 6,713 1,667 2,734 3,310 2,643 4,596 1,307,832 Non-Aeronautical Revenues 28,393 11,951 14,845 4,426 5,376 5,134 2,030 3,400 4,097 2,741 4,673 1,509,270 Airport Improvement Fees 26,805 10,659 23,357 0 3,207 7,843 3,280 3,830 2,529 5,025 5,203 1,399,787 Contributions 3,515 253 0 323 0 0 379 1,178 1,183 1,187 1,517 22,381 Total Revenues 73,844 28,059 49,292 12,888 12,695 19,690 7,356 11,142 11,119 11,596 15,989 4,239,270
Expenses (less Interest Charges) 57,555 26,271 37,835 10,287 10,387 15,928 7,191 9,275 10,208 8,859 11,636 2,845,066 Rent to Federal Government 4,277 993 2,878 208 189 515 23 50 63 61 292 413,055 Income 12,012 795 8,579 2,393 2,119 3,247 142 1,817 848 2,676 4,061 981,149
Interest Charges 6,627 1,589 5,230 591 177 897 0 0 416 32 505 669,641 Other gains/(losses) 26 0 3,802 3,673 135 0 81 3 559 0 223 28,181 Net Income 5,411 (794) 7,151 5,475 2,077 2,350 223 1,820 991 2,644 3,779 339,689
Acquisition of capital assets 42,883 4,494 15,751 2,943 11,005 9,684 18,642 1,702 4,495 11,381 9,072 1,758,403
Ratios:Expenses (incl interest) as a % of Rev. 86.9% 99.3% 87.4% 84.4% 83.2% 85.4% 97.8% 83.2% 95.5% 76.7% 75.9% 82.9%Aeronautical Revenues as a % of Total 20.5% 18.5% 22.5% 63.2% 32.4% 34.1% 22.7% 24.5% 29.8% 22.8% 28.7% 30.9%Non-Aeronautical Revenues as a % Total 38.4% 42.6% 30.1% 34.3% 42.3% 26.1% 27.6% 30.5% 36.8% 23.6% 29.2% 35.6%
Notes: Aeronautical revenues are generated principally from airlines and other commercial aviation sources, and consist mainly of landing fees, terminal fees and the recovery of security costs.
Revenues from concessionaire sales (stores, restaurants etc.), car parking and space rental are considered non-aeronautical.Rent figures may differ from the actual cash received by the Federal Government due to accrual accounting treatment.
Source: Airport Authority 2019 Annual Reports (Consolidated Financial Statements)

StatiStical addendum2020
air tranSportation
67
Table A4: Airport Improvement Fees (AIF) at National Airport System (NAS) Airports, 2011–2020
Charge per passenger (dollars)
As of January 1Airline Handling
Fee(per cent)Airport 2011 2012 2013 2014 2015 2016 2017 2018 2019 2020
Calgary 25 25 30 30 30 30 30 30 30 30 5 Charlottetown 20 20 20 20 20 20 20 20 20 20 5 Edmonton 20 25 25 25 30 30 30 30 30 30 6 Fredericton 20 20 20 20 20 20 20 20 25 25 5 Gander 20 25 25 25 25 25 25 25 35 35 7 Halifax1 20 20 20 25 25 25 25 28 28 28 7 Iqaluit 0 0 0 0 0 0 0 0 0 0 N/AKelowna2 12 15 15 15 15 15 15 15 20 20 7 London 15 15 15 15 15 15 15 15 7 7 7 Moncton 20 20 20 20 20 20 20 25 25 25 7 Montreal (Trudeau) 25 25 25 25 25 25 25 25 30 30 5 Ottawa3 20 20 20 23 23 23 23 23 23 23 7 Prince George 18 18 20 20 20 25 25 25 25 25 7 Quebec City 25 25 27 29 30 33 33 35 35 35 7 Regina 4 15 20 20 20 20 20 20 20 20 20 7 Saint John 20 20 20 25 25 25 25 25 25 25 5 Saskatoon5 15 15 20 20 20 20 20 20 20 20 7 St. John’s 20 20 20 20 30 30 30 35 35 35 7 Thunder Bay 0 0 0 0 0 0 0 0 0 0 N/AToronto6 25 25 25 25 25 25 25 25 25 25 4 Vancouver7 15 15 20 20 20 20 20 20 25 25 5 Victoria 10 10 10 10 15 15 15 15 15 15 7 Whitehorse 0 0 0 0 0 0 0 0 0 0 N/AWinnipeg8 20 20 25 25 25 25 25 25 25 25 7 Yellowknife 0 0 0 0 0 0 0 0 0 0 N/A
Notes: N/A= Not applicable.1 Passengers are charged $15 for flights to: Sydney/J.A Douglas McCurdy, NS.2 Effective February 19, 2020. AIF increased to $25.3 Effective September 30, 2020. AIF increases to $28.4 Passengers are charged $5 for intra-provincial flights and $20 for all other destinations. 5 Passengers are charged $5 for intra-provincial flights and $15 for all other destinations. Effective March 1, 2020, AIF increased to $23.6 Connecting passengers are charged $4.7 Passengers are charged $5 for intra-provincial flights and $25 for all other destinations.8 Effective September 1, 2020. AIF increases to $38.
Source: Air Transport Association of Canada and Airport Authorities
Table A5: Air Travellers Security Charge (ATSC), 2002–2020
ATSC Rates (Current dollars per enplaned passenger)
---------------------------------------------------------- Effective Date ---------------------------------------------------------- Current sinceApril 1stApril 1st
20021March 1st
20031April 1st
20041March 1st
20051July 1st
20061January 1st
20081Sector 20101
Domestic (One-way) $12.0 $7.0 $6.0 $5.0 $5.0 $4.9 $7.5Domestic (Round-trip) $24.0 $14.0 $12.0 $10.0 $9.9 $9.8 $15.0Transborder2 $12.0 $12.0 $10.0 $8.5 $8.4 $8.3 $12.7Other International $24.0 $24.0 $20.0 $17.0 $17.0 $17.0 $25.9
Notes: GST/HST = Goods and Services Tax/Harmonized Sales Tax.1 The total charge includes the GST or the federal portion of HST where applicable. From April 1, 2002 to June 30, 2006, the rate of GST and HST was 7% and 15%, respectively; From July 1, 2006 to December 31, 2007, the rate of GST and HST was 6% and 14%, respectively ; Effective January 1, 2008, the rate of GST has been established at 5%. As of July 2010, the rate of HST was 12% in British Columbia; 13% in Ontario, New Brunswick, and Newfoundland and Labrador, respectively and 15% in Nova Scotia. Additional information on GST/HST rates is available from the Canada Revenue Agency and the TaxTips.ca websites.2 Transborder ATSC rate is for air travel to a destination outside Canada but within the continental zone (Include Mexico)
Sources: Transport Canada, adapted from Finance Canada, Canada Revenue Agency, ATSC Rates

tranSportation in canada2020
air tranSportation
68
Table A6: Top 10 Busiest Canadian Airports in Terms of Aircraft Movements, 2011–2020
(Thousands of aircraft movements)
All MovementsRanking 2011-2020
CAGR12020 Airport/Province 2011 2012 2013 2014 2015 2016 2017 2018 2019 2020P
1 Boundary Bay, BC 147 149 146 156 162 172 175 195 217 173 1.8 2 Toronto Pearson International, ON 429 435 434 437 446 459 467 476 455 164 (10.1)3 Vancouver International, BC 298 300 302 312 319 326 334 339 332 146 (7.6)4 Abbotsford, BC 100 111 118 126 136 131 139 148 168 130 2.9 5 Calgary/Springbank, AB 133 133 135 147 151 158 143 137 154 119 (1.3)6 Calgary International, AB 238 241 246 252 250 235 234 244 239 111 (8.1)7 Québec City Jean Lesage International Airport, QC 131 135 120 114 112 118 123 139 146 111 (1.8)8 Montréal/St-Hubert, QC 170 157 170 157 179 151 126 137 154 103 (5.5)9 Kitchener/Waterloo, ON 97 104 107 96 102 110 102 119 141 99 0.2 10 Pitt Meadows, BC 111 88 78 83 103 109 110 118 143 95 (1.7)
Subtotal 1,855 1,854 1,854 1,878 1,959 1,970 1,952 2,053 2,150 1,250 (4.3)Share of total movements - Top 10 airports (%) 29.5 29.4 29.8 30.1 31.4 31.5 30.7 31.5 32.9 31.4 0.7 Total for All Airports2- All movements 6,283 6,302 6,230 6,232 6,246 6,247 6,361 6,526 6,536 3,976 (5.0) Itinerant movements 4,619 4,668 4,645 4,595 4,628 4,585 4,679 4,730 4,643 2,635 (6.0) Local movements 1,664 1,633 1,585 1,637 1,618 1,662 1,683 1,797 1,894 1,341 (2.4) Share Itinerant movements (%) 73.5 74.1 74.6 73.7 74.1 73.4 73.5 72.5 71.0 66.3 (1.1) Share Local movements (%) 26.5 25.9 25.4 26.3 25.9 26.6 26.5 27.5 29.0 33.7 2.7
Itinerant Movements3
1 Toronto Pearson International, ON 428 434 433 435 445 457 465 474 453 164 (10.1)2 Vancouver International, BC 298 299 301 311 318 321 332 339 331 145 (7.7)3 Calgary International, AB 236 240 244 250 249 234 233 244 239 110 (8.1)4 Montréal-Pierre Elliott Trudeau International, QC 233 233 224 220 221 226 235 241 237 91 (10.0)5 Edmonton Intl, AB 132 139 153 166 157 137 138 142 134 65 (7.6)6 Montréal/St-Hubert, QC 82 77 79 75 85 79 72 75 90 65 (2.5)7 Winnipeg James Armstrong Richardson Int’l, MB 125 120 116 116 113 110 114 112 109 64 (7.1)8 Boundary Bay, BC 60 60 62 66 66 67 69 72 82 63 0.6 9 Québec City Jean Lesage International Airport, QC 91 97 89 83 80 81 85 87 89 59 (4.8)10 Calgary/Springbank, AB 52 54 55 59 59 60 57 57 62 52 (0.0)
Subtotal 1,736 1,752 1,756 1,781 1,792 1,773 1,800 1,842 1,827 877 (7.3)Share of total Itinerant movements - Top 10 airports (%) 37.6 37.5 37.8 38.8 38.7 38.7 38.5 39.0 39.3 33.3 (1.3)Total for All Airports2 - All Itinerant movements 4,619 4,668 4,645 4,595 4,628 4,585 4,679 4,730 4,643 2,635 (6.0)
Local Movements 4
1 Boundary Bay, BC 87 89 84 90 95 106 107 124 135 110 2.6 2 Abbotsford, BC 60 71 74 80 86 82 83 89 101 80 3.2 3 Calgary/Springbank, AB 81 79 79 88 92 98 86 80 92 67 (2.2)4 Chicoutimi/St-Honore, QC 49 50 48 52 45 60 75 76 68 62 2.6 5 Pitt Meadows, BC 72 55 49 52 61 63 62 69 86 58 (2.3)6 Kitchener/Waterloo, ON 54 59 62 56 59 63 59 71 83 56 0.6 7 Winnipeg/St Andrews, MB 66 57 63 62 53 62 65 75 84 55 (2.0)8 Québec City Jean Lesage International Airport, QC 39 38 31 31 32 36 38 51 58 52 3.2 9 Fredericton, NB 33 44 51 55 60 65 59 52 63 46 3.9 10 Moncton/Greater Moncton International, NB 32 20 21 30 33 44 48 52 56 39 2.3
Subtotal 574 563 562 595 616 679 681 740 826 627 1.0 Share of total Local movements - Top 10 airports (%) 34.5 34.4 35.5 36.3 38.1 40.8 40.5 41.2 43.6 46.8 3.4 Total for All Airports2 - All Local movements 1,664 1,633 1,585 1,637 1,618 1,662 1,683 1,797 1,894 1,341 (2.4)
Notes: P= Preliminary data.1 CAGR= Compound Annual Growth Rate.2 Including airports with control towers and/or flight service stations (91 as of December 2017) and airports without control towers or flight service stations reporting aircraft
movements on a voluntary basis (126 as of December 2017).3 Itinerant movements are those in which aircraft arrive from or depart to a point other than the reporting airport; or where aircraft leave the circuit (i.e. a pattern or a standard
path for coordinating air traffic usually at close proximity of the airport) but return without landing at another airport.4 Local movements are those in which aircraft remain in the circuit (i.e. a pattern or a standard path for coordinating air traffic usually at close proximity of the airport). Local
movements are often carried out during training flights (touch-and-go), equipment tests, etc.
Sources: Statistics Canada, “Aircraft Movement Statistics”, TP 577, Cat. 51-209 and 51-210. Transport Canada, Aircraft movement database, for 2020 data

StatiStical addendum2020
air tranSportation
69
Table A8: Civil Aviation Personnel Licences and Permits by Category as of December 2020
Category In ForceIssued 12
Months Male FemaleAeroplanesPrivate Pilot 15,214 1,978 13,885 1,329Commercial Pilot 2,013 374 1,852 161Airline Transport Pilot 3,224 128 3,029 195Multi-Crew Pilots 0 0 0 0Total 20,451 2,480 18,766 1,685
HelicoptersPrivate Pilot 420 24 407 13Commercial Pilot 1,111 68 1,066 45Airline Transport Pilot 431 12 413 18Total 1,962 104 1,886 76
PermitsGyroplane Pilot 29 2 29 0Ultra-Light Pilot 2,135 92 2,071 64Recreational Pilot 851 51 814 37Total 3,015 145 2,914 101
Other LicencesGlider Pilot 5,310 52 4,669 641Balloon Pilot 94 2 84 10Flight Engineer 88 0 86 2Air Traffic Controller 602 21 486 116Total 6,094 75 5,325 769
Total Licences & Permits 31,522 2,804 28,891 2,631
Note: Excludes student pilot permits
Source: Transport Canada, Safety and Security, Civil Aviation
Table A7: Licence Authorities Held by Air Carriers as of December 31, 2020
--------------------------- Services ----------------------------------- Licence Domestic International Total Number of Aircraft Type Scheduled Non-Scheduled Licences Air Carriers1
Total Canada 617 328 298 1,243 555 Small aircraft 540 9 237 786 Medium aircraft 23 37 20 80 Large aircraft 15 176 15 206 All cargo aircraft 39 106 26 171
Total United States 0 42 567 609 573 Total Foreign 0 120 215 335 261
Total 617 490 1,080 2,187 1,389
Note: Represents licence authorities held by air carriers; however, an air carrier can hold multiple licence authorities.1 Number of air carriers holding Canadian Transportation Agency licences, by nationality.
Source: Canadian Transportation Agency
Table A9: Personnel Licences and Permits by Province/ Territory, as of December2019 and 2020
Province/TerritoryNumber of
LicencesNumber of
LicencesGrowth
(per cent)2019 2020 2109 - 2020
Ontario 17,716 11,045 (37.7)British Columbia 10,912 8,760 (19.7)Quebec 10,887 6,467 (40.6)Alberta 8,354 6,007 (28.1)Manitoba 2,527 1,758 (30.4)Saskatchewan 1,852 1,388 (25.1)Other 1,827 1,228 (32.8)New Brunswick 1,367 834 (39.0)Nova Scotia 893 635 (28.9)Newfoundland and Labrador 629 405 (35.6)Yukon 282 218 (22.7)Northwest Territories 255 140 (45.1)Prince Edward Island 127 84 (33.9)Nunavut 15 13 (13.3)Total 57,643 38,982 (32.4)
Note: Including student pilot permits.
Source: Transport Canada, Safety and Security, Civil Aviation

tranSportation in canada2020
air tranSportation
70
Table A10: Total Operating Revenues of Canadian Air Carriers, 2010-2019
(millions of dollars)
YearPassenger
ServicesGoods
ServicesOther
Services1 TotalGrowth
(per cent)2010 15,356 1,159 837 17,352 - 2011 16,930 1,196 941 19,067 9.9 2012 18,081 1,225 1,037 20,343 6.7 2013 18,525 1,178 1,113 20,816 2.3 2014 19,726 1,209 1,374 22,309 7.2 2015 20,058 1,202 1,573 22,833 2.3 2016 20,319 1,257 1,655 23,231 1.7 2017R 22,460 1,486 1,602 25,549 10.0 2018 24,561 1,703 1,586 27,850 9.0 2019 25,724 1,718 2,017 29,460 5.8
CAGR 2010-2019 (per cent) 5.3 4.0 9.2 5.4
Notes: R= Revised data. CAGR: Compounded Average Growth Rate.Scheduled and charter services, passengers and goods, for Level I to Level III carriers1 Other services include other flying services, subsidies and net incidental air transport related revenue.
Source: Statistics Canada. Table 401-0069 - Civil aviation financial statistics, Canadian air carriers, Levels I to III, annual (dollars)
Table A11: Annual Labour Costs per Employee of Canadian Air Carriers, 2008-2019
Average Annual Salary
Levels I-III1 2008 2009 2010 2011 2012R 2013R 2014R 2015R 2016R 2017R 2018P 2019P
Pilots and Copilots 98,726 101,390 102,225 105,963 113,595 116,276 116,571 114,130 124,432 122,197 128,285 131,765 Other Flight Personnel 44,559 43,698 44,523 48,605 51,418 52,361 49,901 57,924 50,182 50,350 52,204 51,003 Management and Administration 84,596 76,091 75,058 80,632 75,242 80,607 76,431 87,235 95,509 100,342 112,941 122,597 Other Carrier Personnel2 52,873 52,840 49,079 53,444 54,771 55,089 56,854 58,773 60,476 57,655 59,371 58,567 Total Levels I - III 63,729 62,969 59,460 64,140 66,700 67,880 68,084 71,930 71,861 70,011 72,712 72,919
Average Number of Employees
Levels I-III1 2008 2009 2010 2011 2012R 2013R 2014R 2015R 2016R 2017R 2018P 2019P
Pilots and Copilots 9,925 9,504 9,667 10,094 10,236 10,426 10,420 11,261 10,485 11,315 11,849 12,469 Other Flight Personnel 11,485 10,901 11,770 12,042 12,176 12,426 12,469 11,598 13,499 14,543 15,572 16,168 Management and Administration 2,996 3,098 3,355 3,543 4,276 4,058 4,495 4,098 3,174 3,188 3,164 3,325 Other Carrier Personnel2 17,475 19,324 27,930 27,444 27,702 28,411 28,144 28,540 29,305 32,473 34,962 37,946 Total Levels I - III 41,881 42,827 52,722 53,123 54,390 55,321 55,528 55,497 56,463 61,519 65,547 69,908
Notes: R=Revised data. P=Preliminary data.1 Levels I-III (from 2001): Canadian air carriers that in each of the two calendar years immediately preceding the report year, realized annual gross revenues of $1 million or
more for the air services for which the air carrier held a license.2 Including maintenance labour, aircraft and traffic servicing, and other personnel.
Source 2007-2011: Statistics Canada, Civil Aviation, Annual Operating and Financial Statistics, Canadian Air Carriers, Levels I to III, Cat. 51-004, various issues.Source 2012-2015: Statistics Canada. Table 23100266 (formerly 401-0072) - Civil aviation employment and fuel consumption, Canadian air carriers, Levels I to III, annual.Source 2016-2019: Statistics Canada. Civil Aviation, Annual Survey.

StatiStical addendum2020
air tranSportation
71
Table A12: Average Scheduled Daily Seat-Kilometres, by Air Carrier, Domestic Sector, 2019 and 2020
Daily Seat-Kilometres2 (million) Percentage Capacity Share (per cent)Airlines1 2019 2020 Change 2019 2020Air Canada FamilyAir Canada3 89.5 40.2 (55.1) 44.0 44.4Air Canada Expess - Jazz 19.4 8.6 (56.0) 9.6 9.5Air Canada Express - Others4 1.1 1.0 (10.4) 0.5 1.1Total 110.0 49.7 (54.8) 54.1 55.0
National and Leisure AirlinesWestJet5 64.7 27.5 (57.6) 31.8 30.4Swoop Inc. 7.0 3.2 (55.1) 3.5 3.5Porter Airlines 4.5 0.8 (83.4) 2.2 0.8Flair Airlines 3.7 2.2 (39.6) 1.8 2.5Air Transat6 3.6 1.2 (65.2) 1.8 1.4Sunwing Airlines6 0.5 0.3 (45.8) 0.2 0.3Total 84.1 35.1 (58.2) 41.3 38.8
Northern AirlinesCanadian North7 3.5 1.9 (47.4) 1.7 2.1Air North 1.3 0.7 (44.4) 0.6 0.8Air Inuit 0.8 0.5 (40.2) 0.4 0.5Northern Airlines - Others8 0.7 0.5 (32.4) 0.4 0.5Total 6.4 3.6 (44.1) 3.1 3.9
Local Service Airlines 3.0 2.1 (29.9) 1.5 2.3
Grand Total 203.4 90.5 (55.5) 100.0 100.0
Notes:1 Air Carriers listed are the marketing airlines, with the exception of the Air Canada Family.2 Daily average seat-kilometres in 2019 and 2020 are based on the full year.3 Air Canada includes domestic portion of Air Canada rouge flights.4 Air Canada Express - Others includes services operated for Air Canada by Exploit Valley Air Services, Sky Regional and Air Georgian.5 WestJet includes WestJet Encore.6 Domestic portion of international flights, only those flights designated as scheduled flights are included.7 Canadian North includes First Air.8 Northern Airlines - Others includes airlines Kenn Borek Air, Aklak, Air Tindi, North-Wright Airways, Northwestern Airlease and Calm AirTotals may not add up due to rounding.
Sources: Airport IS, Transport Canada

tranSportation in canada2020
air tranSportation
72
Table A13 : Competition in the Top 25 Deomestic Air Markets as of Dec 31, 2020
------------------ Capacity Market Shares (per cent) ---------------
Rank Market1 Daily Seats2
2020
Percentage change over
2019 Air Canada3 WestJet4 Porter Airlines OthersDaily Seats2
20191 Vancouver, BC6 - Toronto, ON5 4,875 (49.2) 70.8 23.4 0.0 5.8 9,588 2 Montreal, QC7 - Toronto, ON 4,679 (61.6) 71.9 17.6 6.4 4.1 12,177 3 Calgary, AB - Toronto, ON 3,995 (46.1) 49.0 46.2 0.0 4.8 7,417 4 Vancouver, BC - Calgary, AB 3,696 (50.9) 45.4 50.1 0.0 4.5 7,531 5 Ottawa, ON - Toronto, ON 2,846 (64.5) 55.5 31.2 13.3 0.0 8,018 6 Vancouver, BC - Victoria, BC8 2,377 (20.3) 35.8 15.4 0.0 48.8 2,984 7 Edmonton, AB - Toronto, ON 2,073 (55.8) 55.8 34.2 0.0 10.0 4,687 8 Edmonton, AB - Vancouver, BC 2,061 (56.4) 53.3 39.1 0.0 7.7 4,730 9 Halifax, NS - Toronto, ON 1,772 (55.6) 57.9 40.5 0.3 1.2 3,991 10 Nanaimo, BC9 - Vancouver, BC 1,549 21.6 30.7 4.7 0.0 64.6 1,274 11 Winnipeg, MB - Toronto, ON 1,532 (58.5) 51.3 42.3 0.0 6.4 3,688 12 Edmonton, AB - Calgary, AB 1,464 (55.4) 30.1 67.9 0.0 2.0 3,286 13 Montreal, QC - Vancouver, BC 1,392 (44.3) 93.4 0.0 0.0 6.6 2,500 14 Kelowna, BC - Vancouver, BC 1,218 (52.9) 59.8 36.9 0.0 3.3 2,584 15 Winnipeg, MB - Calgary, AB 1,141 (52.2) 15.6 75.8 0.0 8.6 2,385 16 Kelowna, BC - Calgary, AB 1,029 (53.1) 10.3 86.3 0.0 3.4 2,194 17 Fort McMurray, AB - Calgary, AB 836 (35.4) 41.1 58.9 0.0 0.0 1,294 18 Saskatoon, SK - Calgary, AB 835 (59.0) 16.7 83.3 0.0 0.0 2,038 19 Thunder Bay, ON - Toronto, ON 833 (62.4) 56.1 24.6 19.3 0.0 2,213 20 Calgary, AB - Victoria, BC 832 (50.4) 17.8 82.2 0.0 0.0 1,677 21 Montreal, QC - Calgary, AB 807 (49.3) 76.8 18.4 0.0 4.7 1,592 22 Vancouver, BC - Prince George, BC 772 (49.8) 43.3 51.2 0.0 5.5 1,535 23 Quebec, QC - Montreal, QC 745 (55.4) 70.2 0.0 11.3 18.5 1,673 24 St. Johns, NL - Toronto, ON 725 (65.1) 72.1 27.6 0.0 0.3 2,078 25 Regina, SK - Calgary, AB 716 (53.7) 15.1 84.9 0.0 -0.0 1,548
Notes :1 The top 25 markets are ranked on the number of 2020 daily seats.2 The number of daily seats is defined as the average number of seats offered on non-stop flights in each direction.3 Data for Air Canada includes the number of seats operated by Air Canada Rouge and Air Canada Express.4 Data for WestJet includes the number of seats operated by WestJet Encore.5 Toronto, ON includes Toronto Lester B Pearson International Airport and Toronto Billy Bishop City Centre Airport.6 Montreal, QC includes Montréal Pierre Élliot Trudeau airport and Montreal St-Hubert Airport.7 Vancouver, BC includes Vancouver International Airport and Vancouver Harbour.8 Victoria, BC includes Victoria Internation Airport and Victoria Harbour.9 Nanaimo, BC includes Nanaimo Airport and Nanaimo Harbour.
Source : IATA AirportIS SRS.

StatiStical addendum2020
air tranSportation
73
Table A14: Top 20 busiest Canadian airports in terms of Enplaned/Deplaned Revenue Passengers, 2011-2020
RankingAverage2011-2020
2011-2020Sector, Airport / Province 2011R 2012R 2013R 2014R 2015R 2016R 2017R 2018R 2019R 2020P CAGR
1 Toronto Pearson International, ON 32.4 34.0 35.2 37.2 39.7 43.1 46.0 48.4 49.1 12.9 (9.7)2 Vancouver International, BC 16.6 17.1 17.5 19.0 19.6 21.7 23.6 25.3 25.4 7.1 (9.0)3 Calgary International, AB 12.1 12.9 13.5 14.4 14.6 14.9 15.6 16.7 17.2 5.3 (8.7)4 Montréal Trudeau International, QC 13.3 13.4 13.5 14.3 14.8 16.0 17.6 18.8 19.5 5.1 (10.0)5 Edmonton International, AB 6.2 6.7 7.2 7.7 7.5 7.1 7.7 7.9 7.9 2.4 (10.0)6 Ottawa Macdonald-Cartier Int’l, ON 4.4 4.5 4.4 4.5 4.5 4.7 4.8 5.0 5.0 1.3 (12.4)7 Winnipeg Richardson International, MB 3.4 3.4 3.4 3.6 3.7 4.0 4.3 4.2 4.1 1.2 (11.1)8 Halifax Robert L. Stanfield Int’l, NS 3.5 3.5 3.5 3.6 3.6 3.8 4.0 4.2 4.1 1.0 (13.4)9 Kelowna International, BC 1.4 1.4 1.5 1.6 1.5 1.7 1.9 2.0 2.0 0.7 (7.1)10 Victoria International, BC 1.5 1.5 1.5 1.6 1.7 1.8 1.9 2.0 1.9 0.5 (10.4)
Total - Top 10 Airports 94.6 98.5 101.3 107.4 111.1 118.8 127.4 134.5 136.1 37.5 (9.8)
11 Aéroport Int’l Jean-Lesage de Québec, QC 1.4 1.4 1.5 1.5 1.5 1.5 1.6 1.7 1.7 0.5 (10.4)12 Saskatoon John G. Diefenbaker, SK 1.2 1.3 1.4 1.5 1.4 1.4 1.4 1.5 1.5 0.4 (10.5)13 St John’s International, NL 1.3 1.4 1.4 1.5 1.5 1.5 1.5 1.5 1.4 0.4 (13.3)14 Regina International, SK 1.1 1.2 1.2 1.2 1.2 1.3 1.2 1.2 1.2 0.4 (11.7)15 John C Munro Hamilton Int’l, ON 0.3 0.3 0.3 0.3 0.3 0.4 0.8 0.7 1.0 0.3 (1.8)16 Thunder Bay, ON 0.7 0.7 0.7 0.7 0.7 0.8 0.8 0.8 0.8 0.3 (10.1)17 Abbotsford International, BC C C C C C C C C C C18 Fort McMurray, AB 0.7 0.9 1.1 1.2 1.0 0.7 0.7 0.6 0.6 0.2 (12.0)19 London International, ON 0.5 0.5 0.5 0.5 0.5 0.5 0.5 0.5 0.7 0.2 (8.6)20 Fort MacKay/Albian, AB C C C C C C C C C C
Total - Top 20 Airports1 102.2 106.8 110.1 116.6 120.0 127.7 137.0 144.1 146.2 40.6 (9.7)
Grand Total for All Airports 113.7 119.3 123.0 130.1 133.8 142.0 151.9 159.5 162.0 45.6 (9.6)Top 10’s Share (%) of Grand Total 83.2 82.5 82.3 82.5 83.1 83.7 83.9 84.3 84.0 82.3Top 20’s Share (%) of Grand Total 89.9 89.5 89.5 89.6 89.7 89.9 90.2 90.3 90.3 89.1
C= Confidential data. E/D= Enplaned/Deplaned passengers. CAGR= Compounded Annual Growth Rate.1 Toronto Billy Bishop Airport ranks amongst the top 20 airports, but was not included due to confidentiality.
Source: Transport Canada, ECATS database

tranSportation in canada2020
air tranSportation
74
Table A15: Top 10 Busiest Canadian Airports in Terms of Enplaned/Deplaned Revenue Passengers, by Sector, 2011–2020
RankingAverage 2011-20202011-20 Sector, Airport/Province 2011R 2012R 2013R 2014R 2015R 2016R 2017R 2018R 2019R 2020P CAGR
Domestic1
1 Toronto Pearson International, ON 13.0 13.7 14.3 15.0 15.7 16.7 17.2 17.6 17.6 5.2 (9.6)2 Vancouver International, BC 8.6 9.0 9.2 9.8 10.0 10.9 11.5 12.1 12.3 4.1 (8.0)3 Calgary International, AB 8.3 8.9 9.4 10.0 10.2 10.5 10.9 11.7 11.8 4.0 (7.8)4 Edmonton International, AB 4.7 5.2 5.6 5.9 5.8 5.8 6.4 6.5 6.5 2.0 (9.0)5 Montréal Trudeau International, QC 5.0 5.2 5.1 5.4 5.5 6.1 6.6 6.8 6.9 1.9 (10.2)6 Ottawa Macdonald-Cartier Int’l, ON 3.2 3.3 3.2 3.3 3.4 3.6 3.8 3.9 3.9 1.0 (12.2)7 Winnipeg Richardson International, MB 2.8 2.8 2.8 2.9 3.1 3.4 3.7 3.6 3.5 0.9 (11.8)8 Halifax Robert L. Stanfield Int’l, NS 2.8 2.8 2.8 2.9 3.0 3.2 3.4 3.6 3.5 0.8 (12.6)9 Kelowna International Airport, BC 1.2 1.3 1.3 1.4 1.4 1.6 1.7 1.9 1.8 0.6 (6.7)10 Victoria International Airport, BC 1.2 1.2 1.2 1.3 1.4 1.5 1.6 1.6 1.6 0.5 (9.2)
Subtotal (Domestic) 50.9 53.2 55.1 58.0 59.4 63.2 66.8 69.3 69.3 21.1 (9.3)
Transborder1
1 Toronto Pearson International, ON 8.7 9.3 9.7 10.2 10.9 11.8 12.7 13.4 13.6 3.0 (11.2)2 Vancouver International, BC 4.1 4.2 4.2 4.6 4.9 5.4 5.9 6.2 6.3 1.3 (11.8)3 Montréal Trudeau International, QC 3.1 3.1 3.2 3.4 3.5 3.8 4.0 4.3 4.4 1.0 (11.5)4 Calgary International, AB 2.5 2.7 2.7 3.0 3.0 2.9 3.1 3.3 3.5 0.8 (11.8)5 Edmonton International, AB 1.1 1.2 1.2 1.3 1.2 0.9 0.9 1.0 1.0 0.2 (16.6)6 Ottawa Macdonald-Cartier Int’l, ON 0.7 0.8 0.8 0.7 0.7 0.7 0.6 0.7 0.7 0.2 (15.5)7 Winnipeg Richardson International, MB 0.5 0.5 0.5 0.5 0.4 0.4 0.4 0.4 0.5 0.1 (12.7)8 Halifax Robert L. Stanfield Int’l, NS 0.4 0.4 0.4 0.4 0.3 0.3 0.3 0.3 0.4 0.1 (18.2)9 Aéroport Int’l Jean-Lesage de Québec, QC 0.2 0.3 0.3 0.2 0.2 0.2 0.2 0.2 0.2 0.1 (15.5)10 Hamilton International Airport, ON C C C C C C C C C C
Subtotal (Transborder) 21.3 22.2 22.8 24.4 25.2 26.4 28.1 29.9 30.7 6.8 (11.9)
Other International1 Toronto Pearson International, ON 10.6 11.1 11.3 12.0 13.1 14.5 16.1 17.4 17.8 4.7 (8.7)2 Montréal Trudeau International, QC 5.2 5.2 5.2 5.5 5.8 6.2 7.0 7.7 8.2 2.2 (9.1)3 Vancouver International, BC 3.9 4.0 4.1 4.5 4.6 5.5 6.2 7.0 6.9 1.7 (8.8)4 Calgary International, AB 1.3 1.3 1.3 1.3 1.4 1.5 1.7 1.7 1.9 0.5 (9.7)5 Ottawa Macdonald-Cartier Int’l, ON 0.4 0.5 0.4 0.4 0.4 0.4 0.4 0.4 0.4 0.2 (9.5)6 Aéroport int’l Jean-Lesage de Québec, QC 0.4 0.3 0.4 0.4 0.4 0.4 0.3 0.3 0.3 0.2 (8.5)7 Edmonton International, AB 0.4 0.4 0.4 0.4 0.5 0.4 0.4 0.4 0.4 0.2 (9.0)8 Winnipeg Richardson International, MB 0.2 0.2 0.2 0.2 0.2 0.2 0.2 0.2 0.2 0.1 (1.4)9 Hamilton International Airport, ON C C C C C C C C 0.2 0.1 10 Halifax Robert L. Stanfield Int’l, NS 0.3 0.3 0.3 0.3 0.3 0.3 0.3 0.4 0.3 0.1 (16.0)
Subtotal (Other International) 22.6 23.2 23.6 25.1 26.8 29.4 32.5 35.4 36.6 9.8 (8.8)
All Sectors1
1 Toronto Pearson International, ON 32.4 34.0 35.2 37.2 39.7 43.1 46.0 48.4 49.1 12.9 (9.7)2 Vancouver International, BC 16.6 17.1 17.5 19.0 19.6 21.7 23.6 25.3 25.4 7.1 (9.0)3 Calgary International, AB 12.1 12.9 13.5 14.4 14.6 14.9 15.6 16.7 17.2 5.3 (8.7)4 Montréal Trudeau International, QC 13.3 13.4 13.5 14.3 14.8 16.0 17.6 18.8 19.5 5.1 (10.0)5 Edmonton International, AB 6.2 6.7 7.2 7.7 7.5 7.1 7.7 7.9 7.9 2.4 (10.0)6 Ottawa Macdonald-Cartier Int’l, ON 4.4 4.5 4.4 4.5 4.5 4.7 4.8 5.0 5.0 1.3 (12.4)7 Winnipeg Richardson International, MB 3.4 3.4 3.4 3.6 3.7 4.0 4.3 4.2 4.1 1.2 (11.1)8 Halifax Robert L. Stanfield Int’l, NS 3.5 3.5 3.5 3.6 3.6 3.8 4.0 4.2 4.1 1.0 (13.4)9 Kelowna International, BC 1.4 1.4 1.5 1.6 1.5 1.7 1.9 2.0 2.0 0.7 (7.1)10 Victoria International, BC 1.5 1.5 1.5 1.6 1.7 1.8 1.9 2.0 1.9 0.5 (10.4)
Subtotal (All Sectors) 94.6 98.5 101.3 107.4 111.1 118.8 127.4 134.5 136.1 37.5 (9.8)
Grand Total for All AirportsDomestic 68.0 71.9 74.4 78.4 79.7 84.1 89.3 92.2 92.8 28.5 (9.2)Transborder 22.7 23.8 24.5 26.2 26.9 28.1 29.6 31.4 32.2 7.1 (12.2)Other International 22.9 23.6 24.0 25.5 27.3 29.8 33.0 35.9 37.0 10.1 (8.7)All Sectors 113.7 119.3 123.0 130.1 133.8 142.0 151.9 159.5 162.0 45.6 (9.6)
Top 10’s Share (%) of Grand TotalDomestic 74.8 74.1 73.9 74.1 74.5 75.1 74.9 75.1 74.7 74.1 Transborder 93.9 93.6 93.1 93.2 93.7 94.2 94.9 95.1 95.3 96.7 Other International 98.4 98.3 98.2 98.2 98.2 98.4 98.5 98.7 98.8 97.8 All Sectors 83.2 82.5 82.3 82.5 83.1 83.7 83.9 84.3 84.0 82.3
Notes: CAGR= Compounded Annual Growth Rate.
1 Toronto Billy Bishop Airport ranks amongst the top 10 airports, but was not included due to confidentiality.
Sources: Transport Canada, adapted from Statistics Canada, “Air Carrier Traffic at Canadian airports”, Cat. 51-203, various issues; Transport Canada, ECATS database for years 2011-2020

StatiStical addendum2020
air tranSportation
75
Table A16: Volume of Traffic Carried by Canadian Air Carriers1, 2011-2020
(Millions)Year Passengers Passenger - Kilometers Goods (Tonnes) Goods Tonne-Kilometers2011 62.9 147,107 0.8 2,2122012 66.9 156,323 0.7 2,2662013 67.4 155,876 0.7 2,1692014 72.2 167,108 0.7 2,3762015 75.5 176,255 0.7 2,2832016 80.4 191,889 0.7 2,5292017 86.8 209,725 0.8 3,0692018 91.5 226,643 0.9 3,3222019 92.9 232,703 0.9 3,2212020 27.6 62,757 0.8 2,393CAGR 2011-2020 (8.7) (9.0) 1.2 0.9
Notes: CAGR = Componded Annual Growth Rate.1. Scheduled and charter services, Canadian air carriers Level I to III for 2008 to 2015 and Level I to II for 2016 and 2017.
Source: Statistics Canada, Table 23-10-0259-01

tranSportation in canada2020
air tranSportation
76
Table A17 : Top 10 busiest Canadian airports in terms of Loaded/ Unloaded Revenue Cargo1, by Sector, 2011-2020
RankingAverage 2011-20202011-20 Sector; Airport / Province 2011R 2012R 2013R 2014R 2015R 2016R 2017R 2018R 2019R 2020P CAGR
Domestic1 Vancouver International, BC 79.0 75.9 71.1 81.6 87.3 90.8 103.7 115.7 110.2 105.3 3.2 2 John C Munro Hamilton Int’l, ON 75.6 67.0 65.3 67.7 74.4 77.8 75.2 84.5 79.9 93.3 2.4 3 Toronto Pearson International, ON 64.6 67.3 67.4 73.7 80.2 80.6 96.8 95.6 95.7 74.5 1.6 4 Winnipeg Richardson International, MB 59.9 54.4 47.1 49.9 C C C C C C5 Calgary International, AB 35.3 34.1 28.5 29.0 33.8 35.2 47.5 49.5 46.9 48.9 3.7 6 Montréal Mirabel, QC 36.9 34.2 33.2 33.0 33.4 C C C C C7 Montréal Trudeau International, QC 11.8 11.6 10.2 14.0 15.9 21.7 24.7 28.1 27.6 23.8 8.1 8 Edmonton International, AB 17.8 17.0 18.2 18.7 18.3 17.6 18.6 19.6 17.6 18.6 0.5 9 Moncton/Greater Moncton Int’l, NB 27.5 C C C C C C C C C10 Halifax Robert L. Stanfield Int’l, NS 26.3 26.4 25.6 26.5 22.0 20.5 21.8 21.9 18.8 14.5 (6.4)
Subtotal (Domestic) 434.6 412.9 389.2 417.1 448.9 486.3 507.4 533.9 494.2 476.0 1.0
Transborder1 Toronto Pearson International, ON 96.1 91.4 91.2 93.3 90.1 88.9 93.8 95.6 96.4 83.8 (1.5)2 Montréal Mirabel, QC 39.0 36.7 35.7 36.8 36.4 35.6 41.1 49.2 49.8 47.5 2.2 3 Vancouver International, BC 34.1 33.4 34.4 31.5 37.2 36.5 43.7 44.2 33.2 35.2 0.3 4 John C Munro Hamilton Int’l, ON 17.2 18.1 25.8 32.4 C C C C C C5 Calgary International, AB 24.5 24.9 26.4 24.0 21.1 20.3 21.3 22.9 23.4 23.0 (0.7)6 Winnipeg Richardson International, MB 7.1 8.3 8.0 8.3 C C C C C C7 Edmonton International, AB 5.6 6.5 8.0 8.3 6.9 C C C C C8 Ottawa Macdonald-Cartier Int’l, ON 0.8 0.8 0.9 0.8 1.0 C C C C C9 Halifax Robert L. Stanfield Int’l, NS 0.0 0.2 0.0 0.5 0.3 C C C C C10 Montréal Trudeau International, QC 1.0 1.0 1.3 1.3 0.9 0.7 1.1 1.7 2.9 0.6 (5.5)
Subtotal (Transborder) 225.5 221.2 231.5 237.3 244.5 242.8 241.9 247.7 239.3 233.4 0.4
Other International1 Toronto Pearson International, ON 186.4 190.3 188.7 193.1 204.2 217.6 259.5 296.5 273.9 144.5 (2.8)2 Vancouver International, BC 80.0 85.9 84.4 103.4 112.9 124.8 138.7 174.5 148.9 89.7 1.3 3 Montréal Trudeau International, QC 64.4 67.6 66.0 62.7 64.9 74.7 78.8 93.3 94.7 56.2 (1.5)4 Calgary International, AB 20.3 18.4 21.2 26.5 24.7 22.2 23.6 20.2 18.6 8.1 (9.7)5 John C Munro Hamilton Int’l, ON 0.6 0.6 1.4 0.5 0.2 C C C C C6 Edmonton International, AB 1.2 1.4 1.1 1.2 1.7 C C C C 1.8 7 Halifax Robert L. Stanfield Int’l, NS 1.7 2.9 3.0 3.4 3.5 C C C C C8 Moncton/Greater Moncton Int’l, NB 0.0 0.1 C C C C C C C C9 St. John’s International Airport, NL 0.1 0.3 0.0 0.1 0.0 0.1 C C C C10 Goose Bay Airport, NL C C C C C C C C C C
Subtotal (Other International) 354.9 367.5 365.9 391.1 412.2 447.2 509.5 598.6 546.1 309.4 (1.5)
All Sectors1 Toronto Pearson International, ON 347.1 349.0 347.2 360.1 374.5 387.2 450.0 487.7 465.9 302.8 (1.5)2 Vancouver International, BC 193.1 195.2 189.8 216.6 237.3 252.1 286.2 334.4 292.3 230.1 2.0 3 John C Munro Hamilton Int’l, ON 93.4 85.7 92.5 100.6 116.8 123.0 99.5 106.9 98.8 123.4 3.1 4 Montréal Trudeau International, QC 77.2 80.2 77.4 77.9 81.6 97.0 104.6 123.0 125.1 80.6 0.5 5 Calgary International, AB 80.1 77.5 76.1 79.5 79.6 77.8 92.3 92.6 88.9 80.0 (0.0)6 Montréal Mirabel, QC 76.4 71.4 69.3 70.2 70.5 73.2 77.8 90.6 84.2 79.5 0.4 7 Winnipeg Richardson International, MB 67.1 63.2 55.5 59.1 64.9 84.6 69.9 65.7 57.1 60.7 (1.1)8 Edmonton International, AB 24.6 24.8 27.3 28.3 27.0 25.9 27.2 29.4 27.0 27.2 1.1 9 Halifax Robert L. Stanfield Int’l, NS 28.0 29.4 28.6 30.5 25.8 26.8 28.4 25.3 21.6 16.5 (5.7)10 Moncton/Greater Moncton Int’l, NB 27.5 25.1 22.8 23.2 27.5 28.8 22.2 23.0 17.1 16.1 (5.8)
Subtotal (All Sectors) 1,014.5 1,001.5 986.4 1,046.0 1,105.6 1,176.4 1,258.1 1,378.6 1,278.1 1,016.9 0.0
Grand Total for All AirportsDomestic 500.7 473.2 466.9 483.7 527.7 604.3 651.5 671.0 646.6 640.2 2.8 Transborder 226.3 222.1 232.2 238.0 245.2 243.3 242.5 248.3 239.7 234.2 0.4 Other International 361.7 371.0 368.8 395.9 416.2 450.7 512.6 603.3 549.1 310.4 (1.7)All sectors 1,088.7 1,066.3 1,067.9 1,117.5 1,189.1 1,298.4 1,406.5 1,522.5 1,435.4 1,184.8 0.9
Top 10’s Share (%) of Grand TotalDomestic 86.8 87.3 83.4 86.2 85.1 80.5 77.9 79.6 76.4 74.4 Transborder 99.7 99.6 99.7 99.7 99.7 99.8 99.7 99.8 99.8 99.6 Other International 98.1 99.1 99.2 98.8 99.0 99.2 99.4 99.2 99.5 99.7 All Sectors 93.2 93.9 92.4 93.6 93.0 90.6 89.4 90.5 89.0 85.8
Notes: C= Confidential data. CAGR= Compounded Annual Growth Rate.1 Reported tonnage might be underestimated as: Cargo data was not collected for the smaller scheduled services / or the smaller charter operations Some carriers report their data after the submission period. Updated data is published in the next edition.
Sources: Transport Canada, ECATS database

StatiStical addendum2020
air tranSportation
77
Table A18: Air Exports and Imports, by World Region, 2019 and 2020
(Millions of dollars)
Region of OriginEastern Western Grand Per Cent
Destination Canada Canada Total of TotalExports (2019R) Europe 26,561 2,653 29,214 42.0 United States 19,869 1,224 21,094 30.3 Asia 9,963 2,539 12,503 18.0 Latin America 1,843 340 2,182 3.1 Other 3,482 1,088 4,571 6.6 Total Exports1 61,718 7,845 69,563 100.0
Exports (2020P)Europe 26,756 2,813 29,568 45.3United States 20,700 1,132 21,833 33.5Asia 6,742 1,898 8,640 13.2Latin America 1,448 347 1,795 2.8Other 2,468 929 3,398 5.2 Total Exports1 58,115 7,119 65,233 100.0
Region of ClearanceEastern Western Grand Per Cent
Origin Canada Canada Total of TotalImports (2019R) Europe 23,366 3,000 26,366 33.0 United States 16,368 5,382 21,750 27.2 Asia 15,571 3,285 18,856 23.6 Latin America 7,742 626 8,368 10.5 Other 3,886 625 4,511 5.6 Total Imports 66,933 12,919 79,852 100.0
Imports (2020P) Europe 21,975 2,160 24,135 30.5 United States 15,857 3,939 19,796 25.0 Asia 16,594 3,572 20,166 25.4 Latin America 8,276 616 8,892 11.2 Other 5,810 455 6,265 7.9Total Imports 68,513 10,741 79,254 100.0
Notes: R= Revised data. P= Preliminary data. 1 Total exports include domestic exports and re-exports.
Source: Transport Canada, adapted from Statistics Canada, International Trade Database

tranSportation in canada2020
air tranSportation
78
Table A19: Main Commodity Groups Shipped by Air in Canada’s International Trade, 2019 and 2020
(Millions of dollars)
Exports1 2019R 2020P Per Cent ChangeOther manufactured and miscellaneous goods 36,316 34,219 (5.8)Machinery and electrical equipment 15,047 12,168 (19.1)Automobiles, parts and other transportation equipment 9,436 9,559 1.3 Aviation-related equipment 9,257 9,418 1.7 Chemical products, plastics and rubber 5,090 6,091 19.7 Agricultural and food products 2,039 1,478 (27.5)Base metals and articles thereof 827 781 (5.5)Waste and scrap material 587 728 24.0 Wood and paper products 152 144 (5.5)Non-metallic minerals, coal and stone products 65 60 (6.6)Petroleum products, LNG and other fuels2 3 3 (3.2)Metallic ores 1 2 177.5 Total Exports 69,563 65,233 (6.2)
Imports Per Cent ChangeMachinery and electrical equipment 23,541 27,525 16.9 Other manufactured and miscellaneous goods 29,608 25,837 (12.7)Chemical products, plastics and rubber 14,569 15,375 5.5 Automobiles, parts and other transportation equipment 7,982 5,174 (35.2)Aviation-related equipment 7,289 4,710 (35.4)Base metals and articles thereof 753 2,529 235.9 Agricultural and food products 1,667 1,246 (25.2)Waste and scrap material 1,169 928 (20.6)Wood and paper products 306 308 0.6 Non-metallic minerals, coal and stone products 250 217 (13.3)Petroleum products, LNG and other fuels2 7 115 1501.8 Metallic ores 0 0 25.6 Total Imports 79,852 79,254 (0.7)
Notes: R= Revised data. P= Preliminary data.1 Total exports include domestic exports and re-exports.2 LNG= Liquefied natural gas.
Source: Transport Canada, adapted from Statistics Canada, International Trade Database

StatiStical addendum202079
marine transportation
Table M1: Port Classifications, as of December 31, 2020
Federal Provincial Local TotalFederal Agency Ports Canada Port Authorities 17 N/A N/A 17 Harbour Authorities 0 N/A N/A 0
Ports Operated by Transport Canada Regional/Local 20 N/A N/A 20 Remote 15 N/A N/A 15
Ports Transferred1
From Transport Canada 73 43 157 273
Status of Other Former Transport Canada Ports Demolished 17 N/A N/A 17 Interests Terminated 24 N/A N/A 24 Deproclaimed2 215 N/A N/A 215
Notes: N/A = Not available.Additional detailed information on ports is presented in tables M2 and M3. This includes summaries of the provincial distribution of the ports Transport Canada administered from 2011 to 2020 and the divestiture status of regional/local and remote ports on a regional basis.1 Includes 20 sites where facilities have been transferred but the harbour bed has not yet been deproclaimed, 65 sites that were transferred to Fisheries and Oceans Canada and one site that was transferred to Health Canada.2 Public harbours deproclaimed between June 1996 and March 1999.
Source: Transport Canada, Port Program Management
Table M2: Number of Port Facilities Under the Control and Administration of Transport Canada, by Province, 2011–2020
(Status as of December 31, 2020)
Province 2011 2012 2013 2014 2015 2016 2017 2018 2019 2020Newfoundland and Labrador 7 7 6 3 3 3 3 2 2 2Nova Scotia 2 2 2 2 2 1 1 0 0 0Prince Edward Island 1 1 0 0 0 0 0 0 0 0New Brunswick 0 0 0 0 0 0 0 0 0 0Quebec 27 26 25 25 25 25 24 24 24 20Ontario 8 8 8 8 8 7 7 7 7 6Manitoba 1 1 1 1 1 1 1 1 0 0Saskatchewan 0 0 0 0 0 0 0 0 0 0Alberta 1 1 1 1 1 1 1 1 1 1British Columbia 15 15 13 10 10 10 10 9 6 6Northwest Territories 0 0 0 0 0 0 0 0 0 0Total 62 61 56 50 50 48 47 44 40 35
Source: Transport Canada, Port Program Management

tranSportation in canada2020 80
marine tranSportation
Table M3: Status of Transport Canada Port Facilities
(Status as of December 31, 2020)
RegionTransferred to
Provinces
Transferred to Other Federal
Departments Divested to
Local Interests Demolished
Transport Canada Interests
Terminated Deproclaimed1 Remaining Total
Harbour beds without port
facilitiesAtlantic 35 6 41 3 14 160 2 261 20Quebec 11 3 16 6 0 27 20 83 0Ontario 1 4 22 1 4 17 6 55 4Manitoba 0 0 0 1 0 0 0 1 1Prairie/Northern 0 55 0 0 0 1 1 57 0Pacific 2 1 74 6 6 10 6 105 1Total 49 69 153 17 24 215 35 562 26
Notes:1 Does not include deproclamation of 26 harbours found during subsequent archival research, nor the 20 sites where facilities have been transferred but cannot be deproclaimed because the harbour bed has not yet been divested.
Source: Transport Canada, Port Program Management
Table M4: Canada Port Authorities (CPA) Financial Results, 2019
(Thousands of dollars)
Financial Information Vancouver Montreal Halifax Quebec City Saint John St. John’s Prince Rupert Port Alberni HamiltonOperating revenues 301,318 129,984 45,218 43,055 24,327 8,582 66,568 4,097 31,596 Operating expenses 147,471 94,654 32,806 32,408 20,055 6,656 36,544 4,104 23,098 Operating income 153,847 35,330 12,412 10,647 4,272 1,926 30,024 (7) 8,498 Gross revenue charge 8,039 4,629 2,112 1,972 869 174 3,337 79 1,320 Other revenues/(expenses) 99,653 4,566 (1,152) (991) 1,097 (253) 467 96 (727)Comprehensive Income 245,461 35,267 9,148 7,684 4,500 1,499 27,154 10 6,451
Other InformationAcquisition of capital assets 207,774 47,548 31,672 30,710 4,448 1,979 13,572 151 14,236 Total assets 2,190,166 570,723 243,966 203,956 120,912 46,318 318,751 16,320 174,074 Equity 1,934,499 409,087 204,032 118,023 106,557 39,026 258,516 11,435 151,398
RatiosOperating ratio 48.9% 72.8% 72.6% 75.3% 82.4% 77.6% 54.9% 100.2% 73.1%Return on assets 11.2% 6.2% 3.7% 3.8% 3.7% 3.2% 8.5% 0.1% 3.7%
Financial Information Nanaimo Thunder Bay Toronto Windsor Saguenay Sept-Îles Trois-Rivières Belledune TotalOperating revenues 10,071 3,147 61,013 1,519 4,586 20,792 9,646 8,666 774,185 Operating expenses 10,325 3,037 49,477 1,482 2,823 14,855 6,845 6,237 492,877 Operating income (254) 110 11,536 37 1,763 5,937 2,801 2,429 281,308 Gross revenue charge 205 74 3,039 35 97 695 224 179 27,079 Other revenues/(expenses) (162) 541 (6,194) 210 (141) 9,485 340 (1) 106,834 Comprehensive Income (621) 577 2,303 212 1,525 14,727 2,917 2,249 361,063
Other InformationAcquisition of capital assets 2,022 6,688 11,444 299 602 816 1,497 5,160 380,618 Total assets 31,644 45,238 346,004 14,327 32,497 327,346 113,234 78,404 4,873,880 Equity 27,875 43,635 227,393 13,249 27,320 115,392 71,652 57,124 3,816,213
RatiosOperating ratio 102.5% 96.5% 81.1% 97.6% 61.6% 71.4% 71.0% 72.0% 63.7%Return on assets (2.0%) 1.3% 0.7% 1.5% 4.7% 4.5% 2.6% 2.9% 7.4%
Note: The Oshawa Port Authority did not issue 2019 audited financial statements. The Oshawa Port Authority was amalgamated with the Hamilton Port Authority in June 2019.
Sources: CPAs 2019 Audited Financial Statements

StatiStical addendum2020
marine tranSportation
81
Table M5: Canada Port Authorities (CPA) Financial Comparison, 2018 and 2019
(Thousands of dollars)
Operating revenues Operating expenses Gross Revenue Charge Other revenues/(expenses) Comprehensive IncomeCPA 2019 2018 2019 2018 2019 2018 2019 2018 2019 2018Vancouver 301,318 274,453 147,471 136,451 8,039 7,477 99,653 (1,278) 245,461 129,247 Montreal 129,984 123,684 94,654 91,063 4,629 4,496 4,566 (20) 35,267 28,105 Halifax 45,218 44,634 32,806 28,483 2,112 2,080 (1,152) 834 9,148 14,905 Quebec 43,055 36,760 32,408 29,146 1,972 1,604 (991) (1,085) 7,684 4,925 Saint John 24,327 23,866 20,055 18,735 869 831 1,097 274 4,500 4,574 St. John’s 8,582 7,834 6,656 6,182 174 159 (253) (24) 1,499 1,469 Prince Rupert 66,568 59,865 36,544 32,573 3,337 3,039 467 558 27,154 24,811 Port Alberni 4,097 4,367 4,104 3,849 79 84 96 33 10 467 Hamilton 31,596 28,126 23,098 21,286 1,320 1,127 (727) 920 6,451 6,633 Nanaimo 10,071 10,978 10,325 11,024 205 241 (162) (228) (621) (515)Thunder Bay 3,147 3,267 3,037 3,210 74 76 541 518 577 499 Toronto 61,013 60,029 49,477 53,616 3,039 3,000 (6,194) 1,024 2,303 4,437 Windsor 1,519 1,511 1,482 1,538 35 34 210 214 212 153 Saguenay 4,586 3,823 2,823 2,723 97 79 (141) 144 1,525 1,165 Sept-Îles 20,792 16,061 14,855 12,208 695 472 9,485 10,507 14,727 13,888 Trois-Rivières 9,646 9,555 6,845 6,062 224 206 340 101 2,917 3,388 Belledune 8,666 8,935 6,237 5,664 179 184 (1) (181) 2,249 2,906 Total 774,185 717,748 492,877 463,813 27,079 25,189 106,834 12,311 361,063 241,057
Note: The Oshawa Port Authority did not issue 2018 and 2019 audited financial statements. The Oshawa Port Authority was amalgamated with the Hamilton Port Authority in June 2019.
Sources: CPAs 2018 and 2019 Audited Financial Statements
Table M6: Financial Results for Transport Canada Ports, 2011/2012 - 2020/2021
(Millions of dollars)
2011/12 2012/13 2013/14 2014/15 2015/16 2016/17 2017/18 2018/19 2019/20 2020/21F
Revenues 10.4 9.3 8.8 8.7 8.1 8.1 8.5 8.4 8.2 4.7Expenses 12.3 12.1 12.2 11.6 11.7 12.2 11.3 14.7 16.9 8.3Operating Income (1.9) (2.8) (3.4) (2.9) (3.6) (4.1) (2.8) (6.3) (8.7) (3.6)
Capital Expenditures 11.6 6.2 11.9 8.4 4.8 3.9 4.4 12.2 8.8 1.3
Grants and Contributions 28.2 12.9 24.3 3.0 0.1 5.4 0.8 0.4 150.4 62.4
Net Income (41.7) (21.9) (39.6) (14.3) (8.4) (13.4) (8.0) (18.9) (167.9) (67.3)
Note: F= Forecast (at March 19, 2021)
Source: Transport Canada, Air, Marine and Environmental Programs

tranSportation in canada2020
marine tranSportation
82
Table M7: St. Lawrence Seaway Financial Performance, 2010/11–2019/20
(Thousands of dollars)
Year Revenues Expenditures Excess of Revenue Over Expenses Net Excess of Revenue Over Expenses2
2010/11 65,952 117,916 (51,964) 15,1082011/12 68,165 129,381 (61,216) 5,3762012/13 72,010 133,580 (61,570) 10,8372013/14 68,526 160,768 (92,242) 16,2972014/15 77,894 169,687 (91,793) 20,0832015/161 71,894 179,359 (107,465) 23,0582016/17 70,693 163,551 (92,858) 20,4442017/18 80,649 127,770 (47,121) 20,1842018/19 84,379 113,153 (28,774) 18,4242019/20 79,759 125,165 (45,406) 15,362
Notes: Fiscal year from April 1st to March 31st.1 Revenues for the 2015/16 fiscal year consist primarily of tolls collected during the 2015 navigation season, which ended on December 30, 2015.2 Following contribution from Capital Trust Fund.
Source: St. Lawrence Seaway Management Corporation
Table M8: Pilotage Authorities Financial Results, 2011–2020
(Thousands of dollars)
Pilotage Authority 2011 2012 2013 2014 2015 2016 2017 2018 2019 2020Atlantic (APA) Revenues 22,041 20,341 21,576 22,562 22,673 24,093 27,793 28,831 29,691 25,326 Expenditures 20,148 20,483 21,475 23,180 23,224 22,896 24,880 27,085 28,394 26,593
Net Income (loss) 1,893 (142) 101 (618) (551) 1,197 2,913 1,746 1,297 (1,267)
Laurentian (LPA) Revenues 77,399 78,752 78,066 85,136 86,229 91,430 95,017 105,902 108,293 93,971Expenditures 72,030 76,020 76,554 83,045 82,597 89,890 94,709 106,512 107,679 96,535Net Income (loss) 5,369 2,732 1,512 2,091 3,632 1,540 308 (609) 613 (2,564)
Great Lakes (GLPA) Revenues 19,599 20,558 22,223 26,602 25,554 25,888 30,283 35,379 40,479 38,188Expenditures 18,945 20,182 21,323 25,266 25,906 26,742 29,588 35,051 41,667 38,998Net Income (loss) 654 376 900 1,336 (352) (854) 695 327 (1,187) (809)
Pacific (PPA) Revenues 61,758 64,576 71,959 74,689 73,016 76,552 85,795 92,614 96,856 83,241Expenditures 58,801 63,123 72,313 78,193 77,411 80,330 86,541 90,623 93,972 83,432Net Income (loss) 2,957 1,453 (354) (3,504) (4,395) (3,778) (756) 1,991 2,884 (191)
Total All Revenues 180,797 184,227 193,824 208,989 207,472 217,963 238,888 262,726 275,319 240,726Authorities Expenditures 169,924 179,808 191,665 209,684 209,138 219,858 235,718 259,271 271,712 245,558
Net Income (loss) 10,873 4,419 2,159 (695) (1,666) (1,895) 3,170 3,455 3,607 (4832)
Sources: Pilotage Authorities’ Annual Reports, various years

StatiStical addendum2020
marine tranSportation
83
Table M9: Total Pilotage Assignments and Assignments Per Pilot, 2011–2020
Pilotage Authority Indicators 2011 2012 2013 2014 2015 2016 2017 2018 2019 2020Atlantic (APA) Number of Pilots1 45 55 52 56 58 58 59 61 61 61
Total Assignments 8,997 8,254 8,338 8,472 8,348 7,959 8,809 8,720 8,694 7,234 Assignments per Pilot 199 150 160 151 144 137 149 142 142 118
Laurentian (LPA) Number of Pilots2 185 187 188 187 184 185 192 174 180 195Total Assignments 22,729 22,096 20,915 22,386 21,468 22,432 22,732 24,950 24,670 21,215Assignments per Pilot 123 118 111 120 117 121 118 143 137 108
Great Lakes (GLPA) Number of Pilots3 57 56 56 56 56 59.5 59.6 54.7 59.1 60.1Total Assignments 6,389 6,358 6,403 7,462 7,166 7,020 7,636 8,798 10,093 9,290Assignments per Pilot 113 114 114 133 128 136 143 161 170 154
Pacific (PPA) Number of Pilots4 105 105 107 106 106 111 122 126 132 132Total Assignments 12,522 12,292 12,840 13,264 12,892 12,661 13,397 13,364 13,282 12,736Assignments per Pilot 101 123 120 125 122 114 110 107 100 96
Total All Number of Pilots 392 403 403 405 404 414 433 415.7 432.1 448.1Authorities Total Assignments 50,637 49,000 48,496 51,584 49,874 50,072 52,574 55,832 56,739 50,475
Assignments per Pilot 121 123 120 127 123 121 122 138 131 112
Notes: 1 Atlantic Pilotage Authority: Employee pilots (FTE) and entrepreneur pilots.2 Laurentian Pilotage Authority: Contract pilots and FTEs.3 Great Lakes Pilotage Authority: Employee pilots (FTEs).4 Pacific Pilotage Authority: Employee pilots (FTEs) and contract pilots.
Sources: Pilotage Authorities’ Annual Reports, various years
Table M10: Canadian-Registered Fleet by Vessel Type, 2000, 2010 and 2020
Gross Tonnage (000s) Number of Vessels
Type of Vessel 2000 2010 2020 2000 2010 2020Dry bulk 1,286 1,239 894 72 71 42Tankers 375 652 396 22 29 32General cargo 178 147 405 24 20 42Ferries 323 474 302 56 69 65Other 38 36 259 8 6 21Total 2,200 2,548 2,255 182 195 202 Note: Includes self-propelled passenger and cargo vessels with gross tonnage of 1,000 and over, including government-owned ferries. Does not include fishing vessels, platforms,
working vessels, tugs, pleasure craft or unclassified vessels.
Source: Transport Canada, Canadian Register of Vessels

tranSportation in canada2020
marine tranSportation
84
Table M11: Vessel Trips in Canadian Waters, by Vessel Type, 2016–2020
Number of transits1
Vessel Type 2016 2017 2018 2019 2020Cargo 1,643 1,891 1,818 1,857 1,738Container 3,825 4,056 4,129 4,087 3,615Dry Bulk 7,897 9,475 8,720 8,677 8,078Ferry/Ro-Ro 9,020 9,592 9,872 9,698 8,952Fishing 3,164 3,655 3,690 3,455 3,348Government/Research 14,674 14,926 17,090 19,165 19,253Others/Special Ships 4,077 3,679 4,326 4,650 4,637Passenger/Cruise 11,119 15,493 16,567 15,704 10,372Pleasure Vessels 6,962 7,716 8,411 10,140 9,269Tankers 5,078 5,239 5,672 5,441 4,551Tugs/Port 51,459 53,593 57,237 60,203 48,307Total 118,918 129,315 137,532 143,077 123,992
Number of nautical miles sailed2
Vessel Type 2016 2017 2018 2019 2020Cargo 1,436,036 1,778,267 1,787,081 1,948,853 1,876,333Container 2,001,562 2,419,275 2,661,462 2,636,679 2,500,241Dry Bulk 4,455,320 5,076,340 5,342,020 5,179,701 4,970,884Ferry/Ro-Ro 2,576,860 2,700,766 2,654,407 2,694,673 2,327,548Fishing 3,448,614 4,023,483 4,110,759 4,490,841 4,400,471Government/Research 1,414,686 1,611,881 1,606,286 1,599,155 1,685,745Others/Special Ships 904,884 906,188 884,262 912,309 778,725Passenger/Cruise 1,387,906 1,685,201 1,971,444 2,353,241 1,004,924Pleasure Vessels 1,953,170 2,524,667 2,631,781 3,355,349 1,805,201Tankers 2,364,039 2,658,452 2,891,915 2,915,909 2,473,256Tugs/Port 3,143,383 3,076,155 3,365,929 3,516,866 3,294,007Total 25,086,459 28,460,675 29,907,346 31,603,577 27,117,336
Notes: 1 Transits are based on fused terrestrial and satellite Automatic Identification System (AIS) data processed and analyzed by Transport Canada. The number of transits were only
counted for the 17* CPAs.2 The number of nautical miles sailed are based on fused terrestrial and satellite Automatic Identification System (AIS) data processed and analyzed by Transport Canada.
Nautical miles sailed were computed for all Canadian waters within the Exclusive Economic Zone (EEZ).
Source: Transport Canada, Automated Information System (AIS)
Table M12: Vessel Trips in Canadian Waters, by Vessel Flag, 2016–2020
Number of transits1
Vessel Flag 2016 2017 2018 2019 2020Canada 100,858 110,225 118,048 123,631 108,997United States 2,506 2,891 2,823 3,083 1,440International 15,554 16,199 16,661 16,363 13,555Total 118,918 129,315 137,532 143,077 123,992
Number of nautical miles sailed2
Vessel Flag 2016 2017 2018 2019 2020Canada 13,284,567 15,018,816 15,671,243 17,163,225 15,402,253United States 3,010,211 3,298,922 3,470,220 3,714,511 2,339,420International 8,791,681 10,142,937 10,765,883 10,725,842 9,375,664Total 25,086,459 28,460,675 29,907,346 31,603,577 27,117,336
Notes: 1 Transits are based on fused terrestrial and satellite Automatic Identification System (AIS) data processed and analyzed by Transport Canada. The number of transits were only
counted for the 17 CPAs.2 The number of nautical miles sailed are based on fused terrestrial and satellite Automatic Identification System (AIS) data processed and analyzed by Transport Canada.
Nautical miles sailed were computed for all Canadian waters within the Exclusive Economic Zone (EEZ).
Source: Transport Canada, Automated Information System (AIS)

StatiStical addendum2020
marine tranSportation
85
Table M13: Total Tonnage Handled by Canada’s Port Authorities, 2011–2020
YearTotal Cargo
Tonnage (millions)Annual Growth
Rate (%)2011 303.02012 313.9 3.6 2013 313.7 (0.1)2014 311.4 (0.7)2015 307.3 (1.3)2016 311.2 1.3 2017 335.4 7.8 2018 343.1 2.3 2019 348.1 1.5 2020P 346.3 (0.5)
CAGR 2011-20 1.5%
Notes: P= Preliminary data. CAGR= Compound Annual Growth Rate.
Sources: Transport Canada, Canada’s Port Authorities
Table M14: St. Lawrence Seaway Cargo Traffic, 2011–2020
(Millions of tonnes)
Montreal–Lake Ontario Section Welland Canal Section
2011 28.7 29.62012 31.4 30.02013 28.6 29.22014 30.1 31.82015 27.4 28.22016 27.1 26.22017 28.8 30.22018 31.5 30.12019 29.1 28.62020P 29.3 28.9
Note: P= Preliminary data.
Source: St. Lawrence Seaway Management Corporation - Seaway Traffic Reports
Table M15: St. Lawrence Seaway Traffic1, by Commodity, 2011–2020
(Millions of tonnes)
Year Grain Iron Ore General Cargo Coal Other Total 2011 8.6 8.8 1.9 3.7 14.4 37.52012 8.6 10.3 2.0 4.6 13.5 39.02013 8.4 9.9 1.6 4.5 12.6 37.02014 12.1 6.9 3.2 4.2 13.6 39.92015 10.9 7.2 2.7 2.5 13.0 36.22016 11.3 6.2 2.6 2.3 12.6 35.02017 10.1 8.2 3.3 2.3 14.3 38.32018 12.3 7.5 3.3 2.5 15.3 41.02019 10.5 6.9 2.2 2.4 16.3 38.42020P 13.3 6.1 2.3 2.4 13.6 37.7
Notes: P= Preliminary data. 1 Combined traffic on the two sections of the Seaway.
Source: St. Lawrence Seaway Management Corporation
Table M16: Cruise Ship Traffic at Selected Canadian Ports, 2011–2020
(Thousands of passengers)
Year Vancouver-Fraser Victoria Montreal Quebec City Halifax Sydney Saint John2011 663.4 439.6 38.0 83.0 243.6 67.6 184.82012 666.2 503.7 54.8 117.0 252.8 86.7 187.92013 812.4 450.0 55.6 122.7 252.1 99.4 166.62014 812.1 467.0 56.5 135.0 217.3 82.6 106.52015 805.4 563.1 71.3 122.0 222.3 89.7 119.22016 826.8 550.0 69.2 108.9 238.2 82.2 143.92017 842.9 600.0 91.6 145.6 292.7 118.4 147.72018 889.2 640.0 101.5 230.9 316.9 130.2 159.52019 1,070.9 709.0 90.1 236.7 323.7 150.7 196.02020P 0.0 0.0 0.0 0.0 0.0 0.0 0.0
Notes: R= Revised data. P= Preliminary data.
Sources: Canadian Port Authorities (CPA), Greater Victoria Harbour Authority and Port of Sydney, Canada.

tranSportation in canada2020
marine tranSportation
86
Table M17: Cargo Handled by Canada Port Authorities (CPAs), 2011–2020
(millions of tonnes)
CPA 2011 2012R 2013 2014 2015 2016 2017 2018 2019R 2020P CAGRVancouver-Fraser 122.5 127.6 135.0 139.6 138.2 135.5 142.1 147.1 144.2 145.5 1.9Montreal 28.5 28.4 28.2 30.4 32.0 35.4 38.0 38.9 40.6 35.1 2.3Sept-Iles 26.0 27.9 27.7 23.8 22.7 22.9 24.2 25.4 29.3 33.1 2.7Prince Rupert 19.3 22.3 23.1 20.7 19.7 18.9 24.2 26.7 29.8 32.4 5.9Quebec 29.0 33.1 27.1 24.3 21.4 24.8 27.6 27.6 29.0 27.0 (0.8)Saint John 31.8 27.7 27.7 23.9 26.4 26.4 30.5 25.1 25.4 26.0 (2.2)Hamilton-Oshawa1 10.3 10.8 10.3 10.9 9.6 9.7 10.3 12.2 10.6 10.9 0.6Thunder Bay 7.6 7.8 6.5 9.3 8.9 8.8 8.8 8.7 9.3 10.2 3.3Halifax 9.5 9.5 8.6 7.8 7.6 8.3 8.9 9.0 8.6 8.3 (1.5)Windsor 5.1 5.5 6.0 5.4 5.6 4.8 5.1 5.2 4.7 4.5 (1.2)Nanaimo 3.2 3.0 3.8 4.1 4.9 5.4 5.6 5.3 4.6 3.4 0.9Trois Rivières 3.3 3.4 2.7 3.8 3.1 2.8 2.6 3.8 4.2 3.3 0.1Toronto 1.7 1.9 1.6 1.9 1.7 1.8 2.2 2.2 2.2 2.2 3.2Belledune 2.1 1.9 1.7 1.7 1.8 2.0 2.0 2.4 2.2 1.7 (2.0)St-John’s 1.4 1.4 1.8 1.7 1.8 1.7 1.7 1.7 1.7 1.5 0.7Port Alberni 1.5 1.6 1.8 1.7 1.6 1.6 1.3 1.5 1.0 0.6 (10.0)Saguenay 0.3 0.3 0.3 0.3 0.3 0.3 0.3 0.4 0.6 0.5 6.0Total 303.0 313.9 313.7 311.4 307.3 311.2 335.4 343.1 348.1 346.3 1.5
Notes: P= Preliminary data. R= Revised data. CAGR= Compuond Annual Growth Rate.Totals may not add up due to rounding.1 Hamilton and Oshawa CPAs were amalgamated in 2019. Prior results have been combined.
Sources: Transport Canada reports, port web sites, Canadian Sailings magazine
Table M18: Containerized Freight Volumes for Selected Ports, 2011–2020
(Thousands of TEUs)
Port 2011 2012 2013 2014 2015R 2016 2017R 2018 2019 2020P
Vancouver-FraserTotal containers 2,507.0 2,713.1 2,825.5 2,919.9 3,054.5 2,929.6 3,252.2 3,396.4 3,398.9 3,467.5Empty containers 272.7 314.7 281.3 368.1 446.0 323.0 472.8 533.5 567.5 626.9
MontrealTotal containers 1,363.0 1,364.3 1,346.1 1,402.4 1,369.7 1,447.6 1,537.7 1,679.4 1,745.2 1,607.3Empty containers 143.9 187.7 159.1 168.5 100.7 179.6 185.8 237.1 225.3 218.3
Prince RupertTotal containers 410.5 564.9 536.4 618.2 776.4 736.7 926.5 1,036.0 1,210.8 1,141.4Empty containers 76.9 122.3 83.0 102.3 186.9 133.2 236.6 259.9 340.0 304.2
HalifaxTotal containers 409.8 416.2 441.7 399.6 418.2 480.7 559.2 547.4 546.7 507.2Empty containers 74.6 67.0 67.7 60.5 69.5 67.1 85.8 82.8 93.3 90.7
Saint JohnTotal containers 44.4 51.0 76.3 89.6 97.1 90.3 57.4 59.1 68.9 79.1Empty containers 21.7 24.8 34.8 41.9 46.7 42.2 25.0 24.7 30.3 29.7
TotalTotal containers 4,734.6 5,109.5 5,225.9 5,429.7 5,715.9 5,684.8 6,333.1 6,718.4 6,970.5 6,802.5Empty containers 589.8 716.4 626.0 741.2 849.8 745.1 1,006.0 1,137.9 1,256.4 1,269.8
Notes: P = Preliminary data. R = Revised data. TEUs = Twenty-foot equivalent unit, a standardized measure of container volume.
Sources: Transport Canada reports, port web sites

StatiStical addendum2020
marine tranSportation
87
Table M19: Main Commodities Shipped in Canada’s International Marine Trade, by Market, 2020
Millions of dollars Percentage Share in Per Cent
Marine Marine Marine Marine Marine MarineCanada/U.S. Exports Imports Total Exports Imports TotalPetroleum products, LNG and other fuels 10,880 8,661 19,541 72.9 74.3 73.6Base metals and articles thereof 1,774 27 1,801 11.9 0.2 6.8Non-metallic minerals, coal and stone products 780 746 1,525 5.2 6.4 5.7Metallic ores 257 1,202 1,459 1.7 10.3 5.5Agricultural and food products 539 179 718 3.6 1.5 2.7Chemical products, plastics and rubber 123 435 558 0.8 3.7 2.1Waste and scrap material 230 11 241 1.5 0.1 0.9Automobiles, parts and other transportation equipment 30 211 241 0.2 1.8 0.9Other manufactured and miscellaneous goods 120 50 170 0.8 0.4 0.6Machinery and electrical equipment 80 85 165 0.5 0.7 0.6Wood and paper products 103 45 148 0.7 0.4 0.6Total Canada/U.S. Marine Trade 14,916 11,651 26,568 100.0 100.0 100.0
Marine Marine Marine Marine Marine MarineCanada/Other Countries Exports1 Imports2 Total Exports Imports TotalAgricultural and food products 33,200 14,801 48,001 37.8 13.4 24.2Chemical products, plastics and rubber 8,166 16,436 24,602 9.3 14.9 12.4Machinery and electrical equipment 3,627 20,077 23,704 4.1 18.2 12.0Other manufactured and miscellaneous goods 1,562 21,699 23,261 1.8 19.7 11.7Automobiles, parts and other transportation equipment 4,030 14,714 18,744 4.6 13.3 9.5Base metals and articles thereof 5,236 11,187 16,423 6.0 10.1 8.3Metallic ores 12,352 1,117 13,470 14.1 1.0 6.8Wood and paper products 8,190 2,168 10,358 9.3 2.0 5.2Petroleum products, LNG and other fuels 3,801 5,343 9,144 4.3 4.8 4.6Non-metallic minerals, coal and stone products 4,980 2,482 7,463 5.7 2.2 3.8Waste and scrap material 2,612 321 2,933 3.0 0.3 1.5Total Canada/Other Countries Marine Trade 87,758 110,345 198,103 100.0 100.0 100.0
Notes: Preliminary data for 2020.1 Including domestic exports and re-exports.2 Marine imports from countries other than the US might be underestimated. In the case of imports, the mode of transport represents the last mode (often truck) by which the
cargo was transported to the port of clearance in Canada and is derived from the cargo control documents of customs. This may not be the mode of transport by which the cargo arrived at the Canadian port of entry in the case of inland clearance. This may, therefore, lead to some underestimation of Canadian imports by the marine and air transport modes.
Source: Transport Canada, adapted from Statistics Canada, International Trade Database

tranSportation in canada2020
marine tranSportation
88
Table M20: End-to-End Transit Times from Shanghai to Toronto via British Columbia Ports using a Direct RailModel, 2011–2020
(Number of days)
Month 2011 2012 2013 2014 2015 2016 2017 2018 2019 2020Change 2020/2019
(Per cent)January 22.8 25.2 23.3 27.1 27.7 25.3 26.3 28.9 28.5 25.8 (9.6)February 23.4 24.2 25.5 29.1 29.3 24.7 27.0 29.1 32.7 32.7 (0.1)March 22.7 22.5 25.4 27.4 29.7 24.2 24.5 30.3 29.2 27.9 (4.5)April 22.6 23.9 24.4 27.5 25.6 22.9 24.1 24.8 24.1 25.9 7.6May 21.7 23.2 23.7 24.4 24.8 23.1 24.3 25.4 24.0 25.9 8.1June 21.1 24.9 23.5 24.0 24.8 23.8 24.4 25.5 24.2 25.9 7.2July 20.6 23.8 23.4 25.4 23.0 23.9 24.4 26.6 24.5 27.9 13.9August 21.3 23.1 24.4 27.9 23.5 24.3 24.9 27.0 24.7 32.5 31.5September 22.9 22.8 24.6 26.9 23.8 22.9 25.5 26.9 24.0 31.9 33.1October 22.2 23.4 24.6 25.5 24.4 23.2 25.8 28.4 24.1 32.9 36.6November 22.5 23.7 23.9 24.9 23.3 24.3 25.4 28.0 26.0 33.0 27.2December 23.4 23.7 25.2 26.8 24.7 26.8 27.1 28.4 25.1 34.0 35.6Annual Average 22.3 23.7 24.3 26.4 25.4 24.1 25.3 27.4 25.9 29.7 14.6
Source: Transport Canada, Policy Group
Table M21: Key Performance Indicators for Selected Intermodal Container Ports, 2018–2020
British Columbia Ports1
Indicators 2020 2019 2018 2017-19 AverageContainer volumes - TEUs 4,608,911 4,609,642 4,432,485 4,409,380Import Share - % 54.2 52.5 53.0 53.0Import rail container dwell time - days 3.8 3.0 4.1 3.6Vessel on-time performance - % 39.5 51 39.0 46.6End-to-end transit time – Shanghai to Chicago - days 27.9 25.4 27.2 25.8U.S. comparison – Shanghai to Chicago via Seattle/Tacoma - days 29.2 28.1 27.5 27.4U.S. comparison – Shanghai to Chicago via LA/Long Beach - days 27 26.4 25.8 25.6
Canadian East Coast Ports2
Indicators 2020 2019 2018 2017-19 AverageContainer volumes - TEUs 2,114,473 2,288,935 2,226,796 2,204,214Import Share - % 50.4 49.4 50.1 49.4Import rail container dwell time - days 4.3 2.8 3.2 2.8End-to-end transit time – Antwerp to Chicago - days 22.1 19.0 20.0 19.2
Notes: TEUs = Twenty-foot Equivalent Units.1 Port of Vancouver and Prince Rupert.2 Port of Montreal and Halifax.
Sources: Transport Canada; Canada Port Authorities; Class I Railways

StatiStical addendum202089
raiL transportation
Table RA1: Railways in Canada, 2019
2019 Total Length of First
Main Track Operated
2018 Total Length of First
Main Track Operated Percent of Total
2019 Percentage Change Over Previous Year
CN 21,878 21,924 50.8 (0.2)CPR 13,094 12,712 30.4 3.0 VIA Rail 285 285 0.7 0.0 Regional and Shortline Railways 7,809 7,354 18.1 6.2 Total 43,065 42,274 100.0 1.9
Notes: R = Revised data. CN = Canadian National. CPR = Canadian Pacific Railway.Length of track does not include parallel trackage, spurs, sidings and yard trackage.
Source: Transport Canada, Statistics Canada
Table RA2: Railway Revenues, 2010–2019
(Millions of dollars)
2010 2011 2012 2013 2014 2015 2016 2017 2018R 2019CN 5,611 6,202 6,821 7,179 8,135 8,292 7,980 8,800 9,604 10,173CPR 3,796 3,930 4,279 4,525 4,809 4,798 4,609 4,800 5,367 5,837VIA 525 532 545 568 585 568 580 627 654 680Subtotal - Class I 9,931 10,664 11,645 12,271 13,530 13,658 13,169 14,228 15,625 16,690Regional 288 354 355 385 379 327 257 249 291 361Shortlines 368 362 348 373 449 441 406 414 421 478Total 10,587 11,380 12,348 13,029 14,357 14,426 13,832 14,891 16,337 17,529
Notes: R= Revised data. CN = Canadian National. CPR = Canadian Pacific Railway. VIA = VIA Rail Canada. Revenues are tabulated as per Uniform Classification of Accounts requirements.Excludes Tour operations
Sources: Transport Canada, Statistics Canada

tranSportation in canada2020 90
rail tranSportation
Table RA3: Railway Fleet, 2010–2019
2010R 2011R 2012R 2013R 2014R 2015R 2016R 2017R 2018R 2019LocomotivesFreight or PassengerClass I 1,917 1,958 2,367 2,434 2,421 2,394 2,366 2,280 2,419 2,399Class II 392 394 410 413 419 449 436 445 444 457Total 2,309 2,352 2,777 2,847 2,840 2,843 2,802 2,725 2,863 2,856
Switching and other usesClass I 856 814 462 390 364 359 473 341 363 293Class II 117 108 110 101 91 81 83 82 84 89Total 973 922 572 491 455 440 556 423 447 382
Total LocomotivesClass I 2,773 2,772 2,829 2,824 2,785 2,753 2,839 2,621 2,782 2,692Class II 509 502 520 514 510 530 519 527 528 546Total 3,282 3,274 3,349 3,338 3,295 3,283 3,358 3,148 3,310 3,238
Passenger CarsClass I 505 506 507 519 519 519 487 480 480 451Class II 140 139 139 135 136 136 136 135 148 156Total 645 645 646 654 655 655 623 615 628 607
Freight CarsBoxcarsClass I 13,443 13,177 12,861 10,947 10,641 9,822 8,349 8,575 7,488 7,895Class II 1,379 1,275 1,289 1,311 2,052 2,377 3,141 3,141 3,167 3,103Total 14,822 14,452 14,150 12,258 12,693 12,199 11,490 11,716 10,655 10,998
FlatcarsClass I 12,554 13,015 12,643 12,024 11,975 12,077 12,447 14,230 15,097 15,315Class II 747 873 873 729 748 763 773 783 826 811Total 13,301 13,888 13,516 12,753 12,723 12,840 13,220 15,013 15,923 16,126
GondolasClass I 11,218 10,934 10,378 8,687 8,584 7,796 8,365 8,984 9,698 9,518Class II 320 273 272 270 258 292 224 224 223 225Total 11,538 11,207 10,650 8,957 8,842 8,088 8,589 9,208 9,921 9,743
Hopper CarsClass I 27,185 27,781 25,002 21,447 20,204 19,155 18,140 15,294 19,523 20,645Class II 1,302 1,212 1,212 1,212 1,211 1,211 1,259 1,259 1,259 1,261Total 28,487 28,993 26,214 22,659 21,415 20,366 19,399 16,553 20,782 21,906
Other Freight CarsClass I 105 99 93 78 73 113 113 676 590 597Class II 102 85 96 104 98 104 131 134 194 202Total 207 184 189 182 171 217 244 810 784 799
Total Freight CarsClass I 64,505 65,006 60,977 53,183 51,477 48,963 47,414 47,759 52,396 53,970Class II 3,850 3,718 3,742 3,626 4,367 4,747 5,528 5,541 5,669 5,602Total 68,355 68,724 64,719 56,809 55,844 53,710 52,942 53,300 58,065 59,572
Notes: R = Revised data.Freight railcars belonging to shippers, including tanker cars, are not included in the table above
Source: Transport Canada and Statistics Canada, Rail Carrier annual reports

StatiStical addendum2020
rail tranSportation
91
Figure RA4: Average Monthly Train Velocity, by Rail Carrier, 2020
20
25
30
35
40
45
50
Kilo
met
res
Per
Hou
r
CP Average Monthly Train Velocity
Intermodal
Manifest
Coal Unit
Grain Unit
All Trains
20
25
30
35
40
45
50
Kilo
met
res
Per
Hou
r
CN Average Monthly Train Velocity
Intermodal
Manifest
Coal Unit
Grain Unit
All Trains
Notes: CP= Canadian Pacific Railway. CN = Canadian National.Train velocity measures the line-haul movement from origin to destination. The average velocity is calculated by dividing train-kilometres by total hours operated, excluding yard and local trains, passenger trains, maintenance of way trains. Weekly kilometres per hour are averaged to produce a monthly estimate.
Source: Transport Canada, Statistics Canada Table 23-10-0276-01
Table RA5: Revenue Tonne-Kilometres, by Railway Sector, 2010–2019
(Millions)
2010 2011 2012 2013 2014 2015 2016 2017 2018R 2019Class I 327,831.6 337,929.5 356,943.0 371,799.0 402,612.9 399,353.2 383,505.4 411,250.6 433,484.7 432,416.3Regional 9,802.8 10,392.4 10,617.4 11,192.4 9,552.9 8,964.5 9,131.2 9,513.9 9,857.1 12,371.6Short Line 3,689.9 3,668.1 3,349.8 3,459.7 3,536.0 2,814.9 2,768.3 2,959.5 3,796.3 3,293.9Total 341,324.3 351,989.9 370,910.2 386,451.1 415,701.8 411,132.5 395,404.9 423,723.9 447,138.2 448,081.8
Percentage of total
Class I 96.0 96.0 96.2 96.2 96.9 97.1 97.0 97.1 96.9 96.5Regional 2.9 3.0 2.9 2.9 2.3 2.2 2.3 2.2 2.2 2.8Short Line 1.1 1.0 0.9 0.9 0.9 0.7 0.7 0.7 0.8 0.7
Note: R = Revised data.
Sources: Transport Canada, Statistics Canada
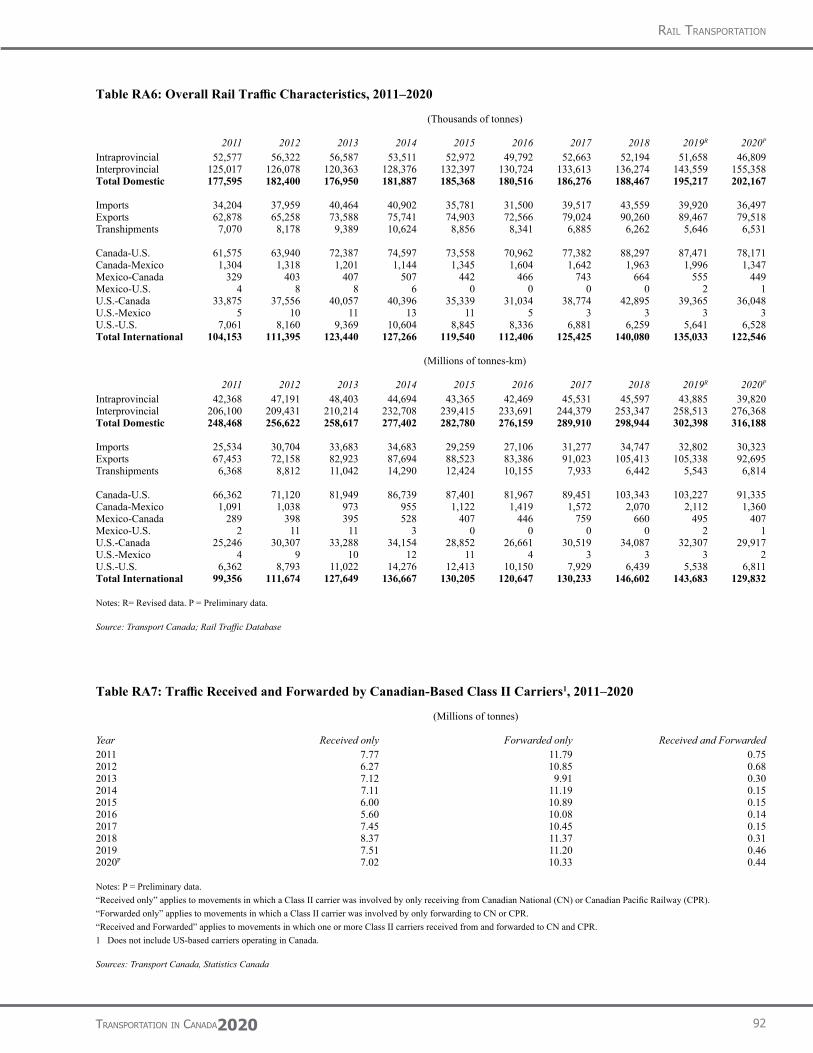
tranSportation in canada2020
rail tranSportation
92
Table RA6: Overall Rail Traffic Characteristics, 2011–2020
(Thousands of tonnes)
2011 2012 2013 2014 2015 2016 2017 2018 2019R 2020P
Intraprovincial 52,577 56,322 56,587 53,511 52,972 49,792 52,663 52,194 51,658 46,809Interprovincial 125,017 126,078 120,363 128,376 132,397 130,724 133,613 136,274 143,559 155,358Total Domestic 177,595 182,400 176,950 181,887 185,368 180,516 186,276 188,467 195,217 202,167
Imports 34,204 37,959 40,464 40,902 35,781 31,500 39,517 43,559 39,920 36,497Exports 62,878 65,258 73,588 75,741 74,903 72,566 79,024 90,260 89,467 79,518Transhipments 7,070 8,178 9,389 10,624 8,856 8,341 6,885 6,262 5,646 6,531
Canada-U.S. 61,575 63,940 72,387 74,597 73,558 70,962 77,382 88,297 87,471 78,171Canada-Mexico 1,304 1,318 1,201 1,144 1,345 1,604 1,642 1,963 1,996 1,347Mexico-Canada 329 403 407 507 442 466 743 664 555 449Mexico-U.S. 4 8 8 6 0 0 0 0 2 1U.S.-Canada 33,875 37,556 40,057 40,396 35,339 31,034 38,774 42,895 39,365 36,048U.S.-Mexico 5 10 11 13 11 5 3 3 3 3U.S.-U.S. 7,061 8,160 9,369 10,604 8,845 8,336 6,881 6,259 5,641 6,528Total International 104,153 111,395 123,440 127,266 119,540 112,406 125,425 140,080 135,033 122,546
(Millions of tonnes-km)
2011 2012 2013 2014 2015 2016 2017 2018 2019R 2020P
Intraprovincial 42,368 47,191 48,403 44,694 43,365 42,469 45,531 45,597 43,885 39,820Interprovincial 206,100 209,431 210,214 232,708 239,415 233,691 244,379 253,347 258,513 276,368Total Domestic 248,468 256,622 258,617 277,402 282,780 276,159 289,910 298,944 302,398 316,188
Imports 25,534 30,704 33,683 34,683 29,259 27,106 31,277 34,747 32,802 30,323Exports 67,453 72,158 82,923 87,694 88,523 83,386 91,023 105,413 105,338 92,695Transhipments 6,368 8,812 11,042 14,290 12,424 10,155 7,933 6,442 5,543 6,814
Canada-U.S. 66,362 71,120 81,949 86,739 87,401 81,967 89,451 103,343 103,227 91,335Canada-Mexico 1,091 1,038 973 955 1,122 1,419 1,572 2,070 2,112 1,360Mexico-Canada 289 398 395 528 407 446 759 660 495 407Mexico-U.S. 2 11 11 3 0 0 0 0 2 1U.S.-Canada 25,246 30,307 33,288 34,154 28,852 26,661 30,519 34,087 32,307 29,917U.S.-Mexico 4 9 10 12 11 4 3 3 3 2U.S.-U.S. 6,362 8,793 11,022 14,276 12,413 10,150 7,929 6,439 5,538 6,811Total International 99,356 111,674 127,649 136,667 130,205 120,647 130,233 146,602 143,683 129,832
Notes: R= Revised data. P = Preliminary data.
Source: Transport Canada; Rail Traffic Database
Table RA7: Traffic Received and Forwarded by Canadian-Based Class II Carriers1, 2011–2020
(Millions of tonnes)
Year Received only Forwarded only Received and Forwarded2011 7.77 11.79 0.752012 6.27 10.85 0.682013 7.12 9.91 0.302014 7.11 11.19 0.152015 6.00 10.89 0.152016 5.60 10.08 0.142017 7.45 10.45 0.152018 8.37 11.37 0.312019 7.51 11.20 0.462020P 7.02 10.33 0.44
Notes: P = Preliminary data.“Received only” applies to movements in which a Class II carrier was involved by only receiving from Canadian National (CN) or Canadian Pacific Railway (CPR).“Forwarded only” applies to movements in which a Class II carrier was involved by only forwarding to CN or CPR.“Received and Forwarded” applies to movements in which one or more Class II carriers received from and forwarded to CN and CPR.1 Does not include US-based carriers operating in Canada.
Sources: Transport Canada, Statistics Canada

StatiStical addendum2020
rail tranSportation
93
Table RA8: Volume of Rail Traffic, by Commodity, 2011–2020
(Thousands of tonnes)
Exports 2011 2012 2013 2014 2015 2016 2017 2018 2019R 2020P
Forest Products 13,416 13,317 14,498 15,034 15,396 16,201 15,479 15,958 14,783 14,038Chemicals 10,307 10,237 11,635 11,870 11,165 11,391 11,036 11,853 11,625 11,408Potash 8,634 7,408 8,380 8,675 8,282 7,943 10,158 11,165 9,449 10,082Intermodal 4,441 5,409 5,634 6,213 6,918 6,596 7,433 8,185 8,345 8,359Crude Oil 129 1,486 4,754 6,962 5,935 4,143 6,744 12,573 14,991 8,250Petroleum Products (excl. crude oil) 4,833 6,171 6,108 5,539 6,157 6,482 7,797 8,883 10,068 8,138Agricultural and Food Products 4,963 5,239 5,516 5,921 6,025 5,915 6,146 6,109 6,154 6,053Metals 3,911 3,450 3,494 3,422 3,887 3,568 3,550 3,832 3,494 3,342Minerals 1,895 1,839 1,921 2,032 2,170 2,364 2,328 2,696 2,961 2,467Miscellaneous 1,718 1,729 2,030 1,914 1,686 1,754 1,862 2,057 1,818 2,104Grains 2,987 3,556 4,380 3,599 2,519 1,943 2,638 3,082 2,031 1,960Fertilizer Materials 2,530 2,273 2,293 1,810 1,809 1,391 1,332 1,478 1,419 1,572Automotive Vehicles and Equipment 2,128 2,472 2,268 2,195 2,426 2,355 2,079 1,997 1,942 1,532Coal 987 657 598 475 526 520 442 393 387 212Iron Ore 0 14 80 79 1 0 0 0 0 0Total 62,878 65,258 73,588 75,741 74,903 72,566 79,024 90,260 89,467 79,518
Imports 2011 2012 2013 2014 2015 2016 2017 2018 2019R 2020P
Coal 9,576 11,173 11,651 10,227 8,570 5,568 10,370 12,411 10,132 9,263Chemicals 5,397 5,672 5,855 5,851 5,621 5,305 5,858 6,140 6,151 6,327Minerals 3,384 4,012 4,944 5,882 5,541 4,745 6,942 7,341 6,774 5,740Intermodal 3,717 4,061 4,761 4,482 4,171 4,289 4,011 4,807 4,652 4,433Petroleum Products (excl. crude oil) 3,316 3,960 4,213 3,871 3,419 3,725 3,192 3,437 3,332 2,960Agricultural and Food Products 2,488 2,682 2,268 2,281 2,174 2,108 2,191 2,488 2,126 2,033Automotive Vehicles and Equipment 1,565 1,477 1,619 1,866 1,918 1,955 2,123 1,906 1,948 1,435Iron Ore 106 106 28 10 646 1,356 1,534 1,528 1,429 1,365Forest Products 1,177 1,204 1,131 1,070 991 872 1,028 947 935 887Grains 376 187 130 314 298 160 403 961 1,094 860Metals 2,114 2,357 2,436 2,242 1,290 1,034 1,354 991 718 752Miscellaneous 937 771 792 707 537 377 485 580 608 416Fertilizer Materials 4 1 2 0 1 4 14 17 16 16Crude Oil 10 249 622 2,087 598 2 4 3 5 8Potash 37 48 11 11 3 1 5 1 1 1Total 34,204 37,959 40,464 40,902 35,781 31,500 39,517 43,559 39,920 36,497
Domestic 2011 2012 2013 2014 2015 2016 2017 2018 2019R 2020P
Grains 29,193 30,120 27,136 35,630 34,562 32,434 34,296 34,968 36,415 43,544Coal 34,309 36,631 37,818 36,557 31,913 31,704 33,469 33,752 36,041 33,571Intermodal 32,911 34,167 28,857 26,695 28,550 26,308 28,740 29,606 29,220 29,591Iron Ore 13,780 13,973 15,314 14,546 17,893 18,586 17,191 14,948 18,447 21,232Petroleum Products (excl. crude oil) 11,038 11,484 9,790 10,201 10,399 11,445 12,658 13,650 14,428 13,247Agricultural and Food Products 7,111 6,786 7,794 7,891 9,007 10,310 10,166 10,769 11,107 12,704Potash 8,493 6,774 8,165 8,801 10,233 9,669 9,928 11,635 11,272 12,400Forest Products 13,667 14,048 13,363 11,391 12,476 13,327 12,809 12,180 10,884 10,222Minerals 10,735 10,619 10,147 9,775 10,005 9,573 9,845 9,987 10,454 9,237Chemicals 7,618 7,857 8,168 7,797 7,982 8,073 8,236 8,508 8,368 8,229Metals 3,095 3,061 3,126 3,521 3,325 2,971 3,057 3,214 3,150 2,993Fertilizer Materials 3,494 3,090 2,834 2,546 2,843 2,725 2,689 2,612 2,494 2,775Miscellaneous 1,045 1,245 1,076 1,144 1,184 1,167 1,396 1,380 1,452 1,255Automotive Vehicles and Equipment 952 1,209 1,108 1,008 1,106 1,067 1,126 1,105 1,083 910Crude Oil 153 1,335 2,256 4,384 3,891 1,156 668 155 402 257Total 177,595 182,400 176,950 181,887 185,368 180,516 186,276 188,467 195,217 202,167
Total Traffic (including transborder) 2011 2012 2013 2014 2015 2016 2017 2018 2019R 2020P
Grains 34,917 35,624 33,263 42,169 39,632 37,189 39,663 41,477 40,640 47,924Coal 44,874 48,461 50,067 47,260 41,011 37,795 44,283 46,556 46,561 43,046Intermodal 41,070 43,639 39,253 37,392 39,639 37,193 40,184 42,598 42,217 42,398Chemicals 23,735 24,132 25,974 25,833 25,024 25,021 25,358 26,732 26,370 26,171Forest Products 28,916 29,149 29,561 28,159 29,433 30,916 29,806 29,693 27,097 25,548Petroleum Products (excl. crude oil) 19,310 21,765 20,246 19,750 20,095 21,805 23,779 26,218 28,324 24,942Agricultural and Food Products 17,582 18,365 18,958 19,422 20,439 22,100 21,674 21,389 22,107 23,922Iron Ore 13,886 14,092 15,421 14,635 18,541 19,942 18,725 16,476 19,876 22,598Potash 17,164 14,243 16,558 17,488 18,518 17,613 20,091 22,801 20,722 22,483Minerals 16,343 16,712 17,303 18,082 17,901 16,817 19,262 20,602 20,664 18,013Crude Oil 374 4,344 10,619 16,516 12,554 6,086 7,749 12,730 15,398 8,515Metals 9,173 8,953 9,126 9,230 8,585 7,619 7,993 8,122 7,474 7,112Fertilizer Materials 6,027 5,365 5,129 4,356 4,653 4,120 4,035 4,107 3,929 4,364Automotive Vehicles and Equipment 4,649 5,167 4,997 5,072 5,452 5,378 5,331 5,010 4,977 3,882Miscellaneous 3,726 3,786 3,914 3,788 3,430 3,328 3,767 4,036 3,895 3,795Total 281,747 293,795 300,390 309,153 304,908 292,922 311,702 328,548 330,250 324,713
Notes: R = Revised data. P = Preliminary data. Domestic includes shipments made to and from ports within Canada. Transborder is U.S.-U.S. traffic that travels through Canada.
Source: Transport Canada, Rail Traffic Database

tranSportation in canada2020
rail tranSportation
94
Table RA9: Value of Rail Exports and Imports by Commodity, 2011–2020
(Millions of dollars)
Exports 2011 2012 2013 2014 2015 2016 2017 2018R 2019R 2020P
Automotive products 26,503 32,152 30,144 29,800 35,948 38,128 34,911 33,991 35,043 26,761 Forest products 7,826 7,994 9,519 10,375 10,712 11,145 11,440 12,262 9,831 11,342 Chemical products 10,006 9,600 10,738 11,529 11,203 10,487 10,319 11,666 10,470 9,463 Metals 8,929 7,793 8,242 9,070 9,106 8,006 9,843 10,980 9,015 8,532 Petroleum products 3,608 4,919 7,398 9,149 5,574 4,134 6,896 11,766 12,379 7,109 Agriculture and food 3,193 3,435 3,474 3,724 3,810 4,037 4,148 4,113 4,138 4,171 Fertilizer materials 3,585 3,259 3,185 2,709 3,489 2,380 2,737 3,124 3,138 2,906 Miscellaneous 1,750 1,928 2,157 1,891 1,868 1,915 1,944 1,990 2,006 1,404 Grains 1,597 1,780 2,062 1,904 1,655 1,338 1,643 1,854 1,361 1,354 Other mine products 202 111 120 143 186 210 242 284 327 254 Coal 283 145 102 81 89 61 147 117 112 47 Iron ore 0 0 0 0 0 0 0 0 0 0Total 67,483 73,115 77,142 80,376 83,640 81,841 84,270 92,147 87,820 73,343
Imports 2011 2012 2013 2014 2015 2016 2017 2018R 2019R 2020P
Automotive products 12,919 14,890 15,118 18,160 20,684 26,848 31,088 29,261 31,381 22,722Chemical products 7,447 8,114 8,532 9,040 8,321 7,661 8,419 8,952 8,439 7,533Miscellaneous 3,267 4,206 4,669 5,260 4,816 3,841 3,704 3,637 4,465 3,231Agriculture and food 2,498 2,972 2,752 3,015 2,917 2,733 2,664 2,832 2,620 2,829Forest products 1,253 1,269 1,321 1,310 1,440 1,317 1,411 1,482 1,546 1,357Metals 3,172 3,423 3,406 3,457 2,418 1,728 2,184 2,249 1,749 1,279Petroleum products 2,462 3,276 3,631 4,381 1,937 1,195 1,104 1,551 1,353 1,125Other mine products 649 694 478 637 799 660 880 768 669 1,048Grains 320 293 250 290 274 244 214 371 375 395Iron ore 172 224 230 210 154 137 149 122 153 152Fertilizer materials 17 41 86 25 45 36 31 28 31 29Coal 16 34 20 36 26 36 34 31 9 4Total 34,192 39,436 40,494 45,821 43,830 46,436 51,881 51,285 52,789 41,703
Notes: R = Revised data. P = Preliminary data.
Source: Transport Canada, adapted from Statistics Canada, International Trade Division

StatiStical addendum2020
rail tranSportation
95
Table RA10: Dangerous Goods Shipments on Rail, 2010–2020
(Thousands of Tonnes)
Petroleum Products 2010 2011 2012 2013 2014 2015 2016 2017 2018R 2019R 2020P
Crude Oil1 24 375 4,344 10,620 16,517 12,554 6,087 7,750 12,734 15,401 8,517Ethanol or Ethanol Mix2 3,500 5,055 6,170 6,781 6,704 5,781 5,814 6,076 6,672 7,072 6,316All Other Petroleum Products3,4 17,862 17,119 18,466 17,281 17,296 17,754 19,434 21,394 23,490 24,961 22,411
Dangerous GoodsMinerals, Ores & Concentrates 2,459 2,770 2,486 2,478 2,013 2,226 1,845 1,776 2,237 2,086 2,492Other Manufactured & Miscellaneous Goods 724 816 861 960 876 775 707 737 745 754 683Petroleum Products5 14,212 14,700 20,360 25,096 30,372 26,965 22,036 25,491 32,389 37,504 28,363Plastic & Chemical Products5 10,901 11,448 11,638 12,927 13,230 12,261 11,786 12,048 12,925 12,485 11,559Waste & Scrap 195 216 241 260 249 209 217 298 323 357 296Other Commodities5 1,115 1,887 1,814 1,785 1,637 1,669 1,862 1,770 1,475 1,428 1,345Total 29,606 31,837 37,401 43,506 48,378 44,105 38,452 42,120 50,094 54,613 44,738
All GoodsAll Dangerous Goods 29,606 31,837 37,401 43,506 48,378 44,105 38,452 42,120 50,094 54,613 44,738Non-Dangerous Goods 237,726 249,812 256,394 256,884 260,775 260,803 254,470 269,582 278,454 275,637 279,975Grand Total 267,332 281,648 293,795 300,390 309,153 304,908 292,922 311,702 328,548 330,250 324,713
Dangerous Goods Share of Grand Total (%) 11.1 11.3 12.7 14.5 15.6 14.5 13.1 13.5 15.2 16.5 13.8
(Number of Carloads)
Petroleum Products 2010 2011 2012 2013 2014 2015 2016 2017 2018R 2019R 2020P
Crude Oil1 306 4,750 53,469 127,705 193,358 146,633 72,064 91,589 147,351 180,870 101,577Ethanol or Ethanol Mix2 45,616 64,182 77,819 84,184 83,083 72,173 72,283 75,120 82,087 87,622 78,484All Other Petroleum Products3,4 238,733 229,428 248,155 236,101 237,859 246,772 271,726 298,472 326,338 348,731 315,016
Dangerous GoodsMinerals, Ores & Concentrates 27,396 30,920 27,955 27,829 22,386 24,914 20,806 20,286 25,104 23,219 27,476Other Manufactured & Miscellaneous Goods 21,844 24,320 26,409 29,159 27,570 24,572 22,981 23,424 23,758 23,337 21,820Petroleum Products5 193,782 198,405 270,673 326,528 386,408 349,193 297,632 344,282 426,016 494,043 383,616Plastic & Chemical Products5 135,674 143,249 144,951 159,767 162,873 152,894 147,868 152,011 161,341 156,232 145,519Waste & Scrap 2,927 3,285 3,585 4,186 3,958 3,041 3,283 4,433 4,678 5,435 4,324Other Commodities5 14,295 23,075 23,194 23,003 21,918 21,926 23,268 22,188 18,954 18,343 17,866Total 395,919 423,253 496,766 570,471 625,113 576,539 515,837 566,624 659,851 720,609 600,619
All GoodsAll Dangerous Goods 395,919 423,253 496,766 570,471 625,113 576,539 515,837 566,624 659,851 720,609 600,619Non-Dangerous Goods 3,562,475 3,694,491 3,841,143 3,899,994 4,023,134 4,100,971 4,043,632 4,351,110 4,460,245 4,438,664 4,319,114Grand Total 3,958,394 4,117,744 4,337,909 4,470,466 4,648,247 4,677,510 4,559,469 4,917,734 5,120,096 5,159,272 4,919,733
Dangerous Goods Share of Grand Total (%) 10.0 10.3 11.5 12.8 13.4 12.3 11.3 11.5 12.9 14.0 12.2
Notes: R = Revised data. P = Preliminary data.1 Standard Classification of Transported Goods (SCTG) code #16000.2 Includes ethanol, methanol and various types of ethanol blends.3 Not all ethanol or ethanol mix products are included in this commodity group.4 Includes petroleum products that are not flagged as dangerous.5 Includes some ethanol and ethanol blends.
Source: Transport Canada, Rail Traffic Database

tranSportation in canada2020
rail tranSportation
96
Table RA11: Volume of Rail Exports and Imports, by Province/Territory of Origin, 2011–2020
(Thousands of tonnes)ExportsProvince/Territory of Origin 2011 2012 2013 2014 2015 2016 2017 2018 2019R 2020P
Alberta 13,600 14,263 16,892 19,515 20,653 19,999 23,289 30,153 32,681 25,292 Saskatchewan 15,256 16,206 19,595 19,771 16,909 14,479 16,873 19,929 17,925 17,327 British Columbia 8,761 10,028 10,315 10,626 11,620 12,117 12,245 13,281 12,440 11,818 Ontario 11,219 11,212 11,543 11,178 11,623 12,150 12,059 12,474 12,316 11,574 Quebec 9,322 8,903 9,753 9,680 9,215 8,696 8,908 8,866 8,824 8,386 Manitoba 2,576 2,809 3,410 3,044 2,992 3,019 3,472 3,544 3,291 3,482 New Brunswick 1,296 1,242 1,363 1,244 1,200 1,421 1,485 1,406 1,495 1,168 Nova Scotia 847 596 717 683 692 684 694 608 495 472 Other1 1 0 0 0 0 0 0 0 0 0 Total 62,878 65,258 73,588 75,741 74,903 72,566 79,024 90,260 89,467 79,518
ImportsProvince/Territory of ClearanceBritish Columbia 11,778 13,935 15,072 13,635 11,789 9,210 14,422 16,981 14,657 13,652Ontario 6,681 8,054 9,017 9,524 7,955 8,165 8,427 8,616 8,427 7,987Alberta 6,815 7,034 7,112 6,996 7,291 6,360 8,024 9,265 8,254 6,762Quebec 5,701 5,513 5,593 7,261 5,648 4,838 4,969 5,071 5,139 4,977Saskatchewan 1,511 1,554 1,732 1,784 1,555 1,485 2,100 2,027 2,018 1,739Manitoba 817 836 858 907 846 670 763 807 661 652Nova Scotia 548 518 498 436 415 530 575 580 561 505New Brunswick 353 516 581 359 282 241 238 211 203 223Other1 0 1 2 0 0 0 0 0 0 0Totals 34,204 37,959 40,464 40,902 35,781 31,500 39,517 43,559 39,920 36,497
Notes: R = Revised data. P = Preliminary data.1 Includes Newfoundland and Labrador, Northwest Territories and Yukon.
Source: Transport Canada, Rail Traffic Database
Table RA12: Value of Rail Exports and Imports, by Port of Exit and Clearance, 2011–2020
(Millions of dollars)ExportsPort of Exit 2011 2012 2013 2014 2015 2016 2017 2018R 2019R 2020P
Windsor 14,723 18,170 17,935 17,554 20,670 21,474 20,137 18,949 17,999 17,702 Sarnia 18,515 17,927 18,273 19,024 20,039 20,334 21,165 22,770 22,611 16,398 Fort Frances 7,754 7,993 9,761 10,745 10,699 10,332 10,876 13,523 12,195 10,119 Fort Erie 7,934 9,272 8,372 8,193 9,367 9,008 7,447 7,516 8,077 6,072 North Portal 3,631 3,538 5,197 5,647 5,201 4,316 5,401 6,720 5,528 4,881 Emerson 3,945 4,993 4,520 4,799 4,119 3,718 4,415 5,712 6,158 4,614 White Rock 2,641 2,863 3,558 3,750 3,742 4,228 4,876 5,287 4,422 4,236 Kingsgate 2,229 2,187 2,542 2,765 2,681 1,858 2,327 3,050 3,332 2,753 Lacolle 1,831 1,950 2,718 3,302 3,086 2,121 2,292 2,801 2,173 1,817 Huntington 941 939 1,089 1,223 1,121 1,431 1,507 1,104 1,273 1,306 Other 3,339 3,283 3,177 3,373 2,913 3,022 3,827 4,715 4,054 3,445 Total 67,483 73,115 77,142 80,376 83,640 81,841 84,270 92,147 87,820 73,343
ImportsPort of ClearanceWindsor 7,294 9,665 8,236 8,884 9,397 15,262 18,660 16,010 19,136 13,912Toronto 6,925 7,552 7,601 8,357 8,542 10,388 10,941 11,786 11,218 9,268Sarnia 3,741 3,224 3,489 3,773 3,478 4,224 5,348 5,637 4,839 4,087Montréal 2,769 3,227 3,166 3,908 3,438 1,757 1,570 1,636 2,121 2,234Winnipeg 986 2,590 2,448 2,633 2,293 2,206 2,745 2,700 2,744 2,127Fort Erie 931 1,025 1,465 2,067 2,813 2,948 2,832 2,796 3,010 1,748Edmonton 3,261 3,470 3,848 3,621 2,676 1,707 1,890 2,508 1,998 1,672Calgary 1,702 1,773 2,189 2,404 2,132 2,068 1,961 1,863 1,661 1,388Vancouver 1,554 1,767 1,686 1,664 1,652 1,286 987 1,036 1,168 1,019Hamilton 856 1,121 1,090 1,569 1,190 327 584 860 858 903Other 4,173 4,023 5,277 6,941 6,218 4,263 4,363 4,454 4,036 3,345Total 34,192 39,436 40,494 45,821 43,830 46,436 51,881 51,285 52,789 41,703
Notes: R = Revised data. P = Preliminary data.
Source: Transport Canada, adapted from Statistics Canada, International Trade Division

StatiStical addendum2020
rail tranSportation
97
Table RA13: Volume of Rail Marine Exports and Imports, 2011–2020
(Thousands of tonnes)
2011R 2012R 2013R 2014R 2015R 2016R 2017R 2018R 2019R 2020P
Exports1 105,216 111,250 112,155 118,263 114,751 115,384 119,968 123,201 127,107 135,093Imports2 24,060 25,363 26,107 27,262 27,885 26,947 29,213 30,893 30,324 28,969Total 129,276 136,613 138,262 145,524 142,637 142,331 149,181 154,094 157,430 164,062
Notes: R = Revised data. P = Preliminary data.1 Volume of rail cargo shipped through Canadian marine ports.2 Volume or rail cargo coming from Canadian marine ports.
Source: Transport Canada; Rail Traffic Database
Table RA14: Volume of Rail Marine Exports and Imports by Commodity, 2011–2020
(Thousands of tonnes)
Exports1
Commodity 2011R 2012R 2013R 2014R 2015R 2016R 2017R 2018R 2019R 2020P
Grains 25,802.0 27,222.5 24,926.8 33,786.2 33,169.4 31,529.6 33,405.4 33,759.9 35,222.3 42,235.3 Coal 35,464.9 40,056.0 40,215.6 37,376.8 31,800.1 31,624.2 33,411.6 33,721.3 35,924.1 33,460.7 Intermodal 10,239.6 10,538.4 11,539.3 11,557.5 11,264.8 11,863.1 12,318.2 12,925.0 12,680.9 12,853.2 Agricultural and Food Products 6,247.7 5,966.0 6,932.7 7,246.5 8,181.0 9,575.6 9,333.1 10,080.0 10,088.1 11,618.4 Potash 8,218.5 6,484.2 7,491.4 8,444.1 9,611.8 9,049.6 9,045.3 10,844.9 10,276.6 11,340.1 Petroleum Products (excl. crude oil) 2,360.5 3,009.4 3,083.3 3,061.0 2,942.7 3,966.6 5,287.9 5,580.8 6,743.4 6,852.1 Forest Products 7,644.4 8,211.6 7,950.6 6,351.2 6,902.9 7,384.7 7,217.0 6,773.4 6,412.8 6,722.1 Minerals 2,476.6 2,547.4 2,523.3 2,572.4 2,559.0 2,618.9 2,682.7 2,845.8 2,978.7 3,268.6 Fertilizer Materials 3,428.8 3,033.6 2,774.0 2,487.0 2,780.3 2,618.0 2,543.7 2,513.3 2,415.6 2,691.4 Chemicals 2,010.5 1,951.6 2,030.7 2,078.6 2,226.3 2,440.3 2,393.4 2,183.3 2,229.6 2,413.5 Metals 546.8 556.3 655.7 814.2 828.4 943.0 830.9 905.4 910.7 800.9 Automotive Vehicles and Equipment 477.8 490.1 485.8 570.8 612.1 664.2 778.7 718.5 674.5 424.8 Crude Oil 17.0 902.9 1,311.9 1,685.5 1,688.2 938.2 508.9 119.3 335.7 230.7 Miscellaneous 280.8 279.5 233.8 231.2 183.7 167.5 210.7 229.7 213.6 181.2 Iron Ore - - - - 0.7 0.1 - - - - Total 105,216.0 111,249.6 112,154.9 118,262.9 114,751.4 115,383.6 119,967.6 123,200.5 127,106.6 135,092.9
Imports2
Commodity 2011R 2012R 2013R 2014R 2015R 2016R 2017R 2018R 2019R 2020P
Intermodal 13,324.5 14,708.3 15,042.0 16,116.1 17,017.8 16,318.6 18,424.9 19,928.0 19,999.7 19,653.1 Chemicals 2,258.9 2,396.8 3,137.8 2,876.2 2,764.9 2,652.6 2,746.8 2,765.8 2,674.7 2,489.8 Metals 1,530.8 1,521.0 1,568.1 2,014.5 1,939.2 1,771.6 1,750.1 1,610.0 1,532.1 1,771.8 Forest Products 1,638.3 1,504.5 1,560.5 1,598.0 1,560.3 1,629.8 1,612.1 1,722.6 1,606.7 1,453.6 Agricultural and Food Products 976.2 906.0 760.0 574.1 650.6 669.5 726.8 746.9 851.5 873.4 Miscellaneous 452.2 455.4 586.7 485.5 467.0 595.6 637.9 702.6 667.5 831.5 Petroleum Products (excl. crude oil) 892.8 632.1 812.6 616.8 747.3 872.2 945.8 930.7 1,039.2 818.2 Automotive Vehicles and Equipment 1,095.9 1,237.4 1,072.5 1,018.9 1,231.7 1,004.6 955.3 1,060.7 1,042.8 637.9 Minerals 590.9 708.3 779.3 1,477.3 1,334.4 1,292.8 1,290.8 1,224.0 693.2 302.1 Grains 1,232.8 1,211.2 655.8 393.0 114.4 78.2 32.3 114.4 103.7 75.7 Fertilizer Materials 65.3 61.5 72.2 63.3 46.6 55.7 60.7 47.7 50.2 51.6 Coal - 4.1 0.5 - 0.2 - 0.0 - 0.2 7.2 Potash 1.2 0.1 0.7 2.3 0.4 5.8 12.3 19.8 53.6 2.4 Crude Oil 0.6 16.0 58.3 25.4 10.4 0.2 17.2 20.1 8.7 1.1 Iron Ore - 0.4 - - - - - - - - Grand Total 24,060.4 25,363.0 26,107.1 27,261.5 27,885.2 26,947.4 29,213.0 30,893.5 30,323.8 28,969.4
Notes: R = Revised data. P = Preliminary data.1 Volume of rail cargo shipped through Canadian marine port of origin.2 Volume of rail cargo shipped through Canadian marine port of destination.
Source: Transport Canada; Rail Traffic Database

tranSportation in canada2020
rail tranSportation
98
Table RA15: CN and CPR Intermodal Traffic, 2011–2020
(Millions of tonnes)
Origin-Destination 2011R 2012R 2013R 2014R 2015R 2016R 2017R 2018R 2019R 2020P
North America 8.2 8.5 8.9 9.4 9.3 9.2 9.6 9.9 9.7 9.7Canada - Canada 6.3 6.2 6.5 7.0 7.1 7.2 7.5 7.6 7.6 7.9Canada - United States 0.7 0.7 0.8 0.8 0.7 0.6 0.7 0.7 0.6 0.9Canada - Mexico 0.0 0.0 0.0 0.0 0.0 0.1 0.1 0.1 0.0 0.0United States - Canada 1.1 1.3 1.4 1.3 1.2 1.1 1.1 1.3 1.1 3.4United States - United States 0.0 0.0 0.0 0.0 0.0 0.0 0.0 0.0 0.0 0.2Mexico - Canada 0.0 0.1 0.1 0.1 0.1 0.1 0.1 0.1 0.1 0.1
Marine Exports 10.2 10.5 11.5 11.6 11.3 11.9 12.3 12.9 12.7 13.5Marine Imports 13.1 14.7 15.0 16.1 17.0 16.3 18.4 19.9 20.0 19.7Total 31.5 33.5 35.3 36.9 37.4 37.2 40.1 42.5 42.2 45.6
Type of carsCOFC 31.0 33.0 34.8 36.4 37.0 37.2 40.1 42.5 42.2 45.6TOFC 0.5 0.5 0.5 0.5 0.3 0.0 0.0 0.0 0.0 0.0Total 31.5 33.5 35.3 36.9 37.4 37.2 40.1 42.5 42.2 45.6
Notes: R = Revised data. P = Preliminary data. CN = Canadian National. CPR = Canadian Pacific Railway. COFC = Containers on flat cars. TOFC = Trailers on flat cars.
Source: Transport Canada; Rail Traffic Database
Table RA16: Passenger and Passenger-Kms for VIA Rail Canada and Other Carriers, 2011–2020
Passengers Carried (Thousands)
Year VIA Rail Other Total2011 4,130 153 4,2832012 3,923 137 4,0602013 3,890 102 3,9922014 3,800 103 3,9032015 3,818 103 3,9212016 3,974 106 4,0802017 4,390 104 4,4942018 4,753 99 4,8522019R 5,016 100 5,1162020P 1,163 N/A N/A
Passenger - Kilometres (Millions)
Year VIA Rail Other Total2011 1,369.6 34.8 1,404.42012 1,342.2 33.5 1,375.72013 1,339.0 26.4 1,365.42014 1,300.3 26.5 1,326.92015 1,322.9 26.5 1,349.42016 1,380.8 27.3 1,408.12017 1,500.0 27.3 1,527.32018 1,596.6 25.3 1,621.92019R 1,698.1 25.9 1,724.02020P 227.0 N/A N/A
Notes: P= Preliminary data. N/A= Not available. Other includes CN, CP, and Class II. Excludes tour operations.
Source: Transport Canada

StatiStical addendum202099
road transportation
Table RO2: Length of Public Road Network in Canada, 2019
Length (thousands of two–lane equivalent kilometres) Percentage Distribution
Paved Unpaved TotalProvinces/Territories
Share of Total (per cent) Paved Unpaved Newfoundland and Labrador 11.3 9.2 20.4 1.8 55.1 44.9Nova Scotia 18.2 15.9 34.1 3.0 53.3 46.7Prince Edward Island 4.4 1.8 6.2 0.6 71.2 28.8New Brunswick 21.1 10.8 31.9 2.8 66.2 33.8Quebec 98.5 59.9 158.4 14.1 62.2 37.8Ontario 127.3 117.4 244.7 21.7 52.0 48.0Manitoba 19.7 67.9 87.6 7.8 22.5 77.5Saskatchewan 30.3 177.3 207.6 18.4 14.6 85.4Alberta 64.3 166.4 230.7 20.5 27.9 72.1British Columbia 53.3 39.0 92.3 8.2 57.7 42.3Nunavut 0.0 1.3 1.3 0.1 0.0 100.0Northwest Territories 1.2 4.2 5.3 0.5 21.9 78.1Yukon 2.5 3.7 6.2 0.5 40.9 59.1Total 452.0 674.6 1,126.6 100.0 40.1 59.9
Notes: Does not include private roads.The methodology used to calculate the two-lane equivalent kilometers has been revised since the previous edition of this table was published.
Source: National Road Network (NRN), CanVec Series 2019
Table RO1: National Highway System, 2017(Kilometres)
Province Core Routes Feeder RoutesNorthern & Remote
Routes TotalNewfoundland and Labrador 1,007.6 298.0 1,161.0 2,466.6Nova Scotia 904.7 294.3 0.0 1,199.0Prince Edward Island 208.7 189.5 0.0 398.2New Brunswick 994.6 818.4 0.0 1,813.0Quebec 3,436.9 770.9 1,435.6 5,643.4Ontario 6,134.8 682.0 0.0 6,816.8Manitoba 985.2 740.6 368.2 2,094.0Saskatchewan 2,451.2 0.0 236.3 2,687.5Alberta 4,088.5 215.5 196.5 4,500.6British Columbia 5,869.3 446.7 724.0 7,040.0Nunavut 0.0 0.0 0.0 0.0Northwest Territories 575.6 0.0 847.2 1,422.8Yukon 1,068.6 0.0 947.9 2,016.5Canada 27,725.7 4,455.9 5,916.7 38,098.4
Notes: Totals may not add up due to rounding.The length information is based on the centerline distance of a roadway between start and end points (rather than lane-kilometers or “two-lane equivalent” lengths) as of December 31, 2017.New data was not available at source prior to publication.
Source: Canada’s National Highway System Annual Report 2017

tranSportation in canada2020 100
road tranSportation
Table RO3: Traffic Volume by Canadian For-Hire Carriers, 2014–2018
Metric Tonnes (Millions) Tonne-Kilometres (Millions)Share 2018 Share 2018
2014 2015 2016 2017 2018P in percent 2014 2015 2016 2017 2018P in percentIntraprovincial 550.2 545.3 579.0 569.7 574.8 76.1 77,588 85,221 92,906 82,792 78,398 29.1Interprovincial 78.0 81.9 74.0 84.4 84.5 11.2 82,972 82,960 79,467 82,068 86,606 32.2Total Domestic 628.3 627.2 653.0 654.2 659.3 87.3 160,561 168,181 172,373 164,860 165,004 61.3
Exports 55.8 55.3 68.2 68.9 54.1 7.2 52,983 55,503 79,216 90,612 55,924 20.8Imports 46.5 46.7 34.3 37.0 41.6 5.5 55,024 53,712 43,126 44,387 48,357 18.0Total International 102.3 102.0 102.5 105.9 95.7 12.7 108,008 109,215 122,342 134,999 104,282 38.7
Total 730.6 729.2 755.5 760.1 755.0 100.0 268,568 277,396 294,716 299,858 269,285 100.0
Note: P= Preliminary data. New data was not available at source prior to publication.
Source: Statistics Canada, Trucking Commodity Origin and Destination (TCOD) Survey
Table RO4: Canadian International Trade Value Shipped by Trucks, by Commodity Groups, 2019–2020
(Millions of dollars)
Total Exports by trucks
Commodity Categories 2019R % Share 2020P % ShareMachinery and electrical equipment 43,940 18.8 37,136 17.4Other manufactured and miscellaneous goods 37,807 16.2 36,991 17.3Automobiles, parts and other transportation equipment 45,761 19.6 34,951 16.3Agricultural and food products 33,254 14.2 34,245 16.0Chemical products, plastics and rubber 30,826 13.2 29,885 14.0Base metals and articles thereof 20,051 8.6 18,465 8.6Wood and paper products 14,031 6.0 14,887 7.0Non-metallic minerals, coal and stone products 3,265 1.4 3,314 1.6Waste and scrap material 2,361 1.0 2,339 1.1Petroleum products, LNG and other fuels 2,037 0.9 1,483 0.7Metallic ores 82 0.0 87 0.0
Total Exports by Trucks 233,414 100.0 213,785 100.0 Destination: United States 225,798 96.7 207,967 97.3 Destination: Mexico 3,604 1.5 2,927 1.4 Destination: Other Countries 4,012 1.7 2,891 1.4
Total Imports by trucks1
Commodity Categories 2019R % Share 2020P % ShareMachinery and electrical equipment 97,894 30.9 87,012 30.2Automobiles, parts and other transportation equipment 57,106 18.1 43,266 15.0Other manufactured and miscellaneous goods 43,473 13.7 42,845 14.9Chemical products, plastics and rubber 43,394 13.7 43,587 15.1Agricultural and food products 33,068 10.5 33,747 11.7Base metals and articles thereof 20,825 6.6 18,689 6.5Wood and paper products 10,395 3.3 9,961 3.5Non-metallic minerals, coal and stone products 4,778 1.5 4,504 1.6Waste and scrap material 2,781 0.9 2,373 0.8Petroleum products, LNG and other fuels 2,440 0.8 2,219 0.8Metallic ores 221 0.1 220 0.1
Total Imports by Trucks 316,375 100.0 288,423 100.0 Origin: United States 208,297 65.8 188,802 65.5 Origin: Mexico 26,043 8.2 21,263 7.4 Origin: Other Countries 82,035 25.9 78,358 27.2
Notes: R= Revised data. P= Preliminary data. LNG= Liquefied natural gas.1 Imports by trucks from other countries than the United States are overestimated. In the case of imports, the mode of transport represents the last mode by which the cargo was
transported to the port of clearance in Canada and is derived from the cargo control documents of customs. This may not be the mode of transport by which the cargo arrived at the Canadian port of entry in the case of inland clearance. This may, therefore, lead to some underestimation of Canadian imports by the marine and air transport modes.
Source: Transport Canada, adapted from Statistics Canada, International Trade database

StatiStical addendum2020
road tranSportation
101
Table RO5: Canada’s Road Trade with the United States, by Busiest Border Crossing Points, 2019–2020
(Millions of dollars)
Exportsby Road
2020P
Importsby Road
2020P
Total Tradeby Road
2020P
Total Tradeby Road
2019R
PercentageChange2020/19
Share inPer Cent
2020
Cumulative Share in Per Cent
2020Border Crossing PointWindsor-Ambassador, Ontario 58,021 52,847 110,868 123,838 (10.5) 27.9 27.9Fort Erie/Niagara Falls, Ontario 35,666 27,032 62,698 66,671 (6.0) 15.8 43.7Sarnia, Ontario 35,014 26,208 61,222 68,394 (10.5) 15.4 59.2Lacolle, Québec 14,863 6,602 21,465 23,083 (7.0) 5.4 64.6Emerson, Manitoba 10,324 10,547 20,872 23,471 (11.1) 5.3 69.8Pacific Highway, British Columbia 10,605 9,546 20,151 21,318 (5.5) 5.1 74.9Lansdowne, Ontario 10,677 7,013 17,689 17,606 0.5 4.5 79.4Coutts, Alberta 7,067 4,978 12,045 13,980 (13.8) 3.0 82.4North Portal, Saskatchewan 2,924 6,206 9,129 10,699 (14.7) 2.3 84.7Huntingdon, British Columbia 3,016 1,324 4,340 4,384 (1.0) 1.1 85.8Woodstock, New Brunswick 3,268 923 4,191 4,574 (8.4) 1.1 86.9Philipsburg, Québec 2,663 1,354 4,017 5,649 (28.9) 1.0 87.9Kingsgate, British Columbia 2,125 1,687 3,812 3,984 (4.3) 1.0 88.8St. Stephen, New Brunswick 2,283 956 3,238 3,739 (13.4) 0.8 89.7Other crossing points 9,452 31,579 41,031 42,704 (3.9) 10.3 100.0Total Road Trade 207,967 188,802 396,770 434,095 (8.6) 100.0
Notes: R = Revised data. P = Preliminary data.
Source: Transport Canada, adapted from Statistics Canada, International Trade Database
Table RO6: Twenty Busiest Border Crossings for Cars/Other Vehicles, 2016–2020
2020 Rank
Two-Way Traffic Volume (millions of movements) Share (%)
Border Crossing Province 2016 2017 2018 2019 2020 2016 2017 2018 2019 20201 Windsor-Ambassador Bridge1 Ont. 4.01 4.13 4.43 4.21 1.79 7.5 7.7 8.0 7.7 15.72 Pacific Highway/Douglas B.C. 7.63 7.76 8.35 8.06 1.60 14.3 14.5 15.0 14.8 14.13 Detroit - Windsor Tunnel1 Ont. 4.15 4.04 3.67 4.00 1.08 7.8 7.5 6.6 7.3 9.54 Cornwall Ont. 1.59 1.66 1.68 1.69 1.04 3.0 3.1 3.0 3.1 9.15 Fort Erie - Peace Bridge Ont. 4.13 4.11 4.10 4.09 0.91 7.8 7.7 7.4 7.5 8.06 Sarnia - Blue Water Bridge Ont. 3.02 3.26 3.80 3.44 0.59 5.7 6.1 6.8 6.3 5.27 Niagara Falls - Queenston Bridge Ont. 3.02 2.99 3.07 3.03 0.54 5.7 5.6 5.5 5.6 4.88 Boundary Bay B.C. 2.61 2.70 2.82 2.85 0.43 4.9 5.0 5.1 5.2 3.89 Niagara Falls - Rainbow Bridge Ont. 2.31 2.33 2.47 2.31 0.38 4.4 4.3 4.4 4.2 3.410 Lacolle2 Que. 1.83 1.82 1.83 1.85 0.38 3.4 3.4 3.3 3.4 3.311 Huntingdon B.C. 1.61 1.62 1.86 1.79 0.37 3.0 3.0 3.3 3.3 3.212 Sault Ste. Marie Ont. 1.36 1.42 1.44 1.35 0.30 2.6 2.6 2.6 2.5 2.713 Lansdowne Ont. 1.20 1.17 1.18 1.19 0.25 2.3 2.2 2.1 2.2 2.214 St. Stephen N.B. 1.02 1.02 1.08 1.11 0.23 1.9 1.9 1.9 2.0 2.015 Aldergrove B.C. 0.92 0.96 1.14 1.09 0.21 1.7 1.8 2.1 2.0 1.816 Edmundston N.B. 0.73 0.73 0.75 0.73 0.18 1.4 1.4 1.4 1.3 1.517 Phillipsburg Que. 0.87 0.87 0.88 0.90 0.17 1.6 1.6 1.6 1.7 1.518 Fort Frances Ont. 0.75 0.74 0.79 0.80 0.16 1.4 1.4 1.4 1.5 1.419 Rock Island3 Que. 0.78 0.79 0.80 0.79 0.15 1.5 1.5 1.4 1.4 1.320 Coutts Alb. 0.42 0.42 0.42 0.40 0.14 0.8 0.8 0.8 0.7 1.3
Top 20 Crossings 43.98 44.51 46.57 45.68 10.89 82.7 83.0 83.6 83.8 95.8All other crossings 9.20 9.11 9.12 8.80 0.48 17.3 17.0 16.4 16.2 4.2Total All Border Crossings 53.17 53.62 55.69 54.49 11.37 100.0 100.0 100.0 100.0 100.0
Notes: Two-way traffic volumes were estimated by doubling one-way flows northbound into Canada. 1 The data for the Windsor-Ambassador Bridge and Detroit-Windsor Tunnel presented here comes from a Transport Canada calculation and is not found directly in the source
data. The sum of vehicle movements through all other Ontario border crossings is deducted from the Ontario total found in the source data. The proportions match those found in publically-available data from the Bridge & Tunnel Operators Association (BTOA).
2 Lacolle includes routes 15, 221 and 223.3 Rock Island includes routes 55 and 143.
Source: Transport Canada, adapted from Statistics Canada, Table 24-10-0002-01

tranSportation in canada2020
road tranSportation
102
Table RO8: Border Wait Times for Southbound Trucks at Selected Crossings, 2020
Border NameMedian Border
Waiting Times (Minutes)Median Border Waiting Times (3 year average)
95th percentile Wait Time (Minutes)
95th percentile Wait Time (3 year average)
St. Stephen, NB 11.1 6.8 37.0 20.8Woodstock Road, NB 6.9 9.2 16.3 20.9Rock Island, QC 5.4 7.5 20.0 26.6Lacolle, QC 10.2 12.7 27.3 33.0Lansdowne, ON 15.1 16.3 37.7 33.7Niagara Falls, ON - Queenston Bridge 11.9 13.9 45.7 42.6Fort Erie, ON - Peace Bridge 12.2 10.9 35.8 34.7Windsor-Ambassador Bridge, ON 8.0 13.1 27.8 40.4Sarnia, ON 11.3 16.6 31.0 39.1Sault Ste. Marie, ON 5.4 10.0 16.9 25.5Emerson, MB 10.6 13.3 21.4 25.7North Portal, SK 8.3 9.7 20.4 23.5Coutts, AB 9.1 12.2 21.6 27.9Huntingdon, BC 11.0 12.2 30.2 29.8Pacific Highway, BC 15.2 15.1 42.7 44.8
Source: Transport Canada
Table RO7: Twenty Busiest Border Crossings for Trucks, 2016–2020
2019 Rank
Two-Way Traffic Volume (millions of movements) Share (%)
Border Crossing Province 2016 2017 2018 2019 2020 2016 2017 2018 2019 20201 Windsor-Ambassador Bridge1 Ont. 2.69 2.86 3.05 2.96 2.66 24.7 26.0 27.3 27.0 28.12 Sarnia -Blue Water Bridge Ont. 1.70 1.61 1.56 1.53 1.39 15.6 14.6 14.0 14.0 14.73 Fort Erie - Peace Bridge Ont. 1.19 1.14 1.11 1.02 0.97 10.9 10.3 10.0 9.3 10.34 Niagara Falls - Queenston Bridge Ont. 0.75 0.79 0.79 0.81 0.74 6.9 7.2 7.1 7.5 7.85 Pacific Highway/Douglas B.C. 0.78 0.78 0.79 0.77 0.72 7.2 7.1 7.1 7.0 7.66 Lacolle2 Que. 0.54 0.55 0.57 0.57 0.54 5.0 5.0 5.1 5.2 5.77 Emerson Man. 0.41 0.42 0.42 0.42 0.41 3.7 3.8 3.7 3.9 4.48 Lansdowne Ont. 0.38 0.37 0.38 0.37 0.36 3.5 3.4 3.4 3.4 3.89 Coutts Alb. 0.25 0.25 0.26 0.27 0.27 2.3 2.3 2.3 2.5 2.810 North Portal Sas. 0.21 0.23 0.24 0.22 0.21 1.9 2.1 2.2 2.0 2.211 Huntingdon B.C. 0.19 0.19 0.18 0.18 0.19 1.8 1.8 1.6 1.7 2.012 Rock Island3 Que. 0.18 0.18 0.18 0.21 0.17 1.7 1.6 1.6 1.9 1.813 Phillipsburg Que. 0.18 0.18 0.18 0.17 0.17 1.7 1.7 1.6 1.6 1.814 Kingsgate B.C. 0.12 0.11 0.10 0.11 0.11 1.1 1.0 0.9 1.0 1.115 St. Stephen N.B. 0.10 0.10 0.11 0.11 0.10 0.9 0.9 1.0 1.0 1.116 Woodstock N.B. 0.10 0.11 0.12 0.12 0.10 0.9 1.0 1.0 1.1 1.117 Aldergrove B.C. 0.08 0.09 0.09 0.09 0.10 0.7 0.8 0.8 0.8 1.018 Sault Ste. Marie Ont. 0.09 0.09 0.08 0.08 0.08 0.8 0.8 0.7 0.7 0.819 Prescott Ont. 0.06 0.07 0.07 0.07 0.06 0.5 0.6 0.6 0.6 0.720 Woburn Que. 0.05 0.05 0.05 0.05 0.05 0.5 0.5 0.5 0.5 0.6
Top 20 Crossings 10.04 10.17 10.32 10.13 9.41 92.1 92.3 92.4 92.6 99.2All other crossings 0.86 0.85 0.85 0.81 0.08 7.9 7.7 7.6 7.4 0.8Total All Border Crossings 10.89 11.02 11.17 10.94 9.48 100.0 100.0 100.0 100.0 100.0
Notes: Two-way traffic volumes were estimated by doubling one-way flows northbound into Canada. 1 The data for the Windsor-Ambassador Bridge presented here comes from a Transport Canada calculation and is not found directly in the source data. The
sum of vehicle movements through all other Ontario border crossings is deducted from the Ontario total found in the source data. The proportions match those found in publically-available data from the Bridge & Tunnel Operators Association (BTOA).
2 Lacolle includes routes 15, 221 and 223.3 Rock Island includes routes 55 and 143.
Source: Transport Canada, adapted from Statistics Canada, Table 24-10-0002-01

StatiStical addendum2020
road tranSportation
103
Table RO9: Annual Trucking Bankruptcies by Region, 2011–2020
Atlantic Manitoba & British Columbia Total TotalYear Provinces Quebec Ontario Saskatchewan Alberta & Territories Trucking Economy1
2011 8 75 65 20 10 10 188 3,6432012 8 66 55 9 10 7 155 3,2362013 11 77 26 9 3 3 129 3,1872014 8 74 34 10 6 7 139 3,1162015 6 67 30 6 2 6 117 3,0892016 5 79 21 10 2 7 124 2,8842017 6 69 21 14 6 4 120 2,7002018 9 87 26 7 6 3 138 2,6772019 5 78 25 12 12 2 134 2,7462020 0 55 11 3 9 0 78 2,108
Notes: Truck transportation bankruptcies data are based on the North American Industry Classification System (NAICS). This table includes bankruptcies data related to NAICS 484 Truck transportation and NAICS 4884 Support activities for road transportation.1 Total Economy include all business bankruptcies (consumer bankruptcies excluded).
Source: Industry Canada, Office of the Superintendent of Bankruptcy
Table RO10: Bus Industry Revenues by Service Lines, 2009–20182009-2018
CAGR2009 2010 2011 2012 2013 2014R 2015R 2016R 2017P 2018P (Per cent)
Number of companiesUrban transit systems1 88 86 85 87 85 88 92 95 96 98 1.2 Interurban and rural bus transportation 20 20 18 22 18 17 13 14 13 14 (3.9)School and employee bus transportation 915 1,020 749 751 542 531 491 488 411 400 (8.8)Charter and sightseeing bus industries 140 152 140 155 148 141 127 117 118 117 (2.0)Other transit and ground passenger transportation2 206 189 174 231 258 247 213 347 396 485 10.0
Total 1,369 1,467 1,166 1,246 1,051 1,024 936 1,061 1,034 1,114 (2.3)
(Millions of dollars)Revenues by NAICS Industry3
Urban transit systems1 10,564 11,254 12,155 12,340 12,700 13,678 14,987 15,144 15,144 17,666 5.9 Interurban and rural bus transportation 631 660 661 675 754 741 620 693 405 317 (7.4)School and employee bus transportation 1,812 1,933 2,019 2,089 2,131 2,272 2,099 2,036 2,418 2,471 3.5 Charter and sightseeing bus industries 458 478 472 512 583 599 570 583 675 675 4.4 Other transit and ground passenger transportation2 171 168 209 224 317 316 288 630 468 590 14.7
Total 13,635 14,494 15,516 15,839 16,485 17,605 18,563 19,085 19,110 21,719 5.3
Revenues by Business LineUrban transit services 3,396 3,608 3,833 4,061 4,334 4,451 4,582 4,817 4,572 4,642 3.5 School Bus transportation 1,456 1,488 1,559 1,548 1,756 1,876 1,727 1,781 1,804 1,916 3.1 Charters services 524 577 554 602 492 537 504 546 567 624 2.0 Shuttle & sightseeing services 78 148 92 90 566 132 119 108 144 127 5.5 Scheduled Intercity services 433 442 436 457 452 452 367 225 305 250 (5.9)Other passenger bus services 205 201 301 378 N/A N/A N/A N/A N/A N/AOther revenues 227 581 678 565 639 687 776 909 1,136 1,226 20.6 Parcels express delivery 85 85 90 84 76 515 441 525 481 545 22.9
Total (excluding government contributions) 6,405 7,130 7,544 7,785 8,314 8,648 8,517 8,912 9,009 9,330 4.3
Government contributions4 7,230 7,364 7,973 8,054 8,171 8,957 10,046 10,173 11,307 12,390 6.2
Total 13,635 14,494 15,516 15,839 16,485 17,605 18,563 19,085 20,316 21,720 5.3
Notes: R= Revised data. P= Preliminary data. N/A = Not available. CAGR= Compound Annual Growth Rate. 1 Including NAICS 485110 as well as urban transit activity in other industries.2 Including NAICS 485510 and 487110.3 NAICS= North American Industry Classification System. The Canadian passenger bus and urban transit industries are covered by 6 categories: 485110 - Urban Transit
Systems; 485210 - Interurban and Rural bus transportation; 485410 - School and Employee bus transportation; 485510 - Charter bus industry; 485990 - Other Transit/ Ground Passenger transportation; and finally 487110 - Scenic and Sightseeing Transportation Land.
4 Including operating and capital government contributions for public transit bus services and school bus services.
Source: Statistics Canada, Table 23-10-0081-01

tranSportation in canada2020
road tranSportation
104
Table RO11: Urban Transit Passengers Carried and Vehicle-Kilometres, 2010–2019
Urban Transit1 Urban TransitYear Passengers (millions) Vehicle-Kilometres (millions)2010 1,909.8 1,128.62011 2,000.8 1,173.32012 2,028.5 1,170.32013 2,050.4 1,185.42014 2,061.6 1,191.62015 2,057.5 1,176.32016 2,030.1 1,185.72017 2,106.0 1,200.72018R 2,156.8 1,243.42019P 2,194.7 1,312.2
Notes: R= Revised data. P= Preliminary data.1 Passengers carried by urban transit operators only.
Sources: Transport Canada, special tabulation based on Canadian Urban Transit Association (CUTA)
Table RO12: Urban Transit Fleet Composition, 2010–2019
(Number of vehicles)
Vehicle Type 2010 2011 2012 2013 2014 2015 2016 2017 2018 2019Standard motor bus 1,547 983 751 590 394 234 219 177 156 71Low floor bus 13,624 14,209 14,493 15,014 15,494 15,685 16,231 16,859 17,552 17,825Light rail vehicle 515 547 592 592 592 619 641 639 679 745Heavy rail vehicle 1,434 1,506 1,596 1,528 1,480 1,552 1,575 1,567 1,567 1,749Commuter rail vehicle 714 557 554 574 574 942 930 666 666 1152Other1 360 326 320 323 328 362 390 378 452 452Total Vehicles 18,194 18,128 18,306 18,621 18,862 19,394 19,986 20,286 21,072 21,994
1 Including streetcars, locomotives, ferries and other unspecified.
Source: Special tabulation based on Canadian Urban Transit Association (CUTA)
Table RO13: Average Annual Compensation in the Bus Industry, 2009–2018
(Current dollars)
2009 2010 2011 2012 2013 2014R 2015 2016 2017R 2018P
Urban transit systems 78,024 82,046 84,031 89,799 89,226 89,392 89,653 94,212 101,351 96,658Interurban and rural bus transportation 61,383 72,085 72,150 77,968 88,450 83,878 80,267 81,043 61,591 84,614Other transit and ground passenger transportation 39,306 34,448 37,528 29,288 41,373 49,123 44,786 44,998 44,169 46,767Charter and sightseeing bus industries 33,171 38,598 38,055 38,038 37,182 39,010 43,358 35,848 35,367 37,767School and employee bus transportation 25,210 28,522 28,749 27,898 28,694 26,715 25,193 26,130 25,897 39,010Total bus industries and bus activities in non-bus industries 55,791 60,647 61,244 63,205 64,255 62,416 62,634 63,077 67,351 67,875
Notes: R= Revised data. P= Preliminary data.
Source: Statistics Canada, Table 23-10-0083-01
Table RO14: Selected Provincial Urban Transportation System Indicators, 2019
Quebec Ontario Alberta B.C. CanadaPrice levels, (Canada=100) 79.7 119.7 72.0 104.0 100.0Total unit cost (Canada=100) 74.5 127.3 88.3 82.1 100.0Cost recovery (in %) 38.8 34.1 29.6 45.9 36.3Revenue Shortfall per passenger ($) 2.8 5.6 3.9 2.9 4.1
Source: Transport Canada, based on Statistics Canada and CUTA information