TRANSPORTATION & DEVELOPMENT - Chandler, … & Maintenance ... 3,590 3,590 3,000 3,590 0.00%...
29
Plenty of road work and heavy lifting keeps Chandler on the move. It’s no easy task, but one that we take very seriously. Through the meticulous efforts of Transportation and Development, Chandler continues to be a well-maintained and structurally sound community. TRANSPORTATION & DEVELOPMENT Activities and Functions Accomplishments Goals, Objectives, and Performance Measurements Budget Summary Position Summary 13 TRANSPORTATION & DEVELOPMENT
-
Upload
nguyenmien -
Category
Documents
-
view
214 -
download
0
Transcript of TRANSPORTATION & DEVELOPMENT - Chandler, … & Maintenance ... 3,590 3,590 3,000 3,590 0.00%...

Plenty of road work and heavy lifting keeps Chandler on the move. It’s no easy task, but one that we take very seriously. Through the meticulous efforts of Transportation and Development, Chandler continues to be a well-maintained and structurally sound community.
TR
AN
SPO
RTAT
ION
&
DE
VE
LO
PM
EN
T
Activities and FunctionsAccomplishmentsGoals, Objectives, and Performance MeasurementsBudget SummaryPosition Summary
13
TRANSPORTATION & DEVELOPMENT

City of Chandler 2017-18 Adopted Budget
Transportation & Development
Assistant City Manager
Transportation & Development
Administration
Development Services Traffic Engineering
Engineering Transit Services
Capital Projects Street Sweeping
Streets
443

City of Chandler 2017-18 Adopted Budget
Transportation & Development
The table below depicts the breakdown by division for the Fiscal Year 2017-18 Transportation & Development Department Budget. Subsequent pages provide cost center descriptions, goals and objectives, performance measurements, budget summaries, authorized positions, and highlights of significant changes.
Transportation & Development Overview
2015-16 2016-17 2016-17 2017-18 % ChangeActual Adopted Estimated Adopted Adopted to
Expenditures by Cost Center Expenditures Budget Expenditures Budget AdoptedTransportation and Dev Administration 1,190,733$ 1,284,933$ 1,208,629$ 1,411,743$ 9.87%Development Services 3,404,903 3,527,855 3,572,505 3,485,748 -1.19%Engineering 2,109,772 2,190,895 2,155,867 2,194,295 0.16%Capital Projects 1,621,563 2,041,136 1,874,230 2,030,737 -0.51%Streets 10,181,829 10,089,009 12,284,691 10,074,919 -0.14%Streets Capital 26,622,822 83,047,548 10,054,565 114,536,032 37.92%Traffic Engineering 6,472,866 6,696,969 6,637,878 6,857,040 2.39%Transit Services 1,135,678 1,655,651 1,707,979 2,764,017 66.94%Street Sweeping 1,480,250 1,302,519 1,306,158 1,025,917 -21.24%
Total 54,220,416$ 111,836,515$ 40,802,502$ 144,380,448$ 29.10%
Expenditures by CategoryPersonnel & Benefits
Total Personnel 14,687,357$ 15,924,969$ 15,699,690$ 16,006,883$ Ongoing(1) - 15,859,769 15,634,490 15,941,244 0.51%One-time(1) - 65,200 65,200 65,639 0.67%
Operating & Maintenance 12,910,237 12,863,998 15,048,247 13,837,533 7.57%Capital - Major 26,622,822 83,047,548 10,054,565 114,536,032 37.92%
Total 54,220,416$ 111,836,515$ 40,802,502$ 144,380,448$ 29.10%
% Change2015-16 2016-17 2016-17 2017-18 Adopted to
Staffing by Cost Center Revised Adopted Revised Adopted AdoptedTransportation and Dev Administration 9.000 9.000 9.000 9.000 0.00%Development Services 32.000 32.000 32.000 32.000 0.00%Engineering 19.000 19.000 19.000 19.000 0.00%Capital Projects 20.000 20.000 20.000 20.000 0.00%Streets 40.500 43.500 43.500 43.500 0.00%Traffic Engineering 25.000 25.000 25.000 25.000 0.00%Transit Services 2.000 2.000 2.000 2.000 0.00%Street Sweeping 9.000 9.000 9.000 9.000 0.00%
Total 156.500 159.500 159.500 159.500 0.00%(1) Ongoing and One-time Personnel Services detail not availab le for 2015-16 Actual Expenditures.
444

City of Chandler 2017-18 Adopted Budget
Transportation & Development
2016-17 Transportation & Development Accomplishments
Implemented an electronic plan submission and review program (EDR), and have received and reviewed over 120 electronic plan submittals since January 2017.
Received American Public Works Association (APWA) reaccreditation in 2016.
Completed federally funded Phase III of McQueen Road Improvements from Riggs Road to Chandler Heights Road.
Worked to increase transit availability by adding a new Ray Road bus route and participating in the transit corridor study with the City of Mesa and Valley Metro.
Provided approximately 61,000 trips to Chandler senior citizens and persons with disabilities through East Valley Dial-a-Ride and the Ride Choice Program.
Installed 35 new bus shelters.
Upgraded 731 sidewalk ramps and 107,623 square feet of driveways to meet current Americans with Disabilities Act (ADA) standards.
Conducted 21 traffic-calming studies and 12 traffic signal warrant studies at various locations.
Updated Geographical Information System (GIS) data layers for the City’s new internal GIS portal: Web Application for Mapping (WAM).
Processed 500 as-built requests and shared 35,000 as-built sheets with external customers requesting as-built information.
Assigned approximately 1,800 new addresses and added them to the existing City of Chandler addressing database.
Processed 8,496 permit applications and issued 2,832 on the same or next business day. Approximately 12,000 customers were served at the customer service counter.
Applied slurry seal to 130 lane miles of City streets.
Completed 68 lane miles of mill and inlay asphalt paving on City streets.
Upgraded 6,830 linear feet of walls and fences.
Awarded and began installing approximately 750 Light-Emitting Diode (LED) streetlights at signalized intersections in the City.
Building plan reviewers examined approximately 4,800 projects.
Averaged approximately 200 walk-in building plan reviews per month for small remodel and repair projects.
City sweepers swept 55,013 miles of City streets and disposed of 1,796 tons of sweeping debris.
Completed 3,420 street light outage and other repairs and 1,500 traffic sign and street name sign repairs and installations.
Completed 96 traffic signal timing changes in response to roadway incidents and construction detours.
City crews placed 2,565 square feet of asphalt and 50,099 square feet of concrete.
Reviewed 1,617 civil planning sheets and 100% of plans within target review timeframes.
445

City of Chandler 2017-18 Adopted Budget
Transportation & Development
Transportation & Development Administration is charged with providing management direction and support to the operational areas that comprise the Transportation & Development Department.
2017-18 Performance Measurements
Goal: To provide efficient and effective services to the residents of Chandler through administration, general direction, and coordination of activities of the Transportation & Development Department. Supports Priority Based Budgeting Goal(s): Good Governance Objective: ♦ Respond to requests for information, assistance, complaints, and direction in a timely manner and keep
citizens informed of services, programs, and projects affecting them.
Measures
2014-15 Actual
2015-16 Actual
2016-17
Projected
2016-17 Year End Estimate *
2017-18
Projected Number of citizen requests 3,924 3,816 4,200 3,400 3,600 Percentage of customer service requests responded to within 5 days 95% 95% 95% 95% 95% Number of public meetings with citizens/neighborhoods/businesses 32 32 32 32 31
Goal: Supply factual information, data, and recommendations on Transportation & Development issues to the City Manager to assist in implementation of City Code requirements and Council policies. Supports Priority Based Budgeting Goal(s): Effective Transportation Objective: ♦ Represent the City at various agency and civic group meetings (i.e., Arizona Department of Transportation,
Salt River Project, Maricopa Association of Governments, and Regional Public Transit Authority).
Measure
2014-15 Actual
2015-16 Actual
2016-17
Projected
2016-17 Year End Estimate *
2017-18
Projected Number of agency and civic group meetings attended by City representatives 116 116 118 116 116
* 2016-17 Year End Estimate reflects “six months actual” and “six months estimated.” Note: All measurements are through June 30th, the last day of the fiscal year.
Division: Transportation & Development
Administration Cost Center: 3010
446

City of Chandler 2017-18 Adopted Budget
Transportation & Development
Transportation & Development Administration – 3010
Budget Summary
Authorized Positions
Significant Budget and Staffing Changes
During Fiscal Year (FY) 2016-17, one Construction Project Coordinator position was reclassified to Public Works Inspector. FY 2017-18 reflects a one-time funding increase for on-call temporary services, as well as ongoing funding increases for computer monitors and software.
Description
2015-16 Actual
Expenditures
2016-17 Adopted Budget
2016-17 Adjusted Budget
2016-17 Estimated
Expenditures
2017-18 Adopted Budget
% Change Adopted to
AdoptedPersonnel Services Total Personnel 1,099,805$ 1,138,982$ 1,087,103$ 1,073,769$ 1,120,300$ -1.64% Ongoing* - 1,138,982 1,087,103 1,073,769 1,120,300 -1.64% One-time* - - - - - N/AProfessional/Contract 15,306 106,120 227,376 70,000 251,120 136.64%Operating Supplies 35,117 15,117 15,117 14,915 16,180 7.03%Repairs/Maintenance - 3,590 3,590 3,000 3,590 0.00%Communications/Transportation 3,551 9,641 9,641 36,060 9,070 -5.92%Other Charges/Services 10,606 8,913 8,913 8,315 8,913 0.00%Machinery/Equipment 23,778 - - - - N/ACapital Replacement 2,570 2,570 2,570 2,570 2,570 0.00%Total Cost Center - 3010 1,190,733$ 1,284,933$ 1,354,310$ 1,208,629$ 1,411,743$ 9.87%General Fund 1,190,733$ 1,284,933$ 1,354,310$ 1,208,629$ 1,411,743$ * Ongoing and One-time Personnel Services detail not available for 2015-16 Actual Expenditures.
Position Title2013-14 Revised
2014-15 Revised
2015-16 Revised
2016-17 Adopted
2016-17 Revised
2017-18 Adopted
Construction Project Coordinator 0 1 1 1 0 0Development Project Administrator 2 2 1 1 1 1Development Project Coordinator 1 1 1 1 1 1Engineer Assistant 1 1 0 0 0 0Management Assistant 0 1 1 1 1 1Public Works Inspector 0 0 1 1 2 2Regulatory Affairs Manager 1 1 1 1 1 1Senior Executive Assistant 1 0 0 0 0 0Senior Management Analyst 0 1 1 1 1 1Senior Management Assistant 1 0 0 0 0 0Transportation & Development Director 1 1 1 1 1 1Transportation Manager 1 1 1 1 1 1Total 9 10 9 9 9 9
447

City of Chandler 2017-18 Adopted Budget
Transportation & Development
Development Services reviews and issues permits for development projects, provides building and structural plan review, and provides building
inspection for subdivision and site development.
2017-18 Performance Measurements
Goal: To maintain public safety and quality of life standards through development plan review and onsite inspections. Supports Priority Based Budgeting Goal(s): Safe Community; Healthy and Attractive Community; Sustainable Economic Health Objectives: ♦ Review building plans for compliance with all applicable building codes, fire codes, and other regulatory
requirements and standards. ♦ Respond to all building construction inspection requests within the next business day. ♦ Provide prompt, courteous service to all customers requesting information or assistance.
Measures
2014-15 Actual
2015-16 Actual
2016-17
Projected
2016-17 Year End Estimate *
2017-18
Projected Number of permits issued / Value of permits issued(1)
5,237/ N/A
5,054/ N/A
3,500/ $725,000,000
4,000/ $1,300,0000,000
3,500/ $1,000,000,000
Percentage of building plans reviewed within 10 business days(2) 90% 95% 60% 80% 80% Percentage of building plans approved within one business day(3) N/A N/A 25% 35% 40% Percentage of inspection requests conducted next business day 100% 100% 100% 100% 100% (1) The decrease in number of permits issued starting in Fiscal Year (FY) 2016-17 is due to consolidation of permit types as a customer service
improvement. The value of permitted improvements is added effective FY 2016-17. (2) Revised measure effective FY 2016-17 to include all permit application types. Prior to FY 2016-17, the measure only included applications
for Residential Single Family Models, Residential Miscellaneous, Fire Sprinkler, and Alarm. Now that all permit application types are included, the majority are required to be completed within 20 business days. However, most reviews are completed significantly earlier than the due date. The lower percentage projected for FY 2016-17 is reflective of the mix of building plan reviews required within 10 and 20 days.
(3) New measure effective FY 2016-17. * 2016-17 Year End Estimate reflects “six months actual” and “six months estimated.” Note: All measurements are through June 30th, the last day of the fiscal year.
Division: Development Services Cost Center: 1530
448

City of Chandler 2017-18 Adopted Budget
Transportation & Development
Development Services – 1530
Budget Summary
Authorized Positions
Significant Budget and Staffing Changes
There are no significant budget and staffing changes for Fiscal Year 2017-18.
Description
2015-16 Actual
Expenditures
2016-17 Adopted Budget
2016-17 Adjusted Budget
2016-17 Estimated
Expenditures
2017-18 Adopted Budget
% Change Adopted to
AdoptedPersonnel Services Total Personnel 3,269,522$ 3,293,904$ 3,319,378$ 3,338,900$ 3,277,105$ -0.51% Ongoing* - 3,293,904 3,319,378 3,338,900 3,277,105 -0.51% One-time* - - - - - N/AProfessional/Contract 29,969 26,840 37,054 95,346 26,840 0.00%Operating Supplies 50,019 92,223 95,400 52,788 89,483 -2.97%Repairs/Maintenance 1,149 18,367 14,267 3,000 14,267 -22.32%Communications/Transportation 17,436 19,383 19,383 19,253 19,551 0.87%Insurance/Taxes - 3,000 3,000 300 3,000 0.00%Other Charges/Services 8,892 24,500 24,500 11,604 25,500 4.08%Machinery/Equipment - 19,636 19,636 21,312 - -100.00%Capital Replacement 27,915 30,002 30,002 30,002 30,002 0.00%Total Cost Center - 1530 3,404,903$ 3,527,855$ 3,562,620$ 3,572,505$ 3,485,748$ -1.19%General Fund 3,404,903$ 3,527,855$ 3,562,620$ 3,572,505$ 3,485,748$ * Ongoing and One-time Personnel Services detail not available for 2015-16 Actual Expenditures.
Position Title2013-14 Revised
2014-15 Revised
2015-16 Revised
2016-17 Adopted
2016-17 Revised
2017-18 Adopted
Administrative Specialist 1 0 0 0 0 0Building Inspector 10 11 11 11 11 11Building Official 1 1 1 1 1 1Chief Building Inspector 1 1 1 1 1 1Construction Permit Representative 7 7 7 7 7 7Customer Service Representative 0 1 1 1 1 1Customer Service Supervisor 1 1 1 1 1 1Development Project Administrator 2 2 2 2 2 2Development Services Engineer 1 0 0 0 0 0Executive Assistant 1 0 0 0 0 0Management Analyst 0 1 1 1 1 1Management Assistant 1 0 0 0 0 0Plan Review Manager 0 1 1 1 1 1Plans Examiner 1 1 1 1 1 1Principal Engineer 1 0 0 0 0 0Principal Plans Examiner 1 0 0 0 0 0Senior Administrative Assistant 0 1 0 0 0 0Senior Building Inspector 2 2 2 2 2 2Senior Plans Examiner 6 2 2 2 2 2Structural Engineer 1 1 1 1 1 1Total 38 33 32 32 32 32
449

City of Chandler 2017-18 Adopted Budget
Transportation & Development
Engineering is responsible for assuring compliance with City standard details and specifications, code requirements for public and private development through
the civil plan review process, civil engineering, and traffic design review. Civil engineering reviews civil plans and issues encroachment permits for development projects. Traffic design review analyzes specific development proposals for compliance with adopted standards and performs traffic impact analysis studies to evaluate a development’s impact on our transportation system. The division is also responsible for maintaining engineering records on all City infrastructure and assuring that it is accurately presented in the City’s Geographical Information System (GIS).
2017-18 Performance Measurements
Goal: Provide quality customer service for requests for information, maps, and presentation materials by achieving 98% or better response rate. Supports Priority Based Budgeting Goal(s): Effective Transportation; Healthy and Attractive Community; Sustainable Economic Health Objective: ♦ Assure compliance with City standards and code requirements while responding to City and citizen requests.
Measures
2014-15 Actual
2015-16 Actual
2016-17
Projected
2016-17 Year End Estimate *
2017-18
Projected Number of requests for maps/presentation materials / Percentage provided by Mapping Services Staff
451/ 100%
476/ 100%
500/ 100%
500/ 100%
500/ 100%
Number of requests for data/information / Percentage provided by Mapping Services Staff within 14 days or less
7,663/ 100%
7,520/ 100%
7,300/ 100%
7,500/ 100%
7,500/ 100%
Goal: To promote public safety, sustainability, and maintainability of the City’s infrastructure through the development plan review process. Supports Priority Based Budgeting Goal(s): Effective Transportation Objectives: ♦ Review civil plans for compliance with all applicable subdivision codes and other regulatory requirements and
standards.
Measures
2014-15 Actual
2015-16 Actual
2016-17
Projected
2016-17 Year End Estimate *
2017-18
Projected Average number of reviews per project 3.3 3.4 3.0 3.4 3.3
Number of drawing sheets reviewed 1,859(1) 1,306 1,600(1) 1,600(1) 1,300 Percentage of non-exempt plan review projects completed within the statutory overall time frame 100% 100% 100% 100% 100%
(1) Amount reflects higher than anticipated private development projects. * 2016-17 Year End Estimate reflects “six months actual” and “six months estimated.” Note: All measurements are through June 30th, the last day of the fiscal year.
Division: Engineering Cost Center: 3020
450

City of Chandler 2017-18 Adopted Budget
Transportation & Development
Engineering – 3020
Budget Summary
Authorized Positions
Significant Budget and Staffing Changes
During Fiscal Year (FY) 2016-17, one Records Management Associate position was reclassified to Engineering Records Specialist.
Description
2015-16 Actual
Expenditures
2016-17 Adopted Budget
2016-17 Adjusted Budget
2016-17 Estimated
Expenditures
2017-18 Adopted Budget
% Change Adopted to
AdoptedPersonnel Services Total Personnel 2,074,617$ 2,119,523$ 2,149,058$ 2,103,558$ 2,141,350$ 1.03% Ongoing* - 2,119,523 2,149,058 2,103,558 2,141,350 1.03% One-time* - - - - - N/AProfessional/Contract - 7,267 - - - -100.00%Operating Supplies 10,152 30,979 32,479 26,969 19,735 -36.30%Repairs/Maintenance 814 8,700 8,700 4,100 8,700 0.00%Communications/Transportation 12,275 15,621 15,621 11,610 15,705 0.54%Insurance/Taxes 1,000 300 300 2,000 300 0.00%Other Charges/Services 5,136 4,175 4,175 3,300 4,175 0.00%Machinery/Equipment 1,239 - - - - N/AOffice Furniture/Equipment 209 - - - - N/ACapital Replacement 4,330 4,330 4,330 4,330 4,330 0.00%Total Cost Center - 3020 2,109,772$ 2,190,895$ 2,214,663$ 2,155,867$ 2,194,295$ 0.16%General Fund 2,109,772$ 2,190,895$ 2,214,663$ 2,155,867$ 2,194,295$ * Ongoing and One-time Personnel Services detail not available for 2015-16 Actual Expenditures.
Position Title2013-14 Revised
2014-15 Revised
2015-16 Revised
2016-17 Adopted
2016-17 Revised
2017-18 Adopted
City Engineer 1 1 1 1 1 1Development Project Administrator 0 0 1 1 1 1Engineer Assistant 0 0 1 1 1 1Engineering Records Specialist 0 0 0 0 1 1Engineering Technician 1 1 1 1 1 1GIS Manager 0 0 1 1 1 1GIS Technician I 1 1 1 1 1 1GIS Technician II 4 4 4 4 4 4Plan Review Manager 0 1 1 1 1 1Principal Engineer 1 1 1 1 1 1Principal Plans Examiner 0 1 1 1 1 1Records Management Associate 1 1 1 1 0 0Senior Administrative Assistant 0 0 1 1 1 1Senior Plans Examiner 0 4 4 4 4 4Total 9 15 19 19 19 19
451
City of Chandler 2017-18 Adopted Budget
Transportation & Development
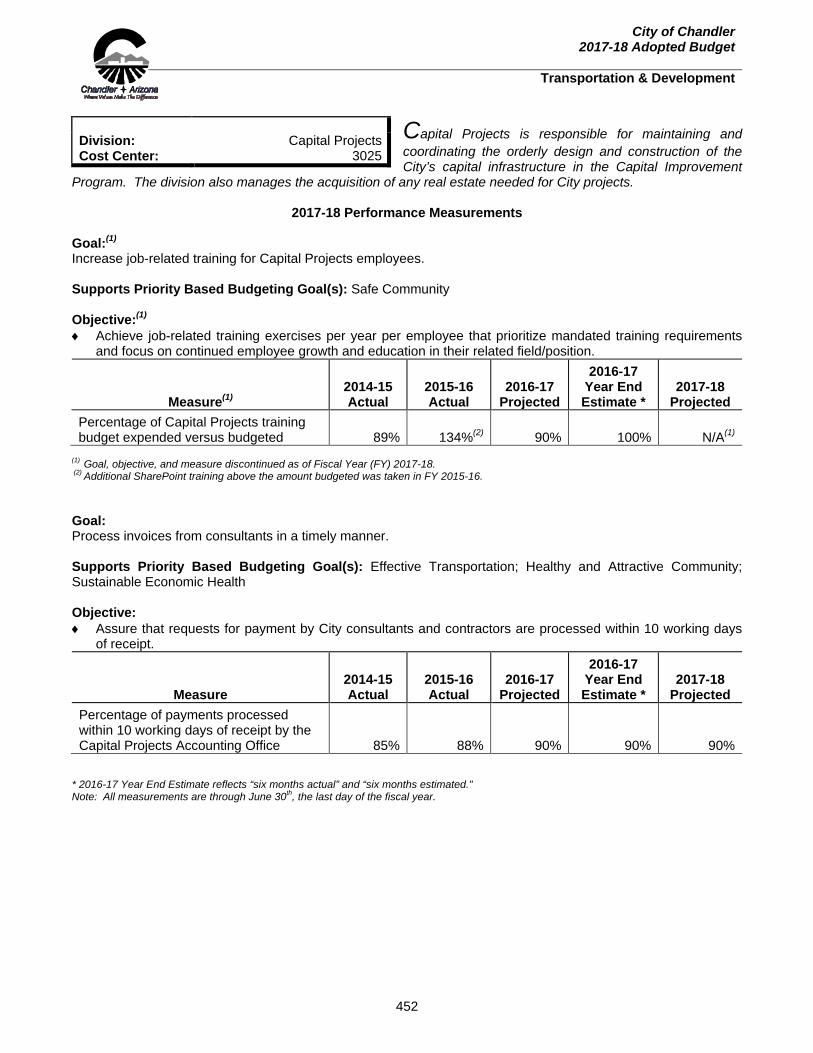
Capital Projects is responsible for maintaining and coordinating the orderly design and construction of the City’s capital infrastructure in the Capital Improvement
Program. The division also manages the acquisition of any real estate needed for City projects.
2017-18 Performance Measurements Goal:(1)
Increase job-related training for Capital Projects employees. Supports Priority Based Budgeting Goal(s): Safe Community Objective:(1) ♦ Achieve job-related training exercises per year per employee that prioritize mandated training requirements
and focus on continued employee growth and education in their related field/position.
Measure(1)
2014-15 Actual
2015-16 Actual
2016-17
Projected
2016-17 Year End Estimate *
2017-18
Projected Percentage of Capital Projects training budget expended versus budgeted 89% 134%(2) 90% 100% N/A(1)
(1) Goal, objective, and measure discontinued as of Fiscal Year (FY) 2017-18. (2) Additional SharePoint training above the amount budgeted was taken in FY 2015-16. Goal: Process invoices from consultants in a timely manner. Supports Priority Based Budgeting Goal(s): Effective Transportation; Healthy and Attractive Community; Sustainable Economic Health Objective: ♦ Assure that requests for payment by City consultants and contractors are processed within 10 working days
of receipt.
Measure
2014-15 Actual
2015-16 Actual
2016-17
Projected
2016-17 Year End Estimate *
2017-18
Projected Percentage of payments processed within 10 working days of receipt by the Capital Projects Accounting Office 85% 88% 90% 90% 90%
* 2016-17 Year End Estimate reflects “six months actual” and “six months estimated.” Note: All measurements are through June 30th, the last day of the fiscal year.
Division: Capital Projects Cost Center: 3025
452

City of Chandler 2017-18 Adopted Budget
Transportation & Development
Capital Projects – 3025 Goal: Limit increases in construction costs of existing projects. Supports Priority Based Budgeting Goal(s): Effective Transportation; Healthy and Attractive Community; Sustainable Economic Health Objective: ♦ Assure cost increases on construction projects are within established limits of the original cost estimates
through performance of design review on construction drawings prior to the bid process.
Measure
2014-15 Actual
2015-16 Actual
2016-17
Projected
2016-17 Year End Estimate *
2017-18
Projected Percentage of aggregate project change orders limited to no more than 5% of original contract amount -19%(1) -27%(1) 5% -5%(1) 5%
(1) Negative percentages due to projects with close-outs under the award amount due to value engineering resulting in reduced costs and
scope reductions. Goal: To provide efficient and effective services to the residents of Chandler through administration, general direction, and coordination of Real Estate Services. Supports Priority Based Budgeting Goal(s): Effective Transportation Objective: ♦ Respond to requests for information, assistance, and direction in a timely manner and keep citizens informed
of Real Estate projects and activities that affect them.
Measures
2014-15 Actual
2015-16 Actual
2016-17
Projected
2016-17 Year End Estimate *
2017-18
Projected Number of requests for real estate services (including telephone, in-person and multiple parcel job requests) / Percentage responded to within 5 days(2)
1,100/ 95%
565/ 95%
450/ 96%
525/ 95%
510/ 95%
(2) The decline in requests starting in Fiscal Year 2015-16 results from reduced telephone requests due to a larger number of multi-property
roadway projects (i.e., one request is submitted for a single project encompassing multiple properties). * 2016-17 Year End Estimate reflects “six months actual” and “six months estimated.” Note: All measurements are through June 30th, the last day of the fiscal year.
453

City of Chandler 2017-18 Adopted Budget
Transportation & Development
Capital Projects – 3025 Goal: Reduce the cost of property/land rights acquisition and maintenance for taxpayers of Chandler. Supports Priority Based Budgeting Goal(s): Effective Transportation Objective:
♦ Pursue and manage capital improvement project property and land rights acquisition for no or low cost to the City.
Measures
2014-15 Actual
2015-16 Actual
2016-17
Projected
2016-17 Year End Estimate *
2017-18
Projected Cost savings based on verification of City property rights, dedications of property, and land rights by real estate staff rather than by use of consultants $0(1) $0(1) $0(2) $170,121 $0(2) Value of capital improvement project right-of-way acquisitions $5,500,000 $1,176,187(3) $2,250,161 $1,115,000 $2,800,000
(1) No property dedications reported, therefore, no cost savings on purchasing right-of-way for City projects. (2) No anticipated dedications based on scheduled roadway improvement projects. (3) In Fiscal Year (FY) 2015-16, there is additional land sale activity not related to the amounts reported above for capital improvement projects
of $744,000 in right-of-way acquisitions and $8,276,560 for the sale of 29.9 acres of City-owned land. Goal:(4)
Maintain public safety and quality of life standards through offsite inspections of class 8 (street excavation) encroachment permits for development and capital improvement projects. Supports Priority Based Budgeting Goal(s): Effective Transportation; Healthy and Attractive Community; Sustainable Economic Health Objective:(4)
♦ Perform offsite inspections of development and capital improvement projects and close completed permits in a timely and efficient manner.
Measure(4)
2014-15 Actual
2015-16 Actual
2016-17
Projected
2016-17 Year End Estimate *
2017-18
Projected Number of hours performing development and capital improvement project (CIP) inspections / Value of class 8 encroachment permits N/A(4) N/A(4)
10,129/ $220,000
10,129/ $220,000
10,300/ $300,000
Number of class 8 encroachment permits pulled for development projects / Number of class 8 encroachment permits closed for development projects N/A(4) N/A(4)
165/ 30
165/ 30
180/ 60
Number of class 8 encroachment permits pulled for CIP projects / Number of class 8 encroachment permits closed for CIP projects N/A(4) N/A(4)
35/ 10
35/ 10
35/ 25
(4) New goal, objective, and measures effective FY 2017-18; measurements not available prior to FY 2016-17. * 2016-17 Year End Estimate reflects “six months actual” and “six months estimated.” Note: All measurements are through June 30th, the last day of the fiscal year.
454
City of Chandler 2017-18 Adopted Budget
Transportation & Development
Capital Projects – 3025
Budget Summary
Description
2015-16 Actual
Expenditures
2016-17 Adopted Budget
2016-17 Adjusted Budget
2016-17 Estimated
Expenditures
2017-18 Adopted Budget
% Change Adopted to
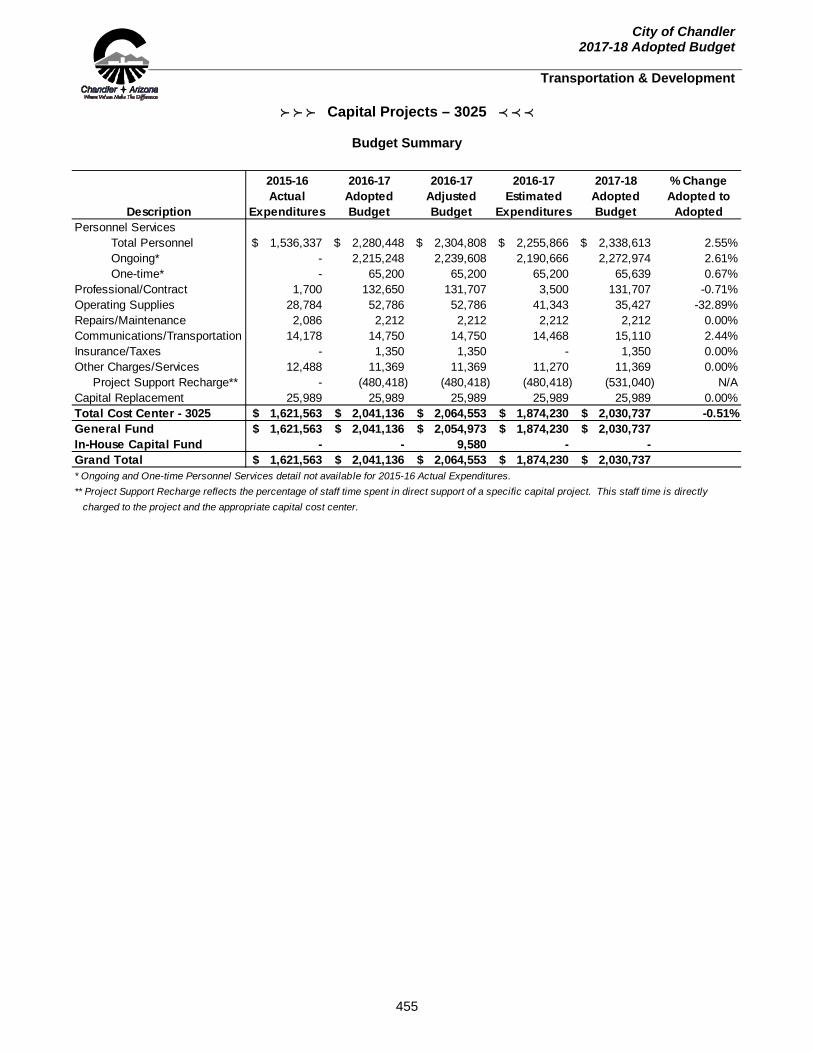
AdoptedPersonnel Services Total Personnel 1,536,337$ 2,280,448$ 2,304,808$ 2,255,866$ 2,338,613$ 2.55% Ongoing* - 2,215,248 2,239,608 2,190,666 2,272,974 2.61% One-time* - 65,200 65,200 65,200 65,639 0.67%Professional/Contract 1,700 132,650 131,707 3,500 131,707 -0.71%Operating Supplies 28,784 52,786 52,786 41,343 35,427 -32.89%Repairs/Maintenance 2,086 2,212 2,212 2,212 2,212 0.00%Communications/Transportation 14,178 14,750 14,750 14,468 15,110 2.44%Insurance/Taxes - 1,350 1,350 - 1,350 0.00%Other Charges/Services 12,488 11,369 11,369 11,270 11,369 0.00% Project Support Recharge** - (480,418) (480,418) (480,418) (531,040) N/ACapital Replacement 25,989 25,989 25,989 25,989 25,989 0.00%Total Cost Center - 3025 1,621,563$ 2,041,136$ 2,064,553$ 1,874,230$ 2,030,737$ -0.51%General Fund 1,621,563$ 2,041,136$ 2,054,973$ 1,874,230$ 2,030,737$ In-House Capital Fund - - 9,580 - - Grand Total 1,621,563$ 2,041,136$ 2,064,553$ 1,874,230$ 2,030,737$ * Ongoing and One-time Personnel Services detail not available for 2015-16 Actual Expenditures.** Project Support Recharge reflects the percentage of staff time spent in direct support of a specific capital project. This staff time is directly charged to the project and the appropriate capital cost center.
455

City of Chandler 2017-18 Adopted Budget
Transportation & Development
Capital Projects – 3025
Authorized Positions
Significant Budget and Staffing Changes
During Fiscal Year (FY) 2016-17, one Engineering Project Manager position was reclassified to Engineer. FY 2017-18 reflects a one-time funding increase for a temporary capital projects support analyst, as well as ongoing funding increases for computer monitors and software.
Position Title2013-14 Revised
2014-15 Revised
2015-16 Revised
2016-17 Adopted
2016-17 Revised
2017-18 Adopted
Administrative Specialist 2 0 0 0 0 0Capital Projects Manager 1 1 1 1 1 1Capital Projects Supervisor 0 0 1 1 1 1Construction Project Coordinator 1 0 0 0 0 0Contract Compliance Specialist 0 0 1 1 1 1Contract Services Representative 1 1 1 1 1 1Engineer 2 2 2 2 3 3Engineering Project Manager 2 2 2 2 1 1Project Analyst 1 1 1 1 1 1Project Support Assistant 0 2 1 1 1 1Public Works Inspector 6 6 6 6 6 6Real Estate Coordinator 2 2 0 0 0 0Real Estate Manager 0 0 1 1 1 1Real Estate Specialist 0 0 1 1 1 1Senior Engineer 1 1 1 1 1 1Site Development Inspector 1 0 0 0 0 0Traffic Engineering Inspector 1 1 1 1 1 1Total 21 19 20 20 20 20
456

City of Chandler 2017-18 Adopted Budget
Transportation & Development
Streets provides for the care, repair, and maintenance of all City-owned streets (2,073 lane miles), alleys (129 miles), curbs, gutters, sidewalks (1,684 miles), drainage
structures (which include catch basins, scuppers, and retention basins), and rights-of-way maintenance.
2017-18 Performance Measurements Goal: Minimize citizen complaints and requests for maintenance by providing for a safe and well-maintained street, sidewalk, and curb/gutter system. Supports Priority Based Budgeting Goal(s): Effective Transportation; Healthy and Attractive Community; Safe Community Objective: ♦ Schedule mowing, weed cutting, and herbicide application of non-landscaped areas in a manner that will
maintain their appearance and limit citizen complaints. Maintain sidewalks, curbs, and gutters to minimize citizen requests for maintenance.
Measures
2014-15 Actual
2015-16 Actual
2016-17
Projected
2016-17 Year End Estimate *
2017-18
Projected Number of complaints on non-landscaped areas and rights of way 4 1 3 2 2 Number of sidewalk maintenance requests 100 84 110 82 86 Number of curb/gutter maintenance requests 26 24 28 20 21 Number of street repairs / Pothole repair requests
80/ 181
72/ 86(1)
90/ 160
72/ 90(1)
70/ 90(1)
(1) A pothole program was instituted in Fiscal Year 2015-16 for the proactive repair of potholes. Goal: Respond to citizen service requests for street, sidewalk, curb, and gutter repairs and maintenance in a timely manner. Supports Priority Based Budgeting Goal(s): Effective Transportation; Healthy and Attractive Community; Safe Community Objective: ♦ Complete maintenance work orders (wo’s) for streets, sidewalks, curbs, and gutters within:
♦ 2 days for potholes ♦ 3 days for safety repairs
♦ 15 days for Americans with Disabilities Act (ADA) related requests
♦ 18 days for street repairs ♦ 30 days for sidewalk, curb, and
gutter repairs
Measures
2014-15 Actual
2015-16 Actual
2016-17
Projected
2016-17 Year End Estimate *
2017-18
Projected Number of days to respond to citizen service requests 2 2 2 2 2 Average number of days to complete wo’s for sidewalk / Curb & gutter repair
3/ 5
3/ 3
3/ 5
3/ 3
3/ 3
Average number days to complete wo’s for street repairs / Pothole repairs
14/ 2
12/ 2
12/ 2
11/ 2
11/ 2
* 2016-17 Year End Estimate reflects “six months actual” and “six months estimated.” Note: All measurements are through June 30th, the last day of the fiscal year.
Division: Streets Cost Center: 3300
457

City of Chandler 2017-18 Adopted Budget
Transportation & Development
Streets – 3300
Goal: Maintain alleys, asphalt roadways, sidewalks, curbs, gutters, scuppers, drains, and catch basins with necessary grading, repair, replacement, and cleaning.
Supports Priority Based Budgeting Goal(s): Effective Transportation; Healthy and Attractive Community; Safe Community
Objectives: ♦ Place asphalt, slurry, and crack seal as needed for road repair. ♦ Place concrete to repair damaged sidewalks, curbs, gutters, and drainage structures. ♦ Inspect and clean scuppers/drains/catch basins as needed. ♦ Grade and place asphalt millings for alley maintenance.
Measures
2014-15 Actual
2015-16 Actual
2016-17
Projected
2016-17 Year End Estimate *
2017-18
Projected Satisfactory Pavement
Lane miles of paved roadway 2,033 2,052 2,056 2,073 2,085 Lane miles of paved roadway in satisfactory condition / Percentage in satisfactory condition(1)
855/ 42%
887/ 43%
890/ 43%
907/ 44%
892/ 43%
Street Slurry Seal
Lane miles of paved roadway needing maintenance, fair condition 647 635 637 619 644 Lane miles of street maintenance performed / Percentage of street maintenance performed
99/ 15%
83/ 13%
61(2)/ 10%
62(2)/ 10%
87/ 14%
Street Repaving(3)
Lane miles of paved roadway needing repaving, poor condition 531 530 529 547 549 Lane miles of street repaving performed / Percentage of streets repaved
74/ 14%
76/ 14%
70/ 13%
72/ 13%
74/ 14%
Other Street Maintenance
Tons of asphalt placed for pavement repair 2,175 3,300 3,700 3,700 4,000 Lineal feet of crack sealing 3,243,319 4,699,206(4) 3,000,000 3,000,000 3,000,000 Square feet of concrete placed 46,960 52,800 48,000 49,600 50,000 Miles of unpaved alley graded / Miles of rehab alleys brushed
47/ 229
47/ 223
65/ 175
40/ 160
40/ 175
Number of scuppers, drains, catch basins, drywells inspected / Number maintained
5,491/ 1,031(5)
8,351/ 584(6)
9,000/ 350
8,300/ 855
8,300/ 850(6)
(1) As the street system ages, more streets will move from satisfactory condition to fair condition. (2) As street infrastructure ages, an increased number of lane miles need street sealing from the same amount of funding. The types of sealing
applications projected for Fiscal Year (FY) 2016-17 are more expensive, resulting in fewer lane miles maintained. (3) Street repaving includes street repaving, hot-in-place recycling, asphalt capping, and other major rehabilitation techniques. (4) More roads were in need of crack seal (a pre-seal on extensive cracks) prior to applying slurry seals. (5) Due to retirement and the training of a new Storm Water Program Specialist position, there was a seven-month period with diminished
abilities to conduct inspections. (6) The process for identifying structures requiring maintenance has been reviewed and revised to only include those structures that are
observed to hold standing water, be obstructed, or contain approximately 20% or more debris. Maintenance will be conducted on all structures associated with a complaint. Additionally, the vactor truck was out of service and sent back to the manufacturer for approximately three months in FY 2015-16; the FY 2017-18 projection reflects a normal level of activity under the new identification process. There will be fluctuations in maintenance based on inspection results. Rains, storms, and other factors can affect maintenance needs and vary year by year
* 2016-17 Year End Estimate reflects “six months actual” and “six months estimated.” Note: All measurements are through June 30th, the last day of the fiscal year.
458

City of Chandler 2017-18 Adopted Budget
Transportation & Development
Streets – 3300
Budget Summary
Description
2015-16 Actual
Expenditures
2016-17 Adopted Budget
2016-17 Adjusted Budget
2016-17 Estimated
Expenditures
2017-18 Adopted Budget
% Change Adopted to
AdoptedPersonnel Services Total Personnel 3,225,523$ 3,642,298$ 3,712,432$ 3,500,800$ 3,621,791$ -0.56% Ongoing* - 3,642,298 3,712,432 3,500,800 3,621,791 -0.56% One-time* - - - - - N/AProfessional/Contract 1,389,093 1,549,337 1,887,800 1,881,846 1,552,278 0.19%Operating Supplies 682,277 753,030 1,206,322 1,208,198 752,301 -0.10%Repairs/Maintenance 54,242 89,259 116,067 116,567 78,259 -12.32%Communications/Transportation 6,561 12,288 12,288 7,625 13,440 9.38%Insurance/Taxes 25,425 16,500 22,304 22,304 16,500 0.00%Rents/Utilities 662,496 767,210 785,706 785,706 805,063 4.93%Other Charges/Services 95,168 101,599 164,759 152,090 101,599 0.00%Contingencies/Reserves - 156,457 156,457 - 156,457 0.00%Machinery/Equipment 157,214 38,968 38,968 35,013 9,268 -76.22%Street Improvements 3,745,280 2,820,265 4,432,744 4,432,744 2,820,265 0.00%Capital Replacement 138,550 141,798 141,798 141,798 147,698 4.16%Total Cost Center - 3300 10,181,829$ 10,089,009$ 12,677,645$ 12,284,691$ 10,074,919$ -0.14%General Fund 6,236,457$ 5,589,258$ 7,230,057$ 7,115,156$ 5,541,284$ Highway User Revenue Fund 3,945,373 4,499,751 5,447,588 5,169,535 4,533,635 Grand Total 10,181,829$ 10,089,009$ 12,677,645$ 12,284,691$ 10,074,919$ * Ongoing and One-time Personnel Services detail not available for 2015-16 Actual Expenditures.
459

City of Chandler 2017-18 Adopted Budget
Transportation & Development
Streets – 3300
Authorized Positions
Significant Budget and Staffing Changes
During Fiscal Year (FY) 2016-17, twelve Senior Streets Specialist positions were renamed Senior Streets Specialist - CDL, three Street Maintenance Supervisor positions were renamed Street Maintenance Supervisor - CDL, three Street Maintenance Worker positions were renamed Street Maintenance Worker - CDL, five Streets Crew Leader positions were renamed Streets Crew Leader - CDL, and eight Streets Specialist positions were renamed Streets Specialist - CDL. FY 2017-18 reflects a one-time funding increase for the street maintenance program, as well as ongoing funding increases for new areas of responsibility for landscape maintenance and utilities (partially offset by a permanent transfer from cost center 3330, Traffic Engineering), and fuel, automotive supplies, and capital replacement for a new vehicle to tow a heated crack seal kettle trailer. FY 2017-18 reflects a small decrease in funding due to one-time funding received in FY 2016-17 for larger monitors and a new vehicle.
Position Title2013-14 Revised
2014-15 Revised
2015-16 Revised
2016-17 Adopted
2016-17 Revised
2017-18 Adopted
Administrative Assistant 0 1 1 1 1 1Administrative Specialist (0.5 FTE position) 0.5 0 0 0 0 0Administrative Specialist (1.0 FTE positions) 2 0 0 0 0 0Landscape Compliance Coordinator 1 1 0 0 0 0Landscape Maintenance & Design Coordinator 0 0 1 1 1 1Landscape Maintenance Technician 2 2 2 2 2 2Management Assistant 1 0 0 0 0 0Senior Administrative Assistant (0.5 FTE position) 0 0.5 0.5 0.5 0.5 0.5Senior Administrative Assistant (1.0 FTE position) 0 1 1 1 1 1Senior Management Analyst 0 1 1 1 1 1Senior Streets Maintenance Coordinator 1 1 0 0 0 0Senior Streets Specialist 10 10 10 12 0 0Senior Streets Specialist - CDL 0 0 0 0 12 12Storm Water Maintenance Coordinator 1 0 0 0 0 0Storm Water Programs Coordinator 1 1 1 1 1 1Storm Water Program Specialist 0 1 1 1 1 1Street Maintenance Coordinator 1 1 1 2 2 2Street Maintenance Supervisor 3 3 3 3 0 0Street Maintenance Supervisor - CDL 0 0 0 0 3 3Street Maintenance Worker 5 4 3 3 0 0Street Maintenance Worker - CDL 0 0 0 0 3 3Street Superintendent 1 1 1 1 1 1Streets Crew Leader 5 5 5 5 0 0Streets Crew Leader - CDL 0 0 0 0 5 5Streets Project Manager 0 0 1 1 1 1Streets Specialist 6 7 8 8 0 0Streets Specialist - CDL 0 0 0 0 8 8Total 40.5 40.5 40.5 43.5 43.5 43.5
460

City of Chandler 2017-18 Adopted Budget
Transportation & Development
Division: Streets Capital Cost Center: 3310
Capital Budget Summary
Significant Budget Changes
Significant budget variances for capital cost centers are primarily attributed to specific project completions related to the prior fiscal year and new projects for the new fiscal year. Fiscal Year (FY) 2017-18 incorporates the carryforward of unexpended program funding from FY 2016-17. Detail on the capital program is available in the 2018-2027 Capital Improvement Program.
Description
2015-16 Actual
Expenditures
2016-17 Adopted Budget
2016-17 Adjusted Budget
2016-17 Estimated
Expenditures
2017-18 Adopted Budget
% Change Adopted to
AdoptedPersonnel Services Total Personnel 297,850$ -$ -$ 209,650$ -$ N/A Ongoing* - - - 209,650 - N/A One-time* - - - - - N/AProfessional/Contract 484,284 1,995,965 4,710,047 214,743 1,352,150 -32.26%Operating Supplies 4,076 - - 6,932 - N/ACommunications/Transportation 1,323 - - 68 - N/AOther Charges/Services 104,185 349,702 895,120 103,673 89,330 -74.46% Project Support Recharge** 76,096 280,097 445,676 4,643 537,901 92.04%Contingencies/Reserves - 47,566,702 - - 54,214,902 13.98%Land/Improvements - 2,855,000 4,101,077 - 3,008,462 5.38%Building/Improvements 14,481 - - - 7,940,474 N/AMachinery/Equipment 595,492 138,000 725,750 - 679,143 392.13%Office Furniture/Equipment - - - - 1,068,857 N/AStreet Improvements 24,997,295 29,862,082 57,202,659 9,514,856 45,644,813 52.85%Park Improvements 47,740 - 1,468 - - N/ATotal Cost Center - 3310 26,622,822$ 83,047,548$ 68,081,797$ 10,054,565$ 114,536,032$ 37.92%Highway User Revenue Fund 3,830,662$ 5,648,684$ 2,994,961$ 302,613$ 6,942,348$ Local Transportation Assistance Fund 169,548 1,382,037 1,226,770 45,763 1,104,461 General Gov't Capital Projects Fund 10,504,671 32,518,484 24,837,249 3,413,856 32,059,012 Vehicle Replacement Fund 336,583 717 - - - HURF Revenue Bond Fund 175,321 - - - - Street GO Bond Fund 3,925,785 10,440,582 9,819,231 1,453,746 21,667,261 Storm/Sewer GO Bond Fund 144,629 348,336 331,299 25,266 606,033 Arterial Street Impact Fee Fund 1,739,541 13,862,079 11,558,620 866,204 29,055,685 Grant Capital Fund 5,796,083 18,846,629 17,313,667 3,947,117 23,101,232 Grand Total 26,622,822$ 83,047,548$ 68,081,797$ 10,054,565$ 114,536,032$ * Ongoing and One-time Personnel Services detail not available for 2015-16 Actual Expenditures.** Project Support Recharge reflects the percentage of staff time spent in direct support of a specific capital project. This staff time is directly charged to the project.
461

City of Chandler 2017-18 Adopted Budget
Transportation & Development
Traffic Engineering is responsible for the planning, design, installation, operation, and maintenance of the traffic control system and lighting for City streets. The
traffic control system is comprised of 218 traffic signals, 27,700 streetlights, and 20,968 traffic signs. This division is also responsible for street name and guide signs, pavement markings for crosswalks, lane lines, and railroad crossing signs.
2017-18 Performance Measurements Goal: Provide for the efficient and safe movement of people and goods within the City through the use of traffic engineering studies and technology for design, installation, maintenance, and operation of traffic control devices including signals, signs, pavement markings, and streetlights. Supports Priority Based Budgeting Goal(s): Effective Transportation; Safe Community Objective: ♦ Complete requests for traffic engineering studies within four weeks.
Measures
2014-15 Actual
2015-16 Actual
2016-17
Projected
2016-17 Year End Estimate *
2017-18
Projected Number of requests requiring traffic studies / Average time of completion in weeks
76/ 4
82/ 3
85/ 3
85/ 3
85/ 3
Goal: Provide proper inspection and maintenance of all traffic signals. Supports Priority Based Budgeting Goal(s): Effective Transportation; Safe Community Objective: ♦ Complete inspections and preventative maintenance of all traffic signals annually.
Measures
2014-15 Actual
2015-16 Actual
2016-17
Projected
2016-17 Year End Estimate *
2017-18
Projected Total number of signalized intersections / Percentage of signals inspected and maintained
217/ 100%
218/ 100%
218/ 100%
218/ 100%
219/ 100%
* 2016-17 Year End Estimate reflects “six months actual” and “six months estimated.” Note: All measurements are through June 30th, the last day of the fiscal year.
Division: Traffic Engineering Cost Center: 3330
462

City of Chandler 2017-18 Adopted Budget
Transportation & Development
Traffic Engineering – 3330 Goal: To maintain street markings and traffic signs within the City in accordance with federal and state standards. Supports Priority Based Budgeting Goal(s): Effective Transportation; Safe Community Objectives:
♦ Install and/or maintain traffic signs. ♦ Repaint 100% of road markings annually.
Measures
2014-15 Actual
2015-16 Actual
2016-17
Projected
2016-17 Year End Estimate *
2017-18
Projected Number of signs installed or maintained to standards 1,500 1,289(1) 2,500 1,500(1) 1,700
Number of centerline-miles of striping inventory / Percentage repainted
275/ 50%(2)
275/ 75%(2)
275/ 75%(2)
275/ 90%(3)
275/ 100%
(1) Staff shortages resulted in a reduced number of regular traffic sign replacements. (2) Fell short of the objective of repainting 100% of all road markings annually due to a combination of staff shortages and equipment problems. (3) New striping machine operational as of December 2016. Goal: To keep the streetlight system operating effectively and efficiently. Supports Priority Based Budgeting Goal(s): Effective Transportation; Safe Community Objective: ♦ Repair (or initiate underground repair) of streetlights within five working days.
Measures
2014-15 Actual
2015-16 Actual
2016-17
Projected
2016-17 Year End Estimate *
2017-18
Projected Number of streetlight repairs / Percentage exceeding five work days
3,915/ 2%
3,282/ 2%
4,500/ 2%
3,274/ 2%
3,500/ 2%
* 2016-17 Year End Estimate reflects “six months actual” and “six months estimated.” Note: All measurements are through June 30th, the last day of the fiscal year.
463

City of Chandler 2017-18 Adopted Budget
Transportation & Development
Traffic Engineering – 3330
Budget Summary
Description
2015-16 Actual
Expenditures
2016-17 Adopted Budget
2016-17 Adjusted Budget
2016-17 Estimated
Expenditures
2017-18 Adopted Budget
% Change Adopted to
AdoptedPersonnel Services Total Personnel 2,536,771$ 2,478,110$ 2,527,495$ 2,423,291$ 2,530,174$ 2.10% Ongoing* - 2,478,110 2,527,495 2,423,291 2,530,174 2.10% One-time* - - - - - N/AProfessional/Contract 58,993 65,292 74,275 74,276 65,292 0.00%Operating Supplies 601,690 708,041 724,784 676,719 707,571 -0.07%Repairs/Maintenance 5,707 5,450 6,134 5,424 5,450 0.00%Communications/Transportation 3,946 9,376 9,376 7,899 9,388 0.13%Insurance/Taxes 8,500 8,500 9,500 9,500 8,500 0.00%Rents/Utilities 3,056,519 3,184,191 3,177,359 3,247,291 3,159,488 -0.78%Other Charges/Services 13,169 17,320 20,513 21,312 17,320 0.00%Contingencies/Reserves - 55,060 55,060 - 48,228 -12.41%Machinery/Equipment 55,710 35,000 38,414 41,537 175,000 400.00%Office Furniture/Equipment 1,232 - - - - N/ACapital Replacement 130,629 130,629 130,629 130,629 130,629 0.00%Total Cost Center - 3330 6,472,866$ 6,696,969$ 6,773,539$ 6,637,878$ 6,857,040$ 2.39%General Fund 2,172,892$ 2,395,361$ 2,407,302$ 2,197,379$ 2,526,367$ Highway User Revenue Fund 4,299,973 4,301,608 4,366,237 4,440,499 4,330,673 Grand Total 6,472,866$ 6,696,969$ 6,773,539$ 6,637,878$ 6,857,040$ * Ongoing and One-time Personnel Services detail not available for 2015-16 Actual Expenditures.
464
City of Chandler 2017-18 Adopted Budget
Transportation & Development
Traffic Engineering – 3330
Authorized Positions
Significant Budget and Staffing Changes
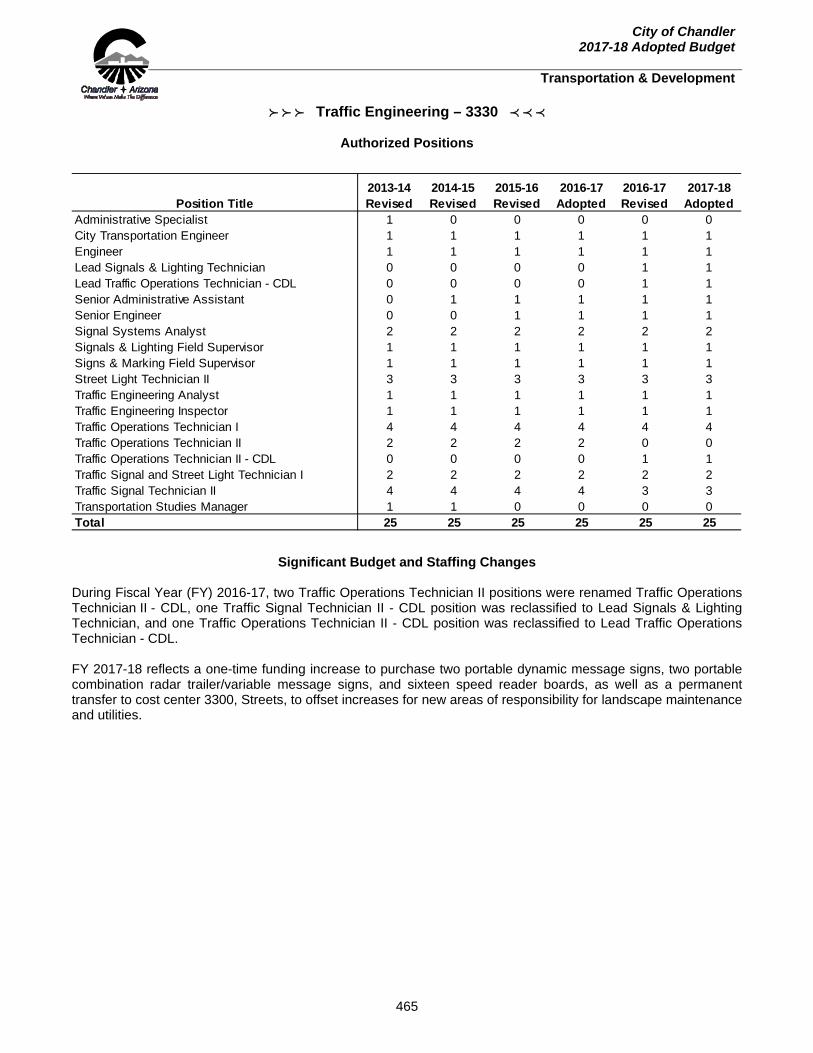
During Fiscal Year (FY) 2016-17, two Traffic Operations Technician II positions were renamed Traffic Operations Technician II - CDL, one Traffic Signal Technician II - CDL position was reclassified to Lead Signals & Lighting Technician, and one Traffic Operations Technician II - CDL position was reclassified to Lead Traffic Operations Technician - CDL. FY 2017-18 reflects a one-time funding increase to purchase two portable dynamic message signs, two portable combination radar trailer/variable message signs, and sixteen speed reader boards, as well as a permanent transfer to cost center 3300, Streets, to offset increases for new areas of responsibility for landscape maintenance and utilities.
Position Title2013-14 Revised
2014-15 Revised
2015-16 Revised
2016-17 Adopted
2016-17 Revised
2017-18 Adopted
Administrative Specialist 1 0 0 0 0 0City Transportation Engineer 1 1 1 1 1 1Engineer 1 1 1 1 1 1Lead Signals & Lighting Technician 0 0 0 0 1 1Lead Traffic Operations Technician - CDL 0 0 0 0 1 1Senior Administrative Assistant 0 1 1 1 1 1Senior Engineer 0 0 1 1 1 1Signal Systems Analyst 2 2 2 2 2 2Signals & Lighting Field Supervisor 1 1 1 1 1 1Signs & Marking Field Supervisor 1 1 1 1 1 1Street Light Technician II 3 3 3 3 3 3Traffic Engineering Analyst 1 1 1 1 1 1Traffic Engineering Inspector 1 1 1 1 1 1Traffic Operations Technician I 4 4 4 4 4 4Traffic Operations Technician II 2 2 2 2 0 0Traffic Operations Technician II - CDL 0 0 0 0 1 1Traffic Signal and Street Light Technician I 2 2 2 2 2 2Traffic Signal Technician II 4 4 4 4 3 3Transportation Studies Manager 1 1 0 0 0 0Total 25 25 25 25 25 25
465

City of Chandler 2017-18 Adopted Budget
Transportation & Development
Transit Services is responsible for formulating policies, design standards, and plans for the City's mass transit services, bicycling, and pedestrian
facilities. Transit Services coordinates and manages all transit service contracts and plans, oversees construction of transit and bicycle facilities, and ensures compliance with the Maricopa County Trip Reduction Ordinance.
2017-18 Performance Measurements
Goal: Provide technical guidance and recommendations on planning, design, programming, implementation, and operation of all modes of intra-city and inter-city transit services. Supports Priority Based Budgeting Goal(s): Effective Transportation; Safe Community Objectives: ♦ Provide transit service in partnership with the Regional Public Transit Authority (RPTA). Identify and
implement service improvements using available funds, including Public Transit Funds (PTF). Plan, design, and construct improvements to arterial street bus stops and identify other facility improvements needed to support public transportation.
♦ Provide Dial-a-Ride (DAR) service in partnership with the Cities of Mesa, Tempe, Scottsdale, the Town of Gilbert, and the RPTA.
Measures
2014-15 Actual
2015-16 Actual
2016-17
Projected
2016-17 Year End Estimate *
2017-18
Projected City funded bus service miles 64,539 81,581(1) 84,000(2) 87,000(2) 210,770(3) City funded passenger boardings 67,766 77,761(1) 85,600(2) 73,700(4) 177,000(3) City funded cost per boarding $3.54 $4.18(5) $4.84(6) $5.09(4) $6.34(3) PTF funded bus service miles 931,765 943,724 922,000 957,350 976,750 PTF service passenger boardings 978,353 911,569 922,000 806,870(4) 820,460 PTF cost per boarding $3.71 $4.54(5) $5.60(6) $5.56(4) $6.25(3)
Average passenger boardings per mile (all service) 1.05 0.96 1.02 0.84 0.84 DAR revenue miles 455,452 557,742 555,000(7) 634,328(7) N/A(8) DAR total trips 50,616 55,463 60,000(7) 56,676(7) 66,378(7) DAR PTF funded cost per trip $29.01 $28.53 $29.55 $32.95 $34.60 DAR City funded cost per trip $11.70 $21.88 $26.00(9) $31.65(9) $34.60(9)
(1) Mileage and boarding increased based on a full year for Route 96 in Fiscal Year (FY) 2015-16; FY 2014-15 based on nine months. (2) Mileage and boarding increase based on a full year for Route 542 in FY 2016-17. (3) Ray Road will add weekday and weekend service in FY 2017-18, resulting in anticipated higher cost per boarding due to lower boardings
on this new route in the beginning until it becomes an established route. (4) Boardings began declining in FY 2016-17 throughout the region, resulting in a higher cost per mile. (5) Higher costs due to Valley Metro mileage cost increase. (6) FY 2016-17 is expected to increase due to service cost increases and blended rates. (7) Demand and costs anticipated to increase with the change of no transfers required for Americans with Disabilities Act (ADA) trips when
traveling outside of Chandler. (8) Effective FY 2017-18 the City will no longer pay mileage; costs will be based per trip. (9) The City has historically paid for Non ADA trips, which are less expensive than ADA trips, however, with the increased demand for ADA
trips City funds are needed to cover the costs of ADA trips that are more than the allocated PTF funds. One-time funding has been received for FY 2017-18 to address this need.
* 2016-17 Year End Estimate reflects “five” months actual” and “seven months estimated.” Note: All measurements are through June 30th, the last day of the fiscal year.
Division: Transit Services Cost Center: 3340
466
City of Chandler 2017-18 Adopted Budget
Transportation & Development
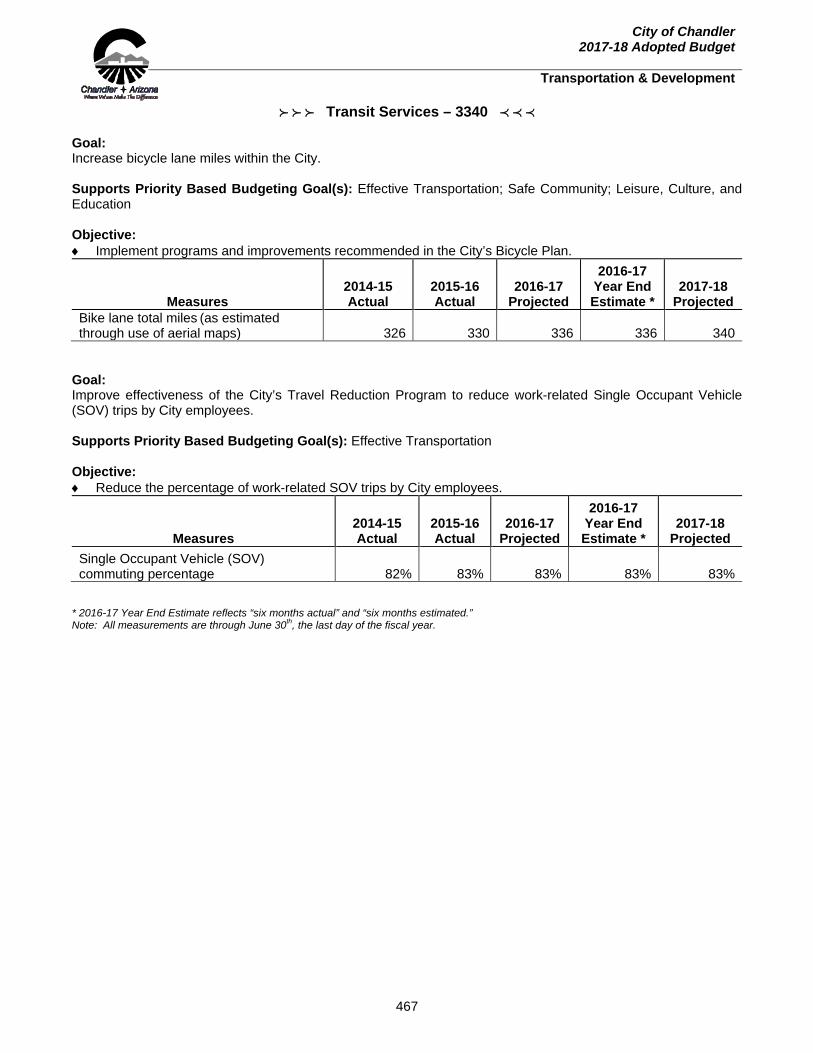
Transit Services – 3340 Goal: Increase bicycle lane miles within the City. Supports Priority Based Budgeting Goal(s): Effective Transportation; Safe Community; Leisure, Culture, and Education Objective: ♦ Implement programs and improvements recommended in the City’s Bicycle Plan.
Measures
2014-15 Actual
2015-16 Actual
2016-17
Projected
2016-17 Year End Estimate *
2017-18
Projected Bike lane total miles (as estimated through use of aerial maps) 326 330 336 336 340
Goal: Improve effectiveness of the City’s Travel Reduction Program to reduce work-related Single Occupant Vehicle (SOV) trips by City employees. Supports Priority Based Budgeting Goal(s): Effective Transportation Objective: ♦ Reduce the percentage of work-related SOV trips by City employees.
Measures
2014-15 Actual
2015-16 Actual
2016-17
Projected
2016-17 Year End Estimate *
2017-18
Projected Single Occupant Vehicle (SOV) commuting percentage 82% 83% 83% 83% 83%
* 2016-17 Year End Estimate reflects “six months actual” and “six months estimated.” Note: All measurements are through June 30th, the last day of the fiscal year.
467
City of Chandler 2017-18 Adopted Budget
Transportation & Development
Transit Services – 3340
Budget Summary
Authorized Positions
Significant Budget and Staffing Changes
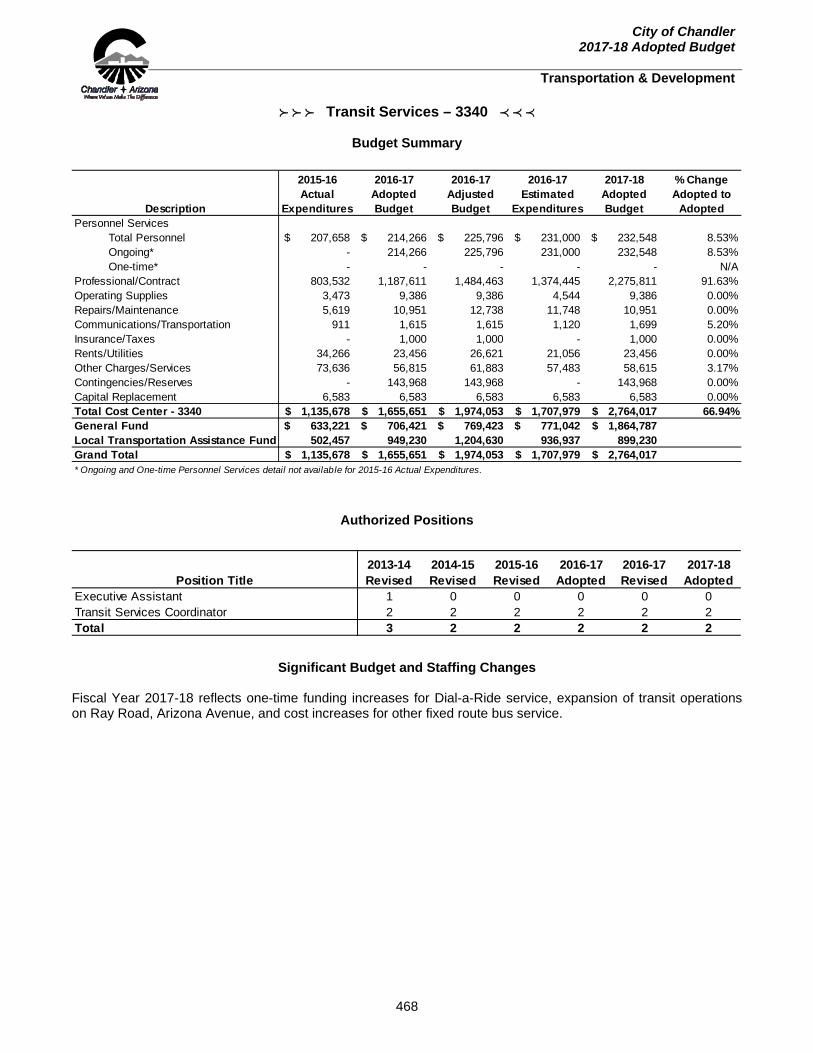
Fiscal Year 2017-18 reflects one-time funding increases for Dial-a-Ride service, expansion of transit operations on Ray Road, Arizona Avenue, and cost increases for other fixed route bus service.
Description
2015-16 Actual
Expenditures
2016-17 Adopted Budget
2016-17 Adjusted Budget
2016-17 Estimated
Expenditures
2017-18 Adopted Budget
% Change Adopted to
AdoptedPersonnel Services Total Personnel 207,658$ 214,266$ 225,796$ 231,000$ 232,548$ 8.53% Ongoing* - 214,266 225,796 231,000 232,548 8.53% One-time* - - - - - N/AProfessional/Contract 803,532 1,187,611 1,484,463 1,374,445 2,275,811 91.63%Operating Supplies 3,473 9,386 9,386 4,544 9,386 0.00%Repairs/Maintenance 5,619 10,951 12,738 11,748 10,951 0.00%Communications/Transportation 911 1,615 1,615 1,120 1,699 5.20%Insurance/Taxes - 1,000 1,000 - 1,000 0.00%Rents/Utilities 34,266 23,456 26,621 21,056 23,456 0.00%Other Charges/Services 73,636 56,815 61,883 57,483 58,615 3.17%Contingencies/Reserves - 143,968 143,968 - 143,968 0.00%Capital Replacement 6,583 6,583 6,583 6,583 6,583 0.00%Total Cost Center - 3340 1,135,678$ 1,655,651$ 1,974,053$ 1,707,979$ 2,764,017$ 66.94%General Fund 633,221$ 706,421$ 769,423$ 771,042$ 1,864,787$ Local Transportation Assistance Fund 502,457 949,230 1,204,630 936,937 899,230 Grand Total 1,135,678$ 1,655,651$ 1,974,053$ 1,707,979$ 2,764,017$ * Ongoing and One-time Personnel Services detail not available for 2015-16 Actual Expenditures.
Position Title2013-14 Revised
2014-15 Revised
2015-16 Revised
2016-17 Adopted
2016-17 Revised
2017-18 Adopted
Executive Assistant 1 0 0 0 0 0Transit Services Coordinator 2 2 2 2 2 2Total 3 2 2 2 2 2
468

City of Chandler 2017-18 Adopted Budget
Transportation & Development
Street Sweeping is responsible for sweeping the 2,073 lane miles of City-owned residential and arterial roadways. This activity provides clean up when there
is a spill in the roadway, a traffic accident, or a special event, and helps improve the region’s air quality.
2017-18 Performance Measurements Goal: Maintain the cleanliness of the streets and reduce particulate matter (PM-10) to help improve the region’s air quality by sweeping City streets. Supports Priority Based Budgeting Goal(s): Effective Transportation; Healthy and Attractive Community; Safe Community Objectives: ♦ Keep streets clean to reduce the number of complaints regarding sweeping services. ♦ Sweep at least 65,000 curb miles per year. ♦ Maintain established schedules and service levels for various areas.
♦ Arterial streets: Once every two weeks ♦ Residential streets: Once per month ♦ Downtown: Twice per week
Measures
2014-15 Actual
2015-16 Actual
2016-17
Projected
2016-17 Year End Estimate *
2017-18
Projected Curb miles swept 59,664(1) 65,937 63,500 67,000 65,500
(1) The City was down an average of three sweepers in Fiscal Year 2014-15 due to maintenance issues with the aging sweeper fleet. * 2016-17 Year End Estimate reflects “six months actual” and “six months estimated.” Note: All measurements are through June 30th, the last day of the fiscal year.
Division: Street Sweeping Cost Center: 3350
469

City of Chandler 2017-18 Adopted Budget
Transportation & Development
Street Sweeping – 3350
Budget Summary
Authorized Positions
Significant Budget and Staffing Changes
During Fiscal Year (FY) 2016-17, eight Senior Streets Specialist positions were renamed Senior Streets Specialist - CDL and one Street Maintenance Supervisor position was renamed Street Maintenance Supervisor - CDL. The overall decrease to the FY 2017-18 adopted budget is due to one-time funding in FY 2016-17 for a grant funded street sweeper and the required General Fund match. Starting in FY 2017-18, sweeper purchases have been moved to the Capital Improvement Program.
Description
2015-16 Actual
Expenditures
2016-17 Adopted Budget
2016-17 Adjusted Budget
2016-17 Estimated
Expenditures
2017-18 Adopted Budget
% Change Adopted to
AdoptedPersonnel Services Total Personnel 737,124$ 757,438$ 770,226$ 772,506$ 745,002$ -1.64% Ongoing* - 757,438 770,226 772,506 745,002 -1.64% One-time* - - - - - N/AProfessional/Contract 584 3,940 3,940 3,800 3,940 0.00%Operating Supplies 182,375 172,435 175,710 203,631 172,435 0.00%Repairs/Maintenance - 1,145 1,145 880 1,145 0.00%Communications/Transportation - - - - 84 N/AInsurance/Taxes - - - 1,000 - N/AOther Charges/Services 66,078 103,311 167,833 100,500 103,311 0.00%Machinery/Equipment 494,089 264,250 264,250 223,841 - -100.00%Total Cost Center - 3350 1,480,250$ 1,302,519$ 1,383,104$ 1,306,158$ 1,025,917$ -21.24%General Fund 1,014,775$ 1,052,519$ 1,133,104$ 1,095,411$ 1,025,917$ Grant Fund 465,475 - - - - Grant Capital Fund - 250,000 250,000 210,747 - Grand Total 1,480,250$ 1,302,519$ 1,383,104$ 1,306,158$ 1,025,917$ * Ongoing and One-time Personnel Services detail not available for 2015-16 Actual Expenditures.
Position Title2013-14 Revised
2014-15 Revised
2015-16 Revised
2016-17 Adopted
2016-17 Revised
2017-18 Adopted
Senior Streets Specialist 8 8 8 8 0 0Senior Streets Specialist - CDL 0 0 0 0 8 8Street Maintenance Supervisor 1 1 1 1 0 0Street Maintenance Supervisor - CDL 0 0 0 0 1 1Total 9 9 9 9 9 9
470