Transportation and Mobility - International Labour Organization

Transportation and Mobility Union City General Plan Update
Public Review Draft Background Report Page 7-1 June 2015
INTRODUCTION This chapter describes the transportation and circulation systems that move residents and goods throughout the city. The General Plan provides for the development of new roadway connections and the widening and improvement of existing roadways to serve new development. However, the overall goals of the Transportation Element are to enhance the regional accessibility of Union City through transit improvements and to provide alternatives to automobile travel with particular emphasis on the reduction of single-occupant auto trips. As such, this chapter presents mobility from a multimodal perspective including public transit, bicycling, walking, and goods movement. Each section describes existing (2014) conditions and highlights key findings as they relate to citywide mobility issues. This chapter is organized into the following sections:
Roadways (Section 7.1)
Bikeways (Section 7.2)
Pedestrian Facilities (Section 7.3)
Transit Services (Section 7.4)
Goods Movement (Section 7.5)
Railways (Section 7.6)
Aviation Facilities (Section 7.7)
Major Findings
This section provides a summary of major findings. These findings are as follows:
Caltrans is responsible for the State highway system that influences local and regional travel patterns. One interstate highway and one State highway affect travel patterns within and around the city.
The Measure B program, administered by the Alameda County Transportation Commission, is a major source of funding for regional and local transportation improvements and has contributed to significant improvements in and around Union City that have influenced travel patterns in the city. The half-cent sales tax will continue to be collected until 2022. In 2014, voters approved Measure BB. Measure BB renewed the 0.5 percent transportation sales tax approved in 2000 under Measure B and increased the tax by 0.5 percent. This has resulted in a one percent sales tax in the county that is dedicated to transportation expenses alone. The tax is set to expire in 2045.
According to the 2012 American Community Survey for journey to work mode choice, approximately 74.3 percent of Union City residents drive alone, 11.8 percent carpool, 8.9 percent use public transportation, 0.2 percent bicycle, and 1.2 percent walk to work.
Between 2001 and 2011 the daily vehicle miles of travel (DVMT) on City-maintained roadway network increased from 439,740 miles to 445,050 miles, an increase of 1.2 percent. For comparison, VMT increased by 4 percent for Alameda County and 6.8 percent statewide.

Public Review Draft Background Report Page 7-2 June 2015
Existing Conditions
The city is served by Interstate 880 (I-880) and State Highways 238 (Mission Boulevard) and 84 (SR 238 and SR 84, respectively). In addition, two BART lines (Fremont-Richmond and Fremont-Daly City/Millbrae) serve the city. Amtrak service is accessible via stations in Fremont and Hayward.
In 2000 voters approved Measure B, a 20-year transportation expenditure tax, administered by the Alameda County Transportation Commission (Alameda CTC). Measure B is a major source of funding for regional and local transportation improvements throughout Alameda County. Measure B funded a portion of Phase 1 of the Intermodal Station project, which was the first step in creating a two-sided station that would link to future passenger rail and transit-oriented development on the east side of the station. Phase 1 renovated and expanded the westerly side of the station and increased its capacity. Phase 1 also reconfigured the BART parking lot to improve efficiency and access for buses, pedestrians, and bicyclists, including installation of a pedestrian and bicycle corridor from Union Square to the entrance to the station. The reconfiguration also created pads on the BART property for future development.
Phase 2 of the Intermodal Station project is currently underway, which will complete the work for a two-sided station by opening up the easterly side of BART and creating a free pedestrian pass-through along the concourse level. The project was awarded a $14.4 million dollar grant that included $8.7 million dollars in One Bay Area Grant (OBAG) funds. The OBAG program was developed to support SB 375, which seeks to reduce California’s greenhouse gas emissions through responsibe land use and transporation decision-making.
The Metropolitan Transportation Commission (MTC) is working on a project to convert approximately 90 miles of existing carpool lanes into express lanes on several Bay Area highways including I-880 in Alameda County between Marina Boulevard/Lewelling Boulevard and Dixon Landing Road. Express lanes offer toll-free travel for carpools, vanpools, motorcycles, buses, and eligible hybrid vehicles, while also allowing solo drivers the option to pay to use the lane to avoid congestion. The project is scheduled for completion in 2017.
Regional and Local Travel Trends
Historical travel trends for the city are presented in Table 7-1. Since the current General Plan was prepared in 2001, the daily vehicle miles of travel (VMT) on city streets increased 1.2 percent. In comparison, during the same time period VMT increased by 4 percent Alameda County and 6.8 percent statewide.
Table 7-1 Daily Vehicle Miles of Travel Trends
Union City, Alameda County, and California Year Union City Alameda County California
2001 439,740 35,113,900 834,187,180 2011 445,050 36,531,750 890,501,310 Growth Rate 2001-2011 (%) 1.2% 4.0% 6.8% Source: Department of Transportation, State of California, 2001 and 2011 California Public Road Data.
Transportation and Mobility Union City General Plan Update
Public Review Draft Background Report Page 7-3 June 2015
Journey to Work
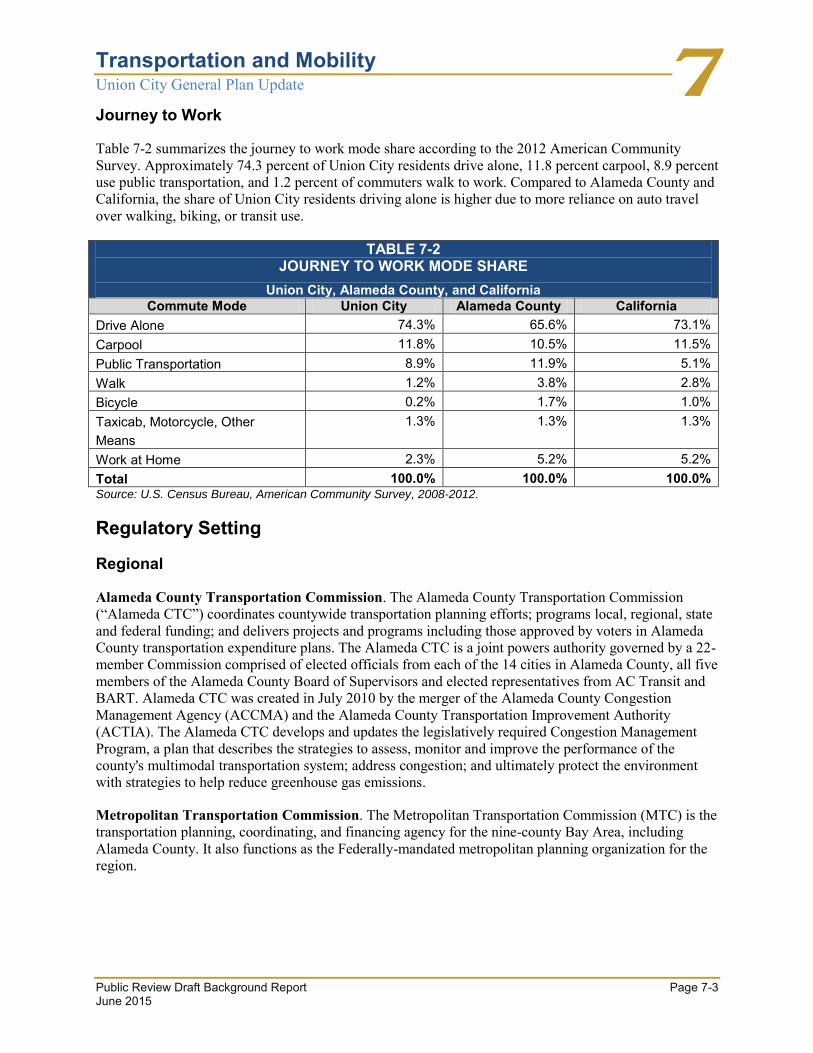
Table 7-2 summarizes the journey to work mode share according to the 2012 American Community Survey. Approximately 74.3 percent of Union City residents drive alone, 11.8 percent carpool, 8.9 percent use public transportation, and 1.2 percent of commuters walk to work. Compared to Alameda County and California, the share of Union City residents driving alone is higher due to more reliance on auto travel over walking, biking, or transit use.
TABLE 7-2 JOURNEY TO WORK MODE SHARE
Union City, Alameda County, and California Commute Mode Union City Alameda County California
Drive Alone 74.3% 65.6% 73.1% Carpool 11.8% 10.5% 11.5% Public Transportation 8.9% 11.9% 5.1% Walk 1.2% 3.8% 2.8% Bicycle 0.2% 1.7% 1.0% Taxicab, Motorcycle, Other Means
1.3% 1.3% 1.3%
Work at Home 2.3% 5.2% 5.2% Total 100.0% 100.0% 100.0% Source: U.S. Census Bureau, American Community Survey, 2008-2012.
Regulatory Setting
Regional
Alameda County Transportation Commission. The Alameda County Transportation Commission (“Alameda CTC”) coordinates countywide transportation planning efforts; programs local, regional, state and federal funding; and delivers projects and programs including those approved by voters in Alameda County transportation expenditure plans. The Alameda CTC is a joint powers authority governed by a 22-member Commission comprised of elected officials from each of the 14 cities in Alameda County, all five members of the Alameda County Board of Supervisors and elected representatives from AC Transit and BART. Alameda CTC was created in July 2010 by the merger of the Alameda County Congestion Management Agency (ACCMA) and the Alameda County Transportation Improvement Authority (ACTIA). The Alameda CTC develops and updates the legislatively required Congestion Management Program, a plan that describes the strategies to assess, monitor and improve the performance of the county's multimodal transportation system; address congestion; and ultimately protect the environment with strategies to help reduce greenhouse gas emissions.
Metropolitan Transportation Commission. The Metropolitan Transportation Commission (MTC) is the transportation planning, coordinating, and financing agency for the nine-county Bay Area, including Alameda County. It also functions as the Federally-mandated metropolitan planning organization for the region.

Public Review Draft Background Report Page 7-4 June 2015
Measure B and BB. Measure B is a half-cent transportation sales tax approved by Alameda County residents in 2000. Administered by ACTC, it funds transportation improvements and services that address regional priorities set forth in the Alameda County 20-year Transportation Expenditure Plan. The plan includes funding for highway and transit projects that directly affect travel patterns in Union City by improving conditions on adjacent freeways and highways, including improvements associated with the future Union City Intermodal station. In November 2014 voters extended the sales tax measure that was set to expire in 2022, through approval of Measure BB, which also doubled the transportation sales tax to a full one percent. This sales tax measure is set to expire in 2045.
Key Terms
None.
References
Reports/Publications
Alameda County Transportation Commission. 2013 Congestion Management Program. 2013.
Department of Transportation, State of California. 2001 California Public Road Data, Office of Highway System Information and Performance, Highway Performance Monitoring System Branch, 2002.
Department of Transportation, State of California. 2011 California Public Road Data, Office of Highway System Information and Performance, Highway Performance Monitoring System Branch, 2012.
Websites
Alameda County Transportation Commission. http://www.alamedactc.org. October 14, 2014.
Metropolitan Transportation Commission. http://www.mtc.ca.gov/planning/plan_bay_area/, January 30, 2013.
U.S. Census Bureau. http://factfinder2.census.gov/bkmk/table/1.0/en/ACS/11_5YR/DP03/ 1600000US0633000, January 8, 2013.

Transportation and Mobility Union City General Plan Update
Public Review Draft Background Report Page 7-5 June 2015
SECTION 7.1 ROADWAYS
Introduction
This section describes the major streets and highways serving Union City. The City defines streets by functional classifications creating a hierarchy of streets and highways that range from regional-serving, limited access freeways, such as I-880, to local streets that primarily provide access to abutting properties. This section also summarizes traffic volumes on major streets, as well as traffic operations on 28 key roadway segments in the city.
Major Findings
All of the 28 existing roadway segments studied are currently (2015) operating at Level of Service (LOS) D or better, which complies with the City’s LOS standard.
The average daily traffic volumes on city streets varies from 4,700 to 43,600 vehicles per day indicating the range of functions from low-volume streets providing local access to high-volume regional through routes.
SB 743 was passed into law in 2013. Under SB 743, CEQA is to revise the guidelines for conducting transportation analyses. The primary change is to reduce reliance on roadway capacity, level of service, and delay, and replace these performance measures with analysis based on vehicle miles travelled (VMT) or similar performance measures. The City may continue to use LOS as a means to assess motor-vehicle mobility or use other means such as vehicle miles traveled (VMT).
Existing Conditions
Functional Roadway Classifications and Standards
An understanding of the existing (2014) conditions on major streets and highways in the city provides the baseline from which the existing and future mobility needs can be identified and addressed. The roadway network is shown on Figure 7-1 with the specific study segments identified. The existing streets and highways serve many different functions as presented in the hierarchy of street classifications described below.
The city’s roadway network is designed to support the land use development reasonably anticipated under the Land Use Element of the General Plan and to reserve adequate right-of-ways. The General Plan seeks to maintain the city’s relatively good traffic flow and operating conditions while allowing for future growth. The City’s most important policy tool for ensuring that roadways are properly upgraded and maintained is the roadway classification system and its associated standards.Roadways serve two functions: to provide mobility and to provide property access. High and constant speeds are desirable for mobility, while low speeds are more desirable for property access and pedestrian safety, particularly in residential areas. A functional classification system provides for meeting the access and mobility needs. Local streets emphasize property access, arterials emphasize high mobility for through traffic, and collectors attempt to achieve a balance between both functions. The hierarchy of the functional classifications in the city consists of freeways, State highways, arterials, primary collectors, industrial roadways, residential collectors, and minor residential streets.

Public Review Draft Background Report Page 7-6 June 2015
This page is intentionally left blank.

SP Railroad
BART
Alam
eda C
reek
SP Railroad
Newark
City ofFremont
City ofHayward
Bay
land
s
Tamarack Dr
7Th St
Arizona St
10Th St
Perry
Fredi St
9Th St
Regents Bl
Railroad Av
H St
6Th St
Skylark
Jean Dr
Whipple Rd
DeborahDr
Cent
ral A
v
Sherm
an
r
5Th StCa
bello
St
Tidewater Dr
TorreyPine Ln
Appian Wy
Rock
linDr
13Th StSanta
Delores
Dr
Wes
tern
Av
Dowe
Av
8Th St
Pacific St
Atlantic St
Whipple Rd
Dyer S
t
Carmel Wy
San An
dreas
Dr
11Th St
Royal
Meridien
Niland S
t
Parkside Dr
Begonia St
Clover St
Lowry
Rd
Maria Dr
Palm Dr
Ci
Union City Bl
Ann Dr
Rd
Dr
Rd
Alvarado Bl
Mission Bl
Alvarado Niles Rd
Alvarado Bl
Mission Bl
Deco
to
Alvarado
Unio n
City
Bl
Deco
to Rd
Union
City
Bl
Niles Rd
D
Figure 7-1Study Segments
0 0.50.25
Miles
City Limits
Study Segment
East-West Connector
1
XX
2
3
5
7
6
111012
9
16
2021
19
13
24 17
18
14
15
26
23
22
25
27
28
8
4

Public Review Draft Background Report Page 7-8 June 2015
This page is intentionally left blank.

Transportation and Mobility Union City General Plan Update
Public Review Draft Background Report Page 7-9 June 2015
State Highways
The city is served by one interstate freeway (I-880), and one State route (SR 238), which are operated and maintained by the State Department of Transportation (Caltrans). These State facilities affect travel patterns within and around the city.
Freeways, such as I-880, are very limited access, high-speed roadways that are part of the State and Federal highway systems. Freeway design standards are established by Caltrans. Freeway access is limited to designated interchanges and no direct access is permitted for any use.
State highways are intended to have limited access and moderate to high travel speeds. State Route 238 (Mission Boulevard) is the only State highway located in Union City. The right-of-ways for Mission Boulevard is 120 feet with six-foot sidewalks. The State allows limited direct access to industrial, commercial, and high-density residential uses subject to site plan review. Major cross-street intersections are signalized with multiple turn lanes. There are right-turn only access restrictions or left-turn staging in the median at occasional collector streets.
Interstate 880 (I-880)
I-880 is an eight-lane freeway that runs north-south through the center of the city. It provides regional access via interchanges at Whipple Road, Alvarado-Niles Road, and Fremont Boulevard/Alvarado Boulevard just south of Union City. I-880 traverses roughly 50 miles from Oakland to San Jose. I-880 is a major regional commuter route, providing connections to San Francisco, Contra Costa, Alameda, Santa Clara, and San Mateo Counties. The I-880/Whipple Road improvement project is a fully-funded Alameda Countywide Transportation Plan (CWTP) Tier 1 project with a total estimated cost of $62 million. The project includes full interchange improvements, including northbound off-ramp, surface street improvements, and realignment. The purpose is to improve safety and capacity. The project is scheduled to begin in 2015.
State Route 238 (SR 238)
SR 238 in Union City is also known as Mission Boulevard. Mission Boulevard is a four- to six-lane State highway that runs north-south along the base of the foothills at the eastern side of the city. Between Whipple Road and Decoto Road, Mission Boulevard is six lanes wide.Intersections improvements are planned on Mission Boulevard and 7th Street to accommodate the future East-West Connector. .
Arterials
Arterials are moderate-speed through streets with various configurations. Average daily traffic on an arterial typically exceeds over 10,000 vehicles per day. Arterials will usually have four to six travel lanes with separate left-turn lanes. The right-of-ways for these streets range from 84 to 110 feet. Access to an arterial is primarily accomplished through primary collector and residential collector streets.
The City allows limited direct access for new industrial, commercial, and high-density residential developments, subject to site development review. Arterial streets in Union City include Decoto Road, Alvarado-Niles Road, Whipple Road, Union City Boulevard, Dyer Street, Central Avenue, and Alvarado Boulevard.

Public Review Draft Background Report Page 7-10 June 2015
Decoto Road
Decoto Road is a four-lane arterial that runs from I-880 to Mission Boulevard. The Decoto Road Grade Separation project is a fully-funded CWTP Tier 1 project with a total estimated cost of $192 million, sponsored by Union City. The project would allow for Decoto Road to be grade-seprated from the Union Pacific railroad tracks.
Alvarado-Niles Road
Alvarado-Niles Road is a four-lane, east-west arterial that extends from Niles Boulevard in Fremont to Dyer Street in Union City. The City has received a Highway Safety Improvement Project Grant (HSIP) to upgrade the traffic signals at 5 intersections on Alvarado-Niles Road including the intersections of: Alvarado-Niles Road and Almaden Boulevard; Alvarado-Niles Road and Hop Ranch Road; Alvarado-Niles Road and Central Avenue; Alvarado-Niles Road and Western Avenue; and Alvarado-Niles Road and H St / Royal Ann Drive. Upgrades include removing the existing signals in the median island and installing longer mast arms with appropriate signal heads. Measures to reduce potential conflicts between pedestrians and motor vehicle movements will also be evaluated as part of the work.
Whipple Road
Whipple Road is a two- to four-lane, east-west arterial that runs from Mission Boulevard to Union City Boulevard where it dead-ends at the UP railroad tracks and the Lincoln Alvarado Business Park. On the western side of the tracks, Whipple Road continues through the business park to the Horner/Veasy Area. Whipple Road primarily serves industrial areas of the city on both the east and west sides of I-880, but also provides access to residential development. The portion of Whipple Road is located within Hayward. The City plans to widen and enhance Whipple Road from I-880 to Mission Boulevard. The project is a partially-funded CWTP Tier 2 project with a total estimated cost of $103 million, and is sponsored by Union City.
Union City Boulevard
Union City Boulevard is a four- to six-lane, north-south major arterial that originates in San Leandro and extends to Newark. To the north in Hayward the roadway is known as Hesperian Boulevard and to the south in Fremont the roadway is known as Ardenwood Boulevard. This arterial runs parallel to I-880 and is a connector to both the State Route 84/Dumbarton Bridge to the south and State Route 92/San Mateo Bridge to the north. The Union City Boulevard widening project is a fully-funded CWTP Tier 1 project with a total estimated cost of $10 million, sponsored by Union City. The project would entail widening Union City Boulevard/Hesperian Boulevard to three lanes from Whipple Road in Union City to Industrial Parkway in Hayward.
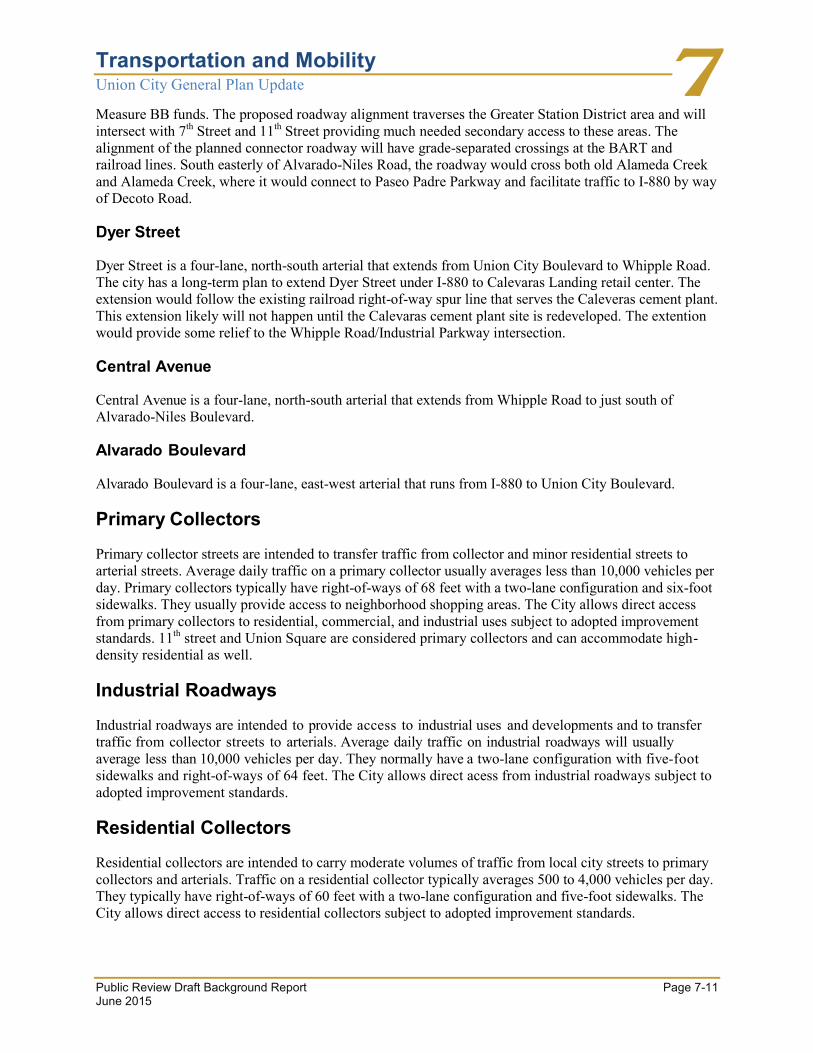
Future East-West Connector
A new four-lane east-west connector arterial is planned between Mission Boulevard and Paseo Padre Parkway to help alleviate traffic congestion from Decoto Road and other east-west thoroughfares. Paseo Padre Parkway and Decoto Road would also be widened as part of this project to facilitate traffic between Mission Boulevard and I-880. The project, sponsored by Alameda CTC, is a fully-funded CWTP Tier 1 project with a total estimated cost of $196 million, which will be paid for by the original Measeure B and
Transportation and Mobility Union City General Plan Update
Public Review Draft Background Report Page 7-11 June 2015
Measure BB funds. The proposed roadway alignment traverses the Greater Station District area and will intersect with 7th Street and 11th Street providing much needed secondary access to these areas. The alignment of the planned connector roadway will have grade-separated crossings at the BART and railroad lines. South easterly of Alvarado-Niles Road, the roadway would cross both old Alameda Creek and Alameda Creek, where it would connect to Paseo Padre Parkway and facilitate traffic to I-880 by way of Decoto Road.
Dyer Street
Dyer Street is a four-lane, north-south arterial that extends from Union City Boulevard to Whipple Road. The city has a long-term plan to extend Dyer Street under I-880 to Calevaras Landing retail center. The extension would follow the existing railroad right-of-way spur line that serves the Caleveras cement plant. This extension likely will not happen until the Calevaras cement plant site is redeveloped. The extention would provide some relief to the Whipple Road/Industrial Parkway intersection.
Central Avenue
Central Avenue is a four-lane, north-south arterial that extends from Whipple Road to just south of Alvarado-Niles Boulevard.
Alvarado Boulevard
Alvarado Boulevard is a four-lane, east-west arterial that runs from I-880 to Union City Boulevard.
Primary Collectors
Primary collector streets are intended to transfer traffic from collector and minor residential streets to arterial streets. Average daily traffic on a primary collector usually averages less than 10,000 vehicles per day. Primary collectors typically have right-of-ways of 68 feet with a two-lane configuration and six-foot sidewalks. They usually provide access to neighborhood shopping areas. The City allows direct access from primary collectors to residential, commercial, and industrial uses subject to adopted improvement standards. 11th street and Union Square are considered primary collectors and can accommodate high-density residential as well.
Industrial Roadways
Industrial roadways are intended to provide access to industrial uses and developments and to transfer traffic from collector streets to arterials. Average daily traffic on industrial roadways will usually average less than 10,000 vehicles per day. They normally have a two-lane configuration with five-foot sidewalks and right-of-ways of 64 feet. The City allows direct acess from industrial roadways subject to adopted improvement standards.
Residential Collectors
Residential collectors are intended to carry moderate volumes of traffic from local city streets to primary collectors and arterials. Traffic on a residential collector typically averages 500 to 4,000 vehicles per day. They typically have right-of-ways of 60 feet with a two-lane configuration and five-foot sidewalks. The City allows direct access to residential collectors subject to adopted improvement standards.
Public Review Draft Background Report Page 7-12 June 2015
Minor Residential Streets
Minor residential streets are intended to serve as low-capacity streets that primarily serve low-density residential uses. Traffic on a minor residential street averages less than 1,000 vehicles per day, although most average less than 500 vehicles per day. Minor residential streets typically have right-of-ways of 56 feet, although narrower right-of-ways are permitted in certain circumstances such as cul-de-sacs or where property constraints exist. The City allows direct access subject to adopted improvement standards.
City Street Standards
The City uses Caltrans specifications for all basic street standards. These typical dimensions are as follows:
11- to 14-foot-wide street lane widths
5-foot-wide minimum striped bicycle lane
7-foot-wide minimum on-street parking
5-foot-wide minimum sidewalks
Roadway Segment Traffic Volumes
The average daily traffic (ADT) volume on the study segments provides an indication of the key corridors serving both regional through traffic and local access. The daily traffic volume along the selected roadway segments were collected using 24-hour tube counts during weekdays (Tuesday, Wednesday, and Thursday). The counts were conducted on September 23 and 24, 2014. The ADT volumes are shown on Figure 7-2.

SP Railroad
BART
Alam
eda C
reek
SP Railroad
Newark
City ofFremont
City ofHayward
Bay
land
s
Tamarack Dr
7Th St
Arizona St
10Th St
Perry
Fredi St
9Th St
Regents Bl
Railroad Av
H St
6Th St
Skylark
Jean Dr
Whipple Rd
DeborahDr
Cent
ral A
v
Sherm
an
r
5Th StCa
bello
St
Tidewater Dr
TorreyPine Ln
Appian Wy
Rock
linDr
13Th StSanta
Delores
Dr
Wes
tern
Av
Dowe
Av
8Th St
Pacific St
Atlantic St
Whipple Rd
Dyer S
t
Carmel Wy
San An
dreas
Dr
11Th St
Royal
Meridien
Niland S
t
Parkside Dr
Begonia St
Clover St
Lowry
Rd
Maria Dr
Palm Dr
Ci
Union City Bl
Ann Dr
Rd
Dr
Rd
Alvarado Bl
Mission Bl
Alvarado Niles Rd
Alvarado Bl
Mission Bl
Deco
to
Alvarado
Unio n
City
Bl
Deco
to Rd
Union
City
Bl
Niles Rd
D
Figure 7-2ADT Volumes
0 0.50.25
Miles
City Limits
Study Segment
East-West Connector
ADT Volume
1
XX
2
3
5
7
6
111012
9
16
2021
19
13
24 17
18
14
15
26
23
22
25
27
28
8
4
XXXX216800
346172625226
860
1497
7
33392
11709
1387
3
25173
23142
4679
3701
3
1773
7214400
35021
43608
25610
1673
7
22358
17394
13365
2240
9
3448934741
28888
212000
n/a
n/a

Public Review Draft Background Report Page 7-14 June 2015
This page is intentionally left blank.

Transportation and Mobility Union City General Plan Update
Public Review Draft Background Report Page 7-15 June 2015
Level of Service
Level of service (LOS) describes the operating conditions experienced by motorists. LOS is a qualitative measure based on a number of factors, including speed and travel time, traffic interruptions, freedom to maneuver, driving comfort, and convenience. LOS are designated "A" through "F" from best to worst, which cover the entire range of traffic operations that might occur. LOS "A" through "E" generally represent traffic volumes at less than capacity, while LOS "F" represents at or over capacity.
Level of Service Evaluation Methodology
This study evaluated LOS for road segments to determine the performance of the existing street system to accommodate existing traffic. The same evaluation can be conducted for intersections; however, intersection LOS is generally more applicable to project-level traffic analyses where traffic is sufficiently focused to justify a more precise level of evaluation.
Union City Level of Service Standard
Each jurisdiction determines acceptable LOS for intersections under its jurisdiction. The Union City General Plan identifies LOS “D” as the goal for the city’s streets and intersections during peak commute hours. Union City uses different criteria to establish LOS for roadways and for intersections. For roadways LOS is based on the ratio of traffic volume to the vehicle capacity of the road segment (the volume-to-capacity ratio). The LOS for the road segment is then correlated to the volume-to-capacity (V/C) ratio for the segment. The exact correlation between the two has been established previously by the Alameda County Transportation Commission CMP as shown in Table 7-3.
For intersections Union City uses the Highway Capacity Manual (HCM) 2010 methodology to determine LOS. The HCM 2010 methodology bases LOS on overall average delay at an intersection. The level of service for the intersection is correlated to the intersection delay as shown in Table 7-3.
TABLE 7-3 ROADWAY AND INTERSECTION LEVEL OF SERVICE CRITERIA
Level of Service Criteria 1, 2 Description LOS “A” Roadway Segment V/C Range
Signalized Intersection Delay (seconds) 0.00-0.35 0.0-10.0
Free flow (relatively). If signalized, conditions are such that no vehicle phase is fully used by traffic and no vehicle waits through more than one red indication. Very slight or no delay.
LOS “B” Roadway Segment V/C Range Signalized Intersection Delay (seconds)
0.36-0.58 10.1-20.0
If signalized, an occasional approach phase is fully used; vehicle platoons are formed. Slight delay.
LOS “C” Roadway Segment V/C Range Signalized Intersection Delay (seconds)
0.59-0.75 20.1-35.0
Stable flow or operation. If signalized, drivers occasionally may have to wait through more than one red indication.

Public Review Draft Background Report Page 7-16 June 2015
TABLE 7-3 ROADWAY AND INTERSECTION LEVEL OF SERVICE CRITERIA
Level of Service Criteria 1, 2 Description
Acceptable delay. LOS “D” Roadway Segment V/C Range
Signalized Intersection Delay (seconds) 0.76-0.90 35.1-55.0
Approaching unstable flow or operation; queues develop but quickly clear. Tolerable delay.
LOS “E” Roadway Segment V/C Range Signalized Intersection Delay (seconds)
0.91-1.00 55.1-80.0
Unstable flow or operation; the intersection has reached capacity congestion and intolerable delay.
LOS “F” Roadway Segment V/C Range 3 –Measured 1.00 or less –Forecast 1.01 or more Signalized Intersection Delay (seconds) >80
Forced flow or operation. Intersection operates below capacity. Jammed.
Notes: 1 Signalized intersection LOS and delays reported are for overall average delay. 2 Roadway segment LOS based on volume-to-capacity (V/C) ratio. 3 While forecast demands can exceed maximum capacity, actual measured volumes theoretically cannot. Since traffic inefficiencies arise at capacity demand conditions, the calculated V/C ratios for LOS “F” conditions can be substantially below a V/C of 1.00. Source: 2013 Alameda County Transportation Commission Congestion Management Program, 2013. Transportation Research Board, Highway Capacity Manual (Washington, D.C., 2010) p10-16, 2010.
The CEQA guidelines for establishing traffic impacts are currently (2014) being updated and are planned for statewide adoption on January 1, 2016. The updates to the CEQA guidelines will most likely result in future transporation-related impacts being assessed using other means such as vehicle miles traveled (VMT). At that time, the City’s criteria for evaluating transporation-related impacts will be re-assessed.
Existing Roadway Segment Levels of Service
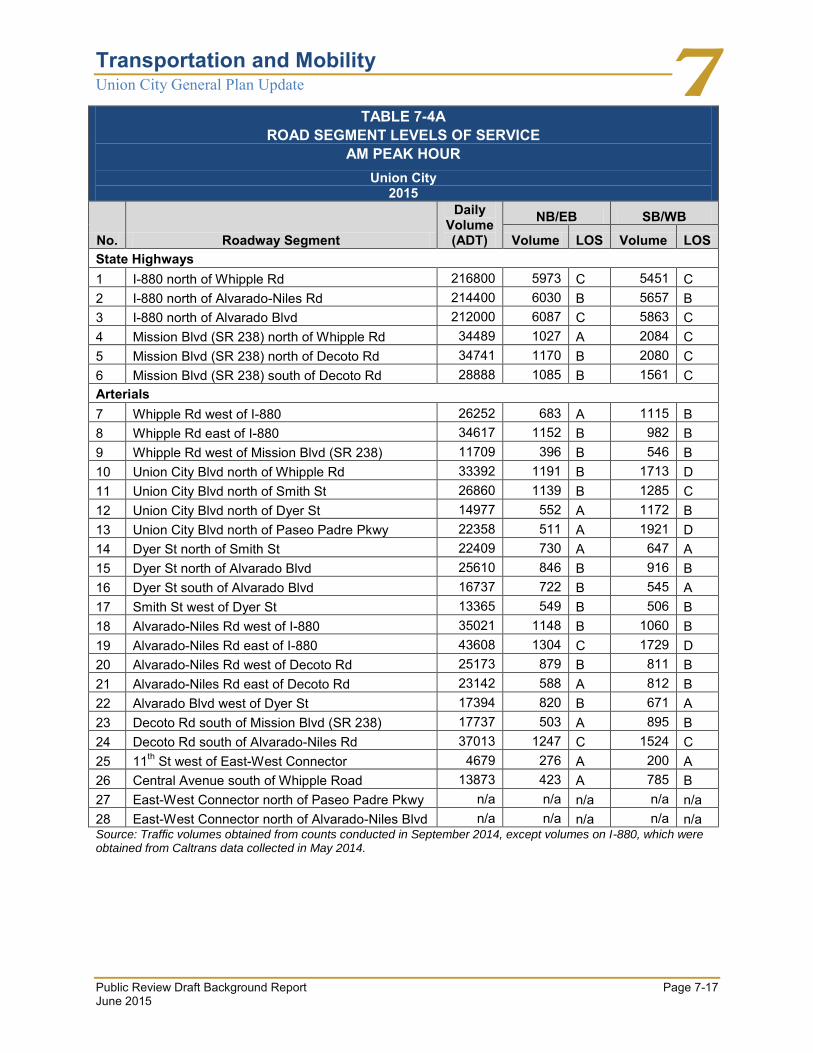
The City analyzed traffic operations based on peak hour traffic counts for 28 roadway segments in Union City. The road segments and LOS of these segments are shown in Table 7-4a and 7-4b. As the tables show, all of the 28 existing roadway segments studied are currently (2015) operating at LOS D or better, which complies with the City’s LOS standard. The numbers on the table correspond to Figure 7-2: ADT Volumes.
Transportation and Mobility Union City General Plan Update
Public Review Draft Background Report Page 7-17 June 2015
TABLE 7-4A ROAD SEGMENT LEVELS OF SERVICE
AM PEAK HOUR Union City
2015
No. Roadway Segment
Daily Volume (ADT)
NB/EB SB/WB
Volume LOS Volume LOS State Highways 1 I-880 north of Whipple Rd 216800 5973 C 5451 C 2 I-880 north of Alvarado-Niles Rd 214400 6030 B 5657 B 3 I-880 north of Alvarado Blvd 212000 6087 C 5863 C 4 Mission Blvd (SR 238) north of Whipple Rd 34489 1027 A 2084 C 5 Mission Blvd (SR 238) north of Decoto Rd 34741 1170 B 2080 C 6 Mission Blvd (SR 238) south of Decoto Rd 28888 1085 B 1561 C Arterials 7 Whipple Rd west of I-880 26252 683 A 1115 B 8 Whipple Rd east of I-880 34617 1152 B 982 B 9 Whipple Rd west of Mission Blvd (SR 238) 11709 396 B 546 B 10 Union City Blvd north of Whipple Rd 33392 1191 B 1713 D 11 Union City Blvd north of Smith St 26860 1139 B 1285 C 12 Union City Blvd north of Dyer St 14977 552 A 1172 B 13 Union City Blvd north of Paseo Padre Pkwy 22358 511 A 1921 D 14 Dyer St north of Smith St 22409 730 A 647 A 15 Dyer St north of Alvarado Blvd 25610 846 B 916 B 16 Dyer St south of Alvarado Blvd 16737 722 B 545 A 17 Smith St west of Dyer St 13365 549 B 506 B 18 Alvarado-Niles Rd west of I-880 35021 1148 B 1060 B 19 Alvarado-Niles Rd east of I-880 43608 1304 C 1729 D 20 Alvarado-Niles Rd west of Decoto Rd 25173 879 B 811 B 21 Alvarado-Niles Rd east of Decoto Rd 23142 588 A 812 B 22 Alvarado Blvd west of Dyer St 17394 820 B 671 A 23 Decoto Rd south of Mission Blvd (SR 238) 17737 503 A 895 B 24 Decoto Rd south of Alvarado-Niles Rd 37013 1247 C 1524 C 25 11th St west of East-West Connector 4679 276 A 200 A 26 Central Avenue south of Whipple Road 13873 423 A 785 B 27 East-West Connector north of Paseo Padre Pkwy n/a n/a n/a n/a n/a 28 East-West Connector north of Alvarado-Niles Blvd n/a n/a n/a n/a n/a Source: Traffic volumes obtained from counts conducted in September 2014, except volumes on I-880, which were obtained from Caltrans data collected in May 2014.

Public Review Draft Background Report Page 7-18 June 2015
TABLE 7-4B ROAD SEGMENT LEVELS OF SERVICE
PM PEAK HOUR Union City
2015
No. Roadway Segment
Daily Volume (ADT)
NB/EB SB/WB
Volume LOS Volume LOS State Highways 1 I-880 north of Whipple Rd 216800 6107 C 6190 C 2 I-880 north of Alvarado-Niles Rd 214400 6336 B 6359 B 3 I-880 north of Alvarado Blvd 212000 6565 C 6527 C 4 Mission Blvd (SR 238) north of Whipple Rd 34489 1819 B 1212 B 5 Mission Blvd (SR 238) north of Decoto Rd 34741 1742 B 1314 B 6 Mission Blvd (SR 238) south of Decoto Rd 28888 1355 C 1154 B Arterials 7 Whipple Rd west of I-880 26252 1146 B 796 B 8 Whipple Rd east of I-880 34617 1096 B 1187 B 9 Whipple Rd west of Mission Blvd (SR 238) 11709 660 C 356 A 10 Union City Blvd north of Whipple Rd 33392 1732 D 1535 C 11 Union City Blvd north of Smith St 26860 1365 C 1311 C 12 Union City Blvd north of Dyer St 14977 1061 B 523 A 13 Union City Blvd north of Paseo Padre Pkwy 22358 1749 D 647 A 14 Dyer St north of Smith St 22409 960 B 922 B 15 Dyer St north of Alvarado Blvd 25610 1113 C 1028 B 16 Dyer St south of Alvarado Blvd 16737 744 B 715 B 17 Smith St west of Dyer St 13365 542 B 444 B 18 Alvarado-Niles Rd west of I-880 35021 1212 B 1312 C 19 Alvarado-Niles Rd east of I-880 43608 1582 D 1582 D 20 Alvarado-Niles Rd west of Decoto Rd 25173 1045 B 965 B 21 Alvarado-Niles Rd east of Decoto Rd 23142 1264 C 878 B 22 Alvarado Blvd west of Dyer St 17394 751 B 721 A 23 Decoto Rd south of Mission Blvd (SR 238) 17737 876 B 609 A 24 Decoto Rd south of Alvarado-Niles Rd 37013 1620 D 1325 C 25 11th St west of East-West Connector 4679 189 A 251 A 26 Central Avenue south of Whipple Road 13873 569 A 547 A 27 East-West Connector north of Paseo Padre Pkwy n/a n/a n/a n/a n/a 28 East-West Connector north of Alvarado-Niles Blvd n/a n/a n/a n/a n/a Source: Traffic volumes obtained from counts conducted in September 2014, except volumes on I-880, which were obtained from Caltrans data collected in May 2014.

Transportation and Mobility Union City General Plan Update
Public Review Draft Background Report Page 7-19 June 2015
Complete Streets
Assembly Bill 1358 (AB 1358), the Complete Streets Act of 2008, requires that all major updates to General Plan circulation (i.e. transportation) elements plan for a multi-modal transportation network that meets the needs of all modes and users. This concept is referred to as “complete streets.”
More specifically, complete streets refers to the provision of a safe and convenient transportation network that meets the needs of all users, including pedestrians, bicyclists, persons with disabilities, motorists, movers of commercial goods, users and operators of public transportation, emergency responders, seniors, children, youth, and families. The concept of complete streets is also context sensitive, which means that roadway improvements are designed to address the unique needs of a particular community.
Implementation of complete streets policies assists cities with reduction of automobile trips resulting in improved air quality and reductions in greenhouse gas emissions. It also contributes to the health of the community by designing safer facilities that encourage physical activity.
To address AB 1358 and the MTC requirements, the City updated the Circulation Element of its General Plan to incorporate complete streets policies in December 2014. The policies were based on a template provided by the Alameda County Transportation Commission.
Existing Roadway Assessment
In October 2014 Save California Streets published the 2014 California Statewide Local Streets and Roads Needs Assessment Report (Needs Assessment Report). The goal of the Needs Assessment Report is to educate the public and policy/decision-makers at all levels of government about the infrastructure investments needed to provide California with an efficient multi-modal transportation system. The Needs Assessment Report reveals the data that illustrates the future funding requirements for California’s local streets, bridges, sidewalks, and other essential transportation components.
Save California Streets surveyed all 58 counties and 482 cities in California. It used the California average local street and road pavement condition index (PCI), which rates street and pavement conditions from 0 (failed) to 100 (excellent condition). A rating above 70 on the PCI scale indicates good conditions, while anything lower than 50 is considered poor or failed. The study found the average pavement condition statewide is 66 on the PCI scale, which indicates an “at-risk” condition.
According to the Needs Assessment Report, both Alameda County and the State have a PCI of 66 indicating road conditions in the county and statewide are “at-risk.” Union City scored above a 70 on the PCI scale, indicating “good” roadway conditions. It is important to note that Union City was one of only six incorporated cities in Alameda County to score above 70 on the PCI scale.
Regulatory Setting
The planning, operations, and maintenance of the streets and highways are regulated by State, regional, and local agencies.
State
California Complete Streets Act of 2008. The purpose of the Complete Streets Act is to require cities and counties to include in the circulation elements of their general plans policies and programs supporting the development of a well-balanced, connected, safe, and convenient multimodal transportation network.
Public Review Draft Background Report Page 7-20 June 2015
This network should consist of complete streets which are designed and constructed to serve all users of streets, roads, and highways, regardless of their age or ability, or whether they are driving, walking, bicycling, or taking transit. The network should allow for all users to effectively travel by motor vehicle, foot, bicycle, and transit to reach key destinations within their community and the larger region.
Sustainable Communities and Climate Protection Act of 2008. The Sustainable Communities and Climate Protection Act, Senate Bill 375 (SB 375), targets greenhouse gas emissions from passenger vehicles. The bill requires that each metropolitan planning organization develop a Sustainable Communities Strategy that integrates transportation, land use, and housing policies to achieve emissions targets set for the region by the California Air Resources Board.
Regional
Metropolitan Transportation Commission. The Metropolitan Transportation Commission (MTC) is the transportation planning, coordinating, and financing agency for the nine-county Bay Area, including Alameda County. It also functions as the Federally-mandated metropolitan planning organization (MPO) for the region. MTC authored the regional transportation plan known as Transportation 2035 that was adopted on April 22, 2009.
The Association of Bay Area Governments (ABAG) is the regional planning agency for the nine-county Bay Area, including Alameda County. It primarily deals with land use, housing, environmental quality, and economic development issues, which are often closely connected to transportation.
MTC partnered with ABAG on preparation and approval of Plan Bay Area, which is the successor to Transportation 2035, the region’s prior long-range transportation plan adopted in 2009. Plan Bay Area
stems from the broader effort to prepare a Sustainable Communities Strategy for the region through a collaborative planning process that involves MTC, ABAG, the Bay Area Air Quality Management District (BAAQMD), and the Bay Conservation and Development Commission (BCDC). Plan Bay Area integrates transportation, land use, and housing desicionmaking for the San Francisco Bay Area. In July 2013 the Plan was jointly approved by the ABAG Executive Board and by MTC.
Associated with these planning efforts is the One Bay Area Grant (OBAG) Program which is a new program to better integrate the region’s Federal transportation program with State climate laws. A requirement of the grant program is for cities to prepare a general plan that complies with the Complete Streets Act of 2008.

Transportation and Mobility Union City General Plan Update
Public Review Draft Background Report Page 7-21 June 2015
Key Terms
The following key terms used in this chapter are defined as follows:
Annual Average Daily Traffic. The average daily volume of traffic estimated on a yearly basis based on one year (365 days) of data.
Average Daily Traffic (ADT). The total volume of traffic during a given time period (in whole days greater than one day and less than one year) divided by the number of days in that time period. ADT volumes can be determined by continuous traffic counts or periodic counts. Where only periodic traffic counts are taken, ADT volume can be established by applying correction factors for the season or day of week. For roadways with traffic in two directions, the ADT includes traffic in both directions unless specified otherwise.
Countywide Transportation Plan (CWTP) Tier 1 Project. CWTP Tier 1 projects are fully funded in the CWTP. They are the farthest along in project development and ready for shorter term implementation.
CWTP Tier 2 Project. CWTP Tier 2 projects are partially funded in the CWTP to further project development and/or to fund some phases that are ready for construction.
Level of Service. A quantitative stratification of a performance measure or measures that represent quality of service. The LOS concept facilitates the presentation of results, through the use of a familiar A (best) to F (worst) scale. LOS is defined by one or more service measures that reflect the traveler perspective and are useful to operating agencies.
Vehicle Miles Traveled (VMT). The total number of vehicle miles traveled within a specific geographic area over a set period of time.
References
Reports/Publications
Alameda County Transportation Commission. 2013 Congestion Management Program, 2013.
California Local Streets & Roads Needs Assessment, October 2014. NCE. Save California Streets. http://www.savecaliforniastreets.org/wp-content/uploads/2014/10/2014-Statewide-Report-FINAL-10-28-14.pdf, November 2014.
Transportation Research Board of National Academies. Highway Capacity Manual 2010, Chapter 5. 2010.
Union City General Plan, Transportation Element, 2002.
Websites
Alameda Countywide Transportation Plan. http://www.alamedactc.org/files/managed/Document/8043/ALAMEDA_CWTP_FINAL.pdf. October 14, 2014.
California Legislative Information. http://leginfo.legislature.ca.gov/faces/billStatusClient.xhtml, December 5, 2012.
Public Review Draft Background Report Page 7-22 June 2015
Metropolitan Transportation Commission. http://www.mtc.ca.gov/planning/plan_bay_area/, January 30, 2013.
OneBayArea. http://onebayarea.org/funding-and-grants.html, January 30, 2013.
Union City. http://www.ci.union-city.ca.us, August 20, 2014.
Union City. http://www.ci.union-city.ca.us/home/showdocument?id=356, November 24, 2014.

Transportation and Mobility Union City General Plan Update
Public Review Draft Background Report Page 7-23 June 2015
SECTION 7.2 BIKEWAYS
Introduction
Union City is served by a network of designated bicycle facilities including on-street facilities and regional recreational trails. Combined with good transit service, temperate weather, and relatively flat topography, bicycling in Union City is an effective transportation and recreation option. This section describes the existing (2014) bicycle network in the city and summarizes local and regional bicycle planning efforts.
Major Findings
The 2012 Union City Pedestrian and Bicycle Master Plan sets the goals and objectives for providing the opportunity to travel by bicycle as an alternative mode of transportation and recreation for physical, environmental, and social benefits.
The existing (2012) Union City bikeways network includes 6.9 miles of paved and unpaved off-street shared Class I Bike paths and pedestrian trails, 12.3 miles of Class II Bike Lanes, and 0.5 miles of Class III Bike Routes.
The type of bicycle activity tends to vary by geographic area in Union City, with more utilitarian bicycle trips occurring on the city’s roadways and recreational bicycle trips occurring on off-street trails the majority of which are located along the area’s flood control levees.
Bicycle trips account for less than one-half percent of all commute trips in Union City, which is lower than both the countywide and the statewide rate.
Existing Conditions
Background
The Union City Pedestrian and Bicycle Master Plan (2012), provides a vision, strategies, and actions for bicycle transportation in Union City. It updates a previous plan prepared in 2006 by providing an updated inventory of the city’s existing and planned bicycle paths, bicycle lanes, and bicycle routes. It also contains an updated list of proposed bikeways and bicycle support facilities. The plan seeks to improve connections throughout the City with an emphasis on connections to transit facilities, neighboring communities, and the regional bicycle network.
Bicycle Facilities
The three types of bikeways identified by Caltrans in the Highway Design Manual are identified below.
Class I Bikeway. Typically called a “bike path” or “bike trail,” a Class I bikeway provides bicycle travel on a paved right-of-way completely separated from any street or highway.
Class II Bikeway. Often referred to as a “bike lane,” a Class II bikeway provides a striped and stenciled lane for one-way travel on a street or highway.
Public Review Draft Background Report Page 7-24 June 2015
Class III Bikeway. Generally referred to as a “bike route,” a Class III bikeway provides for shared use with pedestrian or motor vehicle traffic and is identified only by signing.
Bicycle Network
While bicyclists are permitted on all roads (with the exception of access-controlled freeways), bikeway designations recognize that certain roadways provide more optimal routes for bicyclists.
The Union City Pedestrian and Bicycle Master Plan identifies Class I trails, which provide excellent recreational opportunities for walking and biking. The majority of these facilities are located along the Alameda County Flood Control and Water Conservation District’s flood control levees. These trails are as follows:
Alameda Creek Regional Trail runs from Union City Boulevard in the west to Canyon Road near Niles Canyon in Fremont in the east.
Alameda Creek Trail runs along the northern fork of Alameda Creek from Union City Boulevard north of Whipple Road to Smith Street near Dyer Street.
Dry Creek Trail follows Dry Creek from its southern terminus at Alameda Creek north to Mission Boulevard.
Mariner Park Trail runs between Benson Road and Union City Boulevard.
William Cann Civic Center Park Trail connects Decoto Road and the Alameda Creek Regional Trail through William Cann Civic Center Park.
Bicycles are also permitted on some of the multi-use paths described in the next section describing pedestrian facilities. Existing and proposed bicycle facilities are shown on Figure 7-3.
In 2012 the city’s bicycle network included:
6.9 miles of paved and unpaved off-street shared Class I Bike paths and pedestrian trails
12.3 miles of Class II Bike Lanes
0.5 miles of Class III Bike Routes
The existing (2014) and proposed facilities are shown on Figure 7-3. The Class 1 bicycle paths are generally located along the area’s flood control channels. There is one existing Class III facility located on Smith Street between Union City Boulevard and Dyer Street. The majority of the City’s other existing on-street bicycle facilities are Class II bike facilities. In addition, the plan covers bicycle support facilities and treatments, such as signage, bicycle signal detection, and bicycle parking.

SP Railroad
BART
Alam
eda C
reek
SP Railroad
Newark
City ofFremont
City ofHayward
Bay
land
s
Tamarack Dr
7Th St
Arizona St
10Th St
Perry
Fredi St
9Th St
Regents Bl
Railroad Av
H St
6Th St
Skylark
Jean Dr
Whipple Rd
DeborahDr
Cent
ral A
v
Sherm
an
r
5Th StCa
bello
St
Tidewater Dr
TorreyPine Ln
Appian Wy
Rock
linDr
13Th StSanta
Delores
Dr
Wes
tern
Av
Dowe
Av
8Th St
Pacific St
Atlantic St
Whipple Rd
Dyer S
t
Carmel Wy
San An
dreas
Dr
11Th St
Royal
Meridien
Niland S
t
Parkside Dr
Begonia St
Clover St
Lowry
Rd
Maria Dr
Palm Dr
Ci
Union City Bl
Ann Dr
Rd
Dr
Rd
Alvarado Bl
Mission Bl
Alvarado Niles Rd
Alvarado Bl
Mission Bl
Deco
to
Alvarado
Unio n
City
Bl
Deco
to Rd
Union
City
Bl
Niles Rd
D
Figure 7-3Existing and Proposed Bikeways
0 0.50.25
Miles
City Limits
East-West Connector
Proposed Bike Facilities
Existing Bike Trail
Existing Bike Lane
Existing Unpaved Trail
Public Review Draft Background Report Page 7-26 June 2015
This page is intentionally left blank.

Transportation and Mobility Union City General Plan Update
Public Review Draft Background Report Page 7-27 June 2015
Bicycle Travel
Types of bicycle activity in Union City tends to vary by geographic areas, with more utilitarian bicycle trips occurring on on-street bikeways in the developed portions of the City, and recreational bicycle trips occurring on off-street trails the majority of which are located along the area’s flood control levees.
Bicycle trips account for less than one-half percent of all commute trips in the city. As shown in Table 7-5, Union City had a lower average bicycle mode share (0.2 percent) for commuting when compared to the countywide and California averages of 1.7 percent and 1.0 percent, respectively.
TABLE 7-5 BICYCLE MODE SHARE
Union City, Alameda County, and California 2005-2012
Jurisdiction
2005 2012 Total
Commuters Bicycle
Commuters Bike Mode
Share Total
Commuters Bicycle
Commuters Bike Mode
Share Union City 30,800 123 0.4% 30,288 61 0.2% Alameda County 651,547 5,864 0.9% 693,960 11,797 1.7% California 15,547,334 108,831 0.7% 16,282,943 162,829 1.0% Source: U.S. Census Bureau, American Community Survey, 2005, American Community Survey, 2006, and American Community Survey, 2008-2012.
Union City Pedestrian and Bicycle Master Plan
Originally prepared in 2006 and updated in 2012, the Union City Pedestrian and Bicycle Master Plan provides for a citywide system of pedestrian and bicycle facilities and a variety of programs to allow for safe, efficient, and convenient walking and bicycling within the City. The goals and objectives for the Union City Pedestrian and Bicycle Master Plan are as follows:
Goal TR-C.1: To create an institutional framework that supports bicycle and pedestrian travel through policy development, city staff and committee actions, and capital project implementation
Goal TR-C.2: To develop a comprehensive signed bicycle route network composed of Class I (paved off-street paths and multi-use trails), Class II (bicycle lanes), and class III (shared-use roadways) facilities connecting all of Union City’s neighborhoods and adjacent communities
Goal TR-C.3: To develop Union City’s local trail system and integrate local trails with regional trail systems whenever possible
Goal TR-C.4: To create a continuous pedestrian network that meets ADA standards and allows pedestrians to safely and conveniently access parks and open space areas, transit centers, schools, shopping areas, public facilities, major employment centers, and other significant destinations
Goal TR-C.5: To develop educational and outreach materials and programs that promote safe bicycling and walking, particularly for children
Goal TR-C.6: To ensure bicycle and pedestrian improvement projects are considered for funding

Public Review Draft Background Report Page 7-28 June 2015
Regulatory Setting
Union City works with the regional and State agencies, such as the East Bay Regional Parks District, Alameda County Transportation Commission, the Metropolitan Transportation Commission, and Caltrans, to implement bikeway improvements and maintain the existing (2014) bikeway network. Major regulatory policies and regulations pertaining to bicycle facilities in Union City are summarized below.
State
California Streets and Highways Code. The California Streets and Highways Code (Section 890 to 894.2) is also known as the California Bicycle Transportation Act. This legislation adopted in 1994 establishes the responsibilities of State and local agencies with regard to bicycle safety, signage, traffic control, right-of-ways, and other matters related to non-motorized and particularly bicycle transportation. The California Bicycle Act establishes minimum efforts in data collection and planning that local governments must accomplish to remain compliant. The legislation seeks "to establish a bicycle transportation system designed and developed to achieve the functional commuting needs of the employee, student, business person, and shopper as the foremost consideration in route selection, to have the physical safety of the bicyclist and bicyclist's property as a major planning component, and to have the capacity to accommodate bicyclists of all ages and skills."
A city or county may complete a bicycle transportation plan pursuant to Section 891.2 in order for their project to be considered by the Department of Transportation for funding. Section 890.6 states “the Department, in cooperation with county and city governments, shall establish minimum safety design criteria for the planning and construction of bikeways and roadways where bicycle travel is permitted.” Section 890.8 states” the Department shall establish uniform specifications and symbols for signs, markers, and traffic control devices to designate bikeways, regulate traffic, improve safety and convenience for bicyclists, and alert pedestrians and motorists of the presence of bicyclists on bikeways and on roadways where bicycle travel is permitted.” Section 891 states, “All city, county, regional, and other local agencies responsible for the development or operation of bikeways or roadways where bicycle travel is permitted shall utilize all minimum safety design criteria and uniform specifications and symbols for signs, markers, and traffic control devices established pursuant to Sections 890.6 and 890.8.”
The State also maintains a State Transportation Fund allocation called the Bikeway Account. This fund is dedicated to construction and maintenance of bicycle facilities. Caltrans sets requirements for the bicycle master plan and requires an adopted plan to be eligible for State bicycle funding.
Complete Streets–Integrating the Transportation System: State Policy Directive–Caltrans. Effective March 6, 2001, Caltrans adopted a policy directive related to non-motorized travel that applies to State highways. The Deputy Directive 64 reads:
“The Department fully considers the needs of non-motorized travelers (including pedestrians, bicyclists, and persons with disabilities) in all programming, planning, maintenance, construction, operations, and project development activities and products.”1
1 California Department of Transportation. Deputy Directive DD-64, March 2001.

Transportation and Mobility Union City General Plan Update
Public Review Draft Background Report Page 7-29 June 2015
In support of this directive, Assembly Concurrent Resolution No. 211 (ACR 211, which became effective in August 2002, encourages local jurisdictions to implement the policies in DD-64 when constructing transportation projects. On October 2, 2008, Caltrans issued Deputy Directive DD-64-R1: ‘Complete Streets–Integrating the Transportation System’, which supersedes DD-64. DD-64-R1 reiterates the policy to provide for all travelers of all ages and abilities in all activities and products on the State highway system and recognizes bicycle, pedestrian, and transit modes as integral elements of the transportation system.
Regional
Metropolitan Transportation Commission. In 2006 the Metropolitan Transportation Commission (MTC) adopted a Complete Streets Policy that requires all projects funded with regional funds to consider accommodating bicycle and pedestrian facilities. The policy requires submittal of a Routine Accommodations checklist evaluating bicycle facility needs as part of the planning and design of each transportation project.
Alameda Countywide Bicycle Plan. The latest Alameda Countywide Bicycle Plan, adopted by the Alameda County Transportation Commission on October 25, 2012, identifies and prioritizes bicycle projects, programs, and planning efforts of countywide significance. The plan includes a “vision network” of 762 miles of bicycle facilities throughout the county providing connections between jurisdictions, access to transit, access to central business district, and other activity areas as well as “communities of concern.” The plan also includes priority programs to promote and support biking, and the creation and updating of local bicycle plans.
Key Terms
The following key terms used in this section are defined as follows:
Class I Bikeway (Bike Path). Typically called a “bike path” or “bike trail,” a Class I bikeway provides bicycle travel on a paved right-of-ways completely separated from any street or highway. Class I bike paths are generally desirable for recreational uses, particularly by families and children. Class I bike paths are preferred for corridors where there are few intersections or crossings, to reduce the potential for conflicts with motor vehicles. Class I facilities can also serve a transportation function where a continuous facility is provided for a long distance (e.g., greater than five miles) and provides a connection between a trip generator such as a residential district and a trip attractor such as an area of significant employment density.
Class II Bikeway (Bike Lane). Often referred to as a “bike lane,” a Class II bikeway provides a striped and stenciled lane for one-way travel on a street or highway. Class II bicycle lanes provide a designated, striped lane for bicyclists. When properly designed, bike lanes help improve the visibility of bicyclists. In general Class II bicycle lanes are highly desirable for bicycle commute routes, and any urban area where bicycle circulation is desired by local residents in order to access a variety of destinations such as shopping areas, educational centers, and other land uses.
Class III Bikeway (Bike Route). Generally referred to as a “bike route,” a Class III bikeway provides for shared use with pedestrian or motor vehicle traffic and is identified only by signing.
Public Review Draft Background Report Page 7-30 June 2015
References
Reports/Publications
Alameda County Transportation Commission. Alameda Countywide Bicycle Plan, October 25, 2012.
State of California. Update to the General Plan Guidelines: Complete Streets and the Circulation Element, December 15, 2010.
Union City Pedestrian and Bicycle Master Plan, January 2012.
Websites
State of California, Legislative Counsel. http://www.leginfo.ca.gov/pub/07-08/bill/asm/ab_1351-1400/ab_1358_bill_20080930_chaptered.pdf, January 2, 2013.
State of California, Legislative Counsel. http://www.leginfo.ca.gov/cgi-bin/displaycode?section =shc &group =00001-01000&file=890-894.2, January 2, 2013.
Union City Pedestrian and Bicycle Master Plan. http://www.ci.union-city.ca.us/home/showdocument?id=372, August 23, 2014.
U.S. Government Printing Office. http://www.gpo.gov/fdsys/pkg/BILLS-112hr1780ih/ pdf/BILLS-112hr1780ih.pdf, January 2, 2013.

Transportation and Mobility Union City General Plan Update
Public Review Draft Background Report Page 7-31 June 2015
SECTION 7.3 PEDESTRIAN FACILITIES
Introduction
Walking is the most basic form of transportation and is an important part of healthy and active lifestyles. In Union City, with its temperate climate, transit services, and urban development pattern with many activity centers, walking serves as both transportation and recreation. Basic pedestrian facilities include sidewalks, paths, and trails. This section describes the existing (2014) pedestrian facilities and summarizes information regarding facilities and programs for pedestrians in Union City.
Major Findings
The Pedestrian and Bicycle Master Plan (2012) specifically addresses the issue of pedestrian travel in the city.
The type and condition of sidewalks, crosswalks, and curb ramps vary throughout the city.
The Pedestrian and Bicycle Master Plan recommends several different types of pedestrian improvements including projects located within pedestrian improvement corridors, and neighborhood pedestrian safety improvement areas as well as projects that address sidewalk gap closures and community trail connection projects.
The City has installed several pedestrian improvements over the last several years to address safety concerns, implement its Safe Routes to School program, increase Americans with Disabilities Act handicap facilities, and improve the pedestrian environment.
The walk mode share for commute trips (1.2 percent) in Union City is below that of Alameda County and California; however, a portion of the public transit mode share may include walk access to bus stops, therefore, when all walk modes are combined, the walk share for the city could be comparable to that for statewide.
The Alameda Countywide Pedestrian Plan, prepared by the Alameda County Transportation Commission (Alameda CTC), identifies and prioritizes pedestrian projects, programs, and planning efforts of countywide significance. The projects planned in Union City include the following facilities.
Bay Trail (Class I multi-use trail);
Proposed sidewalk along Union City Boulevard from Smith Street to Lowry Road; and
East Bay Greenway trail along Mission Boulevarad and the future East-West Connector.
Regarding the Bay Trail and East Bay Greenway Trail, the final alignments have not been determined and are shown as conceptual in the Alameda County Pedestrian Plan.
Public Review Draft Background Report Page 7-32 June 2015
Existing Conditions
Pedestrian Facilities
In Union City the pedestrian facilities are comprised primarily of sidewalks and recreational trails as well as improvements such as pedestrian countdown timers, lighted crosswalks, and flashing signs located throughout the city. The type and condition of sidewalks varies by area in the city. Along the major roadways, such as Alvarado-Niles Road, sidewalks provide access along the roadway and crosswalks are marked at key signalized crossings.
Existing and Planned Facilities
The Union City Pedestrian and Bicycle Master Plan identifies Class I trails which provide excellent recreational opportunities for walking and biking. There is an established network of multi-use paths, which allow pedestrians to follow many of the city’s creeks as they run between numerous parks. The following paths and trails provide connections between the city’s parks. Some or parts of these Class I facilities were described in the previous section under Bikeways.
The existing and planned pedestrian network is shown on Figure 7-4. There is a Class I path that extends throughout much of Union City, but it consists of several discontinuous sections that follow existing flood control facilities. the trail extends 2.3 miles from Union City Boulevard to Casa Verde Park, 1.2 miles along Alameda Creek generally from I-880 to William Cann Memorial Park, 0.8 miles along Dry Creek from Alvarado-Niles Road to the UPRR tracks, 0.6 miles from Alameda Creek near Perry Road to Decoto Road, and 0.4 miles along Dry Creek from Whipple Road to Mission Boulevard.
Other Class I multi-use paths or trails are:
Depot Road Trail is a 0.2-mile Class I trail that extends from D Street to H Street
Arroyo Park Trail is a 0.1-mile Class I trail that extends from Perry Road to Osprey Drive
Mariner Park Trail is a 0.9-mile Class I trail that extends from Benson Road to Union City Boulevard
Figure 7-4 shows the locations of the Class I pedestrian trails and paths and the locations of the pedestrian improvement corridors, neighborhood pedestrian safety improvement areas, sidewalk gap closures, community trail connection projects, and pedestrian spot improvements.

SP Railroad
BART
Alam
eda C
reek
SP Railroad
Newark
City ofFremont
City ofHayward
Bay
land
s
Tamarack Dr
7Th St
Arizona St
10Th St
Perry
Fredi St
9Th St
Regents Bl
Railroad Av
H St
6Th St
Skylark
Jean Dr
Whipple Rd
DeborahDr
Cent
ral A
v
Sherm
an
r
5Th StCa
bello
St
Tidewater Dr
TorreyPine Ln
Appian Wy
Rock
linDr
13Th StSanta
Delores
Dr
Wes
tern
Av
Dowe
Av
8Th St
Pacific St
Atlantic St
Whipple Rd
Dyer S
t
Carmel Wy
San An
dreas
Dr
11Th St
Royal
Meridien
Niland S
t
Parkside Dr
Begonia St
Clover St
Lowry
Rd
Maria Dr
Palm Dr
Ci
Union City Bl
Ann Dr
Rd
Dr
Rd
Alvarado Bl
Mission Bl
Alvarado Niles Rd
Alvarado Bl
Mission Bl
Deco
to
Alvarado
Unio n
City
Bl
Deco
to Rd
Union
City
Bl
Niles Rd
D
Figure 7-4Existing and Planned Pedestrian Network
0 0.50.25
Miles
East-West Connector
Community Trail Connection
Neighborhood Pedestrian Safety Improvement Areas
Pedestrian Corridor Improvement Areas
Sidewalk Gap Closure
Proposed SF Bay Trail
Unpaved Trail
Paved Trail
Class I Bicycle and Pedestrian Path
Proposed Pedestrian Spot Improvements
City Limits

Public Review Draft Background Report Page 7-34 June 2015
This page is intentionally left blank.
Transportation and Mobility Union City General Plan Update
Public Review Draft Background Report Page 7-35 June 2015
Pedestrian Activity
The level of pedestrian activity is influenced by land use and urban design. People are more likely to walk in mixed-use communities with high population densities, diverse land uses, and transit-friendly design. Areas with high pedestrian activity in Union City, as identified in the Union City Pedestrian and Bicycle Plan, include:
Station District area;
City Hall, which includes such activity centers as James Logan High School, the Union City Library, the Ruggieri Senior Center, and the William Cann Civic Center Park;
Union Landing;
Four Corners (International Market Place) shopping area on the western side of the city; and
The shopping centers located at the intersection of Alvarado-Niles Road and Decoto Road
Other pedestrian activity centers include the Alvarado-Niles corridor, the Decoto Road corridor, the Whipple Road corridor, and the Historic Alvarado District.
City Pedestrian Improvement Programs / Projects
The City has implemented a five year plan that addresses all the sidewalks within the public right-of-ways. Each year the public works’ staff field inspect approximately 20 percent of the existing sidewalks to determine if any of these sidewalks need repairs, or replacement in order to eliminate tripping hazards. The City makes minor repairs such as shaving, or grinding the concrete to lower the tripping hazards, or filling in with asphalt concrete. However if the damage to the sidewalk cannot be readily fixed and replacement is needed, the City works with the impacted property owner to secure financing and to have the repairs completed. To date approximately 75 percent of the sidewalks in need of repair have been identified and fixed.
Union City installed a rectangular flashing beacon pedestrian activated crosswalk at the mid-block crosswalk on Smith Street near the post office. The City also installed one of these system at the intersection of San Carlos Way and Dyer Street. The City plans to install further enhancements to this pedestrian mid-block crosswalk (including a median island to eliminate left turn movements, enhanced street lighting and increasing the number of flashing beacons) to improve the safety of this crossing. The City is also installing a HAWK pedestrian activated system on Alvarado Niles Road between Decoto Road and Mann along with a pedestrian fence barrier in the median to prevent jaywalking in this area and improve pedestrian safety. . The City is improving six traffic signals (five along Alvarado Niles Road and a sixth at the intersection of Dyer and Alvarado Boulevard). The signals will be improved to eliminate the conflict between left turn traffic with pedestrian movements.
The City updated its American with Disabilities Act (“ADA”) Transition Plan in 2010. The plan is used by the City as a guide for making physical improvements that facilitate accessibility for persons with disabilities by removing obstructions and impediments from the public right-of-way. The plan identifies projects that improve mobility for people with disabilities. Several of these projects have been completed including the replacement of over 60 handicapped access ramps over the past 3 years with an additional 82 ramps planned for replacement in the Spring of 2015. In the future, handicapped access ramps will be upgraded as needed as part of the City’s yearly street maintenance projects.

Public Review Draft Background Report Page 7-36 June 2015
The City has also converted several traffic signals so that all of the City’s signals have pedestrian countdown timers. In addition the City will be installing several pedestrian activated beacon systems at mid- block crosswalks to provide additional safety measures.
Safe Routes to School
As part of the City’s commitment to the Safe Routes to School (SRS2) program, staff assesssed four schools in 2006 to determine what, if any, improvements were required to facilitate a safer environment for students walking and bicycling to school. These schools included: 1) Alvarado Elementary; 2) Alvarado Middle School; 3) Cabello Elementary; and 4) Barnard-White Middle School.
In 2010, four additional Union City schools were chosen to be included in the Safe Routes to School program. These schools included: Cesar Chavez Middle School, Kitiyama Elementary School, Pioneer Elementary School and Searles Elementary School. The City and the New Haven Unified School District worked with Transform through the Safe Routes to Schools Alameda County Partnership. These schools were selected because they each had active interest from school staff and parents, had safety issues or concerns that were known by City staff, and were recommended by School District officials for the program.
A field review was conductred at each school to confirm and evaluate identified concerns /problem areas including locations of frequent speeding, areas where vehicles ignored traffic controls, lack of sidewalks, crossing sight distance problems, and other issues related to roadway crossings. Based on these observations, the consultant team developed a set of recommendations to address the issues, which generally consisted of the installation of high visibility ladder-style crosswalks and installation of new safety signage. As of December 2011, the Public Works Department has completed the majority of the recommended improvements.
The remaining schools that need to be evaluated in the SR2S program include: Delaine Eastin Elementary School; Guy Emanuele Jr. Elementary School, and James Logan High School. An SR2S evaluation of these schools is a priority for the City and the District and will be completed as funding become available or through the Safe Routes to Schools Alameda County Partnership program.
Journey to Work
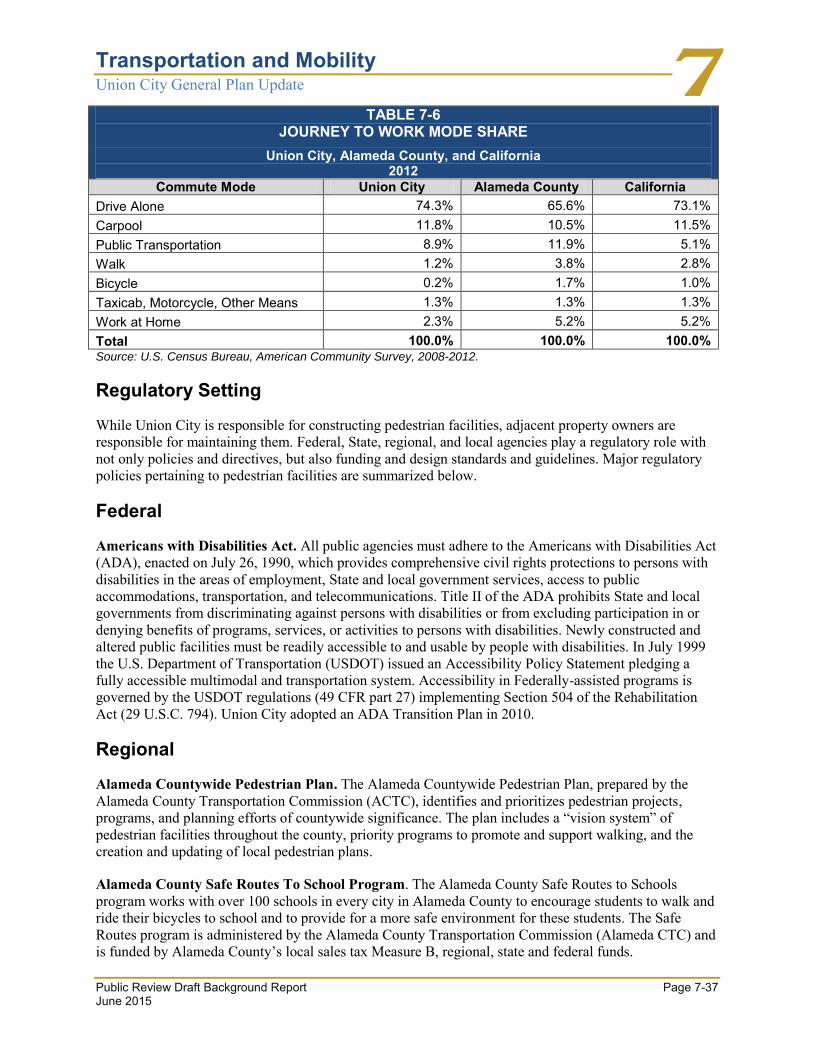
The 2008-2012 American Community Survey found that approximately 1.2 percent of Union City commuters walked to work, as shown in Table 7-6. When compared to the walk mode share for the state, the walk mode share in Union City is lower. However, if considering that a portion of the public transportation commute mode share includes walking to bus stops, the non-auto mode share in the city could be more comparable to the statewide average (2.8 percent). Table 7-6 also outlines commute mode patterns for Union City, Alameda County, and statewide. A higher percentage of Union City residents drive to work alone when compared to both Alameda County and California (74.3 percent compared to 65.6 and 73.1 percent, respectively). However, it is important to note that a larger percentage of Union City residents choose to carpool to work than both Alameda County and California (11.8 percent compared to 10.5 and 11.5 percent, respectively).
Transportation and Mobility Union City General Plan Update
Public Review Draft Background Report Page 7-37 June 2015
TABLE 7-6 JOURNEY TO WORK MODE SHARE
Union City, Alameda County, and California 2012
Commute Mode Union City Alameda County California Drive Alone 74.3% 65.6% 73.1% Carpool 11.8% 10.5% 11.5% Public Transportation 8.9% 11.9% 5.1% Walk 1.2% 3.8% 2.8% Bicycle 0.2% 1.7% 1.0% Taxicab, Motorcycle, Other Means 1.3% 1.3% 1.3% Work at Home 2.3% 5.2% 5.2% Total 100.0% 100.0% 100.0% Source: U.S. Census Bureau, American Community Survey, 2008-2012.
Regulatory Setting
While Union City is responsible for constructing pedestrian facilities, adjacent property owners are responsible for maintaining them. Federal, State, regional, and local agencies play a regulatory role with not only policies and directives, but also funding and design standards and guidelines. Major regulatory policies pertaining to pedestrian facilities are summarized below.
Federal
Americans with Disabilities Act. All public agencies must adhere to the Americans with Disabilities Act (ADA), enacted on July 26, 1990, which provides comprehensive civil rights protections to persons with disabilities in the areas of employment, State and local government services, access to public accommodations, transportation, and telecommunications. Title II of the ADA prohibits State and local governments from discriminating against persons with disabilities or from excluding participation in or denying benefits of programs, services, or activities to persons with disabilities. Newly constructed and altered public facilities must be readily accessible to and usable by people with disabilities. In July 1999 the U.S. Department of Transportation (USDOT) issued an Accessibility Policy Statement pledging a fully accessible multimodal and transportation system. Accessibility in Federally-assisted programs is governed by the USDOT regulations (49 CFR part 27) implementing Section 504 of the Rehabilitation Act (29 U.S.C. 794). Union City adopted an ADA Transition Plan in 2010.
Regional
Alameda Countywide Pedestrian Plan. The Alameda Countywide Pedestrian Plan, prepared by the Alameda County Transportation Commission (ACTC), identifies and prioritizes pedestrian projects, programs, and planning efforts of countywide significance. The plan includes a “vision system” of pedestrian facilities throughout the county, priority programs to promote and support walking, and the creation and updating of local pedestrian plans.
Alameda County Safe Routes To School Program. The Alameda County Safe Routes to Schools program works with over 100 schools in every city in Alameda County to encourage students to walk and ride their bicycles to school and to provide for a more safe environment for these students. The Safe Routes program is administered by the Alameda County Transportation Commission (Alameda CTC) and is funded by Alameda County’s local sales tax Measure B, regional, state and federal funds.

Public Review Draft Background Report Page 7-38 June 2015
Key Terms
The following key terms used in this section are defined as follows:
Crosswalk. Any portion of a roadway that connects the lateral lines of a sidewalk, or in the absence of sidewalks, the edges of a roadway. Crosswalks may or may not be marked.
Curb Ramp. A combined curb ramp and landing that creates a transition between sidewalks that are raised above roadway grade to the roadway. They are necessary for people using wheelchairs, scooters, and other mobility assistive devices but benefit all pedestrians.
Community Trail Connection. Community Trail Connection projects are defined as short Class I, sidewalk, or shared use facilities that provide a connection to a regional trail facility such as the proposed San Francisco Bay Trail or the existing Alameda Creek Regional Trail.
Mid-block Crossing. A designated crossing of a roadway for pedestrians that is not located at a roadway intersection. A mid-block crossing may or may not include treatments as such as pedestrian signals and advanced warning signs, but only exist if they are marked.
Neighborhood Pedestrian Safety Improvement Areas. Neighborhood Pedestrian Safety Improvement Areas are defined as street segments and intersections where specific facility upgrades are recommended to protect pedestrians from motor vehicle traffic. These areas relate to the Safe Routes to School projects, improved access to community facilities such as parks, and other neighborhood needs.
Pedestrian Improvement Corridors. Pedestrian Improvements Corridors are defined as major arterials and collector streets providing direct pedestrian access to transit, commercial centers and employments centers. The Pedestrian Improvement Corridors assume a need for significant pedestrian improvements to accommodate current and/or projected pedestrian traffic volumes and to provide for a desirable pedestrian experience.
Streets identified as Pedestrian Improvement Corridors generally have a minimum standard sidewalk and little pedestrian infrastructure or amenities, yet provide direct access to major pedestrian trip generators and attractors including access to public transit. Upgrade of these corridors will provide for more pedestrian-oriented infrastructure and amenities that will support other investments in areas such as the Station District.
Sidewalk Gap Closure. Sidewalk Gap Closures are defined as street segments where sidewalk facilities are inadequate or nonexistent. These areas are identified to promote universal pedestrian accessibility.

Transportation and Mobility Union City General Plan Update
Public Review Draft Background Report Page 7-39 June 2015
References
Reports/Publications
Alameda County Transportation Commission. Alameda Countywide Pedestrian Plan, October 25, 2012.
State of California. Update to the General Plan Guidelines: Complete Streets and the Circulation Element, December 15, 2010.
Union City Pedestrian and Bicycle Master Plan, January 2012
Websites
State of California, Legislative Counsel. http://www.leginfo.ca.gov/pub/07-08/bill/asm/ab_1351-1400/ab_1358_bill_20080930_chaptered.pdf, January 2, 2013.
State of California, Legislative Counsel. http://www.leginfo.ca.gov/cgi-bin/displaycode?section =shc &group =00001-01000&file=890-894.2, January 2, 2013.
Union City Pedestrian and Bicycle Master Plan. http://www.ci.union-city.ca.us/home/showdocument?id=372, August 23, 2014.
U.S. Government Printing Office. http://www.gpo.gov/fdsys/pkg/BILLS-112hr1780ih/ pdf/BILLS-112hr1780ih.pdf, January 2, 2013.
U.S. Census Bureau. http://factfinder2.census.gov/bkmk/table/1.0/en/ACS/11_5YR/DP03/ 1600000US0633000, January 8, 2013.
Alameda Countywide Pedestrian Plan. http://www.alamedactc.org/files/managed/Document/10094/ACTC_Ped_South_011013.pdf, November 29, 2014.

Public Review Draft Background Report Page 7-40 June 2015
SECTION 7.4 TRANSIT SERVICES
Introduction
Transit services in and near Union City include local and regional bus services, paratransit services, and rapid transit and regional rail services. These services are provided by a number of public and private transportation agencies and companies including Bay Area Rapid Transit (BART), Alameda-Contra Costa Transit District (AC Transit), Union City Transit (UC Transit), Dumbarton Express, and Google bus service. Passenger rail service on the Altamont Commuter Express (ACE) train and Capitol Corridor train is accessible at the Fremont Amtrak Station. Greyhound bus service is available in Hayward. These services are described in this section.
Major Findings
Union City is served by a number of transit services providing viable transit options to residents and visitors through a network of bus and rail systems.
Union City is directly served by BART and the Dumbarton Express via the Union City BART Station connecting Union City to four Bay Area counties (Alameda, Contra Costa, San Francisco, San Mateo).
AC Transit operates 11 bus routes connecting Union City to Oakland, San Francisco, and Fremont through direct and connecting services.
UC Transit provides nine local bus routes in Union City that connect neighborhoods to the Union City BART station, Union Landing, and other city centers.
Regional ADA (Americans with Disabilities Act) paratransit service is provided by East Bay Paratransit. East Bay Paratransit is a consortium of BART and AC Transit. Union City Paratransit provides ADA service within the City limits of Union City. Union City Paratransit also provides non-ADA service to nearby jurisdictions.
Union City has access to rail service via the Fremont Amtrak station located just south of Union City. Amtrak provides access to intercity train service via the Capitol Corridor route, which runs between Sacramento and San Jose, and provides connection to the national Amtrak network. The Altamont Commuter Express (ACE) also provides a rail connection at the Fremont Amtrak station.
AC Transit provides multiple bus connections to Amtrak and the ACE train via the Fremont Amtrak station.
Google bus service is a private service that provides employee buses between the Union City BART station and the Google campus in Mountain View.
The future Union City Intermodal Station is planned to serve as a regional rail intermodal station, providing access to BART, the Capitol Corridor, ACE, and future Dumbarton Rail.
Transportation and Mobility Union City General Plan Update
Public Review Draft Background Report Page 7-41 June 2015
Existing Conditions
A variety of transit services are available to Union City residents and visitors. These services are described in the sections that follow.
BART
The San Francisco Bay Area Rapid Transit District (BART) provides heavy-rail, regional transit service in four Bay Area counties, including Alameda, Contra Costa, San Francisco, and San Mateo via five lines. The Union City station is served by the Fremont-Richmond line and the Fremont-Daly City line. The Fremont-Richmond line provides service every 15 minutes during the weekday until 7:30 p.m. and every 20 minutes during weekday evenings and weekends. This train line runs until midnight every day, with weekday, Saturday, and Sunday service beginning at 4:00 a.m., 6:00 a.m., and 8:00 a.m., respectively. The Fremont-Daly City line provides service every 15 minutes during the weekday and every 20 minutes on Saturday. This train line runs until 6:00 p.m. every day, with weekday and Saturday service beginning at 5:00 a.m. and 9:00 a.m., respectively. Figure 7-5 shows the locations of the BART line and stations in the city. BART is planning to extend services south to the city of San Jose, east to the city of Livermore, and north to the city of Antioch.
Intercity Passenger Rail Service
Amtrak operates the Capitol Corridor service, an intercity passenger train system that provides rail service to 16 stations in 8 Northern California counties along a 170-mile rail corridor. The Capitol Corridor service is coordinated with other rail users–Amtrak, the Union Pacific Railroad, Caltrans, and the various agencies and communities that make up the Capitol Corridor.
Amtrak does not have a station in Union City, but residents, workers, and visitors have access to Amtrak via the Fremont Amtrak station (Centerville Station) located on Fremont Boulevard 2.5 miles south of the city. AC Transit provides bus service to the Fremont Amtrak station via line 99, line 210, and line U. Passengers of the Capitol Corridor boarding at the Fremont station may also transfer to Amtrak routes providing access to over 500 destinations in 46 states, including service to Canada. On weekdays train service is available from 7:00 a.m. to 8:00 p.m. with a frequency ranging every one to three hours. During weekends and holidays train service runs from 8:00 a.m. to 8:00 p.m. with a frequency ranging every one to three hours. Figure 7-5 shows the location of the Amtrak station and the rail line in the city.
The Altamont Commuter Express (ACE) provides weekday commuter service between Stockton and San Jose. There is no station in Union City, but ACE train service is provided in Fremont at the Centerville Station. AC Transit provides connection to the ACE service at the Fremont Amtrak station via line 99, line 210, and line U. There are four trains departing Stockton every morning and four trains departing San Jose every afternoon.
A passenger commuter rail station, referred to as the Intermodal Station, is planned adjacent to BART to serve Dumbarton Rail, Captol Corridor and ACE. The City is in the process of completing improvements to the existing BART station to provide a free pedestrian pass-through that will interface with the new station and the transit-oriented development to the east.
Public Review Draft Background Report Page 7-42 June 2015
This project has a total estimated cost of $231 million and is sponsored by Union City and Resolution 3434. With a projected 45 passenger trains a day, and the high-density development around the proposed station, the rail tracks will need to be elevated to eliminate conflicts with vehicles and pedestrians. Passenger rail improvements would be required from Industrial Parkway in Hayward to the Shinn Yards in Fremont to facilitate the project. These improvements will improve connectivity among transit providers (passenger rail, BART, and bus).
The “Capitol Corridor Intercity Rail Service Expansion Project” is a partially funded CWTP Tier 2 project with a total estimated cost of $579 million, sponsored by Capitol Corridor and Resolution 3434. The project would expand service between Oakland and San Jose. The project scope includes track improvements to increase service from 7 to 16 round trips on the UPRR and Caltrain-owned rail line that Capitol Corridor uses. Essentially, the project would extend all trains currently (2014) terminating at Oakland all the way to San Jose. The frequencies on the Oakland-to-San Jose segment would match the Sacramento-to-Oakland segment.
The Capitol Corridor Joint Powers Authority is also considering a proposal to relocate the Capitol Corridor trains from the existing Niles Subdivision to the Mulford/Coast Subdivision, which is located on the far west side of Union City, near the bay. Relocating the Capitol Corridor train service would the close of the Hayward Capitol Corridor Station and the Centerville Station in Fremont would only be served by the ACE train. Both of these areas are Priority Development Areas, and an elimination of passenger rail service would exclude the opportunity to connect to Union City’s Intermodal Station. The City Council of Union City has requested an evaluation of the impact of the potential station relocation from the Capitol Corridor Joint Powers Authority.
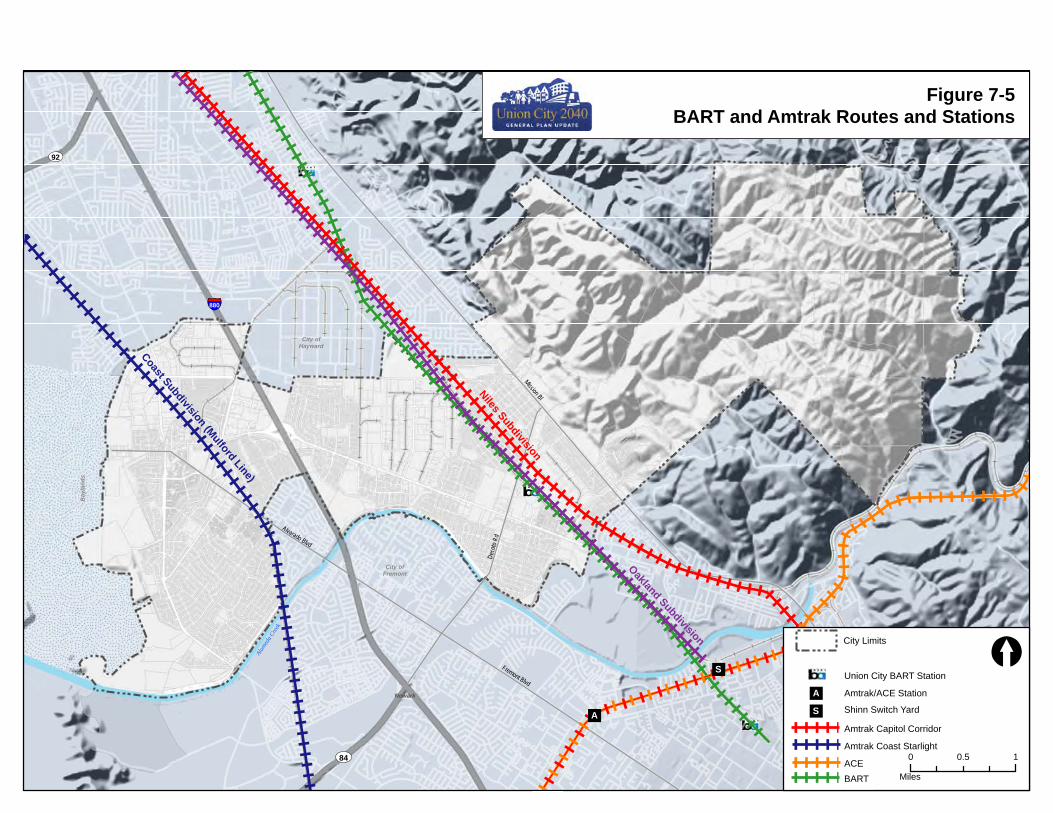
§̈¦880
UV92
Alam
eda C
reek
Newark
City ofFremont
City ofHayward
Bay
land
s
Mission Bl
Fremont Blvd
Alvarado Blvd
Deco
to Rd
UV84
Figure 7-5BART and Amtrak Routes and Stations
0 10.5
Miles
[
Source: Source, Date
City Limits
Amtrak Coast Starlight
ACE
Amtrak Capitol Corridor
Amtrak/ACE Station
Shinn Switch Yard
Union City BART Station
City Limits
Coast Subdivision (Mulford Line)
Niles Subdivision
Oakland Subdivision
A
SA
S
BART

Public Review Draft Background Report Page 7-44 June 2015
This page is intentionally left blank.
.
Transportation and Mobility Union City General Plan Update
Public Review Draft Background Report Page 7-45 June 2015
Local and Regional Bus Service
Alameda-Contra Costa Transit District (AC) Transit operates 11 bus routes in Union City including local, all-nighter, and Transbay services. Route 801, a part of the All-Nighter regional bus network, provides after-hours service with timed connections north to Oakland and south to Fremont. Routes U and SB are Transbay routes connecting the East Bay to San Francisco and the Peninsula. Other routes provide direct and connecting services in Alameda County. Union City Transit provides nine local bus routes in Union City, connecting neighborhoods to the Union City BART station, Union Landing, and other city centers.
Dumbarton Express is a regional public transit service connecting Alameda, San Mateo, and Santa Clara Counties via the Dumbarton Bridge. The Dumbarton Express service consists of two bus lines, the DB and DB1 that provide service between the Union City BART station and the Stanford area and Palo Alto Caltrain station. During the week, service on both lines is from approximately 5:30 AM to 8:45 PM with buses about every 20 minutes during peak travel periods.
Google bus service is private service that provides employee buses between the Union City BART station and the Google campus in Mountain View.
Line routes and service frequencies are shown in Table 7-7. Figure 7-6 displays a map of AC Transit’s bus system serving Union City. Figure 7-7 displays a map of Union City Transit’s bus system serving Union City. Most bus stops in Union City are indicated by free standing poles with signs indicating the bus route number. Some stops (e.g., those at the BART station) include other amenities, such as shelters, benches, and bus route maps.

Public Review Draft Background Report Page 7-46 June 2015
TABLE 7-7 AC TRANSIT AND UNION CITY TRANSIT BUSES SERVING UNION CITY
Union City Route No. Termini Frequency AC Transit 85 San Leandro BART to Union Landing Transit Center 60 min 97 Bayfair BART to Union City BART 20 min 99 Bayfair BART to Fremont BART, via Union City BART 20 min 200 Union City BART to Fremont BART 30 min 210 Ohlone College to Union Landing Shopping Center 30 min 216 Ohlone College (Newark Campus) to Union City BART 60 min 232 Fremont BART to Union City BART 60 min 275 Union City BART to Four Corners Shopping Center 45 min 801 Downtown Oakland to Fremont BART, via Union City BART (all-nighter) 60 min SB Fremont to San Francisco, via Union City Blvd 20-30 min* U Fremont BART to Stanford University, via Decoto Road 30-60 min* Union City Transit 1 Delores line: Union City BART round trip via Dyer and Union Landing 60 min 2 Whipple line: Union City BART to Union Landing via Whipple 60 min 3 Almaden line: Union City BART to Union Landing via Central and Tropics 60 min 4 Tamarack line: Union City BART to Union Landing via Calaveras Landing
and Mission 30-60min
5 Dyer line: Union City BART to Union Landing via Dyer 60 min 6 Central line: Union City BART to East Plaza via Whipple and Alvarado-Niles 60 min** 7 Alvarado Circulator line: Union Landing round trip via Calaveras Landing and
Union City Blvd 60 min
8 Alvarado-Niles line: Union City BART round trip via Alvarado-Niles and Union Landing
30-60 min
9 Dyer Express line: Union City Blvd & Rocklin to Union City BART via Union Landing and Alvarado-Niles
45 min***
Note: *Service provided weekdays in peak direction only–inbound to SF in a.m. and outbound from SF in p.m.; inbound to Stanford in a.m. and outbound from Stanford in p.m. **Weekday service includes two departures in a.m. and three departures in p.m. peak hours. ***Weekday service includes three departures in a.m.. and four departures in p.m. peak hours. Source: Alameda-Contra Costa Transit District (accessed August 22, 2014, http://www.actransit.org), 2014. Union City Transit (accessed September 2, 2014, http://www.ci.union-city.ca.us/departments/transit-340), 2014.
Transportation and Mobility Union City General Plan Update
Public Review Draft Background Report Page 7-47 June 2015
Paratransit Service
AC Transit and BART, as fixed-route operators, are federally-mandated by the ADA to provide complementery paratransit services that mirror the fixed-route bus/rail services that they offer. East Bay Paratransit is a service of both AC Transit and BART. They provide all regional ADA paratransit trips. Union City offers Union City Paratransit within the City Limits of Union City, which provides services required under the Americans with Disabilities Act (ADA). Services are partially funded by the Measure B sales tax of Alameda County. Union City Paratransit also offers an additional service known as Paratransit Plus, which offers limited service to southern Hayward and northern Fremont and Newark.
There also exist privately-operated non-ADA-required paratransit services. These programs are operated by non-transit operators, and do not need to follow any federal guidelines. Examples are paratransit van shuttle services operated by senior centers or communities. They can charge any fare they want, make up their own service hours, and can place age restrictions.
Taxi Service
Union City is served by an abundance of taxicab companies including Uber and Lyft, which is a ride sharing service that uses a smart phone application to connect drivers to users. Taxis can be used as a principal source of commute or as a means of transfer between intermediate stops and destinations. They can be pre-booked or hired on the spot. Their multiple uses and means of access make them very versatile and convenient but they are more expensive than other alternatives such as using public transit, bicycling, or walking. This is reflected in the very low mode share of 1.3 percent indicated previously in Table 7-1.
Long Distance Bus Service
Greyhound Lines, Inc. is an intercity, long-distance bus service offering services in over 3,700 destinations in the United States, Canada, and Mexico. Greyhound does not have a station in Union City. However, Greyhound operates five buses (northbound and southbound) from its Hayward station on B Street near the Hayward BART station.

Public Review Draft Background Report Page 7-48 June 2015
This page is intentionally left blank.
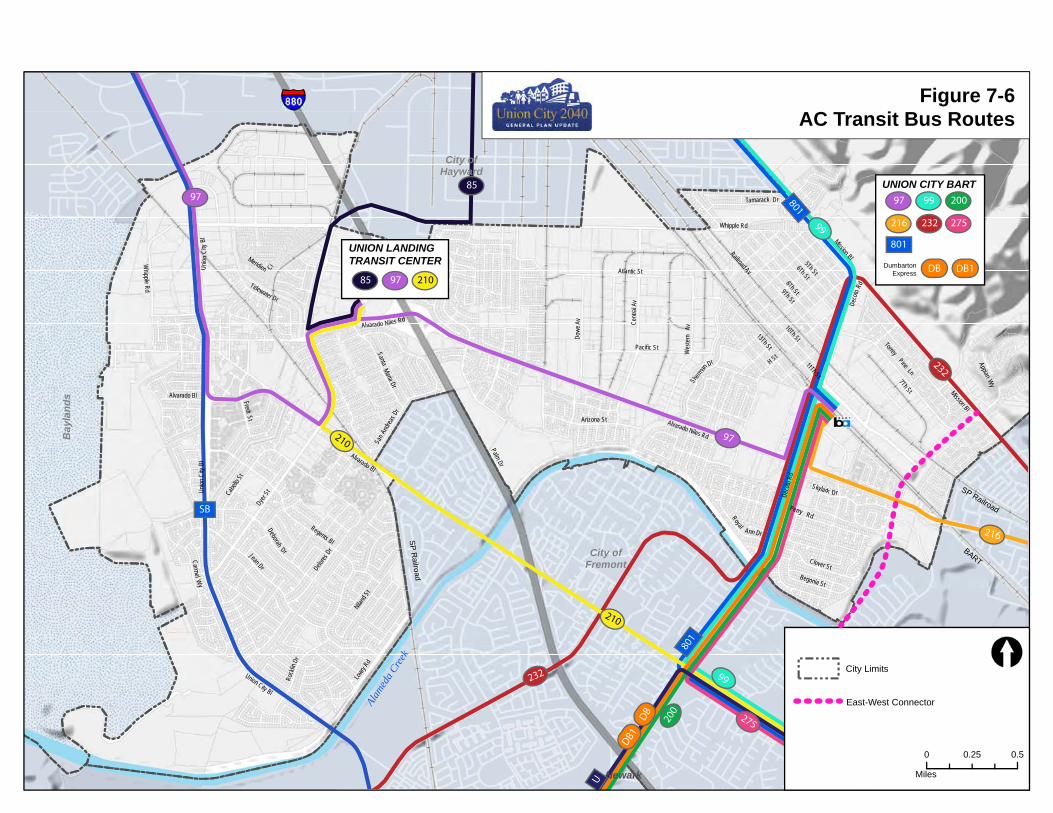
SP Railroad
BART
232
216
801
99
97
85
SB
210
210
801
99232200
97
U
DB
DB1
275
Alam
eda C
reek
SP Railroad
Newark
City ofFremont
City ofHayward
Bay
land
s
Tamarack Dr
7Th St
Arizona St
10Th St
Perry
Fredi St
9Th St
Regents Bl
Railroad Av
H St
6Th St
Skylark
Jean Dr
Whipple Rd
DeborahDr
Cent
ral A
v
Sherm
an
r
5Th StCa
bello
St
Tidewater Dr
TorreyPine Ln
Appian Wy
Rock
linDr
13Th StSanta
Delores
Dr
Wes
tern
Av
Dowe
Av
8Th St
Pacific St
D
Atlantic St
Whipple Rd
Dyer S
t
Carmel Wy
San An
dreas
Dr
11Th St
Royal
Meridien
Niland S
t
Parkside Dr
Begonia St
Clover St
Lowry
Rd
Maria Dr
Palm Dr
Ci
Union City Bl
Ann Dr
Rd
Dr
Rd
Alvarado Bl
Mission Bl
Alvarado Niles Rd
Alvarado Bl
Mission Bl
Deco
to
Alvarado
Unio n
City
Bl
Deco
to Rd
Union
City
Bl
Niles Rd
Figure 7-6AC Transit Bus Routes
0 0.50.25
Miles
City Limits
East-West Connector
97
801
99 200
216 232 275
DB1DB
UNION CITY BART
DumbartonExpress
85 97 210
UNION LANDINGTRANSIT CENTER

Public Review Draft Background Report Page 7-50 June 2015
This page is intentionally left blank.
.
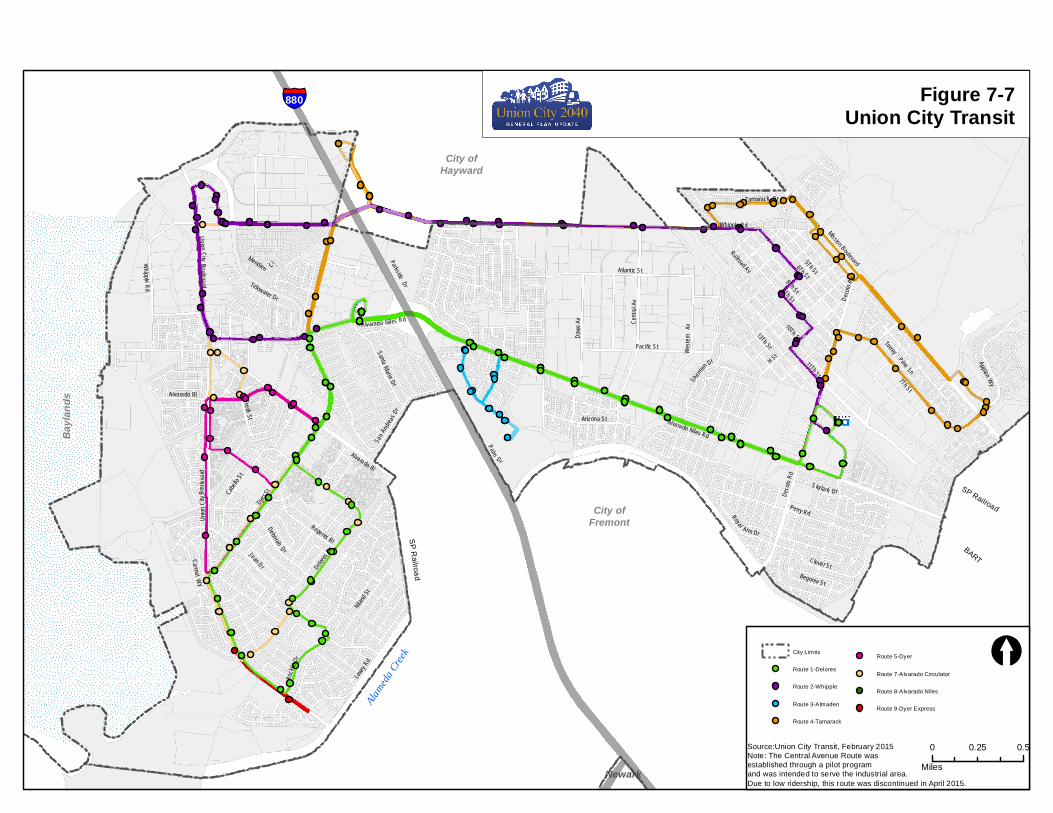
SP Railroad
BART
SP R
ailroad
§̈¦880
Alam
eda C
reek
Newark
City ofFremont
City ofHayward
Bay
land
s
Tamarack Dr
7Th St
Arizona St
10Th St
Perry Rd
Fredi St
9Th St
Regents Bl
Railroad Av
H St
6Th St
Skylark Dr
Jean Dr
Whipple Rd
Deborah
Dr
Cent
ral A
v
Sherm
an
Dr
5Th StCab
ello S
t
Tidewater Dr
TorreyPine Ln
Appian Wy
Rock
linDr
13Th StSantaMari a
Dr
Delores
Dr
Wes
tern
Av
Dowe
Av
8Th St
Pacific St
Atlant ic St
Whipple Rd
Dyer S
t
Car m elWy
San An
dreas
Dr
11Th St
Royal Ann Dr
Merid ien Ci
Niland S
t
Parkside Dr
Begonia St
Palm
Dr
Clover St
Lowry
Rd
Alvarado Bl
Mission Boulevard
Alvarado Niles Rd
Alvarado Bl
Deco
toRd
Alvarado Niles Rd
Unio nCity
Bou levard
Deco
to R
d
Union
City
Bou le
vard
Figure 7-7Union City Transit
0 0.50.25
Miles
[
Source:Union City Transit, February 2015Note: The Central Avenue Route wasestablished through a pilot programand was intended to serve the industrial area.Due to low ridership, this route was discontinued in April 2015.
City Limits
Route 1-Delores
Route 2-Whipple
Route 3-Almaden
Route 4-Tamarack
Route 5-Dyer
Route 7-Alvarado Circulator
Route 8-Alvarado Niles
Route 9-Dyer Express

Public Review Draft Background Report Page 7-52 June 2015
This page is intentionally left blank.

Transportation and Mobility Union City General Plan Update
Public Review Draft Background Report Page 7-53 June 2015
Regulatory Setting
Public transportation facilities are planned, funded, installed, and maintained under an integrated regulatory framework. Federal, State, and local dollars contribute to capital and operational costs, and those dollars are made available contingent upon certain requirements.
Regional
Measure B and Measure BB. Measure B is a half-cent transportation sales tax approved by Alameda County residents in 2000. Administered by Alameda CTC, it funds transportation improvements and services that address regional priorities set forth in the Alameda County 20-year Transportation Expenditure Plan. The plan includes funding for highway and transit projects that directly affect travel patterns in Union City by improving conditions on adjacent freeways and highways, including improvements associated with the future Union City Intermodal station. In November 2014, voters extended the sales tax measure that was set to expire in 2022, through approval of Measure BB, which also doubled the transportation sales tax to a full one percent. This sales tax measure is set to expire in 2045.
Resolution 3434. As part of the 2001 update to the Regional Transportation Plan (RTP), MTC developed a Regional Transit Expansion Program. Adopted as Resolution No. 3434, the new program is a successor to MTC Resolution No. 1876 adopted in 1988, a multiyear rail expansion program that has delivered new BART service to Dublin and Bay Point in the East Bay, the Tasman light-rail extension in Silicon Valley, and the BART extension to the San Francisco International Airport. Resolution 3434, as adopted, includes 19 bus, rail, and ferry projects totaling roughly $10.5 billion.
Key Terms
The following key terms used in this section are defined as follows:
Heavy-Rail Rapid Transit. The American Public Transportation Association defines a heavy-rail system as an electric railway with the capacity to handle a heavy volume of traffic. The term is often used to distinguish it from light-rail systems, which usually handle a smaller volume of passengers. Heavy-rail refers to high-speed, passenger rail cars running in separate right-of-ways from which all other vehicular and foot traffic are excluded.

Public Review Draft Background Report Page 7-54 June 2015
References
Websites
Alameda-Contra Costa Transit District. http://www.actransit.org/, November 30, 2012.
Alameda Countywide Transportation Plan. http://www.alamedactc.org/files/managed/Document/8043/ALAMEDA_CWTP_FINAL.pdf, October 14, 2014.
Amtrak. http://en.wikipedia.org/wiki/Amtrak, December 4, 2012.
Capitol Corridor Joint Powers Authority. http://www.capitolcorridor.org/, December 4, 2012.
Greyhound. https://www.greyhound.com/farefinder/step2.aspx, December 4, 2012.
Union City. http://www.ci.union-city.ca.us, August 26, 2014.
Union City Transit. http://www.ci.union-city.ca.us/departments/transit-340, September 2, 2014.

Transportation and Mobility Union City General Plan Update
Public Review Draft Background Report Page 7-55 June 2015
SECTION 7.5 GOODS MOVEMENT
Introduction
Goods movement in Union City is provided primarily by trucks using Interstate and State highways to deliver goods from the Port of Oakland to city residences and businesses. The trucking system is supplemented by railroad networks. Each of the networks is described as it relates to freight transport in the city.
Major Findings
The city has designated truck routes, which include freeways, State Routes, and other major city roadways.
I-880 is a National Network truck route per the STAA (Surface Transportation Assistance Act) and SR 238 is a Terminal Access truck route, per the STAA, within Union City.
Existing Conditions
Trucking
Union City has designated a truck route system made up of freeways, State routes, and other major streets within the city roadway network. Table 7-8 and Figure 7-8 identify roads included in Union City’s truck route system, including: I-880, SR 238 (Mission Boulevard), Union City Boulevard, Whipple Road (portion), Decoto Road, Central Avenue, and Alvarado Boulevard (portion). A portion of Alvarado-Niles Road, locaed between the 1-880 freeway and Central Avenue is also a designated truck route. However, General Plan Policy TR-A.1.6 requires all new projects in the Central Technology Center to useWhipple Road as a truck route and for the City to discourage the use of Alvarado-Niles Road as a truck route for existing businesses located in the Central Technology Center. Table 7-8 also shows the average weekday truck percentage of daily traffic on State roadways within Union City.
Table 7-8 Truck Traffic Volumes on State Highways
Union City
Roadway Segment Post Mile Daily Trucks
Annual Average Daily Traffic
(AADT) Truck % Mission Blvd (SR 238) at Decoto Road
6.78 760 21,700 3.5%
I-880 at Whipple Road
13.66 10,780 196,000 5.5%
I-880 at Industrial Pkwy
14.53 12,331 209,000 5.9%
Source: Department of Transportation, State of California. 2012 Annual Average Daily Truck Traffic on the California
State Highway System.

Public Review Draft Background Report Page 7-56 June 2015
Rail Lines
In California the Union Pacific (UP) has 3,267 miles of track and serves the Central Valley, Port of Oakland, San Francisco Bay Area, and the Los Angeles metropolitan area. The UP has three rail lines that run through Union City including the Coast Subdivision, Niles Subdivision, and Oakland Subdivision.
The UP’s Coast Subdivision (Mulford Line) line runs between the Bay and I-880 through the entire length of Union City. The line serves freight as well as the Amtrak Coast Starlight long-distance passenger train. Along the Mulford Line, there are five at-grade crossings at Alvarado Boulevard, Dyer Street, Smith Street, Union City Boulevard, and Whipple Road.
The UP’s Niles Subdivision line runs from West Oakland to Newark serving freight as well as Amtrak Capitol Corridor passenger service. The Niles line runs through the City paralleling 11th Street, Depot Road, and Railroad Avenue with at-grade crossings at Whipple Road, H Street, E Street, and Decoto Road.
The UP’s Oakland Subdivision, which runs through Union City along the BART right-of-ways, is lightly used. Approximately one train a week uses the Oakland Subdivision line in Union City.
See Section 7.6, Railways, for a detailed overview of rail facilities within Union City.
Regulatory Setting
Union City has designated routes for truck traffic to address traffic operations and safety concerns. The City has adopted truck route regulations in the City’s Municipal Code.
Federal
Surface Transportation Assistance Act. The Federal Surface Transportation Assistance Act passed in 1982 allows large trucks to operate on the interstate and certain primary routes collectively called the National Network. These routes, referred to as STAA routes, provide larger turning radius than most local roads can accommodate. Truck routes designated by Union City meet these standards.
State
California Department of Transportation. The California Department of Transportation designated I-880 as National Network (for STAA trucks) and SR 238 as Terminal Access (for STAA trucks) in the California Truck Network.
California Public Utility Commission. The California Public Utility Commission (CPUC) is the State agency responsible for regulating railroad, rail transit, and passenger transportation companies in California. It strives to ensure safety at railroad crossings.

Transportation and Mobility Union City General Plan Update
Public Review Draft Background Report Page 7-57 June 2015
Local
Union City Municipal Code. The Union City Municipal Code Chapter 10.40 Section 10.40.040 states that “Whenever any resolution of this City designates and describes any street or portion thereof as a street the use of which is permitted by any vehicle exceeding a maximum gross weight limit of three (3) tons, the City Traffic Engineer is authorized to designate such street or streets by appropriate signs as Truck Traffic Routes for the movement of vehicles exceeding a maximum gross weight limit of three (3) tons.”
Key Terms
None.
References
Reports/Publications
California Department of Transportation, Division of Mass Transportation. Transportation Development Act Statutes and California Codes of Regulations, March 2009.
Websites
California, Department of Transportation. http://www.dot.ca.gov/hq/traffops/engineering/trucks/truckmap/truckmap-d04.pdf, August 26, 2014.
Union City Truck Route Map. http://www.unioncity.org/departments/police-department/online-services/truck-routes/truck-route-map.

Public Review Draft Background Report Page 7-58 June 2015
This page is intentionally left blank.
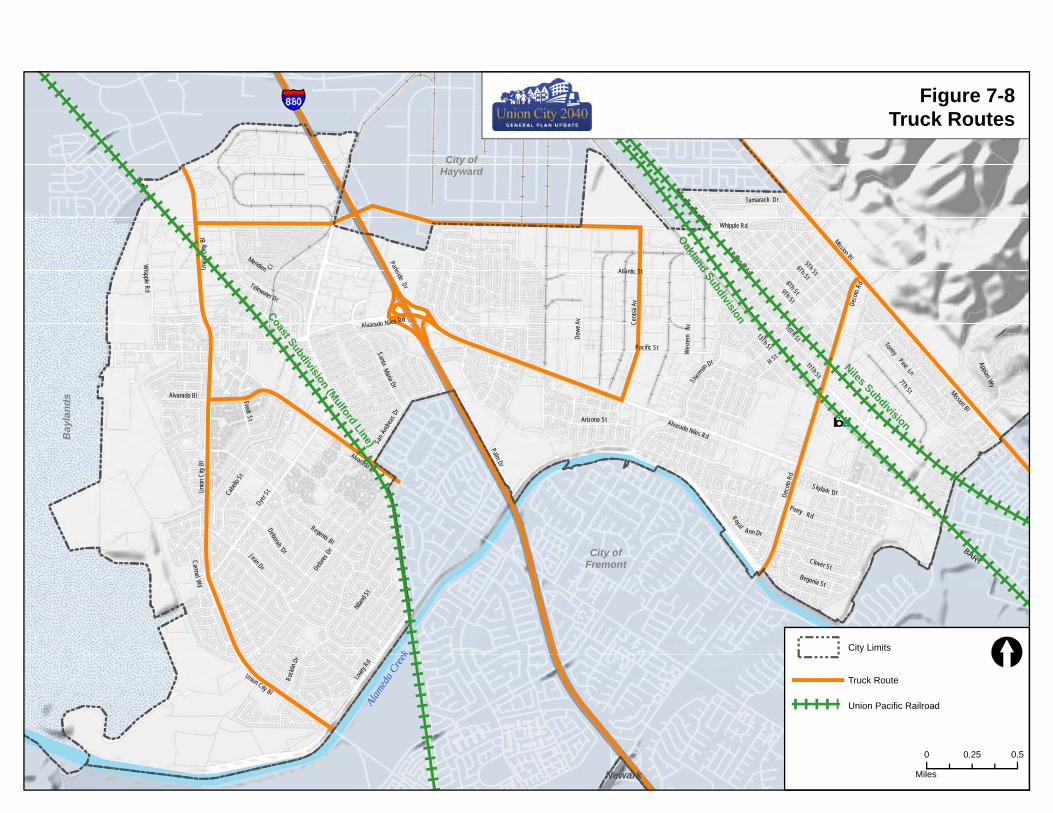
BART
Alam
eda C
reek
Newark
City ofFremont
City ofHayward
Bay
land
s
Tamarack Dr
7Th St
Arizona St
10Th St
Perry
Fredi St
9Th St
Regents Bl
Railroad Av
H St
6Th St
Skylark
Jean Dr
Whipple Rd
DeborahDr
Cent
ral A
v
Sherm
an
r
5Th StCa
bello
St
Tidewater Dr
TorreyPine Ln
Appian Wy
Rock
linDr
13Th StSanta
Delores
Dr
Wes
tern
Av
Dowe
Av
8Th St
Pacific St
D
Atlantic St
Whipple Rd
Dyer S
t
Carmel Wy
San An
dreas
Dr
11Th St
Royal
Meridien
Niland S
t
Parkside Dr
Begonia St
Clover St
Lowry
Rd
Maria Dr
Palm Dr
Ci
Union City Bl
Ann Dr
Rd
Dr
Rd
Alvarado Bl
Mission Bl
Alvarado Niles Rd
Alvarado Bl
Mission Bl
Deco
to
Alvarado
Unio n
City
Bl
Deco
to Rd
Union
City
Bl
Niles Rd
Figure 7-8Truck Routes
0 0.50.25
Miles
City Limits
Truck Route
Coast Subdivision (Mulford Line)
Niles Subdivision
Oakland Subdivision
Union Pacific Railroad

Public Review Draft Background Report Page 7-60 June 2015
This page is intentionally left blank.

Transportation and Mobility Union City General Plan Update
Public Review Draft Background Report Page 7-61 June 2015
SECTION 7.6 RAILWAYS
Introduction
This section summarizes the rail facilities and railroads operating in Union City.
Major Findings
Union City has three rail lines that pass through the city: the Coast Subdivision, the Niles Subdivision and the Oakland Subdivision. All are operated by Union Pacific.
Bay Area Rapid Transit District operates the Bay Area Rapid Transit railway that is fully grade separated through Union City.
The rail lines that intersect Union City generally run north to south and are located on both the east and west sides of the city.
Streets in Union City with the highest volume of daily train crossings include: Decoto Road, Union City Boulevard, Whipple Road, Smith Street, Alvarado Boulevard, and several lettered streets near the Decoto neighborhood including E, F, H, and I.
Existing Conditions
Union City has several rail lines that pass through the city (see Figure 7-9). Union Pacific operates all of these facilities, which were previously owned by the Southern Pacific Railroad and the Western Pacific Railroad. Founded in 1865, Southern Pacific was created as a rail line from San Francisco to San Diego. By 1868 it had extended to New Orleans. In 1996 Southern Pacific merged with Union Pacific. Western Pacific was founded in 1903 and was one of the most popular railroads heading west from 1910 until merging with Union Pacific Railroad. Western Pacific was acquired by Union Pacific on December 1982. Currently (2014), there are at-grade crossings at Alvarado Boulevard, Dyer Street, Smith Street, Union City Boulevard, Whipple Road, H Street, E Street, and Decoto Road. The three subdivision rail lines intersecting Union City include the Oakland Subdivision, Niles Subdivision, and the Coast Subdivision.
Within Union City, spur lines are located within the Central Bay Technology Center generally bounded by Whipple Road to the North, Atlantic Street to the east, Alvarado-Niles Road to the south that connect to the Oakland Subdivision. Spurs also run along the westerly boundary of the business park along the boundary with the Town Estates residential neighborhood. These spurs extend into the business park located along Huntwood Way in Hayward. Additional spurs extend along a portion of the Alvarado Business Park near Ahern Avenue and Volpey Way. A spur line also crosses Whipple Road near the Dyer Street intersection to provide service to the Calaveras cement plant. It is unclear how many of these spurs are currently in use. For information on the movement of goods via railways passing through Union City, see Section 7.5 Goods Movement.
Additionally, Bay Area Rapid Transit (BART) operates a heavy-rail public transit and subway system, which includes a stop in Union City. BART serves four Bay Area counties, including Alameda, Contra Costa, San Francisco, and San Mateo via five rail lines. The Union City station is served by the Fremont-Richmond line and the Fremont-Daly City line. For information on the BART public transit system, see Section 7.4 Transit Services.
Public Review Draft Background Report Page 7-62 June 2015
Union City Intermodal Station
In 2002 Union City incorporated the Intermodal Station District and Transit Facility Plan into the General Plan (Appendix C). This plan, adopted in February 2002, incorporated an expansion of the existing Union City BART Station into an Intermodal Station planned to accommodate BART, passenger rail (e.g., Amtrak Capital Corridor, ACE, and Dumbarton Rail), and bus (AC Transit and UC Transit). Since its adoption, Union City has invested more than $167 million in redevelopment funds and grants to assemble land, build affordable housing and public infrastructure, and improved passenger capacity and circulation for BART. BART owns some of the right-of-ways it occupies while some segments are operated via a joint-use agreement with Union Pacific Railroad.
Union Pacific Railroad: Amtrak–Capital Corridor
The Capital Corridor is a State-funded Amtrak intercity passenger train system that operates trains running on tracks through Union City. The route begins in the city of Auburn near Sacramento, travels through Union City and ends at the San Jose/Diridon Station near downtown San Jose. The Capital Corridor stops in Hayward and Fremont but there is no designated train stop for the Capital Corridor train in Union City. Over 3,500 passengers ride the Capital Corridor train daily. The Capital Corridor Joint Powers Authority (CCJPA) is the governing body of the Amtrak Capital Corridor Service; however, Union Pacific Railroad owns the railroad line. The CCJPA is considering double-tracking the Mulford Line and bypassing the existing Hayward and Fremont stations to accommodate an increase in capacity and headway times.
Union Pacific Railroad: Oakland Subdivision
The Oakland Subdivision railway was the westernmost route of the Western Pacific Railroad before it was acquired by Union Pacific Railroad. The portion of the Oakland Subdivision between Union City and Oakland was relegated to industrial spur status after Union Pacific Railroad merged with Southern Pacific and Union Pacific Railroad chose to operate on Southern Pacific’s parallel route, the Mulford Line, instead of the Oakland Subdivision. Today, the line is lightly used. Union Pacific still provides service to a few industrial customers on the line, mainly using the industrial spurs. Union Pacific Railroad owns, operates, and maintains the existing freight rail operation on the Union Pacific Railroad Oakland Subdivision.
The Alameda County Pedestrian Plan identifies a proposed Class 1 Trail, referred to as the Eastbay Greenway, that extends from Oakland to Hayward within the Oakland Subdivision right-of-way. Within South Hayward, the alignment switches to Mission Boulevard and connects to the future East-West Connector to allow for future use of the portion of the Oakland Subdivision through Union City for passenger rail.
Existing Rail Crossings
Table 7-9 below outlines the number of trains moving through railways within Union City. Most notably, the cross streets of E Street near the Decoto neighborhood and Smith Street in the Historic Alvarado District are the areas which experience the highest volume of daily train movements. The cross streets with the highest volume of daily train movements are also major roads in Union City, including Decoto

Transportation and Mobility Union City General Plan Update
Public Review Draft Background Report Page 7-63 June 2015
Road, Union City Boulevard, Whipple Road, Smith Street, Alvarado Boulevard, and several lettered streets near the Decoto neighborhood.
TABLE 7-9 RAILROAD CROSSING INVENTORY INFORMATION1
Union City 2014
Crossing Number Railroad Operator Cross Street Daily Train
Movements 749776K Union Pacific RR Whipple Road 14 749779F Union Pacific RR;
Amtrak, BNSF E Street 28
749780A Union Pacific RR H Street 18 749781G Union Pacific RR Decoto Road 20 749916K Union Pacific RR;
Amtrak Union City Blvd. 17
749923V Union Pacific RR Whipple Road 4 749927X Union Pacific RR;
Amtrak Smith Street 23
749928E Union Pacific RR; Amtrak
Dyer Street 13
749929L Union Pacific RR; Amtrak
Alvarado Boulevard 13
750248F Union Pacific RR Seventh Street 2 751989V Union Pacific RR Zwissig Way 0 751994S Union Pacific RR Tidewater Drive 4 834195U Union Pacific RR Atlantic Street 4 834194M Union Pacific RR Atlantic Street 4 834186V Union Pacific RR Decoto Road-Central Avenue 13 834193F Union Pacific RR Atlantic Street 4 834192Y Union Pacific RR Central Avenue 4 834191S Union Pacific RR Whipple Road 0 834190K Union Pacific RR Whipple Road 15 834189R Union Pacific RR F Street 13 834188J Union Pacific RR H Street 13 834187C Union Pacific RR I Street 13 834196B Union Pacific RR Pacific Street 0 834197H Union Pacific RR Pacific Street 0 834198P Union Pacific RR Pacific Street 4 834199W Union Pacific RR Pacific Street 0 834200N Union Pacific RR Lewis Avenue 4 Total – – 247 1 Data as of November 24, 2014. Source: U.S. Department of Transportation, Federal Railway Administration, Office of Safety Analysis. http://safetydata.fra.dot.gov/OfficeofSafety/PublicSite/Crossing/Xingqryloc.aspx. November 2014.
Public Review Draft Background Report Page 7-64 June 2015
Proposed Dumbarton Rail Project
The Dumbarton Rail Bridge was built in 1910 by a subsidiary of Southern Pacific Railroad, and was the first bridge to be built across the San Francisco Bay. The line primarily carried freight trains, but from 1912 to 1918 it was used to provide a trans-bay passenger service. In 1982 use of the rail bridge was discontinued; however, in 1991 the San Mateo County Transportation Authority issued a Dumbarton Commuter Service Feasibility Study to analyze the potential of rehabilitating the railway. Several rail corridor studies followed, and in 2004 a group of regional leaders formed the Dumbarton Rail Corridor Policy Advisory Committee to move the project of rehabilitating the railway forward.
The most recent proposed Dumbarton Rail project would function as a connector to the current Caltrain system and serve the increasing cross-bay travel market. Additionally, the project also involves repairing and upgrading damaged rail bridges and tracks spanning the bay between Redwood City and Newark. The rail system is proposed to commence at the future Union City Intermodal Station. The project has undergone environmental evaluation, and more recently suffered a number of setbacks due to insufficient funding. The Dumbarton Rail Policy Advisory Committee is reorganizing and perservering to rescope the project to make it phaseable.
Regulatory Setting
California Public Utilities Commission. The California Public Utilities Commission (CPUC) is the State agency that regulates privately-owned railroad, rail transit, and passenger transportation companies.
Key Terms
The following key terms used in this chapter are defined as follows:
Easement. A right to use another’s property for a specific purpose.
Rail Right-of-ways. The land on which a railroad is constructed or a type of easement granted by the Federal government to a railway company.

Transportation and Mobility Union City General Plan Update
Public Review Draft Background Report Page 7-65 June 2015
References
Bay Area Rapid Transit. A History of BART: The Concept is Born. http://www.bart.gov/about/history, November 2014.
Bay Area Rapid Transit. Board of Directors. http://www.bart.gov/about/bod, November 2014.
Bay Area Rapid Transit. Station Profile Study: 2008. http://www.bart.gov/about/reports/profile, November 2014.
Union City. Planning Document Archive. Station District Mixed-Use DEIR/FEIR documents. http://www.ci.union-city.ca.us/departments/economic-community-development/ecd-archives, November 2014.
Union Pacific Railroad. About Us. http://www.up.com/aboutup/index.shtml, November 2014.
Union Pacific Railroad. Corridor Improvement Study: Existing Conditions Technical Memorandum. Alameda County. https://www.acgov.org/pwa/documents/B_Existing_Conditions_Appendix_1_.pdf, November 2014.
Union Pacific Railroad, Oakland Subdivision. Corridor Improvement Study Executive Summary. Alameda County Public Works Agency, January 2010. http://www.acgov.org/pwa/documents/UPRR_Executive_Summary.pdf, November 2014.
U.S. Department of Transportation, Federal Railroad Administration, Office of Safety Analysis. Crossings data, by location. http://safetydata.fra.dot.gov/OfficeofSafety/PublicSite/Crossing/Xingqryloc.aspx, November 2014.

Public Review Draft Background Report Page 7-66 June 2015
This page is intentionally left blank.

SP Railroad
BART
SP R
ailroad
Oakland Subdivision
Niles Subdivision
Coast Subdivision
§̈¦880
Alameda
Creek
Newark
City ofFremont
City ofHayward
Bayla
nds
SP Railroad
SP Railroad
Bay AreaRapid Transit
WP Railroad
SP Railroad
SP R
ailro
ad
Tamarack Dr
7Th St
Arizona St
10Th St
Perry Rd
Fredi St
Regents Bl
H St
6Th St
Skylark Dr
Jean Dr
Whipple Rd
Deborah
Dr
Cent
ral A
v
Sherm
an
Dr
5Th St
Cabell
o St
Tidewater Dr
TorreyPine Ln
Appian Wy
Railroad Av
Rock
linDr
13Th StSanta MariaDr
Delores
Dr
Wes
tern
Av
Dowe
Av
8Th St
Pacific St
Atlant ic St
Whipple Rd
Dyer S
t
Car melW
y
San
Andre
asDr
11Th St
Royal Ann Dr
Merid ien Ci
Niland S
t
Parkside Dr
Begonia StPalm
Dr
Clover St
Lowry
Rd
Alvarado Bl
Mission Boulevard
Alvarado Niles Rd
Alvarado Bl
Deco
toRd
Alvarado Niles Rd
Union CityBou levard
Deco
to R
d
Union
City
Bou
levar
d
Figure 7-9 Railways
0 10.5
Miles
[City Limits
RailSpurs
NAME
Bay Area Rapid Transit
Heavy Rail
Source: Union City Intermodal Rail Station Passenger Rail Project

Public Review Draft Background Report Page 7-68 June 2015
This page is intentionally left blank.

Transportation and Mobility Union City General Plan Update
Public Review Draft Background Report Page 7-69 June 2015
SECTION 7.7 AVIATION FACILITIES
Introduction
This section describes the aviation facilities located near Union City.
Major Findings
Union City is serviced by several nearby airports including: the San Francisco International Airport (distance: 25 miles); Oakland International Airport (distance: 15 miles); San Jose International Airport (distance: 22 miles), and the Hayward Executive Airport (distance: 7 miles).
Hayward Executive Airport is a general aviation airport owned and operated by the City of Hayward, which is classified as a reliever airport for the surrounding international airports. The Hayward airport serves smaller jets and general aviation operations with FAA-reported average aircraft operations of 284 aircraft per day for a twelve-month period ending August 2014.
San Francisco International Airport is one of the top 25 busiest airports in the world with over 44 million passengers annually. Oakland International Airport served over 10 million passengers in 2014 and San Jose International Aiport served over 9.4 million.
In 2013 San Francisco International Airport had 21,704,626 enplanments, Oakland International Airport had 4,770,716, and San Jose International Airport had 4,315,839.
Existing Conditions
Union City is serviced by several nearby regional airports, including San Francisco International Airport, Oakland International Airport, and San Jose International Airport. The Hayward Executive Airport serves as a reliever airport and as a facility for local private aviation.
San Francisco International Airport
San Francisco International Airport (SFO) is an airport serving more than 44 million domestic and international passengers annually. SFO provides frequent service to the top 15 destinations in North America, nonstop service to more than 75 U.S. airports on 15 domestic airlines, and nonstop service to more than 30 international points on 30 international carriers. SFO also has eleven cargo facilities that provide over one million square feet of warehouse and office space. In 2010 cargo service was available from 48 airlines, including 8 cargo-only airlines. During that same year SFO captured 44.5 percent of the San Francisco Bay Area’s air cargo market, including 95.2 percent of the international cargo market. SFO is operated as a Department of the City and County of San Francisco and considered one of the world’s 25 busiest airports. During the 2012-2013 Fiscal Year, a total of 44,607,577 passengers traveled through SFO.
SFO is about 25 miles from Union City. SFO can be accessed from Union City via personal vehicle, public transportation, or taxi, and is roughly a half-hour drive. Alameda County Transit operates a shuttle to SFO via a bus from Union City. SFO can also be accessed via BART.
Public Review Draft Background Report Page 7-70 June 2015
Oakland International Airport
Oakland International Airport (OAK) serves more than 9 million domestic and international passengers annually on 210,100 flying operations. OAK also provides cargo services at the airport. In 2012 the total air cargo volume for OAK was over 7,000 metric tons of air mail and freight cargo. In October 2014 OAK had a total of 17,413 aircraft movements, roughly 550 a day. The airport has 2 terminals, 29 boarding gates, and 4 runways. The largest runway is over 10,000 feet. In 2013 a total of 9,742,887 passengers traveled through Oakland International Airport.
OAK can be accessed from Union City via personal vehicle, public transportation, or taxi. OAK is about 15 miles from Union City, which is roughly a 20-minute drive in a personal vehicle or taxi. There is also a car rental facility at OAK for individuals that choose to rent a vehicle. BART recently (2014) opened an aerial tram that connects to OAK. Travelers can board the three-car aerial tram just outside the OAK terminals for the 3-minute trip to the Oakland Coliseum BART Station, then transfer to get to the Union City BART station.
San Jose International Airport
The Norman Y. Mineta San Jose International Airport (SJC) is located in the South Bay about two miles from downtown San Jose and about 22 miles south of Union City. SJC is owned and operated by the City of San Jose. In 2013 SJC served about 8.8 million passengers averaging 130 commercial and 86 general aviation departures daily. During that same year the airport managed about 94 million pounds of cargo. SJC operates two runways, each 11,000 feet, which are capable of handling aircraft serving any domestic or international destination, as well as the cargo flights.
SJC can be accessed from Union City via personal vehicle, public transportation, or taxi, and is roughly a 25-minute drive. Public transportation options include bus service by taking BART from Union City to Fremont then taking an express bus from the BART station to SJC, which is operated by the Valley Transportation Authority.
Hayward Executive Airport
The Hayward Executive Airport (HWD) is owned and operated by the City of Hayward. The airport is situated on 543 acres providing two parallel runways for general aviation operations. The airport is situated on a former World War II fighter base and provides approximately 131,400 square yards of apron area for aircraft movement and local and transient aircraft tiedown. Over 450 aircraft are based at the airport from single-engine airplanes to sophisticated corporate jets.
HWD is located along the northeastern portion of San Francisco Bay approximately seven miles north of Union City. Access is from Skywest Drive off of Hesperian Boulevard. The airport is accessible by personal autos, taxi, and bus service operated by AC Transit.
Regulatory Setting
Airport facilities operate through collaborative efforts of several government agencies as well as the private entities. They are subject to Federal, State, and local regulation, including local land use planning agencies.

Transportation and Mobility Union City General Plan Update
Public Review Draft Background Report Page 7-71 June 2015
Federal
Federal Aviation Regulations. Federal Aviation Regulations (FARs) are rules established by the Federal Aviation Administration governing all civilian and, to a lesser extent, military aviation activities in the United States. FARs are designed to promote aviation safety. They are developed and approved through a formal Federal rule-making process and address a wide variety of aviation activities, including aircraft design, flight procedures, pilot training requirements, and airport design. FARs concerning aircraft flight generally preempts any State or local regulations. At the national level, the Hayward airport is included in the National Plan of Integrated Airport Systems.
State
California Aviation System Plan–Policy Element. The California Aviation System Plan–Policy Element (2011) is the primary document that explains and guides the business of the Division of Aeronautics that is housed in the California Department of Transportation. The Division’s primary duties and functions are defined by statute codified in the State Aeronautics Act (originally the State Aeronautics Commission Act of 1947) and published in the California Public Utilities Code, Section 21001 et seq. The Policy Element is one of multiple elements that comprise the larger California Aviation System Plan (CASP), the means by which continuous aviation system planning is conducted by the State. CASP elements are revised on an approximate five-year cycle with the last Policy Element update published in 2006. The Hayward airport is included in the CASP.
Regional
Regional Airport System Plan. The Regional Airport System Plan (RASP) 2000 is intended to explore a range of solutions to address the increasing air traffic demands being placed on the runways at the major commercial airports and on the airspace around these airports. The RASP provides an independent analysis of future aviation trends and airport system requirements to be used together with airport planning documents to help evaluate proposed improvements to regional airport system capacity. The RASP forecasts for each airport are based on the analysis of individual markets. The RASP is primarily an advisory and informational document. The Hayward airport is included in the Metropolitan Transportation Commission’s RASP for the San Francisco Bay Area.
Key Terms
None.

Public Review Draft Background Report Page 7-72 June 2015
References
Reports/Publications
Alameda County Airport Land Use Commission, Hayward Executive Airport–Airport Land Use Compatibility Plan. September 2010.
AECOM. Hayward Executive Airport–Airport Layout Plan Update–Approved Final Narrative Report. January 2011.
Contra Costa Times. BART aerial tram connecting to Oakland International Airport opens this weekend, November 19, 2014. http://www.contracostatimes.com/breaking-news/ci_26937815/bart-aerial-tram-connecting-oakland-international-airport-opens, November 2014.
California Department of Transportation, Division of Aeronautics. California Public Utilities Code–Section 21001 et seq. relating to the State Aeronautics Act. February 2011.
Coffman Associates, Inc. and Environmental Science Associates (ESA). Hayward Executive Airport, Airport Master Plan–Final Technical Report. April 2002.
California Department of Transportation, Division of Aeronautics. California Aviation System Plan–Policy Element, October 2011.
Metropolitan Transportation Commission. Regional Airport System Plan Update 2000, September 2000.
Websites
Hayward, City of. http://www.hayward-ca.gov/CITY-GOVERNMENT/DEPARTMENTS/ PUBLIC-WORKS-ET/HEA/index.shtm, August 2014.
Oakland International Airport. Airport Statistics. http://www.oaklandairport.com/airport_stats_facilities.shtml, November 2014.
San Francisco International Airport. About SFO. http://www.flysfo.com/about-sfo, November 2014.
San Jose International Airport.