Big Data Analysis for the High-Resolution View of Urban Public Transportation Accessibility
Transportation Accessibility
By Carlos A. Alba CE 790, University of Wisconsin-Milwaukee December, 2003
OUTLINE
1. Introduction 2. Goal 3. Street Connectivity
3.1. Institutionalization of Standards 3.2. Comparison of Street Patterns
• Traffic Capacity • Pedestrian Access • Other Issues
3.3. Related Research 3.4. Connectivity and the Future
• The Shared Street Concept • Interconnected Cul-de-sacs • Retrofitting of Traditional Neighborhoods
4. Street Spacing • Future Highways and Urban Growth • TRB Circular 456, 1996 • ITE Report, 1997
5. Conclusion 6. References
Transportation Accessibility
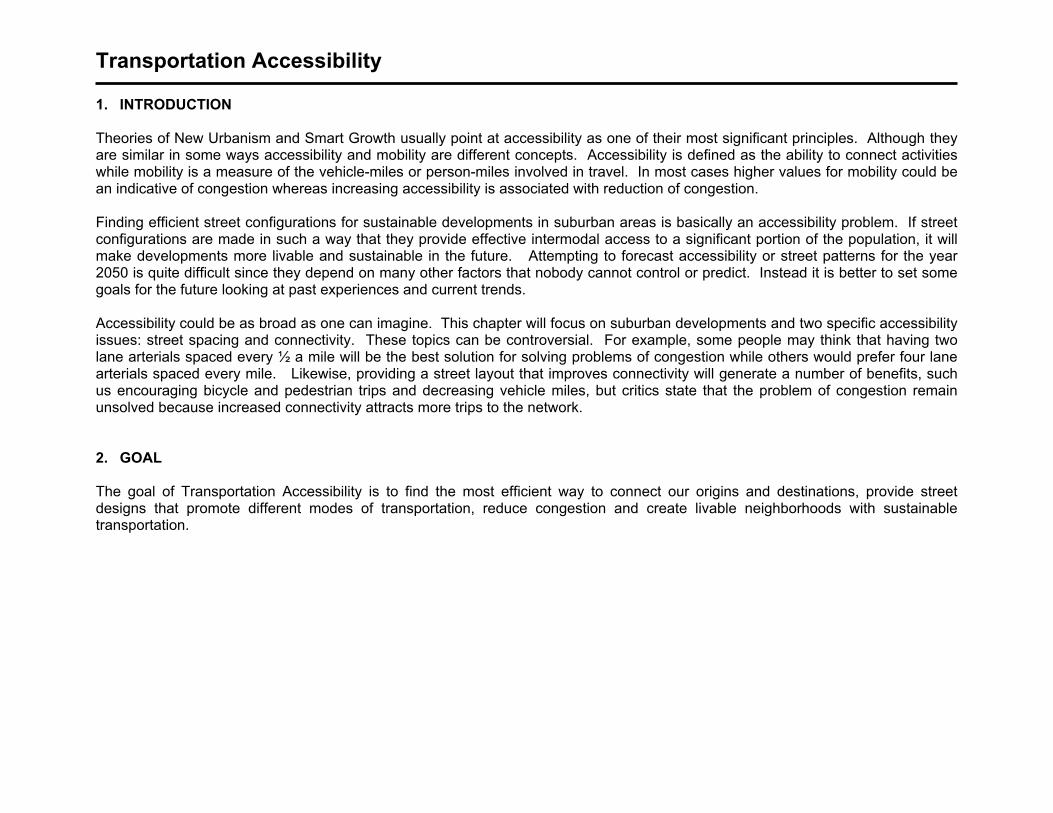
1. INTRODUCTION Theories of New Urbanism and Smart Growth usually point at accessibility as one of their most significant principles. Although they are similar in some ways accessibility and mobility are different concepts. Accessibility is defined as the ability to connect activities while mobility is a measure of the vehicle-miles or person-miles involved in travel. In most cases higher values for mobility could be an indicative of congestion whereas increasing accessibility is associated with reduction of congestion. Finding efficient street configurations for sustainable developments in suburban areas is basically an accessibility problem. If street configurations are made in such a way that they provide effective intermodal access to a significant portion of the population, it will make developments more livable and sustainable in the future. Attempting to forecast accessibility or street patterns for the year 2050 is quite difficult since they depend on many other factors that nobody cannot control or predict. Instead it is better to set some goals for the future looking at past experiences and current trends. Accessibility could be as broad as one can imagine. This chapter will focus on suburban developments and two specific accessibility issues: street spacing and connectivity. These topics can be controversial. For example, some people may think that having two lane arterials spaced every ½ a mile will be the best solution for solving problems of congestion while others would prefer four lane arterials spaced every mile. Likewise, providing a street layout that improves connectivity will generate a number of benefits, such us encouraging bicycle and pedestrian trips and decreasing vehicle miles, but critics state that the problem of congestion remain unsolved because increased connectivity attracts more trips to the network. 2. GOAL The goal of Transportation Accessibility is to find the most efficient way to connect our origins and destinations, provide street designs that promote different modes of transportation, reduce congestion and create livable neighborhoods with sustainable transportation.
Transportation Accessibility
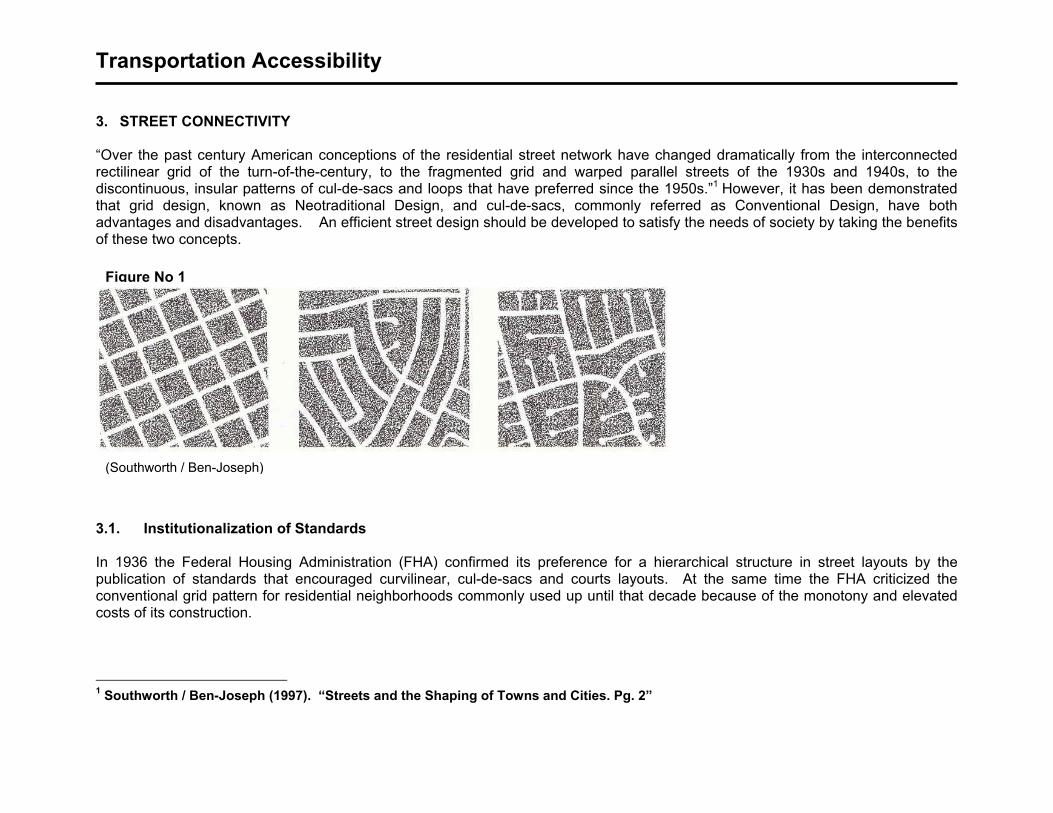
3. STREET CONNECTIVITY “Over the past century American concept the residential street have changed dramatically from the interconnected rectilinear grid of the turn-of-the-century fragmented grid and d parallel streets of the 1930s and 1940s, to the discontinuous, insular patterns of cul-de-s d loops that have prefthat grid design, known as Neotradition ign, and cul-de-sacsadvantages and disadvantages. An effic et design should be dof these two concepts.
(Southworth / Ben-Joseph)
Figure No 1
3.1. Institutionalization of Standards In 1936 the Federal Housing Administration (FHA) confirmed its prepublication of standards that encouraged curvilinear, cul-de-sacs andconventional grid pattern for residential neighborhoods commonly usedcosts of its construction.
1 Southworth / Ben-Joseph (1997). “Streets and the Shaping of Towns and
network warpe
erred since the 1950s.”1 However, it has been demonstrated , commonly referred as Conventional Design, have both eveloped to satisfy the needs of society by taking the benefits
ions of, to theacs anal Des
ient stre
ference for a hierarchical structure in street layouts by the courts layouts. At the same time the FHA criticized the up until that decade because of the monotony and elevated
Cities. Pg. 2”
Transportation Accessibility
me:
esting vistas, and eliminate the monotony of long straight
s.2
The following standards were taken from publications of the FHA by that ti
Layouts should discourage through-traffic;
Streets should follow the topography to reduce costs, create interrows of houses;
Cul-de-sacs are the most attractive street layout for family dwelling
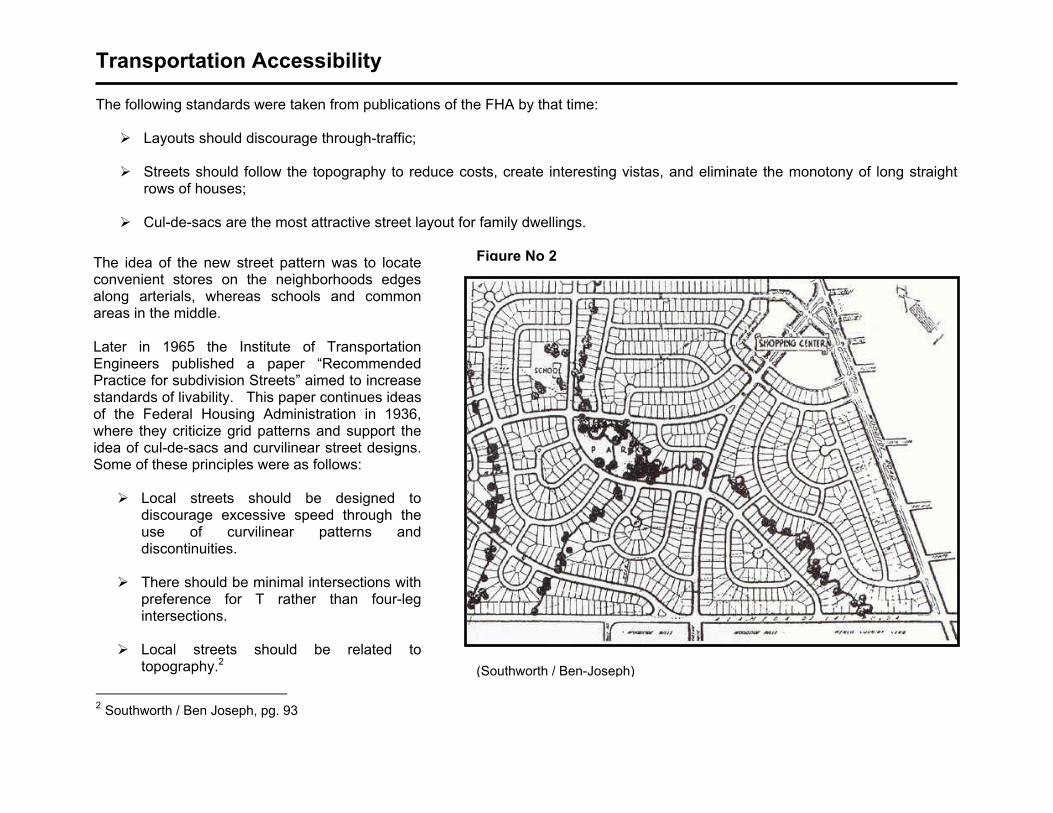
Figure No 2 The idea of the new street pattern was to locate
convenient stores on the neighborhoods edges along arterials, whereas schools and common areas in the middle. Later in 1965 the Institute of Transportation Engineers published a paper “Recommended Practice for subdivision Streets” aimed to increase standards of livability. This paper continues ideas of the Federal Housing Administration in 1936,
where they criticize grid patterns and support the idea of cul-de-sacs and curvilinear street designs. Some of these principles were as follows:
Local streets should be designed to discourage excessive speed through the use of curvilinear patterns and discontinuities.
There should be minimal intersections with
preference for T rather than four-leg intersections.
Local streets should be related to
topography.2 (Southworth / Ben-Joseph)
2 Southworth / Ben Joseph, pg. 93
Transportation Accessibility
3.2. Comparison of Street Patterns
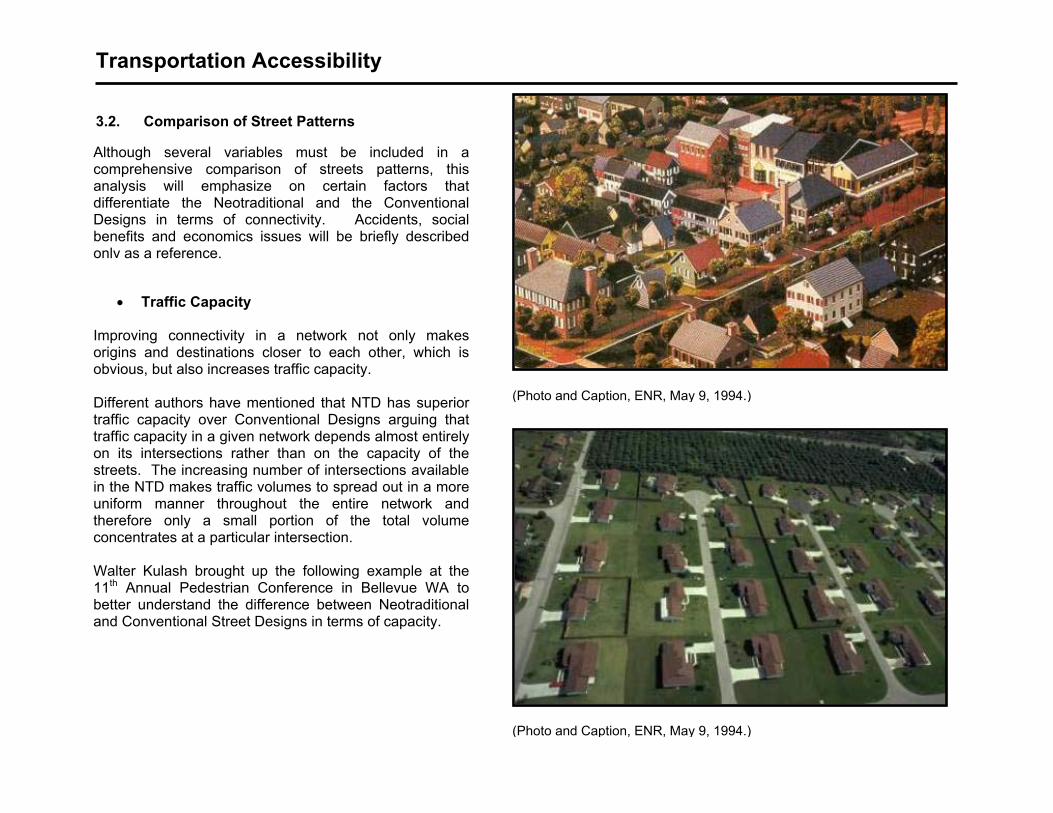
Although several variables must be included in a comprehensive comparison of streets patterns, this analysis will emphasize on certain factors that differentiate the Neotraditional and the Conventional Designs in terms of connectivity. Accidents, social benefits and economics issues will be briefly described only as a reference.
(Photo and Caption, ENR, May 9, 1994.)
• Traffic Capacity Improving connectivity in a network not only makes origins and destinations closer to each other, which is obvious, but also increases traffic capacity. Different authors have mentioned that NTD has superior traffic capacity over Conventional Designs arguing that traffic capacity in a given network depends almost entirely on its intersections rather than on the capacity of the streets. The increasing number of intersections available in the NTD makes traffic volumes to spread out in a more uniform manner throughout the entire network and therefore only a small portion of the total volume concentrates at a particular intersection. Walter Kulash brought up the following example at the 11th Annual Pedestrian Conference in Bellevue WA to better understand the difference between Neotraditional and Conventional Street Designs in terms of capacity.
(Photo and Caption, ENR, May 9, 1994.)
Transportation Accessibility
Figure No ventional Design) to the lack of access points Conventional Street Design e traffic volumes meet at inte ns which commonly have a -lane divided and six-lane div erial street: each having left- lanes and protected left-turn
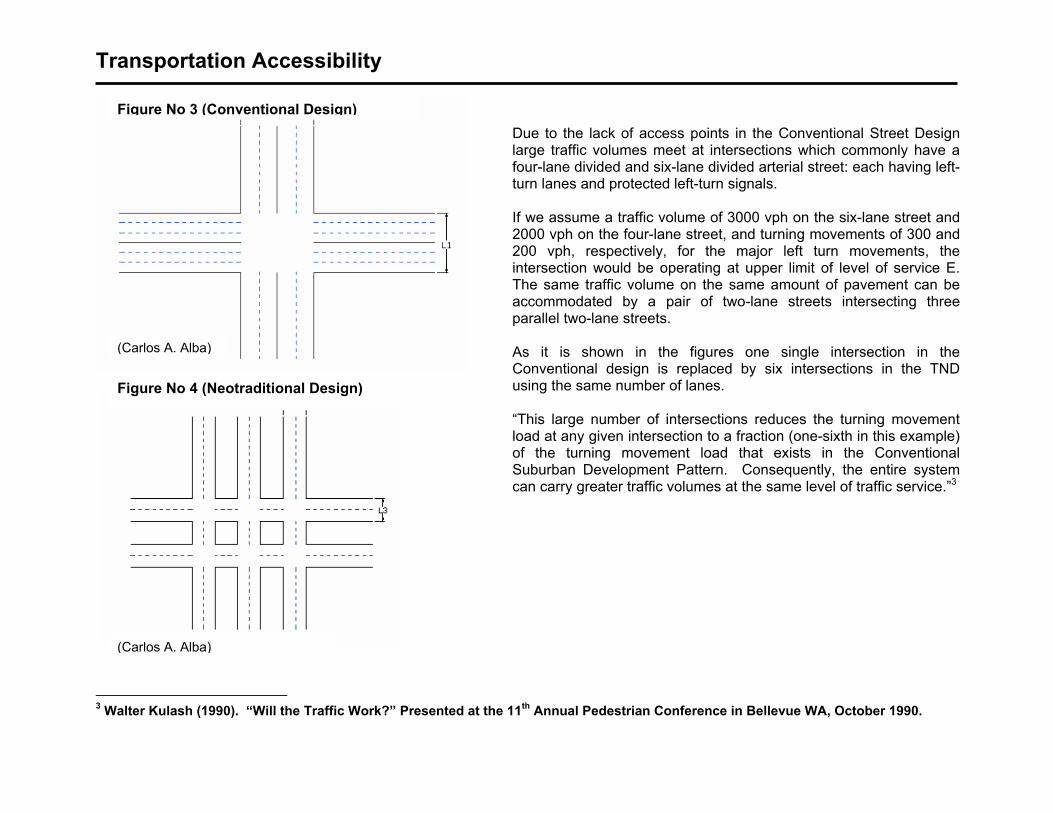
If we assume a traffic volume of h on the six-lane street and 2000 vph on the four-lane street, ning movements of 300 and 200 vph, respectively, for the left turn movements, the intersection would be operating r limit of level of service E. The same traffic volume on the mount of pavement can be accommodated by a pair of t streets intersecting three parallel two-lane streets. As it is shown in the figure single intersection in the Conventional design is replaced by six intersections in the TND using the same number of lanes. “This large number of intersections reduces the turning movement load at any given intersection to a fraction (one-sixth in this example) of the turning movement load that exists in the Conventional Suburban Development Pattern. Consequently, the entire system can carry greater traffic volumes at the same level of traffic service.”3
(Carlos A. Alba)
Figure No 4 (Neotraditional Design)
nce in Bellevue WA, October 1990.
2 (Carlos A. Alba) 3 Walter Kulash (1990). “Will the Traffic Work?” Presented at the 11th Annual Pedestrian Confere
in the rsectio
ided artsignals.
3000 vp and tur
major at uppesame awo-lane
s one
Duelargfourturn
3 (Con
Transportation Accessibility
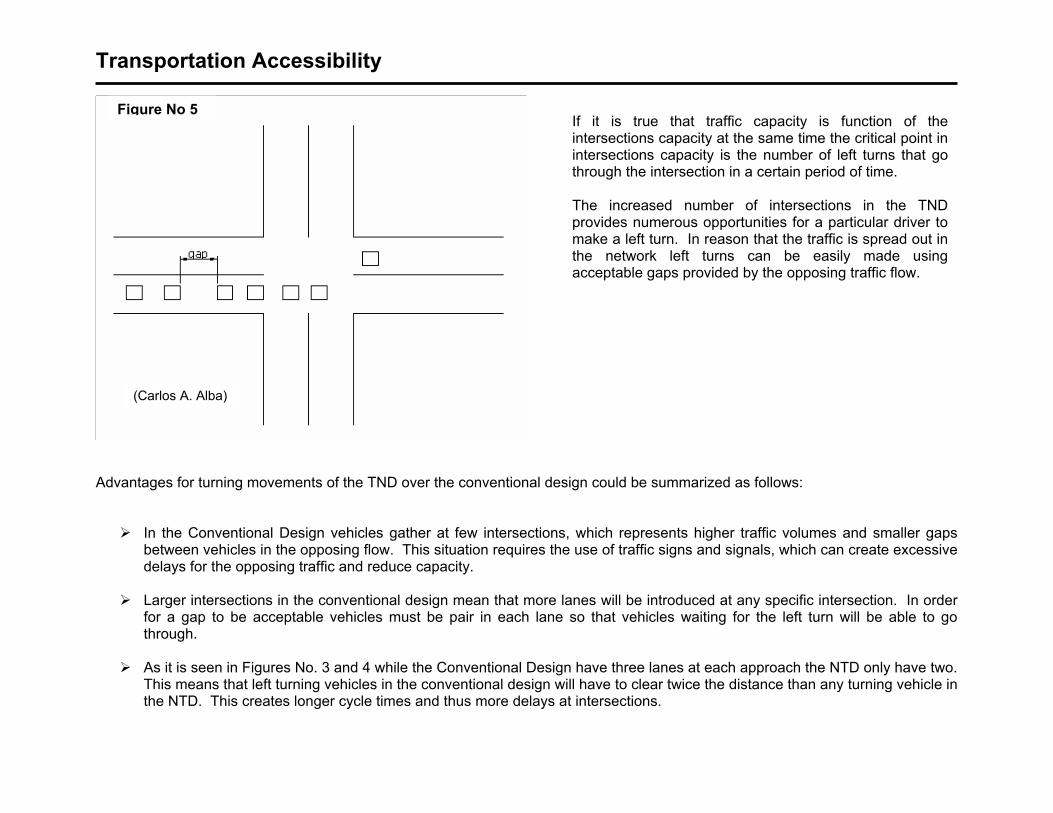
Figure No 5 If it is true that traffic capacity isintersections capacity at the same time intersections capacity is the number ofthrough the intersection in a certain peri The increased number of intersectioprovides numerous opportunities for a pmake a left turn. In reason that the traffthe network left turns can be eaacceptable gaps provided by the opposi
(Carlos A. Alba)
Advantages for turning movements of the TND over the conventional design could be summarized as follows:
In the Conventional Design vehicles gather at few intersections, which represents higher traffic volumebetween vehicles in the opposing flow. This situation requires the use of traffic signs and signals, which cadelays for the opposing traffic and reduce capacity.
Larger intersections in the conventional design mean that more lanes will be introduced at any specific in
for a gap to be acceptable vehicles must be pair in each lane so that vehicles waiting for the left turnthrough.
As it is seen in Figures No. 3 and 4 while the Conventional Design have three lanes at each approach the
This means that left turning vehicles in the conventional design will have to clear twice the distance than anthe NTD. This creates longer cycle times and thus more delays at intersections.
function of the the critical point in left turns that go od of time.
ns in the TND articular driver to ic is spread out in sily made usingng traffic flow.
s and smaller gaps n create excessive
tersection. In order will be able to go
NTD only have two. y turning vehicle in
Transportation Accessibility
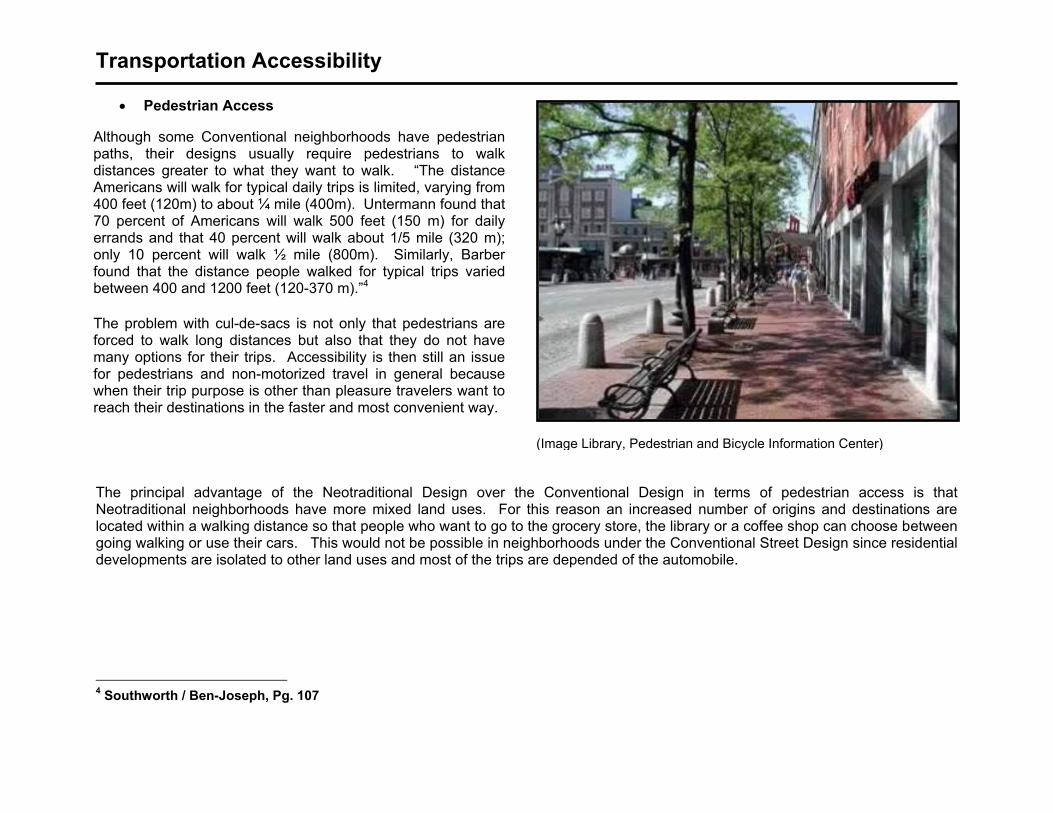
• Pedestrian Access
(Image Library, Pedestrian and Bicycle Information Center)
1
Although some Conventional neighborhoods have pedestrian paths, their designs usually require pedestrians to walk distances greater to what they want to walk. “The distance Americans will walk for typical daily trips is limited, varying from 400 feet (120m) to about ¼ mile (400m). Untermann found that 70 percent of Americans will walk 500 feet (150 m) for daily errands and that 40 percent will walk about 1/5 mile (320 m); only 10 percent will walk ½ mile (800m). Similarly, Barber found that the distance people walked for typical trips varied between 400 and 1200 feet (120-370 m).”4 The problem with cul-de-sacs is not only that pedestrians are forced to walk long distances but also that they do not have many options for their trips. Accessibility is then still an issue for pedestrians and non-motorized travel in general because when their trip purpose is other than pleasure travelers want to reach their destinations in the faster and most convenient way.
The principal advantage of the Neotraditional Design over the Conventional Design in terms of pedestrian access is that Neotraditional neighborhoods have more mixed land uses. For this reason an increased number of origins and destinations are located within a walking distance so that peop want to go to the grocery store, the library or a coffee shop can choose between going walking or use their cars. This would n ossible in neighborhoods under the Conventional Street Design since residential developments are isolated to other land uses a st of the trips are depended of the automobile. 4 Southworth / Ben-Joseph, Pg. 107
le who ot be pnd mo
Transportation Accessibility
• Other Issues Another important advantage of NTD is that real-time route selections are most likely to happen. That means that during peak hours, for example, people can change their path selection and traffic congestion can be avoided. This is not possible under the street configuration of the conventional design. Accidents Since 1950’s traffic engineers have paid special attention to the relationship between street design and crashes. “One of the first engineering studies on street safety in residential subdivisions, conducted in Los Angeles between 1951 and 1956, examined the accident rates in developments with a grid pattern, as compared to the prevailing FHA limited-access and curvilinear patterns. The study results showed that accident rates were substantially higher for grid-pattern subdivisions: Fifty percent of all intersections in the grid pattern had at least one accident during the five-year period. In contrast, only 8.8 percent of the intersections in the limited-access pattern had accidents during that period. Overall, T intersections were found to be fourteen times safer than in the grid tracts”5. Although the study was not sensitive to neighborhood density and traffic volume it became a strong argument to support the hierarchical pattern set by the FHA. Traffic speed, which is one of the principal causes of accidents, is a controversial point for NTD and Conventional Design supporters. Authors like Walter Kulash affirm “the travel speed profile for a NTD generally shows a lower peak speed and shorter, more frequent intersection delays than on a Conventional design. The Conventional Suburban Development trip, made mainly on major arterial streets, is typified by a pattern of high speeds for short segments of road, interspersed with long traffic signal delays at individual traffic signals.”6 On the other hand, the Conventional Design supporters claim that despite of the speed in the arterial streets, low traffic volumes and reduced speeds in the cul-the-sacs make the Conventional Design safer for children playing in the streets. Beyond the controversy of which street design is better in terms of safety recent studies show that high speed not only causes an increased number of accidents on the roads but it also influence the severity of the accident by itself. “In Limpert’s Motor Vehicle Accident Reconstruction and Cause Analysis, it is shown that the probability of a pedestrian being killed when a vehicle is traveling at 15 mph is 3.5%. And when you go to 44 mph you are suddenly at an 83% probability of being killed.”7 5 Southworth / Ben-Joseph, pg. 92 6 Walter Kulash (1990). “Will the Traffic Work?” Presented at the 11th Annual Pedestrian Conference in Bellevue WA, October 1990. 7 Margaret A. Kubilins. “Designing Functional Streets that Contribute to Our Quality of Life”
Transportation Accessibility
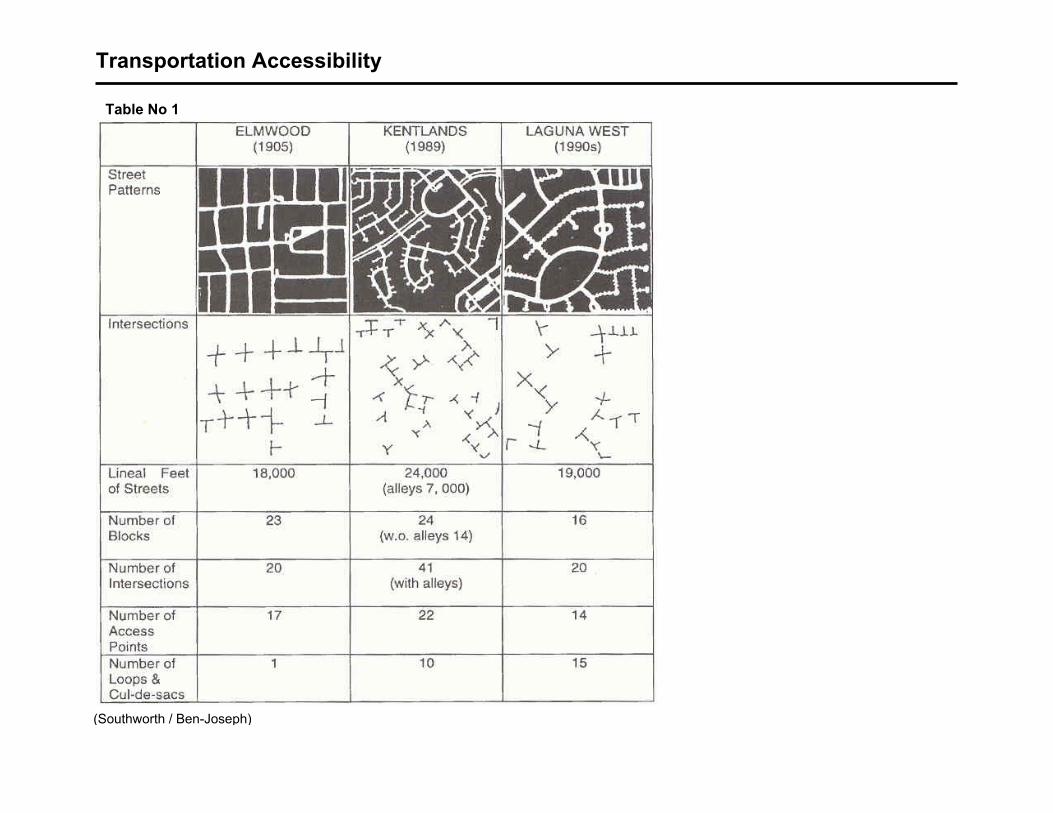
Social Benefits One cannot easily compare grid patterns and cul-de-sacs in terms of social benefits because the latter ones have an advantage over the conventional grid design. Factors, such as high speed and aesthetics make grid patterns inconvenient for most people. However, if the analysis is made between cul-de-sacs and grid patterns under specific conditions like traffic claming, the comparison becomes pertinent. Grid patterns under those conditions promote a civic spirit, encourage multimodal transportation since bicycles and walking becomes a convenient alternative, and create areas where kids can play and neighbors have a closer interaction. Even though benefits of cul-de-sacs are often controversial, nobody can argue, for example, that Conventional Design does not provide more safety in access roads where traffic volumes are considerably lower. Furthermore, it has been demonstrated that criminals prefer neighborhoods with more street choices (grid patterns) where they can escape easily after committing a felony than cul-de-sacs where they spend some more time finding their way out8. 3.3. Related Research The following analysis made by Michael Southworth illustrates the difference between a Neotraditional (Elmwood) and two Conventional Neighborhoods (Kentlands and Laguna West): As it is shown in Table No.1 equal and squared analysis areas of 2000 feet per side were selected for each development so that a comparison between neighborhoods with different characteristics would be possible. The criteria selected for this analysis was established carefully so that differences in terms of accessibility could be easily found between the neighborhoods in analysis.
8 Mayo, J. 1979. “Suburban Neighboring and the Cul-de-Sac Street.”
Transportation Accessibility
Ta 1
(Southworth / Ben-Joseph)
ble No
Transportation Accessibility
From the table it is concluded that even though Kentlands and Laguna West have different linear feet of streets, number of blocks, intersections and access points, they have a similar number of loops and cul-de-sacs and that is the principal reason why they are considered to be in the same group of conventional street design. “In terms of access into the study area from outside, Kentlands has 22 points of entry to the study area, while Elmwood has 16, and Laguna West has only 14. However, when the entire development is examined compared with Elmwood, both Kentlands and Laguna West are weakly connected with the surrounding urban context.”9
Results from this study are difficult to interpret. It seems like either the criteria used in the analysis does not clearly relate to connectivity or that the selection of neighborhoods are not representative of Neotraditional and Conventional Designs. Neotraditional neighborhoods, Like Elmwood, are suppose to have more linear feet of streets, an increased number of intersections, more number of access points and therefore better connectivity. Based on the results of the study however, Elmwood is still the one that visually offers better connectivity. 3.4. Connectivity and the Future Successful street designs that provides connectivity and supply the needs of travelers will be achieved after taking the advantages of both Neotraditional and Conventional Designs. Traffic engineers must find the balance between the convenience of NTD Designs and the safety and social benefits offered by Conventional Designs. Grid patterns were unsafe in the old set up but new concepts like Traffic Calming can make Neotraditional neighborhoods safer and more convenient for automobiles and non-motorized modes of transportation. The following concepts will play a vital role in the development of cities by the year 2050:
9 Southworth / Ben-Joseph (1997), pg. 105
Transportation Accessibility
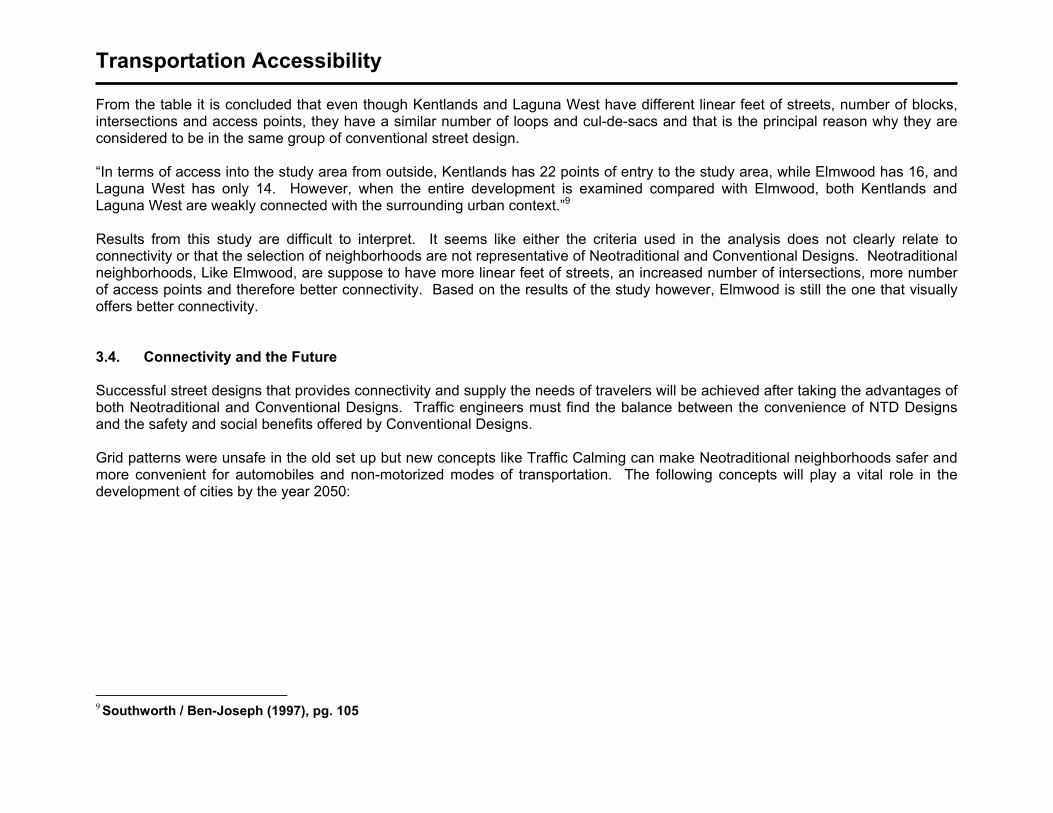
Figure No 6 • The shared Street Concept
The shared street concept tries to keep the functionality and efficiency of the grid pattern used in the Neotraditional developments and at the same time integrates the safety and livability of the Conventional design. The main goal of this concept is that vehicles, pedestrian and bicycles will share the space in the streets. Looking at the evolution of the form since its inception, several design characteristics are typical:
• It is a residential, public space. • Through traffic is discouraged. • Paved space is shared by pedestrians and cars, with
pedestrians having priority over the entire street. Walking and playing are allowed everywhere.
• It can be a single street, a square (or other form), or a combination of connected spaces.
• Its entrances are clearly marked. • There are no conventional, straight stretches of
pavement with raised curbs, and the pavement
(carriageway) and sidewalk (footway) are not rigidly demarcated.
speed and movement are restricted by physical riers and deviations, bends, and undulations. idents have automobile access to their dwelling ts. area has extensive landscaping and street ishings.
The street idea is based on the grid design concept in the that, although in different conditions, it promotes accessibility and not just for automobiles but also for pedestrians and bicyclists.
(Southworth / Ben-Joseph)
• Carbar
• Resfron
• Thefurn
sharedsense
Transportation Accessibility
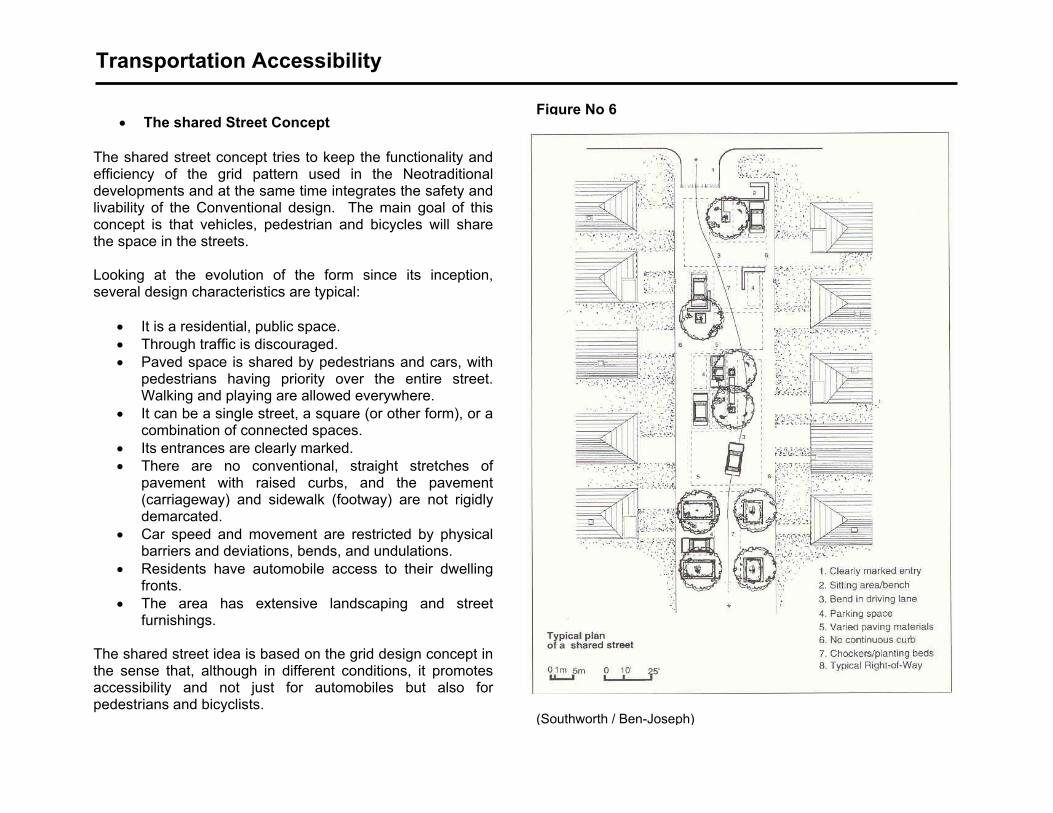
• Interconnected cul-de-sacs
Figure No 7
Interconnected cul-de-saconvenience of a cul-de-other transportation alterwalking and bicycle. The achieved by the bicycle/pedestrian paths sacs so that the accessibpedestrians and bicyconventional street desigimproved. Interconnected cul-de-sacriticized because they wsimilar values of accessiand pedestrians than the the grid design and problems for automobiles r
(Southworth / Ben-Joseph)
(Southworth / Ben-Joseph)
• Street Closures
Street closures used in neighborhoods built under the Grid Pattern are a way to reduce automobile traffic transportation modes such as, bicycle and walking. As it is shown in Figure No 8 the idea behind this concept is to keep the connectivity benefits of the grid design bicyclist whereas restricting connectivity for automobiles so that they have to drive slower and therefore safely. Cargue that more than decreasing connectivity street closures represent inconvenient for drivers who are not famBesides, street closures usually increases vehicle miles and all the problems associated with it.
cs provide the sac and promote natives such as interconnection is construction of between cul-de-ility neglected to
clists by the n is somewhat
cs have been ill never provide
bility for bicycles ones achieved by the accessibility
emain unsolved.
and promote other
for pedestrians and ritics of this concept
iliar with the area.
Transportation Accessibility
Figure No 8
(FHWA Publication)
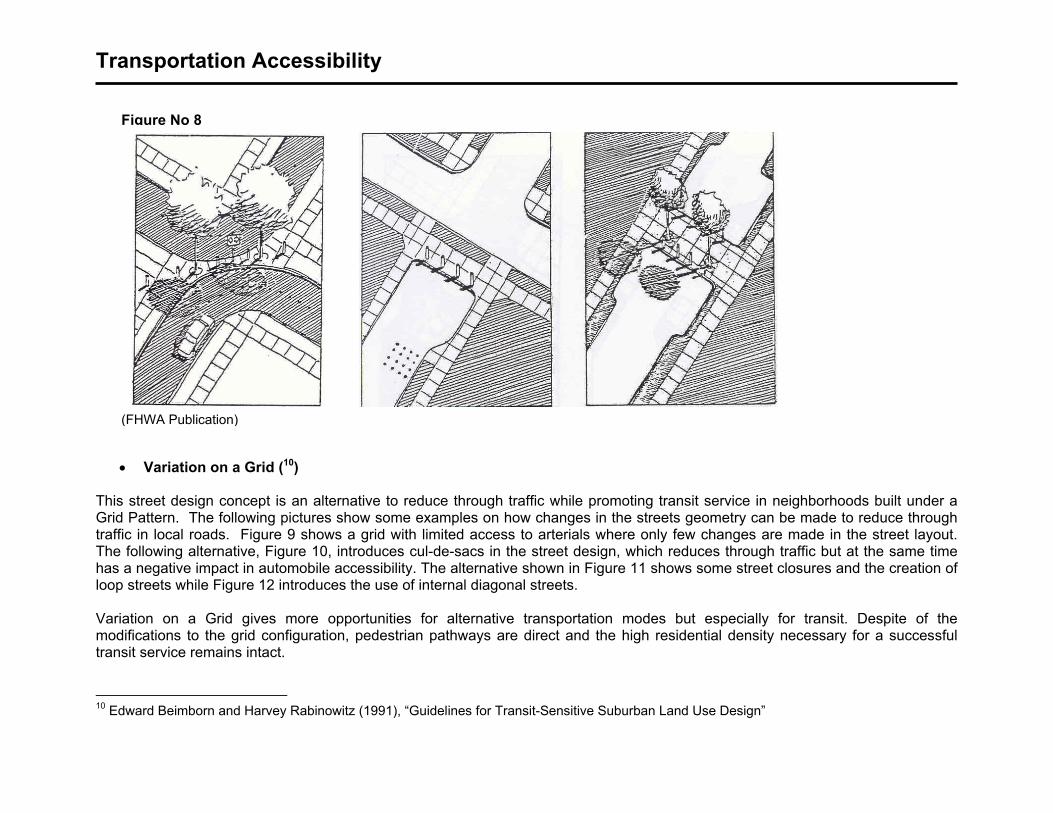
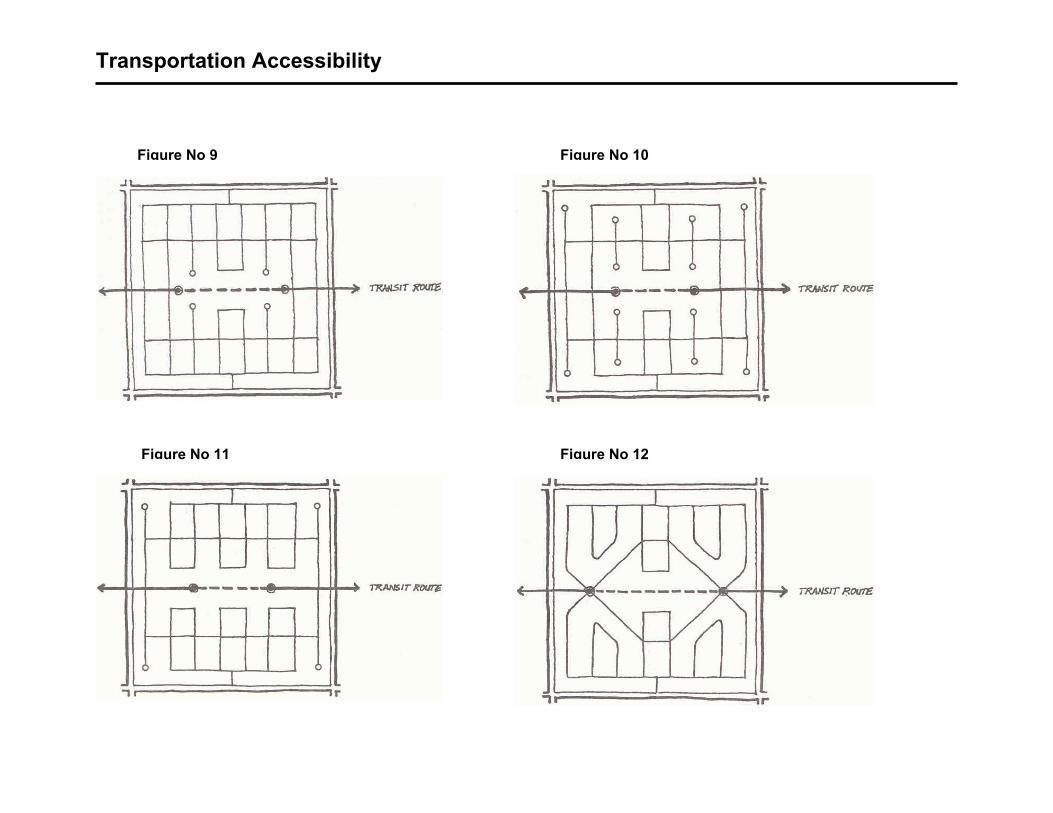
• Variation on a Grid (10) This street design concept is an alternative to reduce through traffic while promoting transit service in neighborGrid Pattern. The following pictures show some examples on how changes in the streets geometry can be madtraffic in local roads. Figure 9 shows a grid with limited access to arterials where only few changes are made The following alternative, Figure 10, introduces cul-de-sacs in the street design, which reduces through traffic bhas a negative impact in automobile accessibility. The alternative shown in Figure 11 shows some street closuresloop streets while Figure 12 introduces the use of internal diagonal streets. Variation on a Grid gives more opportunities for alternative transportation modes but especially for tranmodifications to the grid configuration, pedestrian pathways are direct and the high residential density necessatransit service remains intact.
10 Edward Beimborn and Harvey Rabinowitz (1991), “Guidelines for Transit-Sensitive Suburban Land Use Design”
hoods built under a e to reduce through in the street layout. ut at the same time and the creation of
sit. Despite of the ry for a successful
Transportation Accessibility
Figure No 9 Figure No 10
Figure No 11 Figure No 12
Transportation Accessibility
4. STREET SPACING Street planning usually focuses on particular locations and almost never analyzes traffic problems in a comprehensive manner. That is the reason why transportation decision makers keep on adding more lanes and changing the geometry of the highway system. Street spacing, which is an important and often neglected approach for street planning could help transportation planners to make street designs more sustainable in the future. Finding adequate values for street spacing can significantly improve accessibility and mobility throughout the network. Streets that are too close to each other can cause accidents and delays because of the increased number of intersections. Likewise, streets that are too far from each other would decrease accessibility and over concentrate traffic at intersections. Although connectivity and street spacing are two different concepts both are generally measured using the same criteria. In fact, when streets are efficiently spaced on the network it is very likely to reach higher values of connectivity and vice versa. For that reason this chapter will compare and analyze different methodologies and case studies on how to find values for street spacing.
• Future Highways and Urban Growth, 1961 (11) The main point of this research prepared by Wilbur Smith and Associates in 1961 under commission from The Automobile Manufacturers Association is that where topographic differences are not significant, freeway spacing will be dependent on population density. However, the study points out that population density is only one of the factors that affect traffic within specific communities since through traffic plays also and important role in traffic congestion and therefore in the whole street spacing configuration. 11 Wilbur Smith and Associates (1961). “Future Highways and Urban Growth”
Transportation Accessibility
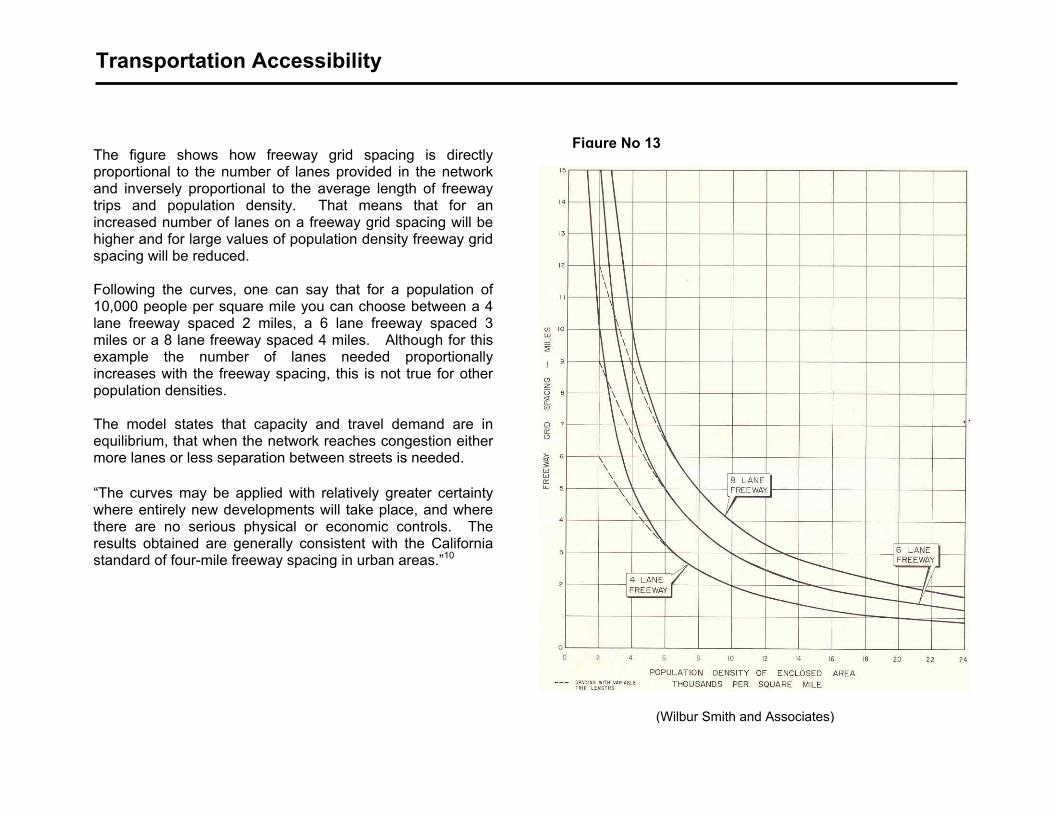
Figure No 13 The figure shows how freeway grid spacing is directly proportional to the number of lanes provided in the network and inversely proportional to the average length of freeway trips and population density. That means that for an increased number of lanes on a freeway grid spacing will be higher and for large values of population density freeway grid spacing will be reduced. Following the curves, one can say that for a population of 10,000 people per square mile you can choose between a 4 lane freeway spaced 2 miles, a 6 lane freeway spaced 3 miles or a 8 lane freeway spaced 4 miles. Although for this example the number of lanes needed proportionally increases with the freeway spacing, this is not true for other population densities. The model states that capacity and travel demand are in equilibrium, that when the network reaches congestion either more lanes or less separation between streets is needed. “The curves may be applied with relatively greater certainty where entirely new developments will take place, and where there are no serious physical or economic controls. The results obtained are generally consistent with the California standard of four-mile freeway spacing in urban areas.”10
(Wilbur Smith and Associates)
Transportation Accessibility
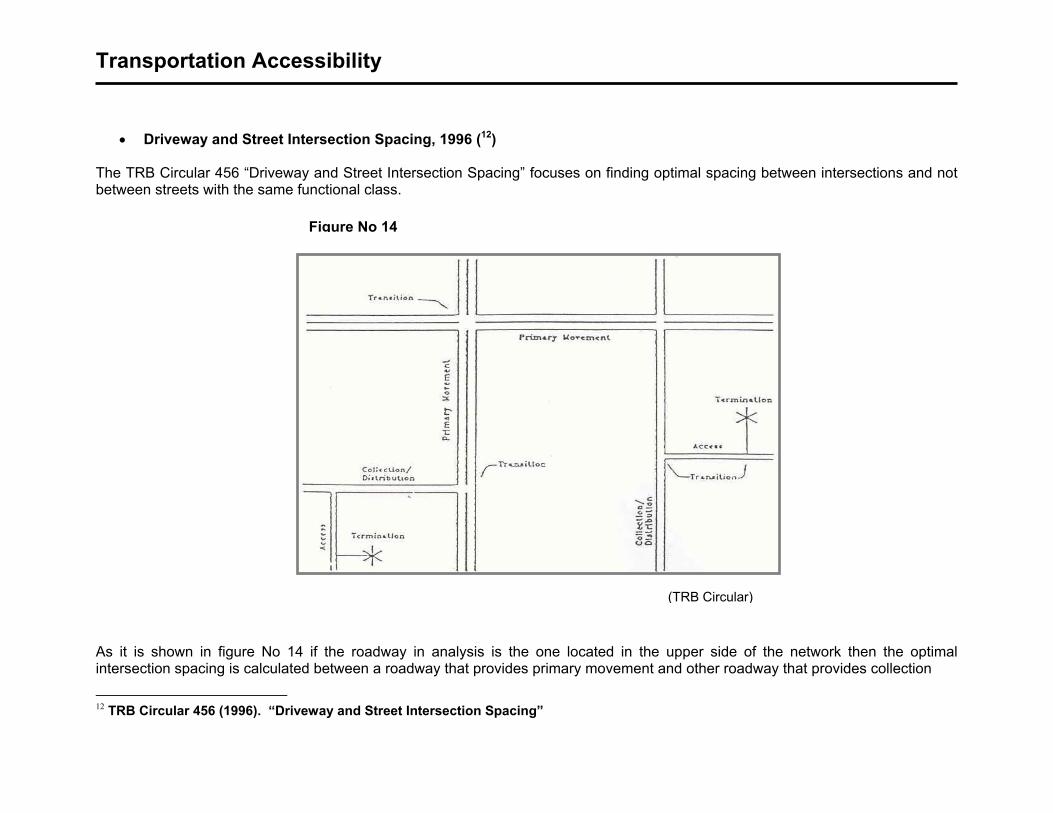
• Driveway and Street Intersection Spacing, 1996 (12) The TRB Circular 456 “Driveway and Street Intersection Spacing” focuses on finding optimal spacing between intersections and not between streets with the same functional class.
Figure No 14
As it is shown in figure No 14 if the roadway in analysis is the one locatedintersection spacing is ted between a roadway that provides primary mov
12 TRB Circular 456 (19 riveway and Street Intersection Spacing”
(TRB Circular)
in the upper side of the network then the optimal ement and other roadway that provides collection
calcula96). “D
Transportation Accessibility
Figure No 15
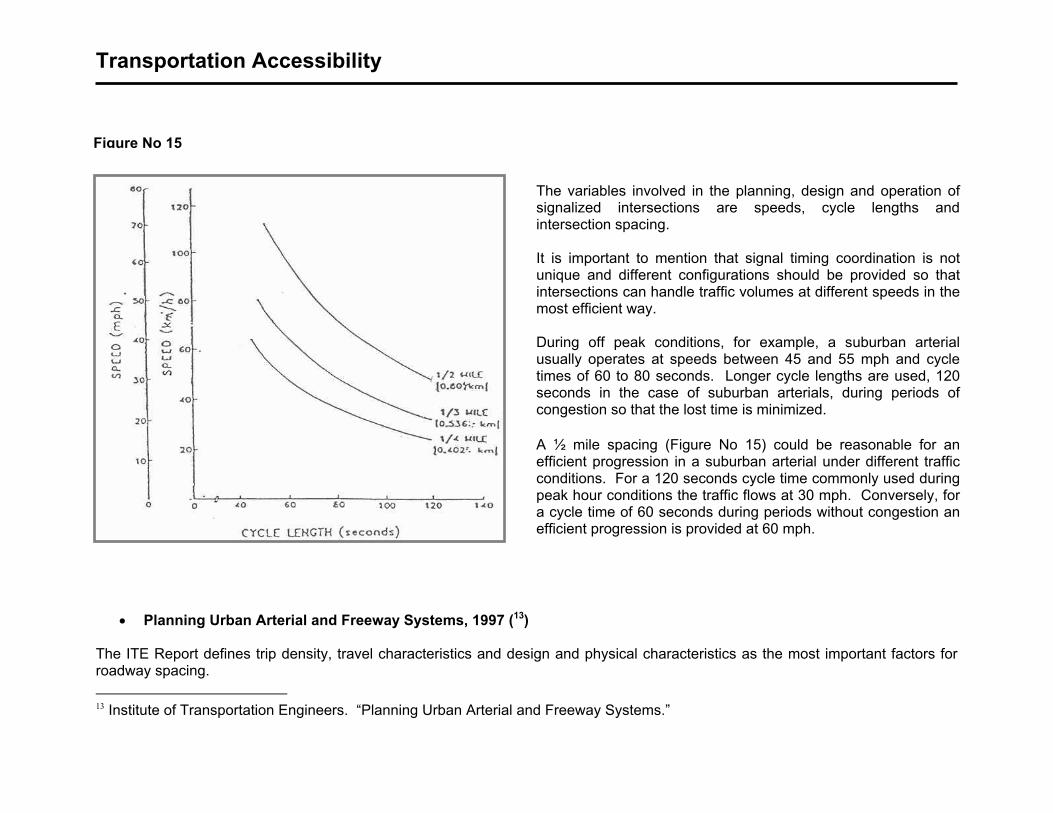
The variables involved isignalized intersectionsintersection spacing. It is important to mentiounique and different cointersections can handlemost efficient way. During off peak conditusually operates at spetimes of 60 to 80 seconseconds in the case ocongestion so that the lo A ½ mile spacing (Figuefficient progression in aconditions. For a 120 sepeak hour conditions thea cycle time of 60 seconefficient progression is p
• Planning Urban Arterial and Freeway Systems, 1997 (13) The ITE Report defines trip density, travel characteristics and design and physical characteroadway spacing. 13 Institute of Transportation Engineers. “Planning Urban Arterial and Freeway Systems.”
n the planning, design and operation of are speeds, cycle lengths and
n that signal timing coordination is not nfigurations should be provided so that traffic volumes at different speeds in the
ions, for example, a suburban arterial eds between 45 and 55 mph and cycle ds. Longer cycle lengths are used, 120 f suburban arterials, during periods of st time is minimized.
re No 15) could be reasonable for an suburban arterial under different traffic conds cycle time commonly used during traffic flows at 30 mph. Conversely, for ds during periods without congestion an rovided at 60 mph.
ristics as the most important factors for
Transportation Accessibility
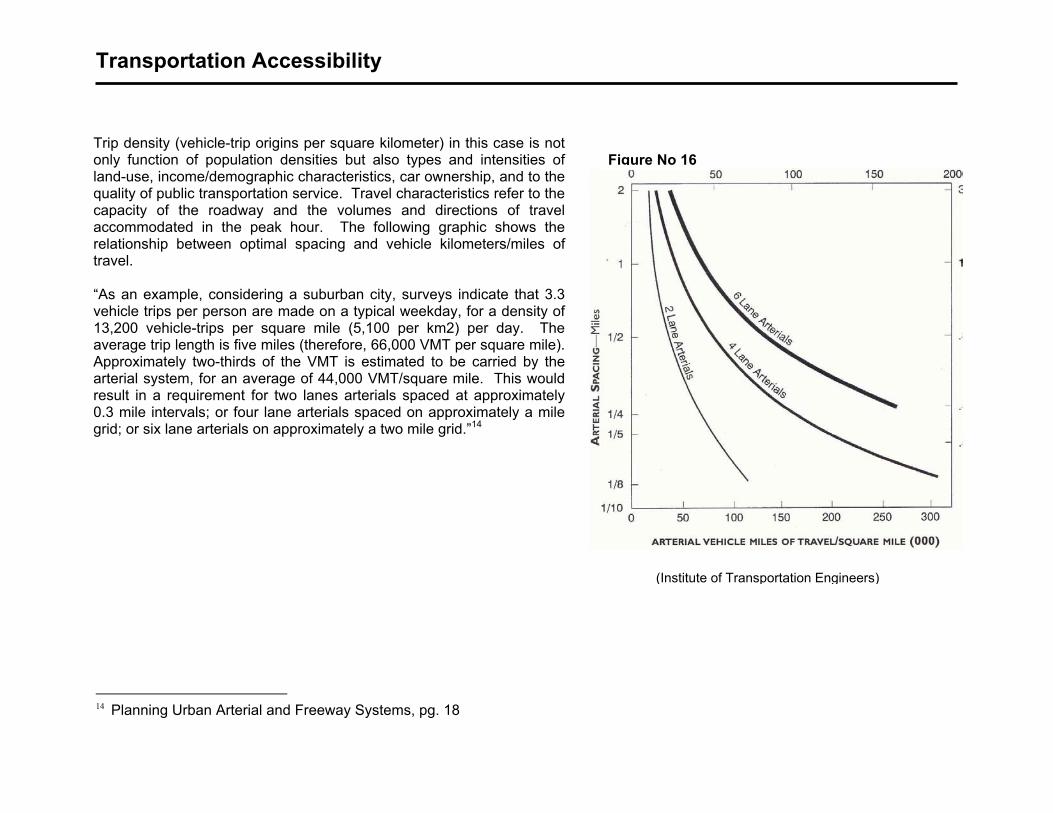
Trip density (vehicle-trip origins per square kilometer) in this case is not only function of population densities but also types and intensities of land-use, income/demographic characteristics, car ownership, and to the quality of public transportation service. Travel characteristics refer to the capacity of the roadway and the volumes and directions of travel accommodated in the peak hour. The following graphic shows the relationship between optimal spacing and vehicle kilometers/miles of travel. “As an example, considering a suburban city, surveys indicate that 3.3 vehicle trips per person are made on a typical weekday, for a density of 13,200 vehicle-trips per square mile (5,100 per km2) per day. The average trip length is five miles (therefore, 66,000 VMT per square mile). Approximately two-thirds of the VMT is estimated to be carried by the arterial system, for an average of 44,000 VMT/square mile. This would result in a requirement for two lanes arterials spaced at approximately 0.3 mile intervals; or four lane arterials spaced on approximately a mile grid; or six lane arterials on approximately a two mile grid.”14
Figure No 16
(Institute of Transportation En
14
14 Planning Urban Arterial and Freeway Systems, pg. 18
gineers)
Transportation Accessibility
5. CONCLUSIONS The most important thing when doing urban planning is to understand the needs of the people for whom decisions are going to be taken. Thus, as people have different perceptions the idea of this study was not to find out the perfect street design for every neighborhood, town or city in the United States. Instead, a set of principles is presented so that communities with different characteristics and street designs can achieve reasonable levels of livability and promote sustainability in the future.
♦
♦
♦
♦
♦
♦
♦
Street design should promote multimodal transportation. This idea not only refers to the need of building the infrastructure for all transportation modes but also to set up the conditions so that different transportation modes are equally attractive. In that sense accessibility should be provided for all transportation modes so that origins and destinations are close to each other.
Mixed land use. Even though some people do like to live in areas where the land use is exclusively residential it is possible to limit the size and separation from other land uses of this residential developments.
Local streets should be design to discourage excessive speed. Some of the benefits of this measure are: reduction in through traffic and more safety for children and pedestrians.
Provide enough number of intersections. If possible, there should be a sufficient number of intersections in the network so that automobiles and other transportation modes have multiple path choices and therefore traffic can spread out uniformly in the network. In some cases multiple intersections can make the use of traffic signals unnecessary reducing delays at intersections.
Whenever there is an excessive use of a particular transportation street designs can be adjusted so that the equilibrium between transportation modes can be achieved. Between this concepts are: Interconnected cul-de-sacs, The Shared Street Concept, Street Closures and Variation on a Grid.
Topographic conditions, population density, speed and cycle lengths are the most important factors to consider in a street spacing study.
As it is discussed in the TRB Circular 456 (1996) street spacing studies should consider different traffic conditions. That means that it is possible to find out the most effective street separation for both peak and off peak hour conditions where vehicle speeds and cycle times are different.
Transportation Accessibility
6. REFERENCES
• Edward Beimborn and Harvey Rabinowitz (1991), “Guidelines for Transit-Sensitive Suburban Land Use Design”
• Institute of Transportation Engineers (1984). “Planning Urban Arterial and Freeway Systems.”
• Margaret A. Kubilins (1999). “Designing Functional Streets that Contribute to Our Quality of Life.” TRB Circular E-CO19: Urban Street Symposium.
• Mayo, J. (1979). “Suburban Neighboring and the Cul-de-Sac Street.”
• Southworth / Ben-Joseph (1997). “Streets and the Shaping of Towns and Cities”
• TRB Circular 456 (1996). “Driveway and Street Intersection Spacing” • Walter Kulash (1990). “Will the Traffic Work?” Presented at the 11th Annual Pedestrian Conference in Bellevue WA, October
1990.
• Wilbur Smith and Associates (1961). “Future Highways and Urban Growth”