Transport Strategy Review: Context and Way Forward
46
Tunbridge Wells Borough Council Transport Strategy Review: Context and Way Forward September 2019
Transcript of Transport Strategy Review: Context and Way Forward

Tunbridge Wells Borough Council
Transport Strategy Review: Context and Way Forward
September 2019

Page
2 of 46
Tunbridge Wells Borough Council
Transport Strategy Review: Context and Way Forward
Date of publication – September 2019
Introduction .............................................................................................................................. 3
Purpose ................................................................................................................................ 3
Why do we need a Transport Strategy? ............................................................................... 3
Transport roles and responsibilities ...................................................................................... 4
Transport challenges ............................................................................................................ 4
Current travel behaviour in the borough ............................................................................... 4
Future Changes in Travel Behaviour and New Technology ..................................................... 8
Supporting Growth and the Local Economy ....................................................................... 11
Road Safety........................................................................................................................ 13
Traffic Dominance and Congestion .................................................................................... 16
Public Transport ................................................................................................................. 18
Bus ................................................................................................................................. 18
Taxis ............................................................................................................................... 19
Rail ................................................................................................................................. 20
Rural Transport Issues ....................................................................................................... 22
Environmental Issues ......................................................................................................... 24
Climate Change .............................................................................................................. 24
Air Quality ....................................................................................................................... 26
Public Health ...................................................................................................................... 28
Active Travel....................................................................................................................... 29
Parking ............................................................................................................................... 31
Transport Funding .............................................................................................................. 33
Appendix A: Reference Documents ....................................................................................... 39
Appendix B: Local Plan Infrastructure Delivery Plan .............................................................. 44
Appendix C: Local Plan Transport Assessment Report 2019 (prepared by Sweco) .............. 45

Page
3 of 46
Tunbridge Wells Borough Council
Transport Strategy Review: Context and Way Forward
Date of publication – September 2019
Introduction
Purpose
1. This paper sets the scene for a review of the Council’s current Transport Strategy. It
explains the contextual framework for the review, including key challenges, from
which proposed aims for the review are put forward. The updated Transport
Strategy will complement and integrate with the emerging new Local Plan for the
borough. Hence, the paper sets out how the proposed aims clearly link with relevant
objectives and policies in the new Draft Local Plan.
Why do we need a Transport Strategy?
2. The Tunbridge Wells Transport Strategy is being prepared to:
• support future development in the borough;
• address existing transport issues; and
• identify new opportunities in mobility.
3. The Strategy is being prepared alongside the Tunbridge Wells Local Plan (Appendix
A) and the associated Infrastructure Delivery Plan (Appendix B) which is seeking to
deliver approximately 13,500 new homes across the Borough between 2016 and
2036 and, in addition up to 14 hectares of new employment floorspace to retain
existing and create new jobs. This development will support the continued
prosperity of the borough and new infrastructure is required to ensure that it does
not result in negative impacts on the existing transport network.
4. There are other challenges relating to the existing transport network and services
that also need to be addressed. In addition, significant advances in data collection
and use, as well as other developments in new transport technology, will lead to
changes in the way people travel in the future. The Transport Strategy will need to
take a carefully considered approach to these changes, to ensure that the benefits
of new technology are maximised for the borough.
5. There are a significant number of policies in the Local Plan that refer to sustainable
design, infrastructure, digital connectivity, transport, travel and parking issues and
these are referenced in this paper.

Page
4 of 46
Tunbridge Wells Borough Council
Transport Strategy Review: Context and Way Forward
Date of publication – September 2019
Transport roles and responsibilities
6. Tunbridge Wells Borough Council (TWBC) is the Local Planning Authority for the
borough and also has delegated responsibility for Civil Parking Enforcement under
the Traffic Management Act 2004. TWBC also undertakes street cleaning, the
licensing of taxis and private hire vehicles, manages the contract for the provision of
bus shelters (within the urban area of Royal Tunbridge Wells) as well as some of
the street lighting, and the monitoring and improvement of air quality.
7. Kent County Council (KCC) is the Local Highway Authority for Kent and is
responsible for the management and maintenance of all adopted roads in the
county, other than motorways and trunk roads, which are the responsibility of
Highways England. KCC also has responsibility for road safety, procuring socially
necessary public and school bus services and in maintaining cycle routes and
public rights of way (PROW), and promoting active travel.
Transport challenges
8. This paper sets out the key challenges relating to both the existing and the future
transport network and services, that we know are of importance to the lives of local
people and that impact on the built and natural environment. The transport
challenges facing Tunbridge Wells borough and the UK as a whole, are such that
the policy response will need to come from all tiers of government, not just at the
local level. For example changes in regulation or fiscal measures such as new
taxation or incentives are likely to be needed from national government. Private
sector investment will also be required to address some issues.
9. In May 2019 the Government declared an environment and climate emergency and
in July 2019, TWBC also passed a motion at Full Council, declaring its recognition
of global climate and biodiversity emergencies (see the Full Council Motion July
2019).
Current travel behaviour in the borough
10. The most recent information about travel behaviour in the borough is available from
national census data (see 2011 Census Data). The most recent data is from 2011,
but the travel patterns that are shown are still relevant as an indicator for today.
11. Figure 1 shows car ownership levels in the borough in 2011. The borough as a
whole is shown as having a higher than average car ownership compared with the
rest of Kent and the South East region with 39% of borough households having
more than one car. The rural areas of the borough had the highest car ownership
levels especially in Brenchley & Horsmonden. The lowest levels of car ownership
per household were found in the urban areas of the borough such as Culverden,

Page
5 of 46
Tunbridge Wells Borough Council
Transport Strategy Review: Context and Way Forward
Date of publication – September 2019
Park, Sherwood and St James. The data also showed that in 2011, 17% of
households did not have any car or van available for private use, which means that
access to other means of travel is likely to remain very important for a significant
proportion of borough residents.
Figure 1: Car ownership in Tunbridge Wells borough
12. Although it is anticipated that car ownership will remain high in Tunbridge Wells
borough, nationwide evidence also shows that car ownership is static in every age
group in the UK except the over 60s (see Centre for the Reduction of Energy
Demand Studies (CREDS) Report: Shifting the Focus 2019).
13. A high level of car ownership does not necessarily lead to higher than average
levels of car commuter trips. In fact, recent evidence suggests that in the UK, on
average, cars are parked for over 98% of their lifetime, with a third of all cars not
being used on a daily basis (CREDS 2019). Figure 2 shows that in 2011 53% of
residents travelled to work by car in the borough. However, when considering the
number of residents commuting by train to London, the presence of walkable
neighbourhoods near to town centre employment opportunities and the significant
number of residents working mainly from home, the overall picture is a more
balanced modal split than might be expected from car ownership statistics.

Page
6 of 46
Tunbridge Wells Borough Council
Transport Strategy Review: Context and Way Forward
Date of publication – September 2019
Figure 2: Travel to work by mode in Tunbridge Wells borough
14. Figure 3 shows the distances that people were travelling to work in 2011. The
average distance is higher than that for Kent and the wider South East region, as
trips to London fall into the 40km+ category. However, the data also shows a high
proportion of residents travelling less than 5km (31%) which suggests that there
should be scope to increase the number of trips made on foot or by bike with
appropriate infrastructure improvements. The data shows that the distances
travelled is higher for residents in the rural areas of the borough for example those
living in Frittenden, Sissinghurst, Goudhurst and Lamberhurst.
Figure 3: Distance travelled to work in Tunbridge Wells borough
15. The 2016 Economic Needs Study for the borough (prepared as part of the evidence
base for the Local Plan) provided information about the Travel to Work Area
(TTWA) for Tunbridge Wells borough, using information from the 2011 census (view
the Economic Needs Study). The TTWA boundary shows where “at least 75% of

Page
7 of 46
Tunbridge Wells Borough Council
Transport Strategy Review: Context and Way Forward
Date of publication – September 2019
the area’s resident workforce work in the area and at least 75% of the people who
work in the area also live in the area.”
16. Figure 4 below shows the extent of the local Travel To Work Area centred around
Royal Tunbridge Wells. It covers the towns of Sevenoaks, Tonbridge, Crowborough
and surrounding villages in adjacent authorities, including the north west of Rother
and Wealden districts. The figure highlights the importance of the strategic transport
links (roads and public transport routes) between these settlements for commuter
journeys.
17. The main commuter inflows to Tunbridge Wells borough for work are from
Tonbridge & Malling and Wealden and the main outflows are to Tonbridge & Malling
and London, again showing the importance of the rail links to the City of London or
Westminster.
Figure 4: Travel to Work Area, Tunbridge Wells Economic Needs Study 2016, Turley Economics
18. Figure 5 shows the residential population of the borough split between the urban
and rural areas. There will need to be different transport policy approaches required
to support both urban and rural communities.

Page
8 of 46
Tunbridge Wells Borough Council
Transport Strategy Review: Context and Way Forward
Date of publication – September 2019
Figure 5: Urban and rural population split in Tunbridge Wells borough
Future Changes in Travel Behaviour
and New Technology
19. It is widely recognised that there will be significant changes in the UK population’s
travel behaviour over the next decades, including in Tunbridge Wells borough.
Some of these changes will result in an increased number of vehicle trips on the
network and others to a decrease. Forecasts point to an overall growth in travel
demand driven by population growth, while on an individual basis people are
generally travelling less than they did 20 years ago (see DfT Future of Mobility
2019).
20. Some of the reasons for the future changes in travel demand are set out in the table
below:
Table 1: Reasons for future changes in travel demand
Increase in vehicle trips Decrease in vehicle trips
Population growth Commuter journeys reduced due to working
from home, part-time working and self-
employment: -16% between 1995 and 2014
(DfT Future of Mobility 2019)
“Multiple changes in transport technology are happening at once….At the same time
significant demographic economic and behavioural trends are changing how and when
we travel. Together these technology and demand led changes are driving new
business models that could have transformative effects of their own.” (Department for
Transport (DfT) Future of Mobility: Urban Strategy March 2019)

Page
9 of 46
Tunbridge Wells Borough Council
Transport Strategy Review: Context and Way Forward
Date of publication – September 2019
Increase in vehicle trips Decrease in vehicle trips
Employment growth Shopping trips reduced to town centres and
retail parks: -30% reduction in last decade with
18% of purchases now made online (DfT Future
of Mobility 2019)
Increased freight deliveries e.g. internet
deliveries: evidence gathering is required to
quantify this trend
Younger people less likely to own cars as
staying in education longer and starting families
later (although they may have access to family-
owned vehicles)
Population ageing and more older people driving Technology for mobility as a service, allowing
vehicle sharing: more likely to be adopted by
younger people
Reduction in rural bus service mileage: leading
to greater dependency on private vehicles
Greater take up of cycling and walking:
(particularly in cities where funding for cycling
infrastructure has been focused to date)
21. Some of the trends above are already affecting the borough, for example pressure
on rural bus services, reduced footfall in town centres as a result of online shopping
and an increasing number of delivery vans in residential areas.
22. The new technology that will lead to changes in travel patterns can be summarised
as follows:
• Data availability and improved connectivity are transforming journeys: e.g.
planning multi-stage journeys, optimising public transport network management,
mobility as a service (see Section 7);
• Transport is becoming increasingly automated: e.g. improved sensing
technology already in many vehicles, speed limitors (intelligent speed assistance
system) and self-driving vehicles being widely tested;
• Transport is becoming cleaner: e.g. electric vehicles and biofuels; and
• New modes are emerging: e.g. micro-mobility (electric scooters), vertical take off
and landing unmanned aircraft (drones).
23. There are potential benefits and risks to these new technological developments,
shown in the table below:
Table 2: Potential benefits and risks
Potential Benefits Potential Risks
• More inclusive transport system: lower
running costs make it more affordable for
travellers
• Safer streets: advances in automation and
vehicle sensors
• Safety and security threats: cyber crime
• Risks to public transport viability: decline in
rural buses
• Digital and financial exclusion: people need
to be on relevant digital platforms

Page
10 of 46
Tunbridge Wells Borough Council
Transport Strategy Review: Context and Way Forward
Date of publication – September 2019
Potential Benefits Potential Risks
• Smoother journeys: booking and paying
made easier
• Increased active travel and use of public
transport: e.g. bike sharing
• Environmental benefits (CO2 emissions, air
& noise pollution reduced): electric vehicles
• Unlocking space from cars to people: fewer
vehicles parked on streets
• Tackling congestion: maximise the capacity
of the network
• Improving productivity: free up travel time for
work
• Attracting investment and creating jobs: in
the knowledge economy
• Health & wellbeing: door to door mobility
options reduce walking & cycling
• Social isolation: more home working
• Privacy risks: increased use of data
• Urban sprawl: easier travel options leading
to longer journeys
• Local environmental impact: disruptive
modes e.g. drones
• Increasing congestion: if vehicle sharing is
not adopted
• Power supply: lack of national provision to
meet demand
• Loss of jobs and new skills needed: fewer
driving roles
24. There is a need for central and local government to work together to ensure that the
benefits of new technology are realised and the risks mitigated. For example, the
results of exploratory analysis into the effect of self-driving vehicles on traffic growth
(between 2015 and 2050) shows that road traffic could grow between 55 – 71% if
ride-sharing is not embedded to increase vehicle occupancy rates (see DfT Future
of Mobility 2019).
25. In discussing the future for public transport, the concept of Mobility as a Service
(MaaS) is now entering common parlance. “Mobility as a Service (Maas) is a term
used to describe digital transport service platforms that enable users to access, pay
for and get real-time information on a range of public and private transport options.
These platforms may also be linked to the provision of new transport services.” An
early example of this is the national rail provider SNCF in France that is partnering
with a digital ride-sharing business in order to offer integrated, multi-modal ticket
options to customers.
26. MaaS would be a major change from transport being provider-led to being a user-
led system, where the level and type of transport adjusts continually in response to
the requirements of travellers. There is already a culture of ‘collaborative
consumption’ amongst younger people, where possessions are lent or borrowed.
This lends itself to the concept of MaaS. However, in order to facilitate the
widespread adoption of MaaS, there will be a need for the government to set open
data policies and create the right conditions for businesses and users to share data.
27. Studies into the impact of technological changes on transport suggest that local
authorities need to take an approach that is flexible and adaptable: “major
challenges exist for policymakers, who will need to balance the promised benefits
with issues such as safety, data security and privacy, equity and the threat of
marketplace distortion by dominant unscrupulous suppliers” (see Mobility as a

Page
11 of 46
Tunbridge Wells Borough Council
Transport Strategy Review: Context and Way Forward
Date of publication – September 2019
Service in the UK: Change and its implications, Government Office for Science
2018).
Supporting Growth and the Local Economy
28. Having an efficient transport network is essential to the vitality and competitiveness
of the borough’s businesses. The strategic transport network in the borough must
support the local economy and provide access for customers, employees, delivery
of goods and servicing.
29. There have been recent improvements to the strategic road network with the
dualling of the A21, the Longfield Road widening scheme and junction
improvements on the A26 in Southborough. However, the A264 and A26 remain
congested corridors during peak hours. In addition, the A228 at Colts Hill, and the
A21 south of Royal Tunbridge Wells at Kippings Cross are both bottlenecks,
preventing the efficient flow of traffic at peak times. Transport congestion is also an
issue in other parts of the borough including, for example, the A229/A268 in the
centre of Hawkhurst. These roads provide important access to and from the
borough’s Key Employment Areas and current congestion levels are a constraint on
the performance of local businesses. They also provide appropriate routes for
freight vehicles servicing the borough.
30. The growth that will be delivered in the borough through the new Local Plan will
need to be supported by appropriate transport infrastructure and services. A
Transport Assessment for the Plan has been undertaken and has identified the
schemes that are required to ensure that the proposed housing and employment
growth can be accommodated without a negative impact on the borough’s existing
Policy Aim: Tunbridge Wells to be an early adopter of appropriate new technology, as
referenced in the Local Plan Strategic Objectives 3 and 8:
To prioritise active travel, but where necessary to plan appropriately for use by private
motor vehicle, in particular embracing new technology.
To tackle climate change and minimise the impact of development on communities, the
economy, and the environment with carefully considered design and by embracing
technology, such as renewable energy generation.
Policy Implementation: Facilitate 5G and other smarter corridor digital infrastructure,
explore possibility of autonomous vehicles pilots.
“Enabling growth without gridlock has been highlighted as a key challenge for Kent &
Medway and one that will only be achieved through a combination of measures that
influence behaviour and improve infrastructure.” (Kent County Council Kent & Medway
Energy and Low Emissions Strategy Consultation July 2019)

Page
12 of 46
Tunbridge Wells Borough Council
Transport Strategy Review: Context and Way Forward
Date of publication – September 2019
network (Appendix C). These measures will include highway improvements (links
and junctions), innovative bus services and new public transport routes as well as
better infrastructure for walking and cycling. On a borough-wide basis a modal shift
away from the car will be required to accommodate the proposed growth. The
National Planning Policy Framework 2019 sets out that new development should
give priority to pedestrians, cyclists and high quality public transport (see the NPPF
2019) and this is reflected in policies in the emerging Local Plan for example Policy
STR6: Transport and Parking and criterion 6 of STR7: Place Shaping and Design.
31. High streets and town centres across the country have been undergoing change for
some time and the challenges relating to this are becoming increasingly obvious
and a matter of widespread concern (approximately 20% of shopping is now
undertaken online). As more people have changed the way that they shop, their
expectation of town centres has also changed. Many visitors to town centres are
seeking an ‘experience’ that cannot be bought online, such as events and festivals.
Evidence from other towns shows that better streets and pleasant public spaces
can add to the visitor experience and therefore play a part in supporting town centre
businesses.
32. There is considerable evidence from recent research (for example in parts of
London) to suggest that investment in walking and cycling can lead to:
• Footfall increase;
• Longer dwell times;
• Higher spend;
• Fewer retail vacancies; and
• Rental values increasing. (see Transport for London, Walking & Cycling in
London: the economic benefits 2018 and Living Streets, The Pedestrian Pound
2018)
33. Tunbridge Wells Borough Council has been seeking to support town centre
businesses through the public realm improvements at Fiveways and on Mount
Pleasant Road in Royal Tunbridge Wells. This will create a better environment for
pedestrians, cyclists and those using public transport and will encourage people to
stay longer in the town centre in a more pleasant environment.
34. Whilst some new infrastructure is needed to support local businesses, the
businesses themselves also should be encouraged or incentivised to reduce their
carbon footprint for example through increased use of technology to conduct virtual
meetings, providing changing facilities for active commuting or by promoting car
sharing. In recent years a number of grant schemes have been available to support
businesses in this: for example the LoCase scheme (EU Funded) provided
businesses with grants of up to £20,000 to assist them with the adoption of electric
vehicles, while the Kent County Council Sustainable Travel Grant is an annual
programme which offers businesses with grants to provide facilities for employees
to use that will encourage sustainable travel to work.

Page
13 of 46
Tunbridge Wells Borough Council
Transport Strategy Review: Context and Way Forward
Date of publication – September 2019
Road Safety
35. Over recent years the issue of road safety has been highlighted by borough
residents as a key concern and one that has an impact on their choice of mode for
travel. The personal injury crash statistics for the borough in 2017 are shown in the
table below:
Table 3: Personal injury crash statistics for Tunbridge Wells Borough in 2017 (Source: Kent County Council crash data 2019)
Crash Type (2017) Collisions Casualties
Fatal 5 7
Serious 46 51
Slight 235 323
Total 286 381
36. Between 2016 and 2017 there was an overall increase in the number of casualties.
This was a result of an increase in the number of pedestrian casualties and
Policy Aim: Maintain and improve transport infrastructure at the strategic and local level
(including rail, highways, bus and cycle networks) as set out in Local Plan Policy STR6:
Transport and Parking. Specific policies in the Local Plan including STR/CA1,
STR/PW1, AL/HA1, AL/HA3, ALPW1 and AL/PW2
Policy Implementation: Ensure provision of new infrastructure through working with
developers, submit bids for funding (e.g. Local Growth Fund) for infrastructure
improvements to deliver growth, take balanced approach to parking standards in new
development and parking provision in town centres, public realm improvements in town
and village centres, work with businesses to reduce travel footprint grants to
businesses to support active travel.
“Minimising road danger is fundamental to the creation of streets where
everyone feels safe walking cycling and using public transport.” (Transport for
London Mayor’s Transport Strategy for London 2018)
“It is vital that death and injury on Kent roads continues to be tackled as
effectively as possible by all agencies involved. We all must recognise that the
way we drive ride or walk plays a huge part in avoiding us or our dependents
becoming a road casualty.” (Kent County Council Road Casualty Reduction
Strategy 2014 updated 2017)

Page
14 of 46
Tunbridge Wells Borough Council
Transport Strategy Review: Context and Way Forward
Date of publication – September 2019
particularly in the number of incidents involving older people (over 65 years). The
target for the borough should be zero casualties (as adopted by other authorities).
37. The Transport Research Laboratory (TRL) has identified three main factors behind
incidents that cause death and injury on the road: the Environment (the road), the
Machine (the vehicle) and the Road User Behaviour (the human). These are shown
in the graphic below:
Figure 6: Factors involved in crashes (source: see Transport Research Laboratory)
38. The research shows that 2% of crashes are caused solely due to a poor road
environment; 3% are solely due to vehicle failure; whilst 76.6% are solely due to the
behaviour of the road user. When adding elements where poor road user behaviour
mixes with a poor environment and/or a mechanical failure, it takes the human
factor to 95% causation. Therefore, the key to improvements in road safety is
changing the way that road users interact with their environment and their vehicle.
39. Kent County Council’s approach to road safety is set out in the Kent Road Casualty
Reduction Strategy 2014 (updated in 2017). The Strategy recognises the
importance of influencing the road user through the ‘3 Es’ of Education,
Enforcement and Engineering. The County Council collects data in order to
prioritise locations for safety schemes to address accident black spots.
40. Many towns and cities in the UK (for example Brighton and Edinburgh) have now
adopted area-wide 20mph speed restrictions, as part of a package of measures to
improve highway safety and encourage more walking and cycling. Kent County
Council has recently reviewed its policy on the introduction of 20mph speed
restrictions and will consider:
• if the speed restriction is likely to address several issues including reducing
speeds, road crashes and improving the road environment for people walking
and cycling;
• if there is clear evidence of local support which outweighs opposition; and

Page
15 of 46
Tunbridge Wells Borough Council
Transport Strategy Review: Context and Way Forward
Date of publication – September 2019
• all the factors affecting a road environment, not only the existing average
speeds, for example public health indicators and air quality.
41. Some of the design and engineering measures that can be used to lower speeds
include:
• signs and road markings;
• raising pedestrian crossing points, including at side road junctions (raised
tables);
• widening footpaths and creating more space for cycling;
• removing the white line in the centre of the road or changing the surface of the
road; and
• preventing rat running by closing road junctions to allow residential roads to be
used by cyclists and pedestrians, and to keep through traffic on the main roads.
42. There is an active 20s Plenty action group in the borough and a number of 20mph
schemes have been introduced recently including: Royal Tunbridge Wells town
centre at Five Ways and on Mount Pleasant Road; in Speldhurst village; to the east
of High Brooms station (Oak Road/Clifton Road); and in St Johns to the north of
Royal Tunbridge Wells town centre. Design work is currently underway for a 20mph
scheme in Culverden also. These initiatives have been well supported by local
residents, although there are still concerns about enforcement of limits. Community
Speed Watch groups, that promote awareness of speeding vehicles and encourage
positive driver behaviour are supported by the borough’s Community Safety Unit
and have been set up in some of the 20mph areas.
43. In the future, all vehicles may be fitted with intelligent speed assistance systems
(ISA) which are intended to assist drivers to stay at the most appropriate speed for
the road that they are on. ISAs operate by limiting engine power with information
either from links to GPS satellite navigation technology or by a camera that can
read speed limit signage. However, this technology is still developing at present and
operational problems still remain. Once 5G connections are more widely available,
the opportunity for vehicle to infrastructure communication becomes possible. This
would allow signs and traffic lights, for example, to transmit information to vehicles.

Page
16 of 46
Tunbridge Wells Borough Council
Transport Strategy Review: Context and Way Forward
Date of publication – September 2019
Traffic Dominance and Congestion
44. Whilst motorised road transport provides benefits to many, including comfort and
convenience, there is a cost to society. The dominance of the car as a mode of
transport can lead to congestion, more road accidents, air and noise pollution. In
addition, it contributes to climate change, reduces social cohesion and leads to less
healthy lifestyles (see Sections 9 and 10).
45. It is recognised that residents living in the rural areas of the borough are more
dependent on cars for many journeys, due to limited access to public transport and
the greater travel distances to facilities (see Section 8 below). However, over the
past 50 years car-centric development has led to many people becoming dependent
on driving. Out of town businesses and retail parks have also contributed to this
trend.
46. Peak hour congestion has been an issue for the borough for a number of years with
some key routes suffering significant delays during the AM peak period in particular
(the PM peak is generally spread over a wider time period). As already noted in
Section 4, the A264 Pembury Road and the A26 London Road/St John’s Road into
Royal Tunbridge Wells both experience severe congestion during peak hours, as
does the A229 at Hawkhurst.
Policy Aim: Eradicate deaths and serious injuries from the borough’s transport network
(a vision zero approach). Relevant Local Plan policies include STR6 Transport and
Parking, STR7: Place Shaping and Design, TP2: Transport Design and Accessibility.
Reference to speed restrictions in policies for Benenden (STR/BE1), Sandhurst
(STR/SA1) and Speldhurst (AL/SP2).
Policy Implementation: Speed restrictions and associated engineering measures,
remedial schemes for accident black spots, better maintenance of highways, improved
infrastructure for walking and cycling, education programmes for road safety (for all
users), community speed watch and other community involvement programmes,
appropriate levels of police enforcement.
“While the rise of motor transport has brought substantial benefits high levels of car
ownership and use have also brought serious challenges.” (DfT Future of Mobility
Urban Strategy 2018)
“Enabling and encouraging a shift from private motorised travel to more energy efficient
modes requires systematic support for the very lowest energy methods of transport –
walking cycling (including e-bikes and e-scooters) and public transport through
investment programmes on both capital and revenue spending priority use of road
space and an expansion of ‘soft’ or ‘smarter’ methods of encouraging behavioural
change.” (CREDS: Shifting the Focus Oxford University 2019)

Page
17 of 46
Tunbridge Wells Borough Council
Transport Strategy Review: Context and Way Forward
Date of publication – September 2019
47. Another problem linked to congestion is rat-running, often experienced on
unsuitable residential streets, as a result of motorists trying to avoid delays on the
more strategic routes. It is recognised that this is a concern for people living in the
borough for example in streets off the A26. Rat-running can be addressed by
introducing road closures for through traffic, whilst retaining local access and routes
for pedestrians and cyclists. Both evidence-based studies and experience from
elsewhere suggests that closing streets can lead to ‘traffic evaporation’ – a
decrease in car use as a result of changes in mode or reduced travel overall. This
has been the experience in the London Borough of Waltham Forest (visited by
Councillors and Officers from KCC and TWBC in 2019).
48. There is a need to improve the efficiency of the road network in the future, in
support of the growth to be delivered via the Local Plan. This will include new link
roads, junction improvements and greater co-ordination of traffic signals for
example. Nevertheless, it is not possible to build our way out of congestion,
especially within existing urban areas with historic road layouts or in parts of the
borough where the natural environment would suffer significant negative impacts.
49. Some of the developments in technology mentioned earlier, could assist in
addressing the issue of car dominance. For example, automated vehicles are likely
to drive more efficiently than people, leading to smoother traffic flows. If the
introduction of automation is well managed, it could help tackle congestion and air
pollution, improve connectivity and boost the local economy. It could also make
urban areas more pleasant places to be, as well as increasing the convenience and
affordability of travel and widening access to mobility for older people and those
with disabilities. However, if not managed appropriately, automated mobility could
worsen congestion and have negative public health outcomes.
50. In order to alleviate the problems associated with car dependency and traffic
dominance there is a need to reduce car use overall, through facilitating modal shift
towards walking, cycling and public transport use, car sharing or by travelling less
for example through more home working and virtual meetings. With reference to
this, the Kent Environment Strategy (Kent County Council 2016) acknowledges the
importance of promoting smarter working through supporting investment in digital
technologies that enable flexible working and workspaces.
51. Whilst recognising that the car will remain an important mode of travel for some
journeys, this does not mean that measures to encourage modal shift for shorter
journeys should not be implemented. This may require the reallocation of road
space in some locations. It is notable that in other towns and cities where seemingly
difficult decisions have been taken to reclaim road space from the car (for example
in Waltham Forest), this has not led to increased congestion but to a decrease in
car use and better streets for people to live in. This has generally been supported
by local people and has resulted in benefits to the local economy.
Page
18 of 46
Tunbridge Wells Borough Council
Transport Strategy Review: Context and Way Forward
Date of publication – September 2019
Public Transport
Bus
52. The borough has a good network of buses within the urban areas. The best served
routes in the borough include the A26 between Tonbridge and Royal Tunbridge
Wells (Arriva services 7/402 providing a 10 minute frequency) and services from
Rusthall through Royal Tunbridge Wells to High Brooms (Arriva Service 281
providing a 15 minute frequency). In addition, buses bring a high proportion of
pupils to the many secondary schools in the borough. However, as an overall share
by mode, usage is very low in the borough.
53. Approximately 95% of bus services in Tunbridge Wells borough are operated on a
commercial basis and do not require local authority support. The remainder are
either wholly or partly subsided by KCC, to provide ‘socially necessary’ services,
particularly focused on rural areas and access to education.
54. The Council has a positive working relationship with the 9 bus operators that serve
the borough, with regular meetings held to address current issues of concern and
assist in the planning of future services. TWBC and KCC have signed a voluntary
Quality Bus Partnership Agreement with the borough’s principal commercial bus
operator, Arriva, which commits all parties to invest jointly in local bus services and
supporting infrastructure. One of the issues frequently raised by all the bus
operators, is the lack of layover parking for drivers between journeys in Royal
Tunbridge Wells town centre when drivers need a break. A number of the operators
now use the parking intended for coaches on London Road, as well as the bus
stands in Meadow Road, but there is limited space available. This is an issue that
Policy Aim: Plan to reduce the need to travel overall and where it is necessary, prioritise
active travel and public transport as an alternative means of travel to the private car as
set out in Local Plan Policy STR6: Transport and Parking and STR7: Place Shaping and
Design and TP2: Transport Design and Accessibility.
Policy Implementation: Overall Local Plan development strategy and subsequent
development management decisions, facilitate infrastructure for walking and cycling
through preparation of Local Cycling and Walking Infrastructure Plan (LCWIP) and
bidding for funding, consider schemes to reduce rat-running (filtered permeability
measures), expansion of car club, explore options for congestion charging and parking
charges and restrictions.
“Buses can move 70 people in the same amount of space taken up by about three
cars. Many trips that people make by car which they may not want to make by foot
or cycle can be switched to the bus.” (Transport for London Mayor’s Transport
Strategy for London 2018)

Page
19 of 46
Tunbridge Wells Borough Council
Transport Strategy Review: Context and Way Forward
Date of publication – September 2019
will need to be considered further if the transport strategy is seeking to support a
greater modal shift to bus services from the car.
55. TWBC and KCC seek to support bus services through Section 106 agreements with
developers where appropriate, particularly to get new services started in the
expectation that they can become commercially viable over time as well as the
provision of appropriate infrastructure such as bus shelters and seating.
56. Many of the bus companies in the borough are now seeking to innovate to attract
more passengers and ensure that bus travel is an attractive travel alternative to the
car. Recent innovations include on-vehicle contactless payment and mobile apps to
enable passengers to access real time information about bus schedules. New
vehicles have been introduced on some routes that are more comfortable, with
services such as wifi and charging points on board. In addition, operators are
running demand-responsive services in some locations e.g. Arriva Click in
Sittingbourne. The cost of tickets remains an issue that impacts on this choice of
mode (for example parking for a day in Royal Tunbridge Wells can be cheaper than
a return bus ticket from Tonbridge to Royal Tunbridge Wells), not taking into
account the whole cost of running a car.
57. A Study was undertaken in 2018 to consider the option of a Park & Ride bus service
centred on Royal Tunbridge Wells (see the TWBC Park & Ride Feasibility Study).
The study showed that park and ride services could work, particularly on the A264
Pembury Road and on the A26 south of the town centre. However, there was
limited benefits in terms of journey times and the services would need long term
financial subsidies (as is the case in many other locations in the UK).
58. Increasingly, Local Authorities are introducing Emissions Standards for the bus
fleets. One consequence of this is that, as bus fleet operators use their newer,
cleaner buses in areas where emissions standards have been introduced, they shift
their older more polluting buses to the areas where no standards apply. TWBC
therefore needs to ensure that appropriate standards are established so that the
vehicles deployed in the borough are as clean as possible. Kent County Council has
recently partnered with Renault Trucks to provide an electric minibus for the local
charity Compaid’s accessible transport services to for disabled and vulnerable
people in the borough. It is the first pilot in KCC’s sustainable transport approach, to
assess the longer term financial and environmental benefits of electromobility. Later
on in the year, KCC and the local bus operators will be trialling larger electric
vehicles on some services in the borough.
Taxis
59. Taxis and Private Hire Vehicles (PHVs) can assist in tackling congestion and
encourage sustainable travel by reducing the need for car ownership. They can also
play an important role in providing access to services for rural residents and those
who are unable to use conventional bus services (e.g. older people). The Council’s
Licensing Partnership is responsible for the regulation of the taxi trade within the

Page
20 of 46
Tunbridge Wells Borough Council
Transport Strategy Review: Context and Way Forward
Date of publication – September 2019
Borough and has recently commissioned a Hackney Carriage Unmet Demand
Survey. This work encompasses stakeholder consultation on the level of service
provided by licensed vehicles in this area.
Rail
60. Rail services in the borough are operated primarily as part of the South Eastern
Franchise, which is specified by the Department for Transport (DfT). The franchise
is currently held by Southeastern and has been extended by direct award to
November 2019, with a possible extension to April 2020. The west of the Borough
also has access to services by Southern on the Oxted Line, from Ashurst station
and the Medway Valley Line links Tonbridge (via Paddock Wood) to Maidstone and
Strood, operated by a Community Rail Partnership.
61. The Council seeks to lobby the rail operators for improvements to services as
opportunities arise and recently provided feedback to the consultation on the new
rail franchise. Both Southeastern and Network Rail regularly attend the Tunbridge
Wells Borough Public Transport Forum and report back on service performance and
future plans.
62. As indicated in Section 2 levels of rail commuting in the borough remain high at
present with all the stations and services busy at peak times. It is anticipated that
the new franchise will bring with it new rolling stock that may provide additional
capacity on board the existing services but the number of carriages per train on the
Hastings line is constrained by the power supply to the south of Royal Tunbridge
Wells. The new South Eastern franchise should also provide additional services on
the Medway Valley Line making commuting by train from the borough to Maidstone
a more attractive modal choice. However, Department for Transport franchise
makes no requirement for improved services to Gatwick Airport which would be a
significant benefit for commuters and passengers travelling to and from the airport.
63. Rail companies have also been introducing innovation in their services recently. Rail
passengers have for a long time stated that they would like better information both
about their normal services and particularly in times of disruption. As a result train
operators are introducing digital real time information (on screens and via mobile
applications for customers). This now includes letting passengers know the
crowding levels on the train carriages so that they can stand at the best place on
the platform, allowing for quicker boarding and helping people to find available
seating. In addition, wifi is commonly available on trains and smart ticketing is
becoming more widely available with ticketless travel likely to become the norm in
the near future.
“Further growth in home working is likely to be embraced most by those who are
otherwise most likely to be heavy rail users.” (Williams Rail Review Evidence Paper for
Department of Transport 2019)

Page
21 of 46
Tunbridge Wells Borough Council
Transport Strategy Review: Context and Way Forward
Date of publication – September 2019
64. There is a need for improved bus-rail interchange in the borough, with many
residents choosing to drive to rail stations from rural areas due to the poor levels of
bus provision at present (Paddock Wood, Staplehurst and Marden for example).
There have been recent improvements to cycle parking facilities at both Tunbridge
Wells and High Brooms station and s106 funding has been agreed for
improvements at Paddock Wood station. Lobbying is also required to achieve
access improvements to the stations in the borough so that they are fully accessible
to all those that wish to use the rail services. This is an issue at Tunbridge Wells
and High Brooms.
65. The Government commissioned the Williams Rail Review in September 2018 to
explore the role of rail in the future transport system of the country and the final
report is due in autumn 2019 (see Williams Review – Rail in the Future Transport
System). An initial evidence paper (May 2019) prepared as part of the review,
confirms that due to flexible working, part time and self employment as well as more
home working, the number of rail commuter journeys has decreased. In addition,
increasing flexibility in working patterns in the future may lead to further reductions
in peak time trips by train. This would improve the passenger experience with less
over-crowding and could potentially reduce the need for increased capacity at peak
times. On the other hand the share of leisure rail trips is increasing but these trips
are much more likely to be spread across the day and week.
66. Whilst acknowledging areas of innovation by rail operators, the Williams evidence
paper also recognises that while other modes of transport are changing quickly to
accommodate customer’s requirements, the rail sector is less flexible because if its
long term assets including infrastructure and rolling stock as well as timetables and
destinations. Some of these are difficult (or impossible) to change in the short term.
Policy Aim: Working with partners to achieve the best possible public transport services
(rail, bus, car club, car share and taxi and Mobility as a Service) available to as many
people as possible as set out in Local Plan policy STR6: Transport and Parking, STR7:
Place Shaping and Design, TP2: Transport Design and Accessibility and TP5
Safeguarding Railway Land.
Policy Implementation: Overall Local Plan Development Strategy and subsequent
development management decisions (including s106 agreements), lobbying and
partnering with public transport operators, improved options for smart ticketing,
improving bus stop infrastructure, bidding for funding to support public transport,
facilitating new technology (MaaS), licensing of taxis and management of taxi ranks,
accessibility at rail stations.

Page
22 of 46
Tunbridge Wells Borough Council
Transport Strategy Review: Context and Way Forward
Date of publication – September 2019
Rural Transport Issues
67. It is recognised that rural areas of the borough have particular transport challenges
to face. Rural bus services have seen a reduction in mileage in recent years, due to
pressure on County Council budgets, and for those that do not have access to a car
or other transport there is a danger of social exclusion, especially for young and
older people.
68. KCC’s recent Big Conversation consultation (2018) (see Big Conversation
Feedback) which focused on rural bus services showed that 73% of respondents
felt the availability of public transport restricted the places that they travelled to for
the following reasons:
• Services were too infrequent;
• Timetabling doesn’t cover early or late journey requirements or Sundays;
• Routes are not direct enough or there are too many changes;
• Use of travel passes is restricted to certain times of day;
• Walking distances to bus stops are too long; and
• Too expensive compared to other options.
69. The most important features of a rural transport network that were wanted by
respondents were:
• a timetabled service;
• routes that are relevant;
• good links to the wider bus/train network; and
• prices cheaper than a one-off taxi journey.
70. As a result of this consultation, Kent County Council launched a number of rural
transport pilots in Summer 2019 to assess the potential of Feeder Buses, Bookable
and Taxi Bus services. The only part of Tunbridge Wells borough that is part of a
pilot is Benenden (as part of the Tenterden Hopper Sevice). The impact of the pilot
will be assessed by KCC after one year and these should provide evidence for
services across the County in the future.
71. Some rural communities have set up Car Clubs. For example, Forest Row Parish
Council (in partnership with Transition Forest Row) invested in car club vehicles
“It is far easier to change travel behaviour in urban areas.” (Gordon Stokes Transport
and the Rural Economy Presentation Transport Studies Unit Oxford University 2016)
“On average people living in the most rural areas travel 45% further per year than
those in England as a whole and 53% further than those living in urban areas.” (Action
with Communities in Rural England website 2019)

Page
23 of 46
Tunbridge Wells Borough Council
Transport Strategy Review: Context and Way Forward
Date of publication – September 2019
with the help of a grant from East Sussex County Council. The scheme provides an
alternative to owning a car (or more than one car). It is run by the Parish Council,
with the assistance of three volunteer co-ordinators. The club has three cars at
present and runs successfully.
72. Another issue that is raised frequently by those living in the rural areas of the
borough in particular is the increasing amount of Heavy Goods Vehicle (HGVs)
traffic on unsuitable roads. This can lead to property damage, vibrations/noise and
air pollution as well as congestion. The borough has a few well known hotspots for
this such as the centre of Goudhurst village.
73. Kent County Council can consider the introduction of restrictions for HGVs whilst
taking into account the:
• volume of HGV traffic;
• sensitivity of the area;
• population affected;
• level of HGV access required; and
• availability of suitable alternative routes.
74. The restriction options include environmental limits, structural weight/height limit,
advisory signing and directional signing.
75. In addition, KCC is seeking to work with operators to ensure use of appropriate
satnavs or route mapping that does not lead to HGVs choosing inappropriate
routes. The KCC Freight Action Plan 2012 notes that “unfortunately many of the
Sat-Nav devices used by HGVs were designed for the use of cars and so do not
consider restrictions such as weight, height and width limits.” (see KCC Freight
Action Plan for Kent 2012-2016). To seek to address this KCC has developed and
adopted the Freight Journey Planner, an online mapping tool specific to HGVs that
allows drivers to plan the most effective routes avoiding weight, width and height
restricted routes. This tool is free to use for HGV companies and drivers. KCC also
works with other mapping and satellite navigation companies to update mapping
systems. Co-operation from haulage companies is required in this matter.
76. It is recognised that road safety on rural roads for walking and cycling is also an
issue that discourages greater use of these modes, with limited pavements in some
locations and few segregated rural cycle routes. Traffic speeds on the rural roads
can also be a barrier to cycling and walking. Ensuring that local facilities are
available within local communities can also cut down the need to use cars for some
journeys.

Page
24 of 46
Tunbridge Wells Borough Council
Transport Strategy Review: Context and Way Forward
Date of publication – September 2019
Environmental Issues
77. As stated at the start of this document, in July 2019 the Council passed a motion at
Full Council, declaring its recognition of global climate and biodiversity emergencies
and stated its intention to take action to meet the goal of making the borough
carbon neutral by 2030. The approach to the Transport Strategy will need to
recognise this.
Climate Change
78. Transport now accounts for 28% of the UK’s greenhouse gas emissions and is the
largest emitting sector in the UK15. Cars, vans and HGVs are the three main
sources of emissions. The Government has recently confirmed amendments to the
Climate Change Act of 2008 that embed a ‘Net Zero’ carbon target by 2050 into
legislation (following recommendations from the Committee on Climate Change
(CCC). In its 2018 Progress Report to Parliament (see Progress Report), the CCC
identifies a number of ways to reduce emissions including:
• improving conventional vehicle efficiency;
• encouraging a change to ultra-low emission vehicles or use of biofuels;
• measures to change travel behaviour; and
• increasing freight efficiency.
Policy Aim: Pursue improvements to transport links in rural areas of the borough and
conserve and enhance the rural lanes network to ensure that they are convenient and
safe for users, as set out in Local Plan policies STR6: Transport and Parking and TP2:
Transport Design and Accessibility. Support the rural economy and ensure access to
facilities and services for rural communities as set out in ED9: Town and Rural Service
Centres, ED12: Retention of local services and facilities within defined Neighbourhood
and Village Centres.
Policy Implementation: Credible inter-urban public transport system (e.g. bus rapid
transit), other innovative bus services (e.g. Demand Responsive) and community
transport schemes for example car clubs, Mobility as a Service, maintenance of local
facilities/services in rural areas, support move to low emission vehicles in rural areas,
provide cycling and pavement/PROW infrastructure, provide inter-urban cycle routes for
electric bikes, speed and access restrictions for HGV traffic on rural roads where
required.
“…. road transport contributes to a third of Kent’s CO2 emissions and pollutants have
negative effects on air quality in addition to noise and consequently on human health
and the natural environment.” (Kent County Council Kent Environment Strategy 2016)

Page
25 of 46
Tunbridge Wells Borough Council
Transport Strategy Review: Context and Way Forward
Date of publication – September 2019
79. Progress on improving conventional vehicle efficiency has stalled in recent years
because more people are driving larger vehicles. Sports Utility Vehicles now
represent 18% of car sales compared to nearly 8% in 2010 (CCC 2018)15. The
2019 CREDS report Shifting the Focus: energy demand in a net-zero carbon UK,
suggests that the availability of larger vehicles may need to be reduced in the future
or their use restricted in certain locations.
80. The Government has announced ambitions to end sales of new conventional petrol
and diesel cars and vans by 2040, but sales of low emission cars in the UK fell for
the first time in more than two years between June 2018 and 2019 (see BBC News
2019). This may be partly due to the removal of subsidies by the Government which
were scrapped for plug-in hybrids and reduced for battery electric vehicles. In
addition, low emission vehicle purchase prices remain high which also has a
negative effect on uptake (although running costs are much lower) and there
remains a lack of a nationwide network of charging points. Another factor that is
affecting sales is a lack of clarity about new fuel types and the impact of future
regulations on the value of vehicles for resale.
81. A national charging network, including both topping-up and rapid charging facilities,
is essential to accelerate a significant increase in the take up of electric vehicles. In
acknowledgement of this, Kent County Council is preparing an Electric Vehicle
Strategic Action Plan (as part of the Kent & Medway Energy and Low Emission
Strategy). In addition, guidance on parking will be updated in the new Kent Design
Guide.
82. TWBC has been encouraging and facilitating the introduction of charging points
through the planning process and through provision in the Council’s own car parks.
There are rapid charging points in the Great Hall and Crescent Road car parks in
Royal Tunbridge Wells town centre and the Council’s Guidance Note for Applicants
(2018) provides developers with information on standards (see TWBC Electric
Vehicle Charging Guidance). Reference to parking standards are also set out in the
new Local Plan (Appendix B).
83. Most electric vehicle owners will charge their cars at home and some at their
workplaces. However, many residential areas in the borough do not have off-street
parking, presenting a barrier to plug-in vehicle adoption. TWBC and KCC will need
to work together to identify suitable locations for on-street charging and attract
inward investment to deliver an appropriate level of electric vehicle charging
capacity in these streets. In addition, there will be a need to facilitate the provision
of charging infrastructure in other locations e.g. petrol stations or car parks.
84. The Tunbridge Wells Car Club already provides its members with access to low
emission and hybrid vehicles and has proved very popular as a type of car sharing.
There are five Co-Wheels cars located in and around Royal Tunbridge Wells in their
own dedicated car parking space in:
• Grove Hill Road
• Mount Ephraim Road

Page
26 of 46
Tunbridge Wells Borough Council
Transport Strategy Review: Context and Way Forward
Date of publication – September 2019
• Mount Pleasant Road – near the Town Hall
• Mount Pleasant Road – north of the railway station
• Quarry Road
85. In Royal Tunbridge Wells suitable locations are being identified to expand the car
club, for example in the Pantiles/High Street area, St Johns and Hawkenbury.
86. Local government needs to play its part in encouraging a change to lower emission
vehicles and some towns and cities in the UK are planning to take a robust policy
approach. For example, Oxford City Council is consulting on banning non zero-
emitting cars, taxis, vans and buses from using certain areas of the city from 2020
and then expanding ban to the whole city and including HGVs in the restrictions by
2035.
Air Quality
87. Air pollution impacts on public health, the natural environment, and the economy. It
is well known that long term exposure to high levels of air pollution can have
potentially serious health implications, including contributing to cardiovascular
disease, lung cancer and respiratory diseases. Poor air quality affects everyone but
it has a disproportionate impact on the young and the old, the sick and less affluent
people.
88. There is a link between places with congestion and those with poor air quality. A
stop-start traffic flow produces more emissions and this is exacerbated in areas with
taller buildings that prevent air movement. Transport is widely recognised as one of
the biggest causes of nitrogen dioxide (NO2) pollution and particulate matter
(PM10) in town centres.
Policy Aim: All sustainable modes of transport including active travel, public transport
and electric vehicles will be facilitated to reduce dependence on emissions-producing
private vehicles, as set out in Local Plan Policy STR6: Transport and Parking and TP2:
Transport Design and Accessibility .
Policy Implementation: Network of EV charging points, expand car club, provide
infrastructure for walking and cycling, fiscal measures to encourage move to low
emission vehicles (e.g. via parking charges), dedicated or free parking spaces for those
using a car club.
“What, then, can be done about air pollution? The authors cite the three pillar solution
known as ‘Avoid Shift Improve’: avoid means cutting out motorised travel altogether; shift
means getting people to switch from high polluting modes to low polluting ones; and
improve is about reducing the harmful environmental impacts of vehicle technology.”
(RAC Foundation Report: Air Quality and Road Transport 2014)

Page
27 of 46
Tunbridge Wells Borough Council
Transport Strategy Review: Context and Way Forward
Date of publication – September 2019
89. The Council has been measuring air pollution for many years, to fulfil statutory
obligations under the Environment Act 1990. The pollutants monitored in the
Borough are NO2 and PM10. The A26 corridor has suffered from poor air quality
over a number of years and has been designated an Air Quality Management Zone.
However, in recent years there has been a downward trend in pollution levels and
the Council is committed to continuing the improvements. The Council adopted a
new Air Quality Action Plan in March 2019 to ensure that air quality continues to
improve further (view the Air Quality Action Plan).
90. The Tunbridge Wells Air Quality Action Plan sets out the following aims:
• To ensure that Tunbridge Wells Borough Council is complying with relevant air
quality legislation;
• To achieve a higher standard of air quality across Tunbridge Wells borough;
• To engage with partners and colleagues including those representing Highways
and Transportation, Public Health, Economic Development, local Bus
Companies, and other relevant stakeholders, to improve air quality across the
borough; and
• To build on previous work in this area in order to drive further improvements in
air quality with the ultimate aim of being able to revoke the Air Quality
Management Area.
91. The Action Plan sets out a number of measures that will help to achieve these aims,
including supporting modal shift to sustainable transport and walking and cycling for
shorter journeys (thereby reducing the number of vehicles on the road), improving
the flow of traffic on the road network and encouraging the use of cleaner vehicles.
The Plan recognises that merely relying on technological change and cleaner
vehicles alone will not achieve overall good air quality or reduce congestion, nor will
it deliver the co-benefits of improved physical well-being by incorporating physical
activity into daily life through active travel (see Section 10 below).
92. The Council has recently launched an anti-idling campaign to coincide with Clean
Air Day (20 June 2019). This initiative aims to encourage everyone who needs to
drive, to switch off their vehicle engines when they are stationary. The campaign will
be rolled out over the coming year and will include placing posters and banners
designed by school children at key locations across the borough and other
awareness raising events.
Policy Aim: Improve Air Quality across the borough as set out in Local Plan Policy EN23:
Air Quality and EN24 Air Quality Management Areas, also STR6: Transport and Parking
and TP2 Transport Design and Accessibility. See also Air Quality Action Plan.
Policy Implementation: Develop network of EV charging points, expansion of car club,
provide infrastructure for walking and cycling, fiscal measures to encourage low emission
vehicles (parking charges) including buses and cars, education/campaigns, air quality
signs to discourage idling and monitor emissions.

Page
28 of 46
Tunbridge Wells Borough Council
Transport Strategy Review: Context and Way Forward
Date of publication – September 2019
Public Health
93. Public Health England (PHE) has provided guidance to local authorities on the
policy approach that should be taken to transport19. The following key messages
are highlighted for those seeking to develop a healthy local transport strategy
including:
• physical inactivity directly contributes to 1 in 6 deaths in the UK and costs £7.4
billion a year to business and wider society;
• the growth in road transport has been a major factor in reducing levels of
physical activity and increasing obesity;
• building walking or cycling into daily routines are the most effective ways to
increase physical activity;
• short car trips (under 5 miles) are a prime area for switching to active travel and
to public transport; and
• health-promoting transport systems are pro-business and support economic
prosperity. They enable optimal travel to work with less congestion, collisions,
pollution, and they support a healthier workforce
94. The figure below summarises some of the effects that road transport has on health
and quality of life, both direct and indirect.
Figure 7: (source: see Public Health England, working Together To Promote Active Travel, 2016)
“Walking and cycling are good for our physical and mental health. Switching more
journeys to active travel will improve health, quality of life and the environment, and
local productivity, while at the same time reducing costs to the public purse. These are
substantial ‘win wins’ that benefit individual people and the community as a whole.”
(Public Health England, Working Together to Promote Active Travel 2016)

Page
29 of 46
Tunbridge Wells Borough Council
Transport Strategy Review: Context and Way Forward
Date of publication – September 2019
95. Travelling to work presents one of the main opportunities to incorporate activity into
a typical day and many people’s commute contains stages that could be walked or
cycled. Transport for London research has estimated that by mode of travel, the
amount of time spent being physically active during an average journey is as
follows:
• by car <1 minute
• by public transport 8–15 minutes
• on foot 17 minutes
• by bicycle 22 minutes (Source: see Mayor’s Transport Strategy for London
2018)
96. The infrastructure to encourage active commuting should be facilitated by local
authorities and funding will be required from central government (for example via
the Cycling and Walking Investment Strategy 2017) (view the DfT Cycling &
Walking Investment Strategy). To date there has been very limited ring-fenced
funding for walking and cycling for towns, with funding awards mainly going to cities.
Active Travel
97. Active travel means walking or cycling as an alternative to motorised transport
(notably cars) for the purpose of making everyday journeys. Earlier sections of this
report have provided evidence of the need for more journeys to be taken on foot or
by bike, particularly shorter journeys (under 5km).
98. The Kent Active Travel Strategy 2016 (view the Active Travel Strategy) sets out the
main reasons that people give for not making short journeys using active travel,
including:
Policy Aim: Prioritise all options of active travel to support an improvement in general
public health (see Local Plan para 4.59), Policy STR6: Transport and Parking, Policy
TP2 Transport Design and Accessibility.
Policy Implementation: Overall Local Plan Development Strategy and subsequent
development management decisions, provide infrastructure to facilitate active travel
choices: routes, parking and changing facilities, signing and maps for routes,
preparation of LCWIP and bid for funding, educational/promotional campaigns.
“Active Travel – journeys made through physical activity of the human body – can bring
many benefits to health and wellbeing the economy and the climate. Kent faces a
number of challenges in coming years and declining levels of physical activity and an
increase in traffic on the roads are two that will have a major impact on the life of
residents in the county.” (Kent County Council Kent Active Travel Strategy 2016)

Page
30 of 46
Tunbridge Wells Borough Council
Transport Strategy Review: Context and Way Forward
Date of publication – September 2019
• a perceived lack of suitable continuous routes between homes and community
services, workplaces or schools;
• not enough promotion of existing routes;
• a lack of facilities such as lockers and secure bicycle parking, obstacles in cycle
lanes and in footways;
• perception of safety when walking and cycling;
• the convenience of using a car, especially to carry heavy or bulky loads; and
• the need to make linked trips such as a school drop-off on the way to work.
99. Given these significant barriers, in order to facilitate active travel, pedestrians,
cyclists, and users of other transport that involve physical activity will need to take
the highest priority within a future transport strategy.
100. In many parts of the borough there is a good walking network with pavements
available for many journeys. However, a series of walking audits around Royal
Tunbridge Wells have identified that even in urban areas improvements are
required to make walking an easier choice for short journeys from residential areas
into the town centre. These route audits are being used to inform the Local Cycling
& Walking Infrastructure Plan that is being prepared for the borough (view the DfT
Local Cycling & Walking Infrastructure Plan: Technical Guidance). Examples of
improvements that are needed (many of them relatively small scale) include:
• additional or improved pedestrian crossings;
• replacing broken or uneven paving stones and resurfacing footways;
• improving street lighting;
• widening footways and removing street clutter;
• reducing traffic speeds;
• providing or improving dropped kerbs and tactile paving;
• discouraging footway parking; and
• provision of benches.
101. As indicated above, evidence from across the UK suggests that there is a high level
of unmet demand from those who wish to cycle some journeys, but owing to
barriers and/or perceived barriers do not do so (see Chartered Institute for
Highways and Transportation: Planning for Cycling). The consultation for the 2015
Borough Cycling Strategy showed that the primary barrier to bike use for travel was
the lack of cycling infrastructure and the fear of traffic on the roads (see Borough
Cycling Strategy 2016-2020).
102. Unfortunately, the cycling infrastructure in the borough remains very poor with a
number of sub-standard and discontinuous routes and no coherent overall network.
There have been some recent improvements including the delivery of the A21

Page
31 of 46
Tunbridge Wells Borough Council
Transport Strategy Review: Context and Way Forward
Date of publication – September 2019
segregated route between North Farm/Pembury and Tonbridge and the associated
link to Tunbridge Wells Hospital, but the reality of delivering cycling infrastructure in
the borough remains challenging for a number of reasons including:
• Limited highway space available to provide segregated infrastructure;
• Lack of ring-fenced funding for cycling infrastructure;
• Achieving stakeholder (including political) buy-in for difficult design decisions
e.g. reallocation of road space; and
• Access to appropriate expertise in the design of next-generation cycling
infrastructure .
103. Improving cycling infrastructure will therefore require innovative design solutions but
also commitment by all stakeholders. Priority routes will be set out in the Local
Cycling and Walking Infrastructure Plan and opportunities will be taken to bid for
funding for cycling infrastructure as these arise.
104. The take up of electric bikes is increasing as prices fall and this will allow people to
travel longer distances, making inter-urban trips possible for many, for example
between Royal Tunbridge Wells and Paddock Wood, if appropriate infrastructure is
provided.
Parking
105. Parking availability and cost is a key issue that is raised by borough residents and
businesses on a frequent basis. High levels of car ownership have led to a demand
for more and more parking spaces both at people’s homes, in residential streets
Policy Aim: Prioritise infrastructure for journeys taken on foot or on bike rather than by
car (particularly shorter journeys) as set out in Local Plan Policy STR6: Transport and
Parking, STR7: Place Shaping and Design, TP2 Transport Design and Accessibility and
TP3 Parking Standards.
Policy Implementation: Walking and cycling priority modes in new developments and
future masterplanning, improve walk/cycle/public transport interchanges, retrofit cycling
infrastructure into existing network where possible, speed restrictions to make walking
and cycling safer e.g. 20mph, better PROW and pavement maintenance.
“Parking policy, whether in terms of levels of provision or regulation of on or off-street
parking, can have significant effects in influencing transport choices and addressing
congestion. It can also affect patterns of development and play an important part in the
economic success and liveability of places, particularly town centres.” (Greater London
Authority, The London Plan 2016)

Page
32 of 46
Tunbridge Wells Borough Council
Transport Strategy Review: Context and Way Forward
Date of publication – September 2019
and in places of work, as well as in high streets, at stations and at other trip
attractors, for example leisure facilities.
106. Many residential streets in the urban areas of the borough have limited off-street
parking availability particularly in Royal Tunbridge Wells, Southborough, High
Brooms and Paddock Wood. Some of the borough’s streets are filled with parked
vehicles throughout the day and night. Pavement parking is also a barrier to walking
in many of the more car-crowded residential streets.
107. A balance needs to be struck between the competing demands for roadside space.
Local authorities have a duty to preserve the fundamental purpose of a highway to
keep traffic flowing efficiently. Tension can be created as the Council seeks to
provide sufficient parking for shoppers and visitors in town centres (in addition to
those who live and work in these areas) without encouraging unnecessary trips by
car that could be made by more sustainable modes. Controlled parking zones are a
management tool that have been introduced in a number of areas to restrict parking
to residents-only during certain times of the day in order to improve the local
environment and restrict commuter parking in places where it has become
problematic.
108. Parking standards for new developments will be set out in the new Local Plan and
will seek to ensure that there is not an adverse impact on surrounding areas from
parking relating to the development. Safe and secure cycle parking provision within
all new residential development will be required at the minimum standards outlined
within Kent County Council's Supplementary Planning Guidance 4 on Vehicle
Parking Standards (see SPG 4) or in later guidance if superseded (as stated in
Local Plan Policy TP3).
109. The Council has 12 off-street parking facilities in Royal Tunbridge Wells town centre
and another nine across town and village centres in the borough. These car parks
need to be managed in line with the overall transport strategy, and the pricing policy
for these must be considered in relation to supporting high street businesses whilst
again not encouraging unnecessary car trips. At present, there is sufficient capacity
to meet demand in most of the car parks in the borough except on some days in the
town centres at Christmas time.
110. The need for a network of electric charging points in the borough has already been
noted, both on and off-street. Once a comprehensive network is in place the
promotion of lower cost parking permits for vehicles with low emissions and/or those
vehicles that occupy less road space could be considered as a policy approach. In
other towns or cities, the option of a workplace parking levy has been introduced or
is being explored.
111. Parking spaces are also required to expand the borough Co-Wheels Car Club. It is
notable that each car club vehicle can displace approximately 6 private vehicles
from the network and therefore alleviate pressures on parking in local residential
areas.
Page
33 of 46
Tunbridge Wells Borough Council
Transport Strategy Review: Context and Way Forward
Date of publication – September 2019
112. New technology is already making a significant difference to parking management.
Firstly, advances in car park machinery have enabled more payment options to be
provided to the customer. For example, in borough car parks there are options to
pay by phone and check in/out with contactless payments. In addition, the adoption
of virtual parking permits allows more efficient management of the permit system.
Secondly, increasingly sophisticated ways of conveying information to drivers about
the availability of parking space both on and off-street are being developed and it is
expected that there will be much further progress in this field in the near future.
113. The Council will be preparing a Parking Policy Review that will support the
Transport Strategy and other relevant strategies and policies whilst remaining fully
compliant with all relevant legislation. In addition, Parking Standards for new
developments will be set out in the Local Plan.
114. Parking policy choices are complex and experts suggest that further research is
needed in the UK as a whole about how people respond to parking policy
interventions in relation to local circumstances such as the availability of alternative
transport modes or the distance to alternative destinations. Decisions about parking
policy will be critical in delivering some of the other policy aims in the Transport
Strategy.
Transport Funding
115. Funding for transport infrastructure is available from a number of sources but it is
limited. Further information is shown in the table below:
Policy Aim: Traffic and car parking will be carefully managed through developing
innovative strategies that will both provide a sufficient level of parking in the borough as
well as encourage sustainable travel (Local Plan Policy STR6: Transport and Parking.
Further details in Local Plan Policy TP3: Parking Standards (including cycle parking)
and TP4: Public Car Parks.
Policy Implementation: Preparation of Parking Strategy/Policy Paper, parking standards
set out in Local Plan, Controlled Parking Zones (CPZs) in appropriate locations, parking
permit management and charging tariff (on and off-street), tariffs in off-street car parks,
new technology to manage car parks.

Page
34 of 46
Tunbridge Wells Borough Council
Transport Strategy Review: Context and Way Forward
Date of publication – September 2019
Table 4: Funding sources for transport infrastructure and services
Source Name of funding Purpose of funding Project funded in Tunbridge
Wells borough
Area available
Local Enterprise Partnerships
(South East LEP) Local Growth Fund (LGF)
Capital grant funding
programme for infrastructure
related to growth (includes
education & skills, community
infrastructure, drainage as well
as transport). Aimed at
delivering new homes and
jobs. Requires match funding
and delivery within a short
time frame.
Yew Tree Road and
Speldhurst Road junction
capacity improvements (2015)
SELEP (Kent, East Sussex,
Essex)
Local Enterprise Partnerships
(South East LEP)
West Kent Local Sustainable
Transport Fund
Capital grant funding
programme for infrastructure
related to growth (includes
education & skills, community
infrastructure, drainage as well
as transport). Aimed at
delivering new homes and
jobs. Requires match funding
and delivery within a short
time frame.
• A26 cycle route design
• Cycle Parking at
Tunbridge Wells Station
• New pedestrian signage in
Royal Tunbridge Wells
• Public Realm works on
Mount Pleasant Road
(currently on site)
West Kent
Ministry for Housing,
Communities and Local
Government (MHCLG)
Housing Infrastructure Fund
(HIF)
Government capital grant
programme. Funding awarded
to local authorities on a highly
competitive basis, providing
grant funding for new
infrastructure that will unlock
new homes in the areas of
greatest housing demand.
Requires match funding and
No HIF funding awarded to
date. National

Page
35 of 46
Tunbridge Wells Borough Council
Transport Strategy Review: Context and Way Forward
Date of publication – September 2019
Source Name of funding Purpose of funding Project funded in Tunbridge
Wells borough
Area available
delivery within a short time
frame.
Department for Transport
Major Roads Network
Programme
The MRN’s purpose is to:
• Reduce congestion
• Support economic growth
• Support housing delivery
• Support all road users
• Support the Strategic
Road Network
Colts Hill Pre Strategic Outline
Business Case proforma
submitted in May 2019.
Outcome not yet known.
National
Department for Transport Local Pinch Point Fund
(available periodically)
Used to fund improvement to
transport infrastructure to
remove bottlenecks on the
local highway network which
impede growth.
Successful bid for funding for
Longfield Road improvements,
scheme now implemented.
National
Department for Transport
Cycling and Walking
Investment Strategy (CWIS)
For authorities that have
published a Local Cycling and
Walking Infrastructure Plan
(LCWIP). Funding can be
used for improvements to
cycling and walking
infrastructure (currently the
majority of funding has been
targeted towards cities).
Funding announcements from
CWIS yet to be made.
National
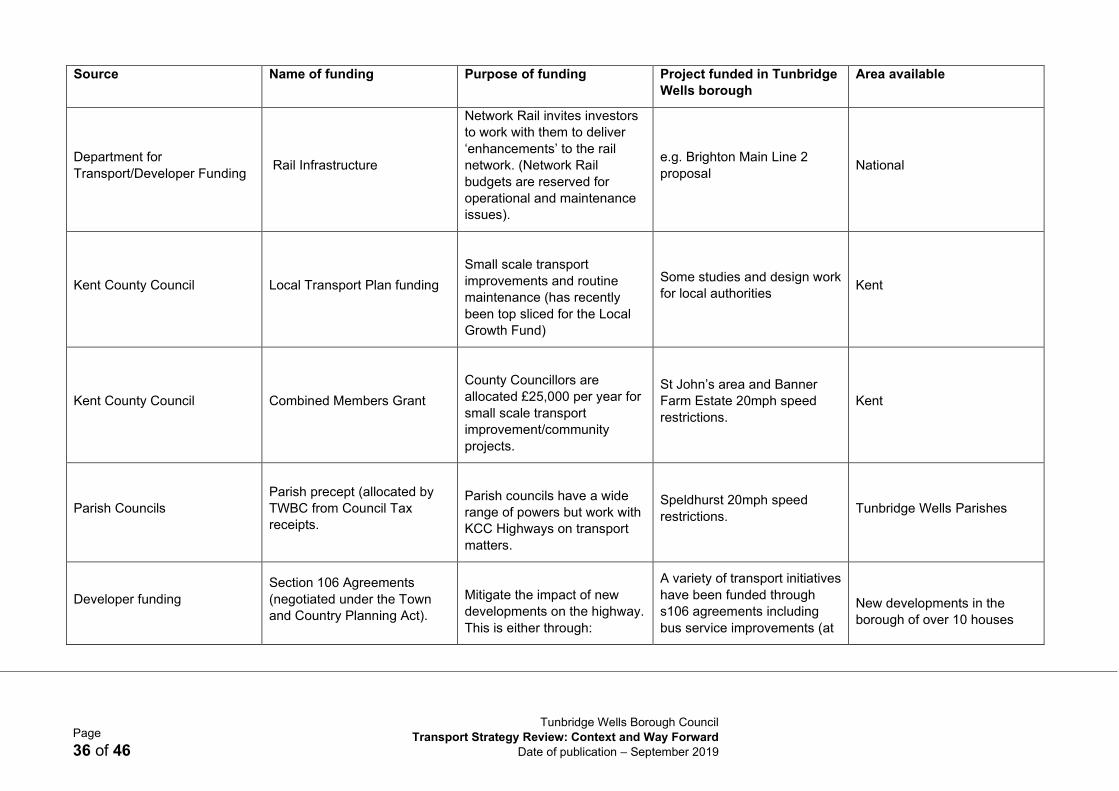
Page
36 of 46
Tunbridge Wells Borough Council
Transport Strategy Review: Context and Way Forward
Date of publication – September 2019
Source Name of funding Purpose of funding Project funded in Tunbridge
Wells borough
Area available
Department for
Transport/Developer Funding Rail Infrastructure
Network Rail invites investors
to work with them to deliver
‘enhancements’ to the rail
network. (Network Rail
budgets are reserved for
operational and maintenance
issues).
e.g. Brighton Main Line 2
proposal National
Kent County Council Local Transport Plan funding
Small scale transport
improvements and routine
maintenance (has recently
been top sliced for the Local
Growth Fund)
Some studies and design work
for local authorities Kent
Kent County Council Combined Members Grant
County Councillors are
allocated £25,000 per year for
small scale transport
improvement/community
projects.
St John’s area and Banner
Farm Estate 20mph speed
restrictions.
Kent
Parish Councils
Parish precept (allocated by
TWBC from Council Tax
receipts.
Parish councils have a wide
range of powers but work with
KCC Highways on transport
matters.
Speldhurst 20mph speed
restrictions. Tunbridge Wells Parishes
Developer funding
Section 106 Agreements
(negotiated under the Town
and Country Planning Act).
Mitigate the impact of new
developments on the highway.
This is either through:
A variety of transport initiatives
have been funded through
s106 agreements including
bus service improvements (at
New developments in the
borough of over 10 houses

Page
37 of 46
Tunbridge Wells Borough Council
Transport Strategy Review: Context and Way Forward
Date of publication – September 2019
Source Name of funding Purpose of funding Project funded in Tunbridge
Wells borough
Area available
• Section 278 Agreement
with KCC (an approved
contractor undertakes
works on behalf of KCC)
• Section 106 Agreement
with TWBC/KCC
(developer makes a
funding contribution to
either body at an agreed
trigger point).
Can be used for Capital or
Revenue projects.
Knights Wood and in
Hawkhurst).
Developer funding Community Infrastructure Levy
(CIL)
Tariff based approach through
planning policy, charged on
extent of new floor space
proposed. Can fund strategic
infrastructure on various
scales.
TWBC to make a decision on
the adoption of CIL in the near
future.
All development in the
borough

Page
38 of 46
Tunbridge Wells Borough Council
Transport Strategy Review: Context and Way Forward
Date of publication – September 2019
Appendices

Page
39 of 46
Tunbridge Wells Borough Council
Transport Strategy Review: Context and Way Forward
Date of publication – September 2019
Appendix A: Reference Documents 1. TWBC Full Council Motion (July 2019)
http://democracy.tunbridgewells.gov.uk/meetings/documents/s43943/11%20Alternativ
e%20Motion.pdf
2. Census Data
https://www.ons.gov.uk/census/2011census
3. Centre for Research into Energy Demand Solutions, Oxford University Centre for the
Environment: Shifting the Focus: Energy Demand in a net-zero carbon UK (July 2019)
https://www.creds.ac.uk/publications/shifting-the-focus-energy-demand-in-a-net-zero-
carbon-uk/
4. Economic Needs Study, Turley 2016
http://www.tunbridgewells.gov.uk/__data/assets/pdf_file/0003/134238/Economic-
Needs-Study_Final-Report-with-appendices-min2.pdf
5. Future of Mobility: Urban Strategy, Moving Britain Forward (March 2019)
https://assets.publishing.service.gov.uk/government/uploads/system/uploads/attachme
nt_data/file/786654/future-of-mobility-strategy.pdf
6. Mobility as a Service (MaaS) in the UK: change and its implications Foresight,
Government Office for Science (December 2018)
https://assets.publishing.service.gov.uk/government/uploads/system/uploads/attachme
nt_data/file/766759/Mobilityasaservice.pdf
7. National Planning Policy Framework (Update 2019)
https://assets.publishing.service.gov.uk/government/uploads/system/uploads/attachme
nt_data/file/810197/NPPF_Feb_2019_revised.pdf
8. Transport for London – The Benefits of Walking and Cycling
https://tfl.gov.uk/info-for/media/press-releases/2018/november/getting-more-people-
walking-and-cycling-could-help-save-our-high-streets
9. Living Streets – The Pedestrian Pound: the business case for better streets and
places
https://www.livingstreets.org.uk/media/3890/pedestrian-pound-2018.pdf
10. TRL Link
www.trl.co.uk/research_development/intelligent_transport/human_factors

Page
40 of 46
Tunbridge Wells Borough Council
Transport Strategy Review: Context and Way Forward
Date of publication – September 2019
11. TWBC Park & Ride Feasibility
http://www.tunbridgewells.gov.uk/__data/assets/pdf_file/0020/211547/7300F8E3E5A1
0D60E0531401A8C0C6BC_Tunbridge_Wells_Park_and_Ride_Feasibility_Study_Fina
l_Report_June_2018.pdf
12. Williams Review – Rail in the Future Transport System
https://assets.publishing.service.gov.uk/government/uploads/system/uploads/attachme
nt_data/file/802472/rail-in-the-future-transport-system.pdf
13. Kent County Council: Big Conversation Feedback (2018)
https://consultations.kent.gov.uk/consult.ti/bigconversation/consultationHome
14. KCC Freight Action Plan for Kent 2012 – 2016
https://www.kent.gov.uk/__data/assets/pdf_file/0012/6105/Freight-action-plan.pdf
15. Commission on Climate Change 2018: Progress Report to Parliament
https://www.theccc.org.uk/publication/reducing-uk-emissions-2018-progress-report-to-
parliament/
16. BBC News 2019
https://www.bbc.co.uk/news/business-48865702
17. TWBC Electric Vehicle Charging Guidance
http://www.tunbridgewells.gov.uk/__data/assets/pdf_file/0007/279106/Electric_Vehicle
_Charging_Points_for_New_Development_Guidance_Note_for_Applicants-
2018Dec2018-v6.pdf
18. TWBC Air Quality Action Plan 2019
http://www.tunbridgewells.gov.uk/__data/assets/pdf_file/0003/276060/Air_Quality_Acti
on_Plan__2018_to_2023_Tunbridge_Wells_Borough_Council_final.pdf
19. Public Health England: Active Travel: a Briefing for Local Authorities (May 2016)
https://assets.publishing.service.gov.uk/government/uploads/system/uploads/attachme
nt_data/file/523460/Working_Together_to_Promote_Active_Travel_A_briefing_for_loc
al_authorities.pdf
20. Mayor’s Transport Strategy for London (2018)
https://www.london.gov.uk/sites/default/files/mayors-transport-strategy-2018.pdf
21. Department for Transport: Cycling & Walking Investment Strategy (2017)
https://assets.publishing.service.gov.uk/government/uploads/system/uploads/attachme
nt_data/file/603527/cycling-walking-investment-strategy.pdf
22. Kent County Council: Kent Active Travel Strategy (2016)

Page
41 of 46
Tunbridge Wells Borough Council
Transport Strategy Review: Context and Way Forward
Date of publication – September 2019
https://www.kent.gov.uk/__data/assets/pdf_file/0007/71773/Active-Travel-Strategy-
information.pdf
23. Department for Transport Local Cycling & Walking Infrastructure Plan: Technical
Guidance
https://assets.publishing.service.gov.uk/government/uploads/system/uploads/attachme
nt_data/file/607016/cycling-walking-infrastructure-technical-guidance.pdf
24. Chartered Institute for Highways and Transportation:
https://www.ciht.org.uk/media/4461/ciht_-_planning_for_cycling_proof_v2_singles.pdf
25. TWBC Borough Cycling Strategy 2016 – 2020
http://www.tunbridgewells.gov.uk/__data/assets/pdf_file/0015/132207/6FB057F542A0
7AF9E0531401A8C01B6A_Final_Cycling_Strategy_2016-20.pdf
26. Kent County Council Kent & Medway Structure Plan 2006: Supplementary Planning
Guidance 4
http://www.maidstone.gov.uk/__data/assets/pdf_file/0010/88984/Kent-and-Medway-
Structure-Plan-2006-SPG4-Vehicle-Parking-Standards.pdf
Other Background Documents
27. Department for Transport: Creating Growth, Cutting Carbon, Making Sustainable Local
Transport Happen White Paper (2011)
https://www.gov.uk/government/publications/creating-growth-cutting-carbon-making-
sustainable-local-transport-happen
28. Department for Transport: A Strategic Framework for Road Safety 2011
https://assets.publishing.service.gov.uk/government/uploads/system/uploads/attachme
nt_data/file/8146/strategicframework.pdf
29. Transport for the South East: Economic Connectivity Review (July 2018)
https://transportforthesoutheast.org.uk/wp-content/uploads/2018/07/FINAL-Economic-
Connectivity-Review.pdf
Kent County Council Plans & Strategies
30. Local Transport Plan 4: Delivering Growth Without Gridlock 2016 – 31 (2016)
https://www.kent.gov.uk/__data/assets/pdf_file/0011/72668/Local-transport-plan-4.pdf
31. Rail Action Plan for Kent (2011)
https://www.kent.gov.uk/__data/assets/pdf_file/0014/13811/rail-action-plan-for-
kent.pdf
32. Road Casualty Reduction Strategy 2014 (Update 2017)

Page
42 of 46
Tunbridge Wells Borough Council
Transport Strategy Review: Context and Way Forward
Date of publication – September 2019
https://www.kent.gov.uk/__data/assets/pdf_file/0012/14520/Road-Casualty-Reduction-
Strategy-for-Kent.pdf
33. Kent Environment Strategy 2016
https://www.kent.gov.uk/__data/assets/pdf_file/0020/10676/KES_Final.pdf
34. Kent Energy & Low Emissions Strategy (Draft 2019)
https://consultations.kent.gov.uk/consult.ti/energyandlowemissionconsultation/consulta
tionHome
Tunbridge Wells Borough Council Plans & Strategies
35. The Five Year Plan 2017 – 2022
http://www.tunbridgewells.gov.uk/__data/assets/pdf_file/0020/53291/Five-Year-Plan-
2017-2022.pdf
36. Regulation 18 Draft Tunbridge Wells Local Plan 2019
http://democracy.tunbridgewells.gov.uk/meetings/documents/b50012522/Supplement
%20-%20High%20resolution%20version%20of%20Appendix%20A%2005th-Aug-
2019%2018.30%20Planning%20and%20Transportation.pdf?T=9
37. Borough Transport Strategy 2015 – 2026
http://www.tunbridgewells.gov.uk/__data/assets/pdf_file/0018/212355/New_Transport
_Strategy_2015-16_TW633_low-res.pdf
38. Borough Economic Development Strategy 2018 – 2021
http://www.tunbridgewells.gov.uk/__data/assets/pdf_file/0005/195800/6E87D2995234
0414E0531401A8C0B054_FINAL_Economic_Development_Strategy_2018-
21_TW1623.compressed.pdf
39. TWBC Community Safety Plan 2019
http://democracy.tunbridgewells.gov.uk/meetings/documents/s42328/10%20Appendix
%20A%20-%20Plan%20Document.pdf
West Kent Partnership
40. West Kent Partnership (WKP) West Kent Economic Priorities for Growth (2019)
http://westkentpartnership.org.uk/wp-content/uploads/2019/05/West-Kent-Economic-
Priorities-for-Growth-2019-22-Final.pdf
41. Action with Communities in Rural England Website
http://acre.org.uk/rural-issues/transport.php
42. The London Plan (Greater London Authority) 2016
https://www.london.gov.uk/what-we-do/planning/london-plan/current-london-
plan/london-plan-chapter-six-londons-transport/pol-27

Page
43 of 46
Tunbridge Wells Borough Council
Transport Strategy Review: Context and Way Forward
Date of publication – September 2019
43. Transport Studies Unit (University of Oxford) – Gordon Stokes
https://www2.uwe.ac.uk/faculties/FET/Research/cts/projects/news/gordonstokes07031
1.pdf
44. RAC Foundation 2014
https://www.racfoundation.org/assets/rac_foundation/content/downloadables/racf_ricar
do_aea_air_quality_report_hitchcock_et_al_june_2014.pdf

Page
44 of 46
Tunbridge Wells Borough Council
Transport Strategy Review: Context and Way Forward
Date of publication – September 2019
Appendix B: Local Plan
Infrastructure Delivery Plan Please see the Draft Infrastructure Delivery Plan on the Supporting Documents page of the
Local Plan website at https://beta.tunbridgewells.gov.uk/local-plan/evidence

Page
45 of 46
Tunbridge Wells Borough Council
Transport Strategy Review: Context and Way Forward
Date of publication – September 2019
Appendix C: Local Plan Transport
Assessment Report 2019 (prepared
by Sweco) Please see the Transport Assessment under the Transport & Infrastructure tab on the
Supporting Documents page of the Local Plan website at
https://beta.tunbridgewells.gov.uk/local-plan/evidence

If you require this document in another format,
please contact:
Planning Policy
Planning Services
Tunbridge Wells Borough Council
Town Hall
Royal Tunbridge Wells
Kent TN1 1RS
Telephone: 01892 5 5 4 0 5 6