Transport properties of hydrophobic microporous … properties of hydrophobic microporous polymeric...
73
Transport properties of hydrophobic microporous polymeric membranes Enrico Drioli 1,3,4,5 Zhaoliang Cui 1 , Naser Tavajohi Hassankiadeh 1 , Young Moo Lee 1,2 , Francesca Macedonio 3,4 , Alberto Figoli 4 , Elena Tocci 4 , 1 WCU Energy Department, Hanyang University, Seoul 133-791 S. Korea 2 Department of Energy Engineering, College of Engineering, Hanyang University, Seoul 133-791, Republic of Korea 3 Department of Environmental and Chemical Engineering, University of Calabria, via P. Bucci, Rende 4 Institute on membrane Technology, National Research Council of Italy, ITM-CNR, c/o University of Calabria, via P. Bucci cubo 17/C, Rende Italy 5 Center of Excellence in Desalination Technology, King Abdulaziz University, Saudi Arabia
Transcript of Transport properties of hydrophobic microporous … properties of hydrophobic microporous polymeric...

Transport properties of hydrophobic
microporous polymeric membranes
Enrico Drioli1,3,4,5
Zhaoliang Cui1, Naser Tavajohi Hassankiadeh1, Young Moo
Lee1,2, Francesca Macedonio3,4, Alberto Figoli4, Elena Tocci4,
1WCU Energy Department, Hanyang University, Seoul 133-791 S. Korea2Department of Energy Engineering, College of Engineering, Hanyang University, Seoul 133-791,
Republic of Korea3Department of Environmental and Chemical Engineering, University of Calabria, via P. Bucci, Rende 4Institute on membrane Technology, National Research Council of Italy, ITM-CNR, c/o University of
Calabria, via P. Bucci cubo 17/C, Rende Italy5Center of Excellence in Desalination Technology, King Abdulaziz University, Saudi Arabia

Membrane processes impact on
the most strategic problems:
water, energy, rationalization of
productive processes

4
Improvement of desalination
Solutions for
tomorrow
• Energy production
• Mineral recoveryProblems of today
• Electric energy consumptions
• Brine disposal
• Water recovery
T. Pankratz, GWI, 24th WateReuse Symposium 2009

Membrane based desalination systems
Seawater reverse osmosis
desalination
MEDINA
(2006-2010)
MEGATON
(2009-2014)
SEAHERO
(2007-2012)
Major desalination projects aims
to increase the water production
and decrease water costs by
integrating various membrane
operations for improved
production of water, energy and
minerals.
HOW THE IMPROVEMENT CAN BE REACHED?
•New membrane modules and materials (e.g., multifunctional
and auto-restored membranes)
•New membrane operations
• More efficient pre-treatment (e.g., MF/UF, MBr, MDBR, etc.)
and post-treatment operations (e.g., MD, MCr, etc.)
•Integrated membrane systems
•Possibility to address contemporaneously water, energy and
raw materials production

Membrane Distillation
A process based on the vapor pressure gradient created across a micro-porous hydrophobic membrane.Membrane requirement Hydrophobic High overall porosity Narrow pore size distribution Low thermal conductivityAdvantages Concentration independent operation Complete rejection of all non volatiles Possibility to use waste grade heat Less stringent mechanical requirements for membrane usedChallenges Unavailability of specific membranes Control of thermal polarization Control of non traditional fouling including wetting and surface scaling

MD Configurations
The performance of various
configurations in terms of flux,
energy efficiency and operational
stability (resistance to wetting and
scaling) can be different under the
same process conditions due to
different thermal polarisation and
resistance to mass transfert.
In SGMD, AGMD and VMD, the
wetting does not affect the product
quality significantly.
The selectivity of volatile
components can differ according
to the configuration used.

MD vs Conventional Distillation
• Membrane Distillation • Conventional Distillation
Compact design with very small foot print.
Can use waste grade heat or solar energy
No corrosion related issues
Can be used for heat sensitive materials (no hot spots)
The process is emerging
Large footprint
Intensive energy nature and
conventionally based on the
fossil fuel.
Corrosion and surface
scaling is a big problem
The applications are usually
typical and temperature
distribution is less uniform.
Well established technology

Membrane Crystallization
Driving force: partial pressure
difference )c,T(pJ
Advantages compared to traditional techniques
High specific area for mass transfer
Optimal control of the supersaturation level
Shorten induction periods
Surface effect (heterogeneous nucleation)
p
M
RT
RT
rJ
2/1
81
3
2

11
Reduction in the free energy of nucleation as a
function of the contact angle with the polymeric
surface
High values of the crystal growth rate at low
supersaturation
Control of crystals habit
0 45 90 135 180
Contactangle(°)
0
0.25
0.5
0.75
1
DGhe
t / DG
hom
(-)
PANCA
PCPEIPSf
PVDFPP
PTFE
Production of catalytic crystals
with a well defined size and shape
400 600 800 1000 1200 1400
0
1
2
3
4
5
6
v, Solution velocity / m s-1
G, G
row
th r
ate
/
m h
-1
-10,0
-7,5
-5,0
-2,5
0,0
2,5
5,0
7,5
r, Len
gth
to w
idth
ratio
Protein: Bovine Pancreas Trypsin, M.W. = ~ 24000 Da

12
Application in
anti-solvent
crystallization
process
Uniform crystals. Control of crystal
size distribution
Crystallization of inorganic, organic
and “bio” materials
Control of the kinetic/thermodynamic
balance in the polymorphic
crystallization of organic molecules
0 50 100 150 200 250 300
0
5
10
15
20
25
30
35
Bovine Pancreas Trypsin Crystallization Trials
Crystal Size Distribution
Fre
qu
en
cy / %
Crystal size / m
Dynamic, V=423 m s-1
Dynamic, V=895 m s-1
Dynamic, V=1246 m s-1
Batch, without membranes
Quiescient, 4 Membranes
Selective polymorphs crystallization
Solvent
Vapor
Solvent
Vapor
Solvent
Vapor
Solvent
Vapor
Strip
pin
g S
olu
tion
-
Polymorph
-
Polymorph
Low
flow
rate
High
flow
rate
Gly
cin
e S
olu
tio
n

13
Example 1: The polymorphism of Glycine
Glycine polymorphs: , , and . At room conditions the -form is stable,
the -form is metastable, the -form is instable.
-
Polymorph
-
Polymorph
-
Polymorph
pH
6 8 1
0
1
2
42
STATIC MEMBRANE
CRYSTALLIZER
DYNAMIC MEMBRANE
CRYSTALLIZER
Flowrate (m/s)
Evaporation rate (L/h)
250 500 750 1000 1250 1500
Form Form
126 18 24 30 36
Di Profio, G.; Tucci, S.; Curcio, E.; Drioli, E. Crystal Growth & Design 2007, 7, 526.

14
Example 2: The polymorphism of Paracetamol
Monoclinic form I : The thermodynamically stable modification at room temperature
Orthorhombic form II : The metastable form at ambient conditions
The form III: The unstable polymorph
J/(mL/h) tind/h S(tind)* Polymorph
1.37 x 10⁻² 64.3 1.34 II
1.94 x 10⁻² 53.6 1.52 II (+ I)
4.33 x 10⁻² 23.5 1.91 I
4.37 x 10⁻² 31.0 1.83 I
5.89 x 10⁻² 24.3 1.93 I
6.60 x 10⁻² 23.0 1.96 I
7.90 x 10⁻² 19.5 2.00 II
8.98 x 10⁻² 17.5 2.05 II
Form I
Form II

Thermodynamic control
(Path 1)
The stable product prevails at the
nucleation stage
The stable product grows to become a
macroscopic crystal
Kinetic control
(Path 2)
The metastable phase nucleate first and
the growth rate (G) determinate which
form will be present at the end
If supersaturation increases slowly, the
metastable phase converts into the
thermodynamic product; if supersaturation
changes quickly, the kinetic form will
growth. )( )( ABdB SSkG
)( ABgA SkG

Kinetic and thermodynamic
control
Chen et al. Cryst. Growth Des. 2011, 11, 887
17
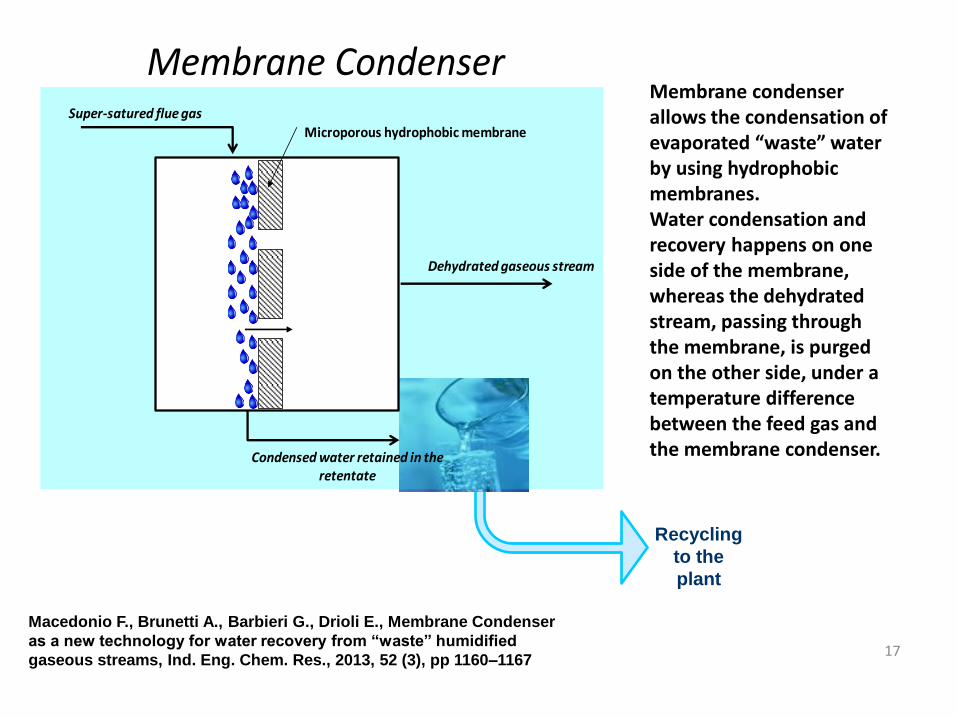
Super-satured flue gas
Dehydrated gaseous stream
Condensed water retained in the retentate
Microporous hydrophobic membrane
Membrane Condenser
Recycling
to the
plant
Macedonio F., Brunetti A., Barbieri G., Drioli E., Membrane Condenser
as a new technology for water recovery from “waste” humidified
gaseous streams, Ind. Eng. Chem. Res., 2013, 52 (3), pp 1160–1167
Membrane condenser allows the condensation of evaporated “waste” water by using hydrophobic membranes.Water condensation and recovery happens on one side of the membrane, whereas the dehydrated stream, passing through the membrane, is purged on the other side, under atemperature difference between the feed gas and the membrane condenser.

18
The membrane surface can be
cooled with a cold gas fed on
the retentate side of the
membrane module.
The cooling gas can consist of
air coming out from the
surrounding that can be cooled
in an heat exchanger if
necessary.
The membrane module can be
placed at a certain distance
from the chimney of the tower
and its cooling can occur
exploiting the temperature
difference between the feed
gas and the environment.
The membrane surface can be
cooled with a sweep gas fed
on the permeate side of the
membrane module.
The sweep can consist of air
coming out from the
surrounding that can be cooled
in an heat exchanger if
necessary.
Configuration 1: cooling of the membrane condenser by external sources
Configuration 2: cooling of fibers with coldsweep gas
Air (Surrounding)
Cooling tower(six parallel stacks)
Flue gasRH=80-100%T= 40-50°C
Balance
Feed
Waterxx L h-1
Temperature=….pH=….
[salt]=….
Microporous hydrofobicMembrane
DehydratedGaseous stream
Is anHeat Exchanger
necessary?
Permeateside
Cooling tower(six parallel stacks)
Air (Surrounding)
at 35°C (noon) or 15°C (midnight)
Flue gasRH=80-100%
Balance
Feed
Waterxx L h-1
Temperature=….pH=….
[salt]=….
Microporous hydrofobicMembrane
DehydratedGaseous stream
Configuration 3: Cooling of the membrane condenser by cold auxiliary
gas fed on retentate side
Cooling tower(six parallel stacks)
Is anHeat Exchanger
necessary?Air (Surrounding)at 35°C (noon) or 15°C (midnight)
Flue gasRH=80-100%
Balance
Feed
Waterxx L h-1
Temperature=….pH=….
[salt]=….
Microporous hydrofobicMembrane
DehydratedGaseous stream
Permeateside
• Low energy consumption
if low ΔT requirement
• Difficult to removing
water from the fiber.
• Difficult to control the
temperature of the
module.
• Can only be used for
small systems.
• Control of the temperature
of the fibers
• Condensation inside the
membrane pores
• Easy removal of water • Dilution of the Feed
current ,consequent
reduction of the relative
humidity and therefore
decrease of water
recovered.
Advantages Disadvantages

Membrane condenser vs conventional technologies
Liquid sorption [1]Cooling with condensation[2]
Dense Membranes [3]Membrane condensers
Water recovery
22-62% < 70% 20-40% > 70%
Water purity >95%Sufficient for cooling towermake upContaminants
>95%Sufficient for coolingtower make upContaminants
Maintananceand durability
Corrosion and salt crystalsformation due to saltdessicants presence and O2
in the flue gas
Corrosion due to the formation of a thin liquidlayer of diluted acids and flyashes forming deposits
Ashes removal and FGDnecessary to avoidmembrane damaging
Ashes removal toavoid membrane damaging
Environmentalaspects
Increase of CO2 emissionsReduction of SOx emissionCaCl2 losses
Co-capture of SOx and NOxcould results in a environmental profit reducing the DENOx and FGD systems
Clean operation Clean operation
Investmentscosts
5.8 mln $ (2006) +200.000$/year (2006)as operational costs
6.4 mln EURO (2011) To be determined To be determined
Economicviability
4.4 $/m3 1.5-2 EURO/m3
1.5 Euro/m3 (WET regions)10 EURO/m3 (DRY regions)
1.5- 2.5 Euro/m3
(*)
[1]Folkedahl, B., Weber, G.F., Collings, M.E. Water extraction from coal-fired power plant flue gas. Final report. DOE Cooperative
Agreement No. DE-FC26-03NT41907. December 2006 . http://www.netl.doe.gov/technologies/coalpower/ewr/water/pp-
mgmt/pubs/41907/41907%20Final.pdf
[2] Michels, B., Adamczyk, F., Koch, J. Retrofit of a flue gas heat recovery system at the Mehrum power plant. An example of power plant
lifetime evaluation in practice. VGB PowerTech, Nr. 10, 2004.
[3] http://www.watercapture.eu/downloads/paper-powergen-europe.pdf

Membrane Emulsification
Emulsions are dispersed systems of two (or more) insoluble liquids,
e.g. water and oil.
Oil in water and water in oil emulsionsa) Cross flow membrane emulsification
b) Batch membrane emusification
c) Pre-emulsification
d) Membrane tube emulsification
e) CME system
Schematic diagram of the membrane emulsification process
Emulsions play an important role in the formulation
of cosmetics, pharmaceuticals, paints and foods and
petroleum industry.

Membrane Emulsification
Advantages of ME
Membrane properties including
material of construction, pore
size, pore size distribution and
overall porosity are crucial in
obtaining the stable emulsion of
desired droplet size and size
distribution.
Process parameters including
cross flow velocity and TMP are
important to control droplet size
and droplet size distribution.
Phase properties including
viscosity and surfactants also
affect the process and emulsion
properties.
Parameters affecting ME
Energy consumption of membrane
emulsification (104–106 Jm−3) is
lower than its conventional
counterparts (106–108 Jm−3).
The droplet size can be tuned by
changing the pore size of
membranes. ME can be utilized to produce
monodispersed micro and
nanoemulsions depending upon
membrane characteristics used. Membrane emulsification can be
particularly suitable for shear-
sensitive ingredients such as
proteins and starch.

Membrane Dryer (1)
Membrane Dryer is a membrane-based system able to dry solid particles
contained in liquid streams, while producing a liquid particle-free.
The main principles are those of Membrane Distillation: the liquid stream
(feed) to be treated is in contact with one side of a microporous
membrane and the liquid permeates as vapor thanks to a driving force
that can be established across the membrane in different ways: by
applying vacuum; by creating an air gap; by sending a cold liquid or a
sweep gas.
Vacuum
Air gap
Cold liquid
Sweep gas
Microporous
Membrane
Vapor Flux
Feed

Membrane Dryer (2)
Main Properties of the membranes to be used:
1. Microporous;
2. Hydrophobic (for aqueous feeds);
3. Hydrophilic (for organic feeds);
4. Pore size smaller than the solid particle size.
Membrane Dryer (3)
Main Advantages:
1. Ability to work with feeds of different concentration (dilute or
concentrated feeds);
2. Ability to work with feeds containing solid particles of different size;
3. Production of liquid particle-free without the need of a separation step
downstream;
4. Modularity, flexibility, easy scale-up and scale-down, low footprint (all
typical advantages of membrane processes).

HOW THE IMPROVEMENT CAN BE REACHED?
•New membrane modules and materials (e.g., multifunctional
and auto-restored membranes)
•New membrane operations
• More efficient pre-treatment (e.g., MF/UF, MBr, MDBR, etc.)
and post-treatment operations (e.g., MD, MCr, etc.)
•Integrated membrane systems
•Possibility to address contemporaneously water, energy and
raw materials production

Membrane characteristics
Morphology: symmetric or asymmetric porous
Thickness: 20-100 m
Pore size: 0.1 – 1.0 m (even if 0.2-0.3 m is better)
Membrane material:
- hydrophobic
- resistant to alchools and surfactants
Membrane porosity: 70-80%

High liquid entry pressure (LEP)
High permeability
Low fouling problem
High chemical stability
High thermal stability
High overall porosity
Narrow pore distribution
Desired membrane characteristics
7.0 um
2.5 um
AFM photos of fluor polymeric membranes
with ordered structures

Desired membrane characteristics
Membrane materialswith low thermalconductivity
Simulation results of the effects of the membrane thermal conductivity onthe DCMD performance
S. Al-Obaidani et al. / Journal of Membrane Science 323 (2008) 85–98

Desired membrane characteristics
Membrane with properthickness
Simulation and experimental results of the effects of the membrane thickness on the MD performance .
S. Al-Obaidani et al. / Journal of Membrane Science 323 (2008) 85–98
Perfluoro polymers for new
membrane operations
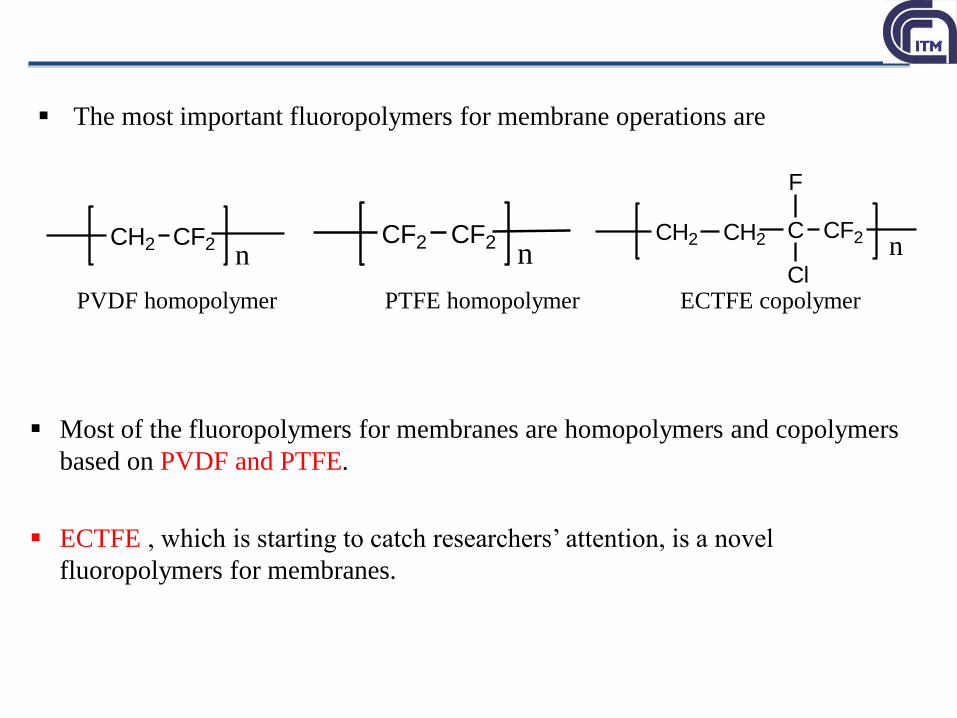
The most important fluoropolymers for membrane operations are
CH2 CF2n
CF2 CF2n
CH2 CH2 C
Cl
F
CF2 n
PVDF homopolymer PTFE homopolymer ECTFE copolymer
Most of the fluoropolymers for membranes are homopolymers and copolymers
based on PVDF and PTFE.
ECTFE , which is starting to catch researchers’ attention, is a novel
fluoropolymers for membranes.

Membrane processes based on fluoropolymers
Fluoropolymer Membrane process
Poly(vinylidene fluoride) (PVDF) homopolymer MF, UF, MD, MCr, ME, PV
PVDF copolymer Poly(vinylidene fluoride-co-tetrafluoroethylene) (P(VDF-co-
TFE))
MF/UF, MD
Poly(vinylidene fluoride-co-hexafluoropropene) (P(VDF-co-
HFP))
MF/UF, MD, PV, fuel cell, lithium
ion battery
Poly(vinylidene fluoride-co-chlorotrifluoroethylene) P(VDF-
co-CTFE)
MF/UF, NF, MD, PV, fuel cell
Poly(vinylidene fluoride)-graft-poly-(styrene sulfonic acid)
PVDF-g-PSSA
Fuel cell
Poly(vinylidene fluoride-trifluoroethylene) (P(VDF-TrFE)) Lithium ion battery, tissue
regeneration
Poly(tetrafluoroethylene) (PTFE) homopolymer MD, MC, PV, MGA
PTFE copolymer Perfluorosulfonic acid (PFSA) Fuel cell, lithium ion battery, chlor-
alkali industry
Poly(tetrafluoroethylene-co-perfluoropropyl vinyl ether) (PFA)Fuel cell
Poly(tetrafluoroethylene-co-hexafluoropropylene) (FEP) MD, fuel cell
Poly(ethylene-alt-tetrafluoroethylene) (ETFE) Fuel cell
Poly(ethylene chlorotrifluoroethylene) (ECTFE) PV, has potential in MD, MC and
MF/UF
Other fluoropolymers Poly(chlorotrifluoroethylene) (PCTFE)
Poly(vinyl fluoride) (PVF) Fuel cell
Poly(fluorenyl ether) (PFE) Fuel cell
Hyflon® AD, Teflon® AF, Cytop® Gas separation, have potential in
MD, MC

PVDF homopolymers
Homopolymers of PVDF are semicrystalline and long chain macromolecules
which contain 59.4 wt.% fluorine and 3 wt.% hydrogen.
PVDF typically has a crystallinity of 35-70%, depending on the preparation
and thermal mechanical history.
Ameduri B. Chem. Rev 2009; 109: 6632-86; Dillon DR, et al. Polymer 2006; 47: 1678-88;
Hasegawa R, et al. Polym J 1972; 3: 600-10; Boccaccio T, et al. J Membr Sci 2002; 210: 315-29.
Three molecular conformations are TGTG’ (α
and δ phases), TTT (β phase) and TTTGTTTG’
(γ and ε phases).
The α-form is kinetically favorable, while the β-
form is the most thermodynamically stable
form.
α phase is non-polar, β and γ phases are polar.
The polar property and the relatively higher
mechanical strength makes β phase is the most
interesting phase.
γ phase presents higher melting point and
solvent resistance.
α and δ phases
β phase
γ and ε phase s

PVDF membrane preparations
Li CL, et al., J Membr Sci 2010; 361: 154-66; Mu CX, et al., J Membr Sci 2010; 361: 15-21;
Feng C, et al., J Membr Sci 2008; 311: 1-6
Publication numbers related PVDF
and its copolymer membranesWet-inversion membranes
Casting-freezing membranes
VIPS membranes
New methods like VIPS,
casting-freezing and
electrospinning are conducted
to prepare PVDF membranes.
• Publication number is
increasing dramatically.
Electrospinning membranes
The most important methods for PVDF membrane preparation are still non-solvent
induced phase separation (NIPS) and thermally induced phase separation (TIPS).
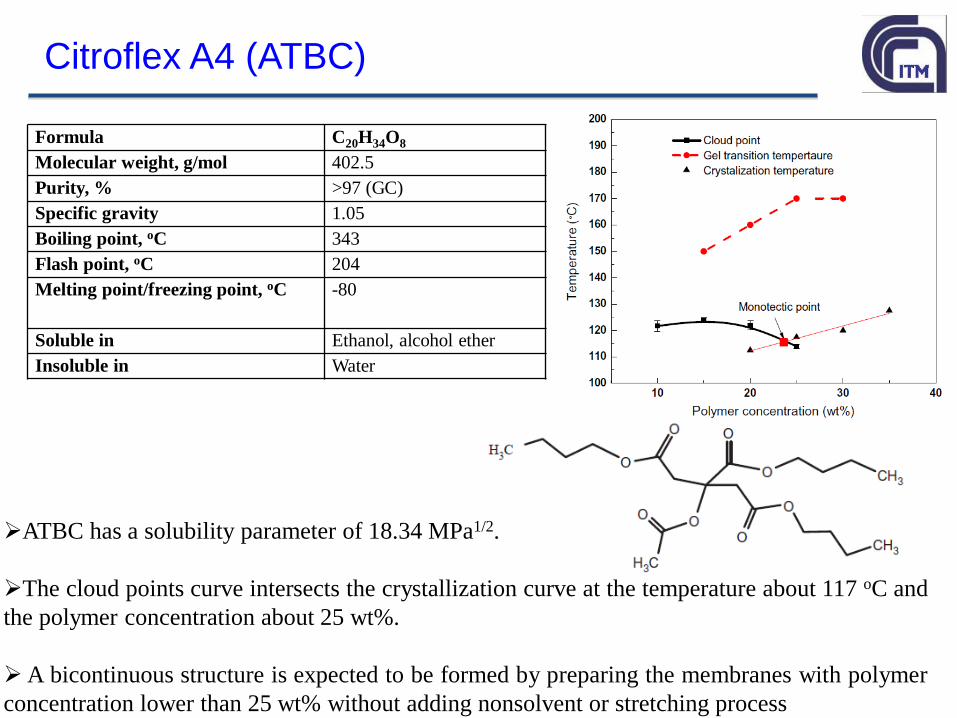
Citroflex A4 (ATBC)
Formula C20H34O8
Molecular weight, g/mol 402.5
Purity, % >97 (GC)
Specific gravity 1.05
Boiling point, oC 343
Flash point, oC 204
Melting point/freezing point, oC -80
Soluble in Ethanol, alcohol ether
Insoluble in Water
ATBC has a solubility parameter of 18.34 MPa1/2.
The cloud points curve intersects the crystallization curve at the temperature about 117 oC and
the polymer concentration about 25 wt%.
A bicontinuous structure is expected to be formed by preparing the membranes with polymer
concentration lower than 25 wt% without adding nonsolvent or stretching process

36
10 15 20 25 30 35
80
90
100
110
120
130
140
150
160
170
Te
mp
era
ture
(o
C)
Polymer concentration (wt.%)
PVDF 1010
10 15 20 25 30 35
80
90
100
110
120
130
140
150
160
170
Te
mp
era
ture
(o
C)
Polymer concentration (wt.%)
PVDF 1015
10 15 20 25 30 35
80
90
100
110
120
130
140
150
160
170
Te
mp
era
ture
(o
C)
Polymer concentration (wt.%)
PVDF 6020
0 5 10 15 20 25 30 35 400
20
40
60
80
100
120
140
Polymer concentration (wt.%)
Te
mp
era
ture
(oC
)
PVDF 1010-fitted curve
PVDF 1010- experimental data
PVDF 1015-fitted curve
PVDF 1015-experimental data
PVDF 6020-fitted curve
PVDF 6020-experimental data Effect of cooling rate, polymer molecular weight and
polymer concentration on cloud point. (a) Solef 1010, (b)
Solef 1015, (c) Solef 6020,( cooling rate: 1 oC /min (▲),
15 oC /min (●) and 30 oC /min (■)). (d) Solef 1010, Solef
1015 and solef 6020 (cooling rate: 30 oC /min).
Phase diagram for different molecular weight of PVDF
Cloud points in the PVDF/ATBC system decreased with the molecular weight of
PVDF. In fact, the high molecular weight of the polymer enhances the interaction
parameter between the polymer and diluent.

37
Morphology of flat sheet membranes
37a, b, c and d: PVDF concentration 15, 20, 25,
and 30 wt%
a, b and c: quenching temperature
30, 50, 100 oC
Bicontinuous structure was formed.
The membrane structure becomes
spherical from concentration of 25 wt%

38
Polymer structure (flat sheet) vs. Polymer concentration
Polymer concentration
(wt%)
Thickness
(μm)
Mean pore size
(μm)
Porosity
(%)
15 186 0.56 76.32
20 175 0.35 75.91
25 193 0.31 69.61
30 262 0.27 66.95
Liquid–liquid phase separation takes place when the polymer concentration is
lower than 25 wt%.
When the polymer concentration is higher than 24 wt%, the higher polymer
concentration reduces spherulite size, and consequently reduces mean pore size.
Porosity decreases with an increase in polymer concentration because the fraction
of the polymer-lean phase is reduced during phase separation.

39
Polymer structure (flat sheet) vs. Quenching temperature
Mean pore size decreases with increase in quenching temperatures.
Porosity increases with quenching temperature, the reason is that larger
pore sizes were induced on the bottom surfaces of the membranes prepared
at relatively higher temperatures.
Quenching temperature
(°C)
Thickness
(μm)
Mean pore size
(μm)
Porosity
(%)
30 175 0.35 77.05
50 294 0.27 79.64
100 312 0.16 81.14

40
Polymorph
40
FTIR
ATBC always induces α-phase PVDF during PVDF membrane preparation via
TIPS method without additives.
Z. Cui, et al., Poly(vinylidene fluoride) membrane preparation with an environmental diluent via thermally induced
phase separation, J Membr Sci (2013), http://dx.doi.org/10.1016/j.memsci.2013.05.031

20mer chain in ATBC
solvent box
Alpha form PVDF
Molecular Dynamics simulations
Crystalline (super)unit cell
interfacing ATBC solvent

42
Properties and performance of the membranes
42
The prepared membranes are MF membranes.
High porosity about 80% can be obtained.
The pure water flux is competitive used in MF/UF.
Z. Cui, et al., Poly(vinylidene fluoride) membrane preparation with an environmental diluent via thermally induced
phase separation, J Membr Sci (2013), http://dx.doi.org/10.1016/j.memsci.2013.05.031

4343
Mechanical strength (flat sheet)
Polymer concentration
(wt%)
Young's modulus
(MPa)
Tensile stress
(MPa)
Extension at break
(%)
15 27.65 1.02 9.28
20 38.58 0.94 13.99
25 59.39 1.47 14.87
30 126.18 4.83 11.97
In the case of solid–liquid TIPS membrane preparation, crystal nucleation and
growth determined the morphology and mechanical strength of the membrane.
The space between crystalline domains became pores upon extraction of the
diluents. Thus, higher polymer concentrations resulted in higher nucleation
density, forming membranes with higher mechanical strength because of
increased integrity.

4444
Mechanical strength (hollow fiber)
Tensile strength
(MPa)
Elongation
(%)
Fiber one 2.18 ± 0.08 89 5.0
Fiber two 3.08 ± 0.03 128 2.0
Fiber three 3.02 ± 0.25 105 7.3
PVDF 1015/30% DBP and 70% DEHP 0.43 69
PVDF 1015/40% DBP and 60% DEHP 0.59 6.81
PVDF 1015/DBP 0.91 8.91
Decreasing air gap from 2.5 cm (fiber one) to 4 mm (fiber two), the
mechanical properties of the membranes improved.
The reduction of mechanical properties of fiber three compared with fiber two
was due to high bore fluid temperature, which decreased the cooling rate of
the inner parts of the fibers.
Superior mechanical strengts compared to other published studies.

45
24
68
1012
1416
1012
1416
1820
60
65
70
75
80
Washing bath temperature (oC)
Quenching bath temperature (oC)
Po
ro
sit
y (
%)
67
68
69
70
71
72
73
74
75
76
24
68
1012
1416 10
12
14
16
18
20
60
65
70
75
80
Washing bath temperature (oC)
Quenching bath temperature (oC)
Po
ro
sit
y (
%)
64
66
68
70
72
74
24
68
1012
1416
1012
1416
1820
1
2
3
4
5
6
7
8
Washing bath temperature (oC)
Quenching bath temperature (oC)
Ten
sil
e s
tre
ng
th (
MP
a)
1.5
2
2.5
3
3.5
4
4.5
5
5.5
6
6.5
24
68
1012
1416
10
12
14
16
18
20
12345678
Washing bath temperature (oC)
Quenching bath temperature (oC)
Ten
sil
e s
tre
ng
th (
MP
a)
2
2.5
3
3.5
4
4.5
The effect of preparation conditions on overall porosity and tensile strength when the air gap is 4 mm (a and c) where air the
gap is 2 cm (b and d). The black points represent experimental data.
The effect of preparation condition on hollow fiber properties

46
60 65 70 750
1
2
3
4
5
6
7 Quenching bath temperature = 3
oC
Quenching bath temperature = 10 o
C
Quenching bath temperature = 15 o
C
Ten
sil
e s
tren
gth
(M
Pa)
Porosity (%)
Tensile=(-0.2237×Porosity)+18.73
60 65 70 75 80
100
1000
10000 Quenching bath temperature = 3
oC
Quenching bath temperature = 10 o
C
Quenching bath temperature = 15 o
C
Wate
r p
erm
eab
ilit
y (
LM
H)
Porosity (%)
Overall porosity of the membrane versus tensile strength and water permeability.
The effect of preparation condition on hollow fiber properties
By increasing the quenching bath temperature the overall porosity increase
and mechanical properties decrease

47
0.10 0.15 0.20 0.25 0.30
Inte
ns
ity
Average diameter (m)
0.176 m 0.222 m
Mean pore size and pore size distribution for different
molecular weights of PVDF Solef® 1015 (red) and Solef®
6020 (blue).
1500 1400 1300 1200 1100 1000 900 800 700
Tra
ns
mit
tan
ce
(%
)
Wave number (cm-1
)
Inner surface of PVDF 1015 hollow fiber
Outer surface fo PVDF 1015 hollow fiber
Inner surface of PVDF 6020 hollow fiber
Outer surface of PVDF 6020 hollow fiber
(840 cm-1)
(1270 cm-1)
FTIR results for different molecular weights of PVDF.
The effect of PVDF molecualr weight on hollw fiber properties
PVDF hollow fiber with very narrow pore size distribuition is prepared by green
solvent
Changin molecular weight of PVDF did not have significant effect on polymorphisim
of prepared membrane.

48
DCMD for the prepared hollow fibers the test was done using 3.5 wt.% NaCl solution at different flow velocity
and the Solef® 6020 hollow fiber membrane. Flux and temperature polarization coefficient increase as Re
increases.
500 750 1000 1250 1500
17
18
19
20
21
22
Flux
Temperature polarization coefficient
Ref
Flu
x (
Kg
/m2
.hr)
0.65
0.70
0.75
0.80
Te
mp
era
ture
Po
lariza
tion
Co
effic
ien
t
One of the potential applications of prepared hollow fiber membrane
Rejection in all experiments was more than 99.99%

49
ECTFE
CH2 CH2 C
Cl
F
CF2 n
Properties:
• High mechanical properties
• Excellent chemical stability
• Wear resistance
• Outstanding stability in pH
• Limited solubility in organic solvents
Chemical structure
Because of the limited solubility in organic solvents, ECTFE is difficult to be
fabricated into membranes by NIPS process, but it is possible by TIPS process.
Phase diagram of ECTFE/DBP system
Ramaswamy S, et al., J Membr Sci 2002; 210: 175–80; Roh IJ, et al., J Membr Sci 2010; 362: 211–20.

ECTFE (Ethylene–Chlorotrifluoroethylene copolymer) is a copolymer of formula
–(–CH2–CH2–CFCl–CF2–)n–, composed of alternating ethylene and
chlorotrifluoroethylene units.
Since it is very hydrophobic, an ECTFE porous membrane is more suitably
used in membrane processes in which vapor or gas passes through the
membrane pores, like MD, and a dense ECTFE membrane can be used in PV.
This material has been studied primarily in preparing flat sheet and hollow fiber
membranes, microporous membranes for UF/MF processes, and dense
membranes for the PV process.
C CC C C C
H
H
F
Cl
F
F
H
H
F
Cl
F
F
H
H
C
ECTFE membranes

Two different additives have been used in order to improve
the polymer processability: glycerol triacetate (GTA), known
also as triacetin and tri-ethyl citrate (Citroflex™, CTF).
CTF
GTA
Polymeric solution
T=180°C
Preparation of ECTFE membranes
Solvent: N-methyl pyrrolidone
Simone, Figoli, Galiano, Drioli et al. Sep and Purif Tech, 90 (2012)147-161

Cloud point DETERMINATION
0
20
40
60
80
100
120
140
160
180
0 5 10 15 20 25
T
(°C)
Weight fraction of ECTFE (%)
NMP NMP+GTA 5% NMP+CTF 5%
The cloud point temperature of a polymer/diluent system depends on the
affinity between the two: the lower the cloud point the more compatible are
the two components.
As shown in the graph, the compatibility of the polymer/diluent system can be further
improved by using CTF or GTA, which work as plasticizer additives.
Simone, Figoli, Galiano, Drioli et al. Sep and Purif Tech, 90 (2012)147-161
Preparation of ECTFE membranes

Morphology: Scanning Electron Microscope
Cross section Top side Bottom side
Cross section Top side Bottom side
ECTFE Membrane with GTA 5%
ECTFE Membrane with CTF 5%
ECTFE membranes presented an asymmetric dense structure.
CHARACTERISATION OF ECTFE MEMBRANE
Simone, Figoli, Galiano, Drioli et al. Sep and Purif Tech, 90 (2012)147-161

Hydrophobicity: Contact angles
98.990.5
102
119.3
0
30
60
90
120
GTA CTF
q()
Additive
Top Side Bottom Side
C.A. measurements confirm the hydrophobicity of ECTFE membranes.
The contact angle of top side (dense) is lower than the bottom side (sferulitical).
Simone, Figoli, Galiano, Drioli et al. Sep and Purif Tech, 90 (2012)147-161
CHARACTERISATION OF ECTFE MEMBRANE

When ECTFE membranes are fabricated, lower temperatures of the casting
block result in anisotropic membrane structure, even with the formation of a
dense skin layer at the quenched surface. On the other hand, if the
casting temperature is high, a dense skin layer also might be induced at the
top surface of flat sheet membranes because of evaporation.
To produce a porous membrane, the formation of a dense skin layer can
be avoided, and more porous membranes can be obtained by co-extrusion
of hot solvent on both sides of the polymeric dope during casting.
Stretching the membrane film during casting has been found to be an
interesting way to improve ECTFE membrane surface porosity and effective
surface pore size. Another method to improve the porosity is incorporating
particles such as silica.
Z. Cui et al. / Progress in Polymer Science. In press.

ECTFE microporous flat sheet membranesC
ross
Se
ctio
n
Surf
ace
: TO
P S
ide
Surf
ace
: B
OT
TOM
Sid
e
113±3µm
ECTFE membranes showed a symmetric porous morphology.The roughness of the surface TOP side is lower than the Surface BOTTOM Side.

ECTFE flat-sheet membrane
Higher contact angles were observed for the bottom side (~139°) than air side (~91°) because of the higher as a consequence of the higher roughness .
ECTFE membrane is hydrophobic and can be used, for example, as a barrier to water transport.

Porosity
0
20
40
60
80
100
ECTFE PVDFP
oro
sit
y(%
)
New hydrophobic flat sheetmembrane and PVDF hollow fibrepresented porosity of around 80%.
Mechanical Tests
MembraneYoung's Modulus
(N/mm2)
Elongation at
Braeak (%)
ECTFE 88±6 123±2
PVDF 53±7 22±4
New polymer(≈83%) (≈80%)
ECTFE flat-sheet membrane

Composite hollow fibres: ECTFE on PP support
Dip-coating, using PP fibers as support, of ECTFE polymeric solution (from 1wt% to
5wt%) in NMP at 135°C. In order to modulate the morphology of the coated
layer of ECTFE, the time of dip-coating was varied from 1 s to 5 s.
ACCUREL® PP S6/2 hollow fibre supplied by Membrana has been used as support of the ECTFE skin layer
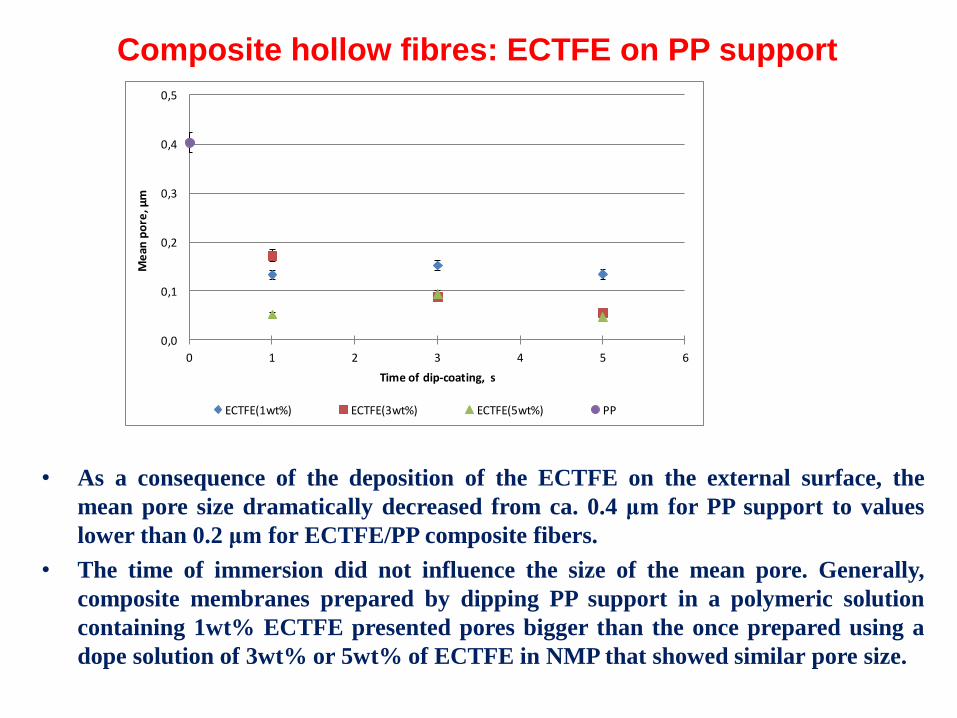
• As a consequence of the deposition of the ECTFE on the external surface, the
mean pore size dramatically decreased from ca. 0.4 μm for PP support to values
lower than 0.2 μm for ECTFE/PP composite fibers.
• The time of immersion did not influence the size of the mean pore. Generally,
composite membranes prepared by dipping PP support in a polymeric solution
containing 1wt% ECTFE presented pores bigger than the once prepared using a
dope solution of 3wt% or 5wt% of ECTFE in NMP that showed similar pore size.
0,0
0,1
0,2
0,3
0,4
0,5
0 1 2 3 4 5 6
Me
an p
ore
, μm
Time of dip-coating, s
ECTFE(1wt%) ECTFE(3wt%) ECTFE(5wt%) PP
Composite hollow fibres: ECTFE on PP support

61
Other fluoropolymers for membranes
Name Chemical structure Membrane process
Hyflon® AD Gas separation, have potential in
MD, MC
Teflon® AF Gas separation, have potential in
MD, MC
Cytop® Gas separation, have potential in
MD, MC
CF C
O
CF2
O
CF2
OF3C
CF2
m
n
CF CF
O
C
O
CF2 CF2m n
F3C CF3
CF CF
O
CF2
CF2
CF2 CF2n

DCMD VMD
50 60 70
6
9
12
15
18
21
Flu
x (
kg/m
2.h
)
Temperature (°C)
M1
M2
M3
PP
50 60 706
9
12
15
18
21
Flu
x (
kg
/m2.h
)
Temperature (°C)
6 L/h
7.8 L/h
9.6 L/h
11.4 L/h
E. Drioli et al., Separation and Purification Technology 115 (2013) 27–38
62
Fiber VMD flux (H2O)
(kg/h m2)
M1 15.06
M2 22.37
M3 41.78
Permeate temperature: 25 C
Permeate flow-rate: 6 l/h
Membrane performance in VDM and DCMD
Pvacuum 40 mbar, Tfin 50 °C, Qfeed 6 l/h

Morphology vs performanceFiber Morphology Thickness
(mm)
Porosity
(%)
Ref. 18 fiber 4b Spongy with some fingers at outer surface 0.174 81.23
Ref. 18 fiber 4d Spongy with some fingers at outer surface 0.202 78.09
Ref. 18 fiber 4g Spongy with some fingers at outer surface 0.139 78.45
M1 Spongy with some fingers at outer surface 0.38 80.9
M2 Asymmetric with fingers at inner and outer surface 0.45 79.11
M3 Asymmetric with fingers towards inner surface 0.23 83.39
63E. Drioli et al., Separation and Purification Technology 115 (2013) 27–38,S. Simone et al. / Journal of Membrane Science 364 (2010) 219–232
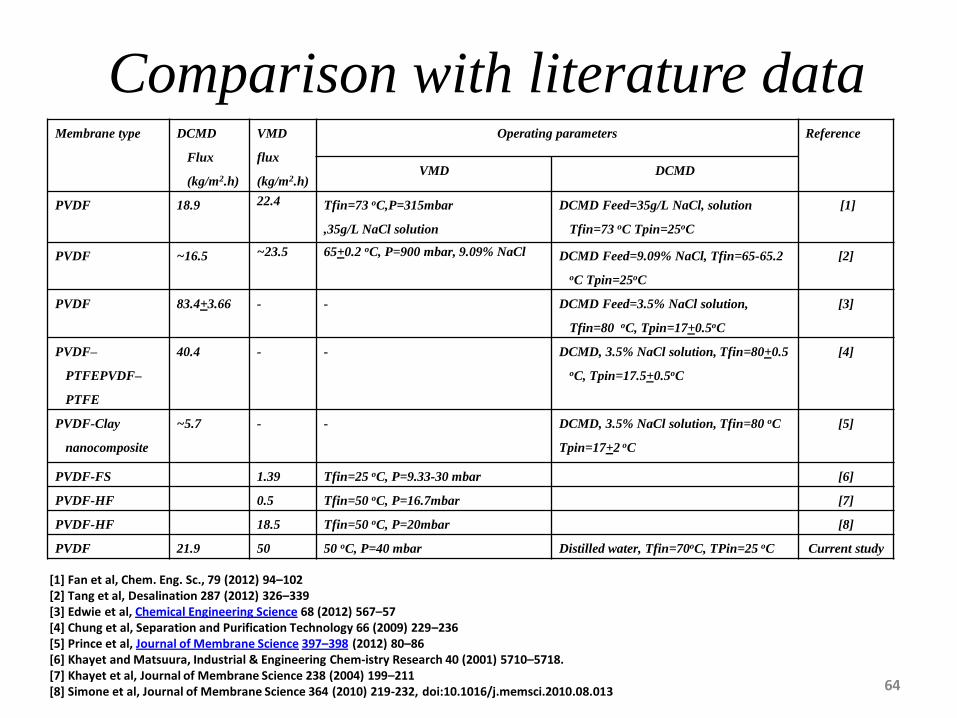
Comparison with literature dataMembrane type DCMD
Flux
(kg/m2.h)
VMD
flux
(kg/m2.h)
Operating parameters Reference
VMD DCMD
PVDF 18.9 22.4 Tfin=73 oC,P=315mbar
,35g/L NaCl solution
DCMD Feed=35g/L NaCl, solution
Tfin=73 oC Tpin=25oC
[1]
PVDF ~16.5 ~23.5 65+0.2 oC, P=900 mbar, 9.09% NaCl DCMD Feed=9.09% NaCl, Tfin=65-65.2
oC Tpin=25oC
[2]
PVDF 83.4+3.66 - - DCMD Feed=3.5% NaCl solution,
Tfin=80 oC, Tpin=17+0.5oC
[3]
PVDF–
PTFEPVDF–
PTFE
40.4 - - DCMD, 3.5% NaCl solution, Tfin=80+0.5
oC, Tpin=17.5+0.5oC
[4]
PVDF-Clay
nanocomposite
~5.7 - - DCMD, 3.5% NaCl solution, Tfin=80 oC
Tpin=17+2 oC
[5]
PVDF-FS 1.39 Tfin=25 oC, P=9.33-30 mbar [6]
PVDF-HF 0.5 Tfin=50 oC, P=16.7mbar [7]
PVDF-HF 18.5 Tfin=50 oC, P=20mbar [8]
PVDF 21.9 50 50 oC, P=40 mbar Distilled water, Tfin=70oC, TPin=25 oC Current study
[1] Fan et al, Chem. Eng. Sc., 79 (2012) 94–102[2] Tang et al, Desalination 287 (2012) 326–339[3] Edwie et al, Chemical Engineering Science 68 (2012) 567–57[4] Chung et al, Separation and Purification Technology 66 (2009) 229–236[5] Prince et al, Journal of Membrane Science 397–398 (2012) 80–86[6] Khayet and Matsuura, Industrial & Engineering Chem-istry Research 40 (2001) 5710–5718.[7] Khayet et al, Journal of Membrane Science 238 (2004) 199–211[8] Simone et al, Journal of Membrane Science 364 (2010) 219-232, doi:10.1016/j.memsci.2010.08.013 64

65
High lights of Rhodiasolv® PolarClean
O O
CH3-O-C- -C-NBranched
C4
CH3
CH3
Polar and water soluble.
Excellent toxicological & ecotoxicological profiles
Non-flammable and with very low vapour pressure
Based on Rhodia raw material Reduced carbon foot print
Hansen parameters close to solvents such as e.g. NMP, ADMA etc.
A new environmental friendly solvent
PVDF 1015 was used to investigate the potential of Polarclean for membrane production

66
No PVP PVP 10K PVP 55K PVP 360K PVP 1300K
A-5 oC A-5 oC A-5 oC A-5 oC
A-15 oC A-15 oC A-15 oC A-15 oC A-15 oC
A-25 oC A-25 oC A-25 oC A-25 oC A-25 oC
B-5 oC B-5 oC B-5 oC
B-5 oC
B-5 oC
B-15 oC B-15 oC B-15 oC B-15 oC B-15 oC
B-25 oC B-25 oC B-25 oC B-25 oC B-25 oC
C-5 oC C-5 oC C-5 oC C-5 oC C-5 oC
A-5 oC
Preparation porous membrane
5 10 15 20 250
250
500
750
1000
1250
Wate
r p
erm
eab
ilit
y (
LM
H)
Quenching bath temperature (oC)
PVP 10k
PVP 55k
PVP 360k
PVP 1300k

67
5 10 15 20 25
20
40
60
Rq
(nm
)
Quenching bath temperature (oC)
No PVP
PVP (Mw= 10 K)
PVP (Mw= 55 K)
PVP (Mw= 360 K)
PVP (Mw= 1300 K)
(a)
5 10 15 20 250
20
40
Ra(
nm
)
Quenching bath temperature (oC)
No PVP
PVP (Mw= 10 K)
PVP (Mw= 55 K)
PVP (Mw= 360 K)
PVP (Mw= 1300 K)
(b)
0
1
2
3
4
5
6
7
1300K
360K
55K
10K
No PVP
Molecular weight o
f PVP
PVP Mw=1300K
PVP Mw=360K
PVP Mw=55K
PVP Mw=10K
No PVP
Tens
ile s
tren
gth
(MP
a)
Quenching bath temperature ( oC)
5
15
25
(a)
010
20
30
40
50
60
70
80
90
100
1300K
360K
55K
10K
No PVP
Molecular weight o
f PVP
PVP Mw=1300K
PVP Mw=360K
PVP Mw=55K
PVP Mw=10K
No PVP
Ove
rall
poro
sity
(%)
Quenching bath temperature ( oC)
5
15
25
(b)
By increasing the quenching bath
temperature the roughness of
prepared hollow fibers increase
By increasing the molecular weight of PVP
the overall porosity increase and mechanical
properties decrease

68
The effect of PVP molecular weights on polymorphism. A, B, C, D and E are No PVP, PVP 10k, PVP 55k, PVP
360k, PVP 1300k.
1500 1400 1300 1200 1100 1000 900 800 700
Tra
nm
itta
nce (
%)
Wavenumber (cm-1)
A
B
C
D
E
(cm-1) (cm
-1)
1400 1300 1200 1100 1000 900 800 700
Tra
nsm
itta
nce (
%)
Wavenumber (cm-1)
A
B
C
D
E
(1270 cm-1
)
(1270 cm-1
)
1400 1300 1200 1100 1000 900 800 700
Tra
nsm
itta
nce (
%)
Wavenumber (cm-1)
A
B
C
D
E
(cm-1
)
(cm-1
)
Quenching bath temp= 5 oC Quenching bath temp= 15 oC Quenching bath temp= 25 oC
The result of FTIR confirm the existence of β phase in the skin layer of prepared hollow fibers
By increasing the molecular weight of PVP the amount of β phase increase and then decrease
The effect of additive on polymorphism

69
1400 1300 1200 1100 1000 900 800 700
Tra
nsm
itta
nce (
%)
Wavenumber (cm-1)
5 o
C
15 o
C
25 o
C
(840 cm-1
)
(1270 cm-1
)
The effect of quenching temperature in polymorphism
10 15 20 25 30
Inte
nsit
y
2q(o)
(o)
(20.26o
)
PVP 360k- 25 oC
PVP 360k- 15 oC
PVP 360k- 5 oC
No PVP- 5 oC
XRD results of produced hollow fiber membranes
The amount of β phase changed in the skin layer while it was constant in the bulk of membrane
By increasing the quenching bath temperature the amount of β phase decreased
The effect of additive on polymorphism

70
Morphology of the hollow fibers by using glycerol as additive. A and B are 5 and 15 wt.% glycerol, respectively. C,
O and I are cross section, outer part and inner part of hollow fibers, respectively.
A B
C- 5 oC
C- 15 oC
C- 25 oC
C- 40 oC
O-5
oC
O-15
oC
O-25
oC
O-40
oC
I-5 oC
I-15 oC
I-25 oC
I-40 oC
A A AB B B
Using glycerol as additive
71
0 5 10 15 20 25 30 35 40 45
10
100
1000
Tra
ns
-me
mb
ran
e f
lux
(lit
/m2.h
r.b
ar)
Quenching bath temperature (oC)
PVDF/PVP
PVDF/glycerol (5 wt.%)
PVDF/glycerol (15 wt.%)
PVDF/PMMA
(a)
0 5 10 15 20 25 30 35 40 450
1
2
3
4
5
6
7
8
Ten
sil
e s
tren
gth
(M
Pa)
Quenching bath temperature (oC)
PVDF
PVDF/Glycerol (5 wt. %)
PVDF/Glycerol (15 wt. %)
PVDF/PVP
PVDF/PMMA
(b)
0 5 10 15 20 25 30 35 40 4560
65
70
75
80
85
90
95
Po
rosit
y (
%)
Quenching bath tempeature (oC)
PVDF
PVDF/glycerol (5 wt. %)
PVDF/glycerol (15 wt. %)
PVDF/PVP
PVDF/PMMA
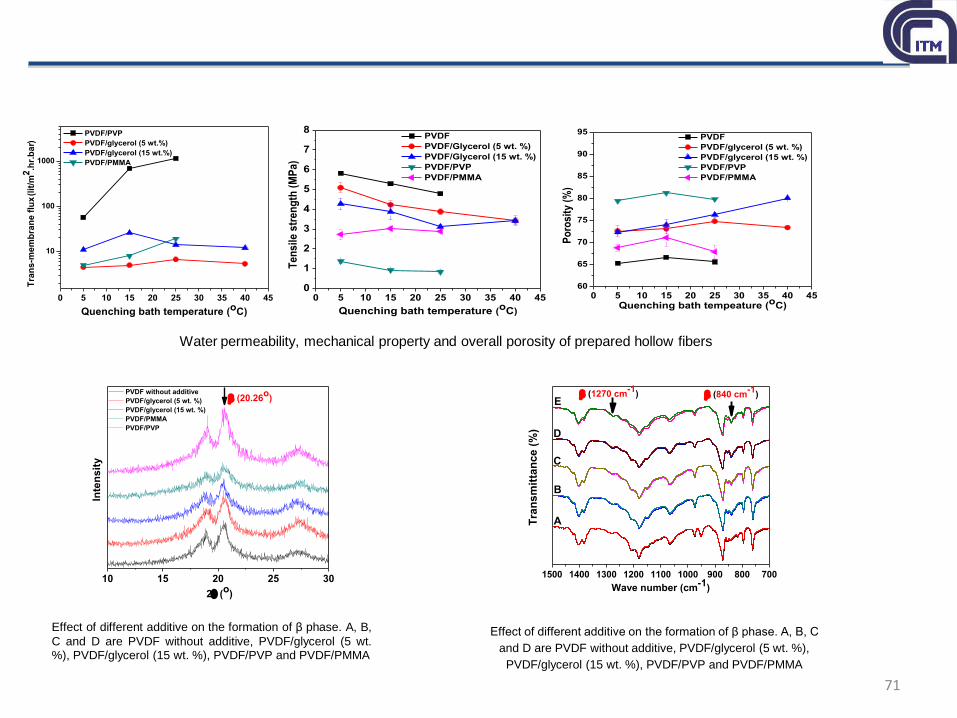
Water permeability, mechanical property and overall porosity of prepared hollow fibers
10 15 20 25 30
Inte
nsit
y
2q(o
)
PVDF without additive
PVDF/glycerol (5 wt. %)
PVDF/glycerol (15 wt. %)
PVDF/PMMA
PVDF/PVP
(20.26o
)
Effect of different additive on the formation of β phase. A, B,
C and D are PVDF without additive, PVDF/glycerol (5 wt.%), PVDF/glycerol (15 wt. %), PVDF/PVP and PVDF/PMMA
0 5 10 15 20 25 30 35 40 45
10
100
1000
Tra
ns
-me
mb
ran
e f
lux
(lit
/m2.h
r.b
ar)
Quenching bath temperature (oC)
PVDF/PVP
PVDF/glycerol (5 wt.%)
PVDF/glycerol (15 wt.%)
PVDF/PMMA
(a)
0 5 10 15 20 25 30 35 40 450
1
2
3
4
5
6
7
8
Ten
sil
e s
tren
gth
(M
Pa)
Quenching bath temperature (oC)
PVDF
PVDF/Glycerol (5 wt. %)
PVDF/Glycerol (15 wt. %)
PVDF/PVP
PVDF/PMMA
(b)
1500 1400 1300 1200 1100 1000 900 800 700
Tra
nsm
itta
nce (
%)
Wave number (cm-1
)
A
B
C
D
E
(1270 cm-1
)
(840 cm-1
)
Effect of different additive on the formation of β phase. A, B, C
and D are PVDF without additive, PVDF/glycerol (5 wt. %),
PVDF/glycerol (15 wt. %), PVDF/PVP and PVDF/PMMA

72
Conclusions and outlook
PVDF and PTFE homopolymers and their copolymers are the most important
fluoropolymers for membranes in the past and now.
ECTFE is a new novel materials for membranes with high properties and
performances and, it has higher processability than PTFE.
In the past, hydrophilicity was the first consideration, but now hydrophobicity
is obtaining more and more attention.
Some amorphous fluoropolymers such as Hyflon® AD, Teflon® AF and
Cytop® are very interesting for gas separation.
New methods such as VIPS, TIPS/NIPS combination, Casting-freezing and
electrospinning becomes novel approaches to prepare good membranes.
Blending amphiphilic copolymers to modify fluoropolymers is an interesting
method to realize preparation and modification in one step.

73
Conclusions and outlook
PVDF membrane with compatible properties were prepared with green
solvent
By using the additives the amount of β phase was controlled in the skin layer
of the membrane
The prepared membranes were used in membrane distillation as one of
potential application
Thank you for your attention