TRANSPORT OF IONS AND SMALL MOLECULES …€¦ · is mediated by selective membrane transport...
56
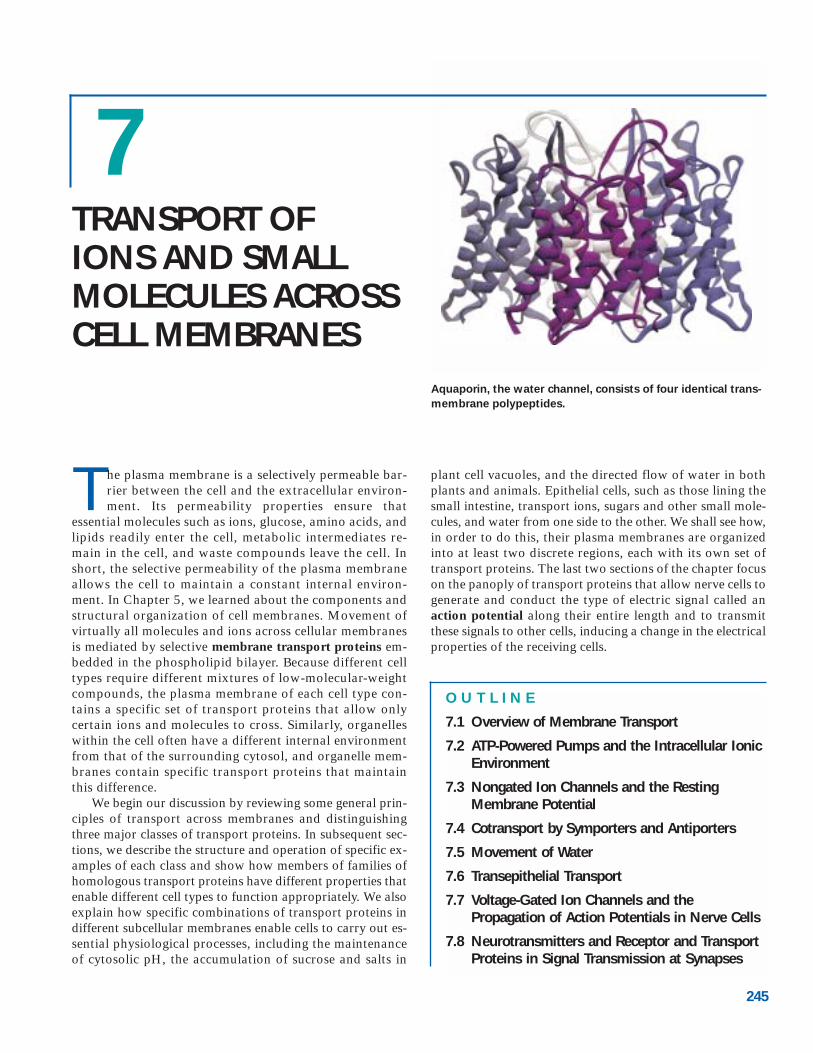
7 Aquaporin, the water channel, consists of four identical trans- membrane polypeptides. TRANSPORT OF IONS AND SMALL MOLECULES ACROSS CELL MEMBRANES T he plasma membrane is a selectively permeable bar- rier between the cell and the extracellular environ- ment. Its permeability properties ensure that essential molecules such as ions, glucose, amino acids, and lipids readily enter the cell, metabolic intermediates re- main in the cell, and waste compounds leave the cell. In short, the selective permeability of the plasma membrane allows the cell to maintain a constant internal environ- ment. In Chapter 5, we learned about the components and structural organization of cell membranes. Movement of virtually all molecules and ions across cellular membranes is mediated by selective membrane transport proteins em- bedded in the phospholipid bilayer. Because different cell types require different mixtures of low-molecular-weight compounds, the plasma membrane of each cell type con- tains a specific set of transport proteins that allow only certain ions and molecules to cross. Similarly, organelles within the cell often have a different internal environment from that of the surrounding cytosol, and organelle mem- branes contain specific transport proteins that maintain this difference. We begin our discussion by reviewing some general prin- ciples of transport across membranes and distinguishing three major classes of transport proteins. In subsequent sec- tions, we describe the structure and operation of specific ex- amples of each class and show how members of families of homologous transport proteins have different properties that enable different cell types to function appropriately. We also explain how specific combinations of transport proteins in different subcellular membranes enable cells to carry out es- sential physiological processes, including the maintenance of cytosolic pH, the accumulation of sucrose and salts in 245 OUTLINE 7.1 Overview of Membrane Transport 7.2 ATP-Powered Pumps and the Intracellular Ionic Environment 7.3 Nongated Ion Channels and the Resting Membrane Potential 7.4 Cotransport by Symporters and Antiporters 7.5 Movement of Water 7.6 Transepithelial Transport 7.7 Voltage-Gated Ion Channels and the Propagation of Action Potentials in Nerve Cells 7.8 Neurotransmitters and Receptor and Transport Proteins in Signal Transmission at Synapses plant cell vacuoles, and the directed flow of water in both plants and animals. Epithelial cells, such as those lining the small intestine, transport ions, sugars and other small mole- cules, and water from one side to the other. We shall see how, in order to do this, their plasma membranes are organized into at least two discrete regions, each with its own set of transport proteins. The last two sections of the chapter focus on the panoply of transport proteins that allow nerve cells to generate and conduct the type of electric signal called an action potential along their entire length and to transmit these signals to other cells, inducing a change in the electrical properties of the receiving cells.
Transcript of TRANSPORT OF IONS AND SMALL MOLECULES …€¦ · is mediated by selective membrane transport...
7
Aquaporin, the water channel, consists of four identical trans-
membrane polypeptides.
TRANSPORT OF IONS AND SMALL MOLECULES ACROSSCELL MEMBRANES
The plasma membrane is a selectively permeable bar-rier between the cell and the extracellular environ-ment. Its permeability properties ensure that
essential molecules such as ions, glucose, amino acids, andlipids readily enter the cell, metabolic intermediates re-main in the cell, and waste compounds leave the cell. Inshort, the selective permeability of the plasma membraneallows the cell to maintain a constant internal environ-ment. In Chapter 5, we learned about the components andstructural organization of cell membranes. Movement ofvirtually all molecules and ions across cellular membranesis mediated by selective membrane transport proteins em-bedded in the phospholipid bilayer. Because different celltypes require different mixtures of low-molecular-weightcompounds, the plasma membrane of each cell type con-tains a specific set of transport proteins that allow onlycertain ions and molecules to cross. Similarly, organelleswithin the cell often have a different internal environmentfrom that of the surrounding cytosol, and organelle mem-branes contain specific transport proteins that maintainthis difference.
We begin our discussion by reviewing some general prin-ciples of transport across membranes and distinguishingthree major classes of transport proteins. In subsequent sec-tions, we describe the structure and operation of specific ex-amples of each class and show how members of families ofhomologous transport proteins have different properties thatenable different cell types to function appropriately. We alsoexplain how specific combinations of transport proteins indifferent subcellular membranes enable cells to carry out es-sential physiological processes, including the maintenanceof cytosolic pH, the accumulation of sucrose and salts in
245
O U T L I N E
7.1 Overview of Membrane Transport
7.2 ATP-Powered Pumps and the Intracellular IonicEnvironment
7.3 Nongated Ion Channels and the RestingMembrane Potential
7.4 Cotransport by Symporters and Antiporters
7.5 Movement of Water
7.6 Transepithelial Transport
7.7 Voltage-Gated Ion Channels and thePropagation of Action Potentials in Nerve Cells
7.8 Neurotransmitters and Receptor and TransportProteins in Signal Transmission at Synapses
plant cell vacuoles, and the directed flow of water in bothplants and animals. Epithelial cells, such as those lining thesmall intestine, transport ions, sugars and other small mole-cules, and water from one side to the other. We shall see how,in order to do this, their plasma membranes are organizedinto at least two discrete regions, each with its own set oftransport proteins. The last two sections of the chapter focuson the panoply of transport proteins that allow nerve cells togenerate and conduct the type of electric signal called anaction potential along their entire length and to transmitthese signals to other cells, inducing a change in the electricalproperties of the receiving cells.
Overview of Membrane TransportThe phospholipid bilayer, the basic structural unit of bio-membranes, is essentially impermeable to most water-soluble molecules, ions, and water itself. After describing thefactors that influence the permeability of lipid membranes,we briefly compare the three major classes of membrane proteins that increase the permeability of biomembranes. Wethen examine operation of the simplest type of transport protein to illustrate basic features of protein-mediated trans-port. Finally, two common experimental systems used instudying the functional properties of transport proteins aredescribed.
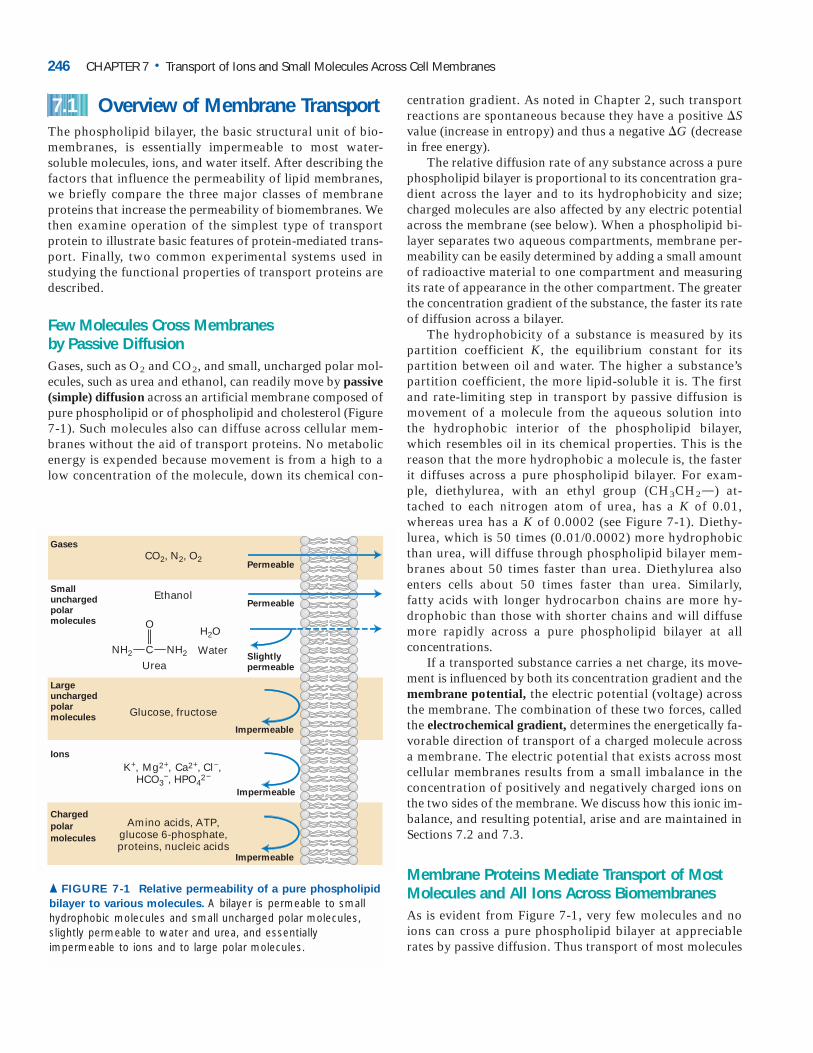
Few Molecules Cross Membranes by Passive DiffusionGases, such as O2 and CO2, and small, uncharged polar mol-ecules, such as urea and ethanol, can readily move by passive(simple) diffusion across an artificial membrane composed ofpure phospholipid or of phospholipid and cholesterol (Figure7-1). Such molecules also can diffuse across cellular mem-branes without the aid of transport proteins. No metabolicenergy is expended because movement is from a high to alow concentration of the molecule, down its chemical con-
7.1 centration gradient. As noted in Chapter 2, such transportreactions are spontaneous because they have a positive �Svalue (increase in entropy) and thus a negative �G (decreasein free energy).
The relative diffusion rate of any substance across a purephospholipid bilayer is proportional to its concentration gra-dient across the layer and to its hydrophobicity and size;charged molecules are also affected by any electric potentialacross the membrane (see below). When a phospholipid bi-layer separates two aqueous compartments, membrane per-meability can be easily determined by adding a small amountof radioactive material to one compartment and measuringits rate of appearance in the other compartment. The greaterthe concentration gradient of the substance, the faster its rateof diffusion across a bilayer.
The hydrophobicity of a substance is measured by its partition coefficient K, the equilibrium constant for its partition between oil and water. The higher a substance’s partition coefficient, the more lipid-soluble it is. The first and rate-limiting step in transport by passive diffusion is movement of a molecule from the aqueous solution into the hydrophobic interior of the phospholipid bilayer, which resembles oil in its chemical properties. This is the reason that the more hydrophobic a molecule is, the faster it diffuses across a pure phospholipid bilayer. For exam-ple, diethylurea, with an ethyl group (CH3CH2O) at-tached to each nitrogen atom of urea, has a K of 0.01, whereas urea has a K of 0.0002 (see Figure 7-1). Diethy-lurea, which is 50 times (0.01/0.0002) more hydrophobic than urea, will diffuse through phospholipid bilayer mem-branes about 50 times faster than urea. Diethylurea also enters cells about 50 times faster than urea. Similarly, fatty acids with longer hydrocarbon chains are more hy-drophobic than those with shorter chains and will diffuse more rapidly across a pure phospholipid bilayer at all concentrations.
If a transported substance carries a net charge, its move-ment is influenced by both its concentration gradient and themembrane potential, the electric potential (voltage) acrossthe membrane. The combination of these two forces, calledthe electrochemical gradient, determines the energetically fa-vorable direction of transport of a charged molecule acrossa membrane. The electric potential that exists across mostcellular membranes results from a small imbalance in theconcentration of positively and negatively charged ions onthe two sides of the membrane. We discuss how this ionic im-balance, and resulting potential, arise and are maintained inSections 7.2 and 7.3.
Membrane Proteins Mediate Transport of MostMolecules and All Ions Across BiomembranesAs is evident from Figure 7-1, very few molecules and noions can cross a pure phospholipid bilayer at appreciablerates by passive diffusion. Thus transport of most molecules
246 CHAPTER 7 • Transport of Ions and Small Molecules Across Cell Membranes
Permeable
Slightlypermeable
Impermeable
Impermeable
Impermeable
Permeable
Amino acids, ATP,glucose 6-phosphate,proteins, nucleic acids
H2O
CO2, N2, O2
EthanolSmallunchargedpolarmolecules
Largeunchargedpolarmolecules
Ions
Chargedpolarmolecules
Gases
Urea
Glucose, fructose
K+, Mg2+, Ca2+, Cl−,
HCO3−, HPO4
2−
O
NH2NH2 C Water
▲ FIGURE 7-1 Relative permeability of a pure phospholipid
bilayer to various molecules. A bilayer is permeable to small hydrophobic molecules and small uncharged polar molecules,slightly permeable to water and urea, and essentially impermeable to ions and to large polar molecules.
into and out of cells requires the assistance of specializedmembrane proteins. Even transport of molecules with a rel-atively large partition coefficient (e.g., water and urea) is fre-quently accelerated by specific proteins because theirtransport by passive diffusion usually is not sufficiently rapidto meet cellular needs.
All transport proteins are transmembrane proteins con-taining multiple membrane-spanning segments that generallyare � helices. By forming a protein-lined pathway across themembrane, transport proteins are thought to allow move-ment of hydrophilic substances without their coming intocontact with the hydrophobic interior of the membrane.Here we introduce the various types of transport proteinscovered in this chapter (Figure 7-2).
ATP-powered pumps (or simply pumps) are ATPasesthat use the energy of ATP hydrolysis to move ions or smallmolecules across a membrane against a chemical concentra-tion gradient or electric potential or both. This process, re-ferred to as active transport, is an example of a coupledchemical reaction (Chapter 2). In this case, transport of ionsor small molecules “uphill” against an electrochemical gra-dient, which requires energy, is coupled to the hydrolysis ofATP, which releases energy. The overall reaction—ATP hydrolysis and the “uphill” movement of ions or small mol-ecules—is energetically favorable.
Channel proteins transport water or specific types of ionsand hydrophilic small molecules down their concentration orelectric potential gradients. Such protein-assisted transportsometimes is referred to as facilitated diffusion. Channel pro-teins form a hydrophilic passageway across the membranethrough which multiple water molecules or ions move si-multaneously, single file at a very rapid rate. Some ion chan-
nels are open much of the time; these are referred to as non-gated channels. Most ion channels, however, open only in re-sponse to specific chemical or electrical signals; these arereferred to as gated channels.
Transporters (also called carriers) move a wide varietyof ions and molecules across cell membranes. Three types oftransporters have been identified. Uniporters transport a sin-gle type of molecule down its concentration gradient via fa-cilitated diffusion. Glucose and amino acids cross the plasmamembrane into most mammalian cells with the aid of uni-porters. In contrast, antiporters and symporters couple themovement of one type of ion or molecule against its concen-tration gradient with the movement of one or more differ-ent ions down its concentration gradient. These proteinsoften are called cotransporters, referring to their ability totransport two different solutes simultaneously.
Like ATP pumps, cotransporters mediate coupled re-actions in which an energetically unfavorable reaction (i.e., uphill movement of molecules) is coupled to an ener-getically favorable reaction. Note, however, that the nature of the energy-supplying reaction driving active transport by these two classes of proteins differs. ATP pumps use en-ergy from hydrolysis of ATP, whereas cotransporters use the energy stored in an electrochemical gradient. This lat-ter process sometimes is referred to as secondary active transport.
Table 7-1 summarizes the four mechanisms by whichsmall molecules and ions are transported across cellularmembranes. In this chapter, we focus on the properties andoperation of the membrane proteins that mediate the threeprotein-dependent transport mechanisms. Conformationalchanges are essential to the function of all transport proteins.
7.1 • Overview of Membrane Transport 247
Uniporter Symporter Antiporter
Transporters
(102−104 molecules/s)
Exterior
Cytosol
Ion channels
(107−108 ions/s)
ClosedOpen
ATP
ATP-powered pumps
(100−103 ions/s)
ADP + Pi
1 2 3
A B C
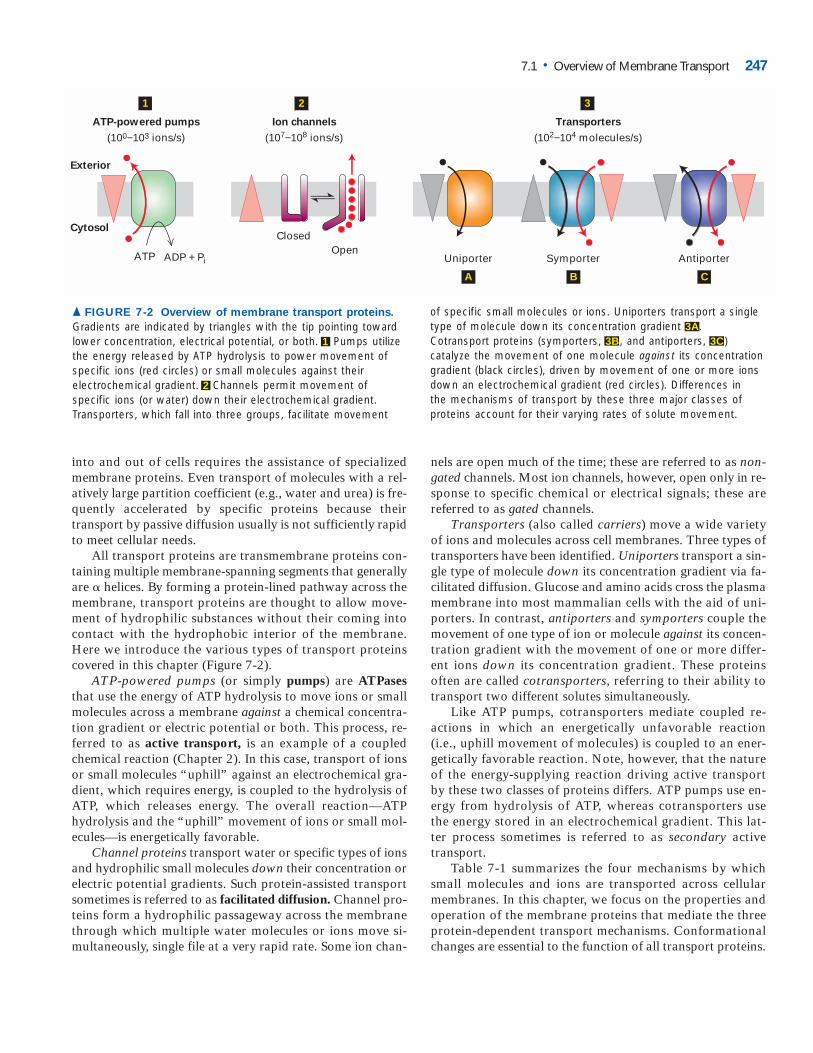
▲ FIGURE 7-2 Overview of membrane transport proteins.
Gradients are indicated by triangles with the tip pointing towardlower concentration, electrical potential, or both. 1 Pumps utilizethe energy released by ATP hydrolysis to power movement ofspecific ions (red circles) or small molecules against their electrochemical gradient. 2 Channels permit movement of specific ions (or water) down their electrochemical gradient.Transporters, which fall into three groups, facilitate movement
of specific small molecules or ions. Uniporters transport a singletype of molecule down its concentration gradient 3A. Cotransport proteins (symporters, 3B , and antiporters, 3C ) catalyze the movement of one molecule against its concentrationgradient (black circles), driven by movement of one or more ionsdown an electrochemical gradient (red circles). Differences in the mechanisms of transport by these three major classes ofproteins account for their varying rates of solute movement.
ATP-powered pumps and transporters undergo a cycle ofconformational change exposing a binding site (or sites) toone side of the membrane in one conformation and to theother side in a second conformation. Because each such cycleresults in movement of only one (or a few) substrate mole-cules, these proteins are characterized by relatively slow ratesof transport ranging from 100 to 104 ions or molecules persecond (see Figure 7-2). Ion channels shuttle between aclosed state and an open state, but many ions can passthrough an open channel without any further conforma-tional change. For this reason, channels are characterized byvery fast rates of transport, up to 108 ions per second.
Several Features Distinguish Uniport Transport from Passive DiffusionThe protein-mediated movement of glucose and other smallhydrophilic molecules across a membrane, known as uniporttransport, exhibits the following distinguishing properties:
1. The rate of facilitated diffusion by uniporters is far higherthan passive diffusion through a pure phospholipid bilayer.
2. Because the transported molecules never enter the hydro-phobic core of the phospholipid bilayer, the partition coefficient K is irrelevant.
3. Transport occurs via a limited number of uniporter molecules, rather than throughout the phospholipid bilayer.Consequently, there is a maximum transport rate Vmax thatis achieved when the concentration gradient across the
membrane is very large and each uniporter is working at its maximal rate.
4. Transport is specific. Each uniporter transports only a single species of molecule or a single group of closely related molecules. A measure of the affinity of a transporterfor its substrate is Km, which is the concentration of substrate at which transport is half-maximal.
These properties also apply to transport mediated by theother classes of proteins depicted in Figure 7-2.
One of the best-understood uniporters is the glucosetransporter GLUT1 found in the plasma membrane of erythrocytes. The properties of GLUT1 and many othertransport proteins from mature erythrocytes have been ex-tensively studied. These cells, which have no nucleus or otherinternal organelles, are essentially “bags” of hemoglobincontaining relatively few other intracellular proteins and asingle membrane, the plasma membrane (see Figure 5-3a).Because the erythrocyte plasma membrane can be isolatedin high purity, isolating and purifying a transport proteinfrom mature erythrocytes is a straightforward procedure.
Figure 7-3 shows that glucose uptake by erythrocytes andliver cells exhibits kinetics characteristic of a simple enzyme-catalyzed reaction involving a single substrate. The kineticsof transport reactions mediated by other types of proteins aremore complicated than for uniporters. Nonetheless, allprotein-assisted transport reactions occur faster than allowedby passive diffusion, are substrate-specific as reflected inlower Km values for some substrates than others, and exhibita maximal rate (Vmax).
248 CHAPTER 7 • Transport of Ions and Small Molecules Across Cell Membranes
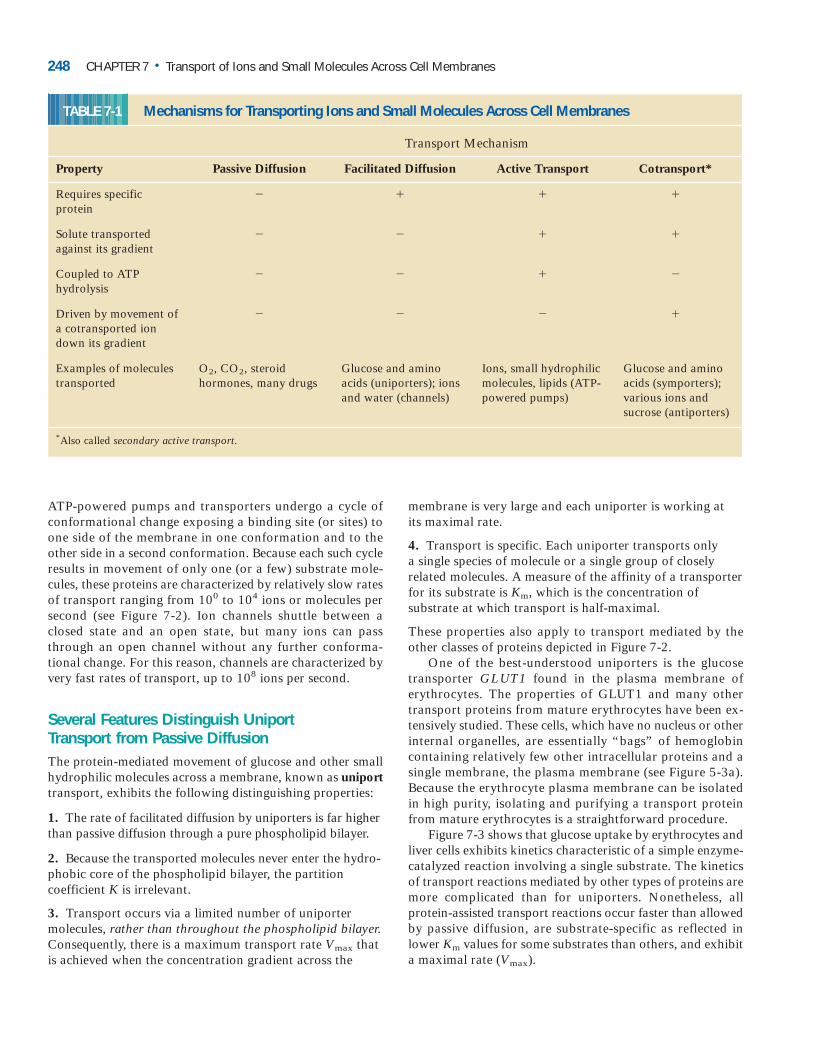
TABLE 7-1 Mechanisms for Transporting Ions and Small Molecules Across Cell Membranes
Transport Mechanism
Property Passive Diffusion Facilitated Diffusion Active Transport Cotransport*
Requires specific � � � �protein
Solute transported � � � �against its gradient
Coupled to ATP � � � �hydrolysis
Driven by movement of � � � �a cotransported ion down its gradient
Examples of molecules O2, CO2, steroid Glucose and amino Ions, small hydrophilic Glucose and aminotransported hormones, many drugs acids (uniporters); ions molecules, lipids (ATP- acids (symporters);
and water (channels) powered pumps) various ions andsucrose (antiporters)
*Also called secondary active transport.
GLUT1 Uniporter Transports Glucose into Most Mammalian CellsMost mammalian cells use blood glucose as the major sourceof cellular energy and express GLUT1. Since the glucose con-centration usually is higher in the extracellular medium(blood in the case of erythrocytes) than in the cell, GLUT1generally catalyzes the net import of glucose from the extra-cellular medium into the cell. Under this condition, Vmax isachieved at high external glucose concentrations.
Like other uniporters, GLUT1 alternates between twoconformational states: in one, a glucose-binding site faces theoutside of the membrane; in the other, a glucose-binding sitefaces the inside. Figure 7-4 depicts the sequence of events oc-curring during the unidirectional transport of glucose fromthe cell exterior inward to the cytosol. GLUT1 also can cat-alyze the net export of glucose from the cytosol to the extra-
cellular medium exterior when the glucose concentration ishigher inside the cell than outside.
The kinetics of the unidirectional transport of glucose from the outside of a cell inward via GLUT1 can be de-scribed by the same type of equation used to describe a simple enzyme-catalyzed chemical reaction. For simplicity, let’s assume that the substrate glucose, S, is present ini-tially only on the outside of the membrane. In this case, we can write:
Km Vmax
Sout � GLUT1 Sout � GLUT1 Sin � GLUT1
where Sout � GLUT1 represents GLUT1 in the outward-facing conformation with a bound glucose. By a similarderivation used to arrive at the Michaelis-Menten equation
7.1 • Overview of Membrane Transport 249
500
250
1 2 3 4 5 6 7 8 9 10 11 12 13 140
1/2Vmax
Vmax
Km
Passive diffusion
GLUT1 (erythrocytes)
GLUT2 (liver cells)
Init
ial r
ate
of
glu
cose
up
take
, V0
External concentration of glucose (mM)
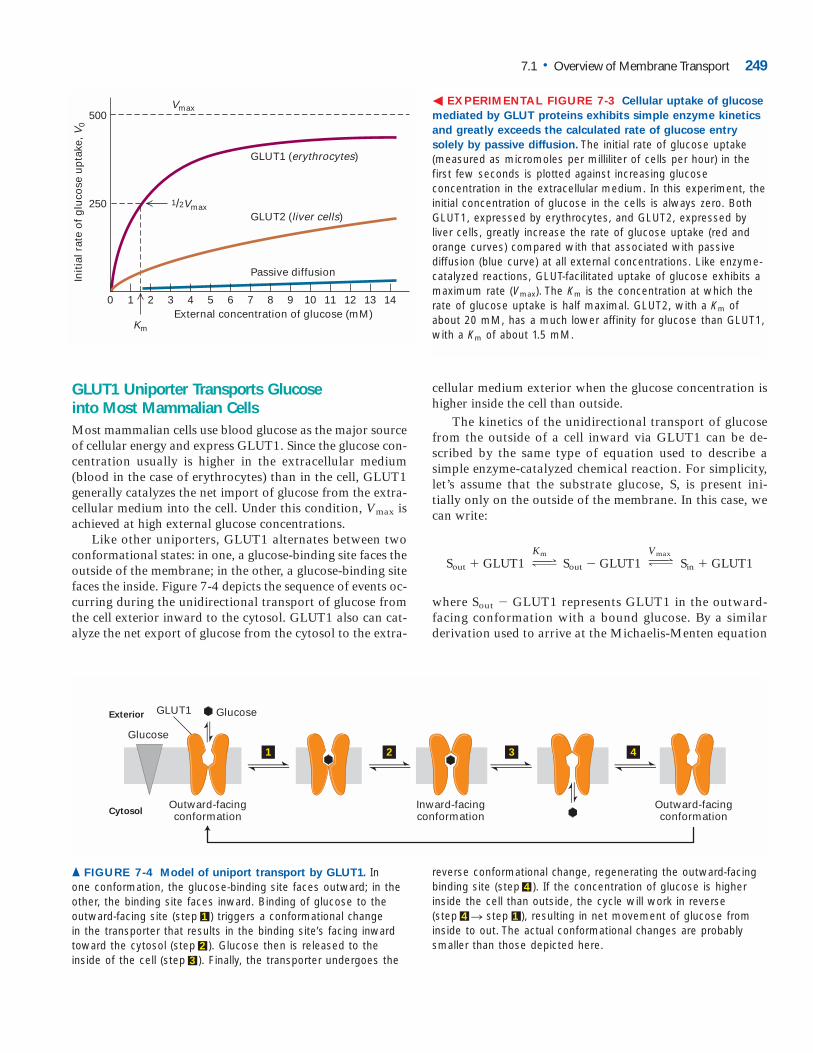
� EXPERIMENTAL FIGURE 7-3 Cellular uptake of glucose
mediated by GLUT proteins exhibits simple enzyme kinetics
and greatly exceeds the calculated rate of glucose entry
solely by passive diffusion. The initial rate of glucose uptake(measured as micromoles per milliliter of cells per hour) in thefirst few seconds is plotted against increasing glucose concentration in the extracellular medium. In this experiment, theinitial concentration of glucose in the cells is always zero. BothGLUT1, expressed by erythrocytes, and GLUT2, expressed byliver cells, greatly increase the rate of glucose uptake (red and orange curves) compared with that associated with passive diffusion (blue curve) at all external concentrations. Like enzyme-catalyzed reactions, GLUT-facilitated uptake of glucose exhibits amaximum rate (Vmax). The Km is the concentration at which therate of glucose uptake is half maximal. GLUT2, with a Km ofabout 20 mM, has a much lower affinity for glucose than GLUT1,with a Km of about 1.5 mM.
Outward-facingconformation
Inward-facingconformation
Glucose
Exterior
Cytosol
GlucoseGLUT1
Outward-facingconformation
4321
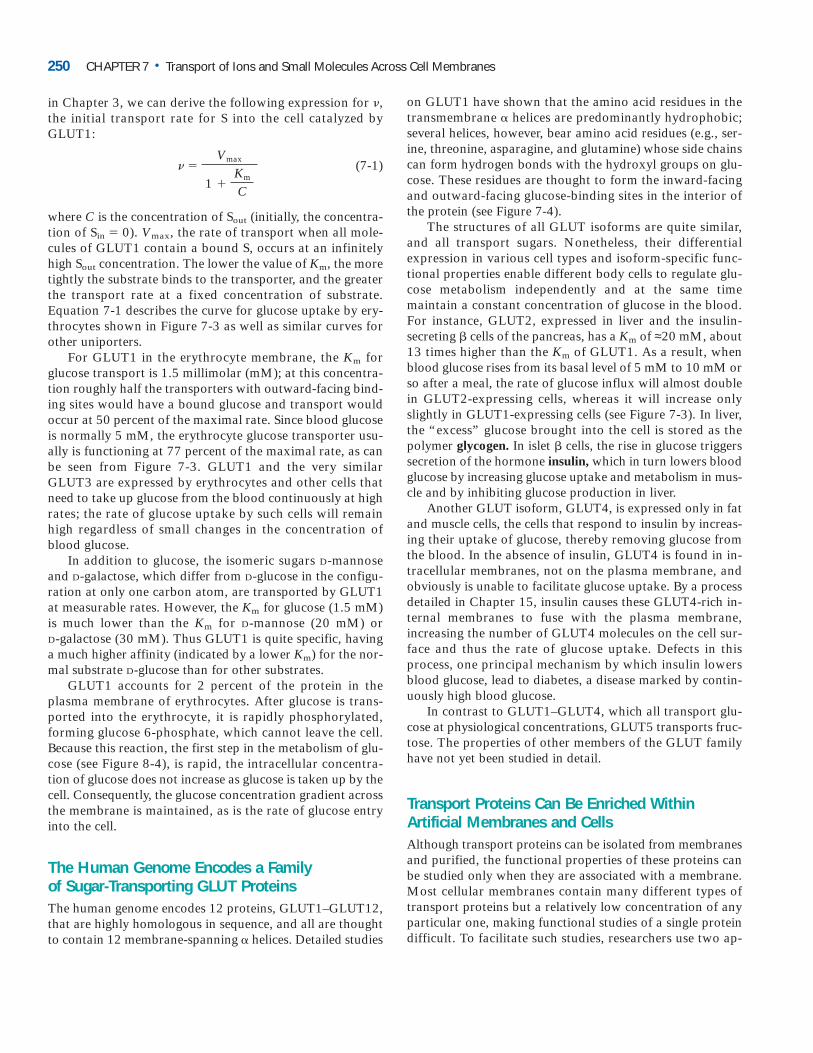
▲ FIGURE 7-4 Model of uniport transport by GLUT1. In one conformation, the glucose-binding site faces outward; in theother, the binding site faces inward. Binding of glucose to theoutward-facing site (step 1 ) triggers a conformational change in the transporter that results in the binding site’s facing inwardtoward the cytosol (step 2 ). Glucose then is released to the inside of the cell (step 3 ). Finally, the transporter undergoes the
reverse conformational change, regenerating the outward-facingbinding site (step 4 ). If the concentration of glucose is higher inside the cell than outside, the cycle will work in reverse (step 4 n step 1 ), resulting in net movement of glucose from inside to out. The actual conformational changes are probablysmaller than those depicted here.
in Chapter 3, we can derive the following expression for �,the initial transport rate for S into the cell catalyzed byGLUT1:
(7-1)
where C is the concentration of Sout (initially, the concentra-tion of Sin � 0). Vmax, the rate of transport when all mole-cules of GLUT1 contain a bound S, occurs at an infinitelyhigh Sout concentration. The lower the value of Km, the moretightly the substrate binds to the transporter, and the greaterthe transport rate at a fixed concentration of substrate.Equation 7-1 describes the curve for glucose uptake by ery-throcytes shown in Figure 7-3 as well as similar curves forother uniporters.
For GLUT1 in the erythrocyte membrane, the Km for glucose transport is 1.5 millimolar (mM); at this concentra-tion roughly half the transporters with outward-facing bind-ing sites would have a bound glucose and transport would occur at 50 percent of the maximal rate. Since blood glucose is normally 5 mM, the erythrocyte glucose transporter usu-ally is functioning at 77 percent of the maximal rate, as can be seen from Figure 7-3. GLUT1 and the very similar GLUT3 are expressed by erythrocytes and other cells that need to take up glucose from the blood continuously at high rates; the rate of glucose uptake by such cells will remain high regardless of small changes in the concentration of blood glucose.
In addition to glucose, the isomeric sugars D-mannoseand D-galactose, which differ from D-glucose in the configu-ration at only one carbon atom, are transported by GLUT1at measurable rates. However, the Km for glucose (1.5 mM)is much lower than the Km for D-mannose (20 mM) or D-galactose (30 mM). Thus GLUT1 is quite specific, havinga much higher affinity (indicated by a lower Km) for the nor-mal substrate D-glucose than for other substrates.
GLUT1 accounts for 2 percent of the protein in theplasma membrane of erythrocytes. After glucose is trans-ported into the erythrocyte, it is rapidly phosphorylated,forming glucose 6-phosphate, which cannot leave the cell.Because this reaction, the first step in the metabolism of glu-cose (see Figure 8-4), is rapid, the intracellular concentra-tion of glucose does not increase as glucose is taken up by thecell. Consequently, the glucose concentration gradient acrossthe membrane is maintained, as is the rate of glucose entryinto the cell.
The Human Genome Encodes a Family of Sugar-Transporting GLUT ProteinsThe human genome encodes 12 proteins, GLUT1–GLUT12,that are highly homologous in sequence, and all are thoughtto contain 12 membrane-spanning � helices. Detailed studies
� �Vmax
1 �Km
C
on GLUT1 have shown that the amino acid residues in thetransmembrane � helices are predominantly hydrophobic;several helices, however, bear amino acid residues (e.g., ser-ine, threonine, asparagine, and glutamine) whose side chainscan form hydrogen bonds with the hydroxyl groups on glu-cose. These residues are thought to form the inward-facingand outward-facing glucose-binding sites in the interior ofthe protein (see Figure 7-4).
The structures of all GLUT isoforms are quite similar,and all transport sugars. Nonetheless, their differential expression in various cell types and isoform-specific func-tional properties enable different body cells to regulate glu-cose metabolism independently and at the same timemaintain a constant concentration of glucose in the blood.For instance, GLUT2, expressed in liver and the insulin-secreting � cells of the pancreas, has a Km of ≈20 mM, about13 times higher than the Km of GLUT1. As a result, whenblood glucose rises from its basal level of 5 mM to 10 mM orso after a meal, the rate of glucose influx will almost doublein GLUT2-expressing cells, whereas it will increase onlyslightly in GLUT1-expressing cells (see Figure 7-3). In liver,the “excess” glucose brought into the cell is stored as thepolymer glycogen. In islet � cells, the rise in glucose triggerssecretion of the hormone insulin, which in turn lowers bloodglucose by increasing glucose uptake and metabolism in mus-cle and by inhibiting glucose production in liver.
Another GLUT isoform, GLUT4, is expressed only in fatand muscle cells, the cells that respond to insulin by increas-ing their uptake of glucose, thereby removing glucose fromthe blood. In the absence of insulin, GLUT4 is found in in-tracellular membranes, not on the plasma membrane, andobviously is unable to facilitate glucose uptake. By a processdetailed in Chapter 15, insulin causes these GLUT4-rich in-ternal membranes to fuse with the plasma membrane, increasing the number of GLUT4 molecules on the cell sur-face and thus the rate of glucose uptake. Defects in thisprocess, one principal mechanism by which insulin lowersblood glucose, lead to diabetes, a disease marked by contin-uously high blood glucose.
In contrast to GLUT1–GLUT4, which all transport glu-cose at physiological concentrations, GLUT5 transports fruc-tose. The properties of other members of the GLUT familyhave not yet been studied in detail.
Transport Proteins Can Be Enriched WithinArtificial Membranes and CellsAlthough transport proteins can be isolated from membranesand purified, the functional properties of these proteins canbe studied only when they are associated with a membrane.Most cellular membranes contain many different types oftransport proteins but a relatively low concentration of anyparticular one, making functional studies of a single proteindifficult. To facilitate such studies, researchers use two ap-
250 CHAPTER 7 • Transport of Ions and Small Molecules Across Cell Membranes
proaches for enriching a transport protein of interest so thatit predominates in the membrane.
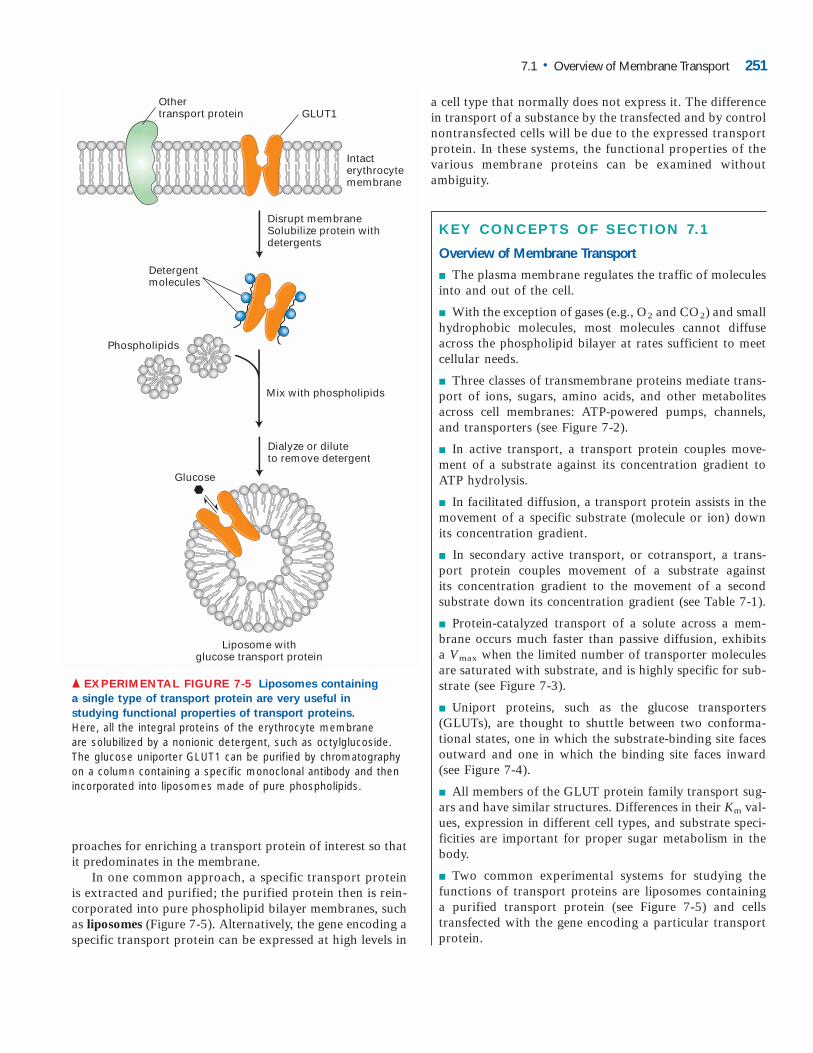
In one common approach, a specific transport protein is extracted and purified; the purified protein then is rein-corporated into pure phospholipid bilayer membranes, such as liposomes (Figure 7-5). Alternatively, the gene encoding a specific transport protein can be expressed at high levels in
a cell type that normally does not express it. The difference in transport of a substance by the transfected and by control nontransfected cells will be due to the expressed transport protein. In these systems, the functional properties of the various membrane proteins can be examined without ambiguity.
KEY CONCEPTS OF SECTION 7.1
Overview of Membrane Transport
■ The plasma membrane regulates the traffic of moleculesinto and out of the cell.
■ With the exception of gases (e.g., O2 and CO2) and smallhydrophobic molecules, most molecules cannot diffuseacross the phospholipid bilayer at rates sufficient to meetcellular needs.
■ Three classes of transmembrane proteins mediate trans-port of ions, sugars, amino acids, and other metabolitesacross cell membranes: ATP-powered pumps, channels,and transporters (see Figure 7-2).
■ In active transport, a transport protein couples move-ment of a substrate against its concentration gradient toATP hydrolysis.
■ In facilitated diffusion, a transport protein assists in themovement of a specific substrate (molecule or ion) downits concentration gradient.
■ In secondary active transport, or cotransport, a trans-port protein couples movement of a substrate against its concentration gradient to the movement of a secondsubstrate down its concentration gradient (see Table 7-1).
■ Protein-catalyzed transport of a solute across a mem-brane occurs much faster than passive diffusion, exhibitsa Vmax when the limited number of transporter moleculesare saturated with substrate, and is highly specific for sub-strate (see Figure 7-3).
■ Uniport proteins, such as the glucose transporters(GLUTs), are thought to shuttle between two conforma-tional states, one in which the substrate-binding site facesoutward and one in which the binding site faces inward(see Figure 7-4).
■ All members of the GLUT protein family transport sug-ars and have similar structures. Differences in their Km val-ues, expression in different cell types, and substrate speci-ficities are important for proper sugar metabolism in thebody.
■ Two common experimental systems for studying thefunctions of transport proteins are liposomes containinga purified transport protein (see Figure 7-5) and cellstransfected with the gene encoding a particular transportprotein.
7.1 • Overview of Membrane Transport 251
Intacterythrocytemembrane
Detergentmolecules
Dialyze or diluteto remove detergent
Othertransport protein GLUT1
Disrupt membraneSolubilize protein withdetergents
Phospholipids
Mix with phospholipids
Glucose
Liposome withglucose transport protein
▲ EXPERIMENTAL FIGURE 7-5 Liposomes containing
a single type of transport protein are very useful in
studying functional properties of transport proteins.
Here, all the integral proteins of the erythrocyte membrane are solubilized by a nonionic detergent, such as octylglucoside. The glucose uniporter GLUT1 can be purified by chromatographyon a column containing a specific monoclonal antibody and thenincorporated into liposomes made of pure phospholipids.
ATP-Powered Pumps and the Intracellular Ionic EnvironmentWe turn now to the ATP-powered pumps, which trans-port ions and various small molecules against their con-centration gradients. All ATP-powered pumps are transmembrane proteins with one or more binding sites for ATP located on the cytosolic face of the membrane. Although these proteins commonly are called ATPases, they normally do not hydrolyze ATP into ADP and Pi un-less ions or other molecules are simultaneously trans-ported. Because of this tight coupling between ATP hydrolysis and transport, the energy stored in the phos-phoanhydride bond is not dissipated but rather used to move ions or other molecules uphill against an electro-chemical gradient.
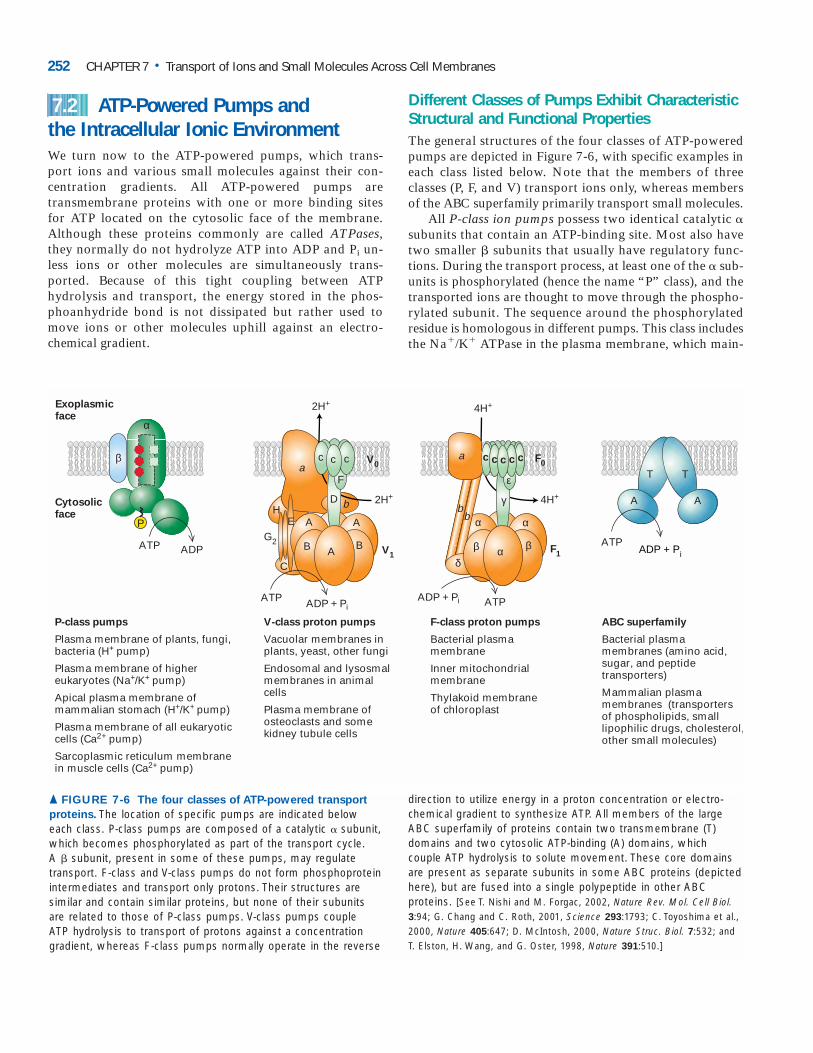
7.2 Different Classes of Pumps Exhibit CharacteristicStructural and Functional PropertiesThe general structures of the four classes of ATP-poweredpumps are depicted in Figure 7-6, with specific examples ineach class listed below. Note that the members of threeclasses (P, F, and V) transport ions only, whereas membersof the ABC superfamily primarily transport small molecules.
All P-class ion pumps possess two identical catalytic �subunits that contain an ATP-binding site. Most also havetwo smaller � subunits that usually have regulatory func-tions. During the transport process, at least one of the � sub-units is phosphorylated (hence the name “P” class), and thetransported ions are thought to move through the phospho-rylated subunit. The sequence around the phosphorylatedresidue is homologous in different pumps. This class includesthe Na�/K� ATPase in the plasma membrane, which main-
252 CHAPTER 7 • Transport of Ions and Small Molecules Across Cell Membranes
ADP + PiADPATP
β
α
Cytosolicface
P-class pumps
Plasma membrane of plants, fungi, bacteria (H+ pump)
Plasma membrane of higher eukaryotes (Na+/K+ pump)
Apical plasma membrane of mammalian stomach (H+/K+ pump)
Plasma membrane of all eukaryotic cells (Ca2+ pump)
Sarcoplasmic reticulum membrane in muscle cells (Ca2+ pump)
F-class proton pumps
Bacterial plasma membrane
Inner mitochondrial membrane
Thylakoid membrane of chloroplast
V-class proton pumps
Vacuolar membranes in plants, yeast, other fungi
Endosomal and lysosmal membranes in animal cells
Plasma membrane of osteoclasts and some kidney tubule cells
ABC superfamily
Bacterial plasma membranes (amino acid, sugar, and peptide transporters)
Mammalian plasma membranes (transporters of phospholipids, small lipophilic drugs, cholesterol,other small molecules)
ATP ADP + Pi ATPADP + Pi
ATP
2H+
2H+
4H+
4H+
a
bHE
C
A A
B B
α α
αβ β
γ
ε
δ
a c c c c c
bD
A
Exoplasmicface
TT
AA
G2V
1
V0
F1
F0
F
c c c
bP
▲ FIGURE 7-6 The four classes of ATP-powered transport
proteins. The location of specific pumps are indicated beloweach class. P-class pumps are composed of a catalytic � subunit,which becomes phosphorylated as part of the transport cycle. A � subunit, present in some of these pumps, may regulatetransport. F-class and V-class pumps do not form phosphoproteinintermediates and transport only protons. Their structures aresimilar and contain similar proteins, but none of their subunitsare related to those of P-class pumps. V-class pumps couple ATP hydrolysis to transport of protons against a concentrationgradient, whereas F-class pumps normally operate in the reverse
direction to utilize energy in a proton concentration or electro-chemical gradient to synthesize ATP. All members of the largeABC superfamily of proteins contain two transmembrane (T) domains and two cytosolic ATP-binding (A) domains, which couple ATP hydrolysis to solute movement. These core domainsare present as separate subunits in some ABC proteins (depictedhere), but are fused into a single polypeptide in other ABC proteins. [See T. Nishi and M. Forgac, 2002, Nature Rev. Mol. Cell Biol.3:94; G. Chang and C. Roth, 2001, Science 293:1793; C. Toyoshima et al.,2000, Nature 405:647; D. McIntosh, 2000, Nature Struc. Biol. 7:532; and T. Elston, H. Wang, and G. Oster, 1998, Nature 391:510.]
tains the low cytosolic Na� and high cytosolic K� concen-trations typical of animal cells. Certain Ca2� ATPases pumpCa2� ions out of the cytosol into the external medium; oth-ers pump Ca2� from the cytosol into the endoplasmic retic-ulum or into the specialized ER called the sarcoplasmicreticulum, which is found in muscle cells. Another memberof the P class, found in acid-secreting cells of the mammalianstomach, transports protons (H� ions) out of and K� ionsinto the cell. The H� pump that generates and maintains themembrane electric potential in plant, fungal, and bacterialcells also belongs to this class.
The structures of F-class and V-class ion pumps are sim-ilar to one another but unrelated to and more complicatedthan P-class pumps. F- and V-class pumps contain severaldifferent transmembrane and cytosolic subunits. All knownV and F pumps transport only protons, in a process that doesnot involve a phosphoprotein intermediate. V-class pumpsgenerally function to maintain the low pH of plant vacuolesand of lysosomes and other acidic vesicles in animal cells bypumping protons from the cytosolic to the exoplasmic faceof the membrane against a proton electrochemical gradient.F-class pumps are found in bacterial plasma membranes andin mitochondria and chloroplasts. In contrast to V pumps,they generally function to power the synthesis of ATP fromADP and Pi by movement of protons from the exoplasmicto the cytosolic face of the membrane down the proton elec-trochemical gradient. Because of their importance in ATPsynthesis in chloroplasts and mitochondria, F-class protonpumps, commonly called ATP synthases, are treated sepa-rately in Chapter 8.
The final class of ATP-powered pumps contains moremembers and is more diverse than the other classes. Referredto as the ABC (ATP-binding cassette) superfamily, this classincludes several hundred different transport proteins foundin organisms ranging from bacteria to humans. Each ABCprotein is specific for a single substrate or group of relatedsubstrates, which may be ions, sugars, amino acids, phos-pholipids, peptides, polysaccharides, or even proteins. AllABC transport proteins share a structural organization con-sisting of four “core” domains: two transmembrane (T) domains, forming the passageway through which trans-ported molecules cross the membrane, and two cytosolicATP-binding (A) domains. In some ABC proteins, mostly inbacteria, the core domains are present in four separatepolypeptides; in others, the core domains are fused into oneor two multidomain polypeptides.
ATP-Powered Ion Pumps Generate and MaintainIonic Gradients Across Cellular MembranesThe specific ionic composition of the cytosol usually differsgreatly from that of the surrounding extracellular fluid. Invirtually all cells—including microbial, plant, and animalcells—the cytosolic pH is kept near 7.2 regardless of the ex-tracellular pH. Also, the cytosolic concentration of K� is
7.2 • ATP-Powered Pumps and the Intracellular lonic Environment 253
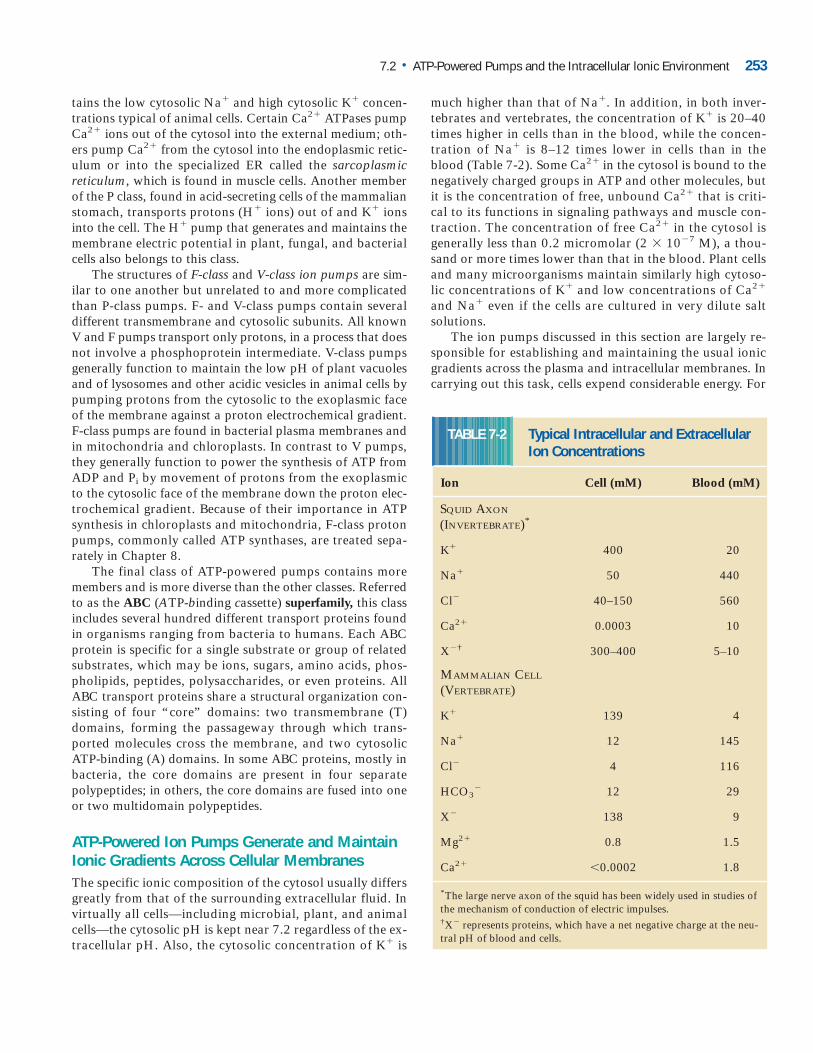
much higher than that of Na�. In addition, in both inver-tebrates and vertebrates, the concentration of K� is 20–40times higher in cells than in the blood, while the concen-tration of Na� is 8–12 times lower in cells than in theblood (Table 7-2). Some Ca2� in the cytosol is bound to thenegatively charged groups in ATP and other molecules, butit is the concentration of free, unbound Ca2� that is criti-cal to its functions in signaling pathways and muscle con-traction. The concentration of free Ca2� in the cytosol isgenerally less than 0.2 micromolar (2 � 10�7 M), a thou-sand or more times lower than that in the blood. Plant cellsand many microorganisms maintain similarly high cytoso-lic concentrations of K� and low concentrations of Ca2�
and Na� even if the cells are cultured in very dilute saltsolutions.
The ion pumps discussed in this section are largely re-sponsible for establishing and maintaining the usual ionicgradients across the plasma and intracellular membranes. Incarrying out this task, cells expend considerable energy. For
TABLE 7-2 Typical Intracellular and Extracellular Ion Concentrations
Ion Cell (mM) Blood (mM)
SQUID AXON
(INVERTEBRATE)*
K� 400 20
Na� 50 440
Cl� 40–150 560
Ca2� 0.0003 10
X�† 300–400 5–10
MAMMALIAN CELL
(VERTEBRATE)
K� 139 4
Na� 12 145
Cl� 4 116
HCO3� 12 29
X� 138 9
Mg2� 0.8 1.5
Ca2� 0.0002 1.8
*The large nerve axon of the squid has been widely used in studies ofthe mechanism of conduction of electric impulses.†X� represents proteins, which have a net negative charge at the neu-tral pH of blood and cells.
example, up to 25 percent of the ATP produced by nerve andkidney cells is used for ion transport, and human erythro-cytes consume up to 50 percent of their available ATP forthis purpose; in both cases, most of this ATP is used to powerthe Na�/K� pump.
In cells treated with poisons that inhibit the aerobic pro-duction of ATP (e.g., 2,4-dinitrophenol in aerobic cells), theion concentrations inside the cell gradually approach thoseof the exterior environment as ions move through channelsin the plasma membrane down their electrochemical gradi-ents. Eventually treated cells die: partly because protein syn-thesis requires a high concentration of K� ions and partlybecause in the absence of a Na� gradient across the cellmembrane, a cell cannot import certain nutrients such asamino acids. Studies on the effects of such poisons providedearly evidence for the existence of ion pumps.
Muscle Ca2� ATPase Pumps Ca2� Ions from the Cytosol into the Sarcoplasmic Reticulum
In skeletal muscle cells, Ca2� ions are concentrated andstored in the sarcoplasmic reticulum (SR); release of storedCa2� ions from the SR lumen into the cytosol causes con-
traction, as discussed in Chapter 19. A P-class Ca2� ATPaselocated in the SR membrane of skeletal muscle pumps Ca2�
from the cytosol into the lumen of the SR, thereby induc-ing muscle relaxation. Because this muscle calcium pumpconstitutes more than 80 percent of the integral protein inSR membranes, it is easily purified and has been studiedextensively.
In the cytosol of muscle cells, the free Ca2� concentrationranges from 10�7 M (resting cells) to more than 10�6 M(contracting cells), whereas the total Ca2� concentration inthe SR lumen can be as high as 10�2 M. However, two solu-ble proteins in the lumen of SR vesicles bind Ca2� and serveas a reservoir for intracellular Ca2�, thereby reducing theconcentration of free Ca2� ions in the SR vesicles and conse-quently the energy needed to pump Ca2� ions into them fromthe cytosol. The activity of the muscle Ca2� ATPase increasesas the free Ca2� concentration in the cytosol rises. Thus inskeletal muscle cells, the calcium pump in the SR membranecan supplement the activity of a similar Ca2� pump located inthe plasma membrane to assure that the cytosolic concentra-tion of free Ca2� in resting muscle remains below 1 M.
The current model for the mechanism of action of theCa2� ATPase in the SR membrane involves two conforma-tional states of the protein termed E1 and E2. Coupling of
254 CHAPTER 7 • Transport of Ions and Small Molecules Across Cell Membranes
Calcium andATP binding
Ca2+ bindingsites
Ca2+Phosphorylatedaspartate ATP
ATPbindingsite
SR lumenE1
Cytosol
Ca2+
ADP
E1
ATP
Phosphorylationof aspartate
Conformationalchange
E1
P
P
Dephosphorylation
Pi
E2 E2
Calciumrelease
E2
6Conformationalchange
3
1
5 4
2
P
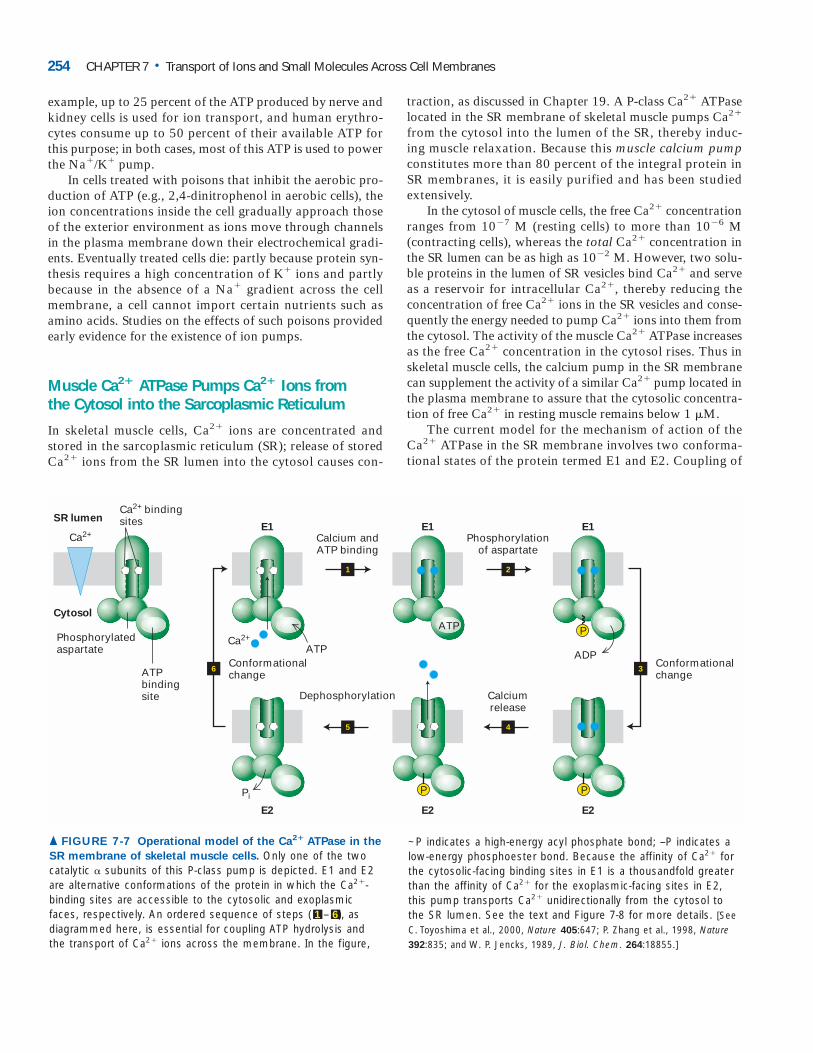
▲ FIGURE 7-7 Operational model of the Ca2� ATPase in the
SR membrane of skeletal muscle cells. Only one of the twocatalytic � subunits of this P-class pump is depicted. E1 and E2are alternative conformations of the protein in which the Ca2�-binding sites are accessible to the cytosolic and exoplasmicfaces, respectively. An ordered sequence of steps ( 1 – 6), as diagrammed here, is essential for coupling ATP hydrolysis andthe transport of Ca2� ions across the membrane. In the figure,
~P indicates a high-energy acyl phosphate bond; –P indicates alow-energy phosphoester bond. Because the affinity of Ca2� forthe cytosolic-facing binding sites in E1 is a thousandfold greaterthan the affinity of Ca2� for the exoplasmic-facing sites in E2,this pump transports Ca2� unidirectionally from the cytosol tothe SR lumen. See the text and Figure 7-8 for more details. [SeeC. Toyoshima et al., 2000, Nature 405:647; P. Zhang et al., 1998, Nature392:835; and W. P. Jencks, 1989, J. Biol. Chem. 264:18855.]
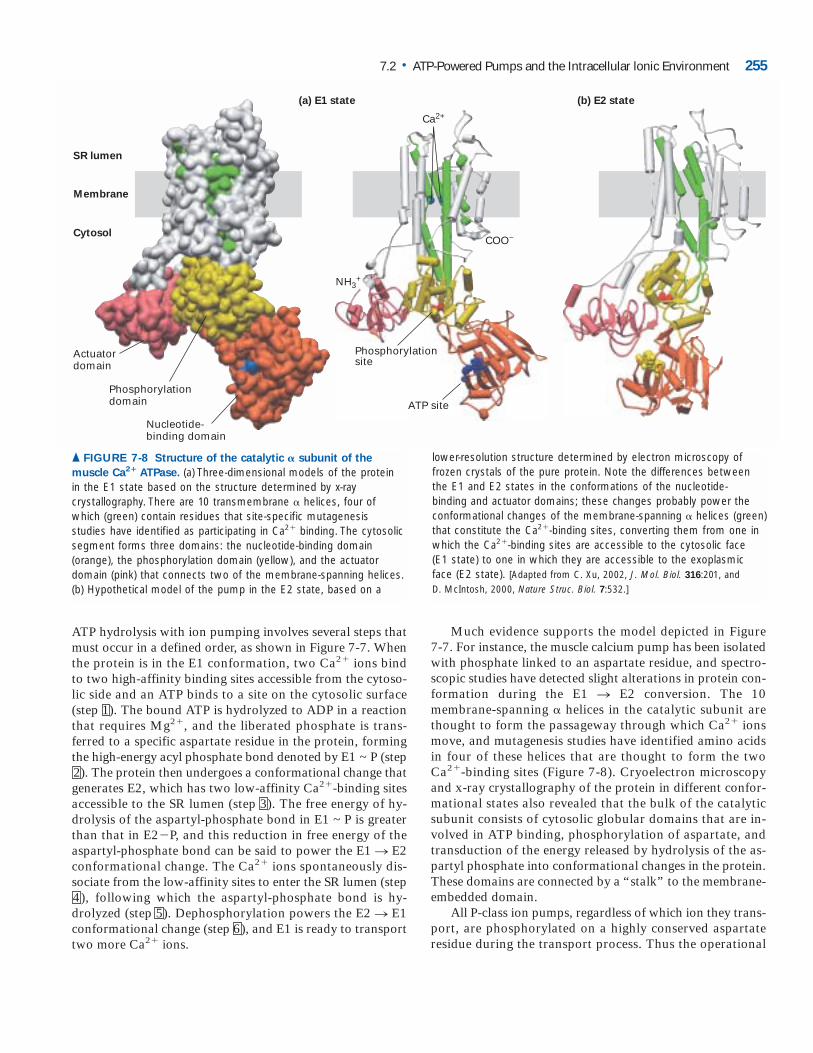
Much evidence supports the model depicted in Figure 7-7. For instance, the muscle calcium pump has been isolatedwith phosphate linked to an aspartate residue, and spectro-scopic studies have detected slight alterations in protein con-formation during the E1 n E2 conversion. The 10membrane-spanning � helices in the catalytic subunit arethought to form the passageway through which Ca2� ionsmove, and mutagenesis studies have identified amino acidsin four of these helices that are thought to form the twoCa2�-binding sites (Figure 7-8). Cryoelectron microscopyand x-ray crystallography of the protein in different confor-mational states also revealed that the bulk of the catalyticsubunit consists of cytosolic globular domains that are in-volved in ATP binding, phosphorylation of aspartate, andtransduction of the energy released by hydrolysis of the as-partyl phosphate into conformational changes in the protein.These domains are connected by a “stalk” to the membrane-embedded domain.
All P-class ion pumps, regardless of which ion they trans-port, are phosphorylated on a highly conserved aspartateresidue during the transport process. Thus the operational
7.2 • ATP-Powered Pumps and the Intracellular lonic Environment 255
Actuatordomain
Phosphorylationdomain
Nucleotide-binding domain
SR lumen
Membrane
Cytosol
(a) E1 state (b) E2 state
NH3+
COO−
Ca2+
Phosphorylationsite
ATP site
▲ FIGURE 7-8 Structure of the catalytic � subunit of the
muscle Ca2� ATPase. (a) Three-dimensional models of the protein in the E1 state based on the structure determined by x-ray crystallography. There are 10 transmembrane � helices, four ofwhich (green) contain residues that site-specific mutagenesis studies have identified as participating in Ca2� binding. The cytosolicsegment forms three domains: the nucleotide-binding domain (orange), the phosphorylation domain (yellow), and the actuator domain (pink) that connects two of the membrane-spanning helices.(b) Hypothetical model of the pump in the E2 state, based on a
lower-resolution structure determined by electron microscopy offrozen crystals of the pure protein. Note the differences betweenthe E1 and E2 states in the conformations of the nucleotide-binding and actuator domains; these changes probably power theconformational changes of the membrane-spanning � helices (green)that constitute the Ca2�-binding sites, converting them from one inwhich the Ca2�-binding sites are accessible to the cytosolic face (E1 state) to one in which they are accessible to the exoplasmicface (E2 state). [Adapted from C. Xu, 2002, J. Mol. Biol. 316:201, and D. McIntosh, 2000, Nature Struc. Biol. 7:532.]
ATP hydrolysis with ion pumping involves several steps thatmust occur in a defined order, as shown in Figure 7-7. Whenthe protein is in the E1 conformation, two Ca2� ions bindto two high-affinity binding sites accessible from the cytoso-lic side and an ATP binds to a site on the cytosolic surface(step 1). The bound ATP is hydrolyzed to ADP in a reactionthat requires Mg2�, and the liberated phosphate is trans-ferred to a specific aspartate residue in the protein, formingthe high-energy acyl phosphate bond denoted by E1 ~ P (step2). The protein then undergoes a conformational change thatgenerates E2, which has two low-affinity Ca2�-binding sitesaccessible to the SR lumen (step 3). The free energy of hy-drolysis of the aspartyl-phosphate bond in E1 ~ P is greaterthan that in E2�P, and this reduction in free energy of the aspartyl-phosphate bond can be said to power the E1 n E2conformational change. The Ca2� ions spontaneously dis-sociate from the low-affinity sites to enter the SR lumen (step4), following which the aspartyl-phosphate bond is hy-drolyzed (step 5). Dephosphorylation powers the E2 n E1conformational change (step 6), and E1 is ready to transporttwo more Ca2� ions.
model in Figure 7-7 is generally applicable to all these ATP-powered ion pumps. In addition, the catalytic � subunits ofall the P pumps examined to date have a similar molecularweight and, as deduced from their amino acid sequences de-rived from cDNA clones, have a similar arrangement oftransmembrane � helices (see Figure 7-8). These findingsstrongly suggest that all these proteins evolved from a com-mon precursor, although they now transport different ions.
Calmodulin-Mediated Activation of Plasma-Membrane Ca2� ATPase Leads to Rapid Ca2� ExportAs we explain in Chapter 13, small increases in the concen-tration of free Ca2� ions in the cytosol trigger a variety ofcellular responses. In order for Ca2� to function in intracel-lular signaling, the concentration of Ca2� ions free in the cy-tosol usually must be kept below 0.1 – 0.2 M. Animal,yeast, and probably plant cells express plasma-membraneCa2� ATPases that transport Ca2� out of the cell against itselectrochemical gradient. The catalytic � subunit of these P-class pumps is similar in structure and sequence to the � sub-unit of the muscle SR Ca2� pump.
The activity of plasma-membrane Ca2� ATPases is regu-lated by calmodulin, a cytosolic Ca2�-binding protein (seeFigure 3-28). A rise in cytosolic Ca2� induces the binding ofCa2� ions to calmodulin, which triggers allosteric activationof the Ca2� ATPase. As a result, the export of Ca2� ionsfrom the cell accelerates, quickly restoring the low concen-tration of free cytosolic Ca2� characteristic of the restingcell.
Na�/K� ATPase Maintains the Intracellular Na� and K� Concentrations in Animal CellsA second important P-class ion pump present in the plasmamembrane of all animal cells is the Na�/K� ATPase. Thision pump is a tetramer of subunit composition �2�2. (ClassicExperiment 7.1 describes the discovery of this enzyme.) Thesmall, glycosylated � polypeptide helps newly synthesized �subunits to fold properly in the endoplasmic reticulum butapparently is not involved directly in ion pumping. Theamino acid sequence and predicted secondary structure ofthe catalytic � subunit are very similar to those of the mus-cle SR Ca2� ATPase (see Figure 7-8). In particular, theNa�/K� ATPase has a stalk on the cytosolic face that links
256 CHAPTER 7 • Transport of Ions and Small Molecules Across Cell Membranes
E1
Pi
E1 E2
Na+
Cytosol
K+
Exterior
ATP
1
Na+ andATP binding
2 K+
3 Na+
2
Phosphorylationof aspartate
Na+ releaseK+ binding
ATP ADP
3
Conformational change
5
Dephosphorylationand conformational
changeK+ release
6
74
E1 E1 E2
P P
P
β
αE1
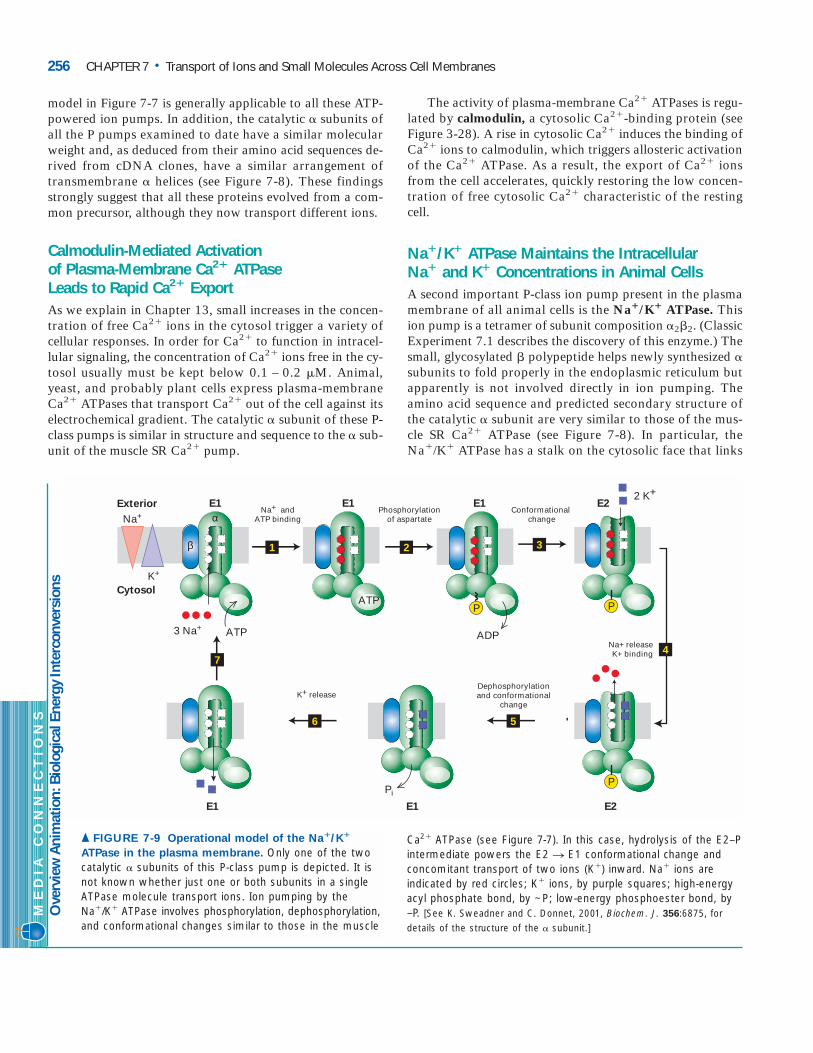
▲ FIGURE 7-9 Operational model of the Na�/K�
ATPase in the plasma membrane. Only one of the twocatalytic � subunits of this P-class pump is depicted. It isnot known whether just one or both subunits in a singleATPase molecule transport ions. Ion pumping by theNa�/K� ATPase involves phosphorylation, dephosphorylation,and conformational changes similar to those in the muscle
ME
DIA
C
ON
NE
CT
IO
NS
Ove
rvie
w A
nim
atio
n: B
iolo
gica
l Ene
rgy
Inte
rcon
vers
ions
Ca2� ATPase (see Figure 7-7). In this case, hydrolysis of the E2–Pintermediate powers the E2 n E1 conformational change andconcomitant transport of two ions (K�) inward. Na� ions areindicated by red circles; K� ions, by purple squares; high-energyacyl phosphate bond, by ~P; low-energy phosphoester bond, by–P. [See K. Sweadner and C. Donnet, 2001, Biochem. J. 356:6875, fordetails of the structure of the � subunit.]
domains containing the ATP-binding site and the phospho-rylated aspartate to the membrane-embedded domain. Theoverall transport process moves three Na� ions out of andtwo K� ions into the cell per ATP molecule hydrolyzed.
The mechanism of action of the Na�/K� ATPase, out-lined in Figure 7-9, is similar to that of the muscle calcium pump, except that ions are pumped in both directions across the membrane. In its E1 conformation, the Na�/K�
ATPase has three high-affinity Na�-binding sites and two low-affinity K�-binding sites accessible to the cytosolic sur-face of the protein. The Km for binding of Na� to these cy-tosolic sites is 0.6 mM, a value considerably lower than the intracellular Na� concentration of ≈12 mM; as a result, Na� ions normally will fully occupy these sites. Conversely, the affinity of the cytosolic K�-binding sites is low enough that K� ions, transported inward through the protein, dis-sociate from E1 into the cytosol despite the high intracel-lular K� concentration. During the E1 n E2 transition, the three bound Na� ions become accessible to the exoplasmic face, and simultaneously the affinity of the three Na�-binding sites becomes reduced. The three Na� ions, transported outward through the protein and now bound to the low-affinity Na� sites exposed to the exoplasmic face, dissociate one at a time into the extracellular mediumdespite the high extracellular Na� concentration. Transitionto the E2 conformation also generates two high-affinity K�
sites accessible to the exoplasmic face. Because the Km for K�
binding to these sites (0.2 mM) is lower than the extracellu-lar K� concentration (4 mM), these sites will fill with K�
ions. Similarly, during the E2 n E1 transition, the twobound K� ions are transported inward and then released intothe cytosol.
Certain drugs (e.g., ouabain and digoxin) bind to the ex-oplasmic domain of the plasma-membrane Na�/K� ATPaseand specifically inhibit its ATPase activity. The resulting dis-ruption in the Na�/K� balance of cells is strong evidence forthe critical role of this ion pump in maintaining the normalK� and Na� ion concentration gradients.
V-Class H� ATPases Pump Protons AcrossLysosomal and Vacuolar MembranesAll V-class ATPases transport only H� ions. These protonpumps, present in the membranes of lysosomes, endosomes,and plant vacuoles, function to acidify the lumen of these or-ganelles. The pH of the lysosomal lumen can be measuredprecisely in living cells by use of particles labeled with a pH-sensitive fluorescent dye. After these particles are phagocy-tosed by cells and transferred to lysosomes, the lysosomal pHcan be calculated from the spectrum of the fluorescence emit-ted. Maintenance of the 100-fold or more proton gradientbetween the lysosomal lumen (pH ≈4.5–5.0) and the cytosol(pH ≈7.0) depends on ATP production by the cell.
The ATP-powered proton pumps in lysosomal and vac-uolar membranes have been isolated, purified, and incor-
porated into liposomes. As illustrated in Figure 7-6 (cen-ter), these V-class proton pumps contain two discrete do-mains: a cytosolic hydrophilic domain (V1) and a transmembrane domain (V0) with multiple subunits in each domain. Binding and hydrolysis of ATP by the B sub-units in V1 provide the energy for pumping of H� ions through the proton-conducting channel formed by the c and a subunits in V0. Unlike P-class ion pumps, V-class proton pumps are not phosphorylated and dephosphory-lated during proton transport. The structurally similar F-class proton pumps, which we describe in the next chapter, normally operate in the “reverse” direction to generate ATP rather than pump protons and their mechanism of ac-tion is understood in great detail.
Pumping of relatively few protons is required to acidifyan intracellular vesicle. To understand why, recall that a so-lution of pH 4 has a H� ion concentration of 10�4 moles perliter, or 10�7 moles of H� ions per milliliter. Since there are6.02 � 1023 molecules per mole (Avogadro’s number), thena milliliter of a pH 4 solution contains 6.02 � 1016 H� ions.Thus at pH 4, a primary spherical lysosome with a volume of4.18 � 10�15 ml (diameter of 0.2 m) will contain just 252protons.
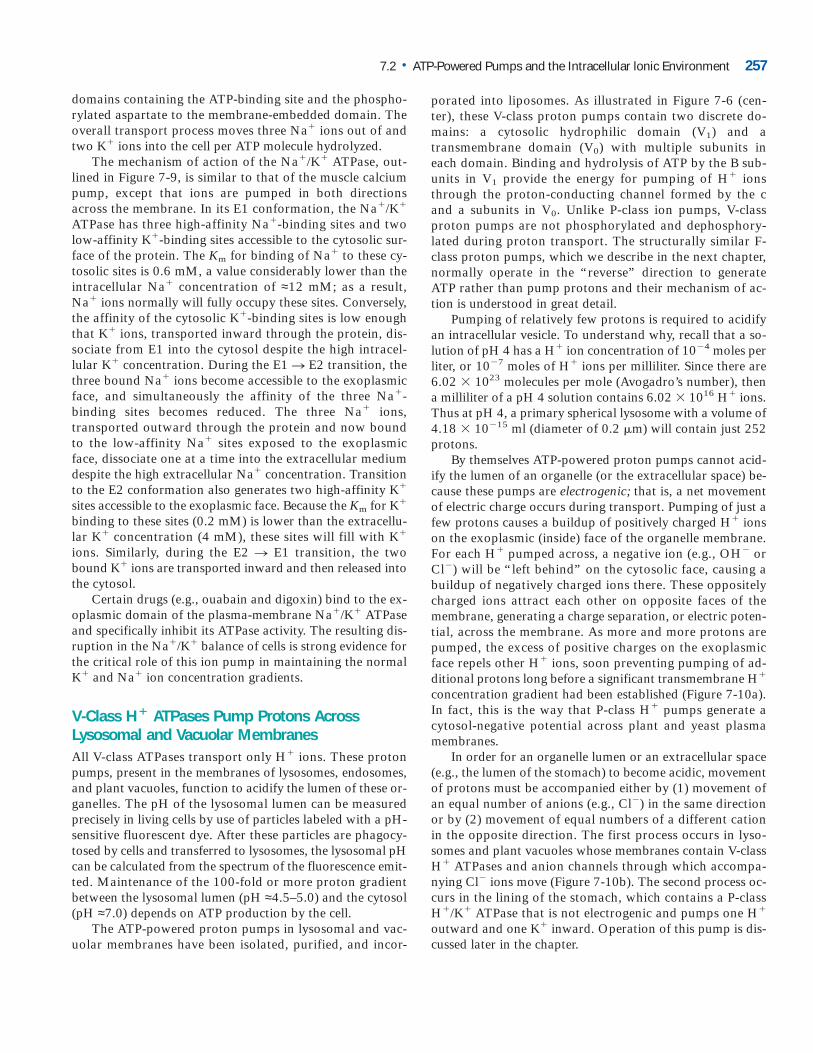
By themselves ATP-powered proton pumps cannot acid-ify the lumen of an organelle (or the extracellular space) be-cause these pumps are electrogenic; that is, a net movementof electric charge occurs during transport. Pumping of just afew protons causes a buildup of positively charged H� ionson the exoplasmic (inside) face of the organelle membrane.For each H� pumped across, a negative ion (e.g., OH� orCl�) will be “left behind” on the cytosolic face, causing abuildup of negatively charged ions there. These oppositelycharged ions attract each other on opposite faces of themembrane, generating a charge separation, or electric poten-tial, across the membrane. As more and more protons arepumped, the excess of positive charges on the exoplasmicface repels other H� ions, soon preventing pumping of ad-ditional protons long before a significant transmembrane H�
concentration gradient had been established (Figure 7-10a).In fact, this is the way that P-class H� pumps generate acytosol-negative potential across plant and yeast plasmamembranes.
In order for an organelle lumen or an extracellular space(e.g., the lumen of the stomach) to become acidic, movementof protons must be accompanied either by (1) movement ofan equal number of anions (e.g., Cl�) in the same directionor by (2) movement of equal numbers of a different cationin the opposite direction. The first process occurs in lyso-somes and plant vacuoles whose membranes contain V-classH� ATPases and anion channels through which accompa-nying Cl� ions move (Figure 7-10b). The second process oc-curs in the lining of the stomach, which contains a P-classH�/K� ATPase that is not electrogenic and pumps one H�
outward and one K� inward. Operation of this pump is dis-cussed later in the chapter.
7.2 • ATP-Powered Pumps and the Intracellular lonic Environment 257
Bacterial Permeases Are ABC Proteins That Import a Variety of Nutrients from the EnvironmentAs noted earlier, all members of the very large and diverseABC superfamily of transport proteins contain two trans-membrane (T) domains and two cytosolic ATP-binding (A)domains (see Figure 7-6). The T domains, each built of sixmembrane-spanning � helices, form the pathway throughwhich the transported substance (substrate) crosses the mem-brane and determine the substrate specificity of each ABCprotein. The sequences of the A domains are ≈30–40 percenthomologous in all members of this superfamily, indicating acommon evolutionary origin. Some ABC proteins also con-tain an additional exoplasmic substrate-binding subunit orregulatory subunit.
The plasma membrane of many bacteria contains nu-merous permeases that belong to the ABC superfamily. Theseproteins use the energy released by hydrolysis of ATP totransport specific amino acids, sugars, vitamins, or even pep-tides into the cell. Since bacteria frequently grow in soil orpond water where the concentration of nutrients is low, these
ABC transport proteins enable the cells to import nutrientsagainst substantial concentration gradients. Bacterial per-meases generally are inducible; that is, the quantity of atransport protein in the cell membrane is regulated by boththe concentration of the nutrient in the medium and themetabolic needs of the cell.
In E. coli histidine permease, a typical bacterial ABC pro-tein, the two transmembrane domains and two cytosolicATP-binding domains are formed by four separate subunits.In gram-negative bacteria such as E. coli, the outer mem-brane contains porins that render them highly permeable tomost small molecules (see Figure 5-14). A soluble histidine-binding protein is located in the periplasmic space betweenthe outer membrane and plasma membrane. This solubleprotein binds histidine tightly and directs it to the T subunitsof the permease, through which histidine crosses the plasmamembrane powered by ATP hydrolysis. Mutant E. coli cellsthat are defective in any of the histidine permease subunits orthe soluble binding protein are unable to transport histidineinto the cell, but are able to transport other amino acidswhose uptake is facilitated by other transport proteins. Suchgenetic analyses provide strong evidence that histidine per-mease and similar ABC proteins function to transport vari-ous solutes into bacterial cells.
About 50 ABC Small-Molecule Pumps Are Known in MammalsDiscovery of the first eukaryotic ABC protein to be recog-nized came from studies on tumor cells and cultured cells thatexhibited resistance to several drugs with unrelated chemicalstructures. Such cells eventually were shown to express ele-vated levels of a multidrug-resistance (MDR) transport pro-tein known as MDR1. This protein uses the energy derivedfrom ATP hydrolysis to export a large variety of drugs fromthe cytosol to the extracellular medium. The Mdr1 gene isfrequently amplified in multidrug-resistant cells, resulting in alarge overproduction of the MDR1 protein.
Most drugs transported by MDR1 are small hydrophobicmolecules that diffuse from the medium across the plasmamembrane, unaided by transport proteins, into the cell cy-tosol, where they block various cellular functions. Two such drugs are colchicine and vinblastine, which block as-sembly of microtubules. ATP-powered export of such drugsby MDR1 reduces their concentration in the cytosol. As a re-sult, a much higher extracellular drug concentration is re-quired to kill cells that express MDR1 than those that donot. That MDR1 is an ATP-powered small-molecule pumphas been demonstrated with liposomes containing the puri-fied protein (see Figure 7-5). The ATPase activity of these liposomes is enhanced by different drugs in a dose-dependentmanner corresponding to their ability to be transported byMDR1.
About 50 different mammalian ABC transport proteinsare now recognized (see Table 18-2). These are expressed in
258 CHAPTER 7 • Transport of Ions and Small Molecules Across Cell Membranes
Neutral pH
Cytosol
++ + _
_ __
ATP ADP + Pi
Acidic pH
ATP ADP + Pi
H+
H+
H+
H+
Cl−
Cl−Cl−
Cl−
Cl−H+
H+
No electricpotential
+_
(a)
(b)
Lumen
Cl−H+
+
Electricpotential
+ −
▲ FIGURE 7-10 Effect of proton pumping by V-class ion
pumps on H� concentration gradients and electric potential
gradients across cellular membranes. (a) If an intracellular organelle contains only V-class pumps, proton pumping generates an electric potential across the membrane, luminal-sidepositive, but no significant change in the intraluminal pH. (b) If theorganelle membrane also contains Cl� channels, anions passively follow the pumped protons, resulting in an accumulationof H� ions (low luminal pH) but no electric potential across themembrane.
abundance in the liver, intestines, and kidney—sites where natural toxic and waste products are removed from the body. Substrates for these ABC proteins include sugars, amino acids, cholesterol, peptides, proteins, toxins, and xenobiotics. Thus the normal function of MDR1 most likely is to transport various natural and metabolic toxins into the bile, intestinal lumen, or forming urine. During the course of its evolution, MDR1 appears to have acquired the ability to transport drugs whose structures are similar to those of these endogenous toxins. Tumors derived from MDR-expressing cell types, such as hepatomas (liver can-cers), frequently are resistant to virtually all chemothera-peutic agents and thus difficult to treat, presumably be-cause the tumors exhibit increased expression of the MDR1or the related MDR2.
Several human genetic diseases are associated withdefective ABC proteins. X-linked adrenoleukodys-trophy (ALD), for instance, is characterized by a
defective ABC transport protein (ABCD1) that is localized toperoxisomal membranes. This protein normally regulatesimport of very long chain fatty acids into peroxisomes,where they undergo oxidation; in its absence these fatty acids accumulate in the cytosol and cause cellular damage.Tangiers disease is marked by a deficiency of the plasma-membrane ABC protein (ABCA1) that transports phospho-lipids and possibly cholesterol (Chapter 18).
A final example is cystic fibrosis (CF), which is causedby a mutation in the gene encoding the cystic fibrosistransmembrane regulator (CFTR). This Cl� transport pro-tein is expressed in the apical plasma membranes of ep-ithelial cells in the lung, sweat glands, pancreas, and othertissues. For instance, CFTR protein is important for re-sorption of Cl� into cells of sweat glands, and babies withcystic fibrosis, if licked, often taste “salty.” An increase incyclic AMP (cAMP), a small intracellular signaling mole-cule, causes phosphorylation of CFTR and stimulates Cl�
transport by such cells from normal individuals, but notfrom CF individuals who have a defective CFTR protein.(The role of cAMP in numerous signaling pathways is cov-ered in Chapter 13.) The sequence and predicted structureof the CFTR protein, based on analysis of the cloned gene,are very similar to those of MDR1 protein except for thepresence of an additional domain, the regulatory (R) do-main, on the cytosolic face. Moreover, the Cl�-transportactivity of CFTR protein is enhanced by the binding ofATP. Given its similarity to other ABC proteins, CFTRmay also function as an ATP-powered pump of some stillunidentified molecule. ❚
ABC Proteins That Transport Lipid-SolubleSubstrates May Operate by a Flippase MechanismThe substrates of mammalian MDR1 are primarily planar,lipid-soluble molecules with one or more positive charges;
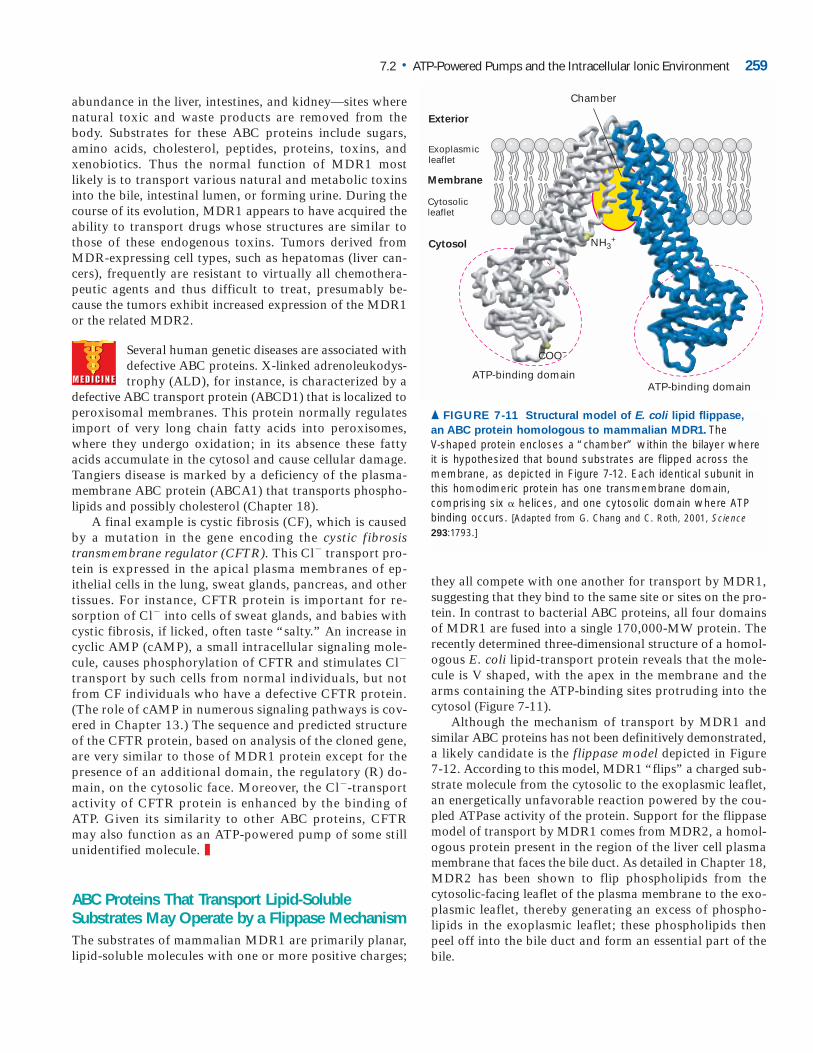
they all compete with one another for transport by MDR1,suggesting that they bind to the same site or sites on the pro-tein. In contrast to bacterial ABC proteins, all four domainsof MDR1 are fused into a single 170,000-MW protein. Therecently determined three-dimensional structure of a homol-ogous E. coli lipid-transport protein reveals that the mole-cule is V shaped, with the apex in the membrane and thearms containing the ATP-binding sites protruding into thecytosol (Figure 7-11).
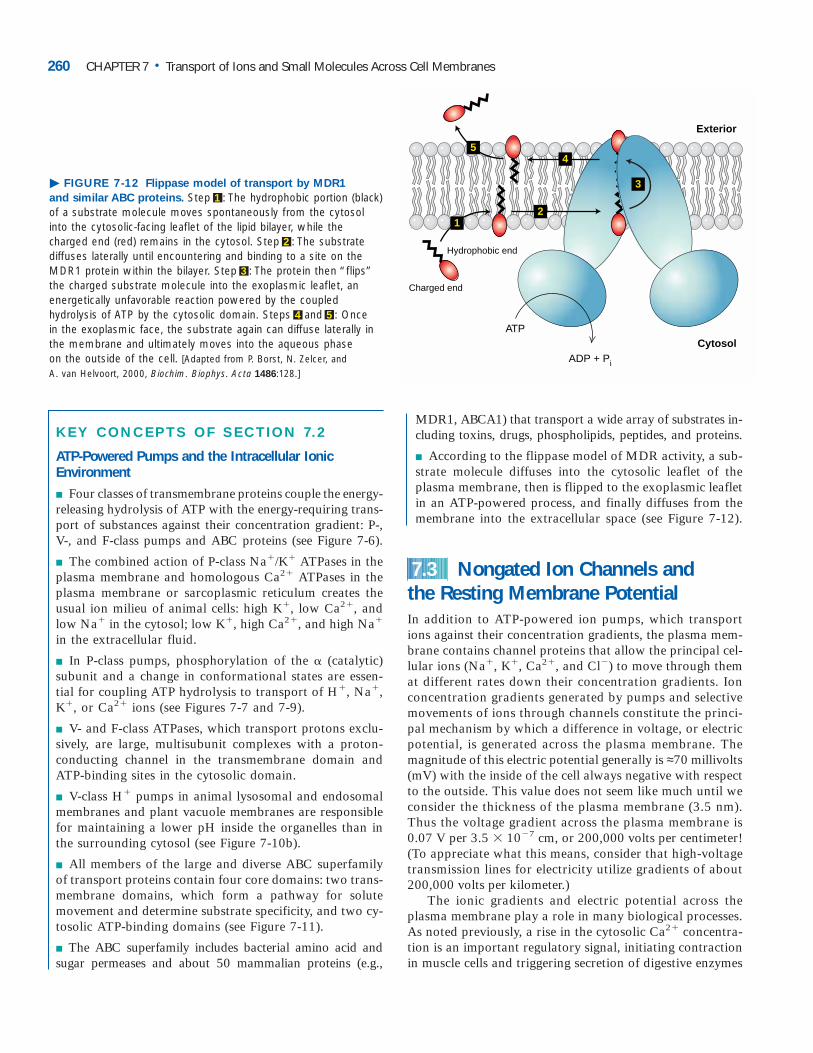
Although the mechanism of transport by MDR1 andsimilar ABC proteins has not been definitively demonstrated,a likely candidate is the flippase model depicted in Figure 7-12. According to this model, MDR1 “flips” a charged sub-strate molecule from the cytosolic to the exoplasmic leaflet,an energetically unfavorable reaction powered by the cou-pled ATPase activity of the protein. Support for the flippasemodel of transport by MDR1 comes from MDR2, a homol-ogous protein present in the region of the liver cell plasmamembrane that faces the bile duct. As detailed in Chapter 18,MDR2 has been shown to flip phospholipids from the cytosolic-facing leaflet of the plasma membrane to the exo-plasmic leaflet, thereby generating an excess of phospho-lipids in the exoplasmic leaflet; these phospholipids then peel off into the bile duct and form an essential part of thebile.
7.2 • ATP-Powered Pumps and the Intracellular lonic Environment 259
NH3+
Exterior
Membrane
Cytosol
Chamber
ATP-binding domainATP-binding domain
Exoplasmicleaflet
Cytosolicleaflet
COO−
▲ FIGURE 7-11 Structural model of E. coli lipid flippase,
an ABC protein homologous to mammalian MDR1. The V-shaped protein encloses a “chamber” within the bilayer whereit is hypothesized that bound substrates are flipped across themembrane, as depicted in Figure 7-12. Each identical subunit inthis homodimeric protein has one transmembrane domain, comprising six � helices, and one cytosolic domain where ATPbinding occurs. [Adapted from G. Chang and C. Roth, 2001, Science293:1793.]
KEY CONCEPTS OF SECTION 7.2
ATP-Powered Pumps and the Intracellular IonicEnvironment
■ Four classes of transmembrane proteins couple the energy-releasing hydrolysis of ATP with the energy-requiring trans-port of substances against their concentration gradient: P-,V-, and F-class pumps and ABC proteins (see Figure 7-6).
■ The combined action of P-class Na�/K� ATPases in theplasma membrane and homologous Ca2� ATPases in theplasma membrane or sarcoplasmic reticulum creates theusual ion milieu of animal cells: high K�, low Ca2�, andlow Na� in the cytosol; low K�, high Ca2�, and high Na�
in the extracellular fluid.
■ In P-class pumps, phosphorylation of the � (catalytic)subunit and a change in conformational states are essen-tial for coupling ATP hydrolysis to transport of H�, Na�,K�, or Ca2� ions (see Figures 7-7 and 7-9).
■ V- and F-class ATPases, which transport protons exclu-sively, are large, multisubunit complexes with a proton-conducting channel in the transmembrane domain andATP-binding sites in the cytosolic domain.
■ V-class H� pumps in animal lysosomal and endosomalmembranes and plant vacuole membranes are responsiblefor maintaining a lower pH inside the organelles than inthe surrounding cytosol (see Figure 7-10b).
■ All members of the large and diverse ABC superfamilyof transport proteins contain four core domains: two trans-membrane domains, which form a pathway for solutemovement and determine substrate specificity, and two cy-tosolic ATP-binding domains (see Figure 7-11).
■ The ABC superfamily includes bacterial amino acid andsugar permeases and about 50 mammalian proteins (e.g.,
MDR1, ABCA1) that transport a wide array of substrates in-cluding toxins, drugs, phospholipids, peptides, and proteins.
■ According to the flippase model of MDR activity, a sub-strate molecule diffuses into the cytosolic leaflet of theplasma membrane, then is flipped to the exoplasmic leafletin an ATP-powered process, and finally diffuses from themembrane into the extracellular space (see Figure 7-12).
Nongated Ion Channels and the Resting Membrane PotentialIn addition to ATP-powered ion pumps, which transportions against their concentration gradients, the plasma mem-brane contains channel proteins that allow the principal cel-lular ions (Na�, K�, Ca2�, and Cl�) to move through themat different rates down their concentration gradients. Ionconcentration gradients generated by pumps and selectivemovements of ions through channels constitute the princi-pal mechanism by which a difference in voltage, or electricpotential, is generated across the plasma membrane. Themagnitude of this electric potential generally is ≈70 millivolts(mV) with the inside of the cell always negative with respectto the outside. This value does not seem like much until weconsider the thickness of the plasma membrane (3.5 nm).Thus the voltage gradient across the plasma membrane is0.07 V per 3.5 � 10�7 cm, or 200,000 volts per centimeter!(To appreciate what this means, consider that high-voltagetransmission lines for electricity utilize gradients of about200,000 volts per kilometer.)
The ionic gradients and electric potential across theplasma membrane play a role in many biological processes.As noted previously, a rise in the cytosolic Ca2� concentra-tion is an important regulatory signal, initiating contractionin muscle cells and triggering secretion of digestive enzymes
7.3
260 CHAPTER 7 • Transport of Ions and Small Molecules Across Cell Membranes
ATP
ADP + Pi
Hydrophobic end
Charged end
Cytosol
Exterior
54
2
3
1
� FIGURE 7-12 Flippase model of transport by MDR1
and similar ABC proteins. Step 1 : The hydrophobic portion (black)of a substrate molecule moves spontaneously from the cytosolinto the cytosolic-facing leaflet of the lipid bilayer, while thecharged end (red) remains in the cytosol. Step 2 : The substrate diffuses laterally until encountering and binding to a site on theMDR1 protein within the bilayer. Step 3 : The protein then “flips”the charged substrate molecule into the exoplasmic leaflet, an energetically unfavorable reaction powered by the coupled hydrolysis of ATP by the cytosolic domain. Steps 4 and 5 : Once in the exoplasmic face, the substrate again can diffuse laterally inthe membrane and ultimately moves into the aqueous phase on the outside of the cell. [Adapted from P. Borst, N. Zelcer, and A. van Helvoort, 2000, Biochim. Biophys. Acta 1486:128.]
in the exocrine pancreatic cells. In many animal cells, thecombined force of the Na� concentration gradient and mem-brane electric potential drives the uptake of amino acids andother molecules against their concentration gradient by ion-linked symport and antiport proteins (see Section 7.4). Andthe conduction of action potentials by nerve cells depends onthe opening and closing of ion channels in response tochanges in the membrane potential (see Section 7.7).
Here we discuss the origin of the membrane electric po-tential in resting cells, how ion channels mediate the selectivemovement of ions across a membrane, and useful experi-mental techniques for characterizing the functional proper-ties of channel proteins.
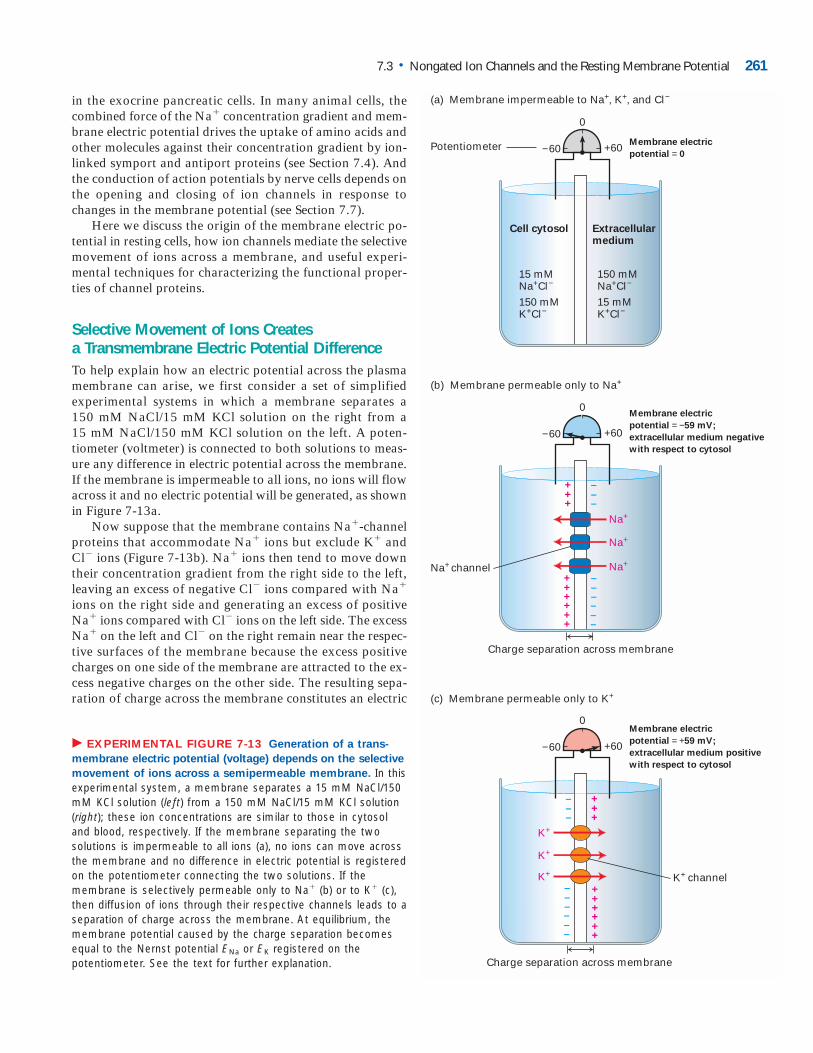
Selective Movement of Ions Creates a Transmembrane Electric Potential DifferenceTo help explain how an electric potential across the plasmamembrane can arise, we first consider a set of simplified experimental systems in which a membrane separates a 150 mM NaCl/15 mM KCl solution on the right from a 15 mM NaCl/150 mM KCl solution on the left. A poten-tiometer (voltmeter) is connected to both solutions to meas-ure any difference in electric potential across the membrane.If the membrane is impermeable to all ions, no ions will flowacross it and no electric potential will be generated, as shownin Figure 7-13a.
Now suppose that the membrane contains Na�-channelproteins that accommodate Na� ions but exclude K� andCl� ions (Figure 7-13b). Na� ions then tend to move downtheir concentration gradient from the right side to the left,leaving an excess of negative Cl� ions compared with Na�
ions on the right side and generating an excess of positiveNa� ions compared with Cl� ions on the left side. The excessNa� on the left and Cl� on the right remain near the respec-tive surfaces of the membrane because the excess positivecharges on one side of the membrane are attracted to the ex-cess negative charges on the other side. The resulting sepa-ration of charge across the membrane constitutes an electric
7.3 • Nongated Ion Channels and the Resting Membrane Potential 261
� EXPERIMENTAL FIGURE 7-13 Generation of a trans-
membrane electric potential (voltage) depends on the selective
movement of ions across a semipermeable membrane. In thisexperimental system, a membrane separates a 15 mM NaCl/150mM KCl solution (left) from a 150 mM NaCl/15 mM KCl solution(right); these ion concentrations are similar to those in cytosoland blood, respectively. If the membrane separating the two solutions is impermeable to all ions (a), no ions can move acrossthe membrane and no difference in electric potential is registeredon the potentiometer connecting the two solutions. If the membrane is selectively permeable only to Na� (b) or to K� (c),then diffusion of ions through their respective channels leads to aseparation of charge across the membrane. At equilibrium, themembrane potential caused by the charge separation becomesequal to the Nernst potential ENa or EK registered on the potentiometer. See the text for further explanation.
15 mMNa+Cl−
150 mMK+Cl−
150 mMNa+Cl−
15 mMK+Cl−
Cell cytosol Extracellularmedium
+ –+ –+ –
Na+
Na+
Na+Na+ channel
(b) Membrane permeable only to Na+
Membrane electric
potential = −59 mV;
extracellular medium negative
with respect to cytosol
K+ channel
K+
K+
K+
(c) Membrane permeable only to K+
Membrane electric
potential = +59 mV;
extracellular medium positive
with respect to cytosol
−60 +60
0
−60 +60
0
(a) Membrane impermeable to Na+, K+, and Cl−
−60 +60
0
Membrane electric
potential = 0Potentiometer
–––
–––
+++
+++
+++
+++
+++
–––
–––
–––
Charge separation across membrane
Charge separation across membrane
potential, or voltage, with the right side of the membranehaving excess negative charge with respect to the left.
As more and more Na� ions move through channelsacross the membrane, the magnitude of this charge difference(i.e., voltage) increases. However, continued right-to-leftmovement of the Na� ions eventually is inhibited by the mu-tual repulsion between the excess positive (Na�) charges ac-cumulated on the left side of the membrane and by theattraction of Na� ions to the excess negative charges built upon the right side. The system soon reaches an equilibriumpoint at which the two opposing factors that determine themovement of Na� ions—the membrane electric potentialand the ion concentration gradient—balance each other out.At equilibrium, no net movement of Na� ions occurs acrossthe membrane. Thus this semipermeable membrane, like allbiological membranes, acts like a capacitor—a device con-sisting of a thin sheet of nonconducting material (the hy-drophobic interior) surrounded on both sides by electricallyconducting material (the polar phospholipid head groupsand the ions in the surrounding aqueous solution)—that canstore positive charges on one side and negative charges onthe other.
If a membrane is permeable only to Na� ions, then atequilibrium the measured electric potential across the mem-brane equals the sodium equilibrium potential in volts, ENa.The magnitude of ENa is given by the Nernst equation, whichis derived from basic principles of physical chemistry:
(7-2)
where R (the gas constant) � 1.987 cal/(degree � mol), or8.28 joules/(degree � mol); T (the absolute temperature in de-grees Kelvin) � 293 K at 20 ºC; Z (the charge, also called thevalency) here equal to �1; F (the Faraday constant) 23,062cal/(mol � V), or 96,000 coulombs/(mol � V); and [Nal] and[Nar] are the Na� concentrations on the left and right sides,respectively, at equilibrium. At 20 ºC, Equation 7-2 reducesto
(7-3)
If [Nal]/[Nar] � 0.1, a tenfold ratio of concentrations as inFigure 7-13b, then ENa � �0.059 V (or �59 mV), with theright side negative with respect to the left.
If the membrane is permeable only to K� ions and not toNa� or Cl� ions, then a similar equation describes the potas-sium equilibrium potential EK:
(7-4)
The magnitude of the membrane electric potential is thesame (59 mV for a tenfold difference in ion concentrations),except that the right side is now positive with respect to theleft (Figure 7-13c), opposite to the polarity obtained acrossa membrane selectively permeable to Na� ions.
EK �RTZF
ln [Kl]
[Kr]
ENa � 0.059log10 [Nal]
[Nar]
ENa �RTZF
ln [Na1]
[Nar]
The Membrane Potential in Animal CellsDepends Largely on Resting K� ChannelsThe plasma membranes of animal cells contain many openK� channels but few open Na�, Cl�, or Ca2� channels. Asa result, the major ionic movement across the plasma mem-brane is that of K� from the inside outward, powered by theK� concentration gradient, leaving an excess of negativecharge on the inside and creating an excess of positive chargeon the outside, similar to the experimental system shown inFigure 7-13c. Thus the outward flow of K� ions throughthese channels, called resting K� channels, is the major de-terminant of the inside-negative membrane potential. Like allchannels, these alternate between an open and a closed state,but since their opening and closing are not affected by themembrane potential or by small signaling molecules, thesechannels are called nongated. The various gated channelsdiscussed in later sections open only in response to specificligands or to changes in membrane potential.
Quantitatively, the usual resting membrane potential of�70 mV is close to but lower in magnitude than that of thepotassium equilibrium potential calculated from the Nernstequation because of the presence of a few open Na� chan-nels. These open Na� channels allow the net inward flow ofNa� ions, making the cytosolic face of the plasma membranemore positive, that is, less negative, than predicted by the
262 CHAPTER 7 • Transport of Ions and Small Molecules Across Cell Membranes
− − − − − − − − − − − − − − − − − −+ + + + + + + + + + + + + + + + + +
−80 +80
−40 +40
Microelectrodefilled withconductingsalt solution
Plasma membraneCytosol
Reference electrodein contact withbathing medium
0
Bathing medium
Potentiometer
▲ EXPERIMENTAL FIGURE 7-14 The electric potential
across the plasma membrane of living cells can be measured.
A microelectrode, constructed by filling a glass tube of extremelysmall diameter with a conducting fluid such as a KCl solution, isinserted into a cell in such a way that the surface membraneseals itself around the tip of the electrode. A reference electrodeis placed in the bathing medium. A potentiometer connecting thetwo electrodes registers the potential, in this case �60 mV. A potential difference is registered only when the microelectrode is inserted into the cell; no potential is registered if the microelectrode is in the bathing fluid.
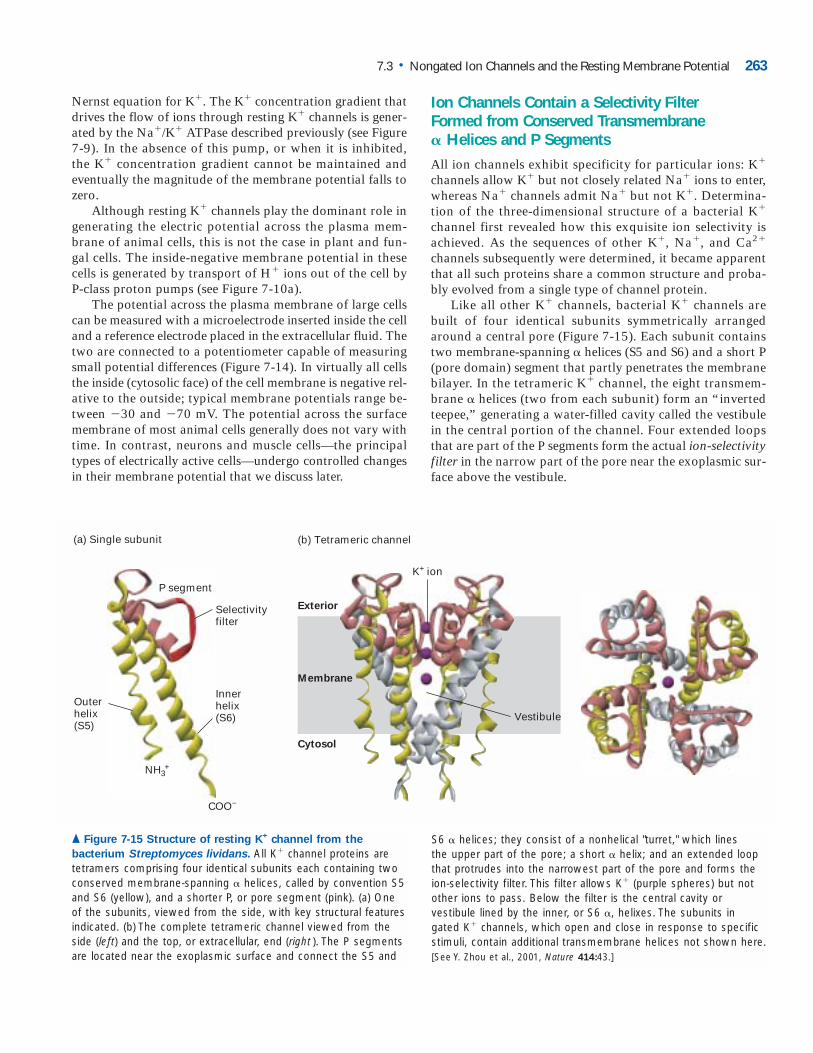
Nernst equation for K�. The K� concentration gradient thatdrives the flow of ions through resting K� channels is gener-ated by the Na�/K� ATPase described previously (see Figure7-9). In the absence of this pump, or when it is inhibited, the K� concentration gradient cannot be maintained andeventually the magnitude of the membrane potential falls tozero.
Although resting K� channels play the dominant role ingenerating the electric potential across the plasma mem-brane of animal cells, this is not the case in plant and fun-gal cells. The inside-negative membrane potential in thesecells is generated by transport of H� ions out of the cell byP-class proton pumps (see Figure 7-10a).
The potential across the plasma membrane of large cellscan be measured with a microelectrode inserted inside the celland a reference electrode placed in the extracellular fluid. Thetwo are connected to a potentiometer capable of measuringsmall potential differences (Figure 7-14). In virtually all cellsthe inside (cytosolic face) of the cell membrane is negative rel-ative to the outside; typical membrane potentials range be-tween �30 and �70 mV. The potential across the surfacemembrane of most animal cells generally does not vary withtime. In contrast, neurons and muscle cells—the principaltypes of electrically active cells—undergo controlled changesin their membrane potential that we discuss later.
Ion Channels Contain a Selectivity Filter Formed from Conserved Transmembrane � Helices and P Segments
All ion channels exhibit specificity for particular ions: K�
channels allow K� but not closely related Na� ions to enter,whereas Na� channels admit Na� but not K�. Determina-tion of the three-dimensional structure of a bacterial K�
channel first revealed how this exquisite ion selectivity isachieved. As the sequences of other K�, Na�, and Ca2�
channels subsequently were determined, it became apparentthat all such proteins share a common structure and proba-bly evolved from a single type of channel protein.
Like all other K� channels, bacterial K� channels arebuilt of four identical subunits symmetrically arrangedaround a central pore (Figure 7-15). Each subunit containstwo membrane-spanning � helices (S5 and S6) and a short P(pore domain) segment that partly penetrates the membranebilayer. In the tetrameric K� channel, the eight transmem-brane � helices (two from each subunit) form an “invertedteepee,” generating a water-filled cavity called the vestibulein the central portion of the channel. Four extended loopsthat are part of the P segments form the actual ion-selectivityfilter in the narrow part of the pore near the exoplasmic sur-face above the vestibule.
7.3 • Nongated Ion Channels and the Resting Membrane Potential 263
(a) Single subunit (b) Tetrameric channel
Vestibule
Exterior
Membrane
Cytosol
P segment
Outerhelix(S5)
NH3+
Innerhelix(S6)
Selectivityfilter
COO−
K+ ion
▲ Figure 7-15 Structure of resting K+ channel from the
bacterium Streptomyces lividans. All K� channel proteins aretetramers comprising four identical subunits each containing twoconserved membrane-spanning � helices, called by convention S5and S6 (yellow), and a shorter P, or pore segment (pink). (a) Oneof the subunits, viewed from the side, with key structural features indicated. (b) The complete tetrameric channel viewed from theside (left) and the top, or extracellular, end (right ). The P segmentsare located near the exoplasmic surface and connect the S5 and
S6 � helices; they consist of a nonhelical "turret," which lines the upper part of the pore; a short � helix; and an extended loopthat protrudes into the narrowest part of the pore and forms theion-selectivity filter. This filter allows K� (purple spheres) but notother ions to pass. Below the filter is the central cavity orvestibule lined by the inner, or S6 �, helixes. The subunits ingated K� channels, which open and close in response to specificstimuli, contain additional transmembrane helices not shown here.[See Y. Zhou et al., 2001, Nature 414:43.]
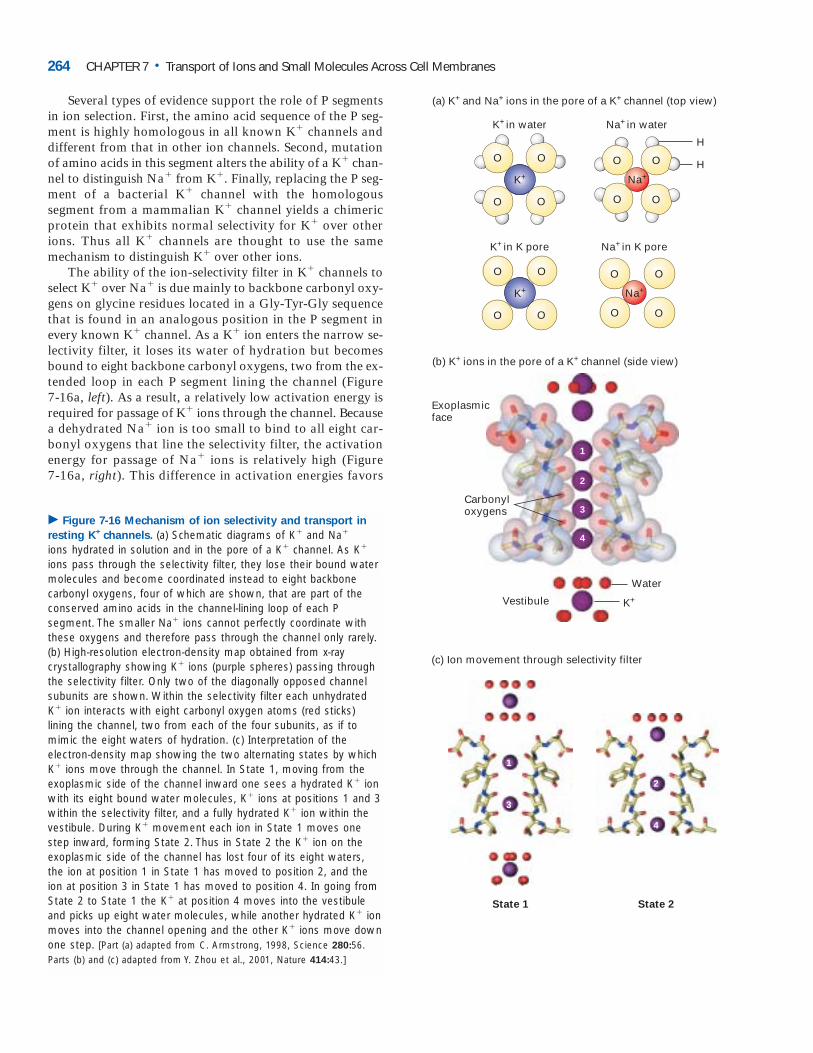
Several types of evidence support the role of P segmentsin ion selection. First, the amino acid sequence of the P seg-ment is highly homologous in all known K� channels anddifferent from that in other ion channels. Second, mutationof amino acids in this segment alters the ability of a K� chan-nel to distinguish Na� from K�. Finally, replacing the P seg-ment of a bacterial K� channel with the homologoussegment from a mammalian K� channel yields a chimericprotein that exhibits normal selectivity for K� over otherions. Thus all K� channels are thought to use the samemechanism to distinguish K� over other ions.
The ability of the ion-selectivity filter in K� channels toselect K� over Na� is due mainly to backbone carbonyl oxy-gens on glycine residues located in a Gly-Tyr-Gly sequencethat is found in an analogous position in the P segment inevery known K� channel. As a K� ion enters the narrow se-lectivity filter, it loses its water of hydration but becomesbound to eight backbone carbonyl oxygens, two from the ex-tended loop in each P segment lining the channel (Figure 7-16a, left). As a result, a relatively low activation energy isrequired for passage of K� ions through the channel. Becausea dehydrated Na� ion is too small to bind to all eight car-bonyl oxygens that line the selectivity filter, the activationenergy for passage of Na� ions is relatively high (Figure 7-16a, right). This difference in activation energies favors
264 CHAPTER 7 • Transport of Ions and Small Molecules Across Cell Membranes
(a) K+ and Na+ ions in the pore of a K+ channel (top view)
O O
K+
K+ in water
OO
Na+
Na+ in water
O O
OO
H
H
K+ in K pore
O O
K+
OO
Na+ in K pore
Na+
O O
OO
(b) K+ ions in the pore of a K+ channel (side view)
1
2
3
4
K+
Water
Exoplasmicface
(c) Ion movement through selectivity filter
State 1 State 2
1
3
2
4
Vestibule
Carbonyloxygens
� Figure 7-16 Mechanism of ion selectivity and transport in
resting K+ channels. (a) Schematic diagrams of K� and Na�
ions hydrated in solution and in the pore of a K� channel. As K�
ions pass through the selectivity filter, they lose their bound watermolecules and become coordinated instead to eight backbone carbonyl oxygens, four of which are shown, that are part of theconserved amino acids in the channel-lining loop of each P segment. The smaller Na� ions cannot perfectly coordinate withthese oxygens and therefore pass through the channel only rarely.(b) High-resolution electron-density map obtained from x-ray crystallography showing K� ions (purple spheres) passing throughthe selectivity filter. Only two of the diagonally opposed channelsubunits are shown. Within the selectivity filter each unhydratedK� ion interacts with eight carbonyl oxygen atoms (red sticks) lining the channel, two from each of the four subunits, as if tomimic the eight waters of hydration. (c) Interpretation of the electron-density map showing the two alternating states by whichK� ions move through the channel. In State 1, moving from theexoplasmic side of the channel inward one sees a hydrated K� ionwith its eight bound water molecules, K� ions at positions 1 and 3within the selectivity filter, and a fully hydrated K� ion within thevestibule. During K� movement each ion in State 1 moves onestep inward, forming State 2. Thus in State 2 the K� ion on the exoplasmic side of the channel has lost four of its eight waters,the ion at position 1 in State 1 has moved to position 2, and theion at position 3 in State 1 has moved to position 4. In going fromState 2 to State 1 the K� at position 4 moves into the vestibuleand picks up eight water molecules, while another hydrated K� ionmoves into the channel opening and the other K� ions move downone step. [Part (a) adapted from C. Armstrong, 1998, Science 280:56.Parts (b) and (c) adapted from Y. Zhou et al., 2001, Nature 414:43.]
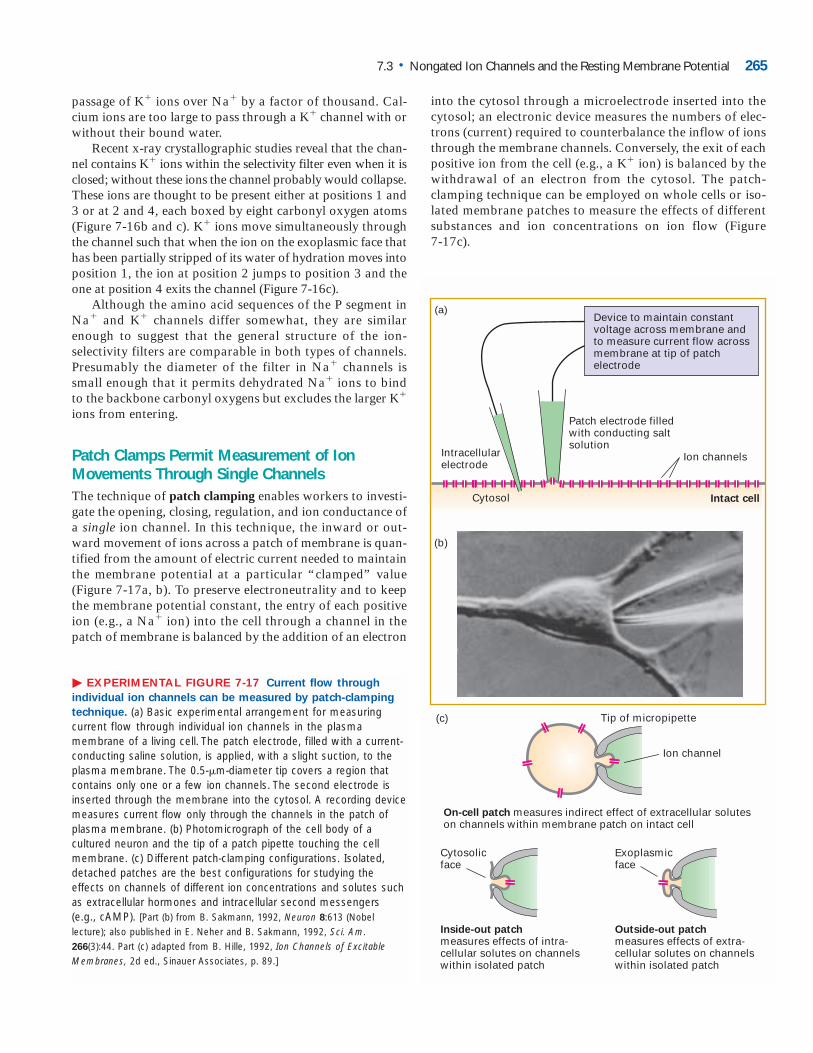
passage of K� ions over Na� by a factor of thousand. Cal-cium ions are too large to pass through a K� channel with orwithout their bound water.
Recent x-ray crystallographic studies reveal that the chan-nel contains K� ions within the selectivity filter even when it isclosed; without these ions the channel probably would collapse.These ions are thought to be present either at positions 1 and3 or at 2 and 4, each boxed by eight carbonyl oxygen atoms(Figure 7-16b and c). K� ions move simultaneously through the channel such that when the ion on the exoplasmic face thathas been partially stripped of its water of hydration moves intoposition 1, the ion at position 2 jumps to position 3 and the one at position 4 exits the channel (Figure 7-16c).
Although the amino acid sequences of the P segment inNa� and K� channels differ somewhat, they are similarenough to suggest that the general structure of the ion-selectivity filters are comparable in both types of channels.Presumably the diameter of the filter in Na� channels issmall enough that it permits dehydrated Na� ions to bindto the backbone carbonyl oxygens but excludes the larger K�
ions from entering.
Patch Clamps Permit Measurement of IonMovements Through Single ChannelsThe technique of patch clamping enables workers to investi-gate the opening, closing, regulation, and ion conductance ofa single ion channel. In this technique, the inward or out-ward movement of ions across a patch of membrane is quan-tified from the amount of electric current needed to maintainthe membrane potential at a particular “clamped” value(Figure 7-17a, b). To preserve electroneutrality and to keepthe membrane potential constant, the entry of each positiveion (e.g., a Na� ion) into the cell through a channel in thepatch of membrane is balanced by the addition of an electron
into the cytosol through a microelectrode inserted into thecytosol; an electronic device measures the numbers of elec-trons (current) required to counterbalance the inflow of ionsthrough the membrane channels. Conversely, the exit of eachpositive ion from the cell (e.g., a K� ion) is balanced by thewithdrawal of an electron from the cytosol. The patch-clamping technique can be employed on whole cells or iso-lated membrane patches to measure the effects of differentsubstances and ion concentrations on ion flow (Figure 7-17c).
7.3 • Nongated Ion Channels and the Resting Membrane Potential 265
On-cell patch measures indirect effect of extracellular solutes on channels within membrane patch on intact cell
Inside-out patch measures effects of intra-cellular solutes on channels within isolated patch
Outside-out patch measures effects of extra-cellular solutes on channels within isolated patch
Ion channel
Tip of micropipette
Ion channelsIntracellularelectrode
Patch electrode filledwith conducting saltsolution
Intact cell
(a)
Cytosol
(c)
Cytosolicface
Exoplasmicface
Device to maintain constant voltage across membrane and to measure current flow across membrane at tip of patch electrode
(b)
� EXPERIMENTAL FIGURE 7-17 Current flow through
individual ion channels can be measured by patch-clamping
technique. (a) Basic experimental arrangement for measuring current flow through individual ion channels in the plasma membrane of a living cell. The patch electrode, filled with a current-conducting saline solution, is applied, with a slight suction, to theplasma membrane. The 0.5-m-diameter tip covers a region thatcontains only one or a few ion channels. The second electrode is inserted through the membrane into the cytosol. A recording devicemeasures current flow only through the channels in the patch ofplasma membrane. (b) Photomicrograph of the cell body of a cultured neuron and the tip of a patch pipette touching the cellmembrane. (c) Different patch-clamping configurations. Isolated, detached patches are the best configurations for studying the effects on channels of different ion concentrations and solutes suchas extracellular hormones and intracellular second messengers(e.g., cAMP). [Part (b) from B. Sakmann, 1992, Neuron 8:613 (Nobel lecture); also published in E. Neher and B. Sakmann, 1992, Sci. Am.266(3):44. Part (c) adapted from B. Hille, 1992, Ion Channels of ExcitableMembranes, 2d ed., Sinauer Associates, p. 89.]
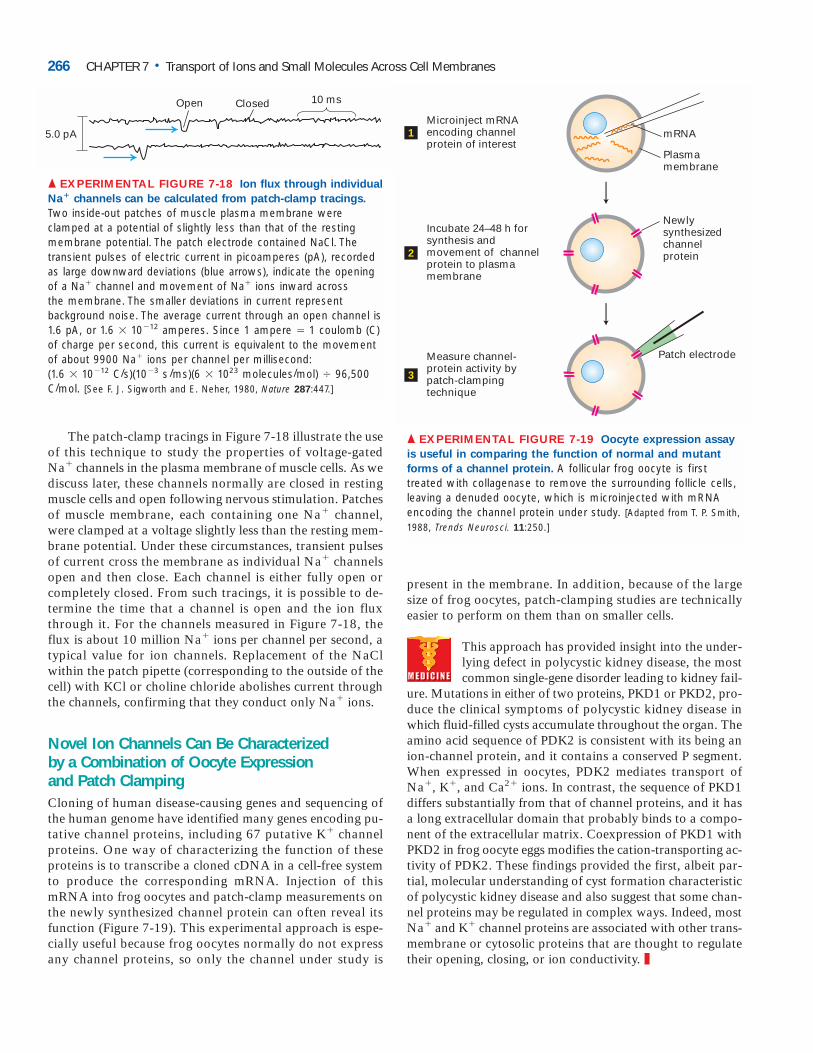
The patch-clamp tracings in Figure 7-18 illustrate the useof this technique to study the properties of voltage-gatedNa� channels in the plasma membrane of muscle cells. As wediscuss later, these channels normally are closed in restingmuscle cells and open following nervous stimulation. Patchesof muscle membrane, each containing one Na� channel,were clamped at a voltage slightly less than the resting mem-brane potential. Under these circumstances, transient pulsesof current cross the membrane as individual Na� channelsopen and then close. Each channel is either fully open orcompletely closed. From such tracings, it is possible to de-termine the time that a channel is open and the ion fluxthrough it. For the channels measured in Figure 7-18, theflux is about 10 million Na� ions per channel per second, atypical value for ion channels. Replacement of the NaClwithin the patch pipette (corresponding to the outside of thecell) with KCl or choline chloride abolishes current throughthe channels, confirming that they conduct only Na� ions.
Novel Ion Channels Can Be Characterized by a Combination of Oocyte Expression and Patch ClampingCloning of human disease-causing genes and sequencing ofthe human genome have identified many genes encoding pu-tative channel proteins, including 67 putative K� channelproteins. One way of characterizing the function of theseproteins is to transcribe a cloned cDNA in a cell-free systemto produce the corresponding mRNA. Injection of thismRNA into frog oocytes and patch-clamp measurements onthe newly synthesized channel protein can often reveal itsfunction (Figure 7-19). This experimental approach is espe-cially useful because frog oocytes normally do not expressany channel proteins, so only the channel under study is
present in the membrane. In addition, because of the largesize of frog oocytes, patch-clamping studies are technicallyeasier to perform on them than on smaller cells.
This approach has provided insight into the under-lying defect in polycystic kidney disease, the mostcommon single-gene disorder leading to kidney fail-
ure. Mutations in either of two proteins, PKD1 or PKD2, pro-duce the clinical symptoms of polycystic kidney disease inwhich fluid-filled cysts accumulate throughout the organ. Theamino acid sequence of PDK2 is consistent with its being anion-channel protein, and it contains a conserved P segment.When expressed in oocytes, PDK2 mediates transport ofNa�, K�, and Ca2� ions. In contrast, the sequence of PKD1differs substantially from that of channel proteins, and it hasa long extracellular domain that probably binds to a compo-nent of the extracellular matrix. Coexpression of PKD1 withPKD2 in frog oocyte eggs modifies the cation-transporting ac-tivity of PDK2. These findings provided the first, albeit par-tial, molecular understanding of cyst formation characteristicof polycystic kidney disease and also suggest that some chan-nel proteins may be regulated in complex ways. Indeed, mostNa� and K� channel proteins are associated with other trans-membrane or cytosolic proteins that are thought to regulatetheir opening, closing, or ion conductivity. ❚
266 CHAPTER 7 • Transport of Ions and Small Molecules Across Cell Membranes
Open 10 msClosed
5.0 pA
▲ EXPERIMENTAL FIGURE 7-18 Ion flux through individual
Na� channels can be calculated from patch-clamp tracings.
Two inside-out patches of muscle plasma membrane wereclamped at a potential of slightly less than that of the restingmembrane potential. The patch electrode contained NaCl. Thetransient pulses of electric current in picoamperes (pA), recordedas large downward deviations (blue arrows), indicate the openingof a Na� channel and movement of Na� ions inward across the membrane. The smaller deviations in current represent background noise. The average current through an open channel is1.6 pA, or 1.6 � 10�12 amperes. Since 1 ampere � 1 coulomb (C)of charge per second, this current is equivalent to the movementof about 9900 Na� ions per channel per millisecond: (1.6 � 10�12 C/s)(10�3 s/ms)(6 � 1023 molecules/mol) � 96,500C/mol. [See F. J. Sigworth and E. Neher, 1980, Nature 287:447.]
Plasmamembrane
Microinject mRNA encoding channel protein of interest
Incubate 24–48 h for synthesis and movement of channelprotein to plasma membrane
Measure channel-protein activity by patch-clamping technique
Newlysynthesizedchannel protein
Patch electrode
mRNA1
2
3
▲ EXPERIMENTAL FIGURE 7-19 Oocyte expression assay
is useful in comparing the function of normal and mutant
forms of a channel protein. A follicular frog oocyte is firsttreated with collagenase to remove the surrounding follicle cells,leaving a denuded oocyte, which is microinjected with mRNA encoding the channel protein under study. [Adapted from T. P. Smith,1988, Trends Neurosci. 11:250.]
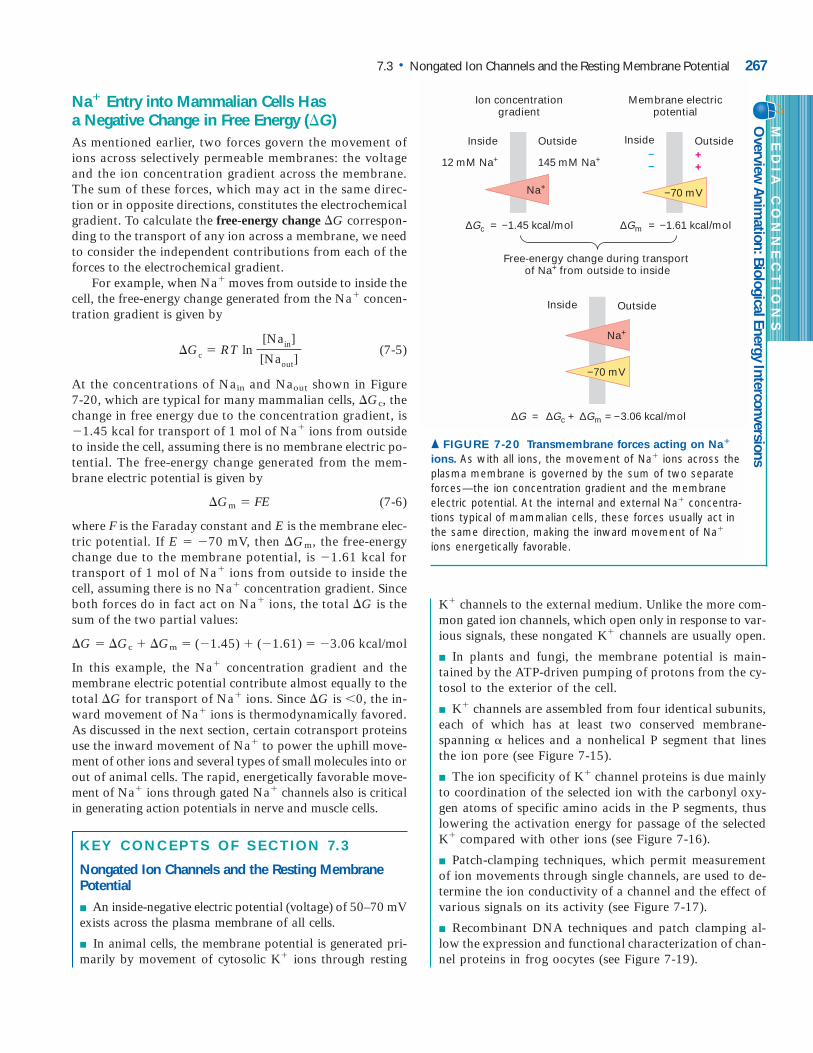
Na� Entry into Mammalian Cells Has a Negative Change in Free Energy (�G)As mentioned earlier, two forces govern the movement ofions across selectively permeable membranes: the voltageand the ion concentration gradient across the membrane.The sum of these forces, which may act in the same direc-tion or in opposite directions, constitutes the electrochemicalgradient. To calculate the free-energy change �G correspon-ding to the transport of any ion across a membrane, we needto consider the independent contributions from each of theforces to the electrochemical gradient.
For example, when Na� moves from outside to inside thecell, the free-energy change generated from the Na� concen-tration gradient is given by
� (7-5)
At the concentrations of Nain and Naout shown in Figure 7-20, which are typical for many mammalian cells, �Gc, thechange in free energy due to the concentration gradient, is�1.45 kcal for transport of 1 mol of Na� ions from outsideto inside the cell, assuming there is no membrane electric po-tential. The free-energy change generated from the mem-brane electric potential is given by
�Gm � FE (7-6)
where F is the Faraday constant and E is the membrane elec-tric potential. If E � �70 mV, then �Gm, the free-energychange due to the membrane potential, is �1.61 kcal fortransport of 1 mol of Na� ions from outside to inside thecell, assuming there is no Na� concentration gradient. Sinceboth forces do in fact act on Na� ions, the total �G is thesum of the two partial values:
�G � �Gc � �Gm � (�1.45) � (�1.61) � �3.06 kcal/mol
In this example, the Na� concentration gradient and the membrane electric potential contribute almost equally to thetotal �G for transport of Na� ions. Since �G is 0, the in-ward movement of Na� ions is thermodynamically favored.As discussed in the next section, certain cotransport proteinsuse the inward movement of Na� to power the uphill move-ment of other ions and several types of small molecules into orout of animal cells. The rapid, energetically favorable move-ment of Na� ions through gated Na� channels also is criticalin generating action potentials in nerve and muscle cells.
KEY CONCEPTS OF SECTION 7.3
Nongated Ion Channels and the Resting MembranePotential
■ An inside-negative electric potential (voltage) of 50–70 mVexists across the plasma membrane of all cells.
■ In animal cells, the membrane potential is generated pri-marily by movement of cytosolic K� ions through resting
Gc � RT ln [Nain]
[Naout]
K� channels to the external medium. Unlike the more com-mon gated ion channels, which open only in response to var-ious signals, these nongated K� channels are usually open.
■ In plants and fungi, the membrane potential is main-tained by the ATP-driven pumping of protons from the cy-tosol to the exterior of the cell.
■ K� channels are assembled from four identical subunits,each of which has at least two conserved membrane-spanning � helices and a nonhelical P segment that linesthe ion pore (see Figure 7-15).
■ The ion specificity of K� channel proteins is due mainlyto coordination of the selected ion with the carbonyl oxy-gen atoms of specific amino acids in the P segments, thuslowering the activation energy for passage of the selectedK� compared with other ions (see Figure 7-16).
■ Patch-clamping techniques, which permit measurementof ion movements through single channels, are used to de-termine the ion conductivity of a channel and the effect ofvarious signals on its activity (see Figure 7-17).
■ Recombinant DNA techniques and patch clamping al-low the expression and functional characterization of chan-nel proteins in frog oocytes (see Figure 7-19).
7.3 • Nongated Ion Channels and the Resting Membrane Potential 267
+
+
OutsideInsideOutsideInside–
–
OutsideInside
12 mM Na+ 145 mM Na+
∆Gc = −1.45 kcal/mol
∆G = ∆Gc + ∆Gm = −3.06 kcal/mol
∆Gm = −1.61 kcal/mol
Free-energy change during transport of Na+ from outside to inside
Na+
−70 mV
−70 mVNa+
Ion concentrationgradient
Membrane electricpotential
▲ FIGURE 7-20 Transmembrane forces acting on Na�
ions. As with all ions, the movement of Na� ions across theplasma membrane is governed by the sum of two separateforces—the ion concentration gradient and the membraneelectric potential. At the internal and external Na� concentra-tions typical of mammalian cells, these forces usually act inthe same direction, making the inward movement of Na�
ions energetically favorable.
ME
DIA
C
ON
NE
CT
IO
NS
Overview
Anim
ation: Biological Energy Interconversions
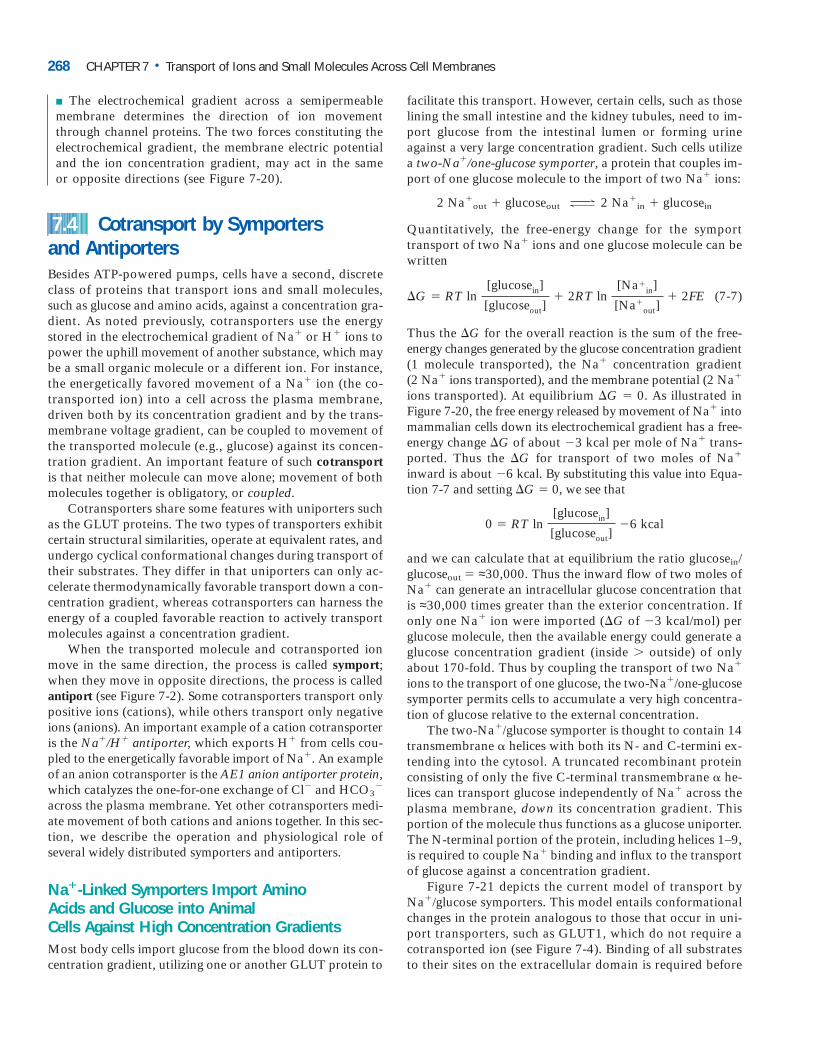
■ The electrochemical gradient across a semipermeablemembrane determines the direction of ion movementthrough channel proteins. The two forces constituting theelectrochemical gradient, the membrane electric potentialand the ion concentration gradient, may act in the sameor opposite directions (see Figure 7-20).
Cotransport by Symporters and AntiportersBesides ATP-powered pumps, cells have a second, discreteclass of proteins that transport ions and small molecules,such as glucose and amino acids, against a concentration gra-dient. As noted previously, cotransporters use the energystored in the electrochemical gradient of Na� or H� ions topower the uphill movement of another substance, which maybe a small organic molecule or a different ion. For instance,the energetically favored movement of a Na� ion (the co-transported ion) into a cell across the plasma membrane,driven both by its concentration gradient and by the trans-membrane voltage gradient, can be coupled to movement ofthe transported molecule (e.g., glucose) against its concen-tration gradient. An important feature of such cotransportis that neither molecule can move alone; movement of bothmolecules together is obligatory, or coupled.
Cotransporters share some features with uniporters suchas the GLUT proteins. The two types of transporters exhibitcertain structural similarities, operate at equivalent rates, andundergo cyclical conformational changes during transport oftheir substrates. They differ in that uniporters can only ac-celerate thermodynamically favorable transport down a con-centration gradient, whereas cotransporters can harness theenergy of a coupled favorable reaction to actively transportmolecules against a concentration gradient.
When the transported molecule and cotransported ionmove in the same direction, the process is called symport;when they move in opposite directions, the process is calledantiport (see Figure 7-2). Some cotransporters transport onlypositive ions (cations), while others transport only negativeions (anions). An important example of a cation cotransporteris the Na�/H� antiporter, which exports H� from cells cou-pled to the energetically favorable import of Na�. An exampleof an anion cotransporter is the AE1 anion antiporter protein,which catalyzes the one-for-one exchange of Cl� and HCO3
�
across the plasma membrane. Yet other cotransporters medi-ate movement of both cations and anions together. In this sec-tion, we describe the operation and physiological role ofseveral widely distributed symporters and antiporters.
Na�-Linked Symporters Import Amino Acids and Glucose into Animal Cells Against High Concentration GradientsMost body cells import glucose from the blood down its con-centration gradient, utilizing one or another GLUT protein to
7.4
facilitate this transport. However, certain cells, such as thoselining the small intestine and the kidney tubules, need to im-port glucose from the intestinal lumen or forming urineagainst a very large concentration gradient. Such cells utilizea two-Na�/one-glucose symporter, a protein that couples im-port of one glucose molecule to the import of two Na� ions:
2 Na�out � glucoseout 2 Na�
in � glucosein
Quantitatively, the free-energy change for the symporttransport of two Na� ions and one glucose molecule can bewritten
� (7-7)
Thus the �G for the overall reaction is the sum of the free-energy changes generated by the glucose concentration gradient(1 molecule transported), the Na� concentration gradient (2 Na� ions transported), and the membrane potential (2 Na�
ions transported). At equilibrium �G � 0. As illustrated in Figure 7-20, the free energy released by movement of Na� intomammalian cells down its electrochemical gradient has a free-energy change �G of about �3 kcal per mole of Na� trans-ported. Thus the �G for transport of two moles of Na�
inward is about �6 kcal. By substituting this value into Equa-tion 7-7 and setting �G � 0, we see that
and we can calculate that at equilibrium the ratio glucosein/glucoseout � ≈30,000. Thus the inward flow of two moles ofNa� can generate an intracellular glucose concentration thatis ≈30,000 times greater than the exterior concentration. Ifonly one Na� ion were imported (�G of �3 kcal/mol) perglucose molecule, then the available energy could generate aglucose concentration gradient (inside outside) of onlyabout 170-fold. Thus by coupling the transport of two Na�
ions to the transport of one glucose, the two-Na�/one-glucosesymporter permits cells to accumulate a very high concentra-tion of glucose relative to the external concentration.
The two-Na�/glucose symporter is thought to contain 14transmembrane � helices with both its N- and C-termini ex-tending into the cytosol. A truncated recombinant proteinconsisting of only the five C-terminal transmembrane � he-lices can transport glucose independently of Na� across theplasma membrane, down its concentration gradient. Thisportion of the molecule thus functions as a glucose uniporter.The N-terminal portion of the protein, including helices 1–9,is required to couple Na� binding and influx to the transportof glucose against a concentration gradient.
Figure 7-21 depicts the current model of transport byNa�/glucose symporters. This model entails conformationalchanges in the protein analogous to those that occur in uni-port transporters, such as GLUT1, which do not require acotransported ion (see Figure 7-4). Binding of all substratesto their sites on the extracellular domain is required before
0 � RT ln [glucosein]
[glucoseout] �6 kcal
G � RT ln [glucosein]
[glucoseout]� 2RT ln
[Na�in]
[Na�out]
� 2FE
268 CHAPTER 7 • Transport of Ions and Small Molecules Across Cell Membranes
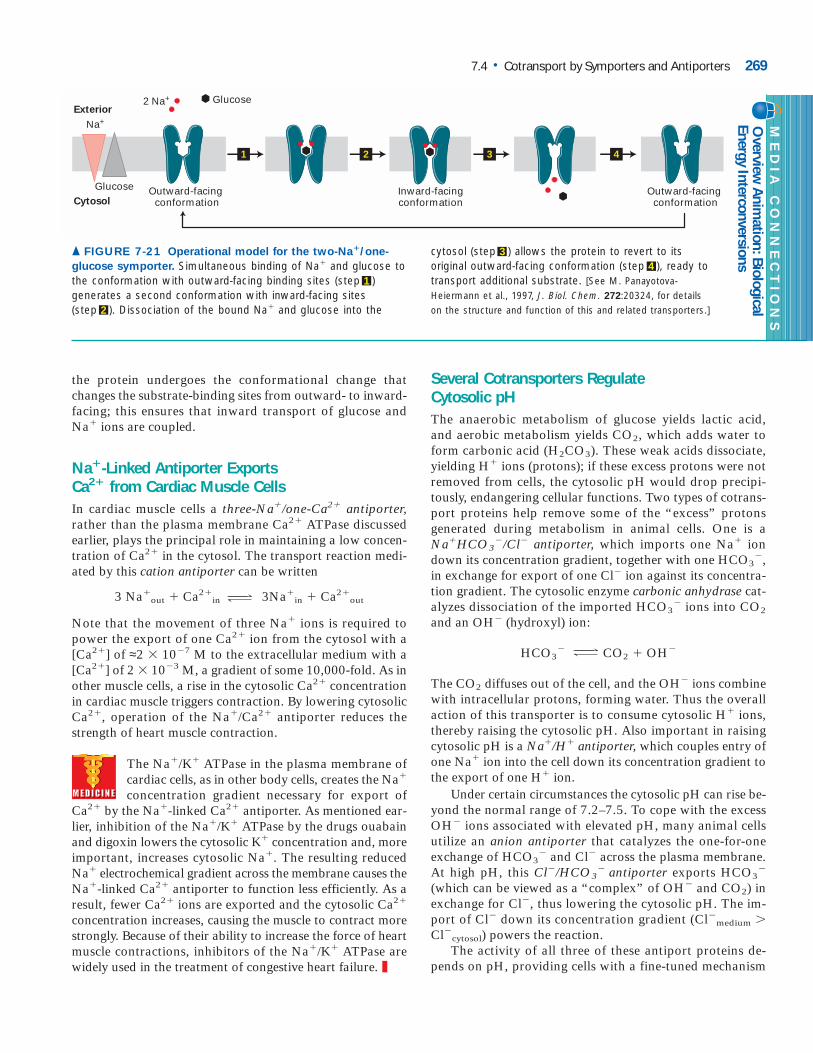
the protein undergoes the conformational change thatchanges the substrate-binding sites from outward- to inward-facing; this ensures that inward transport of glucose andNa� ions are coupled.
Na�-Linked Antiporter Exports Ca2� from Cardiac Muscle CellsIn cardiac muscle cells a three-Na�/one-Ca2� antiporter,rather than the plasma membrane Ca2� ATPase discussedearlier, plays the principal role in maintaining a low concen-tration of Ca2� in the cytosol. The transport reaction medi-ated by this cation antiporter can be written
3 Na�out � Ca2�
in 3Na�in � Ca2�
out
Note that the movement of three Na� ions is required topower the export of one Ca2� ion from the cytosol with a[Ca2�] of ≈2 � 10�7 M to the extracellular medium with a[Ca2�] of 2 � 10�3 M, a gradient of some 10,000-fold. As inother muscle cells, a rise in the cytosolic Ca2� concentrationin cardiac muscle triggers contraction. By lowering cytosolicCa2�, operation of the Na�/Ca2� antiporter reduces thestrength of heart muscle contraction.
The Na�/K� ATPase in the plasma membrane ofcardiac cells, as in other body cells, creates the Na�
concentration gradient necessary for export ofCa2� by the Na�-linked Ca2� antiporter. As mentioned ear-lier, inhibition of the Na�/K� ATPase by the drugs ouabainand digoxin lowers the cytosolic K� concentration and, moreimportant, increases cytosolic Na�. The resulting reducedNa� electrochemical gradient across the membrane causes theNa�-linked Ca2� antiporter to function less efficiently. As aresult, fewer Ca2� ions are exported and the cytosolic Ca2�
concentration increases, causing the muscle to contract morestrongly. Because of their ability to increase the force of heartmuscle contractions, inhibitors of the Na�/K� ATPase arewidely used in the treatment of congestive heart failure. ❚
Several Cotransporters Regulate Cytosolic pHThe anaerobic metabolism of glucose yields lactic acid,and aerobic metabolism yields CO2, which adds water toform carbonic acid (H2CO3). These weak acids dissociate,yielding H� ions (protons); if these excess protons were notremoved from cells, the cytosolic pH would drop precipi-tously, endangering cellular functions. Two types of cotrans-port proteins help remove some of the “excess” protonsgenerated during metabolism in animal cells. One is aNa�HCO3
�/Cl� antiporter, which imports one Na� iondown its concentration gradient, together with one HCO3
�,in exchange for export of one Cl� ion against its concentra-tion gradient. The cytosolic enzyme carbonic anhydrase cat-alyzes dissociation of the imported HCO3
� ions into CO2
and an OH� (hydroxyl) ion:
HCO3� CO2 � OH�
The CO2 diffuses out of the cell, and the OH� ions combinewith intracellular protons, forming water. Thus the overallaction of this transporter is to consume cytosolic H� ions,thereby raising the cytosolic pH. Also important in raisingcytosolic pH is a Na�/H� antiporter, which couples entry ofone Na� ion into the cell down its concentration gradient tothe export of one H� ion.
Under certain circumstances the cytosolic pH can rise be-yond the normal range of 7.2–7.5. To cope with the excessOH� ions associated with elevated pH, many animal cellsutilize an anion antiporter that catalyzes the one-for-oneexchange of HCO3
� and Cl� across the plasma membrane.At high pH, this Cl�/HCO3
� antiporter exports HCO3�
(which can be viewed as a “complex” of OH� and CO2) inexchange for Cl�, thus lowering the cytosolic pH. The im-port of Cl� down its concentration gradient (Cl�medium Cl�cytosol) powers the reaction.
The activity of all three of these antiport proteins de-pends on pH, providing cells with a fine-tuned mechanism
7.4 • Cotransport by Symporters and Antiporters 269
Glucose2 Na+
Outward-facing conformation
Na+
Inward-facingconformation
Outward-facing conformation
Glucose
Exterior
Cytosol
1 2 3 4
ME
DIA
C
ON
NE
CT
IO
NS
Overview
Anim
ation: Biological
Energy Interconversions
cytosol (step 3 ) allows the protein to revert to its original outward-facing conformation (step 4 ), ready totransport additional substrate. [See M. Panayotova-Heiermann et al., 1997, J. Biol. Chem. 272:20324, for details on the structure and function of this and related transporters.]
▲ FIGURE 7-21 Operational model for the two-Na�/one-
glucose symporter. Simultaneous binding of Na� and glucose tothe conformation with outward-facing binding sites (step 1 ) generates a second conformation with inward-facing sites (step 2 ). Dissociation of the bound Na� and glucose into the
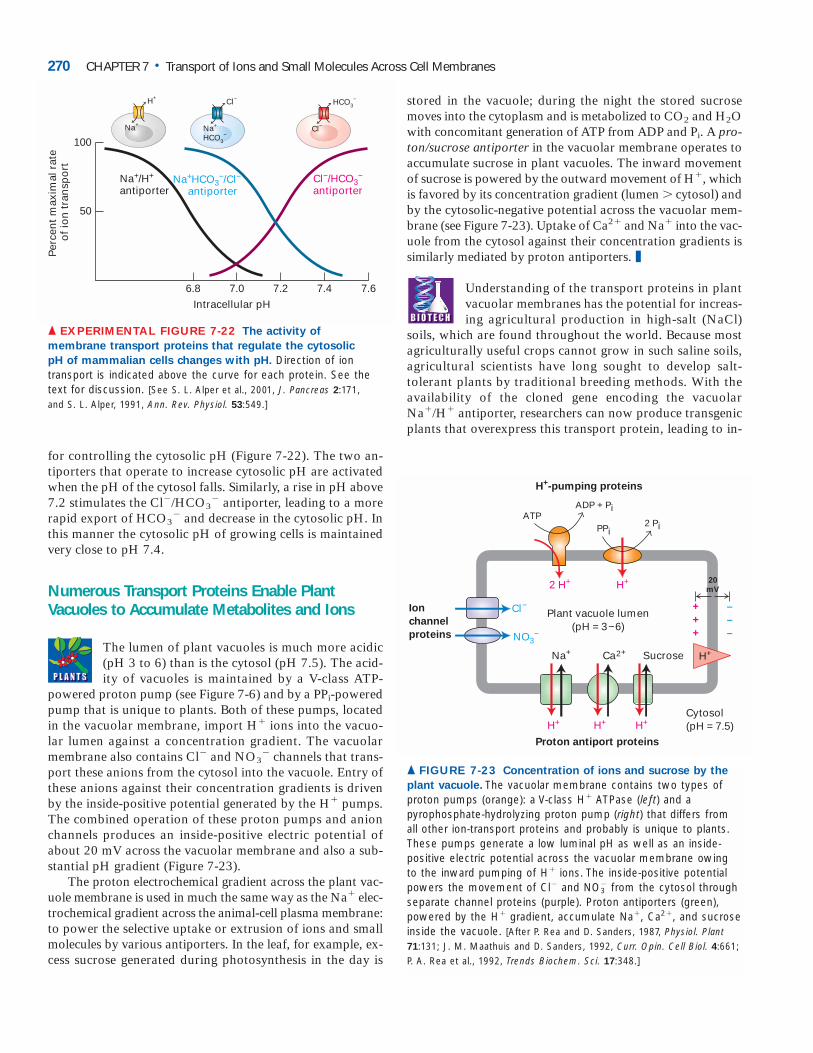
for controlling the cytosolic pH (Figure 7-22). The two an-tiporters that operate to increase cytosolic pH are activatedwhen the pH of the cytosol falls. Similarly, a rise in pH above7.2 stimulates the Cl�/HCO3
� antiporter, leading to a morerapid export of HCO3
� and decrease in the cytosolic pH. Inthis manner the cytosolic pH of growing cells is maintainedvery close to pH 7.4.
Numerous Transport Proteins Enable PlantVacuoles to Accumulate Metabolites and Ions
The lumen of plant vacuoles is much more acidic(pH 3 to 6) than is the cytosol (pH 7.5). The acid-ity of vacuoles is maintained by a V-class ATP-
powered proton pump (see Figure 7-6) and by a PPi-poweredpump that is unique to plants. Both of these pumps, locatedin the vacuolar membrane, import H� ions into the vacuo-lar lumen against a concentration gradient. The vacuolarmembrane also contains Cl� and NO3
� channels that trans-port these anions from the cytosol into the vacuole. Entry ofthese anions against their concentration gradients is drivenby the inside-positive potential generated by the H� pumps.The combined operation of these proton pumps and anionchannels produces an inside-positive electric potential ofabout 20 mV across the vacuolar membrane and also a sub-stantial pH gradient (Figure 7-23).
The proton electrochemical gradient across the plant vac-uole membrane is used in much the same way as the Na� elec-trochemical gradient across the animal-cell plasma membrane:to power the selective uptake or extrusion of ions and smallmolecules by various antiporters. In the leaf, for example, ex-cess sucrose generated during photosynthesis in the day is
stored in the vacuole; during the night the stored sucrosemoves into the cytoplasm and is metabolized to CO2 and H2Owith concomitant generation of ATP from ADP and Pi. A pro-ton/sucrose antiporter in the vacuolar membrane operates toaccumulate sucrose in plant vacuoles. The inward movementof sucrose is powered by the outward movement of H�, whichis favored by its concentration gradient (lumen cytosol) andby the cytosolic-negative potential across the vacuolar mem-brane (see Figure 7-23). Uptake of Ca2� and Na� into the vac-uole from the cytosol against their concentration gradients issimilarly mediated by proton antiporters. ❚
Understanding of the transport proteins in plantvacuolar membranes has the potential for increas-ing agricultural production in high-salt (NaCl)
soils, which are found throughout the world. Because mostagriculturally useful crops cannot grow in such saline soils,agricultural scientists have long sought to develop salt-tolerant plants by traditional breeding methods. With theavailability of the cloned gene encoding the vacuolarNa�/H� antiporter, researchers can now produce transgenicplants that overexpress this transport protein, leading to in-
270 CHAPTER 7 • Transport of Ions and Small Molecules Across Cell Membranes
100
50
Per
cen
t m
axim
al r
ate
of
ion
tra
nsp
ort
6.8 7.2 7.6
Na+/H+
antiporterCl−/HCO3
−
antiporterNa+HCO3
−/Cl−
antiporter
Intracellular pH7.0 7.4
Na+
H+
Na+
HCO3−
Cl−
Cl−
HCO3−
▲ EXPERIMENTAL FIGURE 7-22 The activity of
membrane transport proteins that regulate the cytosolic
pH of mammalian cells changes with pH. Direction of ion transport is indicated above the curve for each protein. See thetext for discussion. [See S. L. Alper et al., 2001, J. Pancreas 2:171, and S. L. Alper, 1991, Ann. Rev. Physiol. 53:549.]
2 H+
Cl−Ion
channel
proteins
Na+ Ca2+ Sucrose
Plant vacuole lumen(pH = 3−6)
Cytosol(pH = 7.5)
20
mV
NO3−
Proton antiport proteins
H+
H+-pumping proteins
ATPADP + Pi
PPi2 Pi
+
+
+
–
–
–
H+ H+ H+
H+
▲ FIGURE 7-23 Concentration of ions and sucrose by the
plant vacuole. The vacuolar membrane contains two types ofproton pumps (orange): a V-class H� ATPase (left) and a pyrophosphate-hydrolyzing proton pump (right) that differs fromall other ion-transport proteins and probably is unique to plants.These pumps generate a low luminal pH as well as an inside-positive electric potential across the vacuolar membrane owingto the inward pumping of H� ions. The inside-positive potentialpowers the movement of Cl� and NO3
� from the cytosol throughseparate channel proteins (purple). Proton antiporters (green),powered by the H� gradient, accumulate Na�, Ca2�, and sucroseinside the vacuole. [After P. Rea and D. Sanders, 1987, Physiol. Plant71:131; J. M. Maathuis and D. Sanders, 1992, Curr. Opin. Cell Biol. 4:661;P. A. Rea et al., 1992, Trends Biochem. Sci. 17:348.]
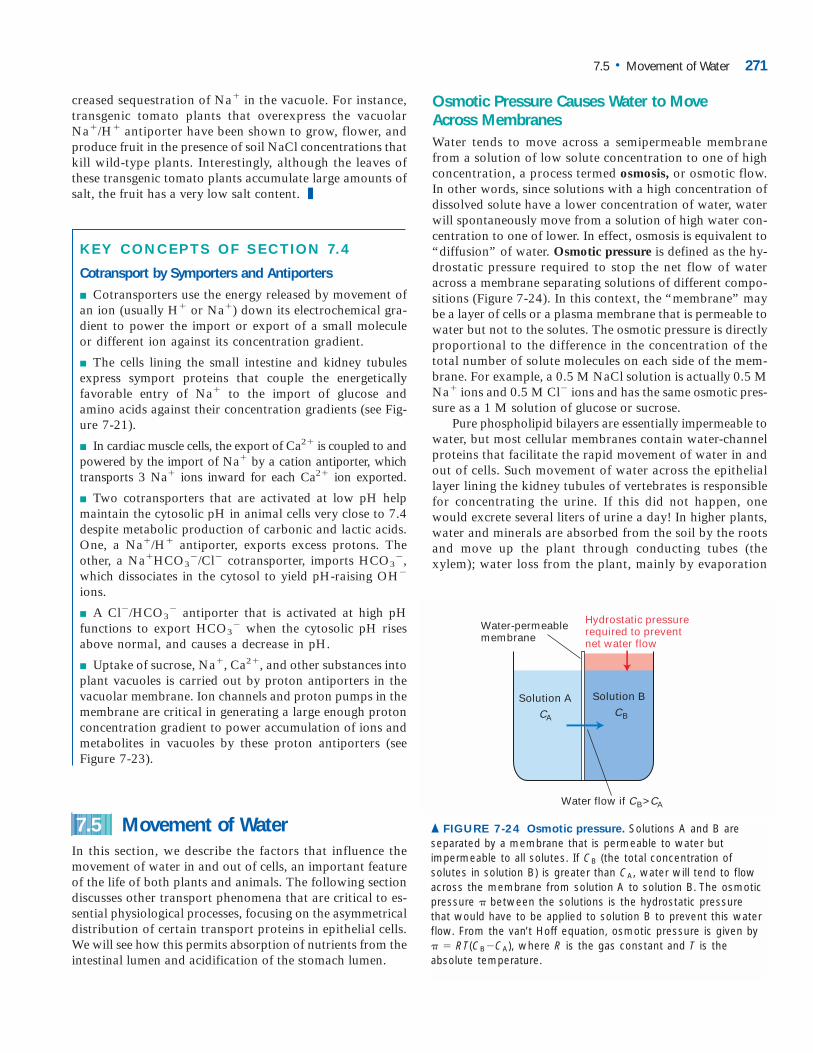
creased sequestration of Na� in the vacuole. For instance,transgenic tomato plants that overexpress the vacuolarNa�/H� antiporter have been shown to grow, flower, andproduce fruit in the presence of soil NaCl concentrations thatkill wild-type plants. Interestingly, although the leaves ofthese transgenic tomato plants accumulate large amounts ofsalt, the fruit has a very low salt content. ❚
KEY CONCEPTS OF SECTION 7.4
Cotransport by Symporters and Antiporters
■ Cotransporters use the energy released by movement ofan ion (usually H� or Na�) down its electrochemical gra-dient to power the import or export of a small moleculeor different ion against its concentration gradient.
■ The cells lining the small intestine and kidney tubulesexpress symport proteins that couple the energeticallyfavorable entry of Na� to the import of glucose andamino acids against their concentration gradients (see Fig-ure 7-21).
■ In cardiac muscle cells, the export of Ca2� is coupled to andpowered by the import of Na� by a cation antiporter, whichtransports 3 Na� ions inward for each Ca2� ion exported.
■ Two cotransporters that are activated at low pH helpmaintain the cytosolic pH in animal cells very close to 7.4despite metabolic production of carbonic and lactic acids.One, a Na�/H� antiporter, exports excess protons. Theother, a Na�HCO3
�/Cl� cotransporter, imports HCO3�,
which dissociates in the cytosol to yield pH-raising OH�
ions.
■ A Cl�/HCO3� antiporter that is activated at high pH
functions to export HCO3� when the cytosolic pH rises
above normal, and causes a decrease in pH.
■ Uptake of sucrose, Na�, Ca2�, and other substances intoplant vacuoles is carried out by proton antiporters in thevacuolar membrane. Ion channels and proton pumps in themembrane are critical in generating a large enough protonconcentration gradient to power accumulation of ions andmetabolites in vacuoles by these proton antiporters (seeFigure 7-23).
Movement of WaterIn this section, we describe the factors that influence themovement of water in and out of cells, an important featureof the life of both plants and animals. The following sectiondiscusses other transport phenomena that are critical to es-sential physiological processes, focusing on the asymmetricaldistribution of certain transport proteins in epithelial cells.We will see how this permits absorption of nutrients from theintestinal lumen and acidification of the stomach lumen.
7.5
Osmotic Pressure Causes Water to Move Across MembranesWater tends to move across a semipermeable membranefrom a solution of low solute concentration to one of highconcentration, a process termed osmosis, or osmotic flow.In other words, since solutions with a high concentration ofdissolved solute have a lower concentration of water, waterwill spontaneously move from a solution of high water con-centration to one of lower. In effect, osmosis is equivalent to“diffusion” of water. Osmotic pressure is defined as the hy-drostatic pressure required to stop the net flow of wateracross a membrane separating solutions of different compo-sitions (Figure 7-24). In this context, the “membrane” maybe a layer of cells or a plasma membrane that is permeable towater but not to the solutes. The osmotic pressure is directlyproportional to the difference in the concentration of thetotal number of solute molecules on each side of the mem-brane. For example, a 0.5 M NaCl solution is actually 0.5 MNa� ions and 0.5 M Cl� ions and has the same osmotic pres-sure as a 1 M solution of glucose or sucrose.
Pure phospholipid bilayers are essentially impermeable towater, but most cellular membranes contain water-channelproteins that facilitate the rapid movement of water in andout of cells. Such movement of water across the epitheliallayer lining the kidney tubules of vertebrates is responsiblefor concentrating the urine. If this did not happen, onewould excrete several liters of urine a day! In higher plants,water and minerals are absorbed from the soil by the rootsand move up the plant through conducting tubes (thexylem); water loss from the plant, mainly by evaporation
7.5 • Movement of Water 271
Water flow if CB>CA
CA CB
Hydrostatic pressure required to prevent net water flow
Water-permeablemembrane
Solution A Solution B
▲ FIGURE 7-24 Osmotic pressure. Solutions A and B are separated by a membrane that is permeable to water but impermeable to all solutes. If CB (the total concentration ofsolutes in solution B) is greater than CA, water will tend to flowacross the membrane from solution A to solution B. The osmoticpressure � between the solutions is the hydrostatic pressurethat would have to be applied to solution B to prevent this waterflow. From the van’t Hoff equation, osmotic pressure is given by� � RT(CB�CA), where R is the gas constant and T is the absolute temperature.
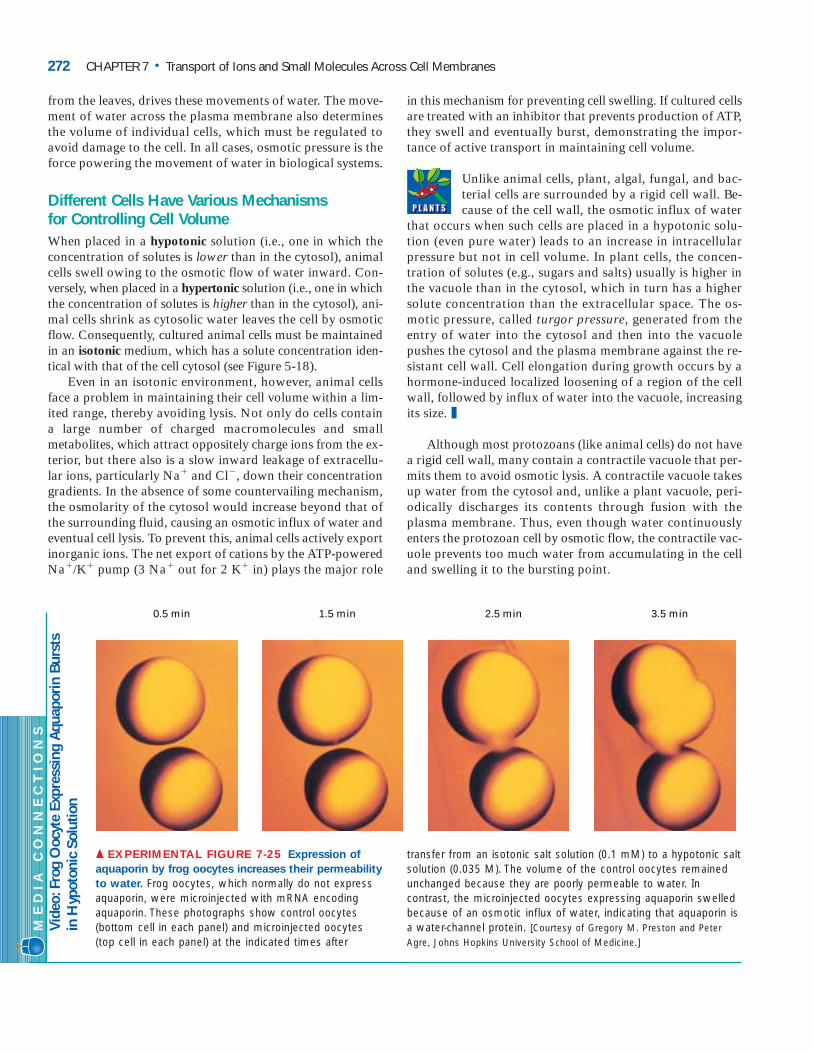
from the leaves, drives these movements of water. The move-ment of water across the plasma membrane also determinesthe volume of individual cells, which must be regulated toavoid damage to the cell. In all cases, osmotic pressure is theforce powering the movement of water in biological systems.
Different Cells Have Various Mechanisms for Controlling Cell VolumeWhen placed in a hypotonic solution (i.e., one in which theconcentration of solutes is lower than in the cytosol), animalcells swell owing to the osmotic flow of water inward. Con-versely, when placed in a hypertonic solution (i.e., one in whichthe concentration of solutes is higher than in the cytosol), ani-mal cells shrink as cytosolic water leaves the cell by osmoticflow. Consequently, cultured animal cells must be maintainedin an isotonic medium, which has a solute concentration iden-tical with that of the cell cytosol (see Figure 5-18).
Even in an isotonic environment, however, animal cellsface a problem in maintaining their cell volume within a lim-ited range, thereby avoiding lysis. Not only do cells containa large number of charged macromolecules and smallmetabolites, which attract oppositely charge ions from the ex-terior, but there also is a slow inward leakage of extracellu-lar ions, particularly Na� and Cl�, down their concentrationgradients. In the absence of some countervailing mechanism,the osmolarity of the cytosol would increase beyond that ofthe surrounding fluid, causing an osmotic influx of water andeventual cell lysis. To prevent this, animal cells actively exportinorganic ions. The net export of cations by the ATP-poweredNa�/K� pump (3 Na� out for 2 K� in) plays the major role
in this mechanism for preventing cell swelling. If cultured cellsare treated with an inhibitor that prevents production of ATP,they swell and eventually burst, demonstrating the impor-tance of active transport in maintaining cell volume.
Unlike animal cells, plant, algal, fungal, and bac-terial cells are surrounded by a rigid cell wall. Be-cause of the cell wall, the osmotic influx of water
that occurs when such cells are placed in a hypotonic solu-tion (even pure water) leads to an increase in intracellularpressure but not in cell volume. In plant cells, the concen-tration of solutes (e.g., sugars and salts) usually is higher inthe vacuole than in the cytosol, which in turn has a highersolute concentration than the extracellular space. The os-motic pressure, called turgor pressure, generated from theentry of water into the cytosol and then into the vacuolepushes the cytosol and the plasma membrane against the re-sistant cell wall. Cell elongation during growth occurs by ahormone-induced localized loosening of a region of the cellwall, followed by influx of water into the vacuole, increasingits size. ❚
Although most protozoans (like animal cells) do not havea rigid cell wall, many contain a contractile vacuole that per-mits them to avoid osmotic lysis. A contractile vacuole takesup water from the cytosol and, unlike a plant vacuole, peri-odically discharges its contents through fusion with theplasma membrane. Thus, even though water continuouslyenters the protozoan cell by osmotic flow, the contractile vac-uole prevents too much water from accumulating in the celland swelling it to the bursting point.
272 CHAPTER 7 • Transport of Ions and Small Molecules Across Cell Membranes
0.5 min 1.5 min 2.5 min 3.5 min
▲ EXPERIMENTAL FIGURE 7-25 Expression of
aquaporin by frog oocytes increases their permeability
to water. Frog oocytes, which normally do not expressaquaporin, were microinjected with mRNA encodingaquaporin. These photographs show control oocytes(bottom cell in each panel) and microinjected oocytes(top cell in each panel) at the indicated times after
transfer from an isotonic salt solution (0.1 mM) to a hypotonic saltsolution (0.035 M). The volume of the control oocytes remainedunchanged because they are poorly permeable to water. Incontrast, the microinjected oocytes expressing aquaporin swelledbecause of an osmotic influx of water, indicating that aquaporin isa water-channel protein. [Courtesy of Gregory M. Preston and PeterAgre, Johns Hopkins University School of Medicine.]
ME
DIA
C
ON
NE
CT
IO
NS
Vid
eo:F
rog
Ooc
yte
Expr
essi
ng A
quap
orin
Bur
sts
in H
ypot
onic
Sol
utio
n
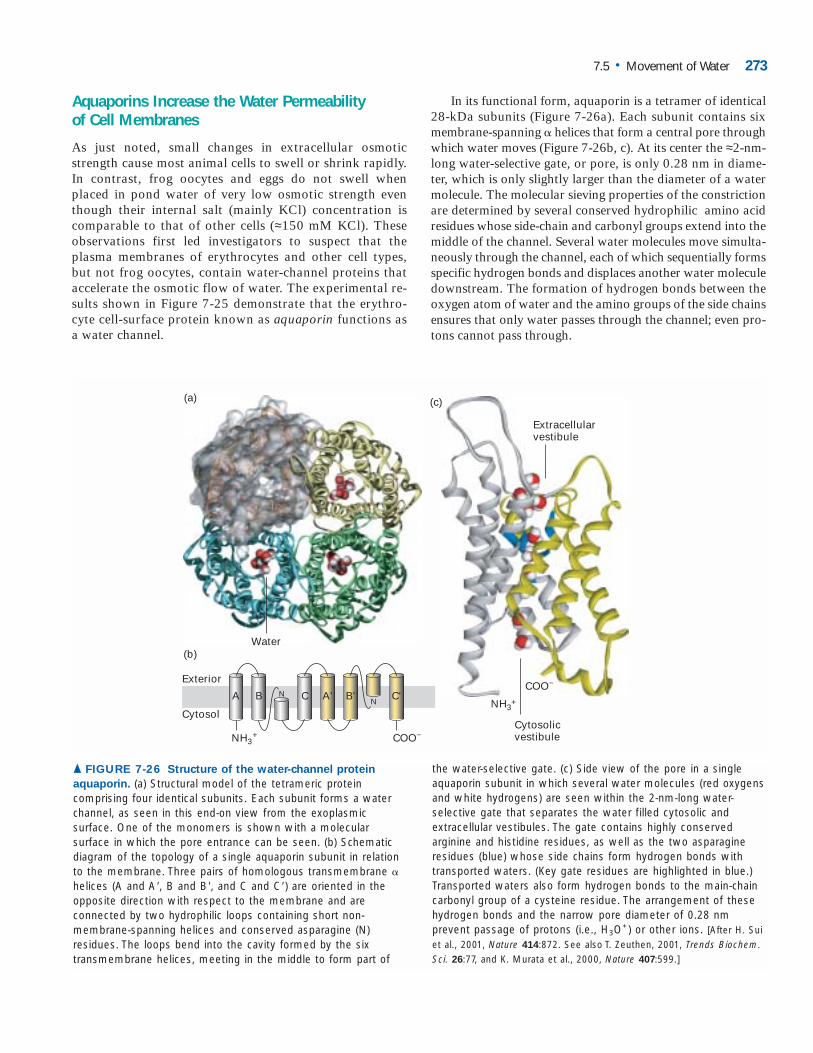
Aquaporins Increase the Water Permeability of Cell Membranes
As just noted, small changes in extracellular osmotic strength cause most animal cells to swell or shrink rapidly. In contrast, frog oocytes and eggs do not swell when placed in pond water of very low osmotic strength even though their internal salt (mainly KCl) concentration is comparable to that of other cells (≈150 mM KCl). These observations first led investigators to suspect that the plasma membranes of erythrocytes and other cell types, but not frog oocytes, contain water-channel proteins that accelerate the osmotic flow of water. The experimental re-sults shown in Figure 7-25 demonstrate that the erythro-cyte cell-surface protein known as aquaporin functions as a water channel.
In its functional form, aquaporin is a tetramer of identical28-kDa subunits (Figure 7-26a). Each subunit contains sixmembrane-spanning � helices that form a central pore throughwhich water moves (Figure 7-26b, c). At its center the ≈2-nm-long water-selective gate, or pore, is only 0.28 nm in diame-ter, which is only slightly larger than the diameter of a watermolecule. The molecular sieving properties of the constrictionare determined by several conserved hydrophilic amino acidresidues whose side-chain and carbonyl groups extend into themiddle of the channel. Several water molecules move simulta-neously through the channel, each of which sequentially formsspecific hydrogen bonds and displaces another water moleculedownstream. The formation of hydrogen bonds between theoxygen atom of water and the amino groups of the side chainsensures that only water passes through the channel; even pro-tons cannot pass through.
7.5 • Movement of Water 273
NH3+ COO−
A
Exterior
Cytosol
(a)
(b)
(c)
Extracellularvestibule
Cytosolicvestibule
NH3+
A B N C A' B' C'N
Water
COO−
▲ FIGURE 7-26 Structure of the water-channel protein
aquaporin. (a) Structural model of the tetrameric protein comprising four identical subunits. Each subunit forms a waterchannel, as seen in this end-on view from the exoplasmic surface. One of the monomers is shown with a molecular surface in which the pore entrance can be seen. (b) Schematicdiagram of the topology of a single aquaporin subunit in relationto the membrane. Three pairs of homologous transmembrane �helices (A and A', B and B', and C and C') are oriented in the opposite direction with respect to the membrane and are connected by two hydrophilic loops containing short non-membrane-spanning helices and conserved asparagine (N)residues. The loops bend into the cavity formed by the six transmembrane helices, meeting in the middle to form part of
the water-selective gate. (c) Side view of the pore in a singleaquaporin subunit in which several water molecules (red oxygensand white hydrogens) are seen within the 2-nm-long water-selective gate that separates the water filled cytosolic and extracellular vestibules. The gate contains highly conserved arginine and histidine residues, as well as the two asparagineresidues (blue) whose side chains form hydrogen bonds withtransported waters. (Key gate residues are highlighted in blue.)Transported waters also form hydrogen bonds to the main-chaincarbonyl group of a cysteine residue. The arrangement of thesehydrogen bonds and the narrow pore diameter of 0.28 nm prevent passage of protons (i.e., H3O+) or other ions. [After H. Sui et al., 2001, Nature 414:872. See also T. Zeuthen, 2001, Trends Biochem.Sci. 26:77, and K. Murata et al., 2000, Nature 407:599.]
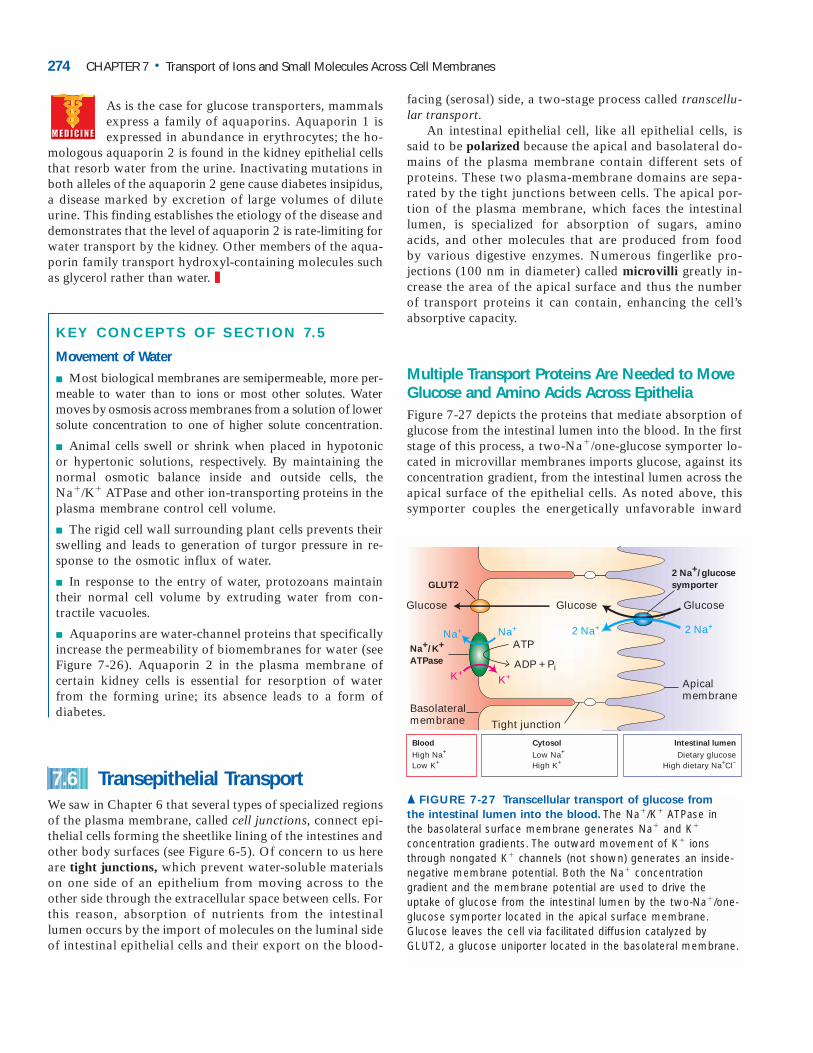
As is the case for glucose transporters, mammalsexpress a family of aquaporins. Aquaporin 1 isexpressed in abundance in erythrocytes; the ho-
mologous aquaporin 2 is found in the kidney epithelial cellsthat resorb water from the urine. Inactivating mutations inboth alleles of the aquaporin 2 gene cause diabetes insipidus,a disease marked by excretion of large volumes of diluteurine. This finding establishes the etiology of the disease anddemonstrates that the level of aquaporin 2 is rate-limiting forwater transport by the kidney. Other members of the aqua-porin family transport hydroxyl-containing molecules suchas glycerol rather than water. ❚
KEY CONCEPTS OF SECTION 7.5
Movement of Water
■ Most biological membranes are semipermeable, more per-meable to water than to ions or most other solutes. Watermoves by osmosis across membranes from a solution of lowersolute concentration to one of higher solute concentration.
■ Animal cells swell or shrink when placed in hypotonicor hypertonic solutions, respectively. By maintaining thenormal osmotic balance inside and outside cells, theNa�/K� ATPase and other ion-transporting proteins in theplasma membrane control cell volume.
■ The rigid cell wall surrounding plant cells prevents theirswelling and leads to generation of turgor pressure in re-sponse to the osmotic influx of water.
■ In response to the entry of water, protozoans maintaintheir normal cell volume by extruding water from con-tractile vacuoles.
■ Aquaporins are water-channel proteins that specificallyincrease the permeability of biomembranes for water (seeFigure 7-26). Aquaporin 2 in the plasma membrane ofcertain kidney cells is essential for resorption of waterfrom the forming urine; its absence leads to a form of diabetes.
Transepithelial TransportWe saw in Chapter 6 that several types of specialized regionsof the plasma membrane, called cell junctions, connect epi-thelial cells forming the sheetlike lining of the intestines andother body surfaces (see Figure 6-5). Of concern to us hereare tight junctions, which prevent water-soluble materialson one side of an epithelium from moving across to theother side through the extracellular space between cells. Forthis reason, absorption of nutrients from the intestinallumen occurs by the import of molecules on the luminal sideof intestinal epithelial cells and their export on the blood-
7.6
facing (serosal) side, a two-stage process called transcellu-lar transport.
An intestinal epithelial cell, like all epithelial cells, is said to be polarized because the apical and basolateral do-mains of the plasma membrane contain different sets of proteins. These two plasma-membrane domains are sepa-rated by the tight junctions between cells. The apical por-tion of the plasma membrane, which faces the intestinal lumen, is specialized for absorption of sugars, amino acids, and other molecules that are produced from food by various digestive enzymes. Numerous fingerlike pro-jections (100 nm in diameter) called microvilli greatly in-crease the area of the apical surface and thus the number of transport proteins it can contain, enhancing the cell’s absorptive capacity.
Multiple Transport Proteins Are Needed to MoveGlucose and Amino Acids Across EpitheliaFigure 7-27 depicts the proteins that mediate absorption ofglucose from the intestinal lumen into the blood. In the firststage of this process, a two-Na�/one-glucose symporter lo-cated in microvillar membranes imports glucose, against itsconcentration gradient, from the intestinal lumen across theapical surface of the epithelial cells. As noted above, thissymporter couples the energetically unfavorable inward
274 CHAPTER 7 • Transport of Ions and Small Molecules Across Cell Membranes
Apical membrane
2 Na+/glucose
symporter
Dietary glucoseHigh dietary Na+Cl−
Basolateral membrane
High Na+
Low K+
Blood Intestinal lumen
Low Na+
High K+
Cytosol
Glucose
2 Na+
Glucose
Tight junction
Glucose
ADP + Pi
ATPNa+ Na+
K+K+
2 Na+
Na+/K+
ATPase
GLUT2
▲ FIGURE 7-27 Transcellular transport of glucose from
the intestinal lumen into the blood. The Na�/K� ATPase in the basolateral surface membrane generates Na� and K�
concentration gradients. The outward movement of K� ionsthrough nongated K� channels (not shown) generates an inside-negative membrane potential. Both the Na� concentration gradient and the membrane potential are used to drive the uptake of glucose from the intestinal lumen by the two-Na�/one-glucose symporter located in the apical surface membrane. Glucose leaves the cell via facilitated diffusion catalyzed byGLUT2, a glucose uniporter located in the basolateral membrane.
movement of one glucose molecule to the energetically fa-vorable inward transport of two Na� ions (see Figure 7-21).In the steady state, all the Na� ions transported from the in-testinal lumen into the cell during Na�/glucose symport, orthe similar process of Na�/amino acid symport, are pumpedout across the basolateral membrane, which faces the under-lying tissue. Thus the low intracellular Na� concentration ismaintained. The Na�/K� ATPase that accomplishes this isfound exclusively in the basolateral membrane of intestinalepithelial cells. The coordinated operation of these twotransport proteins allows uphill movement of glucose andamino acids from the intestine into the cell. This first stage intranscellular transport ultimately is powered by ATP hydrol-ysis by the Na�/K� ATPase.
In the second stage, glucose and amino acids concen-trated inside intestinal cells by symporters are exporteddown their concentration gradients into the blood via uni-port proteins in the basolateral membrane. In the case of glu-cose, this movement is mediated by GLUT2 (see Figure7-27). As noted earlier, this GLUT isoform has a relativelylow affinity for glucose but increases its rate of transportsubstantially when the glucose gradient across the membranerises (see Figure 7-3).
The net result of this two-stage process is movement ofNa� ions, glucose, and amino acids from the intestinallumen across the intestinal epithelium into the extracellularmedium that surrounds the basolateral surface of intestinalepithelial cells. Tight junctions between the epithelial cellsprevent these molecules from diffusing back into the intes-tinal lumen, and eventually they move into the blood. The in-creased osmotic pressure created by transcellular transportof salt, glucose, and amino acids across the intestinal epithe-lium draws water from the intestinal lumen into the extra-cellular medium that surrounds the basolateral surface. In asense, salts, glucose, and amino acids “carry” the wateralong with them.
Simple Rehydration Therapy Depends on the Osmotic Gradient Created by Absorption of Glucose and Na�
An understanding of osmosis and the intestinalabsorption of salt and glucose forms the basis fora simple therapy that saves millions of lives each
year, particularly in less-developed countries. In these coun-tries, cholera and other intestinal pathogens are majorcauses of death of young children. A toxin released by thebacteria activates chloride secretion by the intestinal ep-ithelial cells into the lumen; water follows osmotically, andthe resultant massive loss of water causes diarrhea, dehy-dration, and ultimately death. A cure demands not onlykilling the bacteria with antibiotics, but also rehydration—replacement of the water that is lost from the blood andother tissues.
Simply drinking water does not help, because it is ex-creted from the gastrointestinal tract almost as soon as it en-ters. However, as we have just learned, the coordinatedtransport of glucose and Na� across the intestinal epitheliumcreates a transepithelial osmotic gradient, forcing movementof water from the intestinal lumen across the cell layer. Thus,giving affected children a solution of sugar and salt to drink(but not sugar or salt alone) causes the osmotic flow of waterinto the blood from the intestinal lumen and leads to rehy-dration. Similar sugar/salt solutions are the basis of populardrinks used by athletes to get sugar as well as water into thebody quickly and efficiently. ❚
Parietal Cells Acidify the Stomach Contents While Maintaining a Neutral Cytosolic pHThe mammalian stomach contains a 0.1 M solution of hy-drochloric acid (HCl). This strongly acidic medium killsmany ingested pathogens and denatures many ingested pro-teins before they are degraded by proteolytic enzymes (e.g.,pepsin) that function at acidic pH. Hydrochloric acid is se-creted into the stomach by specialized epithelial cells calledparietal cells (also known as oxyntic cells) in the gastric lin-ing. These cells contain a H�/K� ATPase in their apicalmembrane, which faces the stomach lumen and generates amillionfold H� concentration gradient: pH � 1.0 in thestomach lumen versus pH � 7.0 in the cell cytosol. Thistransport protein is a P-class ATP-powered ion pump simi-lar in structure and function to the plasma-membraneNa�/K� ATPase discussed earlier. The numerous mitochon-dria in parietal cells produce abundant ATP for use by theH�/K� ATPase.
If parietal cells simply exported H� ions in exchange forK� ions, the loss of protons would lead to a rise in the con-centration of OH� ions in the cytosol and thus a marked in-crease in cytosolic pH. (Recall that [H�] � [OH�] always isa constant, 10�14 M2.) Parietal cells avoid this rise in cy-tosolic pH in conjunction with acidification of the stomachlumen by using Cl�/ antiporters in the basolateralmembrane to export the “excess” OH� ions in the cytosolinto the blood. As noted earlier, this anion antiporter is acti-vated at high cytosolic pH (see Figure 7-22).
The overall process by which parietal cells acidify thestomach lumen is illustrated in Figure 7-28. In a reaction cat-alyzed by carbonic anhydrase the “excess” cytosolic OH�
combines with CO2 that diffuses in from the blood, forming. Catalyzed by the basolateral anion antiporter, this
bicarbonate ion is exported across the basolateral membrane(and ultimately into the blood) in exchange for a Cl� ion.The Cl� ions then exit through Cl� channels in the apicalmembrane, entering the stomach lumen. To preserve elec-troneutrality, each Cl� ion that moves into the stomachlumen across the apical membrane is accompanied by a K�
ion that moves outward through a separate K� channel. Inthis way, the excess K� ions pumped inward by the H�/K�
HCO3�
HCO3�
7.6 • Transepithelial Transport 275
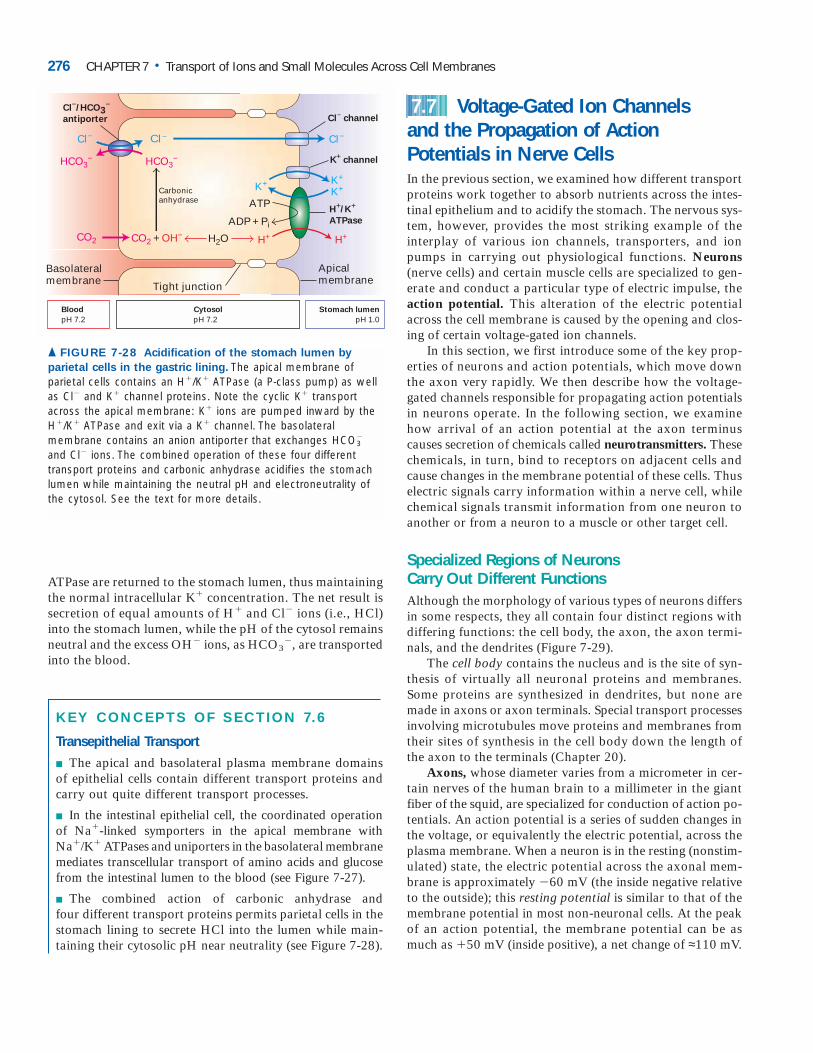
ATPase are returned to the stomach lumen, thus maintainingthe normal intracellular K� concentration. The net result issecretion of equal amounts of H� and Cl� ions (i.e., HCl)into the stomach lumen, while the pH of the cytosol remainsneutral and the excess OH� ions, as HCO3
�, are transportedinto the blood.
KEY CONCEPTS OF SECTION 7.6
Transepithelial Transport
■ The apical and basolateral plasma membrane domainsof epithelial cells contain different transport proteins andcarry out quite different transport processes.
■ In the intestinal epithelial cell, the coordinated operationof Na�-linked symporters in the apical membrane withNa�/K� ATPases and uniporters in the basolateral membranemediates transcellular transport of amino acids and glucosefrom the intestinal lumen to the blood (see Figure 7-27).
■ The combined action of carbonic anhydrase and four different transport proteins permits parietal cells in thestomach lining to secrete HCl into the lumen while main-taining their cytosolic pH near neutrality (see Figure 7-28).
Voltage-Gated Ion Channels and the Propagation of ActionPotentials in Nerve CellsIn the previous section, we examined how different transportproteins work together to absorb nutrients across the intes-tinal epithelium and to acidify the stomach. The nervous sys-tem, however, provides the most striking example of theinterplay of various ion channels, transporters, and ionpumps in carrying out physiological functions. Neurons(nerve cells) and certain muscle cells are specialized to gen-erate and conduct a particular type of electric impulse, theaction potential. This alteration of the electric potentialacross the cell membrane is caused by the opening and clos-ing of certain voltage-gated ion channels.
In this section, we first introduce some of the key prop-erties of neurons and action potentials, which move downthe axon very rapidly. We then describe how the voltage-gated channels responsible for propagating action potentialsin neurons operate. In the following section, we examinehow arrival of an action potential at the axon terminuscauses secretion of chemicals called neurotransmitters. Thesechemicals, in turn, bind to receptors on adjacent cells andcause changes in the membrane potential of these cells. Thuselectric signals carry information within a nerve cell, whilechemical signals transmit information from one neuron toanother or from a neuron to a muscle or other target cell.
Specialized Regions of Neurons Carry Out Different FunctionsAlthough the morphology of various types of neurons differsin some respects, they all contain four distinct regions withdiffering functions: the cell body, the axon, the axon termi-nals, and the dendrites (Figure 7-29).
The cell body contains the nucleus and is the site of syn-thesis of virtually all neuronal proteins and membranes.Some proteins are synthesized in dendrites, but none aremade in axons or axon terminals. Special transport processesinvolving microtubules move proteins and membranes fromtheir sites of synthesis in the cell body down the length ofthe axon to the terminals (Chapter 20).
Axons, whose diameter varies from a micrometer in cer-tain nerves of the human brain to a millimeter in the giantfiber of the squid, are specialized for conduction of action po-tentials. An action potential is a series of sudden changes inthe voltage, or equivalently the electric potential, across theplasma membrane. When a neuron is in the resting (nonstim-ulated) state, the electric potential across the axonal mem-brane is approximately �60 mV (the inside negative relativeto the outside); this resting potential is similar to that of themembrane potential in most non-neuronal cells. At the peakof an action potential, the membrane potential can be asmuch as �50 mV (inside positive), a net change of ≈110 mV.
7.7
276 CHAPTER 7 • Transport of Ions and Small Molecules Across Cell Membranes
Apical membrane
pH 1.0
Basolateral membrane
pH 7.2Blood Stomach lumenCytosol
pH 7.2
Cl− channel
K+ channel
H+/K+
ATPase
Cl−/HCO3−
antiporter
HCO3−HCO3
−
Cl− Cl− Cl−
CO2 CO2 + OH− H2O H+
K+ K+
K+Carbonicanhydrase
H+
ADP + Pi
ATP
Tight junction
▲ FIGURE 7-28 Acidification of the stomach lumen by
parietal cells in the gastric lining. The apical membrane of parietal cells contains an H�/K� ATPase (a P-class pump) as wellas Cl� and K� channel proteins. Note the cyclic K� transportacross the apical membrane: K� ions are pumped inward by theH�/K� ATPase and exit via a K� channel. The basolateral membrane contains an anion antiporter that exchanges HCO3
�
and Cl� ions. The combined operation of these four differenttransport proteins and carbonic anhydrase acidifies the stomachlumen while maintaining the neutral pH and electroneutrality ofthe cytosol. See the text for more details.
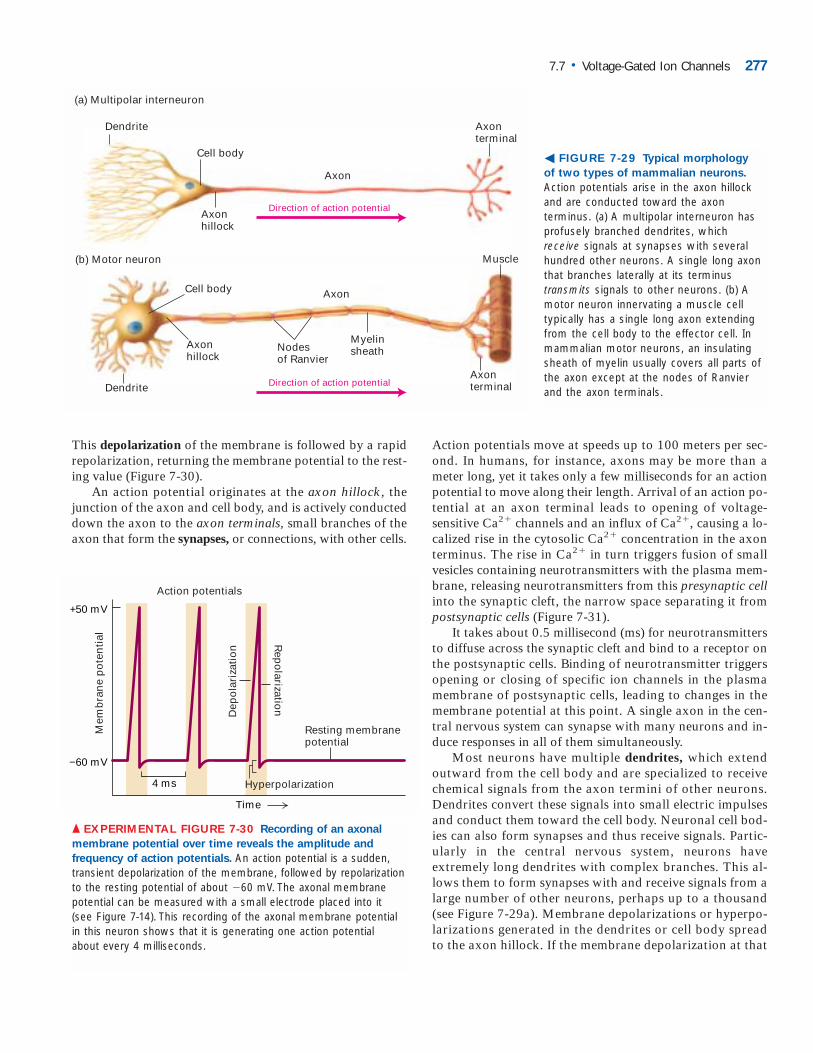
This depolarization of the membrane is followed by a rapidrepolarization, returning the membrane potential to the rest-ing value (Figure 7-30).
An action potential originates at the axon hillock, thejunction of the axon and cell body, and is actively conducteddown the axon to the axon terminals, small branches of theaxon that form the synapses, or connections, with other cells.
Action potentials move at speeds up to 100 meters per sec-ond. In humans, for instance, axons may be more than ameter long, yet it takes only a few milliseconds for an actionpotential to move along their length. Arrival of an action po-tential at an axon terminal leads to opening of voltage-sensitive Ca2� channels and an influx of Ca2�, causing a lo-calized rise in the cytosolic Ca2� concentration in the axonterminus. The rise in Ca2� in turn triggers fusion of smallvesicles containing neurotransmitters with the plasma mem-brane, releasing neurotransmitters from this presynaptic cellinto the synaptic cleft, the narrow space separating it frompostsynaptic cells (Figure 7-31).
It takes about 0.5 millisecond (ms) for neurotransmittersto diffuse across the synaptic cleft and bind to a receptor onthe postsynaptic cells. Binding of neurotransmitter triggersopening or closing of specific ion channels in the plasmamembrane of postsynaptic cells, leading to changes in themembrane potential at this point. A single axon in the cen-tral nervous system can synapse with many neurons and in-duce responses in all of them simultaneously.
Most neurons have multiple dendrites, which extendoutward from the cell body and are specialized to receivechemical signals from the axon termini of other neurons.Dendrites convert these signals into small electric impulsesand conduct them toward the cell body. Neuronal cell bod-ies can also form synapses and thus receive signals. Partic-ularly in the central nervous system, neurons haveextremely long dendrites with complex branches. This al-lows them to form synapses with and receive signals from alarge number of other neurons, perhaps up to a thousand(see Figure 7-29a). Membrane depolarizations or hyperpo-larizations generated in the dendrites or cell body spreadto the axon hillock. If the membrane depolarization at that
7.7 • Voltage-Gated Ion Channels 277
(a) Multipolar interneuron
Dendrite
Cell body
Axon
Axonterminal
Axonhillock
(b) Motor neuron
Nodes of Ranvier
Myelinsheath
Muscle
Cell body
Dendrite
Axon
AxonterminalDirection of action potential
Direction of action potential
Axonhillock
� FIGURE 7-29 Typical morphology
of two types of mammalian neurons.
Action potentials arise in the axon hillockand are conducted toward the axon terminus. (a) A multipolar interneuron hasprofusely branched dendrites, which receive signals at synapses with severalhundred other neurons. A single long axonthat branches laterally at its terminustransmits signals to other neurons. (b) Amotor neuron innervating a muscle celltypically has a single long axon extendingfrom the cell body to the effector cell. Inmammalian motor neurons, an insulatingsheath of myelin usually covers all parts ofthe axon except at the nodes of Ranvierand the axon terminals.
+50 mV
−60 mV
Time
4 ms
Mem
bra
ne
po
ten
tial
Resting membrane potential
Action potentials
Dep
ola
riza
tio
n
Rep
olarizatio
n
Hyperpolarization
▲ EXPERIMENTAL FIGURE 7-30 Recording of an axonal
membrane potential over time reveals the amplitude and
frequency of action potentials. An action potential is a sudden,transient depolarization of the membrane, followed by repolarizationto the resting potential of about �60 mV. The axonal membrane potential can be measured with a small electrode placed into it (see Figure 7-14). This recording of the axonal membrane potentialin this neuron shows that it is generating one action potential about every 4 milliseconds.
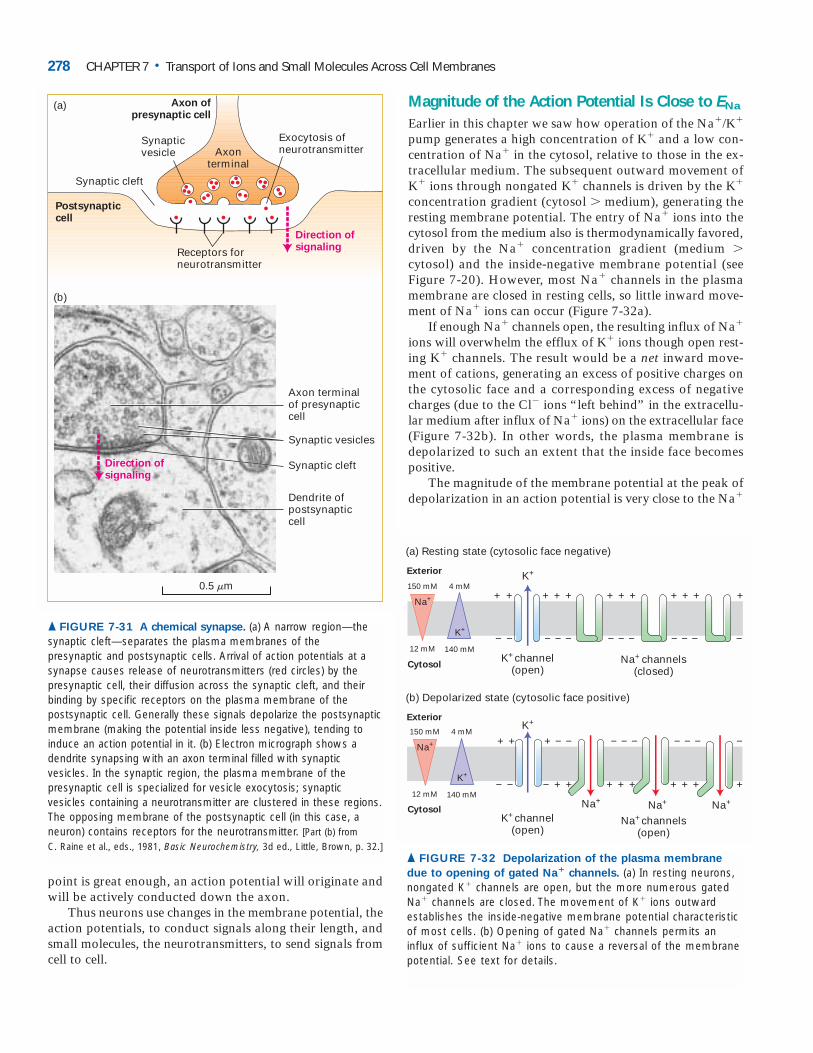
point is great enough, an action potential will originate andwill be actively conducted down the axon.
Thus neurons use changes in the membrane potential, theaction potentials, to conduct signals along their length, andsmall molecules, the neurotransmitters, to send signals fromcell to cell.
Magnitude of the Action Potential Is Close to ENa
Earlier in this chapter we saw how operation of the Na�/K�
pump generates a high concentration of K� and a low con-centration of Na� in the cytosol, relative to those in the ex-tracellular medium. The subsequent outward movement ofK� ions through nongated K� channels is driven by the K�
concentration gradient (cytosol medium), generating theresting membrane potential. The entry of Na� ions into thecytosol from the medium also is thermodynamically favored,driven by the Na� concentration gradient (medium cytosol) and the inside-negative membrane potential (see Figure 7-20). However, most Na� channels in the plasmamembrane are closed in resting cells, so little inward move-ment of Na� ions can occur (Figure 7-32a).
If enough Na� channels open, the resulting influx of Na�
ions will overwhelm the efflux of K� ions though open rest-ing K� channels. The result would be a net inward move-ment of cations, generating an excess of positive charges onthe cytosolic face and a corresponding excess of negativecharges (due to the Cl� ions “left behind” in the extracellu-lar medium after influx of Na� ions) on the extracellular face(Figure 7-32b). In other words, the plasma membrane isdepolarized to such an extent that the inside face becomespositive.
The magnitude of the membrane potential at the peak ofdepolarization in an action potential is very close to the Na�
278 CHAPTER 7 • Transport of Ions and Small Molecules Across Cell Membranes
Exocytosis ofneurotransmitter
Axon ofpresynaptic cell
Axonterminal
Synapticvesicle
Synaptic cleft
Postsynaptic cell
Receptors forneurotransmitter
(a)
Direction ofsignaling
Dendrite ofpostsynapticcell
Synaptic cleft
Synaptic vesicles
Axon terminalof presynapticcell
0.5 m
(b)
Direction ofsignaling
▲ FIGURE 7-31 A chemical synapse. (a) A narrow region—thesynaptic cleft—separates the plasma membranes of the presynaptic and postsynaptic cells. Arrival of action potentials at asynapse causes release of neurotransmitters (red circles) by thepresynaptic cell, their diffusion across the synaptic cleft, and theirbinding by specific receptors on the plasma membrane of the postsynaptic cell. Generally these signals depolarize the postsynapticmembrane (making the potential inside less negative), tending to induce an action potential in it. (b) Electron micrograph shows a dendrite synapsing with an axon terminal filled with synaptic vesicles. In the synaptic region, the plasma membrane of the presynaptic cell is specialized for vesicle exocytosis; synaptic vesicles containing a neurotransmitter are clustered in these regions.The opposing membrane of the postsynaptic cell (in this case, aneuron) contains receptors for the neurotransmitter. [Part (b) from C. Raine et al., eds., 1981, Basic Neurochemistry, 3d ed., Little, Brown, p. 32.]
K+ channel(open)
Exterior
Cytosol
Na+
150 mM
12 mM
K+
140 mM
4 mMK+
Na+ channels(closed)
K+ channel(open)
Na+
150 mM
12 mM
K+
140 mM
4 mMK+
Na+ channels(open)
Na+Na+ Na+
+ + + + + + + + + + + +
− − − − − − − − − − − −
− − − + + + + + + + + +
+ + + − − − − − − − − −
(a) Resting state (cytosolic face negative)
(b) Depolarized state (cytosolic face positive)
Exterior
Cytosol
▲ FIGURE 7-32 Depolarization of the plasma membrane
due to opening of gated Na� channels. (a) In resting neurons,nongated K� channels are open, but the more numerous gatedNa� channels are closed. The movement of K� ions outward establishes the inside-negative membrane potential characteristicof most cells. (b) Opening of gated Na� channels permits an influx of sufficient Na� ions to cause a reversal of the membranepotential. See text for details.
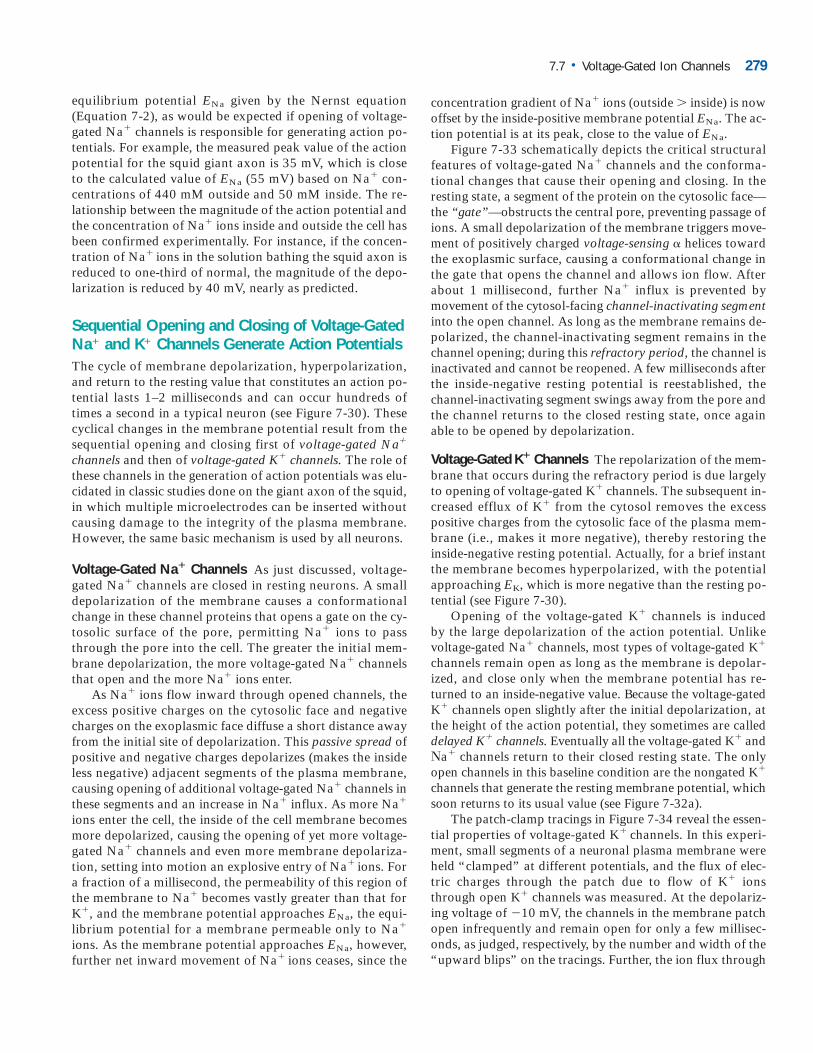
7.7 • Voltage-Gated Ion Channels 279
equilibrium potential ENa given by the Nernst equation(Equation 7-2), as would be expected if opening of voltage-gated Na� channels is responsible for generating action po-tentials. For example, the measured peak value of the actionpotential for the squid giant axon is 35 mV, which is closeto the calculated value of ENa (55 mV) based on Na� con-centrations of 440 mM outside and 50 mM inside. The re-lationship between the magnitude of the action potential andthe concentration of Na� ions inside and outside the cell hasbeen confirmed experimentally. For instance, if the concen-tration of Na� ions in the solution bathing the squid axon isreduced to one-third of normal, the magnitude of the depo-larization is reduced by 40 mV, nearly as predicted.
Sequential Opening and Closing of Voltage-GatedNa� and K� Channels Generate Action PotentialsThe cycle of membrane depolarization, hyperpolarization,and return to the resting value that constitutes an action po-tential lasts 1–2 milliseconds and can occur hundreds oftimes a second in a typical neuron (see Figure 7-30). Thesecyclical changes in the membrane potential result from thesequential opening and closing first of voltage-gated Na�
channels and then of voltage-gated K� channels. The role ofthese channels in the generation of action potentials was elu-cidated in classic studies done on the giant axon of the squid,in which multiple microelectrodes can be inserted withoutcausing damage to the integrity of the plasma membrane.However, the same basic mechanism is used by all neurons.
Voltage-Gated Na� Channels As just discussed, voltage-gated Na� channels are closed in resting neurons. A smalldepolarization of the membrane causes a conformationalchange in these channel proteins that opens a gate on the cy-tosolic surface of the pore, permitting Na� ions to passthrough the pore into the cell. The greater the initial mem-brane depolarization, the more voltage-gated Na� channelsthat open and the more Na� ions enter.
As Na� ions flow inward through opened channels, theexcess positive charges on the cytosolic face and negativecharges on the exoplasmic face diffuse a short distance awayfrom the initial site of depolarization. This passive spread ofpositive and negative charges depolarizes (makes the insideless negative) adjacent segments of the plasma membrane,causing opening of additional voltage-gated Na� channels inthese segments and an increase in Na� influx. As more Na�
ions enter the cell, the inside of the cell membrane becomesmore depolarized, causing the opening of yet more voltage-gated Na� channels and even more membrane depolariza-tion, setting into motion an explosive entry of Na� ions. Fora fraction of a millisecond, the permeability of this region ofthe membrane to Na� becomes vastly greater than that forK�, and the membrane potential approaches ENa, the equi-librium potential for a membrane permeable only to Na�
ions. As the membrane potential approaches ENa, however,further net inward movement of Na� ions ceases, since the
concentration gradient of Na� ions (outside inside) is nowoffset by the inside-positive membrane potential ENa. The ac-tion potential is at its peak, close to the value of ENa.
Figure 7-33 schematically depicts the critical structuralfeatures of voltage-gated Na� channels and the conforma-tional changes that cause their opening and closing. In theresting state, a segment of the protein on the cytosolic face—the “gate”—obstructs the central pore, preventing passage ofions. A small depolarization of the membrane triggers move-ment of positively charged voltage-sensing � helices towardthe exoplasmic surface, causing a conformational change inthe gate that opens the channel and allows ion flow. Afterabout 1 millisecond, further Na� influx is prevented bymovement of the cytosol-facing channel-inactivating segmentinto the open channel. As long as the membrane remains de-polarized, the channel-inactivating segment remains in thechannel opening; during this refractory period, the channel isinactivated and cannot be reopened. A few milliseconds afterthe inside-negative resting potential is reestablished, thechannel-inactivating segment swings away from the pore andthe channel returns to the closed resting state, once againable to be opened by depolarization.
Voltage-Gated K� Channels The repolarization of the mem-brane that occurs during the refractory period is due largelyto opening of voltage-gated K� channels. The subsequent in-creased efflux of K� from the cytosol removes the excesspositive charges from the cytosolic face of the plasma mem-brane (i.e., makes it more negative), thereby restoring theinside-negative resting potential. Actually, for a brief instantthe membrane becomes hyperpolarized, with the potentialapproaching EK, which is more negative than the resting po-tential (see Figure 7-30).
Opening of the voltage-gated K� channels is inducedby the large depolarization of the action potential. Unlikevoltage-gated Na� channels, most types of voltage-gated K�
channels remain open as long as the membrane is depolar-ized, and close only when the membrane potential has re-turned to an inside-negative value. Because the voltage-gatedK� channels open slightly after the initial depolarization, atthe height of the action potential, they sometimes are calleddelayed K� channels. Eventually all the voltage-gated K� and�a� channels return to their closed resting state. The onlyopen channels in this baseline condition are the nongated K�
channels that generate the resting membrane potential, whichsoon returns to its usual value (see Figure 7-32a).
The patch-clamp tracings in Figure 7-34 reveal the essen-tial properties of voltage-gated K� channels. In this experi-ment, small segments of a neuronal plasma membrane wereheld “clamped” at different potentials, and the flux of elec-tric charges through the patch due to flow of K� ionsthrough open K� channels was measured. At the depolariz-ing voltage of �10 mV, the channels in the membrane patchopen infrequently and remain open for only a few millisec-onds, as judged, respectively, by the number and width of the“upward blips” on the tracings. Further, the ion flux through
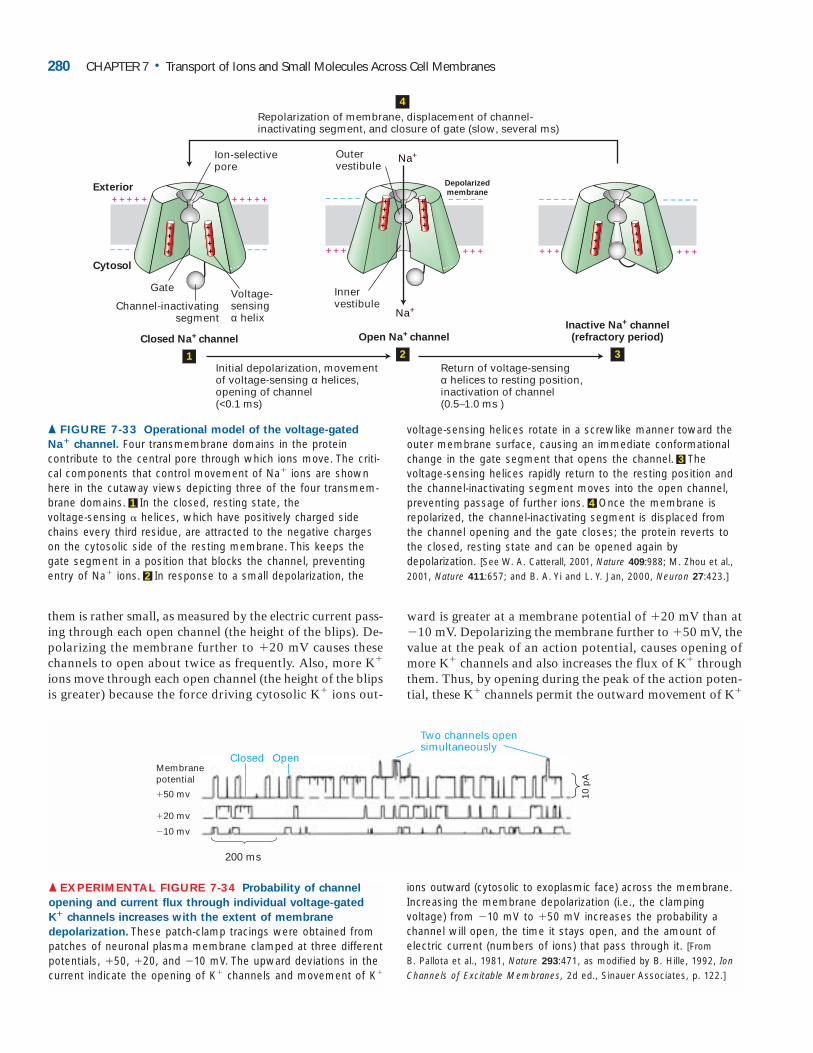
them is rather small, as measured by the electric current pass-ing through each open channel (the height of the blips). De-polarizing the membrane further to �20 mV causes thesechannels to open about twice as frequently. Also, more K�
ions move through each open channel (the height of the blipsis greater) because the force driving cytosolic K� ions out-
ward is greater at a membrane potential of �20 mV than at�10 mV. Depolarizing the membrane further to �50 mV, thevalue at the peak of an action potential, causes opening ofmore K� channels and also increases the flux of K� throughthem. Thus, by opening during the peak of the action poten-tial, these K� channels permit the outward movement of K�
280 CHAPTER 7 • Transport of Ions and Small Molecules Across Cell Membranes
− − − − −
+ + +
− − − − −
+ + +
+ + + + +
− − −
+ + + + +
− − −
− − − − −
+ + +
− − − − −
+ + +
Ion-selectivepore
Na+
Na+
Initial depolarization, movementof voltage-sensing α helices,opening of channel (<0.1 ms)
Return of voltage-sensingα helices to resting position, inactivation of channel (0.5–1.0 ms )
Exterior
Cytosol
Voltage-sensingα helix
Gate
Repolarization of membrane, displacement of channel-inactivating segment, and closure of gate (slow, several ms)
Depolarized
membrane
Channel-inactivatingsegment
Innervestibule
Outervestibule
Closed Na+ channel
1
Open Na+ channel
2
Inactive Na+ channel(refractory period)
3
++++
++++
++++
++++ +
+++
++++
4
▲ FIGURE 7-33 Operational model of the voltage-gated
Na� channel. Four transmembrane domains in the protein contribute to the central pore through which ions move. The criti-cal components that control movement of Na� ions are shownhere in the cutaway views depicting three of the four transmem-brane domains. 1 In the closed, resting state, the voltage-sensing � helices, which have positively charged sidechains every third residue, are attracted to the negative chargeson the cytosolic side of the resting membrane. This keeps thegate segment in a position that blocks the channel, preventingentry of Na� ions. 2 In response to a small depolarization, the
voltage-sensing helices rotate in a screwlike manner toward theouter membrane surface, causing an immediate conformationalchange in the gate segment that opens the channel. 3 The voltage-sensing helices rapidly return to the resting position andthe channel-inactivating segment moves into the open channel,preventing passage of further ions. 4 Once the membrane is repolarized, the channel-inactivating segment is displaced fromthe channel opening and the gate closes; the protein reverts tothe closed, resting state and can be opened again by depolarization. [See W. A. Catterall, 2001, Nature 409:988; M. Zhou et al.,2001, Nature 411:657; and B. A. Yi and L. Y. Jan, 2000, Neuron 27:423.]
OpenClosedMembranepotential
Two channels opensimultaneously
200 ms
�50 mv
�20 mv
�10 mv
10 p
A
▲ EXPERIMENTAL FIGURE 7-34 Probability of channel
opening and current flux through individual voltage-gated
K� channels increases with the extent of membrane
depolarization. These patch-clamp tracings were obtained frompatches of neuronal plasma membrane clamped at three differentpotentials, �50, �20, and �10 mV. The upward deviations in thecurrent indicate the opening of K� channels and movement of K�
ions outward (cytosolic to exoplasmic face) across the membrane.Increasing the membrane depolarization (i.e., the clamping voltage) from �10 mV to �50 mV increases the probability achannel will open, the time it stays open, and the amount ofelectric current (numbers of ions) that pass through it. [From B. Pallota et al., 1981, Nature 293:471, as modified by B. Hille, 1992, IonChannels of Excitable Membranes, 2d ed., Sinauer Associates, p. 122.]
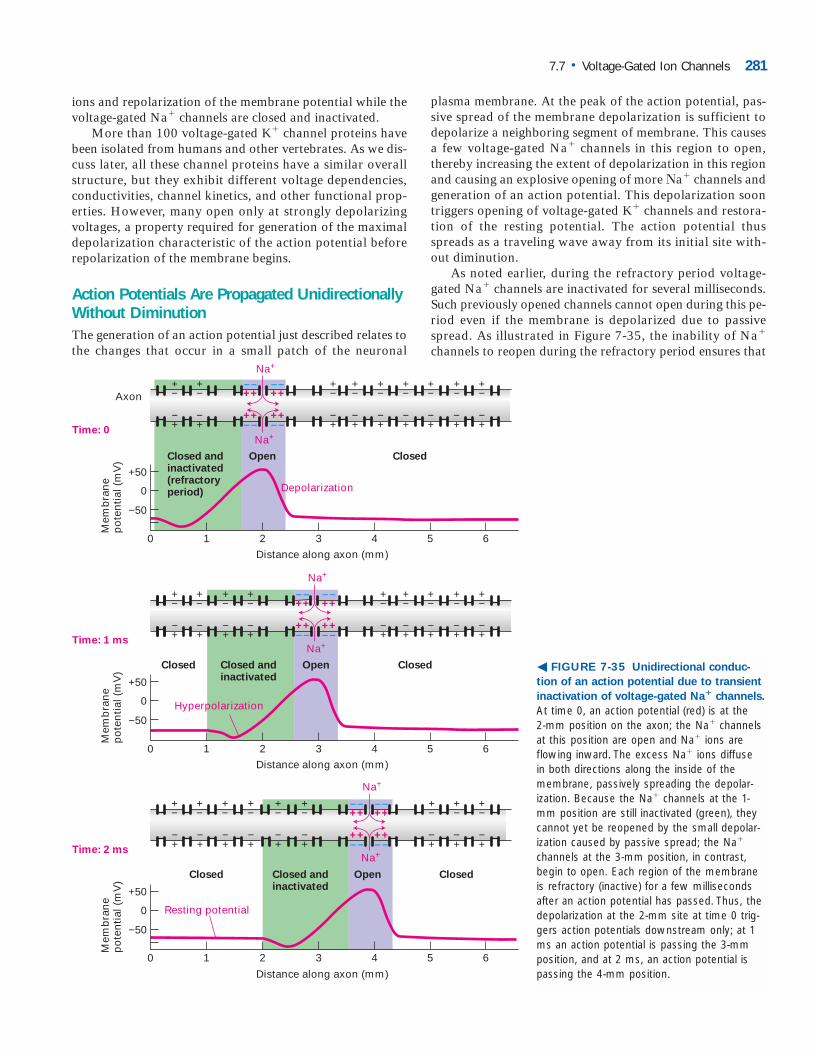
ions and repolarization of the membrane potential while thevoltage-gated Na� channels are closed and inactivated.
More than 100 voltage-gated K� channel proteins havebeen isolated from humans and other vertebrates. As we dis-cuss later, all these channel proteins have a similar overallstructure, but they exhibit different voltage dependencies,conductivities, channel kinetics, and other functional prop-erties. However, many open only at strongly depolarizingvoltages, a property required for generation of the maximaldepolarization characteristic of the action potential beforerepolarization of the membrane begins.
Action Potentials Are Propagated UnidirectionallyWithout DiminutionThe generation of an action potential just described relates tothe changes that occur in a small patch of the neuronal
plasma membrane. At the peak of the action potential, pas-sive spread of the membrane depolarization is sufficient todepolarize a neighboring segment of membrane. This causesa few voltage-gated Na� channels in this region to open,thereby increasing the extent of depolarization in this regionand causing an explosive opening of more �a� channels andgeneration of an action potential. This depolarization soontriggers opening of voltage-gated K� channels and restora-tion of the resting potential. The action potential thusspreads as a traveling wave away from its initial site with-out diminution.
As noted earlier, during the refractory period voltage-gated Na� channels are inactivated for several milliseconds.Such previously opened channels cannot open during this pe-riod even if the membrane is depolarized due to passivespread. As illustrated in Figure 7-35, the inability of Na�
channels to reopen during the refractory period ensures that
7.7 • Voltage-Gated Ion Channels 281
0 1 2 3 4 5 6
Distance along axon (mm)
+50
0
−50
Mem
bra
ne
po
ten
tial
(m
V)
Time: 0
Axon
Depolarization
Closed andinactivated(refractoryperiod)
Open Closed
Closed andinactivated
Open ClosedClosed
Distance along axon (mm)
+50
−50
Mem
bra
ne
po
ten
tial
(m
V)
Time: 1 ms
Closed andinactivated
Open ClosedClosed
Distance along axon (mm)
0 1 2 3 4 5 6
0 1 2 3 4 5 6
+50
−50
Mem
bra
ne
po
ten
tial
(m
V)
Time: 2 ms
Resting potential
0
0
Hyperpolarization
+−
–+
–+
+−
+−
+−
+−
+−
+−
+−
+−
−+
−+
−+
−+
−+
−+
−+
−+
−+
+–
+–
+−
+−
+−
+−
+−
+−
+−
+−
+−
−+
−+
−+
−+
−+
−+
−+
−+
−+
+−
+−
+−
+−
+−
+−
+−
+−
−+
−+
−+
−+
−+
−+
−+
+−
−+
−+
–+
–+
+–
+–
–+
–+
+–
+–
Na+
Na+
Na+
Na+
Na+
Na+
–+
–+
+–
+–
–+
–+
+–
+–
–+
–+
+–
+–
� FIGURE 7-35 Unidirectional conduc-
tion of an action potential due to transient
inactivation of voltage-gated Na� channels.
At time 0, an action potential (red) is at the 2-mm position on the axon; the Na� channelsat this position are open and Na� ions areflowing inward. The excess Na� ions diffusein both directions along the inside of themembrane, passively spreading the depolar-ization. Because the Na� channels at the 1-mm position are still inactivated (green), theycannot yet be reopened by the small depolar-ization caused by passive spread; the Na�
channels at the 3-mm position, in contrast,begin to open. Each region of the membraneis refractory (inactive) for a few millisecondsafter an action potential has passed. Thus, thedepolarization at the 2-mm site at time 0 trig-gers action potentials downstream only; at 1ms an action potential is passing the 3-mmposition, and at 2 ms, an action potential ispassing the 4-mm position.
action potentials are propagated only in one direction, fromthe axon hillock where they originate to the axon terminus.This property of the Na� channels also limits the number ofaction potentials per second that a neuron can conduct. Re-opening of Na� channels “upstream” of an action potential(i.e., closer to the cell body) also is delayed by the membranehyperpolarization that results from opening of voltage-gatedK� channels.
Nerve Cells Can Conduct Many Action Potentials in the Absence of ATPIt is important to note that the depolarization of the mem-brane characteristic of an action potential results from move-ment of just a small number of Na� ions into a neuron anddoes not significantly affect the intracellular Na� concentra-tion gradient. A typical nerve cell has about 10 voltage-gatedNa� channels per square micrometer (m2) of plasma mem-brane. Since each channel passes ≈5000–10,000 ions duringthe millisecond it is open (see Figure 7-18), a maximum of105 ions per m2 of plasma membrane will move inwardduring each action potential.
To assess the effect of this ion flux on the cytosolic Na�
concentration of 10 mM (0.01 mol/L), typical of a restingaxon, we focus on a segment of axon 1 micrometer (m)long and 10 m in diameter. The volume of this segment is78 m3 or 7.8 � 10–14 liters, and it contains 4.7 � 108 Na�
ions: (10�2 mol/L) (7.8 � 10–14 L) (6 � 1023 Na�/mol). Thesurface area of this segment of the axon is 31 m2, and dur-ing passage of one action potential, 105 Na� ions will enterper m2 of membrane. Thus this Na� influx increases thenumber of Na� ions in this segment by only one part inabout 150: (4.7 � 108) � (3.1 � 106). Likewise, the repo-larization of the membrane due to the efflux of K� ionsthrough voltage-gated K� channels does not significantlychange the intracellular K� concentration.
Because so few Na� and K� ions move across the plasma membrane during each action potential, the Na�/K� pump that maintains the usual ion gradients plays no direct role in impulse conduction. When this pump is experimentally inhibited by dinitrophenol or another in-hibitor of ATP production, the concentrations of Na� and K� gradually become the same inside and outside the cell, and the membrane potential falls to zero. This elimination of the usual Na� and K� electrochemical gradients occurs extremely slowly in large squid neurons but takes about 5 minutes in smaller mammalian neurons. In either case, the electrochemical gradients are essentially independent of the supply of ATP over the short time spans required for nerve cells to generate and conduct action potentials. Since the ion movements during each action potential involve only a minute fraction of the cell’s K� and Na� ions, a nerve cell can fire hundreds or even thousands of times in the absence of ATP.
All Voltage-Gated Ion Channels Have Similar StructuresHaving explained how the action potential is dependent onregulated opening and closing of voltage-gated channels, weturn to a molecular dissection of these remarkable proteins.After describing the basic structure of these channels, wefocus on three questions:
■ How do these proteins sense changes in membrane potential?
■ How is this change transduced into opening of thechannel?
■ What causes these channels to become inactivatedshortly after opening?
The initial breakthrough in understanding voltage-gatedion channels came from analysis of fruit flies (Drosophilamelanogaster) carrying the shaker mutation. These fliesshake vigorously under ether anesthesia, reflecting a loss ofmotor control and a defect in certain motor neurons thathave an abnormally prolonged action potential. This pheno-type suggested that the shaker mutation causes a defect involtage-gated K� channels that prevents them from openingnormally immediately upon depolarization. To show that thewild-type shaker gene encoded a K� channel, cloned wild-type shaker cDNA was used as a template to produce shakermRNA in a cell-free system. Expression of this mRNA infrog oocytes and patch-clamp measurements on the newlysynthesized channel protein showed that its functional prop-erties were identical to those of the voltage-gated K� channelin the neuronal membrane, demonstrating conclusively thatthe shaker gene encodes this K�-channel protein.
The Shaker K� channel and most other voltage-gated K�
channels that have been identified are tetrameric proteinscomposed of four identical subunits arranged in the mem-brane around a central pore. Each subunit is constructed ofsix membrane-spanning � helixes, designated S1–S6, and aP segment (Figure 7-36a). The S5 and S6 helices and the Psegment are structurally and functionally homologous tothose in the nongated resting K� channel discussed earlier(see Figure 7-15). The S4 helix, which contains numerouspositively charged lysine and arginine residues, acts as a volt-age sensor; the N-terminal “ball” extending into the cytosolfrom S1 is the channel-inactivating segment.
Voltage-gated Na� channels and Ca2� channels are monomeric proteins organized into four homologous do-mains, I–IV (Figure 7-36b). Each of these domains is similar to a subunit of a voltage-gated K� channel. However, in contrast to voltage-gated K� channels, which have four channel-inactivating segments, the monomeric voltage-gated channels have a single channel-inactivating segment. Except for this minor structural difference and their varying ion permeabilities, all voltage-gated ion channels are thought to function in a sim-ilar manner and to have evolved from a monomeric ancestral channel protein that contained six transmembrane � helices.
282 CHAPTER 7 • Transport of Ions and Small Molecules Across Cell Membranes
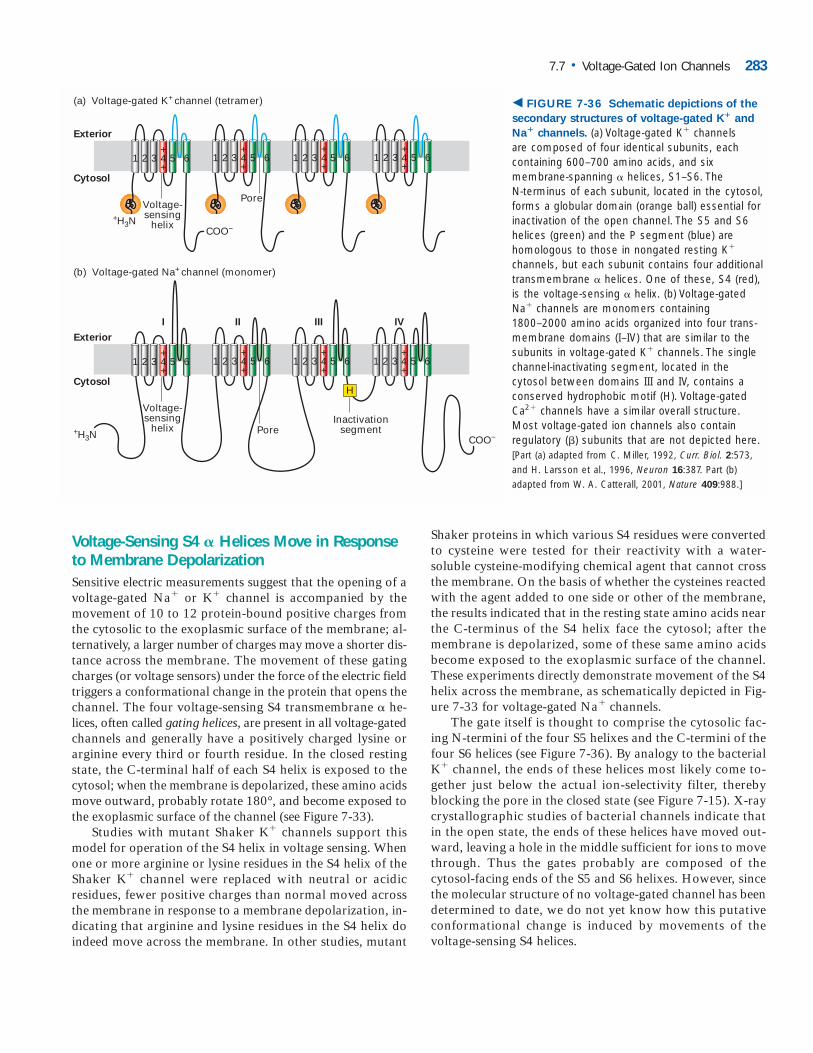
Voltage-Sensing S4 � Helices Move in Responseto Membrane DepolarizationSensitive electric measurements suggest that the opening of avoltage-gated Na� or K� channel is accompanied by themovement of 10 to 12 protein-bound positive charges fromthe cytosolic to the exoplasmic surface of the membrane; al-ternatively, a larger number of charges may move a shorter dis-tance across the membrane. The movement of these gatingcharges (or voltage sensors) under the force of the electric fieldtriggers a conformational change in the protein that opens thechannel. The four voltage-sensing S4 transmembrane � he-lices, often called gating helices, are present in all voltage-gatedchannels and generally have a positively charged lysine orarginine every third or fourth residue. In the closed restingstate, the C-terminal half of each S4 helix is exposed to thecytosol; when the membrane is depolarized, these amino acidsmove outward, probably rotate 180°, and become exposed tothe exoplasmic surface of the channel (see Figure 7-33).
Studies with mutant Shaker K� channels support thismodel for operation of the S4 helix in voltage sensing. Whenone or more arginine or lysine residues in the S4 helix of theShaker K� channel were replaced with neutral or acidicresidues, fewer positive charges than normal moved acrossthe membrane in response to a membrane depolarization, in-dicating that arginine and lysine residues in the S4 helix doindeed move across the membrane. In other studies, mutant
Shaker proteins in which various S4 residues were convertedto cysteine were tested for their reactivity with a water-soluble cysteine-modifying chemical agent that cannot crossthe membrane. On the basis of whether the cysteines reactedwith the agent added to one side or other of the membrane,the results indicated that in the resting state amino acids nearthe C-terminus of the S4 helix face the cytosol; after themembrane is depolarized, some of these same amino acidsbecome exposed to the exoplasmic surface of the channel.These experiments directly demonstrate movement of the S4helix across the membrane, as schematically depicted in Fig-ure 7-33 for voltage-gated Na� channels.
The gate itself is thought to comprise the cytosolic fac-ing N-termini of the four S5 helixes and the C-termini of thefour S6 helices (see Figure 7-36). By analogy to the bacterialK� channel, the ends of these helices most likely come to-gether just below the actual ion-selectivity filter, therebyblocking the pore in the closed state (see Figure 7-15). X-raycrystallographic studies of bacterial channels indicate thatin the open state, the ends of these helices have moved out-ward, leaving a hole in the middle sufficient for ions to movethrough. Thus the gates probably are composed of thecytosol-facing ends of the S5 and S6 helixes. However, sincethe molecular structure of no voltage-gated channel has beendetermined to date, we do not yet know how this putativeconformational change is induced by movements of the voltage-sensing S4 helices.
7.7 • Voltage-Gated Ion Channels 283
Exterior
Cytosol
(a) Voltage-gated K+ channel (tetramer)
1+4+
52 3 6
(b) Voltage-gated Na+ channel (monomer)
+H3N
+H3N
COO−
I II III IV
Exterior
Cytosol
1+4+
52 3 6
COO−
1+4+
52 3 6 1+4+
52 3 6 1+4+
52 3 6
1+4+
52 3 6 1+4+
52 3 6 1+4+
52 3 6
Inactivationsegment
Voltage-sensing
helix
Voltage-sensing
helix
Pore
Pore
H
� FIGURE 7-36 Schematic depictions of the
secondary structures of voltage-gated K� and
Na� channels. (a) Voltage-gated K� channels are composed of four identical subunits, each containing 600–700 amino acids, and six membrane-spanning � helices, S1–S6. The N-terminus of each subunit, located in the cytosol,forms a globular domain (orange ball) essential forinactivation of the open channel. The S5 and S6helices (green) and the P segment (blue) are homologous to those in nongated resting K�
channels, but each subunit contains four additionaltransmembrane � helices. One of these, S4 (red),is the voltage-sensing � helix. (b) Voltage-gatedNa� channels are monomers containing1800–2000 amino acids organized into four trans-membrane domains (I–IV) that are similar to thesubunits in voltage-gated K� channels. The singlechannel-inactivating segment, located in the cytosol between domains III and IV, contains aconserved hydrophobic motif (H). Voltage-gatedCa2� channels have a similar overall structure.Most voltage-gated ion channels also contain regulatory (�) subunits that are not depicted here.[Part (a) adapted from C. Miller, 1992, Curr. Biol. 2:573,and H. Larsson et al., 1996, Neuron 16:387. Part (b)adapted from W. A. Catterall, 2001, Nature 409:988.]
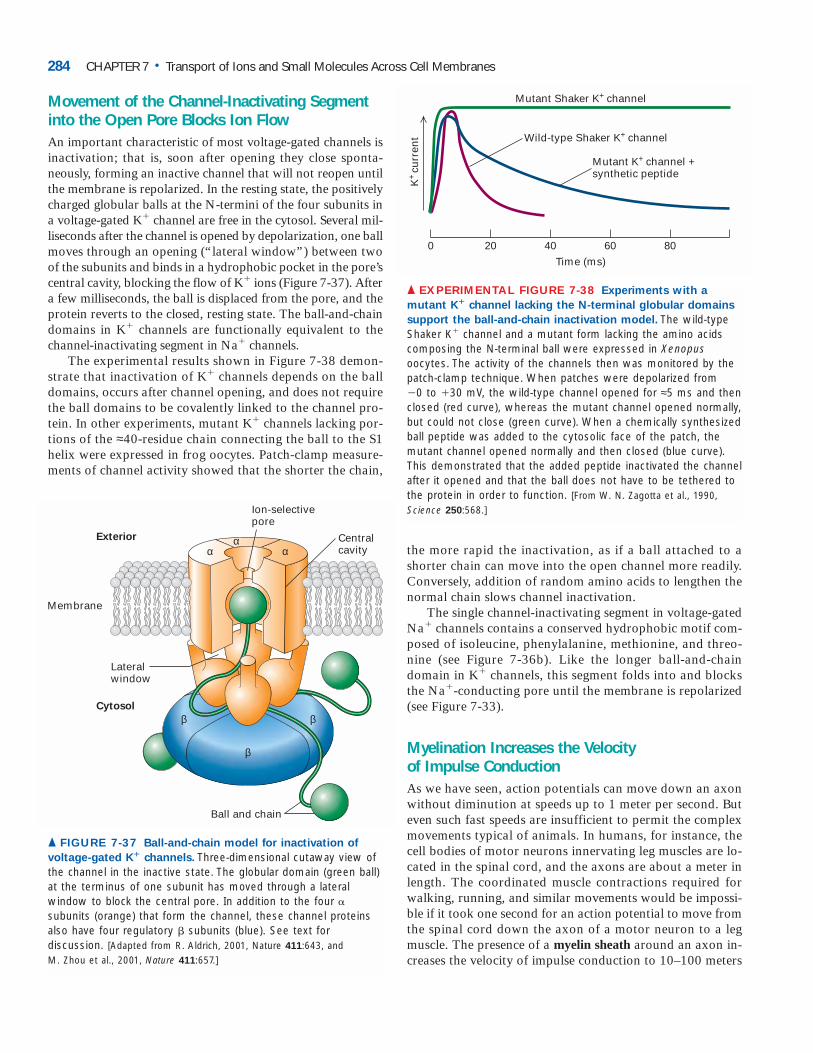
Movement of the Channel-Inactivating Segmentinto the Open Pore Blocks Ion FlowAn important characteristic of most voltage-gated channels isinactivation; that is, soon after opening they close sponta-neously, forming an inactive channel that will not reopen untilthe membrane is repolarized. In the resting state, the positivelycharged globular balls at the N-termini of the four subunits ina voltage-gated K� channel are free in the cytosol. Several mil-liseconds after the channel is opened by depolarization, one ballmoves through an opening (“lateral window”) between twoof the subunits and binds in a hydrophobic pocket in the pore’scentral cavity, blocking the flow of K� ions (Figure 7-37). Aftera few milliseconds, the ball is displaced from the pore, and theprotein reverts to the closed, resting state. The ball-and-chaindomains in K� channels are functionally equivalent to thechannel-inactivating segment in Na� channels.
The experimental results shown in Figure 7-38 demon-strate that inactivation of K� channels depends on the balldomains, occurs after channel opening, and does not requirethe ball domains to be covalently linked to the channel pro-tein. In other experiments, mutant K� channels lacking por-tions of the ≈40-residue chain connecting the ball to the S1helix were expressed in frog oocytes. Patch-clamp measure-ments of channel activity showed that the shorter the chain,
the more rapid the inactivation, as if a ball attached to ashorter chain can move into the open channel more readily.Conversely, addition of random amino acids to lengthen thenormal chain slows channel inactivation.
The single channel-inactivating segment in voltage-gatedNa� channels contains a conserved hydrophobic motif com-posed of isoleucine, phenylalanine, methionine, and threo-nine (see Figure 7-36b). Like the longer ball-and-chaindomain in K� channels, this segment folds into and blocksthe Na�-conducting pore until the membrane is repolarized(see Figure 7-33).
Myelination Increases the Velocity of Impulse ConductionAs we have seen, action potentials can move down an axonwithout diminution at speeds up to 1 meter per second. Buteven such fast speeds are insufficient to permit the complexmovements typical of animals. In humans, for instance, thecell bodies of motor neurons innervating leg muscles are lo-cated in the spinal cord, and the axons are about a meter inlength. The coordinated muscle contractions required forwalking, running, and similar movements would be impossi-ble if it took one second for an action potential to move fromthe spinal cord down the axon of a motor neuron to a legmuscle. The presence of a myelin sheath around an axon in-creases the velocity of impulse conduction to 10–100 meters
284 CHAPTER 7 • Transport of Ions and Small Molecules Across Cell Membranes
Membrane
Exterior
Cytosol
Ion-selectivepore
Ball and chain
Centralcavity
Lateralwindow
α α
β
β β
α
▲ FIGURE 7-37 Ball-and-chain model for inactivation of
voltage-gated K� channels. Three-dimensional cutaway view ofthe channel in the inactive state. The globular domain (green ball)at the terminus of one subunit has moved through a lateral window to block the central pore. In addition to the four �subunits (orange) that form the channel, these channel proteinsalso have four regulatory � subunits (blue). See text for discussion. [Adapted from R. Aldrich, 2001, Nature 411:643, and M. Zhou et al., 2001, Nature 411:657.]
K+
curr
ent
0 20 40 60 80
Time (ms)
Mutant Shaker K+ channel
Wild-type Shaker K+ channel
Mutant K+ channel +synthetic peptide
▲ EXPERIMENTAL FIGURE 7-38 Experiments with a
mutant K� channel lacking the N-terminal globular domains
support the ball-and-chain inactivation model. The wild-typeShaker K� channel and a mutant form lacking the amino acidscomposing the N-terminal ball were expressed in Xenopusoocytes. The activity of the channels then was monitored by thepatch-clamp technique. When patches were depolarized from �0 to �30 mV, the wild-type channel opened for ≈5 ms and thenclosed (red curve), whereas the mutant channel opened normally,but could not close (green curve). When a chemically synthesizedball peptide was added to the cytosolic face of the patch, themutant channel opened normally and then closed (blue curve).This demonstrated that the added peptide inactivated the channelafter it opened and that the ball does not have to be tethered tothe protein in order to function. [From W. N. Zagotta et al., 1990,Science 250:568.]
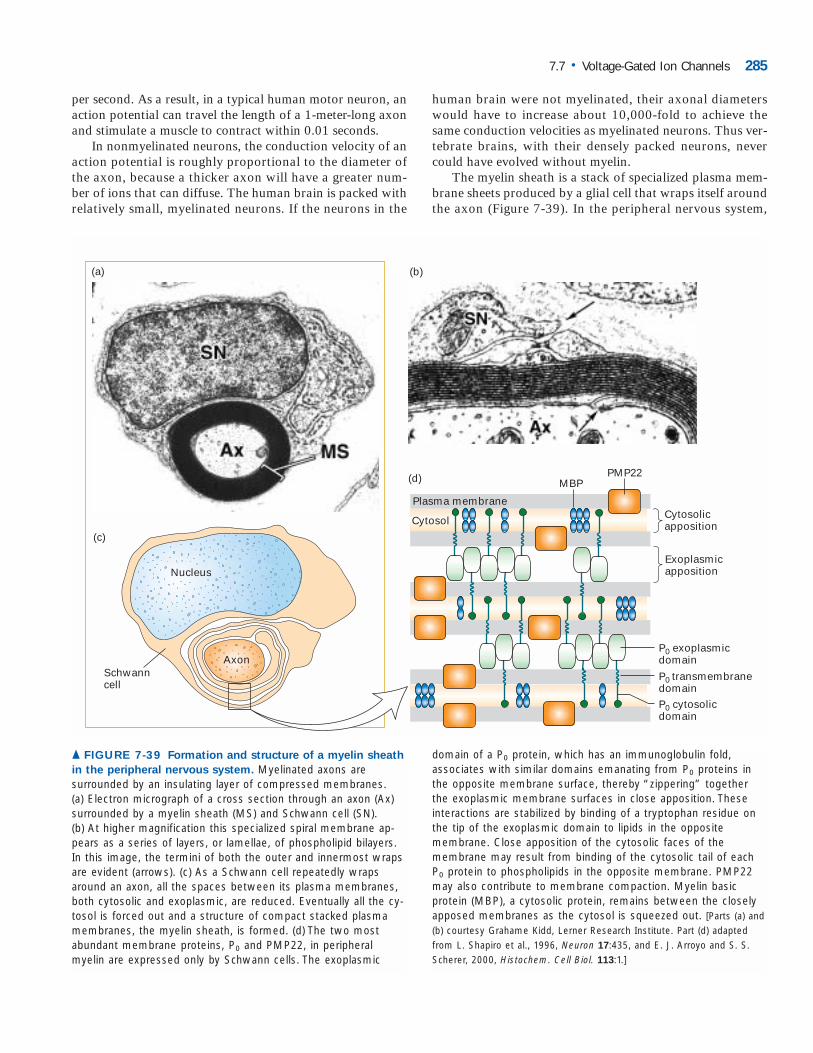
per second. As a result, in a typical human motor neuron, anaction potential can travel the length of a 1-meter-long axonand stimulate a muscle to contract within 0.01 seconds.
In nonmyelinated neurons, the conduction velocity of anaction potential is roughly proportional to the diameter ofthe axon, because a thicker axon will have a greater num-ber of ions that can diffuse. The human brain is packed withrelatively small, myelinated neurons. If the neurons in the
human brain were not myelinated, their axonal diameterswould have to increase about 10,000-fold to achieve thesame conduction velocities as myelinated neurons. Thus ver-tebrate brains, with their densely packed neurons, nevercould have evolved without myelin.
The myelin sheath is a stack of specialized plasma mem-brane sheets produced by a glial cell that wraps itself aroundthe axon (Figure 7-39). In the peripheral nervous system,
7.7 • Voltage-Gated Ion Channels 285
(b)
(c)
Schwann cell
Nucleus
Axon
(d) PMP22MBP
Cytosol
Plasma membrane
P0 cytosolicdomain
P0 exoplasmicdomain
P0 transmembranedomain
Cytosolicapposition
Exoplasmicapposition
(a)
▲ FIGURE 7-39 Formation and structure of a myelin sheath
in the peripheral nervous system. Myelinated axons are surrounded by an insulating layer of compressed membranes.(a) Electron micrograph of a cross section through an axon (Ax)surrounded by a myelin sheath (MS) and Schwann cell (SN). (b) At higher magnification this specialized spiral membrane ap-pears as a series of layers, or lamellae, of phospholipid bilayers.In this image, the termini of both the outer and innermost wrapsare evident (arrows). (c) As a Schwann cell repeatedly wrapsaround an axon, all the spaces between its plasma membranes,both cytosolic and exoplasmic, are reduced. Eventually all the cy-tosol is forced out and a structure of compact stacked plasmamembranes, the myelin sheath, is formed. (d) The two mostabundant membrane proteins, P0 and PMP22, in peripheralmyelin are expressed only by Schwann cells. The exoplasmic
domain of a P0 protein, which has an immunoglobulin fold, associates with similar domains emanating from P0 proteins inthe opposite membrane surface, thereby “zippering” togetherthe exoplasmic membrane surfaces in close apposition. These interactions are stabilized by binding of a tryptophan residue onthe tip of the exoplasmic domain to lipids in the opposite membrane. Close apposition of the cytosolic faces of the membrane may result from binding of the cytosolic tail of eachP0 protein to phospholipids in the opposite membrane. PMP22may also contribute to membrane compaction. Myelin basic protein (MBP), a cytosolic protein, remains between the closelyapposed membranes as the cytosol is squeezed out. [Parts (a) and(b) courtesy Grahame Kidd, Lerner Research Institute. Part (d) adaptedfrom L. Shapiro et al., 1996, Neuron 17:435, and E. J. Arroyo and S. S.Scherer, 2000, Histochem. Cell Biol. 113:1.]
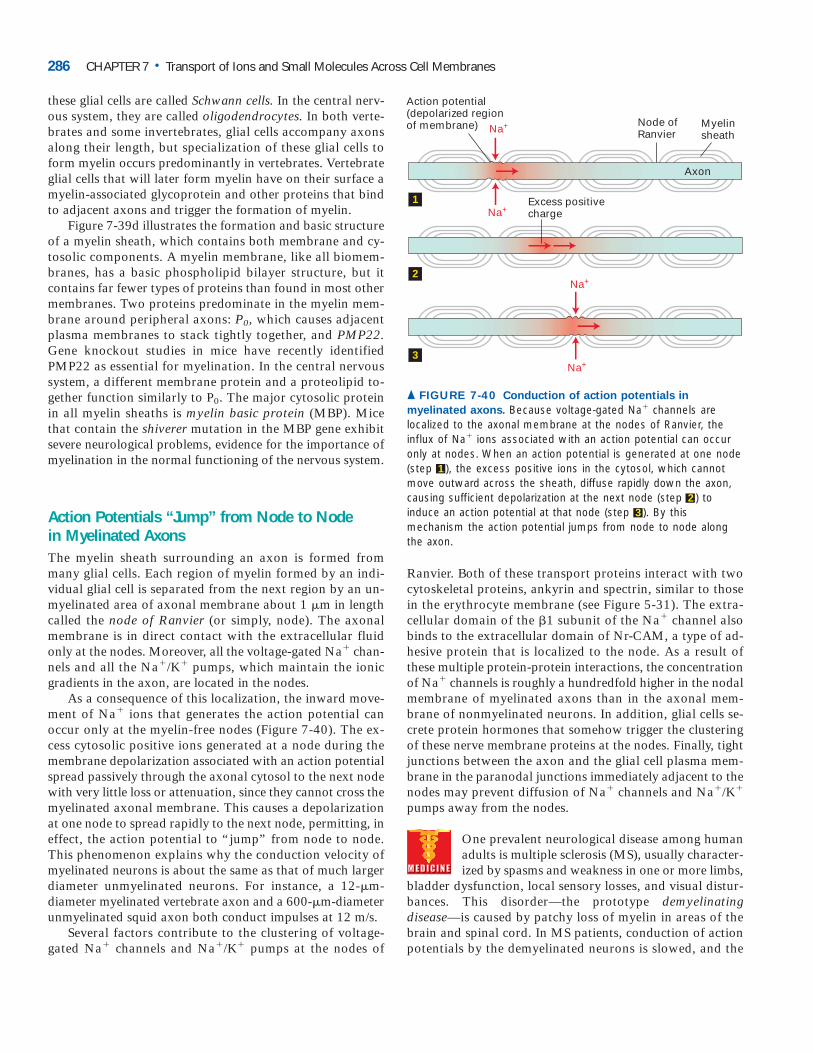
these glial cells are called Schwann cells. In the central nerv-ous system, they are called oligodendrocytes. In both verte-brates and some invertebrates, glial cells accompany axonsalong their length, but specialization of these glial cells toform myelin occurs predominantly in vertebrates. Vertebrateglial cells that will later form myelin have on their surface amyelin-associated glycoprotein and other proteins that bindto adjacent axons and trigger the formation of myelin.
Figure 7-39d illustrates the formation and basic structureof a myelin sheath, which contains both membrane and cy-tosolic components. A myelin membrane, like all biomem-branes, has a basic phospholipid bilayer structure, but itcontains far fewer types of proteins than found in most othermembranes. Two proteins predominate in the myelin mem-brane around peripheral axons: P0, which causes adjacentplasma membranes to stack tightly together, and PMP22.Gene knockout studies in mice have recently identifiedPMP22 as essential for myelination. In the central nervoussystem, a different membrane protein and a proteolipid to-gether function similarly to P0. The major cytosolic protein in all myelin sheaths is myelin basic protein (MBP). Mice that contain the shiverer mutation in the MBP gene exhibitsevere neurological problems, evidence for the importance ofmyelination in the normal functioning of the nervous system.
Action Potentials “Jump” from Node to Node in Myelinated AxonsThe myelin sheath surrounding an axon is formed frommany glial cells. Each region of myelin formed by an indi-vidual glial cell is separated from the next region by an un-myelinated area of axonal membrane about 1 m in lengthcalled the node of Ranvier (or simply, node). The axonalmembrane is in direct contact with the extracellular fluidonly at the nodes. Moreover, all the voltage-gated Na� chan-nels and all the Na�/K� pumps, which maintain the ionicgradients in the axon, are located in the nodes.
As a consequence of this localization, the inward move-ment of Na� ions that generates the action potential canoccur only at the myelin-free nodes (Figure 7-40). The ex-cess cytosolic positive ions generated at a node during themembrane depolarization associated with an action potentialspread passively through the axonal cytosol to the next nodewith very little loss or attenuation, since they cannot cross themyelinated axonal membrane. This causes a depolarizationat one node to spread rapidly to the next node, permitting, ineffect, the action potential to “jump” from node to node.This phenomenon explains why the conduction velocity ofmyelinated neurons is about the same as that of much largerdiameter unmyelinated neurons. For instance, a 12-m-diameter myelinated vertebrate axon and a 600-m-diameterunmyelinated squid axon both conduct impulses at 12 m/s.
Several factors contribute to the clustering of voltage-gated Na� channels and Na�/K� pumps at the nodes of
Ranvier. Both of these transport proteins interact with twocytoskeletal proteins, ankyrin and spectrin, similar to thosein the erythrocyte membrane (see Figure 5-31). The extra-cellular domain of the �1 subunit of the Na� channel alsobinds to the extracellular domain of Nr-CAM, a type of ad-hesive protein that is localized to the node. As a result ofthese multiple protein-protein interactions, the concentrationof Na� channels is roughly a hundredfold higher in the nodalmembrane of myelinated axons than in the axonal mem-brane of nonmyelinated neurons. In addition, glial cells se-crete protein hormones that somehow trigger the clusteringof these nerve membrane proteins at the nodes. Finally, tightjunctions between the axon and the glial cell plasma mem-brane in the paranodal junctions immediately adjacent to thenodes may prevent diffusion of Na� channels and Na�/K�
pumps away from the nodes.
One prevalent neurological disease among humanadults is multiple sclerosis (MS), usually character-ized by spasms and weakness in one or more limbs,
bladder dysfunction, local sensory losses, and visual distur-bances. This disorder—the prototype demyelinatingdisease—is caused by patchy loss of myelin in areas of thebrain and spinal cord. In MS patients, conduction of actionpotentials by the demyelinated neurons is slowed, and the
286 CHAPTER 7 • Transport of Ions and Small Molecules Across Cell Membranes
Na+
Na+
Na+
Na+
Node ofRanvier
Action potential(depolarized regionof membrane) Myelin
sheath
Axon
Excess positivecharge
1
2
3
▲ FIGURE 7-40 Conduction of action potentials in
myelinated axons. Because voltage-gated Na� channels are localized to the axonal membrane at the nodes of Ranvier, the influx of Na� ions associated with an action potential can occuronly at nodes. When an action potential is generated at one node(step 1 ), the excess positive ions in the cytosol, which cannotmove outward across the sheath, diffuse rapidly down the axon,causing sufficient depolarization at the next node (step 2 ) to induce an action potential at that node (step 3 ). By this mechanism the action potential jumps from node to node alongthe axon.
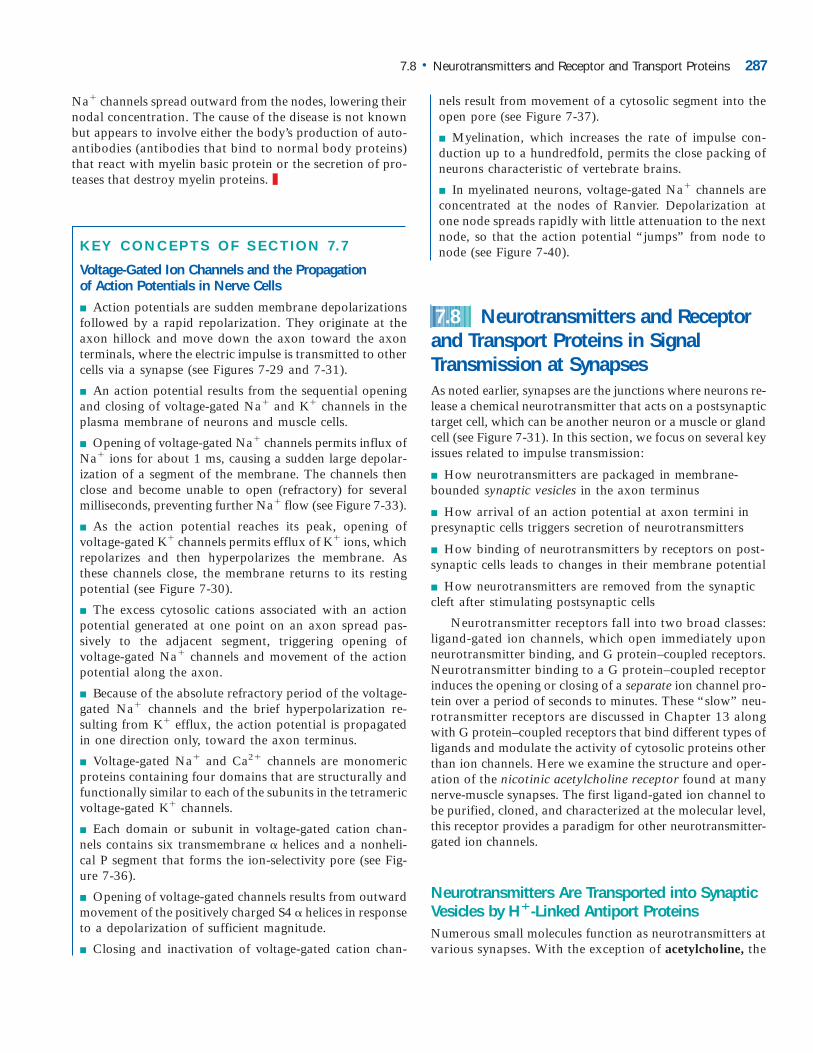
Na� channels spread outward from the nodes, lowering theirnodal concentration. The cause of the disease is not knownbut appears to involve either the body’s production of auto-antibodies (antibodies that bind to normal body proteins)that react with myelin basic protein or the secretion of pro-teases that destroy myelin proteins. ❚
KEY CONCEPTS OF SECTION 7.7
Voltage-Gated Ion Channels and the Propagation of Action Potentials in Nerve Cells
■ Action potentials are sudden membrane depolarizationsfollowed by a rapid repolarization. They originate at theaxon hillock and move down the axon toward the axonterminals, where the electric impulse is transmitted to othercells via a synapse (see Figures 7-29 and 7-31).
■ An action potential results from the sequential openingand closing of voltage-gated Na� and K� channels in theplasma membrane of neurons and muscle cells.
■ Opening of voltage-gated Na� channels permits influx ofNa� ions for about 1 ms, causing a sudden large depolar-ization of a segment of the membrane. The channels thenclose and become unable to open (refractory) for severalmilliseconds, preventing further Na� flow (see Figure 7-33).
■ As the action potential reaches its peak, opening of voltage-gated K� channels permits efflux of K� ions, whichrepolarizes and then hyperpolarizes the membrane. Asthese channels close, the membrane returns to its restingpotential (see Figure 7-30).
■ The excess cytosolic cations associated with an actionpotential generated at one point on an axon spread pas-sively to the adjacent segment, triggering opening ofvoltage-gated Na� channels and movement of the actionpotential along the axon.
■ Because of the absolute refractory period of the voltage-gated Na� channels and the brief hyperpolarization re-sulting from K� efflux, the action potential is propagatedin one direction only, toward the axon terminus.
■ Voltage-gated Na� and Ca2� channels are monomericproteins containing four domains that are structurally andfunctionally similar to each of the subunits in the tetramericvoltage-gated K� channels.
■ Each domain or subunit in voltage-gated cation chan-nels contains six transmembrane � helices and a nonheli-cal P segment that forms the ion-selectivity pore (see Fig-ure 7-36).
■ Opening of voltage-gated channels results from outwardmovement of the positively charged S4 � helices in responseto a depolarization of sufficient magnitude.
■ Closing and inactivation of voltage-gated cation chan-
nels result from movement of a cytosolic segment into theopen pore (see Figure 7-37).
■ Myelination, which increases the rate of impulse con-duction up to a hundredfold, permits the close packing ofneurons characteristic of vertebrate brains.
■ In myelinated neurons, voltage-gated Na� channels areconcentrated at the nodes of Ranvier. Depolarization atone node spreads rapidly with little attenuation to the nextnode, so that the action potential “jumps” from node tonode (see Figure 7-40).
Neurotransmitters and Receptorand Transport Proteins in SignalTransmission at SynapsesAs noted earlier, synapses are the junctions where neurons re-lease a chemical neurotransmitter that acts on a postsynaptictarget cell, which can be another neuron or a muscle or glandcell (see Figure 7-31). In this section, we focus on several keyissues related to impulse transmission:
■ How neurotransmitters are packaged in membrane-bounded synaptic vesicles in the axon terminus
■ How arrival of an action potential at axon termini inpresynaptic cells triggers secretion of neurotransmitters
■ How binding of neurotransmitters by receptors on post-synaptic cells leads to changes in their membrane potential
■ How neurotransmitters are removed from the synapticcleft after stimulating postsynaptic cells
Neurotransmitter receptors fall into two broad classes:ligand-gated ion channels, which open immediately uponneurotransmitter binding, and G protein–coupled receptors.Neurotransmitter binding to a G protein–coupled receptorinduces the opening or closing of a separate ion channel pro-tein over a period of seconds to minutes. These “slow” neu-rotransmitter receptors are discussed in Chapter 13 alongwith G protein–coupled receptors that bind different types ofligands and modulate the activity of cytosolic proteins otherthan ion channels. Here we examine the structure and oper-ation of the nicotinic acetylcholine receptor found at manynerve-muscle synapses. The first ligand-gated ion channel tobe purified, cloned, and characterized at the molecular level,this receptor provides a paradigm for other neurotransmitter-gated ion channels.
Neurotransmitters Are Transported into SynapticVesicles by H�-Linked Antiport ProteinsNumerous small molecules function as neurotransmitters atvarious synapses. With the exception of acetylcholine, the
7.8
7.8 • Neurotransmitters and Receptor and Transport Proteins 287
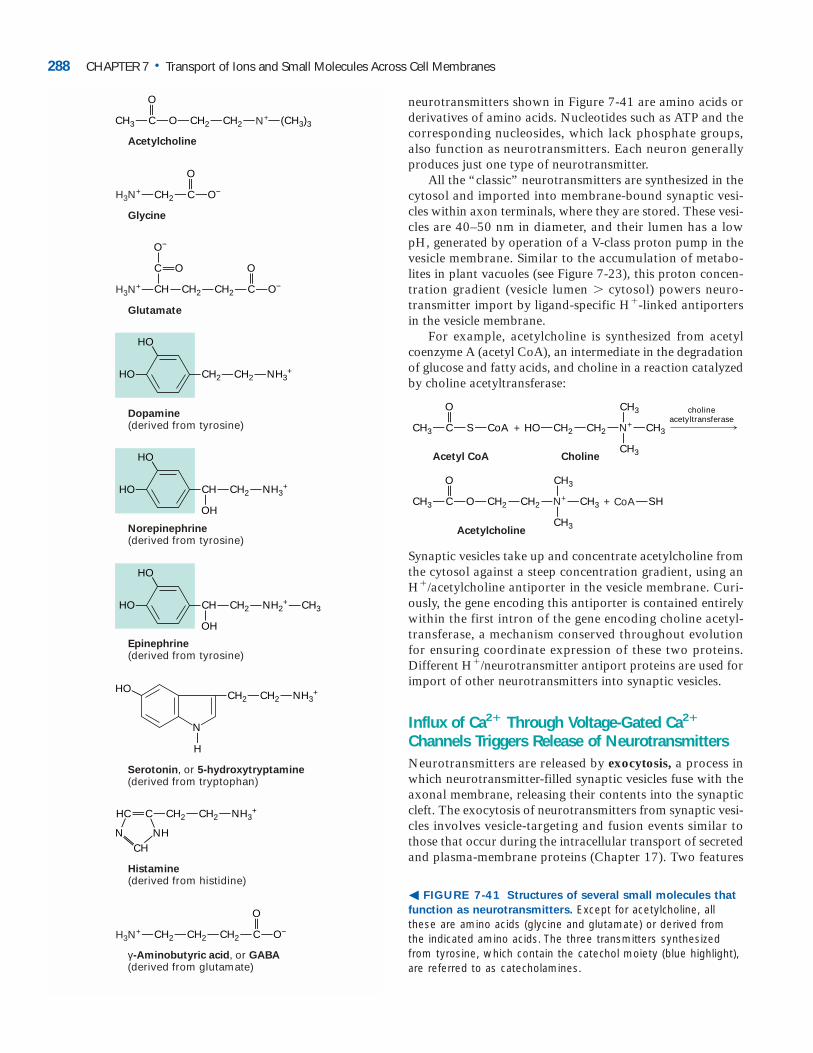
neurotransmitters shown in Figure 7-41 are amino acids orderivatives of amino acids. Nucleotides such as ATP and thecorresponding nucleosides, which lack phosphate groups,also function as neurotransmitters. Each neuron generallyproduces just one type of neurotransmitter.
All the “classic” neurotransmitters are synthesized in thecytosol and imported into membrane-bound synaptic vesi-cles within axon terminals, where they are stored. These vesi-cles are 40–50 nm in diameter, and their lumen has a lowpH, generated by operation of a V-class proton pump in thevesicle membrane. Similar to the accumulation of metabo-lites in plant vacuoles (see Figure 7-23), this proton concen-tration gradient (vesicle lumen cytosol) powers neuro-transmitter import by ligand-specific H�-linked antiportersin the vesicle membrane.
For example, acetylcholine is synthesized from acetylcoenzyme A (acetyl CoA), an intermediate in the degradationof glucose and fatty acids, and choline in a reaction catalyzedby choline acetyltransferase:
Synaptic vesicles take up and concentrate acetylcholine fromthe cytosol against a steep concentration gradient, using anH�/acetylcholine antiporter in the vesicle membrane. Curi-ously, the gene encoding this antiporter is contained entirelywithin the first intron of the gene encoding choline acetyl-transferase, a mechanism conserved throughout evolutionfor ensuring coordinate expression of these two proteins.Different H�/neurotransmitter antiport proteins are used forimport of other neurotransmitters into synaptic vesicles.
Influx of Ca2� Through Voltage-Gated Ca2�
Channels Triggers Release of NeurotransmittersNeurotransmitters are released by exocytosis, a process inwhich neurotransmitter-filled synaptic vesicles fuse with theaxonal membrane, releasing their contents into the synapticcleft. The exocytosis of neurotransmitters from synaptic vesi-cles involves vesicle-targeting and fusion events similar tothose that occur during the intracellular transport of secretedand plasma-membrane proteins (Chapter 17). Two features
288 CHAPTER 7 • Transport of Ions and Small Molecules Across Cell Membranes
O
C
O
O−
C O
C O
Glutamate
Glycine
Acetylcholine
CH3 (CH3)3CH2 CH2
CH CH2 CH2H3N+ C
O
O−
CH2H3N+
N+
NH3+
OH
CH2 CH2
HO
HO
Dopamine(derived from tyrosine)
NH3+CH CH2
HO
HO
Norepinephrine(derived from tyrosine)
OH
NH2+CH CH2 CH3
HO
HO
Epinephrine(derived from tyrosine)
Serotonin, or 5-hydroxytryptamine(derived from tryptophan)
Histamine(derived from histidine)
γ-Aminobutyric acid, or GABA(derived from glutamate)
HO
H
N
NH3+CH2 CH2
CH2 CH2 CH2
N NH
HC C
CH
CH2 NH3+CH2
H3N+ C
O
O−
O−
� FIGURE 7-41 Structures of several small molecules that
function as neurotransmitters. Except for acetylcholine, allthese are amino acids (glycine and glutamate) or derived fromthe indicated amino acids. The three transmitters synthesizedfrom tyrosine, which contain the catechol moiety (blue highlight),are referred to as catecholamines.
O
C O
Acetylcholine
CH3 SHCoA+
CH3
CH3
N+ CH3CH2CH2
O
C S
Acetyl CoA Choline
CH3 +CoA HO
CH3
CH3
N+ CH3
cholineacetyltransferase
CH2CH2
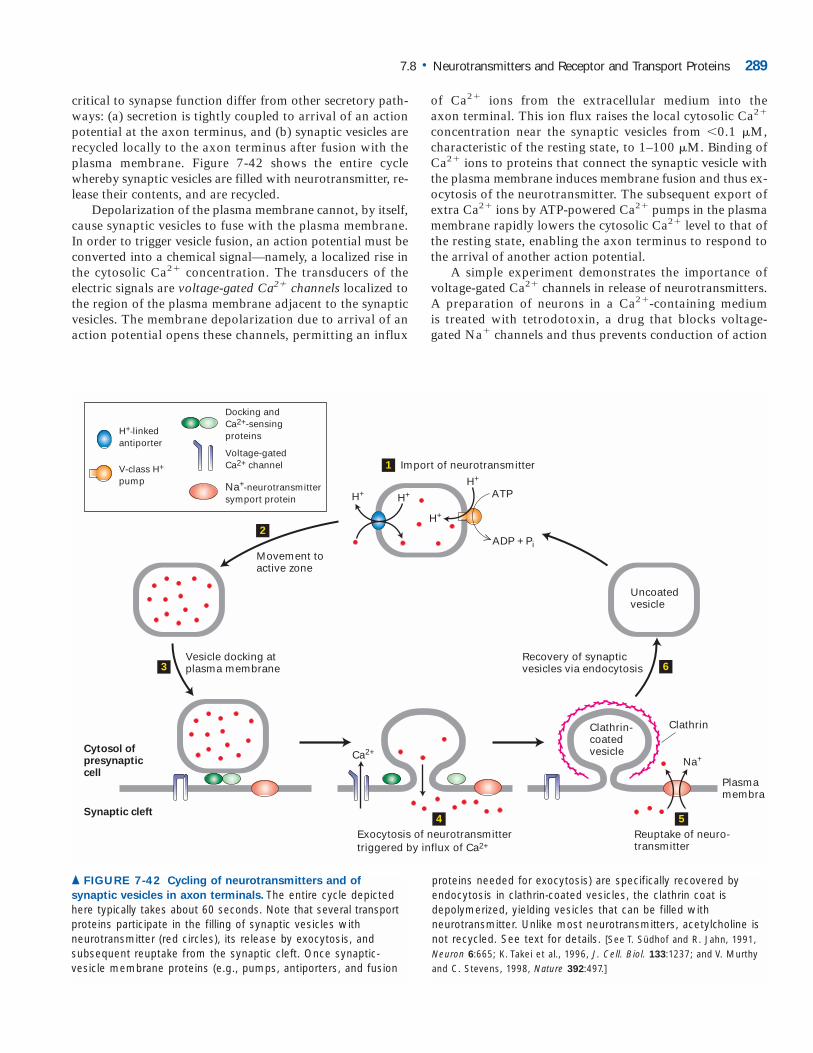
critical to synapse function differ from other secretory path-ways: (a) secretion is tightly coupled to arrival of an actionpotential at the axon terminus, and (b) synaptic vesicles arerecycled locally to the axon terminus after fusion with theplasma membrane. Figure 7-42 shows the entire cyclewhereby synaptic vesicles are filled with neurotransmitter, re-lease their contents, and are recycled.
Depolarization of the plasma membrane cannot, by itself,cause synaptic vesicles to fuse with the plasma membrane.In order to trigger vesicle fusion, an action potential must beconverted into a chemical signal—namely, a localized rise inthe cytosolic Ca2� concentration. The transducers of theelectric signals are voltage-gated Ca2� channels localized tothe region of the plasma membrane adjacent to the synapticvesicles. The membrane depolarization due to arrival of anaction potential opens these channels, permitting an influx
of Ca2� ions from the extracellular medium into the axon terminal. This ion flux raises the local cytosolic Ca2�
concentration near the synaptic vesicles from 0.1 M,characteristic of the resting state, to 1–100 M. Binding ofCa2� ions to proteins that connect the synaptic vesicle withthe plasma membrane induces membrane fusion and thus ex-ocytosis of the neurotransmitter. The subsequent export ofextra Ca2� ions by ATP-powered Ca2� pumps in the plasmamembrane rapidly lowers the cytosolic Ca2� level to that ofthe resting state, enabling the axon terminus to respond tothe arrival of another action potential.
A simple experiment demonstrates the importance ofvoltage-gated Ca2� channels in release of neurotransmitters.A preparation of neurons in a Ca2�-containing medium is treated with tetrodotoxin, a drug that blocks voltage-gated Na� channels and thus prevents conduction of action
7.8 • Neurotransmitters and Receptor and Transport Proteins 289
Movement toactive zone
Exocytosis of neurotransmitter triggered by influx of Ca2+
Cytosol of presynapticcell
Plasmamembra
Synaptic cleft
Ca2+
Clathrin
Recovery of synapticvesicles via endocytosis
Vesicle docking atplasma membrane
Reuptake of neuro-transmitter
Clathrin-coated vesicle
Na+
Na+-neurotransmittersymport protein
Uncoated vesicle
Import of neurotransmitter
H+
H+ H+
ADP + Pi
ATPH+
H+-linkedantiporter
V-class H+ pump
Docking and Ca2+-sensing proteins
Voltage-gatedCa2+ channel 1
2
3
4 5
6
▲ FIGURE 7-42 Cycling of neurotransmitters and of
synaptic vesicles in axon terminals. The entire cycle depictedhere typically takes about 60 seconds. Note that several transportproteins participate in the filling of synaptic vesicles with neurotransmitter (red circles), its release by exocytosis, and subsequent reuptake from the synaptic cleft. Once synaptic-vesicle membrane proteins (e.g., pumps, antiporters, and fusion
proteins needed for exocytosis) are specifically recovered by endocytosis in clathrin-coated vesicles, the clathrin coat is depolymerized, yielding vesicles that can be filled with neurotransmitter. Unlike most neurotransmitters, acetylcholine isnot recycled. See text for details. [See T. Südhof and R. Jahn, 1991,Neuron 6:665; K. Takei et al., 1996, J. Cell. Biol. 133:1237; and V. Murthyand C. Stevens, 1998, Nature 392:497.]
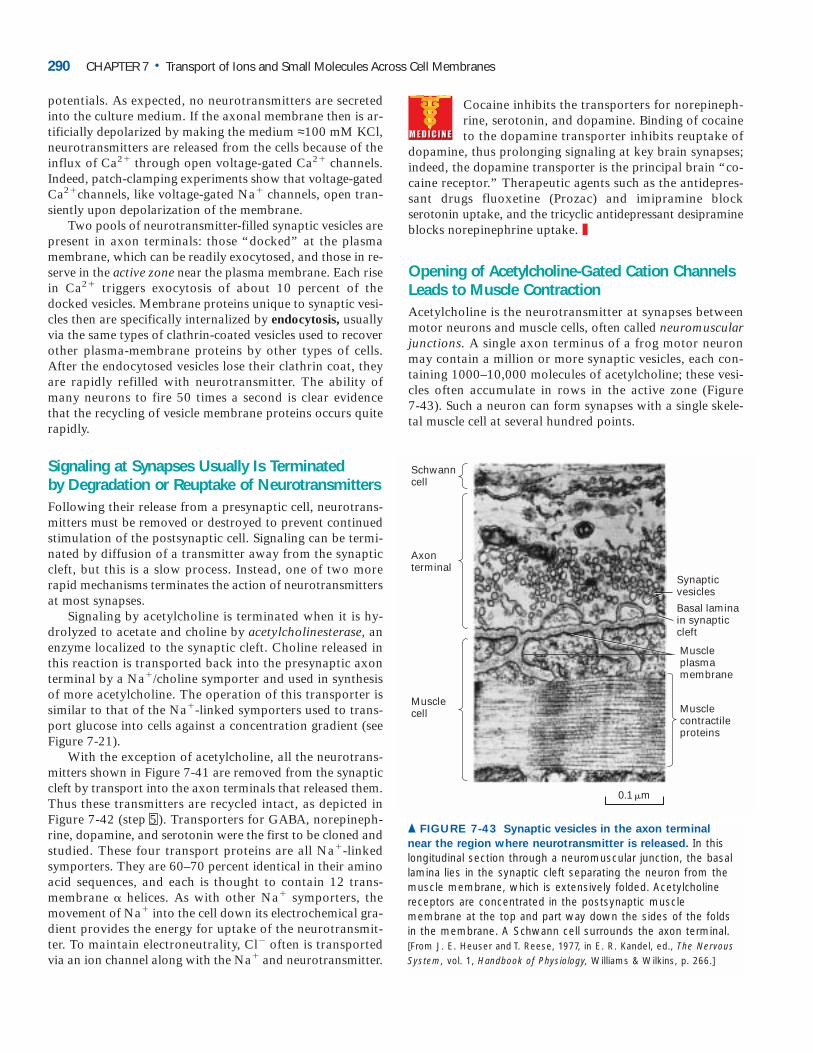
potentials. As expected, no neurotransmitters are secretedinto the culture medium. If the axonal membrane then is ar-tificially depolarized by making the medium ≈100 mM KCl,neurotransmitters are released from the cells because of theinflux of Ca2� through open voltage-gated Ca2� channels.Indeed, patch-clamping experiments show that voltage-gatedCa2�channels, like voltage-gated Na� channels, open tran-siently upon depolarization of the membrane.
Two pools of neurotransmitter-filled synaptic vesicles arepresent in axon terminals: those “docked” at the plasmamembrane, which can be readily exocytosed, and those in re-serve in the active zone near the plasma membrane. Each risein Ca2� triggers exocytosis of about 10 percent of thedocked vesicles. Membrane proteins unique to synaptic vesi-cles then are specifically internalized by endocytosis, usuallyvia the same types of clathrin-coated vesicles used to recoverother plasma-membrane proteins by other types of cells.After the endocytosed vesicles lose their clathrin coat, theyare rapidly refilled with neurotransmitter. The ability ofmany neurons to fire 50 times a second is clear evidence that the recycling of vesicle membrane proteins occurs quiterapidly.
Signaling at Synapses Usually Is Terminated by Degradation or Reuptake of NeurotransmittersFollowing their release from a presynaptic cell, neurotrans-mitters must be removed or destroyed to prevent continuedstimulation of the postsynaptic cell. Signaling can be termi-nated by diffusion of a transmitter away from the synapticcleft, but this is a slow process. Instead, one of two morerapid mechanisms terminates the action of neurotransmittersat most synapses.
Signaling by acetylcholine is terminated when it is hy-drolyzed to acetate and choline by acetylcholinesterase, anenzyme localized to the synaptic cleft. Choline released inthis reaction is transported back into the presynaptic axonterminal by a Na�/choline symporter and used in synthesisof more acetylcholine. The operation of this transporter issimilar to that of the Na�-linked symporters used to trans-port glucose into cells against a concentration gradient (seeFigure 7-21).
With the exception of acetylcholine, all the neurotrans-mitters shown in Figure 7-41 are removed from the synapticcleft by transport into the axon terminals that released them.Thus these transmitters are recycled intact, as depicted inFigure 7-42 (step 5 ). Transporters for GABA, norepineph-rine, dopamine, and serotonin were the first to be cloned andstudied. These four transport proteins are all Na�-linkedsymporters. They are 60–70 percent identical in their aminoacid sequences, and each is thought to contain 12 trans-membrane � helices. As with other Na� symporters, themovement of Na� into the cell down its electrochemical gra-dient provides the energy for uptake of the neurotransmit-ter. To maintain electroneutrality, Cl� often is transportedvia an ion channel along with the Na� and neurotransmitter.
Cocaine inhibits the transporters for norepineph-rine, serotonin, and dopamine. Binding of cocaineto the dopamine transporter inhibits reuptake of
dopamine, thus prolonging signaling at key brain synapses;indeed, the dopamine transporter is the principal brain “co-caine receptor.” Therapeutic agents such as the antidepres-sant drugs fluoxetine (Prozac) and imipramine blockserotonin uptake, and the tricyclic antidepressant desipramineblocks norepinephrine uptake. ❚
Opening of Acetylcholine-Gated Cation ChannelsLeads to Muscle ContractionAcetylcholine is the neurotransmitter at synapses betweenmotor neurons and muscle cells, often called neuromuscularjunctions. A single axon terminus of a frog motor neuronmay contain a million or more synaptic vesicles, each con-taining 1000–10,000 molecules of acetylcholine; these vesi-cles often accumulate in rows in the active zone (Figure7-43). Such a neuron can form synapses with a single skele-tal muscle cell at several hundred points.
290 CHAPTER 7 • Transport of Ions and Small Molecules Across Cell Membranes
Schwanncell
Axonterminal
Musclecell
Synapticvesicles
Basal laminain synapticcleft
Muscleplasmamembrane
Musclecontractileproteins
0.1 m
▲ FIGURE 7-43 Synaptic vesicles in the axon terminal
near the region where neurotransmitter is released. In thislongitudinal section through a neuromuscular junction, the basallamina lies in the synaptic cleft separating the neuron from themuscle membrane, which is extensively folded. Acetylcholine receptors are concentrated in the postsynaptic muscle membrane at the top and part way down the sides of the foldsin the membrane. A Schwann cell surrounds the axon terminal.[From J. E. Heuser and T. Reese, 1977, in E. R. Kandel, ed., The NervousSystem, vol. 1, Handbook of Physiology, Williams & Wilkins, p. 266.]
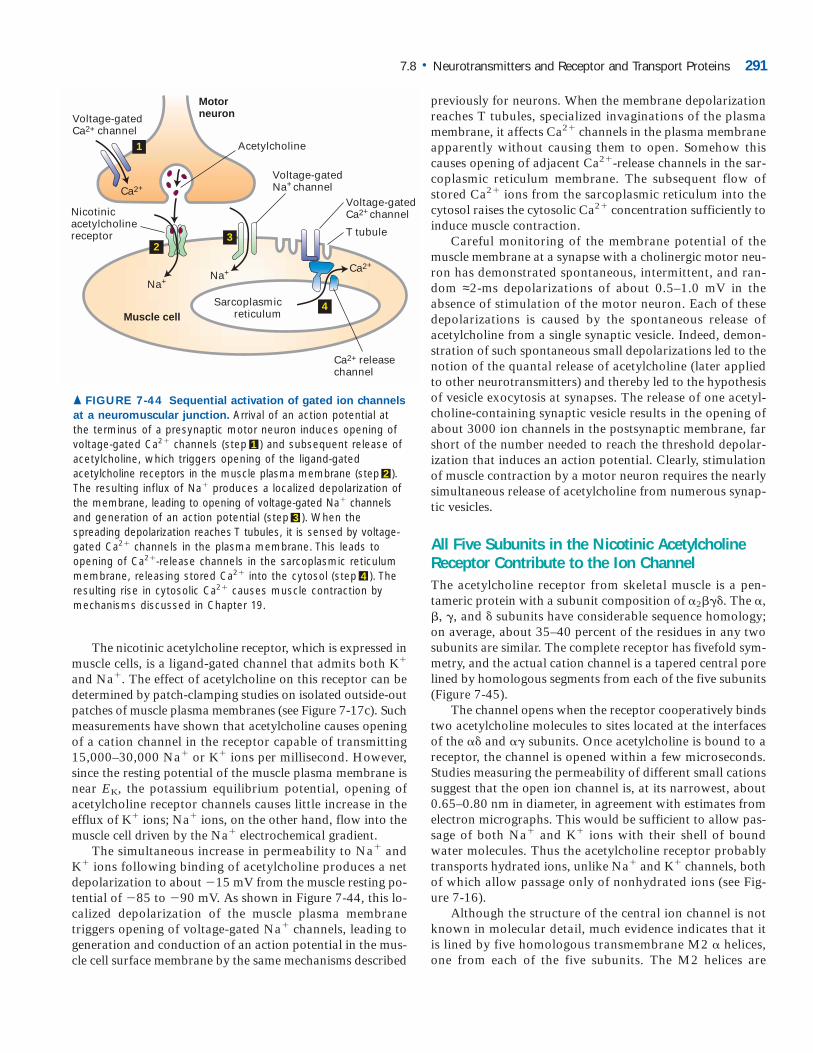
The nicotinic acetylcholine receptor, which is expressed inmuscle cells, is a ligand-gated channel that admits both K�
and Na�. The effect of acetylcholine on this receptor can bedetermined by patch-clamping studies on isolated outside-outpatches of muscle plasma membranes (see Figure 7-17c). Suchmeasurements have shown that acetylcholine causes openingof a cation channel in the receptor capable of transmitting15,000–30,000 Na� or K� ions per millisecond. However,since the resting potential of the muscle plasma membrane isnear EK, the potassium equilibrium potential, opening ofacetylcholine receptor channels causes little increase in theefflux of K� ions; Na� ions, on the other hand, flow into themuscle cell driven by the Na� electrochemical gradient.
The simultaneous increase in permeability to Na� andK� ions following binding of acetylcholine produces a netdepolarization to about �15 mV from the muscle resting po-tential of �85 to �90 mV. As shown in Figure 7-44, this lo-calized depolarization of the muscle plasma membranetriggers opening of voltage-gated Na� channels, leading togeneration and conduction of an action potential in the mus-cle cell surface membrane by the same mechanisms described
previously for neurons. When the membrane depolarizationreaches T tubules, specialized invaginations of the plasmamembrane, it affects Ca2� channels in the plasma membraneapparently without causing them to open. Somehow thiscauses opening of adjacent Ca2�-release channels in the sar-coplasmic reticulum membrane. The subsequent flow ofstored Ca2� ions from the sarcoplasmic reticulum into thecytosol raises the cytosolic Ca2� concentration sufficiently toinduce muscle contraction.
Careful monitoring of the membrane potential of themuscle membrane at a synapse with a cholinergic motor neu-ron has demonstrated spontaneous, intermittent, and ran-dom ≈2-ms depolarizations of about 0.5–1.0 mV in theabsence of stimulation of the motor neuron. Each of thesedepolarizations is caused by the spontaneous release ofacetylcholine from a single synaptic vesicle. Indeed, demon-stration of such spontaneous small depolarizations led to thenotion of the quantal release of acetylcholine (later appliedto other neurotransmitters) and thereby led to the hypothesisof vesicle exocytosis at synapses. The release of one acetyl-choline-containing synaptic vesicle results in the opening ofabout 3000 ion channels in the postsynaptic membrane, farshort of the number needed to reach the threshold depolar-ization that induces an action potential. Clearly, stimulationof muscle contraction by a motor neuron requires the nearlysimultaneous release of acetylcholine from numerous synap-tic vesicles.
All Five Subunits in the Nicotinic AcetylcholineReceptor Contribute to the Ion ChannelThe acetylcholine receptor from skeletal muscle is a pen-tameric protein with a subunit composition of �2���. The �,�, �, and � subunits have considerable sequence homology;on average, about 35–40 percent of the residues in any twosubunits are similar. The complete receptor has fivefold sym-metry, and the actual cation channel is a tapered central porelined by homologous segments from each of the five subunits(Figure 7-45).
The channel opens when the receptor cooperatively bindstwo acetylcholine molecules to sites located at the interfacesof the �� and �� subunits. Once acetylcholine is bound to areceptor, the channel is opened within a few microseconds.Studies measuring the permeability of different small cationssuggest that the open ion channel is, at its narrowest, about0.65–0.80 nm in diameter, in agreement with estimates fromelectron micrographs. This would be sufficient to allow pas-sage of both Na� and K� ions with their shell of boundwater molecules. Thus the acetylcholine receptor probablytransports hydrated ions, unlike Na� and K� channels, bothof which allow passage only of nonhydrated ions (see Fig-ure 7-16).
Although the structure of the central ion channel is notknown in molecular detail, much evidence indicates that itis lined by five homologous transmembrane M2 � helices,one from each of the five subunits. The M2 helices are
7.8 • Neurotransmitters and Receptor and Transport Proteins 291
Voltage-gatedNa+ channel
T tubule
Voltage-gatedCa2+ channel
1
23
4
Na+Na+
Ca2+
Sarcoplasmicreticulum
Motorneuron
Muscle cell
Nicotinicacetylcholine receptor
Ca2+
Acetylcholine
Ca2+ release channel
Voltage-gatedCa2+ channel
▲ FIGURE 7-44 Sequential activation of gated ion channels
at a neuromuscular junction. Arrival of an action potential atthe terminus of a presynaptic motor neuron induces opening ofvoltage-gated Ca2� channels (step 1 ) and subsequent release ofacetylcholine, which triggers opening of the ligand-gated acetylcholine receptors in the muscle plasma membrane (step 2 ).The resulting influx of Na� produces a localized depolarization ofthe membrane, leading to opening of voltage-gated Na� channelsand generation of an action potential (step 3 ). When the spreading depolarization reaches T tubules, it is sensed by voltage-gated Ca2� channels in the plasma membrane. This leads toopening of Ca2�-release channels in the sarcoplasmic reticulummembrane, releasing stored Ca2� into the cytosol (step 4 ). Theresulting rise in cytosolic Ca2� causes muscle contraction bymechanisms discussed in Chapter 19.
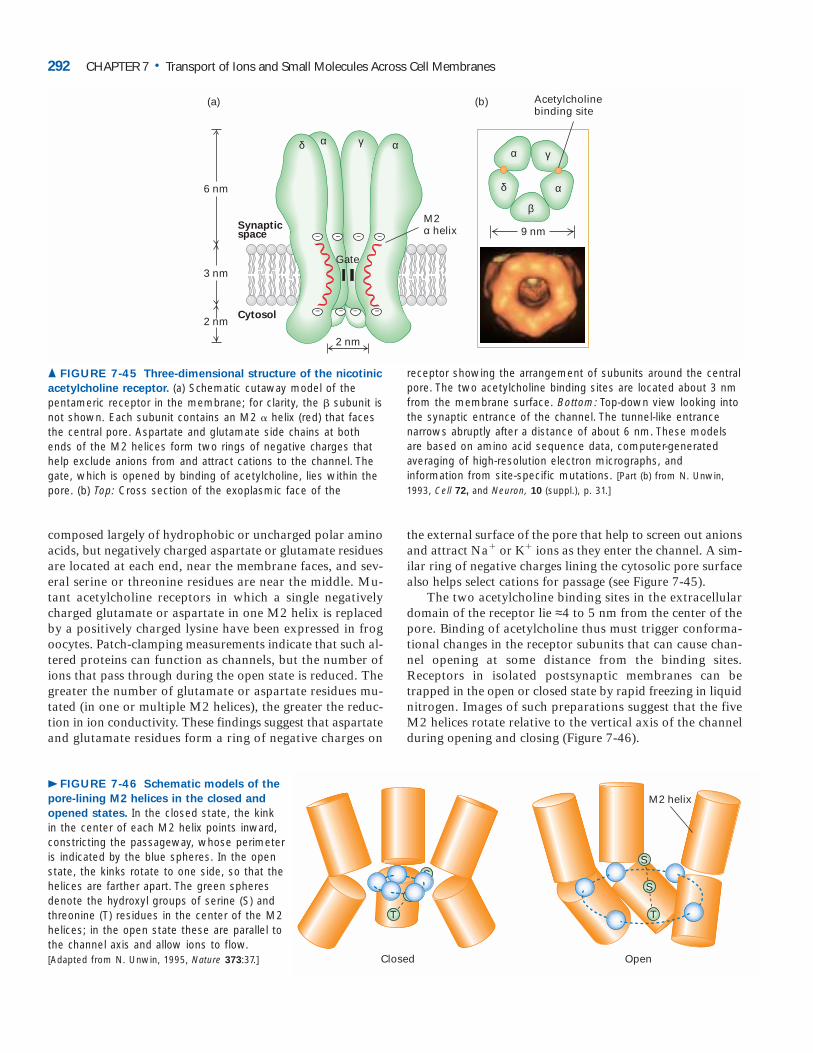
composed largely of hydrophobic or uncharged polar aminoacids, but negatively charged aspartate or glutamate residuesare located at each end, near the membrane faces, and sev-eral serine or threonine residues are near the middle. Mu-tant acetylcholine receptors in which a single negativelycharged glutamate or aspartate in one M2 helix is replacedby a positively charged lysine have been expressed in frogoocytes. Patch-clamping measurements indicate that such al-tered proteins can function as channels, but the number ofions that pass through during the open state is reduced. Thegreater the number of glutamate or aspartate residues mu-tated (in one or multiple M2 helices), the greater the reduc-tion in ion conductivity. These findings suggest that aspartateand glutamate residues form a ring of negative charges on
the external surface of the pore that help to screen out anionsand attract Na� or K� ions as they enter the channel. A sim-ilar ring of negative charges lining the cytosolic pore surfacealso helps select cations for passage (see Figure 7-45).
The two acetylcholine binding sites in the extracellulardomain of the receptor lie ≈4 to 5 nm from the center of thepore. Binding of acetylcholine thus must trigger conforma-tional changes in the receptor subunits that can cause chan-nel opening at some distance from the binding sites.Receptors in isolated postsynaptic membranes can betrapped in the open or closed state by rapid freezing in liquidnitrogen. Images of such preparations suggest that the fiveM2 helices rotate relative to the vertical axis of the channelduring opening and closing (Figure 7-46).
292 CHAPTER 7 • Transport of Ions and Small Molecules Across Cell Membranes
▲ FIGURE 7-45 Three-dimensional structure of the nicotinic
acetylcholine receptor. (a) Schematic cutaway model of the pentameric receptor in the membrane; for clarity, the � subunit isnot shown. Each subunit contains an M2 � helix (red) that facesthe central pore. Aspartate and glutamate side chains at bothends of the M2 helices form two rings of negative charges thathelp exclude anions from and attract cations to the channel. Thegate, which is opened by binding of acetylcholine, lies within thepore. (b) Top: Cross section of the exoplasmic face of the
receptor showing the arrangement of subunits around the centralpore. The two acetylcholine binding sites are located about 3 nmfrom the membrane surface. Bottom: Top-down view looking intothe synaptic entrance of the channel. The tunnel-like entrancenarrows abruptly after a distance of about 6 nm. These modelsare based on amino acid sequence data, computer-generated averaging of high-resolution electron micrographs, and information from site-specific mutations. [Part (b) from N. Unwin,1993, Cell 72, and Neuron, 10 (suppl.), p. 31.]
αδ α
M2 α helix
2 nm
6 nm
3 nm
2 nmCytosol
(a)
γ
Acetylcholinebinding site
α
β
αδ
γ
9 nm− −−
− −
−
Gate
−−
Synapticspace
(b)
S
S
Closed
S
S
TT
Open
M2 helix▲ FIGURE 7-46 Schematic models of the
pore-lining M2 helices in the closed and
opened states. In the closed state, the kinkin the center of each M2 helix points inward,constricting the passageway, whose perimeteris indicated by the blue spheres. In the openstate, the kinks rotate to one side, so that thehelices are farther apart. The green spheresdenote the hydroxyl groups of serine (S) andthreonine (T) residues in the center of the M2helices; in the open state these are parallel tothe channel axis and allow ions to flow.[Adapted from N. Unwin, 1995, Nature 373:37.]
▲
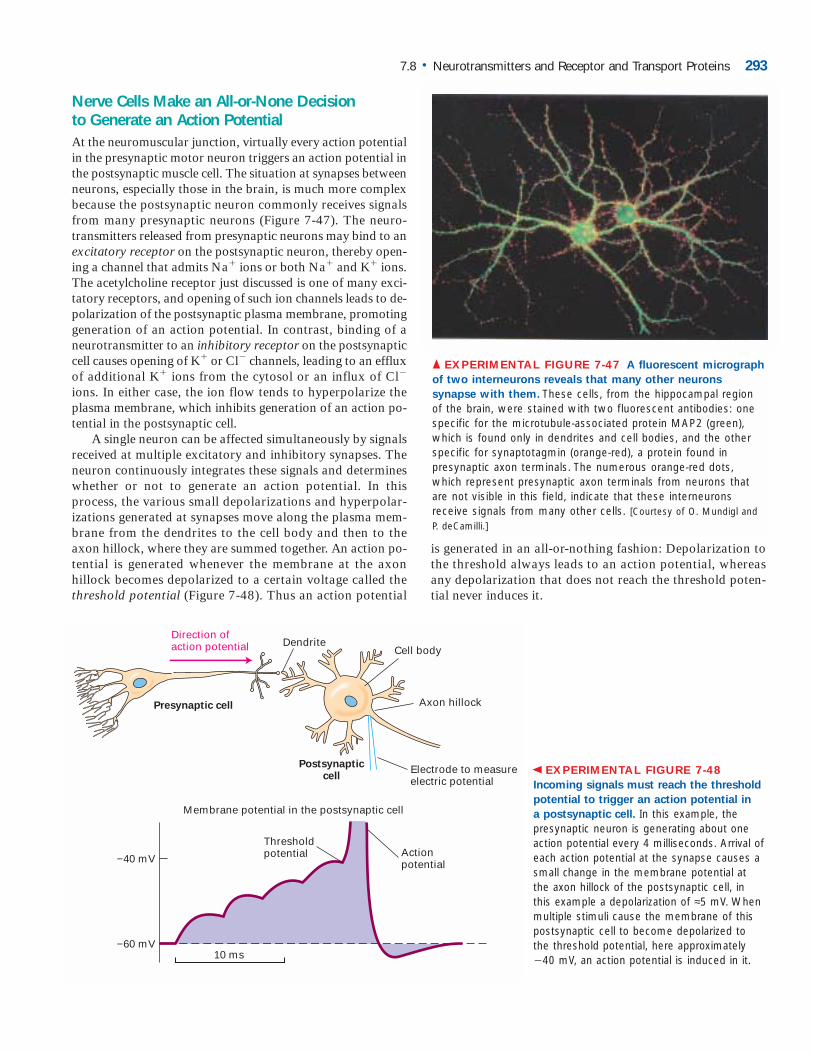
Nerve Cells Make an All-or-None Decision to Generate an Action PotentialAt the neuromuscular junction, virtually every action potentialin the presynaptic motor neuron triggers an action potential inthe postsynaptic muscle cell. The situation at synapses betweenneurons, especially those in the brain, is much more complexbecause the postsynaptic neuron commonly receives signalsfrom many presynaptic neurons (Figure 7-47). The neuro-transmitters released from presynaptic neurons may bind to anexcitatory receptor on the postsynaptic neuron, thereby open-ing a channel that admits Na� ions or both Na� and K� ions.The acetylcholine receptor just discussed is one of many exci-tatory receptors, and opening of such ion channels leads to de-polarization of the postsynaptic plasma membrane, promotinggeneration of an action potential. In contrast, binding of aneurotransmitter to an inhibitory receptor on the postsynapticcell causes opening of K� or Cl� channels, leading to an effluxof additional K� ions from the cytosol or an influx of Cl�
ions. In either case, the ion flow tends to hyperpolarize theplasma membrane, which inhibits generation of an action po-tential in the postsynaptic cell.
A single neuron can be affected simultaneously by signalsreceived at multiple excitatory and inhibitory synapses. Theneuron continuously integrates these signals and determineswhether or not to generate an action potential. In thisprocess, the various small depolarizations and hyperpolar-izations generated at synapses move along the plasma mem-brane from the dendrites to the cell body and then to theaxon hillock, where they are summed together. An action po-tential is generated whenever the membrane at the axonhillock becomes depolarized to a certain voltage called thethreshold potential (Figure 7-48). Thus an action potential
is generated in an all-or-nothing fashion: Depolarization tothe threshold always leads to an action potential, whereasany depolarization that does not reach the threshold poten-tial never induces it.
7.8 • Neurotransmitters and Receptor and Transport Proteins 293
▲ EXPERIMENTAL FIGURE 7-47 A fluorescent micrograph
of two interneurons reveals that many other neurons
synapse with them. These cells, from the hippocampal regionof the brain, were stained with two fluorescent antibodies: onespecific for the microtubule-associated protein MAP2 (green),which is found only in dendrites and cell bodies, and the otherspecific for synaptotagmin (orange-red), a protein found in presynaptic axon terminals. The numerous orange-red dots,which represent presynaptic axon terminals from neurons thatare not visible in this field, indicate that these interneurons receive signals from many other cells. [Courtesy of O. Mundigl andP. deCamilli.]
Direction ofaction potential
Axon hillock
Dendrite
Postsynapticcell
Presynaptic cell
Cell body
Electrode to measureelectric potential
−40 mV
−60 mV
Membrane potential in the postsynaptic cell
Thresholdpotential Action
potential
10 ms
▲ EXPERIMENTAL FIGURE 7-48Incoming signals must reach the threshold
potential to trigger an action potential in
a postsynaptic cell. In this example, thepresynaptic neuron is generating about oneaction potential every 4 milliseconds. Arrival ofeach action potential at the synapse causes asmall change in the membrane potential at the axon hillock of the postsynaptic cell, in this example a depolarization of ≈5 mV. When multiple stimuli cause the membrane of thispostsynaptic cell to become depolarized to the threshold potential, here approximately�40 mV, an action potential is induced in it.
▲
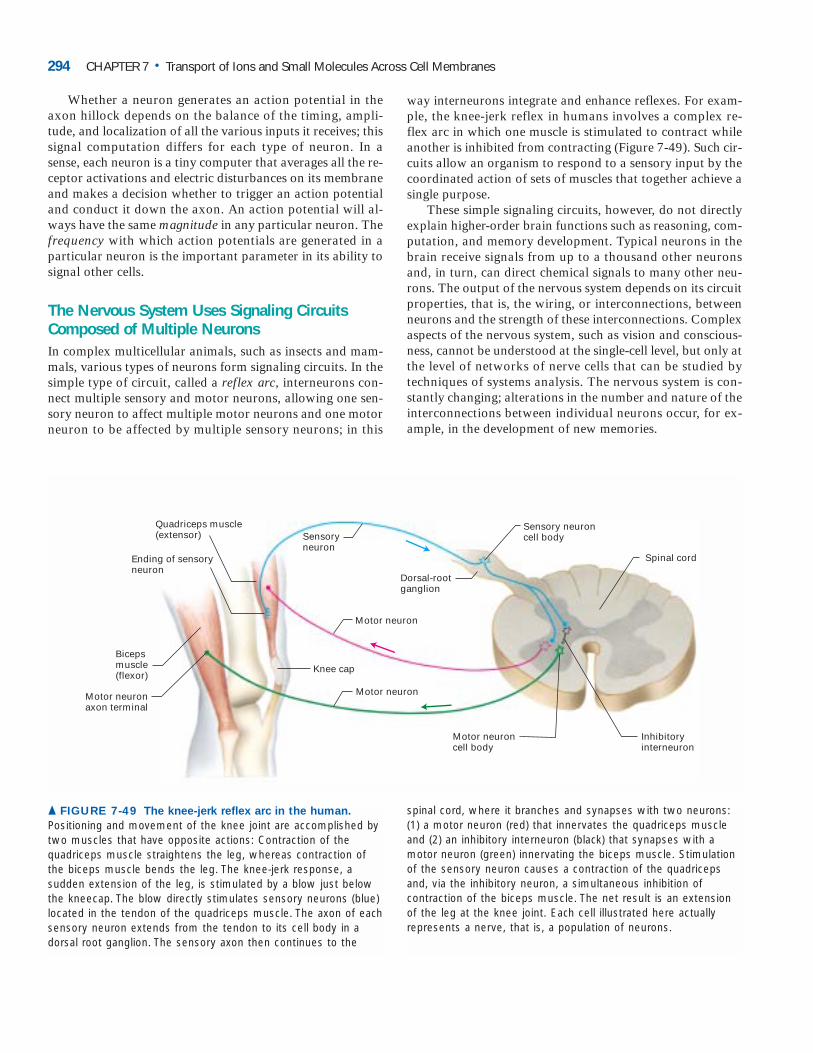
Whether a neuron generates an action potential in theaxon hillock depends on the balance of the timing, ampli-tude, and localization of all the various inputs it receives; thissignal computation differs for each type of neuron. In asense, each neuron is a tiny computer that averages all the re-ceptor activations and electric disturbances on its membraneand makes a decision whether to trigger an action potentialand conduct it down the axon. An action potential will al-ways have the same magnitude in any particular neuron. Thefrequency with which action potentials are generated in aparticular neuron is the important parameter in its ability tosignal other cells.
The Nervous System Uses Signaling CircuitsComposed of Multiple NeuronsIn complex multicellular animals, such as insects and mam-mals, various types of neurons form signaling circuits. In thesimple type of circuit, called a reflex arc, interneurons con-nect multiple sensory and motor neurons, allowing one sen-sory neuron to affect multiple motor neurons and one motorneuron to be affected by multiple sensory neurons; in this
way interneurons integrate and enhance reflexes. For exam-ple, the knee-jerk reflex in humans involves a complex re-flex arc in which one muscle is stimulated to contract whileanother is inhibited from contracting (Figure 7-49). Such cir-cuits allow an organism to respond to a sensory input by thecoordinated action of sets of muscles that together achieve asingle purpose.
These simple signaling circuits, however, do not directlyexplain higher-order brain functions such as reasoning, com-putation, and memory development. Typical neurons in thebrain receive signals from up to a thousand other neuronsand, in turn, can direct chemical signals to many other neu-rons. The output of the nervous system depends on its circuitproperties, that is, the wiring, or interconnections, betweenneurons and the strength of these interconnections. Complexaspects of the nervous system, such as vision and conscious-ness, cannot be understood at the single-cell level, but only atthe level of networks of nerve cells that can be studied bytechniques of systems analysis. The nervous system is con-stantly changing; alterations in the number and nature of theinterconnections between individual neurons occur, for ex-ample, in the development of new memories.
294 CHAPTER 7 • Transport of Ions and Small Molecules Across Cell Membranes
Ending of sensoryneuron
Quadriceps muscle (extensor)
Bicepsmuscle(flexor)
Motor neuronaxon terminal
Motor neuron
Knee cap
Motor neuron
Motor neuroncell body
Sensoryneuron
Sensory neuroncell body
Dorsal-rootganglion
Spinal cord
Inhibitoryinterneuron
▲ FIGURE 7-49 The knee-jerk reflex arc in the human.
Positioning and movement of the knee joint are accomplished bytwo muscles that have opposite actions: Contraction of thequadriceps muscle straightens the leg, whereas contraction ofthe biceps muscle bends the leg. The knee-jerk response, a sudden extension of the leg, is stimulated by a blow just belowthe kneecap. The blow directly stimulates sensory neurons (blue)located in the tendon of the quadriceps muscle. The axon of eachsensory neuron extends from the tendon to its cell body in a dorsal root ganglion. The sensory axon then continues to the
spinal cord, where it branches and synapses with two neurons:(1) a motor neuron (red) that innervates the quadriceps muscleand (2) an inhibitory interneuron (black) that synapses with a motor neuron (green) innervating the biceps muscle. Stimulationof the sensory neuron causes a contraction of the quadricepsand, via the inhibitory neuron, a simultaneous inhibition of contraction of the biceps muscle. The net result is an extensionof the leg at the knee joint. Each cell illustrated here actually represents a nerve, that is, a population of neurons.
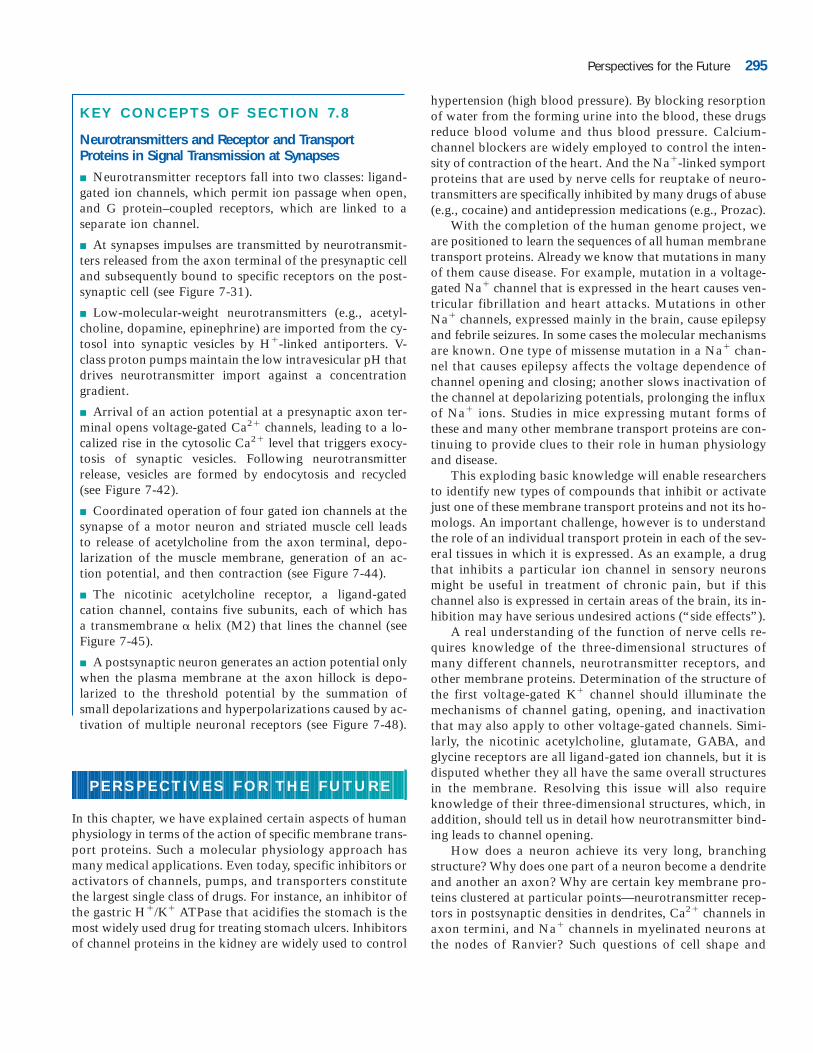
KEY CONCEPTS OF SECTION 7.8
Neurotransmitters and Receptor and Transport Proteins in Signal Transmission at Synapses
■ Neurotransmitter receptors fall into two classes: ligand-gated ion channels, which permit ion passage when open,and G protein–coupled receptors, which are linked to aseparate ion channel.
■ At synapses impulses are transmitted by neurotransmit-ters released from the axon terminal of the presynaptic celland subsequently bound to specific receptors on the post-synaptic cell (see Figure 7-31).
■ Low-molecular-weight neurotransmitters (e.g., acetyl-choline, dopamine, epinephrine) are imported from the cy-tosol into synaptic vesicles by H�-linked antiporters. V-class proton pumps maintain the low intravesicular pH thatdrives neurotransmitter import against a concentrationgradient.
■ Arrival of an action potential at a presynaptic axon ter-minal opens voltage-gated Ca2� channels, leading to a lo-calized rise in the cytosolic Ca2� level that triggers exocy-tosis of synaptic vesicles. Following neurotransmitterrelease, vesicles are formed by endocytosis and recycled(see Figure 7-42).
■ Coordinated operation of four gated ion channels at thesynapse of a motor neuron and striated muscle cell leadsto release of acetylcholine from the axon terminal, depo-larization of the muscle membrane, generation of an ac-tion potential, and then contraction (see Figure 7-44).
■ The nicotinic acetylcholine receptor, a ligand-gatedcation channel, contains five subunits, each of which hasa transmembrane � helix (M2) that lines the channel (seeFigure 7-45).
■ A postsynaptic neuron generates an action potential onlywhen the plasma membrane at the axon hillock is depo-larized to the threshold potential by the summation ofsmall depolarizations and hyperpolarizations caused by ac-tivation of multiple neuronal receptors (see Figure 7-48).
P E R S P E C T I V E S F O R T H E F U T U R E
In this chapter, we have explained certain aspects of humanphysiology in terms of the action of specific membrane trans-port proteins. Such a molecular physiology approach hasmany medical applications. Even today, specific inhibitors oractivators of channels, pumps, and transporters constitutethe largest single class of drugs. For instance, an inhibitor ofthe gastric H�/K� ATPase that acidifies the stomach is themost widely used drug for treating stomach ulcers. Inhibitorsof channel proteins in the kidney are widely used to control
hypertension (high blood pressure). By blocking resorptionof water from the forming urine into the blood, these drugsreduce blood volume and thus blood pressure. Calcium-channel blockers are widely employed to control the inten-sity of contraction of the heart. And the Na�-linked symportproteins that are used by nerve cells for reuptake of neuro-transmitters are specifically inhibited by many drugs of abuse(e.g., cocaine) and antidepression medications (e.g., Prozac).
With the completion of the human genome project, weare positioned to learn the sequences of all human membranetransport proteins. Already we know that mutations in manyof them cause disease. For example, mutation in a voltage-gated Na� channel that is expressed in the heart causes ven-tricular fibrillation and heart attacks. Mutations in otherNa� channels, expressed mainly in the brain, cause epilepsyand febrile seizures. In some cases the molecular mechanismsare known. One type of missense mutation in a Na� chan-nel that causes epilepsy affects the voltage dependence ofchannel opening and closing; another slows inactivation ofthe channel at depolarizing potentials, prolonging the influxof Na� ions. Studies in mice expressing mutant forms ofthese and many other membrane transport proteins are con-tinuing to provide clues to their role in human physiologyand disease.
This exploding basic knowledge will enable researchersto identify new types of compounds that inhibit or activatejust one of these membrane transport proteins and not its ho-mologs. An important challenge, however is to understandthe role of an individual transport protein in each of the sev-eral tissues in which it is expressed. As an example, a drugthat inhibits a particular ion channel in sensory neuronsmight be useful in treatment of chronic pain, but if thischannel also is expressed in certain areas of the brain, its in-hibition may have serious undesired actions (“side effects”).
A real understanding of the function of nerve cells re-quires knowledge of the three-dimensional structures ofmany different channels, neurotransmitter receptors, andother membrane proteins. Determination of the structure ofthe first voltage-gated K� channel should illuminate themechanisms of channel gating, opening, and inactivationthat may also apply to other voltage-gated channels. Simi-larly, the nicotinic acetylcholine, glutamate, GABA, andglycine receptors are all ligand-gated ion channels, but it isdisputed whether they all have the same overall structuresin the membrane. Resolving this issue will also requireknowledge of their three-dimensional structures, which, inaddition, should tell us in detail how neurotransmitter bind-ing leads to channel opening.
How does a neuron achieve its very long, branchingstructure? Why does one part of a neuron become a dendriteand another an axon? Why are certain key membrane pro-teins clustered at particular points—neurotransmitter recep-tors in postsynaptic densities in dendrites, Ca2� channels inaxon termini, and Na� channels in myelinated neurons atthe nodes of Ranvier? Such questions of cell shape and
Perspectives for the Future 295
transport process has two terms. What are these two terms,and why does the second not apply to glucose? Why are cotransporters often referred to as examples of secondary ac-tive transport?
4. GLUT1, found in the plasma membrane of erythrocytes,is a classic example of a uniporter. Design a set of experi-ments to prove that GLUT1 is indeed a glucose-specific uni-porter rather than a galactose- or mannose-specific uniporter.Glucose is a 6-carbon sugar while ribose is a 5-carbon sugar.Despite this smaller size, ribose is not efficiently transportedby GLUT1. How can this be explained?
5. Name the four classes of ATP-powered pumps that pro-duce active transport of ions and molecules. Indicate whichof these classes transport ions only and which transport pri-marily small molecules. In the case of one class of these ATP-powered pumps, the initial discovery of the class came fromstudying not the transport of a natural substrate but ratherartificial substrates used as cancer chemotherapy drugs.What do investigators now think are common examples ofthe natural substrates of this particular class of ATP-poweredpumps?
6. Genome sequencing projects continue, and for an in-creasing number of organisms the complete genome sequenceof that organism is known. How does this information allowus to state the total number of transporters or pumps of agiven type in either mice or humans? Many of the sequence-identified transporters or pumps are “orphan” proteins, inthe sense that their natural substrate or physiological role isnot known. How can this be, and how might one establishthe physiological role of an orphan protein?
7. As cited in the section Perspectives for the Future, spe-cific inhibitors or activators of channels, pumps, and trans-porters constitute the largest single class of drugs producedby the pharmaceutical industry. Skeletal muscle contractionis caused by elevation of Ca2� concentration in the cytosol.What is the expected effect on muscle contraction of selectivedrug inhibition of sarcoplasmic reticulum (SR) P-class Ca2�
ATPase?
8. The membrane potential in animal cells, but not inplants, depends largely on resting K� channels. How dothese channels contribute to the resting potential? Why arethese channels considered to be nongated channels? How dothese channels achieve selectivity for K� versus Na�?
9. Patch clamping can be used to measure the conductanceproperties of individual ion channels. Describe how patchclamping can be used to determine whether or not the genecoding for a putative K� channel actually codes for a K� orNa� channel.
10. Plants use the proton electrochemical gradient across thevacuole membrane to power the accumulation of salts andsugars in the organelle. This creates a hypertonic situation.Why does this not result in the plant cell bursting? How does
protein targeting also apply to other types of cells, but themorphological diversity of different types of neurons makesthese particularly intriguing questions in the nervous system.Development of pure cultures of specific types of neuronsthat maintain their normal properties would enable many ofthese problems to be studied by techniques of molecular cellbiology. Perhaps the most difficult questions concern the for-mation of specific synapses within the nervous system; thatis, how does a neuron “know” to synapse with one type ofcell and not another? Ongoing research on the developmentof the nervous system, which we briefly discuss in Chapter15, is beginning to provide more complete answers about thecomplex wiring among neurons and how this relates to brainfunction.
KEY TERMS
ABC superfamily 239action potential 231active transport 233antiport 254cotransport 254depolarization 263electrochemical
gradient 232facilitated diffusion 233gated channel 233hypertonic 258hypotonic 258isotonic 258
REVIEW THE CONCEPTS
1. The basic structural unit of biomembranes is the phos-pholipid bilayer. Acetic acid and ethanol are composed eachof two carbons, hydrogen and oxygen, and both enter cellsby passive diffusion. At pH 7, one is much more membranepermeant than the other. Which is the more permeable, andwhy? Predict how the permeability of each is altered whenpH is reduced to 1.0, a value typical of the stomach.
2. Uniporters and ion channels support facilitated diffusionacross biomembranes. Although both are examples of facili-tated diffusion, the rates of ion movement via a channel areroughly 104- to 105-fold faster than that of molecules via auniporter. What key mechanistic difference results in thislarge difference in transport rate?
3. Name the three classes of transporters. Explain which ofthese classes is able to move glucose or bicarbonate(HCO3
�), for example, against an electrochemical gradient.In the case of bicarbonate, but not glucose, the �G of the
296 CHAPTER 7 • Transport of Ions and Small Molecules Across Cell Membranes
membrane potential 232myelin sheath 270Na�/K� ATPase 242neurotransmitter 262passive diffusion 232patch clamping 251resting K� channels 248symport 254synapses 263tight junctions 260transcellular transport
260uniport 234
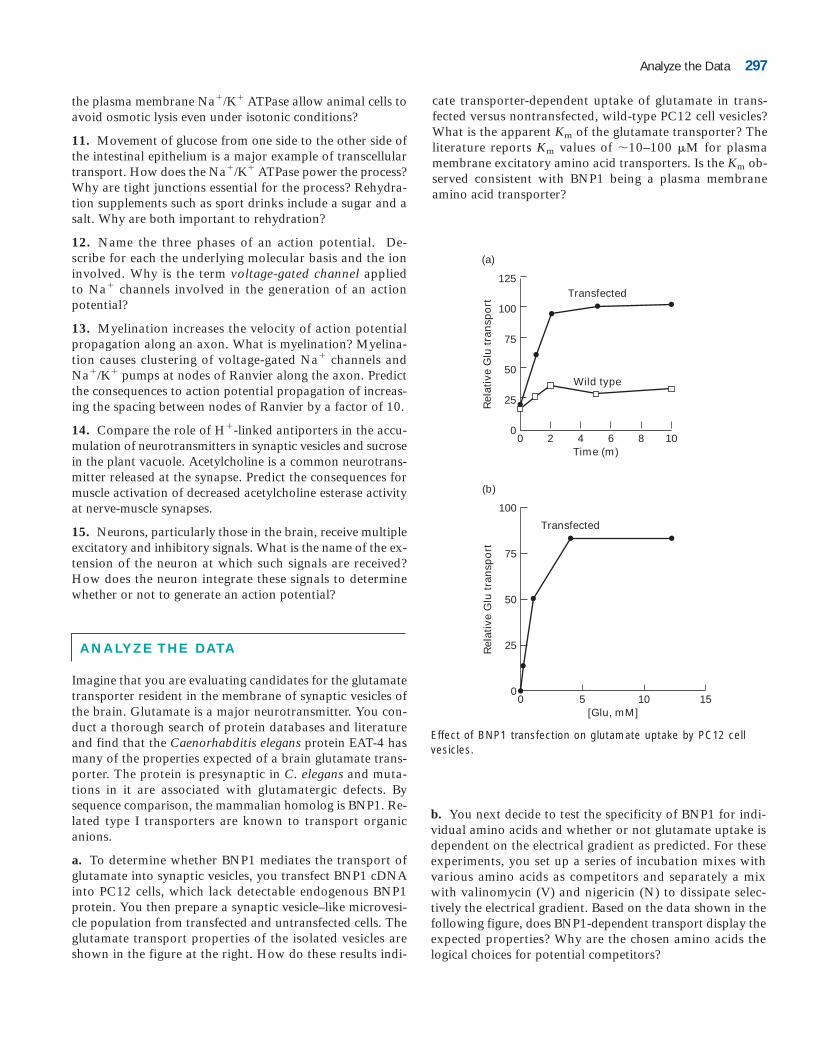
the plasma membrane Na�/K� ATPase allow animal cells toavoid osmotic lysis even under isotonic conditions?
11. Movement of glucose from one side to the other side ofthe intestinal epithelium is a major example of transcellulartransport. How does the Na�/K� ATPase power the process?Why are tight junctions essential for the process? Rehydra-tion supplements such as sport drinks include a sugar and asalt. Why are both important to rehydration?
12. Name the three phases of an action potential. De-scribe for each the underlying molecular basis and the ion involved. Why is the term voltage-gated channel applied to Na� channels involved in the generation of an action potential?
13. Myelination increases the velocity of action potentialpropagation along an axon. What is myelination? Myelina-tion causes clustering of voltage-gated Na� channels andNa�/K� pumps at nodes of Ranvier along the axon. Predictthe consequences to action potential propagation of increas-ing the spacing between nodes of Ranvier by a factor of 10.
14. Compare the role of H�-linked antiporters in the accu-mulation of neurotransmitters in synaptic vesicles and sucrosein the plant vacuole. Acetylcholine is a common neurotrans-mitter released at the synapse. Predict the consequences formuscle activation of decreased acetylcholine esterase activityat nerve-muscle synapses.
15. Neurons, particularly those in the brain, receive multipleexcitatory and inhibitory signals. What is the name of the ex-tension of the neuron at which such signals are received?How does the neuron integrate these signals to determinewhether or not to generate an action potential?
ANALYZE THE DATA
Imagine that you are evaluating candidates for the glutamatetransporter resident in the membrane of synaptic vesicles ofthe brain. Glutamate is a major neurotransmitter. You con-duct a thorough search of protein databases and literatureand find that the Caenorhabditis elegans protein EAT-4 hasmany of the properties expected of a brain glutamate trans-porter. The protein is presynaptic in C. elegans and muta-tions in it are associated with glutamatergic defects. Bysequence comparison, the mammalian homolog is BNP1. Re-lated type I transporters are known to transport organic anions.
a. To determine whether BNP1 mediates the transport ofglutamate into synaptic vesicles, you transfect BNP1 cDNAinto PC12 cells, which lack detectable endogenous BNP1protein. You then prepare a synaptic vesicle–like microvesi-cle population from transfected and untransfected cells. Theglutamate transport properties of the isolated vesicles areshown in the figure at the right. How do these results indi-
cate transporter-dependent uptake of glutamate in trans-fected versus nontransfected, wild-type PC12 cell vesicles?What is the apparent Km of the glutamate transporter? Theliterature reports Km values of �10–100 M for plasmamembrane excitatory amino acid transporters. Is the Km ob-served consistent with BNP1 being a plasma membraneamino acid transporter?
125
100
75
50
25
00 2 4
Transfected
Wild type
(a)
Time (m)
Rel
ativ
e G
lu t
ran
spo
rt
6 8 10
100
75
50
25
00 5 10 15
Transfected
(b)
[Glu, mM]
Rel
ativ
e G
lu t
ran
spo
rt
Analyze the Data 297
Effect of BNP1 transfection on glutamate uptake by PC12 cellvesicles.
b. You next decide to test the specificity of BNP1 for indi-vidual amino acids and whether or not glutamate uptake isdependent on the electrical gradient as predicted. For theseexperiments, you set up a series of incubation mixes withvarious amino acids as competitors and separately a mixwith valinomycin (V) and nigericin (N) to dissipate selec-tively the electrical gradient. Based on the data shown in thefollowing figure, does BNP1-dependent transport display theexpected properties? Why are the chosen amino acids thelogical choices for potential competitors?
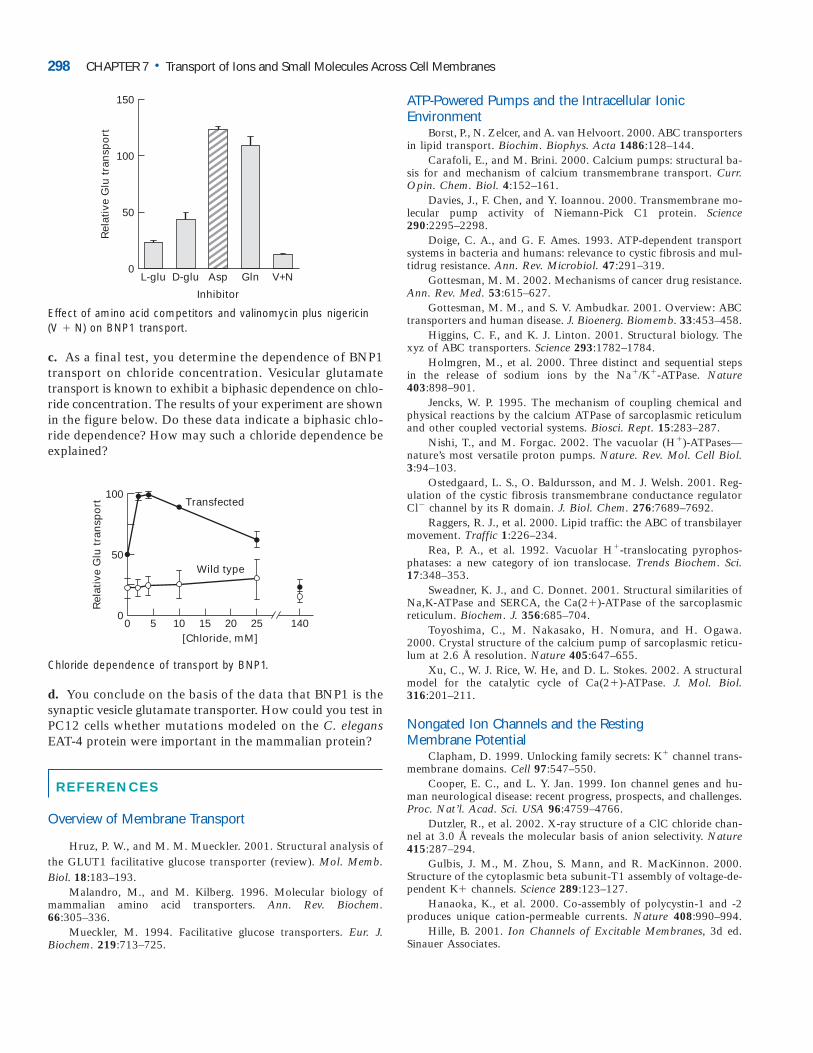
Effect of amino acid competitors and valinomycin plus nigericin(V � N) on BNP1 transport.
c. As a final test, you determine the dependence of BNP1transport on chloride concentration. Vesicular glutamatetransport is known to exhibit a biphasic dependence on chlo-ride concentration. The results of your experiment are shownin the figure below. Do these data indicate a biphasic chlo-ride dependence? How may such a chloride dependence beexplained?
Chloride dependence of transport by BNP1.
d. You conclude on the basis of the data that BNP1 is thesynaptic vesicle glutamate transporter. How could you test inPC12 cells whether mutations modeled on the C. elegansEAT-4 protein were important in the mammalian protein?
REFERENCES
Overview of Membrane Transport
Hruz, P. W., and M. M. Mueckler. 2001. Structural analysis ofthe GLUT1 facilitative glucose transporter (review). Mol. Memb.Biol. 18:183–193.
Malandro, M., and M. Kilberg. 1996. Molecular biology ofmammalian amino acid transporters. Ann. Rev. Biochem.66:305–336.
Mueckler, M. 1994. Facilitative glucose transporters. Eur. J.Biochem. 219:713–725.
100
50
00 10
Rel
ativ
e G
lu t
ran
spo
rt
25155 20[Chloride, mM]
140
Transfected
Wild type
150
100
50
L-glu D-glu Asp
Inhibitor
Rel
ativ
e G
lu t
ran
spo
rt
Gln V+N0
ATP-Powered Pumps and the Intracellular Ionic Environment
Borst, P., N. Zelcer, and A. van Helvoort. 2000. ABC transportersin lipid transport. Biochim. Biophys. Acta 1486:128–144.
Carafoli, E., and M. Brini. 2000. Calcium pumps: structural ba-sis for and mechanism of calcium transmembrane transport. Curr.Opin. Chem. Biol. 4:152–161.
Davies, J., F. Chen, and Y. Ioannou. 2000. Transmembrane mo-lecular pump activity of Niemann-Pick C1 protein. Science290:2295–2298.
Doige, C. A., and G. F. Ames. 1993. ATP-dependent transportsystems in bacteria and humans: relevance to cystic fibrosis and mul-tidrug resistance. Ann. Rev. Microbiol. 47:291–319.
Gottesman, M. M. 2002. Mechanisms of cancer drug resistance.Ann. Rev. Med. 53:615–627.
Gottesman, M. M., and S. V. Ambudkar. 2001. Overview: ABCtransporters and human disease. J. Bioenerg. Biomemb. 33:453–458.
Higgins, C. F., and K. J. Linton. 2001. Structural biology. Thexyz of ABC transporters. Science 293:1782–1784.
Holmgren, M., et al. 2000. Three distinct and sequential stepsin the release of sodium ions by the Na�/K�-ATPase. Nature403:898–901.
Jencks, W. P. 1995. The mechanism of coupling chemical andphysical reactions by the calcium ATPase of sarcoplasmic reticulumand other coupled vectorial systems. Biosci. Rept. 15:283–287.
Nishi, T., and M. Forgac. 2002. The vacuolar (H�)-ATPases—nature’s most versatile proton pumps. Nature. Rev. Mol. Cell Biol.3:94–103.
Ostedgaard, L. S., O. Baldursson, and M. J. Welsh. 2001. Reg-ulation of the cystic fibrosis transmembrane conductance regulatorCl� channel by its R domain. J. Biol. Chem. 276:7689–7692.
Raggers, R. J., et al. 2000. Lipid traffic: the ABC of transbilayermovement. Traffic 1:226–234.
Rea, P. A., et al. 1992. Vacuolar H�-translocating pyrophos-phatases: a new category of ion translocase. Trends Biochem. Sci.17:348–353.
Sweadner, K. J., and C. Donnet. 2001. Structural similarities ofNa,K-ATPase and SERCA, the Ca(2�)-ATPase of the sarcoplasmicreticulum. Biochem. J. 356:685–704.
Toyoshima, C., M. Nakasako, H. Nomura, and H. Ogawa.2000. Crystal structure of the calcium pump of sarcoplasmic reticu-lum at 2.6 Å resolution. Nature 405:647–655.
Xu, C., W. J. Rice, W. He, and D. L. Stokes. 2002. A structuralmodel for the catalytic cycle of Ca(2�)-ATPase. J. Mol. Biol.316:201–211.
Nongated Ion Channels and the Resting Membrane Potential
Clapham, D. 1999. Unlocking family secrets: K� channel trans-membrane domains. Cell 97:547–550.
Cooper, E. C., and L. Y. Jan. 1999. Ion channel genes and hu-man neurological disease: recent progress, prospects, and challenges.Proc. Nat’l. Acad. Sci. USA 96:4759–4766.
Dutzler, R., et al. 2002. X-ray structure of a ClC chloride chan-nel at 3.0 Å reveals the molecular basis of anion selectivity. Nature415:287–294.
Gulbis, J. M., M. Zhou, S. Mann, and R. MacKinnon. 2000.Structure of the cytoplasmic beta subunit-T1 assembly of voltage-de-pendent K� channels. Science 289:123–127.
Hanaoka, K., et al. 2000. Co-assembly of polycystin-1 and -2produces unique cation-permeable currents. Nature 408:990–994.
Hille, B. 2001. Ion Channels of Excitable Membranes, 3d ed.Sinauer Associates.
298 CHAPTER 7 • Transport of Ions and Small Molecules Across Cell Membranes
Montell, C., L. Birnbaumer, and V. Flockerzi. 2002. The TRPchannels, a remarkably functional family. Cell 108:595–598.
Neher, E. 1992. Ion channels for communication between andwithin cells. Nobel Lecture reprinted in Neuron 8:605–612 and Sci-ence 256:498–502.
Neher, E., and B. Sakmann. 1992. The patch clamp technique.Sci. Am. 266(3):28–35.
Nichols, C., and A. Lopatin. 1997. Inward rectifier potassiumchannels. Ann. Rev. Physiol. 59:171–192.
Yi, B. A., et al. 2001. Controlling potassium channel activities:interplay between the membrane and intracellular factors. Proc.Nat’l. Acad. Sci. USA 98:11016–11023.
Zhou, M., J. H. Morais-Cabral, S. Mann, and R. MacKinnon.2001. Potassium channel receptor site for the inactivation gate andquaternary amine inhibitors. Nature 411:657–661.
Zhou, Y., J. Morais-Cabral, A. Kaufman, and R. MacKinnon.2001. Chemistry of ion coordination and hydration revealed by aK� channel–Fab complex at 2 Å resolution. Nature 414:43–48.
Cotransport by Symporters and AntiportersAlper, S. L., M. N. Chernova, and A. K. Stewart. 2001. Regu-
lation of Na�-independent Cl�/HCO3� exchangers by pH. J. Pan-
creas 2:171–175.Barkla, B., and O. Pantoja. 1996. Physiology of ion transport
across the tonoplast of higher plants. Ann. Rev. Plant Physiol. PlantMol. Biol. 47:159–184.
Orlowski, J., and S. Grinstein. 1997. Na�/H� exchangers ofmammalian cells. J. Biol. Chem. 272:22373–22376.
Shrode, L. D., H. Tapper, and S. Grinstein. 1997. Role of intra-cellular pH in proliferation, transformation, and apoptosis. J. Bioen-erg. Biomemb. 29:393–399.
Wakabayashi, S., M. Shigekawa, and J. Pouyssegur. 1997. Mol-ecular physiology of vertebrate Na�/H� exchangers. Physiol. Rev.77:51–74.
Wright, E. M. 2001. Renal Na(�)-glucose cotransporters. Am.J. Physiol. Renal Physiol. 280:F10–F18.
Wright, E. M., and D. D. Loo. 2000. Coupling between Na�,sugar, and water transport across the intestine. Ann. NY Acad. Sci.915:54–66.
Zhang, H-X., and E. Blumwald. 2001. Transgenic salt-toleranttomato plants accumulate salt in foliage but not in fruit. NatureBiotech. 19:765–769.
Movement of WaterAgre, P., M. Bonhivers, and M. Borgina. 1998. The aquaporins,
blueprints for cellular plumbing systems. J. Biol. Chem. 273:14659.Engel, A., Y. Fujiyoshi, and P. Agre. 2000. The importance of
aquaporin water channel protein structures. EMBO J. 19:800–806.Maurel, C. 1997. Aquaporins and water permeability of plant
membranes. Ann. Rev. Plant Physiol. Plant Mol. Biol. 48:399–430.Nielsen, S., et al. 2002. Aquaporins in the kidney: from mole-
cules to medicine. Physiol. Rev. 82:205–244.Schultz, S. G. 2001. Epithelial water absorption: osmosis or co-
transport? Proc. Nat’l. Acad. Sci. USA 98:3628–3630.Sui, H., et al. 2001. Structural basis of water-specific transport
through the AQP1 water channel. Nature 414:872–878.Verkman, A. S. 2000. Physiological importance of aquaporins:
lessons from knockout mice. Curr. Opin. Nephrol. Hypertens.9:517–522.
Transepithelial TransportCereijido, M., J. Valdés, L. Shoshani, and R. Conteras. 1998.
Role of tight junctions in establishing and maintaining cell polarity.Ann. Rev. Physiol. 60:161–177.
Goodenough, D. A. 1999. Plugging the leaks. Proc. Nat’l. Acad.Sci. USA 96:319.
Mitic, L., and J. Anderson. 1998. Molecular architecture of tightjunctions. Ann. Rev. Physiol. 60:121–142.
Schultz, S., et al., eds. 1997. Molecular Biology of MembraneTransport Disorders. Plenum Press.
Propagation of Electric Impulses by Gated Ion ChannelsAldrich, R. W. 2001. Fifty years of inactivation. Nature
411:643–644.Armstrong, C., and B. Hille. 1998. Voltage-gated ion channels
and electrical excitability. Neuron 20:371–380.Catterall, W. A. 2000. From ionic currents to molecular mech-
anisms: the structure and function of voltage-gated sodium channels.Neuron 26:13–25.
Catterall, W. A. 2000. Structure and regulation of voltage-gatedCa2� channels. Ann. Rev. Cell Dev. Biol. 16:521–555.
Catterall, W. A. 2001. A 3D view of sodium channels. Nature409:988–989.
del Camino, D., and G. Yellen. 2001. Tight steric closure at theintracellular activation gate of a voltage-gated K(�) channel. Neu-ron 32:649–656.
Doyle, D. A., et al. 1998. The structure of the potassium chan-nel: molecular basis of K� conduction and selectivity. Science280:69–77.
Hille, B. 2001. Ion Channels of Excitable Membranes, 3d ed.Sinauer Associates.
Jan, Y. N., and L. Y. Jan. 2001. Dendrites. Genes Dev.15:2627–2641.
Miller, C. 2000. Ion channel surprises: prokaryotes do it again!Neuron 25:7–9.
Sato, C., et al. 2001. The voltage-sensitive sodium channel is abell-shaped molecule with several cavities. Nature 409:1047–1051.
Yi, B. A., and L. Y. Jan. 2000. Taking apart the gating of volt-age-gated K� channels. Neuron 27:423–425.
MyelinArroyo, E. J., and S. S. Scherer. 2000. On the molecular archi-
tecture of myelinated fibers. Histochem. Cell Biol. 113:1–18.Pedraza, L., J. K. Huang, and D. R. Colman. 2001. Organizing
principles of the axoglial apparatus. Neuron 30:335–344.Salzer, J. L. 1997. Clustering sodium channels at the node of
Ranvier: close encounters of the axon-glia kind. Neuron 18:843–846.Trapp, B. D., and G. J. Kidd. 2000. Axo-glial septate junctions.
The maestro of nodal formation and myelination? J. Cell Biol.150:F97–F100.
Neurotransmitters and Transport Proteins in the Transmission of Electric Impulses
Amara, S. G., and M. J. Kuhar. 1993. Neurotransmitter trans-porters: recent progress. Ann. Rev. Neurosci. 16:73–93.
Bajjalieh, S. M., and R. H. Scheller. 1995. The biochemistry ofneurotransmitter secretion. J. Biol. Chem. 270:1971–1974.
Betz, W., and J. Angleson. 1998. The synaptic vesicle cycle. Ann.Rev. Physiol. 60:347–364.
Brejc, K., et al. 2001. Crystal structure of an ACh-binding pro-tein reveals the ligand-binding domain of nicotinic receptors. Nature411:269–276.
Fernandez, J. M. 1997. Cellular and molecular mechanics byatomic force microscopy: capturing the exocytotic fusion pore invivo? Proc. Nat’l. Acad. Sci. USA 94:9–10.
Ikeda, S. R. 2001. Signal transduction. Calcium channels—linklocally, act globally. Science 294:318–319.
References 299
Jan, L. Y., and C. F. Stevens. 2000. Signaling mechanisms: adecade of signaling. Curr. Opin. Neurobiol. 10:625–630.
Karlin, A. 2002. Emerging structure of the nicotinic acetylcholinereceptors. Nature Rev. Neurosci. 3:102–114.
Kavanaugh, M. P. 1998. Neurotransmitter transport: models influx. Proc. Nat’l. Acad. Sci. USA 95:12737–12738.
Lin, R. C., and R. H. Scheller. 2000. Mechanisms of synapticvesicle exocytosis. Ann. Rev. Cell Dev. Biol. 16:19–49.
Neher, E. 1998. Vesicle pools and Ca2� microdo-mains: newtools for understanding their roles in neurotransmitter release. Neu-ron 20:389–399.
Reith, M., ed. 1997. Neurotransmitter Transporters: Structure,Function, and Regulation. Humana Press.
Sakmann, B. 1992. Elementary steps in synaptic transmission re-vealed by currents through single ion channels. Nobel Lecturereprinted in EMBO J. 11:2002–2016 and Science 256:503–512.
Sudhof, T. C. 1995. The synaptic vesicle cycle: a cascade of protein-protein interactions. Nature 375:645–653.
Usdin, T. B., L. E. Eiden, T. I. Bonner, and J. D. Erickson. 1995.Molecular biology of the vesicular ACh transporter. Trends Neurosci.18:218–224.
300 CHAPTER 7 • Transport of Ions and Small Molecules Across Cell Membranes