TRANSPORT FOR LONDON - London Undergroundcontent.tfl.gov.uk/motorcycle-user-survey-report-06.pdf ·...
90
TRANSPORT FOR LONDON P2W USER SURVEY 2004 FINAL REPORT
-
Upload
nguyentuyen -
Category
Documents
-
view
215 -
download
1
Transcript of TRANSPORT FOR LONDON - London Undergroundcontent.tfl.gov.uk/motorcycle-user-survey-report-06.pdf ·...

TRANSPORT FOR LONDON P2W USER SURVEY 2004 FINAL REPORT

P2W USER SURVEY 2004 FINAL REPORT Disclaimer Results presented in this report are based on research carried out by FDS International and do not necessarily represent the views of Transport for London PREPARED FOR:
PREPARED BY:
Transport for London 16th Floor Windsor House 42-50 Victoria Street London SW1H 0TL Tel: 020 7941 4554 r7029/SL/AR
FDS International Ltd. Hill House Highgate Hill London N19 5NA Tel: 020 7272 7766 October 2005

MANAGEMENT SUMMARY Research was undertaken to help the London Road Safety Unit achieve a better statistical understanding of powered two-wheeler (P2W) users in London and factors influencing their safety. This will assist LRSU in developing strategies to reduce P2W casualties. From September to November 2004, FDS conducted 504 telephone interviews with a representative sample of Londoners who ever ride P2Ws in London. Additionally, 80 motorcycle couriers were interviewed face-to-face. Detailed profiles were obtained of P2W riders in terms of:- • • • • •
demographics riding and training experience current riding patterns/frequencies makes, types, engine sizes and ages of P2Ws ridden safety clothing worn.
Additionally, we explored their attitudes towards riding and safety issues and their recent experiences of P2W accidents and near misses. From the initial contact study of a representative sample of London households where we were seeking to find P2W riders, it appears that less than 2% of adults living in London ride P2Ws. This proportion is highest for 35-54 year olds, but lower for the under 25s and much lower for the over 65s. About five out of six riders are aged 25-54. Men are more likely than women to ride P2Ws, women accounting for only one in seven riders in London. While teenagers account for only around 3% of current riders, the detailed survey of P2W riders shows about half those surveyed started riding in their teens. Almost half of all riders have over ten years experience of riding on public roads and this proportion is much higher among couriers.
s i Summary

The telephone survey of 504 P2W riders demonstrates that the main types of P2Ws ridden in London are:- •
•
•
• • •
•
•
•
Scooters – especially popular among younger riders and women Naked style (unfaired machines, similar to the example on p.15) – particularly popular with older riders and couriers Supersport style – with a younger-than-average rider profile and favoured
especially by P2W enthusiasts and those from higher socio-economic groups (ABC1s).
About one in three interviewees ride P2Ws with each of the following engine sizes:-
up to 125cc 126-600cc over 600cc.
Women and less experienced riders are more likely to ride less powerful P2Ws. Most P2W riders hold full licences and over half have licences entitling them to ride any type of P2W. Younger riders typically obtained their licence through a direct access test, although older riders usually obtained licences through other means, and had less formal training before they started riding. About one in six of the main sample had had further road training or skills development since obtaining their full licence. BikeSafe-London was the most widely mentioned course attended in the last year, and was found very useful by most participants. Riders vary greatly in terms of safety clothing they wear. Most wear protective suits (or protective jackets and trousers), boots and gloves but riders of mopeds, especially, do not always wear protection. Miles ridden vary enormously. Most couriers ride over 30,000 miles per year most of it in London. In the main sample, a typical P2W rider covers:-
3,000-5,000 miles per year in total including around 2,000 miles in London but only around 500 miles in inner London
s ii Summary

Most riders interviewed in the main study have very positive views of their own abilities, rating themselves as confident, and almost half believing themselves more skilful than the average P2W rider. Very few rated themselves as cautious or with below-average skill. Experienced riders are particularly confident but even new riders and those who only passed their test within the last three years often rate themselves as confident and above-averagely skilful. Almost half those interviewed admitted breaking speed limits while three in five change lanes frequently in slow-moving traffic. While they agree they have a responsibility to ride defensively many inexperienced riders in particular, are quick to place the blame for accidents on to other road users, and to put the onus on pedestrians to look out for riders filtering when crossing roads. Riders who are more willing to place the responsibility on others for avoiding accidents are more likely to have accidents or near misses themselves. Likelihood of having accidents did not show marked difference by gender, social grade or type/engine size of vehicle. However, younger riders are relatively more likely to have accidents, especially accidents involving injury, than are the over 45s. Younger riders are also more likely than older riders to admit to having near misses. Most of those involved in accidents (and this is consistent with police statistics) said they were proceeding ahead normally at the time of the accident and blamed other drivers for the incident. Where accidents involve injury, most riders say their riding was affected, for example through becoming more cautious as a result. Riders’ main suggestions for improving safety for those riding mopeds, motorcycles or scooters in London are to:- •
•
•
•
allow P2Ws to use bus/cyclist lanes increase other road users’ awareness of riders insist on more training/education for riders/other road users resurface/repair roads.
With fewer cars on the roads, many riders feel congestion charging has made it safer to ride a P2W in central London, although they also complain parking has become more difficult.
s iii Summary
Questions on motorcycle/scooter events attended and publications read show marked differences between riders of more and less powerful machines. More ‘enthusiastic’ riders with higher engine capacities, and who have had additional training, are more likely to attend events and meets and to read specialist magazines than are other riders. Media targeted specifically at P2W riders are therefore often effective at reaching the most enthusiastic riders, but not as effective at reaching the utilitarian P2W owner who rides for convenience rather than enjoyment.
Stephen Link Director
October 2005
s iv Summary

CONTENTS PAGE
1 BACKGROUND 1
2 METHODOLOGY 2
3 INCIDENCE OF P2W RIDERS 5
4 RIDER PROFILE 8
4.1. Demographic profiles 8
5 RIDING EXPERIENCE 13
5.1. When respondents started riding 13
5.2. How long respondents have been riding 14
6 CHARACTERISTICS OF P2WS OWNED 15
6.1. Types of P2Ws 15
6.2. Makes of P2Ws 17
6.3. Engine size of P2Ws 18
6.4. Age of P2W 19
7 LICENCES 20
8 RIDING PATTERNS 22
8.1. Miles ridden by respondents 22
8.2. When respondents ride in London 25
8.3. Purposes for which respondents ride 27
8.4. Why respondents ride in London 29
9 ATTITUDES TOWARDS RIDING 31
9.1. Respondents’ confidence in their riding 31
9.2. What annoys respondents? 34
9.3. Respondents’ riding behaviour 36
9.4. Respondents’ attitudes to riding in London 38
c i Contents r7029v8.doc, 15/12/2005, 175

CONTENTS CONT… PAGE
10 SAFETY MEASURES 42
10.1. Headlights 42
10.2. Safety clothing 43
11 TRAINING 48
11.1. Training before test 48
11.2. Training after test 49
12 ACCIDENTS, NEAR MISSES AND SAFETY 53
12.1. Accidents 53
12.2. Near misses 62
12.3. Respondents’ views of manoeuvres 65
12.4. Improving rider safety 66
12.5. Theft/damage 68
12.6. Reasons for giving up riding 70
13 EFFECTS OF CONGESTION CHARGE 71
13.1. Riding in congestion charge zone 71
13.2. Parking 73
14 ACTIVITIES ASSOCIATED WITH RIDING 74
15 CONCLUSIONS AND RECOMMENDATIONS 80 APPENDIX The Questionnaires
c ii Contents r7029v8.doc, 15/12/2005, 175

1
•
•
•
BACKGROUND With numbers of motorcycle, scooter and moped riders in London increasing in recent years there has been a corresponding rise in numbers of accidents involving Power Two Wheelers (P2W). The Mayor of London has set targets to reduce numbers of KSI (Killed or Seriously Injured) casualties on London’s roads. Key targets include a 40% reduction in P2W KSI casualties by 2010, over the 1994-8 baseline level. The London Road Safety Unit (LRSU) has the primary responsibility for ensuring these targets are achieved and they require a better understanding of P2W users in London and factors influencing their safety. TfL needs further statistical information to better understand P2W users and factors affecting their safety on London’s roads to aid in developing a strategy to reduce P2W casualties. Key requirements are to:-
quantify the profile (in terms of number of individuals and annual mileage ridden) of both P2W users and casualties in London, and through comparison to identify groups disproportionately likely to be casualties, relative to miles ridden assess the impact of advanced training and attitudes to riding and accident risk identify how P2W users who ride in the Congestion Charging Zone consider that it has affected their safety and ease of parking.
1 Transport for London • P2W User Survey 2004

2 METHODOLOGY FDS was commissioned to undertake a telephone survey of a representative sample of households within the M25, interviewing P2W riders. It is recognised that some of those riding P2Ws in London live outside the M25. However, we did not attempt to interview these riders as the incidence of riding within the M25 was likely to be too low to make surveying random samples of people living outside the M25 economically viable. The sample of telephone numbers within the M25 was provided by UK Changes and included ex-directory numbers although households who had signed up to the Telephone Preference Service were screened out. Interviewers telephoned a random sample of telephone numbers from within the M25. At each household they asked whether anyone in the household had ridden a powered two-wheeler in London within the past twelve months. Where one or more individuals had ridden a P2W a full interview was attempted with the rider. If there was more than one rider in a household the individual to be interviewed was selected at random ie we selected the individual who next celebrated their birthday. A pilot survey of 20 interviews was carried out between 12th and 21st August 2004 to test the questionnaire flow, length and incidence rate. Some minor changes were made to the questionnaire before interviewing recommenced on 20th September 2004. Initially FDS aimed to conduct solely interviews with P2W users identified by a random survey of households within the M25. However, finding P2W users proved difficult. Only around one in 100 contacts where interviewers spoke to someone resulted in an interview.
2 Transport for London • P2W User Survey 2004

To boost the final number of interviews it was decided to conduct further interviews with a sample of known P2W users. These included:- •
•
• • • •
• •
• • • • • •
those previously interviewed on the 2001 London Area Travel Survey (LATS) or the 2004 FDS/TfL Omnibus Survey P2W riders purchased from Experian/Sample Answers.
Interviewing finished on 9th November 2004 and 504 interviews were achieved in total, broken down as follows:-
263 from random sample 77 from riders identified in 2001 LATS survey 14 from riders identified in 2004 FDS/TfL Omnibus Survey 150 from purchased sample of known riders.
Close examination of the profiles and responses of the random and other samples revealed very similar results. However, the LATS and purchased samples included fewer young and inexperienced riders, and hence fewer riders with less powerful machines (125cc or under). In order to ensure the results were representative of all P2W users living within the M25, the combined sample was weighted to reflect the profile of the random sample of P2W riders in terms of gender and number of years riding and engine size of P2W ridden most often in London. Gender:-
Male – 86% Female – 14%
No. of years riding (Q8d):-
1 year or less – 4.5% 1 - up to 3 years – 15.5% 3 - up to 10 years – 33% 10 - up to 15 years – 12.5% 15 - up to 30 years – 25.5% more than 30 years – 9%
3 Transport for London • P2W User Survey 2004

There were some minor differences between the random and other samples in terms of engine capacity so results for the total sample were weighted to the profile of the random sample:- • • •
•
up to 125cc : 33.4% 126+cc : 65% not stated : 1.6%
Target weights for:-
– gender – years riding – engine capacity.
As shown above, were applied in turn to the combined sample. This weighting sequence ensured the profile of the weighted sample, reported on this volume, was representative of the original random sample. It was not necessary to weight the results by usage as there was little difference in P2W usage between the random and other samples. Additionally, 80 face-to-face interviews were conducted with a sub-sample of motorcycle couriers. This sub-group is identified separately in the results and not included in the total results for P2W riders (although there are a small proportion of riders who use their P2W for work naturally occurring in the random sample). These face-to-face interviews were conducted between 6th-22nd October 2004 at locations where couriers tend to congregate. This included the area around Smithfield Markets, the Ace Café, and the vicinity of courier firms in an attempt to catch couriers coming back to base for lunch/breaks etc.
4 Transport for London • P2W User Survey 2004

3
• • •
INCIDENCE OF P2W RIDERS Interviewers telephoned a random sample of over 40,000 telephone numbers from within the M25. At each household contacted they asked whether anyone in the household had ridden a powered two-wheeler in London within the past twelve months. Where one or more individuals had ridden a P2W a full interview was attempted with the rider. If there was more than one rider in a household the individual to be interviewed was selected via the next birthday rule. If there was no P2W rider present, interviewers attempted to obtain demographic details of household members and to establish whether anyone had stopped riding P2Ws in London in the past three years, and if so, why. Given the subject matter was announced upfront as relating to P2Ws, we cannot be sure whether those who refused to answer any questions were more or less likely than others to have P2W riders in the home. Amongst those contacted who refused to grant an interview:-
107 said they had a P2W 6,683 claimed no-one in their household had a P2W 8,083 refused to state whether or not there was a P2W rider in the household.
Contact was made with 7,618 households where individuals answered questions. Of these 263 (3.45%) said one or more adults in their household had ridden a motorcycle, moped or scooter in London in the past year. However, if we add in responses from households where an interview was not completed, of 14,408 households contacted, 370 (2.6%) said one or more adults in their household had ridden a P2W in London in the past year. This is almost certainly a more realistic assessment of the incidence of P2W riders. Where people stated whether or not there was a P2W rider in the household but refused to answer further questions we have no demographic information on their households. Where contacts were happy to answer questions, gender and age details were collected for non-P2W riders in the household as well as riders.
5 Transport for London • P2W User Survey 2004

The table below is based on all individuals in households, not simply the person answering questions. The second column is based on all individuals identified. Having spoken to 7,618 individuals and with an average of around two adults per household this is equivalent to 15,234 adults. Figures in the third column are based on the P2W riders identified, regardless of whether or not these individuals were actually interviewed. Table 3/1: Penetration and profile of P2W riders by age group Proportions of
contact sample in these age
groups (15,234)
%
Proportion of P2W riders in
this age group (259)
%
Proportion of age groups who ride P2Ws in London
London Population
% All 100 100 1.8% 100
16-19 7 3 0.8% 6 20-24 10 4 0.8% 9 25-34 24 23 1.7% 25 35-44 22 37 2.8% 21 45-54 15 23 2.5% 14 55-64 11 8 1.2% 11
65+ 11 2 0.3% 15 The figures in the fourth column almost certainly overstate the actual proportions of age groups riding P2Ws in London, because those who do not ride P2Ws were less likely to answer any questions. The fact that our contact sample slightly under-represented adults aged 25 and over suggests that older adults who do not ride P2Ws were more likely to refuse to co-operate when they heard the subject matter related to P2Ws, so their true proportions in the contact sample were probably slightly higher than those shown above. Nevertheless, some clear patterns emerge. On the evidence of this survey, relatively few under 25s ride P2Ws in London. Fewer than 1% ride P2Ws and those who do account for less than 10% of riders. Incidence rises among 25-34 year olds and the age group most likely to ride in London is 35-44 year olds. Sizeable numbers of 45-54 year olds ride P2Ws but proportions decline as people get older. There are very few riders aged over 65.
6 Transport for London • P2W User Survey 2004

Men are much more likely to ride in London than women. Nevertheless, women account for around one in seven of P2W riders. Table 3/2: Riding P2W in London by Gender
Profile of all
contacted %
Profile of P2W riders
%
Proportion of males/females riding P2Ws in
London
London Population
% Male 50 85 3.0% 49
Female 50 15 0.5% 51
7 Transport for London • P2W User Survey 2004

4
4.1.
• • •
RIDER PROFILE
DEMOGRAPHIC PROFILES In this section, we present results of the combined data set (random and purchased/LATS samples) weighted to targets reflecting the profile of the random sample in terms of:-
gender years of riding experience engine size.
This should ensure that the weighted profile of our sample is broadly representative of P2W riders riding and living in London. We also show results from couriers surveyed face-to-face. Most P2W riders are male (86%) but there are also sizeable numbers of women riding in London and they account for 14% of the total. Only one of the 80 couriers interviewed was female.
8 Transport for London • P2W User Survey 2004

There is a broad spread of ages of P2W riders with a particular concentration in the 35-44 age group. Based on the weighted survey data, only 5% of P2W riders in London and the same proportion of couriers are under 25. It is possible that despite the careful and logical weighting of survey data, the weighted general sample slightly under-represents the true proportion of 16-24 year olds amongst P2W riders in London. Other studies including London Area Travel Survey suggest a somewhat higher proportion than 5%, perhaps around 7-9%. Our survey shows there are numerous P2W riders among older age groups with riders aged 55 and over representing 12% of the general sample and 7% of couriers. Chart 4.1/1: Sample profiles (Riders Total = 504/Couriers Total = 80 Base: All answering)
86
14
2
23
12
8
2
2
1
1
0
1
99
1
5
31
46
11
7
85
5
1
0
0
1
1
1
01
84
40
20
30
Men
Women
16-19
20-24
25-34
35-44
45-54
55+
White - British
White - Other
White - Irish
Black or Black British - Caribbean
Asian or Asian British - Indian
Asian or Asian British - Pakistani
Asian or Asian British - Bangladeshi
Mixed Race - White+Black Caribbean
Mixed Race - Other
Riders
Couriers
%
Looking at the ethnic profile of the sample, well over four out of five P2W riders are White British. 8% of the general sample and 5% of the courier sample classify themselves as White Other. Very few riders belong to other ethnic groups. Black and Asian residents are under-represented relative to the numbers living in London.
9 Transport for London • P2W User Survey 2004
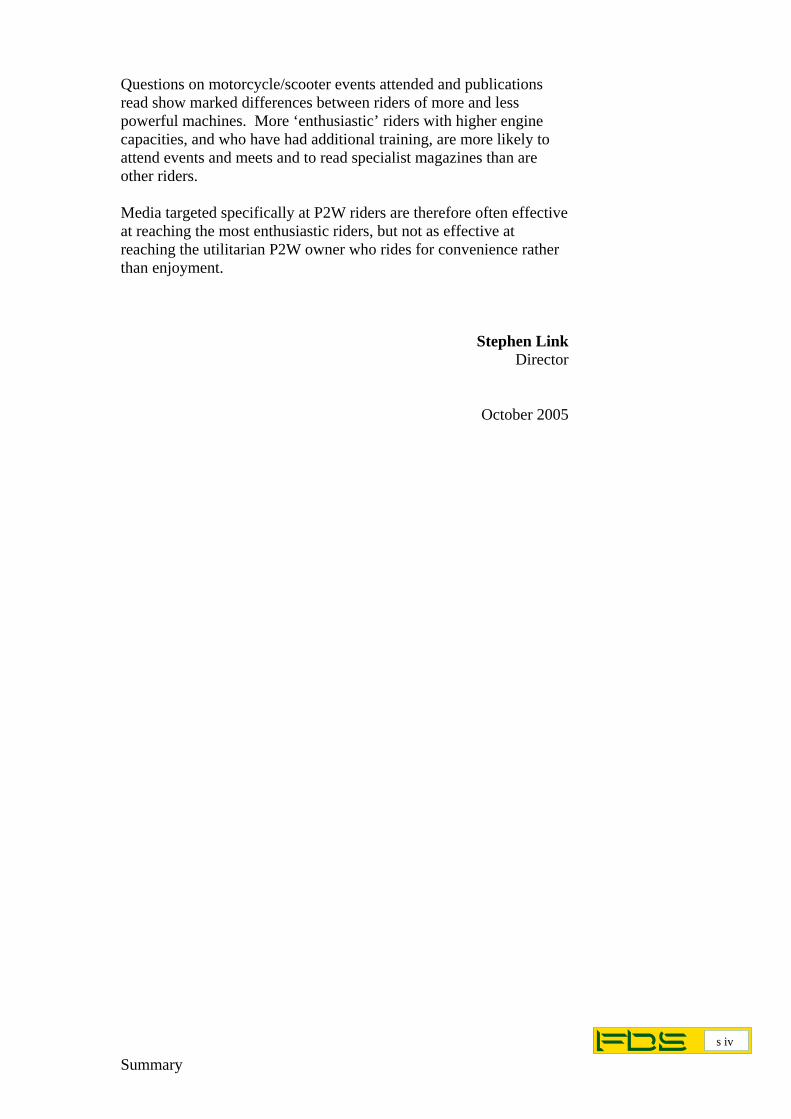
Reflecting their occupation, couriers are inevitably drawn predominantly from social class D (although a few lived in households where the chief wage earner was an ABC1). In contrast, ABC1s predominate among the general sample and there are few DEs riding P2Ws in London. Relative to the population of London as a whole, ABs are particularly well represented among P2W riders. Chart 4.1/2: Social grade profile of riders (main sample)
32
34
25
6
3
AB
C1
C2
D
E
%
Among riders, social grade is not a particularly powerful discriminator in terms of:- •
•
•
•
age or gender
length of time riding
annual mileage
type of machine owned – although ABC1s are a little more likely to have newer and
more powerful P2Ws.
10 Transport for London • P2W User Survey 2004

Reflecting their respective social grades, the general sample had relatively high annual household incomes, the mean being around £40-45,000. Couriers’ household incomes are typically around £16-30,000. Chart 4.1/3: Household incomes
3
12
25
49
10
31
24
19
16
10
Over 50,000
£36-£50,000
£26-£35,000
£16-£25,000
£15,000 orless
Main Sample
Courier
%
Most couriers (75%) work at least 30 hours per week. Similarly, most of the P2W riders in the main sample are in full-time employment. Chart 4.1/4: Work status of main sample
83
7
2
4
4
Work full-time (30+ hours perw eek)
Work part-time (less than 30hours)
Student
Unemployed
Retired
%
A small number of riders are students, unemployed or retired. Compared with full-time workers they tend to ride fewer miles and on fewer days of week.
11 Transport for London • P2W User Survey 2004

Two in three P2W riders (67%) are married or living with partners. Others are:- •
•
•
•
single, not living with parents (19%) single living with parents (8%) divorced (5%) widowed (1%).
One in three (33%) have children aged 0-15 living in their household. In terms of their marital status and likelihood of having children at home, P2W riders are similar to other Londoners with comparable age profiles.
12 Transport for London • P2W User Survey 2004
5
5.1.
• • • •
RIDING EXPERIENCE
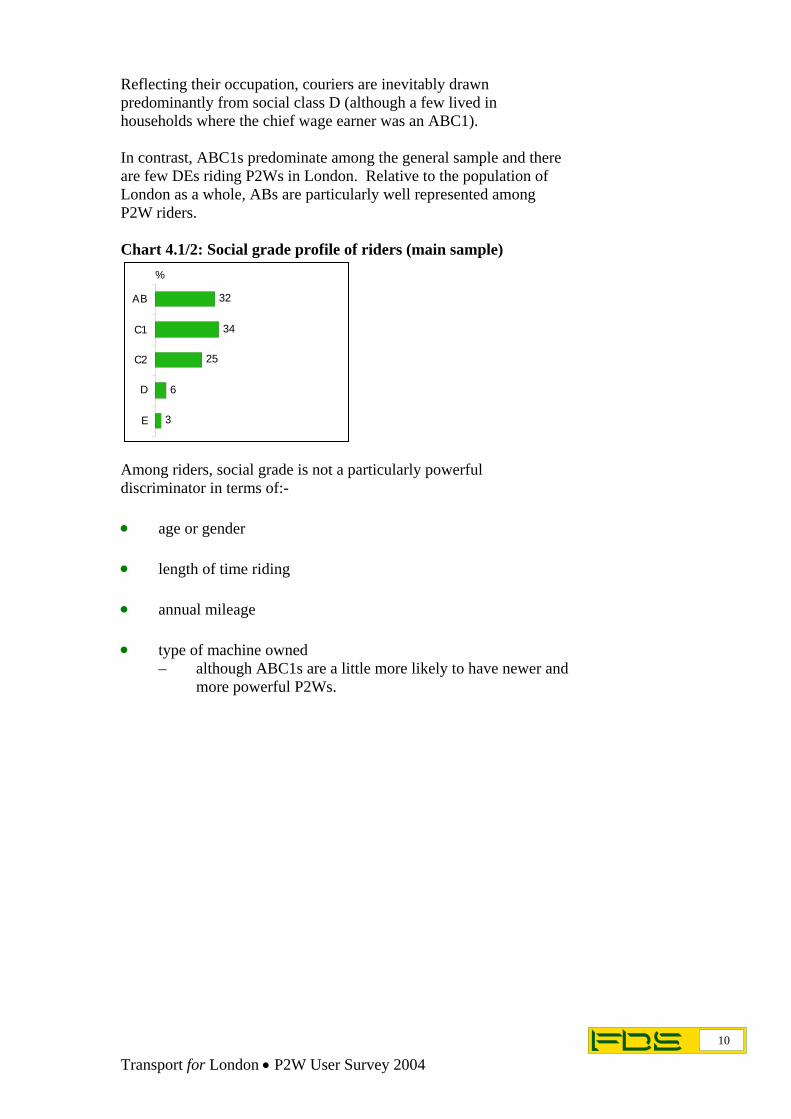
WHEN RESPONDENTS STARTED RIDING Most of the P2W riders surveyed started riding motorcycles, scooters or mopeds in their teens or early twenties. A significant proportion waited until their late twenties or thirties and a few did not start riding until they were in their forties or fifties. Most couriers started riding as teenagers. Chart 5.1/1: Age when first started riding P2Ws (Base – All answering)
36
12
14
25
9
4
54
17
16
10
3
16-17
18-19
20-24
25-34
35-44
45+
Main sample (453)Couriers (63)
%
-
Most interviewees (58% of the main sample and 81% of couriers) had ridden continuously since they first started. However, 42% of the main sample had taken up riding again after a gap of year or more, and among those with lower annual mileages this proportion was over 50%. Of those who had breaks, roughly equal proportions (one in four) had breaks of:-
three years or less over three up to seven years over seven up to fifteen years more than fifteen years.
Most of those who had experienced breaks of a year or more had since been riding continuously for at least three years. However, 19% of those experiencing breaks (8% of all main sample respondents) had been riding for twelve months or less since their last long break. Those who had only recently started riding again were more likely to ride smaller vehicles up to 125cc. They are mostly aged 25-44, although they include some older riders.
13 Transport for London • P2W User Survey 2004
5.2.
•
•
•
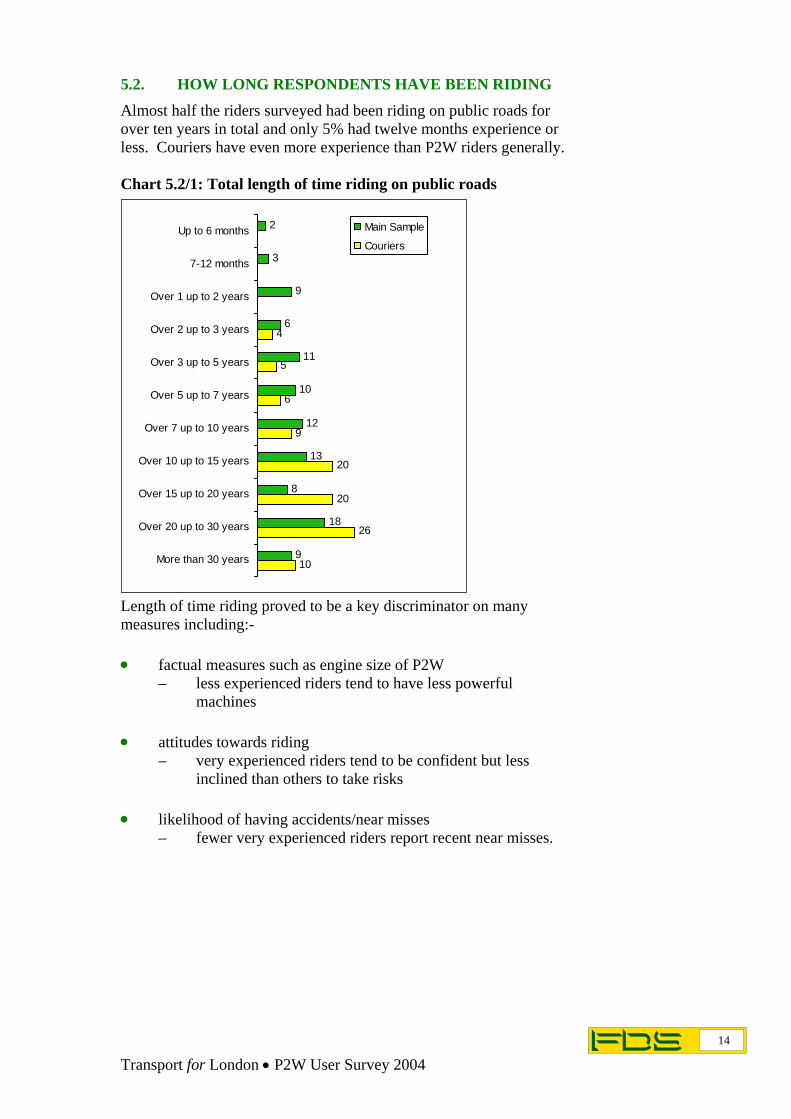
HOW LONG RESPONDENTS HAVE BEEN RIDING Almost half the riders surveyed had been riding on public roads for over ten years in total and only 5% had twelve months experience or less. Couriers have even more experience than P2W riders generally. Chart 5.2/1: Total length of time riding on public roads
10
26
20
20
9
6
5
4
9
18
8
13
12
10
11
6
9
3
2
More than 30 years
Over 20 up to 30 years
Over 15 up to 20 years
Over 10 up to 15 years
Over 7 up to 10 years
Over 5 up to 7 years
Over 3 up to 5 years
Over 2 up to 3 years
Over 1 up to 2 years
7-12 months
Up to 6 months Main Sample
Couriers
Length of time riding proved to be a key discriminator on many measures including:-
factual measures such as engine size of P2W – less experienced riders tend to have less powerful
machines
attitudes towards riding – very experienced riders tend to be confident but less
inclined than others to take risks
likelihood of having accidents/near misses – fewer very experienced riders report recent near misses.
14 Transport for London • P2W User Survey 2004

6
6.1.
• • • • • • • • •
CHARACTERISTICS OF P2WS OWNED
TYPES OF P2WS Riders were asked what types of P2W they owned, and the make, model and engine size of the one they rode most often in London. From the make, model and engine size, the vast majority (well over 90%) of vehicles were classified into the following categories:-
Adventure Sport Custom Scooter Sports (Moped) Sport/Touring Supersport Touring Naked Trail/Enduro
Examples of each category are shown below:- Adventure Sport Sports (Moped) Touring
Custom Sports Touring Naked
Scooter Supersport Trail/Enduro
15 Transport for London • P2W User Survey 2004

Some machines (mainly scooters) were also coded as mopeds on the basis they had an engine capacity of 50cc or lower. 9% of the main sample and 1% of couriers ride mopeds. By far the most popular type of vehicle among couriers was Naked but the main sample was more evenly divided. The types of P2W ridden were as follows:- Chart 6.1/1: Type of P2W ridden
26
24
17
11
4
3
2
2
1
8
4
49
9
21
1
1
9
5
Scooter
Naked
Supersport
Sport/Touring
Custom
Adventure sport
Touring
Trail/Enduro
Sports (Moped)
Unspecified
Main sample (504)Couriers (80)
% In terms of rider profiles, scooters, especially moped scooters are more likely to be ridden by younger adults. They are also relatively popular among women riders. However, the age profile of riders of the more powerful Supersports motorcycles is also younger than average with over one in three aged under 35. These are more likely to be ridden by ABC1s than C2DEs.
Riders of Supersport motorcycles have above-average:- •
•
•
•
annual mileage (although not necessarily mileage in London)
propensity to have had further P2W training since passing their test
propensity to have had an accident in the last three years
tendency to score highly on the confidence/aggression index (discussed in Section 9).
Sport/touring and touring motorcycles have an older rider profile, with the vast majority aged over 35. However, the above comments are all generalisations and there are more similarities than differences in the profiles of those riding different types of P2Ws.
16 Transport for London • P2W User Survey 2004

6.2. MAKES OF P2WS A wide range of makes are ridden in London, with Honda, the market leaders. Among couriers and those with over ten years riding experience more than twice as many ride Honda as any other make. Japanese makes predominate although among moped riders, leading makes (Piaggio, Aprillia and Vespa) are European. Vespa was the most widely ridden make of scooter, and Honda and Yamaha vie for the biggest share among riders with less than three years experience. Makes ridden by at least 1% of the main sample are shown below:- Chart 6.2/1: Main makes of P2Ws ridden Base: All answering
Main sample 498 %
Couriers 80 %
Honda 30 48 Yamaha 17 19
Suzuki 12 5 Kawasaki 8 14
Vespa 7 - Piaggio 5 3
BMW 4 10 Aprillia 3 1
Triumph 3 1 Peugeot 2 -
Gilera 2 - Ducati 1 -
Harley Davidson 1 - Lambretta 1 -
17 Transport for London • P2W User Survey 2004

6.3.
• • •
ENGINE SIZE OF P2WS As shown in the table below about one in three interviewees ride P2Ws of:-
up to 125cc 126-600cc over 600cc.
Table 6.3/1: Engine size of P2W Main Sample Riding Base: All answering
All 496 %
Up to 3 yrs 81 %
3-10 yrs 120 %
Over 10 yrs 295 %
Men 435 %
Women
61 %
Couriers 80 %
50cc or less 10 30 7 3 8 23 5 51-125cc 24 42 25 16 21 28 9
126-600cc 35 19 43 35 36 42 56 601-1000cc 25 8 21 35 28 5 16
Over 1000cc 6 - 5 10 8 3 14 Women and less experienced riders are more likely to ride less powerful machines. Where riders hold full unrestricted licences, the vast majority (almost nine in ten) choose to ride P2Ws of 126cc or above. Riders of more powerful machines are also more likely than other riders to have had further training since passing their P2W test. Engine size of P2W does not correlate closely with annual mileage in London but correlates more closely with total annual mileage suggesting, unsurprisingly, that those who make longer journeys are more likely to have powerful machines and vice versa. Engine size is an effective discriminator on some survey questions. For example, those with more powerful P2Ws appear more interested in and enthusiastic about riding and are more likely to read biking magazines. Riders with powerful machines are a little less likely to use them for functional purposes such as going to work or shopping but much more likely than those with P2Ws up to 125cc to ride for pleasure, rather than to reach a specific destination.
18 Transport for London • P2W User Survey 2004

6.4. AGE OF P2W There is wide variation in the ages of machines ridden in London, with the median age of P2Ws lying between three and five years. Less powerful vehicles (particularly mopeds and scooters) tend to be newer, on average. The median age of mopeds and scooters is between two and three years old. This is also true of Sport/Touring motorcycles. More powerful machines are a little older on average. The oldest P2Ws (those over 15 years old) are predominantly Naked, but even so, most Naked motorcycles are no more than five years old. Predictably, riders with higher annual mileage tend to have newer vehicles. To put it another way, those with older machines tend to ride them less than those with new machines. The oldest machines tended to be ridden by older riders and those from lower socio-economic groups. Younger, inexperienced riders are more likely to have new P2Ws. Almost half of those who had been riding for one year or less had a new machine. Table 6.4/1: Age of P2W Engine size
All (504)
%
Up to 125cc (140)
%
126-600cc (180)
%
Over 600cc (176)
%
Courier Booster
(80) %
12 months or less 11 17 6 9 9 Over 1 up to 2 years 15 20 12 12 14 Over 2 up to 3 years 15 18 13 12 10 Over 3 up to 5 years 22 24 21 21 25 Over 5 up to 7 years 12 6 14 17 13
Over 7 up to 10 years 9 6 8 13 10 Over 10 up to 15 years 7 3 10 9 14 Over 15 up to 20 years 3 2 4 3 4
Over 20 years 6 4 10 4 3
19 Transport for London • P2W User Survey 2004

7 LICENCES Interviewers were asked what vehicles they were licensed to drive/ride and whether licences were full or provision. Table 7/1: Types of licence held Main Sample How Long Riding?
All (503)
%
Up to 3 years (84) %
Over 3 years (419)
%
Couriers
(80) %
Full P2W licence Any
83
60
85
98
Motorcycle of any capacity via Direct Access pass
24 18 25 18
Motorcycle of any capacity via other route
28 6 33 59
Motorcycle up to 33bhp/ 25kw
7 2 8 3
Motorcyle up to 125cc 28 24 29 14 Moped 50cc or under via car
test pass 10 12 9 14
Car – full licence 88 77 90 79 Provisional licence (any) 9 21 6 3
Moped 50cc or under 2 5 1 1 Motorcycle up to 125cc 6 12 4 5
Car – provisional licence 2 8 1 3 Virtually all couriers have full P2W licences, most of whom have licences for any type of powered two-wheeler. Among the main sample, 83% had full P2W licences and additionally most had full car licences. Rules governing what machines one can ride when holding different licences have changed a number of times since the older adults in our sample obtained licences. Some may not have bothered to obtain full P2W licences on the grounds their full driving licence entitled them to ride the P2Ws they wanted. Some riders have a mix of full and provisional licences, eg full licence for P2Ws up to 50cc, provisional licence for motorcycle up to 125cc.
20 Transport for London • P2W User Survey 2004

Naturally, less experienced riders are more likely to hold only provisional licences, although a few experienced riders continue to hold only provision licences. More experienced riders are more likely to have full licences for any type of P2W. Among those who have been riding up to three years three in four of those who hold a full licence for a motorcycle of any capacity do so via Direct Access pass. More experienced riders are more likely to have obtained this via other routes. Most of those with a full licence had held it for over ten years, although 4% of holders had only acquired one in the twelve months prior to interview. About half those holding a provisional licence had had it for three years or less, but some very experienced riders retained provisional licences. The median or typical lengths of time people in the main sample had held different licences were as follows:-
Moped 50cc or under – full licence via car test pass
20-30 years
Moped 50cc or under – full licence via moped test pass
10-15 years
Moped 50cc or under – provisional licence
About 5 years
Motorcycle up to 125cc – full licence
10-15 years
Motorcycle up to 125cc – provisional licence
3-5 years
Motorcycle up to 33bbp/25kw 20-30 years
Motorcycle of any capacity via Direct Access test pass
7-10 years
Motorcycle of any capacity via other route 15-20 years
•
•
•
•
•
•
•
•
21 Transport for London • P2W User Survey 2004

8
8.1.
• • •
RIDING PATTERNS
MILES RIDDEN BY RESPONDENTS Interviewees were asked how many miles they had ridden their machine in the previous twelve months:-
in total in London in inner London.
Answers are shown in detail in Table 8.1/1 and summarised in Charts 8.1/2 and 8.1/3. Table 8.1/1: Miles ridden in last year MAIN SAMPLE COURIERS Base: All answering
Total 493 %
London
480 %
Inner London
471 %
Total
80 %
London
80 %
Inner London
79 %
0-100 miles 8 14 37 - - - 101-300 miles 4 5 6 - - 1 301-500 miles 4 6 7 - - -
501-1,000 miles 6 10 9 1 - - 1,001-1,500 miles 6 8 6 - - 1 1,501-2,000 miles 8 6 6 - - - 2,001-3,000 miles 12 12 10 - - 6 3,001-5,000 miles 21 15 7 - 1 1
5,001-10,000 miles 22 18 9 3 5 19 10,001-15,000 miles 8 5 2 5 23 22 15,001-20,000 miles 1 0.2 0.2 6 13 13 20,001-30,000 miles 1 1 0.2 24 33 20 30,001-40,000 miles 0.2 - - 28 14 6 40,001-50,000 miles 0 0 0 10 4 1 50,001-75,000 miles 0.4 0.4 0.2 14 5 5
75,001-150,000 miles 0.4 0.4 0.2 6 2 4 Over 150,000 0.4 0.4 0.2 4 2 0
Chart 8.1/2: Annual Mileage (Riders Total answering = 493/480)
22 Transport for London • P2W User Survey 2004
35
32
32
49
27
24
2000 or less
2001-5000
Over 5000
Annual
London
%

Chart 8.1/3: Annual Mileage (Couriers Total = 80)
16
51
34
41
46
13
20000 orless
20001-40000
Over 40000
Annual
London
% Most couriers ride huge numbers of miles each year, three out of five riding 20,000 miles or more in London in the last twelve months.
A typical courier rides:- • • •
• • •
• • •
30,000-40,000 miles in total including 20-25,000 miles in London and almost 20,000 miles in inner London.
Mileage figures for the main sample vary enormously. Just over 20% ride fewer than 1,000 miles a year. In contrast over 10% claim to ride more than 10,000 miles. Approximately one in three rode:-
2,000 miles or less 2,001-5,000 miles over 5,000 miles in the last 12 months.
Around half the miles ridden are in London, but a much lower proportion are in inner London. A typical rider rides:-
3,000-5,000 miles in total including around 2,000 miles in London but only around 500 miles in inner London.
23 Transport for London • P2W User Survey 2004

There is not a close correlation between engine size of machine and number of miles ridden, especially mileage in London. However, riders of mopeds are very unlikely to ride over 5,000 miles in London each year, while almost one in four riders of more powerful P2Ws do so. Therefore, moped’s share of miles ridden in London is somewhat smaller than its share of P2Ws owned. Similarly, women and those who have been riding less than three years, tend to have below-average mileage. However, the over 55s also have below-average mileage while 25-44 year olds have slightly above-average mileage.
24 Transport for London • P2W User Survey 2004
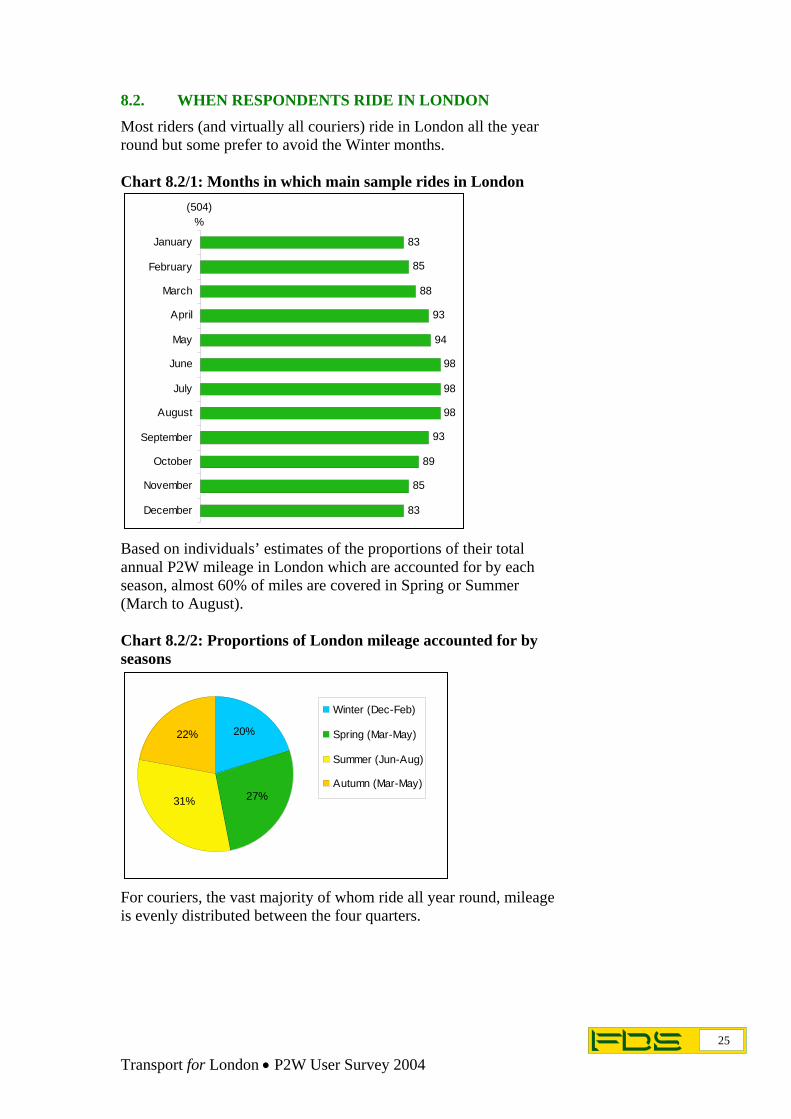
8.2. WHEN RESPONDENTS RIDE IN LONDON Most riders (and virtually all couriers) ride in London all the year round but some prefer to avoid the Winter months. Chart 8.2/1: Months in which main sample rides in London
83
85
88
93
94
98
98
98
93
89
85
83
January
February
March
April
May
June
July
August
September
October
November
December
(504)%
Based on individuals’ estimates of the proportions of their total annual P2W mileage in London which are accounted for by each season, almost 60% of miles are covered in Spring or Summer (March to August). Chart 8.2/2: Proportions of London mileage accounted for by seasons
22%
31% 27%
20%
Winter (Dec-Feb)
Spring (Mar-May)
Summer (Jun-Aug)
Autumn (Mar-May)
For couriers, the vast majority of whom ride all year round, mileage is evenly distributed between the four quarters.
25 Transport for London • P2W User Survey 2004

Almost all couriers ride at least five days a week and 21% ride seven days per week. Responses from the main sample were rather different when they were asked how many days they rode their vehicle in London in a typical week during their riding months. Six in ten ride at least five days per week in London. Among those who ride their machine to and from work this proportion rises to three in four. In contrast, one in four of the total sample ride only one or two days a week (some of whom will only ride at weekends). Chart 8.2/3: Number of days ridden in a typical week
26 3017
3544
10
16
15
19
106
22
13 6
32
OneTw oThree/fourFiveSix/seven
%
All504%
No148%
Yes356%
Ride to work?
Some of the more enthusiastic riders, with powerful machines, only ride on one or two days a week (presumably weekends). In contrast, some of those who ride five or more days per week to get to work ride less powerful P2Ws and are less interested in specialist magazines and unlikely to undergo further training. Numbers of days a P2W is ridden correlates more closely with whether or not it is ridden to work than with the rider’s apparent enthusiasm for riding.
26 Transport for London • P2W User Survey 2004

8.3. PURPOSES FOR WHICH RESPONDENTS RIDE The main uses for which people ride their machine in typical weeks are shown below. Table 8.3/1: Purposes for which machine ridden Base: All answering
Main Sample
503 %
Couriers
80 %
As part of job – delivering parcels 2 100 As part of job – delivering food 1 -
As part of job – other non-delivery 7 - Travelling to/from work 71 100
Travelling to/from school/education 3 6 Travelling on personal business
(eg bank, church)29 41
Shopping 26 40 Visiting friends/relatives 35 39
Leisure eg pub/cinema/sports 38 31 Leisure – where ride for pleasure rather than to reach a destination
40 28
Holidays 10 13 Racing/track days 7 1
Over 80% of couriers’ annual mileage is accounted for by delivery work. About 9% of the main sample ride a P2W as part of their job and for this group, riding related to their work usually accounts for over half their annual mileage. A much larger proportion (71%) use their vehicle to get to work and for these riders, trips to and from work typically account for around 70% of their annual mileage in London. Many riders use their vehicle to see friends or relatives or when travelling on personal business, but these trips typically only account for a minority of miles ridden in London.
27 Transport for London • P2W User Survey 2004

Four in ten of the main sample use their machine for leisure activities where they ride for its own sake rather than to reach a specific destination. These riders tend to:- • • •
ride their P2W less frequently than other riders have lower-than-average mileages in London have more powerful machines.
For them a P2W is something to be enjoyed, whereas for many riders using less powerful machines to get to work, a P2W is a practical means of getting to work or making other journeys.
28 Transport for London • P2W User Survey 2004

8.4. WHY RESPONDENTS RIDE IN LONDON Asked why they use their P2W in London in preference to other means of travelling almost half those answering (47%) cite speed of travel. Other popular reasons for making this choice include ease of travel (28%), cost (25%) and convenience (16%). Travelling by P2W is often a faster and more convenient mode of travel than public transport, especially if travelling alone. Chart 8.4/1: Why use P2W in London in preference to other means of travelling
47
28
25
16
15
13
10
5
3
2
2
2
Quicker
Ease of travel
Cost
Convenience
Dislike other means of transport
Enjoy riding P2W
Easier to park than car
No congestion charge
Freedom/flexibilityNo choice - public transport not
availableSafer than other means of transport
Free parking facilities
(491)%
Chart 8.4/2: Proportion choosing to use P2W in London as faster than other means of transport
35
49
54
42
53
1-2 (125)
3-5 (239)
6-7 (127)
2000 or less (236)
Over 2000 (232)
%Days ride per w eek
Annual mileage in London
29 Transport for London • P2W User Survey 2004

Those who ride their P2Ws most frequently and/or cover the most miles are most likely to mention speed as a reason for choosing to travel by P2W. A fair proportion of P2W riders mentioned disliking other means of transport as a reason for their choice. This may be linked to other responses; riders having experienced or hold the perception that getting around London by other methods of transport is slow and a hassle. One in six say riding a P2W is convenient and some other responses are linked to ease/convenience, including:- • • •
easier than parking a car freedom/flexibility non- availability of public transport either in their area or at the time they wish to travel.
A few mention specific cost factors; being exempt from the congestion charge and free parking. It may be assumed that these riders as well as those mentioning easier parking are choosing to travel by P2W rather than by car. Interestingly several riders (2%) mention that riding a P2W is safer than other means of transport. In general, reasons for riding P2Ws are similar for commuters and non-commuters, although leisure riders are a little more likely to mention enjoyment as influencing their choice.
30 Transport for London • P2W User Survey 2004

9
9.1.
• • •
•
ATTITUDES TOWARDS RIDING
RESPONDENTS’ CONFIDENCE IN THEIR RIDING A series of questions explored riders’ perceptions of their own skills and attitudes to other road users. The main aim of this sequence was to establish confidence/aggression scores, which were used to divide respondents into more and less confident/aggressive riders. This proved to be an interesting analysis break on some questions. Riders are confident in their own abilities. This is unsurprising as were they not confident, they might be unlikely to ride in London. Asked to use a scale from +5 (very confident) to 0 (average in terms of confidence) to -5 (very cautious) to indicate their confidence in their riding ability:-
almost one in three gave the maximum score of +5 almost half gave a score of +5 or +4 five out of six gave a positive score ie they ranked their confidence as above average very few riders (4%) rated themselves as cautious/below average in terms of confidence.
Chart 9.1/1: Confidence as a rider
4 9 9 2 5 213
2011
17
22 19
19 13
1910
23
2315
11
18 16
15
22
16
18
30 2615 23
41
63
5
1512 1
+5
+4
+3+2/+1
0
-1 - -5
All Random
(504)
1 year or less(19)
1-3 years (66)
Over 3 up to 10 years
(121)
Over 10 years(298)
Courier Boosters
(80)
%
2.90 2.44 2.15 2.96 3.15 4.06
All categories of rider rate themselves as confident, especially those who have been riding for many years, and those who ride as part of their work, such as couriers. Reflecting the fact they have generally been riding for many years those aged 55 and over are particularly confident.
31 Transport for London • P2W User Survey 2004

Those with three years experience or less are generally not quite as confident but even so, only around one in ten rates themselves as more cautious/less confident than average. Indeed, among the 16-24 year olds themselves over half volunteered a score of +5 or +4 for confidence and few rated themselves as more cautious than average. Similarly those who have only recently returned to riding after a break have lower than average confidence scores even though most riders rate their own confidence as above average (ie above zero). There is not a strong correlation between annual mileage and levels of confidence although those who ride over 5,000 miles a year are more confident than those riding less. Nor is there a close correlation between type of P2W/engine size and confidence, although those with P2Ws over 1,000cc are particularly confident. Men are more likely than women to award themselves the maximum confidence score of +5 (32% vs 18%). However, only 5% of women rate themselves as more cautious than average and the eighteen riders who gave themselves a score of -2 or lower are all male. Whilst most riders rate themselves as confident, just under half consider themselves to be more skilful than the average rider. Reflecting the confidence scores, only 5% rate themselves as less skilful than the average rider. Chart 9.1/2: Rating of skill as a rider
41
38
30
38
48
71
54
51
60
57
49
29
5
11
9
5
3
0
All (excluding Don't know ) (500)
1 year or less (19)
1-3 years (66)
Over 3 up to 10 years (120)
Over 10 years (295)
Courier Boosters (80)
More skilful than average Average Less skilful%
How long riding?
32 Transport for London • P2W User Survey 2004

Older, more experienced riders and couriers are especially likely to rate themselves as skilful. However, if instead of considering how long people have been riding we consider how long they have held a full licence, the group with greatest confidence in their own abilities are people who have held a licence for over one and up to three years. Most score +5 or +4 for confidence and rate themselves as more skilful than the average rider. More worryingly, most of the nine teenagers surveyed think they are more skilful than the average rider in London. It appears that some relatively inexperienced riders have an inflated view of their skills relative to other riders. Significantly higher proportion of ABC1s than C2DEs rate themselves as more skilful than the average rider in London. There is not a clear correlation between numbers of accidents experienced and perceptions of levels of skill. However, among those who have had no recent accidents, those who deny having had near misses are more likely to rate themselves as skilful than those who report near misses. Riders who have had further training since passing their test:- •
•
have above-average ratings for confidence
and usually rate themselves as more skilful than the average rider.
These riders probably have more justification for their confidence than some of the less experienced riders.
33 Transport for London • P2W User Survey 2004

9.2. WHAT ANNOYS RESPONDENTS? A series of questions, establishing to what extent certain factors annoy P2W riders, were included in order to contribute to scores on the Aggression/Confidence Index. Results are shown below, although it should be noted that while certain views are held by P2W riders, it does not follow that they are unique amongst motorists in doing so, or even more disposed towards these attitudes. For any such conclusions to be drawn about the attitudes of P2W riders, it would be more appropriate to make a comparison with those driving other vehicle types, which is beyond the scope of this study. Chart 9.2/1: Actions which annoy riders
81
35
27
27
12
a) Drivers or passengers w ho throwlitter out of car w indow
b) Motorists w ho drive below the speedlimit
c) Drivers approaching traffic lights w hostop on amber causing you to brake
sharply
d) Motorists in slow moving traff ic w hodrive too close to the kerb for you to
pass them on the inside
e) Drivers w ho stick rigidly to speed limitseven w hen the road ahead is clear
(490)%
Couriers (80)
%
54
41
34
18
23
Most riders are irritated by drivers who throw litter. In comparison, more than one in three riders are irritated by motorists who drive below speed limits and one in eight by drivers who stick to speed limits even when the road ahead is clear. Despite the fact that couriers have a greater-than-average propensity to be annoyed by these actions, in general, those with high levels of annual mileage are a little less likely to be annoyed by motorists driving below the speed limit than are less frequent riders.
34 Transport for London • P2W User Survey 2004

Most riders who have only recently returned to riding are annoyed by motorists who drive below speed limits and almost half are annoyed by motorists in slow moving traffic who drive too close to the kerb for the rider to pass them on the inside. Those with less than three years riding experience, those with P2Ws below 125cc and women, are also more likely to be annoyed by motorists driving too close to the kerb. Riders who have had further training are a little less likely than average to be annoyed by motorists. Responses to this sequence of questions demonstrates that numerous riders:- •
•
rate themselves as confident and above-averagely skilful and
are annoyed by actions of motorists that are more likely to annoy those who are riding inappropriately.
Worryingly, some of the most inexperienced riders fall into both categories.
35 Transport for London • P2W User Survey 2004
9.3.
•
•
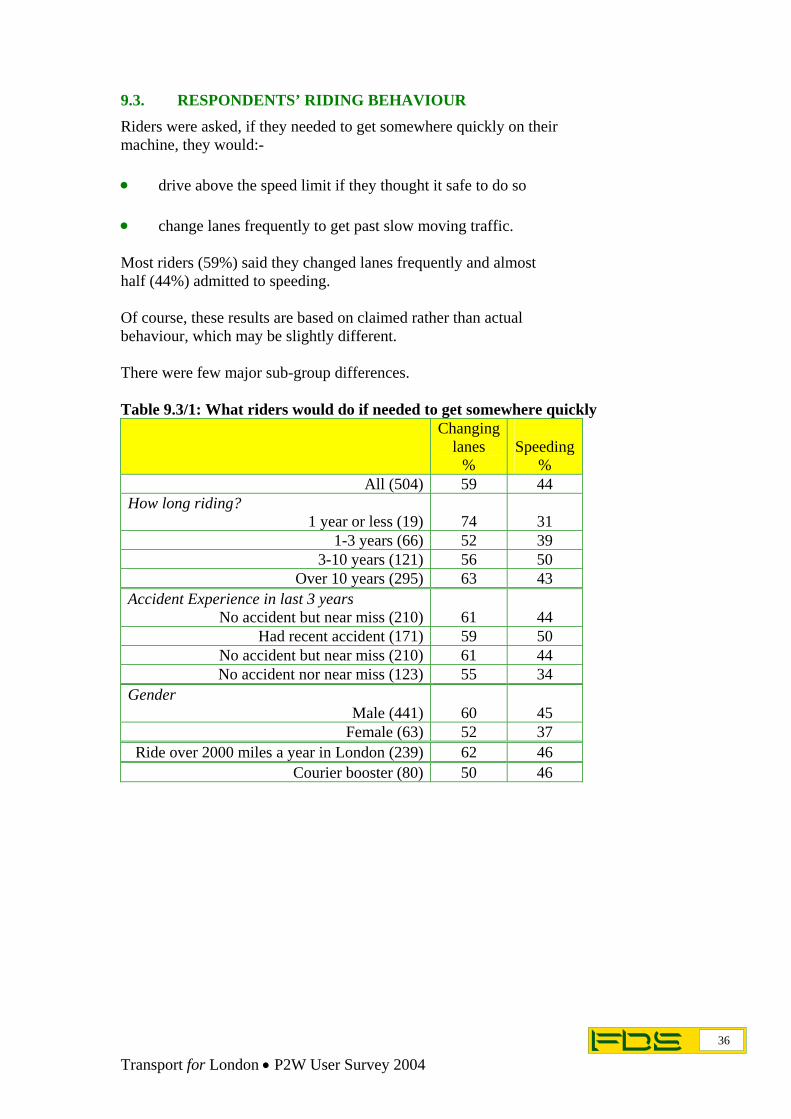
RESPONDENTS’ RIDING BEHAVIOUR Riders were asked, if they needed to get somewhere quickly on their machine, they would:-
drive above the speed limit if they thought it safe to do so
change lanes frequently to get past slow moving traffic. Most riders (59%) said they changed lanes frequently and almost half (44%) admitted to speeding. Of course, these results are based on claimed rather than actual behaviour, which may be slightly different. There were few major sub-group differences. Table 9.3/1: What riders would do if needed to get somewhere quickly Changing
lanes %
Speeding
% All (504) 59 44
How long riding? 1 year or less (19)
74
31
1-3 years (66) 52 39 3-10 years (121) 56 50
Over 10 years (295) 63 43 Accident Experience in last 3 years
No accident but near miss (210)
61
44 Had recent accident (171) 59 50
No accident but near miss (210) 61 44 No accident nor near miss (123) 55 34
Gender Male (441)
60
45
Female (63) 52 37 Ride over 2000 miles a year in London (239) 62 46
Courier booster (80) 50 46
36 Transport for London • P2W User Survey 2004

Those who denied having any recent accidents or near misses were the least likely to admit to speeding or changing lanes. This correlation probably reflects the likelihood that they take fewer risks so have fewer accidents or near misses. Scores for confidence/aggression were aggregated as follows:- •
•
•
•
• • •
• • •
• • • • • • •
-5-+5 according to how confident people were in their riding abilities +3 if they thought they were more skilful than the average rider (-3 if they thought they were less skilful) +2 for each action b)-e) by other motorists which annoyed them (see Chart 9.2.1) +3 if they drove above speed limits and/or changed lanes frequently.
The maximum score is, therefore, 19, and the minimum score, -8. On this basis:-
28% recorded High scores (more than 10) 56% had Average scores (5-10) 15% recorded Low scores (4 or less).
A very different pattern was observable among couriers:-
49% recorded High scores 46% Average only 5% Low scores.
A high confidence/aggression score does not mean than a rider is riding badly or is particularly likely to have an accident. In many cases their confidence in their own riding ability will be well placed. But those with high scores are probably more likely than other riders to be over-confident, arrogant or aggressive in their attitudes to other road users and likely to break speed limits/change lanes. Those with higher scores are more likely than others to:-
be aged under 25 or over 55 have been riding for less than one year or over ten years be non-White ride 6-7 days per week and to have high mileage in London ride P2Ws of over 600cc have had more than one P2W accident in the last year believe P2W accidents are not usually caused by the riders themselves.
37 Transport for London • P2W User Survey 2004
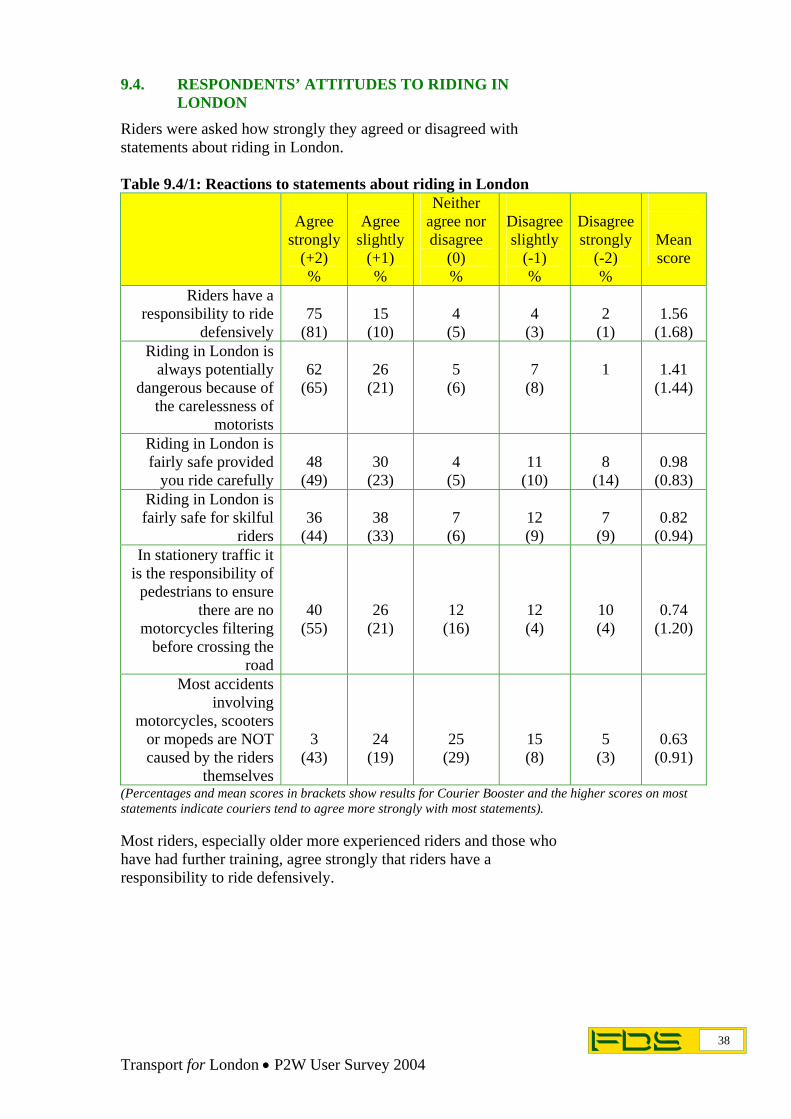
9.4. RESPONDENTS’ ATTITUDES TO RIDING IN LONDON
Riders were asked how strongly they agreed or disagreed with statements about riding in London. Table 9.4/1: Reactions to statements about riding in London
Agree
strongly(+2) %
Agree
slightly (+1) %
Neither agree nor disagree
(0) %
Disagree slightly
(-1) %
Disagree strongly
(-2) %
Mean score
Riders have a responsibility to ride
defensively
75
(81)
15
(10)
4
(5)
4
(3)
2
(1)
1.56
(1.68) Riding in London is
always potentially dangerous because of
the carelessness of motorists
62
(65)
26
(21)
5
(6)
7
(8)
1
1.41
(1.44)
Riding in London is fairly safe provided
you ride carefully
48
(49)
30
(23)
4
(5)
11
(10)
8
(14)
0.98
(0.83) Riding in London is fairly safe for skilful
riders
36
(44)
38
(33)
7
(6)
12 (9)
7
(9)
0.82
(0.94) In stationery traffic it
is the responsibility of pedestrians to ensure
there are no motorcycles filtering
before crossing the road
40 (55)
26 (21)
12 (16)
12 (4)
10 (4)
0.74 (1.20)
Most accidents involving
motorcycles, scooters or mopeds are NOT caused by the riders
themselves
3
(43)
24 (19)
25 (29)
15 (8)
5
(3)
0.63 (0.91)
(Percentages and mean scores in brackets show results for Courier Booster and the higher scores on most statements indicate couriers tend to agree more strongly with most statements). Most riders, especially older more experienced riders and those who have had further training, agree strongly that riders have a responsibility to ride defensively.
38 Transport for London • P2W User Survey 2004

However, some riders may not be thinking through the implications of this statement, as clear majorities also believe:- •
•
•
•
most accidents involving P2Ws are NOT caused by the rider themselves
in stationary traffic it is the responsibility of pedestrians to ensure there are no P2Ws filtering before crossing the road.
Of course, many accidents involving P2Ws are not caused by riders, and pedestrians must always take care crossing roads, but those who agree with these statements may not be thinking sufficiently about what they can do to prevent someone else’s lack of concentration or carelessness resulting in an accident. There are clear correlations between the extent to which riders place the onus on pedestrians and other road users and:-
the numbers of accidents and near misses experienced by the rider
the confidence/aggression score of the rider.
Education on this area may be beneficial to reducing accident risk amongst riders and pedestrians.
39 Transport for London • P2W User Survey 2004

Numbers agreeing strongly that it is the responsibility of pedestrians to ensure there are no motorcycles filtering before crossing the road are shown below. Chart 9.4/2: Agree strongly that it is pedestrian’s responsibility to ensure no motorcycles are filtering
40
54
45
40
27
46
38
36
37
44
All (504)
Had 2+ accidents in last 3 years (61)
Had 1 accident (110)
No accidents but near misses (210)
No accidents nor near misses (123)
High (150)
Average (281)
Low (73)
ABC1 (300)
C2DE (158)
%
Confidence/Agression score
Class
Chart 9.4/3: Agree strongly that most accidents involving P2Ws not caused by riders themselves
32
39
39
29
28
36
30
31
27
41
All (504)
Had 2+ accidents in last 3 years (61)
Had 1 accident (110)
No accidents but near misses (210)
No accidents nor near misses (123)
High (150)
Average (281)
Low (73)
ABC1 (300)
C2DE (158)
%
Confidence/Agression score
Class
There are statistically significant differences by social grade and accident experience in response to these questions. C2DEs and drivers who have had accidents or who appear very confident and/or aggressive are more likely than others to place the onus on pedestrians and other road users, rather than themselves, to avoid accidents.
40 Transport for London • P2W User Survey 2004

Most riders (especially those who have had no accidents or near misses) agree:- • •
•
riding in London is fairly safe provided you ride carefully riding in London is fairly safe for skilful riders.
The vast majority of riders (particularly those who have had accidents) also believe:-
riding in London is always potentially dangerous because of the carelessness of motorists.
Agreement with this statement reflects a realistic acknowledgement that riding can be dangerous. To agree that riding in London is fairly safe provided you ride carefully is a healthier attitude to hold than that riding in London is fairly safe for skilful riders. Riders who score highly on the confidence/aggression index are equally likely to agree with both statements. In contrast, those with low confidence/aggression scores are much more likely to believe you will be safe if you are careful than if you are skilful. The belief that one is a skilful rider could encourage one to take risks that a less confident rider avoids. Those who had received serious injuries as a result of a recent P2W accident were less likely to agree that riding in London was fairly safe for careful riders. Even so, a majority of this group agreed with the statement.
41 Transport for London • P2W User Survey 2004

10
10.1.
SAFETY MEASURES
HEADLIGHTS Most riders ride with dipped headlights during the day. Some prefer to have headlights on full beam, and some base their decision on weather conditions. A few do not normally use their headlights at all during the day. Responses to this question do not show clear variation by sub-groups although there is a slight tendency for more cautious riders with lower annual mileage to base their decision on weather conditions. Those with full unrestricted P2W licences are especially likely to favour dipped beam over full beam headlights. Chart 10.1/1: Use of headlights when riding in London during the day
16
70
4
10
11
68
5
16
Alw ays onfull beam
Alw ays ondipped beam
Alw ays off
Depends onw eather
conditions
Main-stage survey (504)
Courier Booster (80)
%
Most (84%) of those who ride with permanently dipped headlights say this is their own choice, but 16% had their lights wired permanently on.
42 Transport for London • P2W User Survey 2004
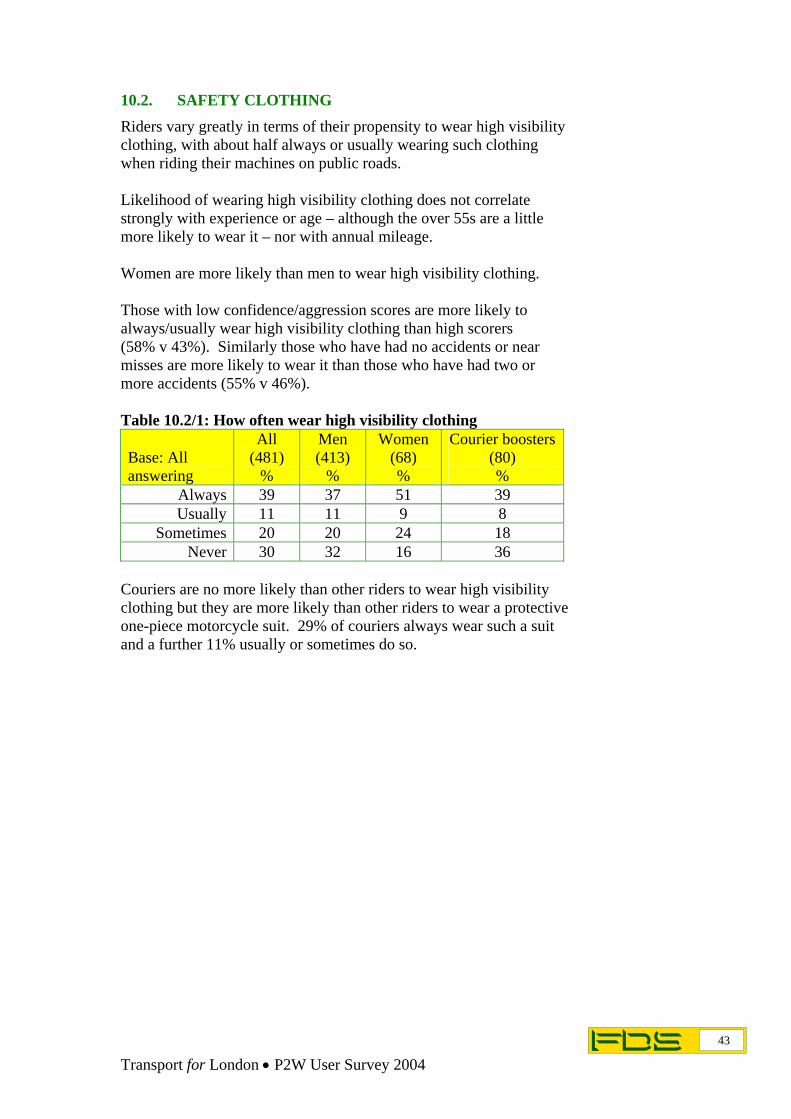
10.2. SAFETY CLOTHING Riders vary greatly in terms of their propensity to wear high visibility clothing, with about half always or usually wearing such clothing when riding their machines on public roads. Likelihood of wearing high visibility clothing does not correlate strongly with experience or age – although the over 55s are a little more likely to wear it – nor with annual mileage. Women are more likely than men to wear high visibility clothing. Those with low confidence/aggression scores are more likely to always/usually wear high visibility clothing than high scorers (58% v 43%). Similarly those who have had no accidents or near misses are more likely to wear it than those who have had two or more accidents (55% v 46%). Table 10.2/1: How often wear high visibility clothing
Base: All answering
All (481)
%
Men (413)
%
Women (68) %
Courier boosters (80) %
Always 39 37 51 39 Usually 11 11 9 8
Sometimes 20 20 24 18 Never 30 32 16 36
Couriers are no more likely than other riders to wear high visibility clothing but they are more likely than other riders to wear a protective one-piece motorcycle suit. 29% of couriers always wear such a suit and a further 11% usually or sometimes do so.
43 Transport for London • P2W User Survey 2004

In contrast, only 14% of our main sample of riders always wear a protective one-piece motorcycle suit while a further 13% sometimes or occasionally do so. Riders of motorcycles are slightly more likely to wear a protective one-piece motorcycle suit (15% always, 3% usually, 11% sometimes, 71% never) than riders of scooters (9% always, 1% usually, 6% sometimes, 84% never). Table 10.2/2: Items worn on body when riding machine on public roads Main Sample Couriers Always
(481) %
Usually (481)
%
Sometimes (481)
%
Never (481)
%
Always (80) %
Protective one-piece motorcycle suit
14 3 10 73 29
Protective motorcycle jacket
75 6 4 15 83
Other jackets 23 7 13 57 19 Protective motorcycle
trousers 42 10 20 28 76
Other trousers 29 11 22 38 21 Protective motorcycle
boots 54 7 7 31 78
Other boots 22 8 13 58 19 Gloves 89 5 3 2 78
CE approved armour (in clothing or separately)
51 5 6 38 50
Most riders always wear protective jackets, however moped and scooter riders are more likely to wear a jacket other than a protective one; 85% of motorcycle riders always wear a protective jacket compared to 53% of scooter and 45% of moped riders. However, even if one adds the proportions who always wear a protective one-piece suit or trousers, a substantial minority of riders do not always have protection for the lower half of their body. Moped and scooter riders are especially likely to leave the lower half of their body unprotected. Furthermore, only just over half always wear protective motorcycle boots, while a similar proportion wears CE approved armour. Again, riders of less powerful machines are much less likely to wear boots or amour. Almost all wear gloves, but 2% of the main sample and 8% of couriers claim never to do so. Couriers may be concerned at the time taken to take their gloves off and on when making deliveries. In general, the more enthusiastic riders (i.e. those who have had additional training and do a lot of riding) are a little more likely than others to wear protective clothing.
44 Transport for London • P2W User Survey 2004

Tab
le 1
0.2/
3: It
ems w
orn
on b
ody
whe
n ri
ding
mac
hine
on
publ
ic r
oads
(mai
n sa
mpl
e)
M
otor
cycl
e R
ider
s
(333
)
Scoo
ter R
ider
s
(111
)
Mop
ed R
ider
s
(36)
*
A
lway
s U
sual
ly
Som
etim
es
Nev
er
Alw
ays
Usu
ally
So
met
imes
N
ever
A
lway
s U
sual
ly
Som
etim
es
Nev
er
Prot
ectiv
e on
e-pi
ece
mot
orcy
cle
suit
15
3
1171
91
684
173
377
Prot
ectiv
e m
otor
cycl
e ja
cket
85
5
4 6
53
7 6
35
45
6 3
46
Oth
er ja
cket
15
614
6441
713
3841
1111
37
Prot
ectiv
e m
otor
cycl
e tro
user
s 52
11
20
16
19
5
22
54
11
3 11
75
Oth
er tr
ouse
rs
18
10
2646
5116
1420
5616
1414
Prot
ectiv
e m
otor
cycl
e bo
ots
68
10
716
211
869
20-
773
Oth
er b
oots
15
613
6539
119
4141
811
39
Glo
ves
924
22
865
63
728
146
CE
appr
oved
arm
our (
in
clot
hing
or s
epar
atel
y)
62
6
626
261
469
20-
-80
* C
autio
n: lo
w b
ase
size
44
Tr
ansp
ort f
or L
ondo
n •
P2W
Use
r Sur
vey
2004

While they are more likely than men to wear high visibility clothing, women are a little less likely to wear protective boots or CE approved armour, reflecting their greater likelihood of riding smaller, less powerful machines. Table 10.2/4: Items worn on head when riding machine Main Sample Couriers Always
(481) %
Usually (481)
%
Sometimes (481)
%
Never (481)
%
Always (80) %
Full-face helmet (including flip face
helmet)
80 3 6 11 79
Open-face helmet 14 2 8 75 13 Dark visor 7 2 12 79 9
Earplugs 10 1 10 78 11 Most riders always wear full-face helmet but some favour open-face helmets and these are more popular among riders aged 55 and over. This is despite the fact that full face helmets, with an integral chin guard and visor that closes onto the chin bar are likely to give greater protection, reducing the risk of injury in an accident. Although most riders of scooters (66%) and mopeds (70%) always wear full-face helmets they are less likely to do so than motorcycle riders (87%). A substantial minority (20% of moped riders and 24% of scooter riders) always wear open face helmets compared to 8% of motorcycle riders. Most P2W riders use machines capable of speeds at which wind noise can damage hearing (40mph+). However, few riders wear dark visors or earplugs. Just one rider amongst the moped and scooter sample totalling 172 riders ever wears earplugs. Only one in three couriers had safety equipment or clothes provided by their employers. Items mentioned by two couriers or more were:- •
• • • •
high visibility clothing (18%) – possibly advertising the company protective jacket (11%) protective boots (4%) protective one-piece suit (3%) protective trousers (3%).
45 Transport for London • P2W User Survey 2004

Ages of helmets varied greatly. One in three of the main sample said the helmet they used most often was no more than one year old, while 3% wear helmets over seven years old. New riders (and those who have recently returned to riding) are naturally more likely to have new helmets. Scooter and moped riders, often new riders, are more likely to have new helmets with 49% of moped riders and 41% of scooter riders having a helmet less than one year old. Based on the ages of helmets of experienced riders it appears that most riders change their helmets at least once every four years, or more frequently. This is in line with the recommended maximum lifespan of a helmet of five years. Table 10.2/5: Ages of helmets used most often
Main sample
504 %
Couriers
80 %
One year or less 33 30 Over 1 up to 2 years 29 33 Over 2 up to 3 years 17 28 Over 3 up to 5 years 16 8 Over 5 up to 7 years 3 1
More than 7 years 3 1 Costs of higher protection Type A helmets typically cost from around £80 upwards. Amongst those interviewed, costs of helmets vary greatly with the mean price being between £151 and £200, raised by some very expensive helmets costing £400 or more. The median or typical helmet costs between £100 and £150. Cheaper helmets (which may mean Type B helmets, tested to lower standards) tend to be owned by those who:- •
• • • •
have been riding for three years or less (almost half of whom have helmets costing £100 or less) are aged under 25 or over 55 (more than half spending £100 or less) have below-average annual mileage ride P2Ws of 125cc or less ride scooters or mopeds (84% of moped and 75% of scooter riders spend £150 or less).
46 Transport for London • P2W User Survey 2004

More ‘enthusiastic’ riders who have had additional training, who own powerful machines and who do a lot of mileage spend above-average sums on their helmets. Table 10.2/6: Cost of helmet
Main sample
504 %
Couriers
80 %
£50 or less 8 6 £51-£100 22 22
£101-£150 23 23 £151-£200 11 11 £201-£300 17 20 £301-£400 9 16 Over £400 4 3
Don’t know/not answered 4 1 Mean £170 £178
47 Transport for London • P2W User Survey 2004
11
11.1.
TRAINING
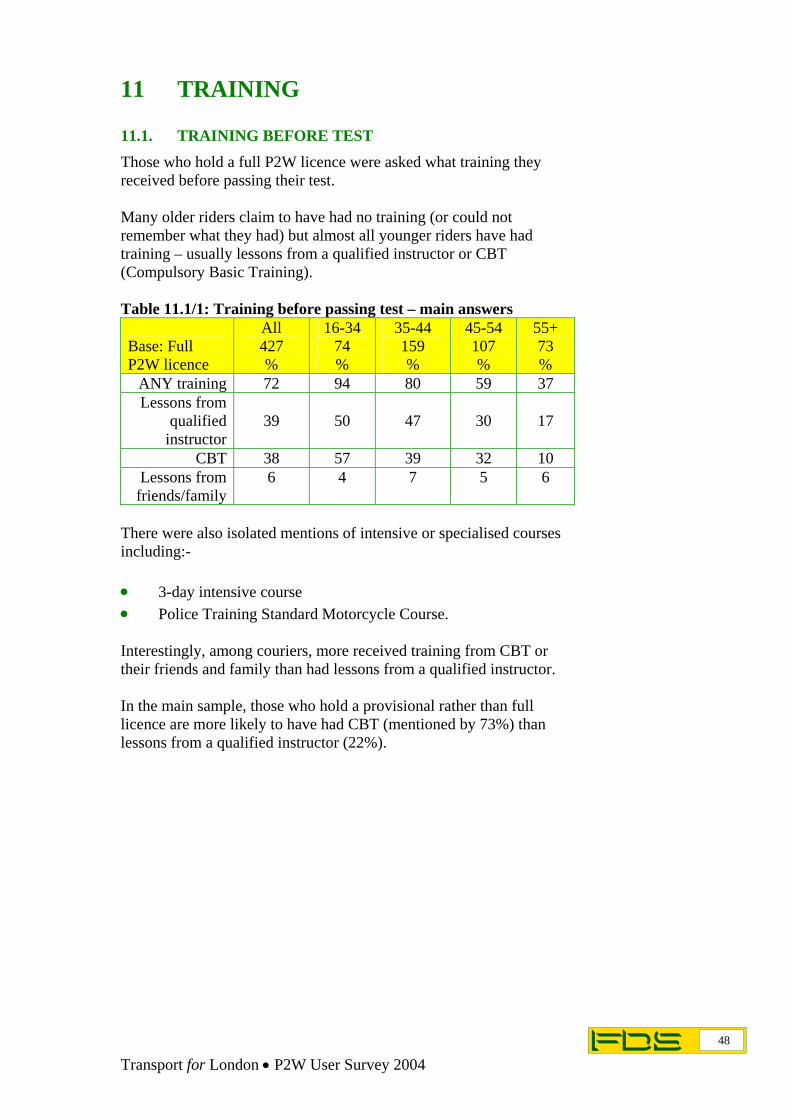
TRAINING BEFORE TEST Those who hold a full P2W licence were asked what training they received before passing their test. Many older riders claim to have had no training (or could not remember what they had) but almost all younger riders have had training – usually lessons from a qualified instructor or CBT (Compulsory Basic Training). Table 11.1/1: Training before passing test – main answers
Base: Full P2W licence
All 427 %
16-34 74 %
35-44 159 %
45-54 107 %
55+ 73 %
ANY training 72 94 80 59 37 Lessons from
qualified instructor
39
50
47
30
17
CBT 38 57 39 32 10 Lessons from friends/family
6 4 7 5 6
There were also isolated mentions of intensive or specialised courses including:- • •
3-day intensive course Police Training Standard Motorcycle Course.
Interestingly, among couriers, more received training from CBT or their friends and family than had lessons from a qualified instructor. In the main sample, those who hold a provisional rather than full licence are more likely to have had CBT (mentioned by 73%) than lessons from a qualified instructor (22%).
48 Transport for London • P2W User Survey 2004

11.2.
• • •
• •
TRAINING AFTER TEST Since passing their test, 24% of full P2W licence holders had undertaken further training or skills development courses, including those on road, off road or track based. Demographic groups more likely to have had additional training/skills development include:-
35-44 year olds (29%) ABC1s (28% compared to 15% of C2DEs) men (25% compared to 17% of women).
Other groups who are more likely to have had additional training/skills development include:-
those with annual P2W mileage of 5,000 miles or more (39%) those whose machines are 600ccs or more (39%).
Those whose work involves riding, including couriers, are not markedly more likely to have had extra training. Those with additional training/skills development tend to score higher on the confidence/aggression index, possibly because their participation has given them more confidence in their abilities as a rider. Among the main sample who had undertaken additional training/skills development courses, almost all had undertaken a course relating to road riding. Courses mentioned by two or more people are shown in the table below. Table 11.2/1: Road-based further training/skills development courses
Ever had additional training
108 %
All
respondents 504 %
IAM (Institute of Advanced Motorists) 28 6 BikeSafe – London skills day 19 4
Police Training Standard Motorcycle course
14
3
RoSPA 6 1 CBT 4 1
‘Refresher’ course 3 1
49 Transport for London • P2W User Survey 2004

Other road-based training/skills development courses included:- • • • •
• • • •
• • • •
BMW road training RAC training course BSM training course BikeSafe courses outside London
Almost one in three of those who had additional training cited track-based courses. Those mentioned by two or more interviewees include:-
Track Day (cited by 11% of all those having additional training) California Superbike School (7%) Ron Haslam Race School (5%) Yamaha Track & Race School (3%)
Other mentions included:-
Suzuki Performance Riding School BMW track training European Superbike School Seattle Superbike Training
Other forms of training mentioned included off-road motorcycle training, mentioned by four people. Almost 8% of all riders claimed to have had any additional training/skills development in the last twelve months. BikeSafe skills days have been introduced relatively recently and most of those who had gone on a BikeSafe course had done so in the last twelve months. Almost 3% of all those interviewed had attended a BikeSafe course in the previous twelve months and this was the most widely mentioned form of additional training/skills development experienced in this time frame, followed by Track Day. In contrast, those who mentioned Institute of Advanced Motorists courses had usually experienced this over three years ago and fewer than 1% had been on an IAM course in the last year.
50 Transport for London • P2W User Survey 2004

Those who had had further training/skills development were asked how useful they found this in terms of improving their road riding skills. In the table below, note that individuals who gave ratings for two or more courses are counted for each one. Table 11.2/2: Perceived usefulness of courses in improving road skills
All Road 139 %
IAM 31 %
BikeSafe – London
19 %
Track/Other Training
60 %
Extremely useful 45 49 46 26 Very useful 32 32 26 33
Fairly useful 16 16 28 14 Not very/not at all useful 6 3 - 25
Reactions to all courses are positive (especially road-based courses) with most finding additional training to be extremely or very useful. Those who found the IAM course useful typically argued it had improved their awareness of dangers on the roads and thus made them safer riders. Some said it had given them useful general information, improved their riding skills and made them aware of bad habits they had picked up. A few complained that training was insufficient for their needs and/or that trainers lacked knowledge but there were many more favourable than unfavourable comments. Among those who had not undertaken any further training or skills development since obtaining their full P2W licence the main reasons given were:- •
• • • • •
do not feel need to/feel have had enough training (volunteered by 51% of the 319 respondents in the main sample and the vast majority of couriers) do not have time (21% of main sample) too expensive (10%) not interested/not bothered (9%) was not aware what training was available (4%) too soon/have only just passed test (2%).
51 Transport for London • P2W User Survey 2004

There were no specific criticisms made of BikeSafe – London and a wide range of positive comments. As with the IAM course, the most frequently mentioned reason for finding it useful was that it improved their awareness of dangers on the roads, making them safer riders. Some observed that it reinforced their existing knowledge and provided useful general information. Other road-based courses (such as RoSPA and Police Training) were also praised, most typically for:- •
•
•
•
•
•
giving general information/improving riding skills generally
improving awareness of dangers on the roads/making participants safer riders
boosting their confidence on roads
teaching them how to handle their machine better/get the most out of it.
The most frequent complaint (though still rare) was that training was insufficient for their needs. Those who attended track-based courses were more likely to argue that courses improved their skills, as they learned how to handle their machine better. The emphasis was on riding skills rather than riding safety and road awareness – and participants generally felt the track-based courses met their objectives. Those who had extra training did not appear to be very different from other riders in their attitudes or behaviour although they were more likely to:-
be very confident in their abilities
demonstrate a keen interest in riding, for example through reading magazines aimed at riders.
Assuming confidence in their abilities is based on enhanced skills and awareness in reacting to road situations, this is likely to make them safer riders, less likely to experience accidents.
52 Transport for London • P2W User Survey 2004

12
12.1.
•
•
ACCIDENTS, NEAR MISSES AND SAFETY
ACCIDENTS Interviewees were questioned about:-
P2W accidents they had had in the last three years – what caused them – whether they necessitated hospital treatment near misses, where they only just avoided having an accident or losing control of their P2W.
More than one in three riders reported having a P2W accident in the last three years and among couriers this proportion rises to three in five. Predictably there is a strong correlation between how much people ride and the likelihood of them having an accident. Table 12.1/1: P2W accidents experienced in the last three years
Annual Mileage Days ride per week
Total (504)
%
2000 or less (171)
%
2001-5000 (166)
%
Over 5000 (158)
%
1-2
(129) %
3-5
(246) %
6-7
(129) %
Couriers(80) %
ANY accidents 36 25 37 46 20 37 49 59 One 23 19 26 24 14 23 31 30 Two 8 5 5 13 4 8 9 18
Three 4 1 6 5 2 4 6 4 Four or more 1 1 - 3 1 1 2 7
On this basis, a typical rider has an accident around once every 15-18 months, or once every 15-20,000 miles. The greater numbers of accidents experienced by couriers reflect their greater mileage. Several of those who had been riding for less than a year had already had an accident and two individuals each had three accidents. Two out of five (40%) of those riding for between one and three years had one or more accidents. As riders gain more experience and get older the likelihood of their having an accident reduces.
53 Transport for London • P2W User Survey 2004

Riders of the most powerful machines are less likely to have had accidents in the last three years than other P2W riders. Table 12.1/2: Accidents experienced in last three years by P2W riders Engine size
Total (504)
%
50cc or less
(38) %
51-125cc
(102) %
126-600cc
(180) %
601-1000cc
(138) %
Over 1000cc
(38) %
ANY accidents 36 40 32 43 36 15 One 23 23 20 28 24 9 Two 8 11 3 8 11 7
Three 4 6 8 4 1 - Four or more 1 - 1 3 - -
Within the sample, non-White riders are statistically significantly more likely to have accidents, but the cell size is small, so this result should be treated with caution. Chart 12.1/3: Proportions having accidents by sub-group
36
40
44
38
30
22
37
31
34
59
21
42
4329
All (504)
Under 25 (20)
25-34 (80)
35-44 (181)
45-54 (122)
55+ (82)
ABC1 (300)
C2DE (158)
White (460)
Non-White (28)
Up to 1 year (19)
1-3 years (66)
3-10 years (121)
Over 10 years (298)
%
How long riding?
There was not a clear relationship between likelihood of a rider having further training and likelihood of them having an accident. In some ways this is not surprising because there are a number of factors at work here.
54 Transport for London • P2W User Survey 2004

Firstly, some of those receiving training may have been prompted to do so, following an accident. Secondly, those who have further training tend to ride more, so have more opportunity to have accidents. These factors suggest there could have been could be a positive correlation between having additional training and having accidents but in fact those who have had further training are no more likely than other riders to have accidents. This suggests training reduces likelihood of having accidents (a theory supported by the positive views expressed by those who received training). Those who had had an accident in the last three years were fairly evenly divided between those whose last accident was in 2004, 2003 or earlier. Accidents occurred throughout the year and were not concentrated in any one month, although among our sample early Autumn (September and October) produced the most accidents and May the fewest. Chart 12.1/4: Months when accidents occurred (Base: 217 accidents reported by 165 individuals)
Feb
Mar
Apr
May
Jun
JulAug
Oct
Nov
Dec
Sept
Jan
7%8%
8%
7%
4%
10%6%9%
13%
11%
8%
7%
In the main sample, 86% of those experiencing an accident in the last three years had an accident in London and this figure rose to 94% for couriers. Over half the riders involved in accidents received injuries – but these were not usually serious enough to require hospital treatment.
55 Transport for London • P2W User Survey 2004

Likelihood of injuries received requiring hospital treatment increased slightly with the engine size of the vehicle, although this was not a strong correlation. The most recent accidents experienced by the main sample resulted in:- •
•
•
•
•
•
injuries to respondent – requiring hospital treatment (in 25% of cases)
injuries to respondent – NOT requiring hospital treatment (31%)
injuries to pillion rider requiring hospital treatment (1%)
injuries to third party or pillion rider requiring hospital treatment (one instance – less than 0.5%)
injuries to third party not requiring hospital treatment (1%)
no injuries at all in 43% of cases.
56 Transport for London • P2W User Survey 2004

21% of riders surveyed said they had an accident in the last three years which results in someone (almost always themselves) suffering an injury. In total 10% of all riders surveyed reported having an accident in the last three years which resulted in them (or in a few cases, another person) requiring hospital treatment. The equivalent figure for couriers was much higher at 25% reflecting their greater mileage. Table 12.1/5: Profile of accidents experienced
Accidents in the last Three Years
Main sample (504)
%
Any (234)
%
Involving
Injury (108)
%
InvolvingSerious Injury (52) %
Accident reported to police
(86) %
Male 86 85 82 83 85 Female 14 15 18 17 15
Under 25 5 6 7 8 10 25-34 20 25 21 24 29 35-44 40 42 50 56 45 45-54 23 19 13 4 12
55+ 12 8 8 8 5 ABC1 65 69 67 67 67 C2DE 35 31 33 33 33 White 93 89 90 83 87
Non-White 7 11 10 17 13 Had further on
road training 16 15 15 12 15
57 Transport for London • P2W User Survey 2004

The vast majority of accidents (83%) experienced by interviewees in the last three years were in London. The profile of those having accidents in London is shown below, with data based on accidents rather than individuals (ie someone who has had two accidents is counted twice) Table 12.1/6: Profile of those experiencing accidents in London
Accidents in the last Three Years
All having accidents
(194) %
Involving injury (105)
%
Involving serious
injury (ie hospitals)
(47) %
Accident
reported to police (78) %
Male 86 83 83 85 Female 14 17 17 15
Under 25 4 4 2 5 25-34 22 20 22 28 35-44 42 51 56 41 45-54 22 17 9 19
55+ 10 8 11 5 ABC1 69 67 68 68 C2DE 31 33 32 32 White 90 90 83 86
Non-White 10 10 17 14 Had further on
road training16 17 13 17
58 Transport for London • P2W User Survey 2004

Men and women riders are roughly equally likely to have accidents. Younger riders (those under 35) are more likely than those aged 55 and over to have accidents. The under 45s are more likely to have serious accidents than the over 45s. Social grade does not appear to affect likelihood of having accidents. Those who have had further on road training are as likely as other riders to have accidents but as they tend to ride more miles, their likelihood of having accidents relative to miles ridden is marginally lower. Respondents were asked what caused or played a part in the accident. Remarkably, only one in five of the main sample felt their own errors contributed to the accident. Across the board, among men and women of different age groups, very few blamed themselves. Those who ride a lot, such as couriers, are especially unlikely to blame themselves for accidents. Most claimed other road users, especially drivers, contributed to their accidents or blamed bad weather, road conditions or luck. Those who had more than one accident typically blamed other drivers for their last two accidents. Very few felt they themselves were, at least partly, responsible. Table 12.1/7: What contributed to accidents
Main Sample Courier Recent
accident (234)
%
Recent accidents
(79) %
OWN ERROR 18 8 Error by driver 56 61
Error by other motorcyclist 6 6 Error by pedestrian 5 10
Error by cyclist 2 4 Poor weather 16 4
Poor road conditions 13 4 Diesel spillage on road 9 4
Bad luck 7 8 Nothing in particular/other answers 1 1
Where accidents resulted in someone having hospital treatment more than seven out of ten riders claimed that at the time of the accident they were driving straight ahead normally, rather than undertaking any manoeuvre. This is consistent with police accident statistics which report most P2W accidents happening when the rider was riding straight ahead.
59 Transport for London • P2W User Survey 2004

In this survey, almost three in ten were doing something other than driving ahead normally, with three or more individuals each saying they were:- • • • •
• • • •
• • • • •
approaching a roundabout going round a right hand bend overtaking moving vehicle offside (all of these were couriers) overtaking stationery vehicle offside.
Interestingly, hardly any riders say their accidents occurred when they were turning left or right or overtaking vehicles nearside. Overall, just over four in ten of the accidents experienced were reported to the police. About one in six of the main sample had a P2W accident in the last three years which was reported to the police. Where accidents resulted in riders or others having hospital treatment they were almost always reported to the police. Only around one in four accidents where victims did not require hospital treatment were reported to police. The main makes of P2Ws ridden by those who had accidents in London are broadly in line with the proportion of riders riding these bikes. Similarly the main types of P2Ws ridden by those who had accidents also reflected the main types which are ridden:-
Naked (11 mentions in main sample plus 4 couriers) Supersport (10 +2) Scooter (7 +1) Sport/Touring (4 +4)
We did not specifically ask about the engine size of the P2W they were riding at the time of the accident but on the basis of what they are currently riding:-
9% have P2Ws of 500cc or less 20% (51-125cc) 44% (126-600cc) 24% (601-1000cc) Only 3% P2Ws of over 1000cc.
60 Transport for London • P2W User Survey 2004

The 41 individuals who had riding accidents in London where they or others were injured were asked whether their accident changed their own behaviour or attitudes to riding. Most of them (70%) said the accident changed their attitudes. Changes brought about by the accident were:- •
•
•
•
now more careful when riding (mentioned by 31% of those having accidents involving injuries)
not as confident/no longer relaxed when riding (13%)
no longer ride/gave up courier job (13%)
made them more aware of other drivers/try to anticipate more (11%).
This suggests serious accidents affect rider behaviour. Earlier statements about attitudes to riding did not suggest that those who had accidents resulting in hospital treatment were particularly cautious. Nevertheless, it may still be true that having an accident caused them to ride more carefully.
61 Transport for London • P2W User Survey 2004

12.2. NEAR MISSES In addition to being questioned about actual accidents, interviewees were also asked how many times in the last three years they had a ‘near miss’ when they felt they only just avoided having an accident or losing control of their motorcycle, scooter or moped. Responses varied enormously between individuals with 27% of the main sample claiming to have had no near misses while in marked contrast, 19% said they had had ten or more. Table 12.2/1: Numbers of near misses in last three years
Annual Mileage Days ride per week
Total (504)
%
2000 or less (154)
%
2001-5000 (156)
%
Over 5000 (158)
%
1-2
(129) %
3-5
(246) %
6-7
(129) %
Couriers(80) %
ANY 73 63 73 84 59 78 77 87 One 14 21 10 10 15 15 13 1 Two 14 12 13 16 13 16 10 4
Three 10 6 12 11 3 12 11 4 4-5 12 11 14 12 9 14 10 10 6-9 4 5 5 5 5 5 4 10
10 or more 19 8 20 30 15 16 28 59 There is a strong correlation between numbers of miles ridden and numbers of near misses with more frequent riders having more near misses. Many couriers claimed to have frequent near misses with almost half (45%) saying they had had twenty or more near misses in the last three years. Answers to this question are more subjective than the question relating to accidents. Some individuals probably count as near misses, incidents which other riders would ignore or forget about.
62 Transport for London • P2W User Survey 2004

This question produced marked differences in responses between different age and class groups. Chart 12.2/2: Numbers of near misses in last three years
19 20 13 21 18
2628
2925
14
2825
2826
3028
17
29
21
2718 22
31
51
2236
1525
None1-23-910+
All(504)
Under 35 (100)
35-44 (181)
45-54 (122)
55+ (82)
ABC1 (300)
C2DE (158)
%
Younger riders are much more likely to claim they have had near misses than were older riders. Over half the over 55s, said they had had no near misses in the last three years. Nevertheless, a small group of riders over 55 claimed to have had numerous recent near misses. ABC1s are more likely than C2DE riders to say they have had near misses. This question did not show marked differences in response by gender. There is a positive correlation between numbers of accidents experienced in the last three years and numbers of near misses. Those who have had accidents, especially those who have had three or more accidents are likely to have had more near misses than other riders.
63 Transport for London • P2W User Survey 2004
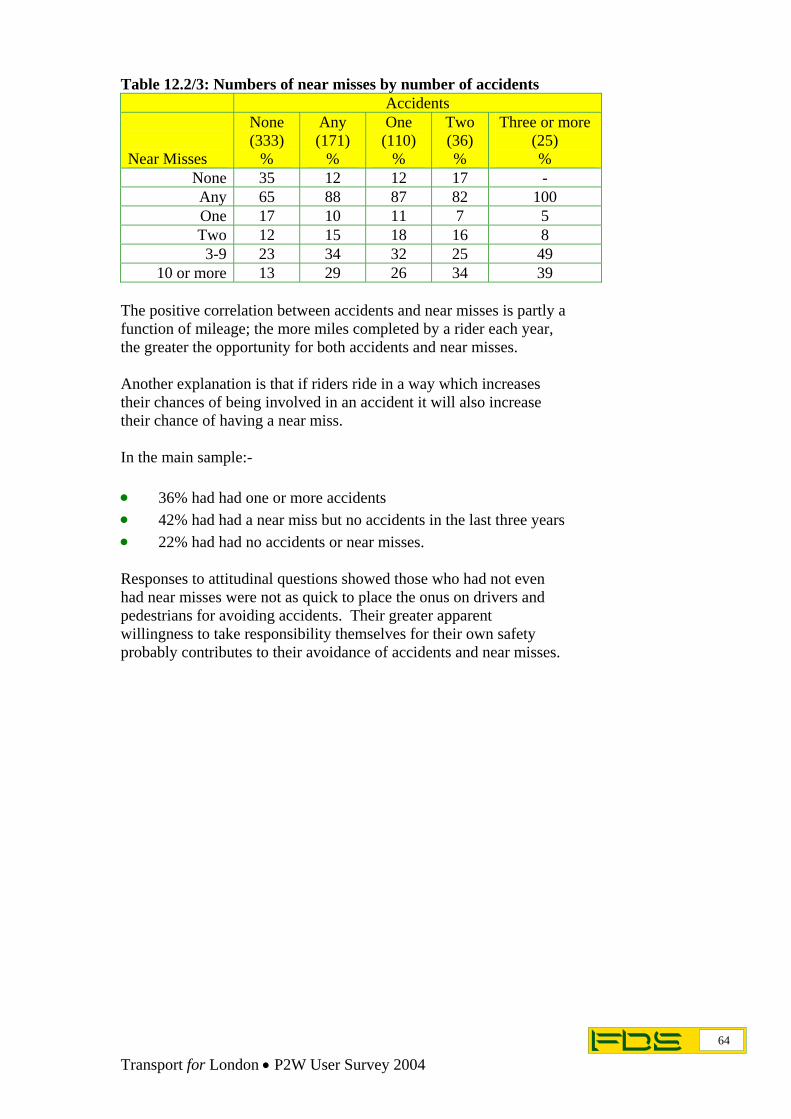
Table 12.2/3: Numbers of near misses by number of accidents Accidents
Near Misses
None (333)
%
Any (171)
%
One (110)
%
Two (36) %
Three or more (25) %
None 35 12 12 17 - Any 65 88 87 82 100 One 17 10 11 7 5 Two 12 15 18 16 8 3-9 23 34 32 25 49
10 or more 13 29 26 34 39 The positive correlation between accidents and near misses is partly a function of mileage; the more miles completed by a rider each year, the greater the opportunity for both accidents and near misses. Another explanation is that if riders ride in a way which increases their chances of being involved in an accident it will also increase their chance of having a near miss. In the main sample:- • • •
36% had had one or more accidents 42% had had a near miss but no accidents in the last three years 22% had had no accidents or near misses.
Responses to attitudinal questions showed those who had not even had near misses were not as quick to place the onus on drivers and pedestrians for avoiding accidents. Their greater apparent willingness to take responsibility themselves for their own safety probably contributes to their avoidance of accidents and near misses.
64 Transport for London • P2W User Survey 2004
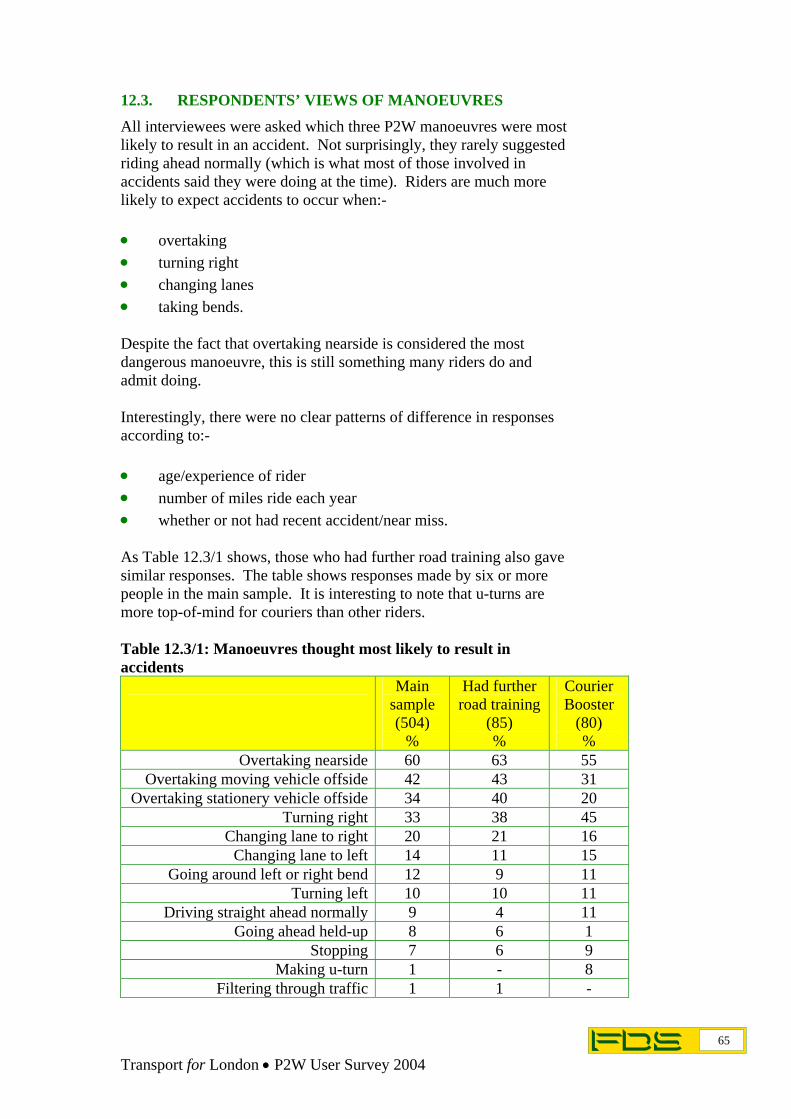
12.3.
• • • •
• • •
RESPONDENTS’ VIEWS OF MANOEUVRES All interviewees were asked which three P2W manoeuvres were most likely to result in an accident. Not surprisingly, they rarely suggested riding ahead normally (which is what most of those involved in accidents said they were doing at the time). Riders are much more likely to expect accidents to occur when:-
overtaking turning right changing lanes taking bends.
Despite the fact that overtaking nearside is considered the most dangerous manoeuvre, this is still something many riders do and admit doing. Interestingly, there were no clear patterns of difference in responses according to:-
age/experience of rider number of miles ride each year whether or not had recent accident/near miss.
As Table 12.3/1 shows, those who had further road training also gave similar responses. The table shows responses made by six or more people in the main sample. It is interesting to note that u-turns are more top-of-mind for couriers than other riders. Table 12.3/1: Manoeuvres thought most likely to result in accidents
Main sample (504)
%
Had further road training
(85) %
Courier Booster
(80) %
Overtaking nearside 60 63 55 Overtaking moving vehicle offside 42 43 31
Overtaking stationery vehicle offside 34 40 20 Turning right 33 38 45
Changing lane to right 20 21 16 Changing lane to left 14 11 15
Going around left or right bend 12 9 11 Turning left 10 10 11
Driving straight ahead normally 9 4 11 Going ahead held-up 8 6 1
Stopping 7 6 9 Making u-turn 1 - 8
Filtering through traffic 1 1 -
65 Transport for London • P2W User Survey 2004

12.4. IMPROVING RIDER SAFETY By far the most common suggestion when interviewees were asked what Transport for London can do to improve safety for those riding motorcycles, scooters or mopeds in London was to allow P2W to use bus/cyclists lanes. Suggestions made by more than five interviewees are shown below:- Table 12.4/1: Most common suggestions for improving P2W safety
Main Sample (504)
%
Courier Booster
(80) %
Allow P2Ws to use bus/cyclist lanes 45 39 Increase other road users awareness of
riders16 24
Resurface/repair/improve/clean roads 13 14 Insist on more training/education for
riders/other road users11 16
Provide separate P2W lanes 9 - Provide more/improve parking
facilities5 3
Ban/reduce numbers of cars on roads 5 - Make sure riders/others more safety
conscious 3 8
Heavier penalties for law breakers 2 - Make sure riders/other road users stick
to speed limits2 1
Provide more traffic police 2 - Improve traffic signs/lights 2 -
Make all riders wear protective clothing
1 -
Allowing P2Ws to use bus lanes was the most popular suggestion among most survey sub-groups except:- •
•
non-White riders who favoured separate lanes
riders under 25 who also liked the idea of separate P2Ws lanes and were concerned about road surfaces.
Organisations representing cyclists have expressed opposition to the idea of P2Ws using bus/cyclist lanes and this issue is likely to continue to stimulate debate.
66 Transport for London • P2W User Survey 2004

Experienced riders and those who drive many miles in London are especially likely to suggest allowing P2Ws to use bus/cyclist lanes. The second most common suggestion is to increase other road users’ awareness of riders and series of advertising campaigns both by TfL and by Department of Transport through their ‘Think’ campaign have sought to address this objective. Another popular suggestion, made by experienced rather than inexperienced riders, is to require riders (and possibly other road users) to have more training/education. Similarly, some recommended steps be taken to ensure riders (and others) are more safety conscious. A few suggested riders be made to wear and/or provided with protective clothing. There were several comments relating to banning cars or reducing the number on London roads by encouraging drivers to use other means of transport. Others felt that improving parking facilities would improve rider safety, which corresponds to the belief held by some riders that many P2W accidents are caused by them overtaking stationary vehicles. Some wanted more traffic police and for speed limits to be enforced more rigorously.
67 Transport for London • P2W User Survey 2004

12.5.
• • •
•
•
•
THEFT/DAMAGE Aside from issues of personal safety, a major concern for P2W riders relates to their machine being stolen or damaged. One in four of the main sample and one in two couriers had experienced problems in the last year in London. Damage to parked machines was the most widespread problem, but theft was also common, both from riders’ homes and other locations. Likelihood of damage or theft (especially theft from locations other than the riders’ home) increased according to:-
numbers of days ride per week mileage in London whether use P2W for work purposes and/or commuting.
Those with P2Ws of engine size 125cc or less are more likely to encounter damage and theft than riders of larger machines. Possible explanations for this include:-
more sophisticated P2Ws have more sophisticated anti-theft devices riders of less valued machines take less care of them
greater appeal of small P2Ws, such as scooters, to thieves.
68 Transport for London • P2W User Survey 2004

Table 12.5/1: Problems experienced in last year in London
ANY %
Theft of machine
from home %
Theft of machine
from other location
%
Damage to machine
parked on road %
Main Sample All (504)
26
6
4
19
Engine size up to 125cc (140)
126-600cc (180)601-1000cc (138)Over 1000cc (38)
34 21 19 26
11 3 5 4
9 1 4 -
24 18 11 22
Day ride per week 1-2 (129)3-5 (246)6-7 (129)
13 27 33
3 7 8
2 3 10
11 21 23
Annual mileage in London
2000 or less (241)Over 2000 miles (239)
21 31
5 7
4 4
14 24
Usage Use for work (41)
Use to commute (356)
37 29
7 7
3 5
31 21
Courier boosters (80) 50 13 14 29
69 Transport for London • P2W User Survey 2004

12.6.
• •
• • • •
REASONS FOR GIVING UP RIDING In the initial contact survey 80 individuals in the random sample (just over 1% of those spoken to) said that although they had not ridden a motorcycle, moped or scooter in London in the past year, they had done so in the past three years. These individuals included high proportions of moped/scooter riders and were predominately:-
male aged 25-44.
The main reasons they gave for stopping riding in London (each volunteered by 18-25% of those providing reasons) were:-
bought a car instead had an accident too dangerous use public transport instead.
It is clear therefore, that safety concerns lead sizeable numbers of riders to stop. The profile of those who had stopped because of an accident (mostly male and mostly aged 35-44) is broadly in line with the profile of current riders. However, it is also likely from the fact that proportions of P2W riders decline among older age groups that as they pass 45 or 50, sizeable numbers of riders stop riding in London, either because they move away or stop using their vehicle.
70 Transport for London • P2W User Survey 2004

13
13.1.
• • •
•
•
• •
EFFECTS OF CONGESTION CHARGE
RIDING IN CONGESTION CHARGE ZONE All the couriers surveyed and 62% of the main sample ever ride in the congestion charge zone within its hours of operation. Just over half of those riding under 2000 miles in London but over seven in ten of those riding over 2000 miles do so. Demographic groups more likely to ride in the congestion charge zone are:-
men (63% of whom do so compared to 52% of women) ABC1s (68% of whom ride compared to only 49% of C2DEs) 25-34 year olds (71% ride compared to a third of the under 25s).
Almost one in five riders say the existence of a Congestion Charge influenced their riding behaviour:-
4% say they have only started riding in the affected area since the introduction of the Congestion Charge
10% ride more since the Charge was brought in.
In contrast:-
4% say they now avoid the area 1% ride less in the affected area since the Charge was introduced.
Only 10% of couriers say the Congestion Charge has influenced their riding with five riding more in the Congestion Charge area and three less. In the main sample, it is relatively infrequent riders who are most likely to be encouraged to use or be discouraged from using the affected area following the introduction of the Congestion Charge. Interviewees who ride in the Congestion Charge zone within its hours of operation were asked whether and if so how, congestion charging has affected the safety of travelling in the zone by P2W.
71 Transport for London • P2W User Survey 2004

Very few of those who (continue to) ride in central London feel the congestion charge has made riding less safe. Substantial numbers (more than half of the main sample) and more than one in three couriers) feel the Congestion Charge has made riding a P2W safer. Across all demographic groups and levels of riding experience and mileage substantial numbers feel the Congestion Charge has enhanced the safety of travelling in the zone by P2W. Chart 13.1/1: Impact of Congestion Charge on safety of travelling by P2W
6 4
4358
5238
Safer
Same
Less safe
Main sample307%
Couriers77%
These results are consistent with the reduction in accidents in the Congestion Charging Zone since its introduction.
72 Transport for London • P2W User Survey 2004

13.2. PARKING Only 10% of couriers and 23% of the main sample who ride in the Congestion Charge area have private or designated parking within the charging zone. Of those who commute to work, 27% have designated parking. Riders complain that finding a motorcycle parking space in the area they wish to park within the charging zone is hard. Couriers are less likely to make this complaint, possibly because they leave their machines for shorter periods or because many of the businesses they visit have parking spaces they can use. Table 13.2/1: Ease of finding motorcycle parking space within zone Base: Ride in congestion zone but no designated parking
Main sample 236 %
Couriers 72 %
Very easy 4 3 Easy 8 5
Neither easy nor difficult 8 45 Difficult 33 11
Very difficult 40 35 Don’t know 7 1
While many riders feel riding has become safer since the introduction of the Congestion Charging zone, most feel it has become more difficult to find a motorcycle parking space in the zone. Table 13.2/2: How ease of finding parking space changed since Congestion Charge introduced Base: Ride in congestion zone but no designated parking
Main sample 236 %
Couriers 72 %
Improved 2 8 Stayed the same 29 46
Got worse 35 14 Got much worse 28 30
Don’t know 8 3
73 Transport for London • P2W User Survey 2004

14
• • • • •
ACTIVITIES ASSOCIATED WITH RIDING
Interviewees were asked questions relating to information sources about motorcycles/mopeds/scooters and:-
P2W events/shows/meets P2W newspapers/magazines TV programmes on motorcycles/scooters specialist motorcycles/scooter websites radio stations listened to.
More than one in four riders had attended one or more of six major P2W shows in 2004. Among London-based riders by far the most popular shows were the Road Racing and Superbike Show in North London and the International Motorcycle and Scooter Show in Birmingham. Table 14/1: Shows attended in last year Main sample
504 %
Couriers 80 %
ANY OF THESE 26 29 Road Racing & Superbike Show, at
Alexandra Palace (Jan/Feb)17 24
International Motorcycle & Scooter Show at NEC (November)
14 9
BMF Garden of England Motorcycle Show at Paddock
Wood
4 1
BMF Show, at East of England Showground (May)
4 1
BMF Tail End Show, at East of England showground (Sept)
2 3
Beaulieu Motorcycle World (June) 2 - Likelihood of attending a show increases with:- • • • •
engine size total annual mileage length of time riding having further P2W training.
Women, ABC1s and non-White people all had lower than average likelihood of attending a show.
74 Transport for London • P2W User Survey 2004

Chart 14/2: Likelihood of main sample attending one or more shows
26
6
30
40
54
16
26
37
14
23
33
44
27
11
27
18
All (504)
125cc or less (140)
126-600cc (180)
601-1000cc (138)
Over 1000cc (38)
2000 or less (154)
2001-5000 (166)
Over 5000 (158)
3 years or less (85)
Over 3 up to 10 years (121)
Over 10 years (298)
Had further on road training (85)
White (460)
Non-w hite (28)
Male (441)
Female (63)
%
Engine size
Annual mileage
Riding for
75 Transport for London • P2W User Survey 2004

A sizeable minority of P2W riders are keen on watching motorcycle racing, and attend events. Those with powerful machines and who have had track/off-road training are especially likely to go. Most of those who go to events go to more than one each year. Chart 14/3: Events attended in last year
8
14
15
21
6
8
10
14
Moto GP
World Superbike (WSB)
British Superbikes (BSB)
ANY of these
Main sample (504)
Couriers (80)
%
Slightly larger proportions of riders said they regularly attend motorcycle/scooter related meets in London or the surrounding areas. Meets mentioned by four individuals or more are shown in the table below. Table 14/4: Main meets regularly attended Main sample
504 %
Couriers 80 %
ANY 16 44 Ace Café 7 20 Box Hill 6 11
Chelsea Bridge 4 13 Oakdene Café 3 1
Epping Forest/Highbeach 1 - Ace Café in North London and Box Hill in the South are the most widely attended meets. As with P2W shows, likelihood of attending meets increases with:- • • • •
engine size total annual mileage length of time riding having further on road training.
76 Transport for London • P2W User Survey 2004
The profile of those attending meets is very different, therefore from riders generally, with more ‘enthusiastic’ riders much more likely to attend meets. This underlines the fact that conducting research solely at locations such as Ace Café and Box Hill will not yield a sample representative of P2W riders.

Almost half the main sample and most couriers regularly read one or more specialist motorcycle/scooter newspapers or magazines. “Motorycle News” is by far the most widely read publication followed by “Bike”, “Ride” and “MCN Sport”. The table below shows publications read by at least five individuals in the main sample. Table 14/5: Specialist publications read regularly Main
sample 504 %
Couriers
80 %
ANY 47 85 Motorcycle News (MCN) 41 41
Bike 11 13 Ride 7 6
MCN Sport 5 23 Superbike 5 10
Classic Bike 4 10 Two Wheels Only (TWO) 2 5
Performance Bikes 2 15 Fast Bikes 2 8 Scootering 1 -
What Bike? 1 3 Backstreet Heros 1 4
Old Bike Mart 1 - Motorcycle Sport & Leisure 1 5
Publications such as “What Bike?” or “Old Bike Mart” are read regularly by relatively few people but may still be read by high proportions of those considering buying a machine. With a few expectations, such as “Scootering”, publications are more likely to be read by:- • • •
riders of P2Ws with large engines more experienced riders those with higher annual mileages, especially those who ride as part of their job.
77 Transport for London • P2W User Survey 2004

About one in five of the main and courier sample regularly visit one or more specialist motorcycle/scooter websites. By far the most widely mentioned (visited by 7% of all informants) is a general website, motorcyclenews.com. Others mentioned were often run by manufacturers or targeted at riders of particular machines. Websites mentioned by three individuals or more were:- • • • • • • • • • •
Honda website/Hondahornet.co.uk Bikersweb.com Ducati website Visordown.co.uk Aprillia website Gilera website Autotrader.com Biketrader.co.uk Superbikes magazine.co.uk Yamaha website
Riders get most of their information about motorcycles, mopeds and scooters from word of mouth or specialist press. Many couriers pick up things from other couriers. The internet is also used by significant numbers of riders as are specialist motor/scooter outlets. Sources mentioned by more than 1% are shown below. Table 14/6: Where obtain most information about P2Ws Main sample
504 %
Couriers 80 %
Specialist magazines/press 37 50 Friends 35 46 Internet 15 10
Specialist motor/scooter outlets 14 4 Colleagues 9 25
78 Transport for London • P2W User Survey 2004

Radio is potentially a good medium for:- • •
• • • •
reaching an audience of Londoners conveying road safety messages – and it is often used in road safety campaigns.
Radio 4 is the most listened to station, reflecting the relatively high socio-economic status and older age profile of P2W riders in general. Commercial stations with the most P2W-riding listeners are:-
Heart (listened to by 15% of the main sample and 13% of couriers) Virgin (13% and 15%) Kiss (9% and 13%) Magic (7% and 11%)
Capital is listened to by 8% of couriers but fewer in the main sample.
79 Transport for London • P2W User Survey 2004

15 CONCLUSIONS AND RECOMMENDATIONS
P2Ws are ridden by a wide range of age groups in London, some doing so on grounds of convenience, others because they positively enjoy riding. Among those who ride P2Ws in London, it appears they have accidents every 15-20,000 miles on average. Furthermore, with so few Londoners (less than 2% of the population) riding P2Ws, fear or perceptions that riding is potentially dangerous may play an important role in discouraging riders. Other road users, including pedestrians as well as drivers, need to be reminded to look out for P2Ws. Riders now have much more formal training than previously before riding P2Ws and receiving full licences. Those who take additional training/skills development such as IAM and BikeSafe – London find it beneficial, and more should be encouraged to take up this option, through a mix of targeted and more general media. Riders need to be encouraged to thoroughly take on board the message that they need to ride defensively. Too many currently appear to pay only lip service, leaving themselves potentially vulnerable if they ride in such a way that other drivers’ errors are more likely to result in accidents. Authorities also need to consider whether P2Ws should be allowed in bus lanes, and need to balance the views of P2W riders, cyclists and those running bus services.
80 Transport for London • P2W User Survey 2004

APPENDIX THE QUESTIONNAIRES
Appendix • The Questionnaires