Transport, deposition and aggregation of metal oxide...
238
Transport, deposition and aggregation of metal oxide nanoparticles in saturated granular porous media: role of water chemistry, collector surface and particle coating Adamo Riccardo Petosa Doctor of Philosophy Department of Chemical Engineering McGill University Montreal, Quebec, Canada April 2013 A thesis submitted to McGill University in partial fulfillment of the requirements of the degree of Doctor of Philosophy Adamo R. Petosa, 2013.
Transcript of Transport, deposition and aggregation of metal oxide...

Transport, deposition and aggregation of metal oxide nanoparticles in saturated granular porous media: role of
water chemistry, collector surface and particle coating
Adamo Riccardo Petosa
Doctor of Philosophy
Department of Chemical Engineering
McGill University Montreal, Quebec, Canada
April 2013
A thesis submitted to McGill University in partial fulfillment of the requirements of the degree of Doctor of Philosophy
Adamo R. Petosa, 2013.

ABSTRACT
Transport, deposition and aggregation of metal oxide nanoparticles in saturated granular porous media: role of water chemistry, collector
surface and particle coating
Adamo R. Petosa
2013
As a multitude of engineered nanomaterials (ENMs) are being incorporated into a
growing number of consumer products, the potential release of these reactive and
potentially toxic constituents into natural aquatic environments and soils is inevitable.
Nanosized metal oxides such as cerium dioxide (nCeO2), titanium dioxide (nTiO2) and
zinc oxide (nZnO) are examples of ENMs currently appearing in consumer products.
Upon the release of such ENMs into natural and engineered aquatic environments, particle
aggregation and deposition behavior will determine the particle transport potential and
thus the environmental fate and potential ecotoxicological impacts of the released
materials.
The objective of this research was to examine the transport behavior of select
nanosized metal oxides (namely, nCeO2, nTiO2 and nZnO) in saturated granular porous
media using laboratory-scale column experiments. The influence of water chemistry (pH,
ionic strength (IS) and cation type (Na+, Ca2+, or Mg2+)) and particle coating (uncoated
(bare) and poly(acrylic acid) (PAA)-coated ENMs) on particle deposition was examined in
quartz sand or loamy sand-packed columns. Select particle transport studies in natural

groundwater were also conducted, and PAA-coated metal oxide transport was compared
to that of an analogous nanosized PAA polymeric capsule (nCAP).
All ENM suspensions were characterized over a range of environmentally relevant
water chemistries using dynamic light scattering (DLS) and nanoparticle tracking analysis
(NTA) to establish aggregate size and laser Doppler velocimetry to determine particle
surface potential. To investigate aggregate morphology, transmission electron microscopy
(TEM) and scanning electron microscopy (SEM) images were obtained under select
conditions.
Overall, bare ENMs exhibited high retention within water-saturated quartz sand-
packed columns at NaNO3 solution IS as low as 0.1 mM for nTiO2 and 0.01 mM for
nZnO. Furthermore, bare nTiO2 was found to exhibit extensive aggregation, regardless of
pH and IS. At lower salt concentrations, the particle attachment efficiency (α) for the
nTiO2 aggregates onto quartz sand increased with increasing IS. At higher IS, α (pH 7) >
α (pH 3) > α (pH 9), likely due to enhanced particle aggregation at pH 7 and subsequent
physical straining within the granular matrix. Bare nTiO2 and nZnO displayed dynamic
(time-dependent) deposition behaviors under selected conditions.
In contrast, PAA-coated nTiO2 and nZnO were less prone to aggregation and
exhibited significant transport potential at IS as high as 100 mM NaNO3 or 3 mM CaCl2.
Likewise, PAA-coated nCeO2 particles suspended in NaNO3 were highly mobile in quartz
sand-packed columns. Nonetheless, heightened nCeO2 and nCAP particle retention and
dynamic transport behavior was observed with increasing divalent salt concentrations and
in natural groundwater. Moreover, enhanced particle retention was encountered in loamy
sand in comparison to quartz sand. Finally, the nCAPs proved to be a good surrogate
particle for the PAA-coated nCeO2.
These findings illustrate the importance of considering the extent and type of
particle surface modification when investigating metal oxide contamination potential in
granular aquatic environments. Furthermore, the results obtained emphasize the need to
consider the nature of the granular medium, along with the water chemistry, when
evaluating ENM contamination risks.
SOMMAIRE
Le transport, la déposition et l'agrégation des nanoparticules d'oxydes métalliques dans les milieux granulaires et poreux saturés : rôle de la
composition chimique de l'eau, du type de sol et le revêtement des particules
Adamo R. Petosa
2013
Actuellement, des différents types de nanomatériaux manufacturés (NMM) sont
intégrées dans un nombre croissant de produits de consommation. Par conséquent, la
libération de ces matériaux réactifs et potentiellement toxiques dans le sol et les milieux
aquatiques naturels est inévitable. Lors de la décharge dans l'environnement, l’agrégation
et la déposition déterminent le potentiel de transport des particules, influencent les
éventuels effets écotoxicologiques des matières rejetées. Les oxydes métalliques de taille
nanométrique, tels que le dioxyde de cérium (nCeO2), dioxyde de titane (nTiO2) et l'oxyde
de zinc (nZnO) ne font pas exception, nécessitant une meilleure compréhension de leur
comportement dans les milieux aquatiques naturels et artificiels.
L'objectif de cette recherche était d'examiner le comportement de transport de
certains oxydes métalliques de taille nanométrique (en particulier le nCeO2, nTiO2 et
nZnO) dans les milieux poreux granulaires saturés. Ceci a été réalisé dans le laboratoire
en utilisant des expériences contrôlées en colonne. L'influence de la chimie de l'eau (pH,
force ionique (FI) et le type de cations (Na+, Ca2+ ou Mg2+)), et le revêtement des NMM
(non revêtus ou revêtus de poly(acide acrylique), PAA) sur la déposition des particules a

été examiné dans des colonnes remplis de sable de quartz ou de sable loameux. Des
études examinent le transport des particules suspendus dans les eaux souterraines
naturelles ont également été menées. Finalement, le transport des oxydes de métal a été
comparée à celle d'une capsule nanométrique (nCAP) analogue composer de PAA.
Toutes les suspensions de NMM préparées dans le laboratoire ont été caractérisées
en utilisant la diffusion dynamique de la lumière (DLS) et l’analyse de suivi de
nanoparticules (« nanoparticle tracking analysis », NTA) pour établir la taille des agrégats
et la vélocimétrie laser Doppler pour déterminer la mobilité électrophorétique des
particules. Pour examiner la morphologie des agrégats, des images de microscopie
électronique en transmission (MET) et de microscopie électronique à balayage (MEB) ont
été obtenues pour quelques-unes des conditions expérimentales.
Dans l'ensemble, les oxydes métalliques non revêtus démontrent une rétention
élevé dans les colonnes remplies de sable de quartz et saturées avec des solutions de
NaNO3. Avec ces particules, une forte rétention est observée à des FI aussi faibles que 0.1
mM pour le nTiO2 et 0.01 mM pour le nZnO. En outre, le nTiO2 démontre une agrégation
extensive, peu importe le pH et la FI. À des concentrations de NaNO3 inférieures,
l'efficacité de filtration (α) des agrégats de nTiO2 dans le sable de quartz augmente en
augmentant la FI. À des plus hautes FI, α (pH 7) > α (pH 3) > α (pH 9). Ceci est
probablement due à une augmentation d'agrégation à pH 7, causant les particules de
devenir prises entres les grains de sable de la colonne. Finalement, le nTiO2 et nZnO non
revêtus démontrent des comportements de déposition dynamiques (dépendant du temps)
dans certaines conditions analysées.
En revanche, le nTiO2 et nZnO revêtus de PAA étaient moins enclins à l'agrégation
et démontrent un potentiel de transport important à des FI assez élevées (100 mM NaNO3

ou 3 mM CaCl2). De même, les particules de nCeO2 revêtus de PAA suspendus dans des
solutions de NaNO3 étaient très mobiles dans le sable de quartz, peu importe la FI.
Néanmoins, le nCeO2 et les particules nCAP démontrent une déposition rehaussée, parfois
dynamique avec l'augmentation des concentrations de sels divalents et dans les eaux
souterraines naturelles. Une déposition rehaussée est également rencontrée dans le sable
loameux comparativement au sable de quartz. Enfin, les particules nCAP se sont avérées
être un bon substitut expérimental pour les particules de nCeO2 revêtus de PAA.
Ces résultats illustrent l'importance de considérer l'étendue et le type de revêtement
des NMM en examinant le potentiel de contamination des oxydes métalliques dans les
milieux granulaires et poreux saturés. En outre, les résultats obtenus soulignent la
nécessité de tenir compte de la nature du milieu granulaire, ainsi que la chimie de l'eau,
lors de l'évaluation des risques de contamination des NMM.

ACKNOWLEDGEMENTS
Firstly I’d like to thank my supervisor Professor Tufenkji for the opportunity to join her research group and for all her support and guidance throughout my studies. Also, I’d like to thank the committee members for taking the time to read my thesis and for attending my defense. Furthermore, I’d like to acknowledge Environment Canada, McGill University (McGill Engineering Doctoral Award), the Natural Sciences and Engineering Research Council of Canada (NSERC) and the Ministère du Développement Économique, de l’Innovation et de l’Exportation (MDEIE, Québec) for their generous funding. Thank you also to: The excellent lecturers I’ve had in Chemical Engineering: Professor Berk, Professor Coulombe and Professor Servio. Hallvard Bruussgaard, Jocelyn Veilleux, Deniz Nasuhoglu, Dominic Sauvageau and Joseph Macri for all their help. I would never have gotten this far without you. Professor Richard Leask for access to cell culture facilities and all his advice. Lisa Danielczak for cell culture training. Professor Kevin Wilkinson for access to state of the art characterization equipment (NTA) and his advice. Francis Duquette-Murphy for assistance on the NTA. The Chemical Engineering staff; the best there is. My fantastic summer students: Spencer Brennan, Carolin Öhl and Faraz Rajput for their hard work and dedication. I truly enjoyed our time together. Vive Crop Protection® for particles that work. My office mates: Rami Issa, Tim “Schatzi” Schinner and Che O’May for conversations I will never forget. The entire Biocolloids group. Alexander “The Relic” Emmott, Ines, Nijaz and Ljubica, Sabine, James, Katie, Marie-Jo, Leron Vandsburger, Mehdi Dargahi and the wine producers of Bordeaux and Burgundy!

To mom, dad, Fabio, Antonio, Anita and all my grandparents for their endless support. And to Ada, for her endless patience and love. This thesis is dedicated to our youth. I fear we’ve left it behind. And to Lazy Hiking and days that should never end.

I
TABLE OF CONTENTS
LIST OF FIGURES 1
LIST OF TABLES 3
CHAPTER 1: PREFACE 4
1.1 MOTIVATION 5
1.2 OBJECTIVES AND SCOPE OF THE DISSERTATION 7
1.3 THESIS ORGANIZATION 8
1.4 CONTRIBUTIONS 10
1.5 REFERENCES 15
CHAPTER 2: AGGREGATION AND DEPOSITION OF ENGINEERED NANOMATERIALS IN AQUATIC ENVIRONMENTS: ROLE OF PHYSICOCHEMICAL INTERACTIONS 19
2.1 ABSTRACT 20
2.2 INTRODUCTION 21
2.3 ENGINEERED NANOMATERIALS IN AQUATIC SYSTEMS: FROM “A”LUMINUM TO “ZIRCONIUM” 24
2.4 COLLOIDAL FORCES GOVERNING NANOPARTICLE DEPOSITION AND AGGREGATION 26 2.4.1 TRADITIONAL COLLOIDAL INTERACTIONS 26 2.4.2 NON-DLVO INTERACTIONS 30 2.4.3 UNIQUE FEATURES OF NANOSCALE PARTICLE INTERACTIONS 31
2.5 QUANTITATIVE APPROACHES TO EVALUATE NANOPARTICLE AGGREGATION 34 2.5.1 UNFAVOURABLE (SLOW) AGGREGATION 35 2.5.2 FAVORABLE (FAST) AGGREGATION 43
2.6 QUANTITATIVE APPROACHES TO EVALUATE NANOPARTICLE DEPOSITION 44 2.6.1 UNFAVORABLE (SLOW) DEPOSITION 45 2.6.2 FAVORABLE (FAST) DEPOSITION 49
2.7 CURRENT STATE OF KNOWLEDGE ON NANOPARTICLE AGGREGATION AND DEPOSITION 52 2.7.1 LABORATORY STUDIES EXAMINING THE AGGREGATION OF ENGINEERED NANOMATERIALS 53 2.7.2 LABORATORY STUDIES EXAMINING THE DEPOSITION OF ENGINEERED NANOMATERIALS 58
II
2.8 CHALLENGES IN QUANTIFYING NANOPARTICLE DEPOSITION AND AGGREGATION IN THE ENVIRONMENT 68
2.9 ACKNOWLEDGEMENTS 72
2.10 NOMENCLATURE 73
2.11 REFERENCES 77
2.12 SUPPLEMENTARY MATERIAL FOR CHAPTER 2 90
CHAPTER 3: DEPOSITION OF TITANIUM DIOXIDE NANOPARTICLE AGGREGATES IN GRANULAR POROUS MEDIA: EFFECT OF pH AND IONIC STRENGTH 98
3.1 PREFACE 99
3.2 ABSTRACT 100
3.3 INTRODUCTION 101
3.4 MATERIALS AND METHODS 101
3.5 RESULTS AND DISCUSSION 103
3.6 CONCLUSIONS 107
3.7 ACKNOWLEDGEMENTS 108
3.8 REFERENCES 109
CHAPTER 4: TRANSPORT OF TWO METAL OXIDE NANOPARTICLES IN SATURATED GRANULAR POROUS MEDIA: ROLE OF WATER CHEMISTRY AND PARTICLE COATING 111
4.1 PREFACE 112
4.2 ABSTRACT 113
4.3 INTRODUCTION 114
4.4 MATERIALS AND METHODS 117 4.4.1 NANOPARTICLE SUSPENSION PREPARATION 117 4.4.2 NANOPARTICLE IMAGING 119 4.4.3 NANOPARTICLE SIZE AND ELECTROKINETIC CHARACTERIZATION 119 4.4.4 NANOPARTICLE TRANSPORT AND DEPOSITION STUDIES 120 4.4.5 nZnO DISSOLUTION 121
4.5 RESULTS AND DISCUSSION 122 4.5.1 NANOPARTICLE PROPERTIES 122
4.5.1.1 Size of suspended nTiO2 and nZnO particles 122 4.5.1.2 Electrokinetic characterization of suspended nTiO2 and nZnO particles 128

III
4.5.2 DEPOSITION STUDIES 131 4.5.2.1 Transport of bare and polymer-coated nTiO2 particles in sand-packed columns 131 4.5.2.2 Transport of bare and polymer-coated nZnO particles in sand-packed columns 138 4.5.2.3 Environmental Implications 141
4.6 CONCLUSIONS 142
4.7 ACKNOWLEDGEMENTS 143
4.8 REFERENCES 144
4.9 SUPPLEMENTARY MATERIAL FOR CHAPTER 4 151
CHAPTER 5: MOBILITY OF NANOSIZED CERIUM DIOXIDE AND POLYMERIC CAPSULES IN QUARTZ AND LOAMY SANDS SATURATED WITH MODEL AND NATURAL GROUNDWATERS 154
5.1 PREFACE 155
5.2 ABSTRACT 156
5.3 INTRODUCTION 157
5.4 MATERIALS AND METHODS 160 5.4.1 NATURAL GROUNDWATER CHARACTERIZATION 160 5.4.2 GRANULAR COLLECTOR SURFACE CHARACTERIZATION 161 5.4.3 NANOPARTICLE SUSPENSION PREPARATION 161 5.4.4 NANOPARTICLE CHARACTERIZATION 162 5.4.5 NANOPARTICLE TRANSPORT AND DEPOSITION STUDIES 162 5.4.6 INTERPRETATION OF ENP TRANSPORT BEHAVIOR 164
5.5 RESULTS AND DISCUSSION 165 5.5.1 PARTICLE AND QUARTZ SAND SURFACE POTENTIAL 165 5.5.2 PARTICLE SIZE 167 5.5.3 TRANSPORT AND DEPOSITION OF nCeO2 AND nCAP 171
5.5.3.1 Transport and deposition in the presence of monovalent salts 172 5.5.3.2 Transport and deposition in the presence of divalent salts 176 5.5.3.3 Transport and deposition of ENPs suspended in a natural groundwater 181 5.5.3.4 Summary of the transport behavior of PAA-coated ENPs 183
5.6 CONCLUSIONS 185
5.7 ACKNOWLEDGEMENTS 186
5.8 REFERENCES 188
5.9 SUPPLEMENTARY MATERIAL FOR CHAPTER 5 192
CHAPTER 6: SUMMARY AND CONCLUSIONS 202
APPENDIX 1: MOBILITY OF NANOSIZED POLYMERIC CAPSULES IN LOAMY SAND SATURATED WITH MODEL GROUNDWATERS 207
IV
A1.1 ABSTRACT 208
A1.2 INTRODUCTION 209
A1.3 MATERIALS AND METHODS 210 A1.3.1 SYNTHETIC GROUNDWATER PROPERTIES 210 A1.3.2 GRANULAR COLLECTOR CHARACTERIZATION 210 A1.3.3 NANOPARTICLE SUSPENSION PREPARATION 210 A1.3.4 NANOPARTICLE CHARACTERIZATION 211 A1.3.5 NANOPARTICLE TRANSPORT AND DEPOSITION STUDIES 212
A1.4 RESULTS AND DISCUSSION 212 A1.4.1 PARTICLE SURFACE POTENTIAL 212 A1.4.2 PARTICLE SIZE 214 A1.4.3 POLYMERIC CAPSULE TRANSPORT AND DEPOSITION 215
A1.4.3.1 Summary of nCAP transport behavior 215 A1.4.3.2 Summary of nCAP2 transport behavior 218 A1.4.3.3 Summary of nCAP3, nCAP4 and nCAP5 transport behavior 219
A1.5 CONCLUSIONS 222
A1.6 ACKNOWLEDGEMENTS 223
A1.7 REFERENCES 224
PERMISSION DOCUMENTS FOR ARTICLES INCLUDED 225

1
LIST OF FIGURES Figure 2.1 Representative aggregation stability curves for selected engineered
nanomaterials. 57 Figure 2.2 Representative deposition stability curves for selected engineered nanomaterials. 67 Figure 3.1 SEM image of nTiO2 (pH 3, 10 mM NaNO3). 103 Figure 3.2 nTiO2 breakthrough curves and attachment efficiencies as a
function of NaNO3 IS at pH 3, 7, and 9. 107 Figure 4.1 SEM image of bare nZnO (pH 8, 0.1 mM NaNO3). 123 Figure 4.2 TEM images of bare nTiO2 and bare nZnO powders. 124 Figure 4.3 Measured breakthrough curves for bare and polymer-coated
nTiO2 particles suspended in NaNO3 at pH 7. 132 Figure 4.4 Calculated attachment efficiencies for bare and polymer-coated
nTiO2 and nZnO particles. 133 Figure 4.5 Polymer-coated nTiO2 and nZnO breakthrough curves in CaCl2. 136 Figure 4.6 Breakthrough curves for bare and polymer-coated nZnO
particles suspended in NaNO3 at pH 8. 139 Figure S4.1 Tracking bare nTiO2 breakthrough curves utilizing UV-visible
spectrophotometry and ICP-AES as complimentary techniques. 152 Figure S4.2 nZnO dissolution behavior evaluated as a function of time
at pH 8. 152 Figure S4.3 Bare nTiO2 and nZnO EPMs measured over a range of pHs. 153 Figure 5.1 nCeO2 breakthrough curves in NaNO3. 173 Figure 5.2 nCeO2 breakthrough curves in CaCl2. 177 Figure 5.3 nCeO2 breakthrough curves in MgCl2. 178
Figure 5.4 Breakthrough curves for nCAP particles in CaCl2. 181

2
Figure 5.5 Breakthrough curves for nCAP and nCeO2 particles in natural
groundwater. 182 Figure 5.6 Attachment efficiency (α) observed for nCAP, nCeO2, QD,
nTiO2 and nZnO particles as a function of CaCl2 IS. 184 Figure S5.1 Groundwater chemical oxygen demand (COD). 193 Figure S5.2 nCeO2 and nCAP EPM as a function of suspension pH. 197 Figure A1.1 A summary of polymeric capsule EPM as a function of pH. 213 Figure A1.2 nCAP deposition behavior in loamy sand-packed columns. 217 Figure A1.3 nCAP2 deposition behavior in loamy sand-packed columns. 219 Figure A1.4 nCAP3 deposition behavior in loamy sand-packed columns. 220 Figure A1.5 nCAP4 deposition behavior in loamy sand-packed columns. 221 Figure A1.6 Absorbance spectra for nCAP2 and nCAP5. 222

3
LIST OF TABLES Table 2.1 Key Equations to Evaluate Particle-Particle and Particle-Surface
Interactions 29 Table 2.2 Summary of Laboratory Studies on Nanoparticle Aggregation 39 Table 2.3 Summary of Laboratory Studies on Nanoparticle Deposition 60 Table S2.1 Summary of Major Nanomaterials of Interest and Their Key
Properties 91 Table S2.2 Hamaker Constants (A123) for Unretarded Interactions between a
Nanoparticle and Silica Collector in Water 92 Table S2.3 Hamaker Constants (A121) for Unretarded Interactions between
Nanoparticles in Water 93 Table 3.1 nTiO2 EPM and hydrodynamic diameter determined by DLS
(dDLS) and NTA (dNTA). PDI is the reported polydispersity index. 104 Table 4.1 Measured hydrodynamic diameter, electrophoretic mobility (EPM)
and calculated attachment efficiencies for nTiO2 and nZnO. 126 Table 5.1 Measured hydrodynamic diameter and electrophoretic mobility
(EPM) for nCeO2 and nCAP particles 166 Table S5.1 Summary of natural groundwater characterization data. 193 Table S5.2 Quartz sand surface potential. 194 Table S5.3 Summary of nCeO2 and nCAP attachment efficiencies (α) in
quartz sand. 199 Table S5.4 Summary of nCeO2 and nCAP attachment efficiencies (α) in
loamy sand. 200 Table A1.1 A summary of polymeric capsule size and EPM under all
experimental conditions. 214

4
CHAPTER 1: PREFACE

5
This thesis is presented in the manuscript-based format outlined in the McGill University
“Guidelines for Thesis Preparation”.
1.1 MOTIVATION
Engineered nanomaterials (ENMs) are being employed in a vast and growing
number of applications. ENMs are currently found in food packaging and toothpaste,
sunscreens and cosmetics, automotive products, sporting goods, paints and building
materials, electronics and stain-resistant clothing (Aitken et al. 2006, Fröhlich and
Roblegg 2012, Klaine et al. 2008, Masciangioli and Zhang 2003, Nel et al. 2006). Given
the multitude of existing and potential ENM uses, the number of products containing
ENMs will continue to rise, with nanosized components gradually superseding currently
available materials (Englert 2007).
Due to their ability to absorb ultraviolet radiation, nanosized cerium dioxide
(nCeO2), titanium dioxide (nTiO2) and zinc oxide (nZnO) are included in dermatological
products, cosmetics, sunscreens and UV blocking agents (Cassee et al. 2011, Dufour et al.
2006, Englert 2007, Mueller and Nowack 2008, Sayes et al. 2006). Furthermore, nCeO2
can serve as a polishing agent in the manufacturing of glass (Johnson and Park 2012), act
as an antioxidant in treating retinal disorders (García et al. 2011), and perform as an
exhaust gas catalyst (Cassee et al. 2011, Van Hoecke et al. 2011). Beyond personal care
products, nTiO2 is included in paints, coatings and building materials (Aitken et al. 2006).
The versatile nZnO is also utilized in pigment applications (coatings and paints), and is
encountered in electronics, optics and photonics applications (Adams et al. 2006, Lin and
Xing 2008, Wang 2004).

6
The ever-increasing production and use of ENMs, including metal oxides such as
nCeO2, nTiO2 and nZnO, will lead to heightened anthropogenic nanoparticle levels in the
environment (Robichaud et al. 2005). ENM release can occur at the manufacturing,
consumption and disposal stages of particle life (Mueller and Nowack 2008, Wiesner and
Bottero 2007), potentially resulting in unforeseen impacts on human and environmental
health. Toxicological studies are gradually revealing the potential health impacts posed by
ENM exposure, with findings from in vitro and in vivo nanotoxicity studies indicating that
nanosized metal oxides are potentially harmful to humans and various other organisms
(Bai et al. 2010, Duan et al. 2010, Fang et al. 2010, Federici et al. 2007, García et al. 2011,
Ge et al. 2011, Hu et al. 2010, Huang et al. 2010, Hussain et al. 2012, Roh et al. 2010,
Schanen et al. 2009, Sharma et al. 2009).
Given the increased commercial significance and potential toxicity of nanosized
metal oxides such as nCeO2, nTiO2 and nZnO, insight into their environmental fate is of
growing importance. Once released into aquatic environments, ENM-associated
ecotoxicological and public health risks will be dependent on particle aggregation,
transport and deposition. To fully understand the risks posed by ENMs, the likelihood of
exposure to the material and the material’s toxicity upon exposure must be considered
(Lecoanet et al. 2004). The likelihood of exposure in soil environments (i.e., the particle
transport potential) can in part be assessed by performing transport studies using
laboratory scale column experiments. On the other hand, material toxicity can be
investigated by performing in vivo studies in model organisms and in vitro cytotoxicity
studies with model cell lines.
Several researchers have assessed ENM transport and deposition behavior in
saturated porous media to better understand particle contamination potential in natural
7
subsurface environments or engineered (deep-bed) water filtration systems (Petosa et al.
2010). Nonetheless, at the time when the work presented in this thesis was undertaken, a
limited number of studies had examined nTiO2 aggregation and deposition in granular
porous media, with conflicting findings (Petosa et al. 2010). Likewise, information
regarding nZnO deposition in aquatic systems was scarce, with no studies in water-
saturated sand available (Petosa et al. 2012). Finally, little was known regarding the
aggregation and deposition behavior of nCeO2 in saturated granular environments.
Available studies had focused on the transport of bare nCeO2 particles suspended in
monovalent salt solutions (Li et al. 2011, Liu et al. 2012) and no analyses had been
conducted in granular matrices other than quartz sand.
1.2 OBJECTIVES AND SCOPE OF THE DISSERTATION
The overall purpose of the research conducted in this thesis was to thoroughly
examine the transport behavior of emerging nanosized metal oxides in model subsurface
environments. The data obtained will enable researchers, corporations and regulators to
better predict and quantify ENM environmental mobility and the corresponding public
health risks.
The specific objectives of this research were:
1. To determine the influence of water chemistry (i.e., pH, ionic strength (IS), cation
species and cation valence) on the physicochemical properties (particle size and
surface potential) and mobility of selected metal oxide nanoparticles (nCeO2,
nTiO2 and nZnO).

8
2. To compare the migration behavior of bare metal oxide particles to that of
polymer-coated particles.
3. To investigate the transport of metal oxide nanoparticles in multiple soil types (i.e.,
quartz sand and an agricultural soil) and in synthetic and natural groundwater
matrices.
4. To compare the transport behavior of polymer-coated metal oxide nanoparticles to
that of an analogous polymeric capsule.
1.3 THESIS ORGANIZATION
The work presented herein furthers our understanding of ENM transport and
deposition behavior in saturated granular environments, such as those representative of
groundwaters. ENM transport potential in such environments is dependent on (i) the
likelihood that the released particles will aggregate (either with one another or with other
natural colloids) and (ii) the likelihood that the particles will deposit onto the surrounding
collector surfaces. Thus, a comprehensive literature review on the physicochemical
interactions governing ENM aggregation and deposition in aquatic environments is
presented in Chapter 2. Topics outlined in Chapter 2 include a description of the colloidal
forces governing ENM aggregation and deposition, the essential equations used in
evaluating particle-particle and particle-surface interactions (including aspects specific to
ENM interactions), the theoretical and experimental approaches employed in evaluating
ENM aggregation and deposition, a summary of the key findings from published studies
examining these processes experimentally and a description of the complications
encountered when quantifying ENM transport in aquatic environments. The critical
9
literature review (Chapter 2) is followed by experimental findings in Chapters 3 to 5 and
Appendix 1.
In Chapter 3, bare nTiO2 particle transport in laboratory-scale, quartz sand-packed
columns was examined. The experiments presented were conducted in monovalent
NaNO3 solutions and the influence of water chemistry (pH and IS) on ENM transport was
investigated. To assist in understanding the underlying deposition mechanisms
encountered in the columns, the nTiO2 particles were characterized under all experimental
conditions using dynamic light scattering (DLS) and laser Doppler velocimetry to
establish aggregate size and surface potential, respectively. Furthermore, scanning
electron microscopy (SEM) was employed to analyze aggregate morphology for select
conditions.
In Chapter 4, the impact of a polymer coating on metal oxide particle transport was
investigated. Bare and poly(acrylic acid) (PAA)-coated nTiO2 and nZnO transport
experiments conducted in laboratory-scale quartz sand-packed columns are presented.
Particles were suspended in monovalent (NaNO3) and divalent (CaCl2) salt solutions to
investigate the impact of IS, cation species and cation valence (Na+, Ca2+) on particle
transport. Once more, the ENMs were thoroughly characterized. The characterization
methods employed include DLS and nanoparticle tracking analysis (NTA) to determine
particle size, transmission electron microscopy (TEM) and scanning electron microscopy
(SEM) to determine particle aggregate morphology and laser Doppler velocimetry to
determine particle surface potential.
In Chapter 5, the mobility of PAA-coated nCeO2 and an analogous nanosized
polymeric capsule (nCAP) in water-saturated quartz sand and loamy sand was
investigated. The influence of solution IS, cation valence and cation type (Na+, Ca2+, or

10
Mg2+) on ENM transport potential was examined in both granular matrices. Furthermore,
the results obtained in artificial water matrices were compared to measurements obtained
for particles suspended in thoroughly characterized natural groundwater. Once more, DLS
and NTA were employed to determine aggregate size, and laser Doppler velocimetry was
used to establish ENM electrophoretic mobility (EPM). Finally, an overall summary of
the entire thesis is provided in Chapter 6.
Beyond the main thesis chapters, one appendix is also included. In Appendix 1,
the transport behavior of various polymeric capsules in loamy sand was investigated.
Vive Crop ProtectionTM, a Toronto based nanotechnology firm, is currently engineering a
range of nanosized water dispersible polymeric capsules for agricultural use. Prior to pilot
field studies and large-scale application, their behavior in model subsurface environments
is to be determined. To achieve this, the stability and deposition behavior of five different
capsules in loamy sand saturated with a synthetic groundwater solution was investigated.
All polymeric capsules employed were characterized, with the particle size and surface
potential in the synthetic groundwater determined.
1.4 CONTRIBUTIONS
The work presented herein contributes to the overall understanding of emerging
ENM transport behavior in soil environments. The data will be of use in assessing the
potential public health and environmental risks posed by ENMs that are inadvertently
released into the environment. Likewise, the findings are also relevant for predicting the
transport potential of ENMs released intentionally for remediation or agricultural
purposes.

11
The specific contributions provided by this thesis include:
1. Conducted the first studies considering (i) nZnO particle transport in water
saturated sand media and (ii) nCeO2 particle transport in complex granular
materials (i.e., agricultural loamy sand) and water chemistries (i.e., divalent
salts, natural groundwater). ENM transport studies using different granular
matrices can be valuable for drawing links between collector (grain) properties and
particle mobility in water saturated granular environments. Furthermore, working
with more complex water chemistries (e.g., divalent salts, groundwater) provides
insight into particle stability and deposition in natural environments. Herein,
environmental conditions such as the presence of sandy soils and lower salt
concentrations were found to result in heightened ENM mobility.
2. Identified environmental conditions resulting in heightened particle retention
and dynamic transport behavior under unfavorable deposition conditions.
(a) ENM exposed to higher IS and/or divalent cations (Ca2+, Mg2+)
experienced heightened retention and/or dynamic (time-dependent)
transport phenomena under unfavorable deposition conditions. This
was likely due to increased particle aggregation, resulting in physical
straining within the granular matrix.
(b) While dynamic ENM deposition behavior was encountered in quartz
sand and loamy sand, heightened nCeO2 retention was observed in
loamy sand at all IS examined. Furthermore, attachment efficiencies for

12
nCeO2 and nCAP particles suspended in natural groundwater were an
order of magnitude higher in loamy sand than in quartz sand. Based on
particle and collector characterisation data, the enhanced retention
observed in loamy sand may be due to the presence of favourable
deposition sites resulting from surface roughness, surface charge
heterogeneities and/or the occurrence of clays such as allophane. Thus,
complex soil matrices found in natural environments may bring about
heightened particle retention.
3. Demonstrated that it is essential to consider particle surface coating in
predicting ENM transport potential. Whereas bare metal oxides exhibited high
retention at low monovalent salt IS (largely due to significant particle
aggregation), PAA-coated ENMs were less likely to aggregate due to electrosteric
stabilization. Consequently, the PAA-coated metal oxides and nCAPs exhibited
significant transport potential at high monovalent salt concentrations and at lower
divalent salt concentrations.
A majority of the work presented herein has either been published or submitted for
publication. The work described in Appendix 1 is unpublished, but the findings presented
therein have been submitted to Vive Crop ProtectionTM, an industrial partner for that
particular project. A list of the publications that have resulted from all the research
presented is included below. Note that following Chapters 2, 4 and 5, a Supplementary
Material section is also provided. This is consistent with the published or submitted
manuscripts corresponding to each of these chapters.

13
The information included in Chapter 2 was previously published as a
comprehensive review article in Environmental Science and Technology:
Petosa AR, Jaisi DP, Quevedo IR, Elimelech M and Tufenkji N. Aggregation and deposition of engineered nanomaterials in aquatic environments: role of physicochemical interactions. Environ Sci Technol 2010; 44 (17): 6532-6549.
Permission has been granted by ACS Publications and by all coauthors to include
this manuscript. Permission documents for all publications included herein are
provided at the end of the thesis. A.R. Petosa’s role in writing the aforementioned
review article included conducting a thorough literature review regarding ENM transport
and deposition and the composition of related sections. Furthermore, A.R. Petosa
composed the Introduction, the Engineered Nanomaterials in Aquatic Systems: From
“A”luminum to “Z”irconium, and the Challenges in Quantifying Nanoparticle Deposition
and Aggregation in the Environment sections, along with reviewing the entire manuscript
prior to submission. A significant portion of the literary research and writing of sections
pertaining to ENM aggregation was performed by D.P. Jaisi and I.R. Quevedo. I.R.
Quevedo also directed all Hamaker constant related work. Finally, all work was guided
by and revised by Professors M. Elimelech (Yale University) and N. Tufenkji (McGill
University).
The co-authors appearing on all other manuscripts (Chapters 3 to 5) in this
dissertation include Professor N. Tufenkji (Ph.D. supervisor), along with McGill Summer
Undergraduate Research in Engineering (SURE) students (S.J. Brennan and F. Rajput)
and/or visiting undergraduate students (C. Öhl) supervised by A.R. Petosa during his
Ph.D. studies. All of these undergraduate students assisted A.R. Petosa in carrying out the
laboratory experiments described herein.
14
The information presented in Chapter 3 was previously published as a short
research article in the Proceedings of the 3rd International Conference on Nanotechnology:
Fundamentals and Applications:
Petosa AR, Rajput F, Ӧhl C, Brennan SJ and Tufenkji N. Deposition of Titanium Dioxide Nanoparticle Aggregates in Granular Porous Media: Effect of pH and Ionic Strength. Proceedings of the 3rd International Conference on Nanotechnology: Fundamentals and Applications 2012 (ISBN: 978-0-9867183-3-5). Permission has been granted by International ASET Inc. (http://International-ASET.com)
and by all coauthors to include this manuscript herein.
The work described in Chapter 4 was previously published as a research article in
Water Research:
Petosa AR, Brennan SJ, Rajput F and Tufenkji N. Transport of Two Metal Oxide Nanoparticles in Saturated Granular Porous Media: Role of Water Chemistry and Particle Coating. Water Res 2012; 46 (4): 1273-1285. Permission has been granted by Elsevier Limited and by all coauthors to include this
manuscript herein.
The findings presented in Chapter 5 have been published in Water Research:
Petosa AR, Ӧhl C, Rajput F and Tufenkji N. Mobility of Nanosized Cerium Dioxide and Polymeric Capsules in Quartz and Loamy Sands Saturated with Model and Natural Groundwaters. Water Res 2013; in press. Permission has been granted by all coauthors to include this manuscript herein.

15
1.5 REFERENCES
Adams, L.K., Lyon, D.Y., McIntosh, A. and Alvarez, P.J.J. (2006) Comparative toxicity of nano-scale TiO2, SiO2 and ZnO water suspensions. Water Science and Technology 54, 327-334. Aitken, R.J., Chaudhry, M.Q., Boxall, A.B.A. and Hull, M. (2006) Manufacture and use of nanomaterials: Current status in the UK and global trends. Occupational Medicine 56(5), 300-306. Bai, W., Zhang, Z., Tian, W., He, X., Ma, Y., Zhao, Y. and Chai, Z. (2010) Toxicity of zinc oxide nanoparticles to zebrafish embryo: A physicochemical study of toxicity mechanism. Journal of Nanoparticle Research 12(5), 1645-1654. Cassee, F.R., Van Balen, E.C., Singh, C., Green, D., Muijser, H., Weinstein, J. and Dreher, K. (2011) Exposure, health and ecological effects review of engineered nanoscale cerium and cerium oxide associated with its use as a fuel additive. Critical Reviews in Toxicology 41(3), 213-229. Duan, Y., Liu, J., Ma, L., Li, N., Liu, H., Wang, J., Zheng, L., Liu, C., Wang, X., Zhao, X., Yan, J., Wang, S., Wang, H., Zhang, X. and Hong, F. (2010) Toxicological characteristics of nanoparticulate anatase titanium dioxide in mice. Biomaterials 31(5), 894-899. Dufour, E.K., Kumaravel, T., Nohynek, G.J., Kirkland, D. and Toutain, H. (2006) Clastogenicity, photo-clastogenicity or pseudo-photo-clastogenicity: Genotoxic effects of zinc oxide in the dark, in pre-irradiated or simultaneously irradiated Chinese hamster ovary cells. Mutation Research - Genetic Toxicology and Environmental Mutagenesis 607(2), 215-224. Englert, B.C. (2007) Nanomaterials and the environment: Uses, methods and measurement. Journal of Environmental Monitoring 9(11), 1154-1161. Fang, X., Yu, R., Li, B., Somasundaran, P. and Chandran, K. (2010) Stresses exerted by ZnO, CeO2 and anatase TiO2 nanoparticles on the Nitrosomonas Europaea. Journal of Colloid and Interface Science 348(2), 329-334. Federici, G., Shaw, B.J. and Handy, R.D. (2007) Toxicity of titanium dioxide nanoparticles to rainbow trout (Oncorhynchus mykiss): Gill injury, oxidative stress, and other physiological effects. Aquatic Toxicology 84(4), 415-430. Fröhlich, E. and Roblegg, E. (2012) Models for oral uptake of nanoparticles in consumer products. Toxicology 291(1-3), 10-17.

16
García, A., Espinosa, R., Delgado, L., Casals, E., González, E., Puntes, V., Barata, C., Font, X. and Sánchez, A. (2011) Acute toxicity of cerium oxide, titanium oxide and iron oxide nanoparticles using standardized tests. Desalination 269(1-3), 136-141. Ge, Y., Schimel, J.P. and Holden, P.A. (2011) Evidence for negative effects of TiO2 and ZnO nanoparticles on soil bacterial communities. Environmental Science and Technology 45(4), 1659-1664. Hu, R., Gong, X., Duan, Y., Li, N., Che, Y., Cui, Y., Zhou, M., Liu, C., Wang, H. and Hong, F. (2010) Neurotoxicological effects and the impairment of spatial recognition memory in mice caused by exposure to TiO2 nanoparticles. Biomaterials 31(31), 8043-8050. Huang, C.C., Aronstam, R.S., Chen, D.R. and Huang, Y.W. (2010) Oxidative stress, calcium homeostasis, and altered gene expression in human lung epithelial cells exposed to ZnO nanoparticles. Toxicology in Vitro 24(1), 45-55. Hussain, S., Al-Nsour, F., Rice, A.B., Marshburn, J., Yingling, B., Ji, Z., Zink, J.I., Walker, N.J. and Garantziotis, S. (2012) Cerium dioxide nanoparticles induce apoptosis and autophagy in human peripheral blood monocytes. ACS Nano 6(7), 5820-5829. Johnson, A.C. and Park, B. (2012) Predicting contamination by the fuel additive cerium oxide engineered nanoparticles within the United Kingdom and the associated risks. Environmental Toxicology and Chemistry 31(11): 2582-2587. Klaine, S.J., Alvarez, P.J.J., Batley, G.E., Fernandes, T.F., Handy, R.D., Lyon, D.Y., Mahendra, S., McLaughlin, M.J. and Lead, J.R. (2008) Nanomaterials in the environment: Behavior, fate, bioavailability, and effects. Environmental Toxicology and Chemistry 27(9), 1825-1851. Lecoanet, H.F., Bottero, J.Y. and Wiesner, M.R. (2004) Laboratory assessment of the mobility of nanomaterials in porous media. Environmental Science and Technology 38(19), 5164-5169. Li, Z., Sahle-Demessie, E., Hassan, A.A. and Sorial, G.A. (2011) Transport and deposition of CeO2 nanoparticles in water-saturated porous media. Water Research 45(15), 4409-4418. Lin, D. and Xing, B. (2008) Root uptake and phytotoxicity of ZnO nanoparticles. Environmental Science and Technology 42(15), 5580-5585. Liu, X., Chen, G. and Su, C. (2012) Influence of collector surface composition and water chemistry on the deposition of cerium dioxide nanoparticles: QCM-D and column experiment approaches. Environmental Science and Technology 46(12), 6681-6688.
17
Masciangioli, T. and Zhang, W.X. (2003) Environmental technologies at the nanoscale. Environmental Science and Technology 37(5), 102A-108A. Mueller, N.C. and Nowack, B. (2008) Exposure modeling of engineered nanoparticles in the environment. Environmental Science and Technology 42(12), 4447-4453. Nel, A., Xia, T., Mädler, L. and Li, N. (2006) Toxic potential of materials at the nanolevel. Science 311(5761), 622-627. Petosa, A.R., Brennan, S.J., Rajput, F. and Tufenkji, N. (2012) Transport of two metal oxide nanoparticles in saturated granular porous media: Role of water chemistry and particle coating. Water Research 46(4), 1273-1285. Petosa, A.R., Jaisi, D.P., Quevedo, I.R., Elimelech, M. and Tufenkji, N. (2010) Aggregation and deposition of engineered nanomaterials in aquatic environments: Role of physicochemical interactions. Environmental Science and Technology 44(17), 6532-6549. Robichaud, C.O., Tanzil, D., Weilenmann, U. and Weisner, M.R. (2005) Relative risk analysis of several manufactured nanomaterials: an insurance industry context. Environmental Science and Technology 39(22), 8985-8994. Roh, J.Y., Park, Y.K., Park, K. and Choi, J. (2010) Ecotoxicological investigation of CeO2 and TiO2 nanoparticles on the soil nematode Caenorhabditis elegans using gene expression, growth, fertility, and survival as endpoints. Environmental Toxicology and Pharmacology 29(2), 167-172. Sayes, C.M., Wahi, R., Kurian, P.A., Liu, Y., West, J.L., Ausman, K.D., Warheit, D.B. and Colvin, V.L. (2006) Correlating nanoscale titania structure with toxicity: A cytotoxicity and inflammatory response study with human dermal fibroblasts and human lung epithelial cells. Toxicological Sciences 92(1), 174-185. Schanen, B.C., Karakoti, A.S., Seal, S., Drake III, D.R., Warren, W.L. and Self, W.T. (2009) Exposure to titanium dioxide nanomaterials provokes inflammation of an in vitro human immune construct. ACS Nano 3(9), 2523-2532. Sharma, V., Shukla, R.K., Saxena, N., Parmar, D., Das, M. and Dhawan, A. (2009) DNA damaging potential of zinc oxide nanoparticles in human epidermal cells. Toxicology Letters 185(3), 211-218. Van Hoecke, K., De Schamphelaere, K.A.C., Van der Meeren, P., Smagghe, G. and Janssen, C.R. (2011) Aggregation and ecotoxicity of CeO2 nanoparticles in synthetic and natural waters with variable pH, organic matter concentration and ionic strength. Environmental Pollution 159(4), 970-976. Wang, Z.L. (2004) Zinc oxide nanostructures: Growth, properties and applications. Journal of Physics Condensed Matter 16(25), R829-R858.

18
Wiesner, M.R. and Bottero, J.-Y. (2007) Environmental Nanotechnology, The McGraw-Hill Companies, New York.
19
CHAPTER 2: AGGREGATION AND DEPOSITION OF ENGINEERED NANOMATERIALS IN AQUATIC
ENVIRONMENTS: ROLE OF PHYSICOCHEMICAL INTERACTIONS

20
2.1 ABSTRACT
The ever-increasing use of engineered nanomaterials will lead to heightened levels
of these materials in the environment. The present review aims to provide a
comprehensive overview of current knowledge regarding nanoparticle transport and
aggregation in aquatic environments. Nanoparticle aggregation and deposition behavior
will dictate particle transport potential and thus the environmental fate and potential
ecotoxicological impacts of these materials. In this review, colloidal forces governing
nanoparticle deposition and aggregation are outlined. Essential equations used to assess
particle-particle and particle-surface interactions, along with Hamaker constants for
specific nanoparticles and the attributes exclusive to nanoscale particle interactions are
described. Theoretical and experimental approaches for evaluating nanoparticle
aggregation and deposition are presented, and the major findings of laboratory studies
examining these processes are also summarized. Finally, we describe some of the
challenges encountered when attempting to quantify the transport of nanoparticles in
aquatic environments.
21
2.2 INTRODUCTION
Featuring unique electronic, optical, thermal and photoactive properties,
nanomaterials are ideal candidates for a multitude of current and potential industrial
applications (Klaine et al. 2008, Wiesner and Bottero 2007). With the rising demand for
such materials and an increase in their production, nanoparticle release into the
environment is inevitable and exposure more likely. Once present in the biosphere, the
novel particles may interact with humans and organisms in an unforeseen fashion
(Maynard et al. 2006). Thus, it is essential to elucidate the effects such materials can have
on both human and environmental health as a result of exposure via different routes.
Exposure can occur at the production, consumption, and disposal stages of particle
life (Mueller and Nowack 2008, Nowack and Bucheli 2007). Particles either enter the
environment directly (e.g., due to unintentional release or for remediation purposes), or
indirectly by way of waste incineration plants, sewage treatment plants, and landfills
(Mueller and Nowack 2008, Nowack and Bucheli 2007). Once released, the particles will
interact with each other and with their surrounding environments (be it in air, water or
soil) (Farré et al. 2009, Wiesner et al. 2009). While particle release occurs within all of
these environments, the present review focuses on nanoparticle deposition and aggregation
in aquatic systems.
When released into aquatic environments, nanoparticle behavior is dependent on
particle-specific properties (e.g., size, shape, chemical composition, surface charge, and
coating), particle state (free or matrix incorporated), the surrounding solution conditions
(e.g., pH, ionic strength, ionic composition, natural organic matter content), and
hydrodynamic conditions (Klaine et al. 2008, Wiesner and Bottero 2007). Such factors

22
are important in determining whether particles aggregate with other particles or deposit
onto various environmental surfaces (Wiesner and Bottero 2007). Recognizing which
interactions particles experience under different conditions is essential in predicting their
fate in the environment and thus the likelihood of exposure.
Under conditions resulting in favorable (non-repulsive) particle-surface
interactions, nanomaterials will be less likely to travel extensive distances (Elimelech et
al. 1995). The opposite holds under unfavorable (repulsive) deposition conditions
(Elimelech et al. 1995). Additionally, an understanding of particle-particle interactions is
also imperative when considering particle transport, as aggregation greatly affects particle
behavior in the natural environment (Wiesner and Bottero 2007). Changes in particle size
and shape resulting from aggregation may significantly alter transport potential, as well as
nanomaterial reactivity and toxicity (Klaine et al. 2008). Whereas nanoparticle transport
through aquatic environments is expected to be dominated by random Brownian diffusion
(Tufenkji and Elimelech 2004, Yao et al. 1971), an increased particle size imparted by
aggregation may result in particle-surface collisions due to gravitational sedimentation and
interception (Tufenkji and Elimelech 2004, Wiesner and Bottero 2007). In addition,
nanoparticles may associate and aggregate with other naturally-occurring substances, such
as organic matter, naturally occurring colloidal matter, and dissolved molecules (e.g.
phosphates and sulfates) (Klaine et al. 2008). Finally, nanoparticles may experience
chemical transformations when suspended in natural aquatic environments, including
oxidation/reduction, partial dissolution, hydrolysis, and biological degradation (Auffan et
al. 2009, Klaine et al. 2008). Whether such associations and transformations facilitate
nanoparticle transport or augment nanoparticle deposition has not been well examined and

23
will depend on the properties exhibited by the nanoparticles, other naturally-occurring
materials and the environmental conditions.
Overall, it is essential to elucidate which physicochemical interactions govern
particle-surface and particle-particle interactions under conditions representative of
aquatic environments. While a great deal of work analyzing the behavior of micrometer-
sized particles in various aquatic environments has been performed, limited data (and
quantitative analysis) is available for nanosized particles, both in terms of aggregation
(Anderson and Barron 2005, Andrievsky et al. 1999, Bouchard et al. 2009, Brant et al.
2005, Chen and Elimelech 2006, 2007, 2009, Dagtepe and Chikan 2008, Deguchi et al.
2001, Domingos et al. 2009b, Dong et al. 2007, Fang et al. 2009, French et al. 2009, He
and Zhao 2007, Hyung et al. 2007, Johnson et al. 2009, Kennedy 2008, Lin and Xing
2008, Lin et al. 2009, Liu et al. 2003, 2009, Ma and Bouchard 2009, Mchedlov-Petrossyan
1997, Moskovits and Vlckova 2005, Niyogi et al., 2007, Pavlova-Verevkina et al. 2009,
Pettibone et al. 2008, Phenrat et al. 2007, 2008, Saleh et al. 2008b, Samoilova et al. 2009,
Sano 2001a, b, Shieh et al. 2007, Smith et al. 2009a, b, Sun et al. 2007, Tiraferri et al.
2008, Tkachenko 2006, Trinh et al. 2009, Tseng and Lin 2003, Vaisman et al. 2006, Wang
et al. 2008b, Zhang et al. 2008a, b) and deposition (Brant et al. 2005, Chen and Elimelech
2006, Chen and Elimelech 2008, Chen et al. 2008, Cheng et al. 2005, Choy et al. 2008,
Doshi et al. 2008, Elimelech and O'Melia 1990a, b, Elliott and Zhang 2001, Espinasse et
al. 2007, Fang et al. 2009, Fatisson et al. 2009, Franchi and O'Melia 2003, Guzman et al.
2006, Hahn et al. 2004, He et al. 2007, Huber et al. 2000, Hydutsky et al. 2007, Jaisi and
Elimelech 2009, Jaisi et al., 2008, Jeong and Kim 2009, Kanel et al. 2008, Kanel et al.
2007, Lecoanet et al. 2004, Lecoanet and Wiesner 2004, Li et al. 2008, Limbach et al.
2008, Liu et al., 2009, Mattigod et al. 2005, Pelley and Tufenkji 2008, Phenrat et al. 2009,

24
Quevedo and Tufenkji 2009, Saleh et al. 2008a, Schrick et al. 2004, Shani et al. 2008,
Shen et al. 2008, Sung et al. 2009, Tufenkji and Elimelech 2005, Wang 2008, Wang et al.
2008a, b, Xueying et al. 2009, Zhan et al. 2008, Zhuang et al. 2005). As a result, two key
questions remain unanswered. First, how do specific particle and environmental
properties affect deposition and aggregation? Second, are the current approaches and
models used in quantifying colloidal interactions and transport applicable to
nanomaterials?
This paper provides critical review and assessment of existing research and
approaches examining the deposition and aggregation behavior of engineered
nanomaterials in aquatic systems. First, colloidal forces central to nanoparticle deposition
and aggregation, including traditional Derjaguin-Landau-Verwey-Overbeek (DLVO),
non-DLVO, and nanoparticle-specific interactions are summarized. Next, theoretical and
experimental approaches for evaluating nanoparticle aggregation and deposition under
both favorable and unfavorable conditions are discussed. Finally, the challenges
commonly faced when attempting to quantify the environmental transport of engineered
nanoparticles are outlined.
2.3 ENGINEERED NANOMATERIALS IN AQUATIC SYSTEMS: FROM “A”LUMINUM TO “Z”IRCONIUM
The presence of nanomaterials in the environment is not novel. Both fullerenes
(C60) and carbon nanotubes (CNTs) were discovered in 10,000-year-old polar ice cores
(Esquivel and Murr 2004). However, the current rise in anthropogenic nanomaterial
production will result in heightened environmental levels of such products (Mueller and
Nowack 2008). Nanoparticle release into the biosphere will originate at both point

25
sources (e.g., production sites, landfills, treatment plants) and nonpoint sources (e.g.,
release into the environment during use and consumption of nanomaterial-containing
goods) (Mueller and Nowack 2008, Wiesner and Bottero 2007). Global production
estimates for nanomaterials range from 350 and 500 tons/yr for CNTs and nano-silver
(nAg), respectively, to 5,000 tons/yr for titanium dioxide (TiO2) nanoparticles. Predicted
environmental concentrations for these particle types have also been estimated, with soil
concentration estimates ranging from 0.01 and 0.02 µg/kg for CNTs and nAg,
respectively, to 0.4 µg/kg for nTiO2 (Mueller and Nowack 2008).
The intentional injection of nanoparticles into the subsurface for remediation
purposes is an additional entry route into the environment (Mattigod et al. 2005). It has
been demonstrated that nanoscale zero-valent iron (nZVI) can treat a variety of
groundwater contaminants, including pesticides and chlorinated organic solvents (Wiesner
and Bottero 2007). While a potentially excellent candidate for large-scale site
remediation, the environmental transport, fate, and impact of such particles remains to be
determined.
Anthropogenic nanomaterials consist of intentionally manufactured products
(referred to as manufactured or engineered nanomaterials) and accidental byproducts
resulting from wear, corrosion, waste, and combustion of bulk materials (Nowack and
Bucheli 2007). A large variety of engineered organic (carbon-based) and inorganic
(includes metallic, bimetallic, metal oxide, and semi-conductor based) particles are
currently available. Table S2.1 in the Supplementary Material section presents a selection
of commonly encountered nanomaterials and their key physicochemical characteristics.
As can be noted in Table S2.1, current manufactured nanomaterials vary significantly in
isoelectric point, shape, and composition, with particles containing elements ranging from

26
Al to Zr. For a more extensive summary describing nanoparticles and their applications,
refer to (Klaine et al. 2008). Additionally (Klaine et al. 2008, Mueller and Nowack 2008),
the Woodrow Wilson International Center for Scholars has developed an extensive
inventory of consumer products incorporating nanotechnology
(http://www.nanotechproject.org/).
2.4 COLLOIDAL FORCES GOVERNING NANOPARTICLE DEPOSITION AND AGGREGATION
Particle-particle interactions and particle-surface interactions play key roles in
controlling the aggregation and deposition behavior of nanoparticles in aquatic
environments. These interactions have traditionally been described by the DLVO theory
of colloidal stability. However, non-DLVO forces such as steric, magnetic, and hydration
forces can also play an important role in the aggregation and deposition of engineered
nanomaterials.
2.4.1 TRADITIONAL COLLOIDAL INTERACTIONS
The classical DLVO theory (Derjaguin and Landau 1941, Verwey and Overbeek
1948) of colloidal stability describes the total interaction energy experienced by a
nanoparticle when approaching another particle (in the case of aggregation) or a collector
surface (in the case of deposition). According to the DLVO theory, the stability of
nanoparticles suspended in an aqueous environment can be evaluated as the sum of van
der Waals (VDW) and electrical double-layer (EDL) interactions. The resultant
27
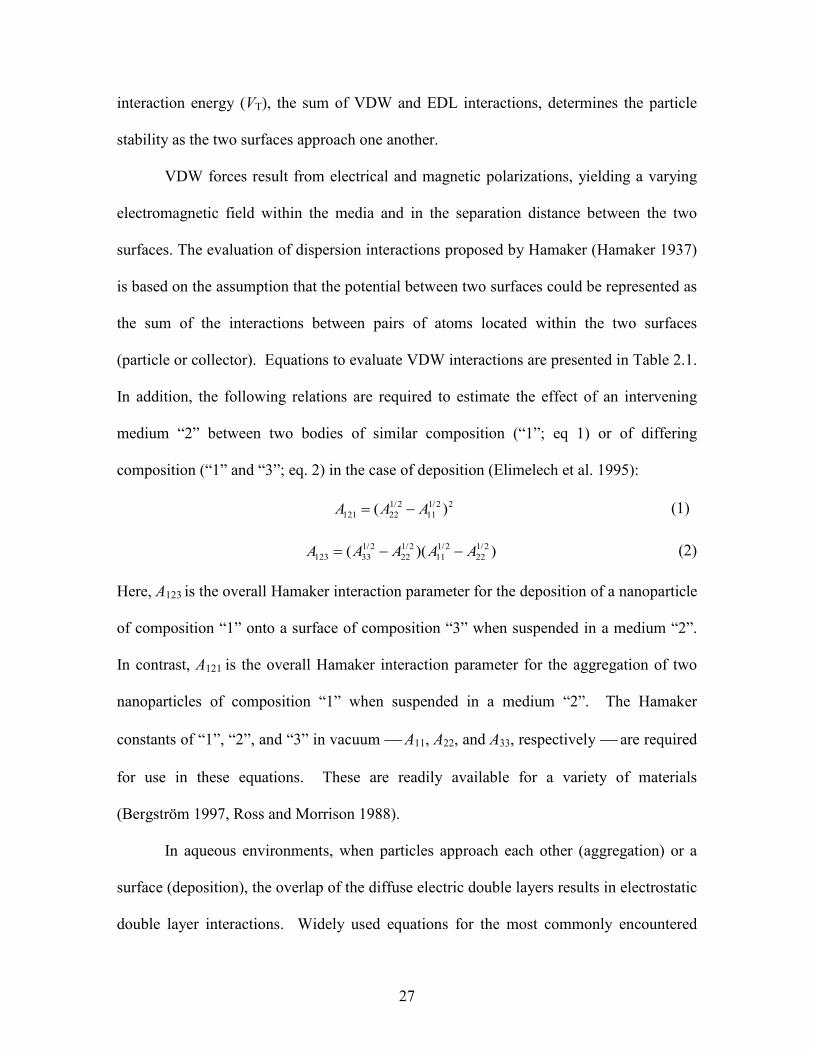
interaction energy (VT), the sum of VDW and EDL interactions, determines the particle
stability as the two surfaces approach one another.
VDW forces result from electrical and magnetic polarizations, yielding a varying
electromagnetic field within the media and in the separation distance between the two
surfaces. The evaluation of dispersion interactions proposed by Hamaker (Hamaker 1937)
is based on the assumption that the potential between two surfaces could be represented as
the sum of the interactions between pairs of atoms located within the two surfaces
(particle or collector). Equations to evaluate VDW interactions are presented in Table 2.1.
In addition, the following relations are required to estimate the effect of an intervening
medium “2” between two bodies of similar composition (“1”; eq 1) or of differing
composition (“1” and “3”; eq. 2) in the case of deposition (Elimelech et al. 1995):
1/2 1/2 2121 22 11( )A A A= − (1)
1/2 1/2 1/2 1/2123 33 22 11 22( )( )A A A A A= − − (2)
Here, A123 is the overall Hamaker interaction parameter for the deposition of a nanoparticle
of composition “1” onto a surface of composition “3” when suspended in a medium “2”.
In contrast, A121 is the overall Hamaker interaction parameter for the aggregation of two
nanoparticles of composition “1” when suspended in a medium “2”. The Hamaker
constants of “1”, “2”, and “3” in vacuum A11, A22, and A33, respectively are required
for use in these equations. These are readily available for a variety of materials
(Bergström 1997, Ross and Morrison 1988).
In aqueous environments, when particles approach each other (aggregation) or a
surface (deposition), the overlap of the diffuse electric double layers results in electrostatic
double layer interactions. Widely used equations for the most commonly encountered

28
interaction geometries (i.e., two spherical particles or a spherical particle interacting with a
planar surface) are presented in Table 2.1. These equations are based on the linear
superposition approximation (LSA) method that applies for low surface potentials and
symmetric electrolytes (Gregory 1975). The LSA is a useful compromise between the
constant-charge approximation (CCA) and the constant-potential approximation (CPA),
which are not likely to apply in practice.

29
Table 2.1 Key Equations to Evaluate Particle-Particle and Particle-Surface Interactions
aAll variables are defined in the Nomenclature section. bThis expression is for cases where the particle and the surface are both polymer-coated. When only a single surface is polymer-coated, a factor of 2 is removed
preceding each l term in eq. 5a.
Interaction Geometry
Type of Interaction Expressiona References
○ – | EDL ( ) ( )hΓΓzeTkaV BprEDL κεπε −= exp/64 212
0 (3) (Gregory 1975)
○ – | VDW ( )λ/1416
123
hhaA
V pVDW +
= (4) (Gregory 1981)
○ – | STERICb
( )
−
+
−
= 127
812582
4/74/5
3 lhl
hll
sTk
ahF BpST π (5a)
∫∞
−=h
STST dhhFhV )()( (5b)
(Byrd and Walz 2005, De Gennes 1987)
○ – ○ EDL ( )hΓΓzeTk
aaaaV B
EDL κπ −
+= exp64 21
2
21
21 (6) (Gregory 1975)
○ – ○ VDW ( )( )λ/1416 21
21121
haahaaAVVDW ++
−= (7) (Gregory 1981)
○ – ○ STERIC
−
+
−
+
= 127
812582)(
4/74/5
321
21
lhl
hll
sTk
aaaa
hF BST π (8a)
∫∞
−=h
STST dhhFhV )()( (8b)
(Byrd and Walz 2005, De Gennes 1987)

30
Tables S2.2 and S2.3 provide a list of Hamaker constants corresponding to several
common nanomaterials. When used with eq 4, the Hamaker constants presented in Table
S2.2 serve in determining the VDW interactions between a particle and a collector surface
(i.e., for deposition). The constants listed in Table S2.3 can be used with eq 7 to evaluate
the VDW interaction between two particles (i.e., aggregation of particles). For the case
where the Hamaker constant of a specific nanomaterial is not known, it may be evaluated
using eqs 1 and 2.
2.4.2 NON-DLVO INTERACTIONS
Beyond the traditional colloidal interactions considered in the DLVO theory, a
number of non-DLVO forces can also influence the stability of a nanoparticle suspension
in aqueous environments. The most significant forces encountered by engineered
nanomaterials in aqueous media include steric interactions, magnetic forces (for iron-
based nanomaterials), and hydration forces.
Generalized expressions describing the extent of steric forces have been derived
for particles with adsorbed layers of polymers or surfactants that might lead to steric
repulsion. These expressions, also included in Table 2.1, are based on the Alexander-de
Gennes theory (Alexander 1977, De Gennes 1985) that is used to evaluate the repulsive
steric force and the Derjaguin approximation. Steric interactions can be particularly
important for nanoparticles in natural and engineered aquatic environments, as most
particles adsorb natural organic matter that is known to stabilize colloids (Franchi and
O'Melia 2003, Pelley and Tufenkji 2008).

31
Certain nanomaterials, such as nano-sized iron, exhibit a magnetic dipole moment,
even in the absence of an applied magnetic field (De Vicente et al. 2000). For these
nanomaterials, the contribution of the magnetic force may dominate the total particle-
particle interaction energy thereby leading to aggregation. Equation 9 represents the
magnetic interaction energy between equally-sized particles of radius ap (De Vicente et al.
2000):
3
320
29
8
+
−=
p
pM
ah
aMV
πε (9)
where all the variables are defined in the Nomenclature section.
Some nanoparticles may carry hydrophilic material or functional groups at their
surface (e.g., proteins, polysaccharides) that can have significant amounts of bound water
that may play a role in the interaction of such particles. The approach of two particles
with hydrated surfaces will generally be hindered by an additional repulsive interaction.
The range of this interaction is significant compared to the range of EDL repulsion and is
expected to have an effect on nanoparticle stability, particularly at high ionic strength
(Healy et al. 1978).
2.4.3 UNIQUE FEATURES OF NANOSCALE PARTICLE INTERACTIONS
Because of the small size of nanoparticles (less than 100 nm), their interaction with
solid surfaces or other particles can be quite different than that of larger, micrometer-sized
particles. These unique features of interaction of nanoscale particles can influence their
transport, deposition, and aggregation in aquatic environments.

32
(a) Greater influence of geochemical heterogeneities on deposition.
Geochemical heterogeneities are prevalent on mineral surfaces in subsurface aquatic
environments (Chen et al. 2001, Song et al. 1994). Because of their small size, the
interactions of nanomaterials in aquatic environments will be substantially influenced by
patchwise geochemical heterogeneities (Chen et al. 2002). Such geochemical
heterogeneities may be an important factor controlling the extent of nanoparticle transport
in subsurface environments. The size of the patches relative to the size of the particles is
an important factor. Nanoparticles may experience greater sensitivity to patch
heterogeneity than micrometer-sized particles because nanoparticles will interact with
smaller patches. When the nanoparticles are smaller than the size of the patch
heterogeneities, the particle deposition rate can be approximated by the patchwise
heterogeneity model (Chen et al. 2001, Song et al. 1994). Similar arguments can be made
regarding nanoparticle interaction with physical heterogeneities in the form of roughness.
(b) Low energy barrier. The kinetics of particle deposition and aggregation are
dependent on the height of the energy barrier (Elimelech et al. 1995). Particles that
overcome the energy barrier will deposit on a surface or aggregate with another particle in
a deep primary energy minimum. The height of the energy barrier for deposition or
aggregation is directly dependent on the size of the interacting particles, with smaller
particles exhibiting much lower energy barriers (Elimelech et al. 1995, Elimelech and
O'Melia 1990a). Therefore, nanoparticles will deposit or aggregate more in primary
minimum than micrometer-sized particles. It has been shown that nanoparticles that
deposit in primary energy minima are less likely to be released from the surface following
changes in solution chemistry, such as reduction of ionic strength or changes in solution
pH (Chen and Elimelech 2006).
33
(c) Negligible secondary energy minimum. At the ionic strength of typical
natural waters, the interaction energy of particles greater than about 0.5 µm interacting
with similarly charged particles or surfaces is characterized by a high energy barrier and a
secondary energy minimum (Hahn and O'Melia 2004, Tufenkji and Elimelech 2005). It
has been shown that secondary energy minima play a critical role in the deposition and
transport of particles greater than approximately 0.5 µm (Hahn et al. 2004, Tufenkji and
Elimelech 2005). Such particles readily deposit in secondary minima, even under
conditions where a significant energy barrier exists, resulting in reduced transport in
subsurface environments. We also note that deposition or aggregation in secondary
energy minima is reversible, as particles are released or disaggregate following reduction
in ionic strength or increased hydrodynamic shear (Tufenkji and Elimelech 2005). Except
for aggregation of nZVI particles that have strong long-range attractive magnetic forces,
or metallic nanoparticles with a large Hamaker (A121) constant (Table S2.3), secondary
energy minima are small for nanoparticles (sizes lower than 100 nm) at typical ionic
strength of natural waters. Therefore, nanoparticles generally will not experience
significant deposition or aggregation in secondary minima, and in the presence of an
energy barrier will experience greater transport than micrometer-sized particles.
(d) Interaction energy for very small nanoparticles or non-spherical particles.
The expressions summarized in Table 2.1 for the calculations of the various sphere-sphere
and sphere-plate interaction energies are based on the classic Derjaguin approximation
(Elimelech et al. 1995). The resulting expressions based on this approximation are valid
for large particles and for very short separation distances, much smaller than the radius of
the interacting particles. Accurate interaction energies for very small particles can be
34
calculated based on the surface element integration (SEI) technique (Bhattacharjee and
Elimelech 1997). This technique is particularly important for EDL interactions of small
particles and low ionic strength, where κap<1 (κ is the inverse Debye length). The
commonly used analytical expressions for EDL interactions (summarized in Table 2.1) are
valid only for κap>>1 (Elimelech et al. 1995). The surface element integration can also be
applied to describe the interaction energies of non-spherical particles (Bhattacharjee et al.
2000), which in principle can be extended to carbon nanotubes.
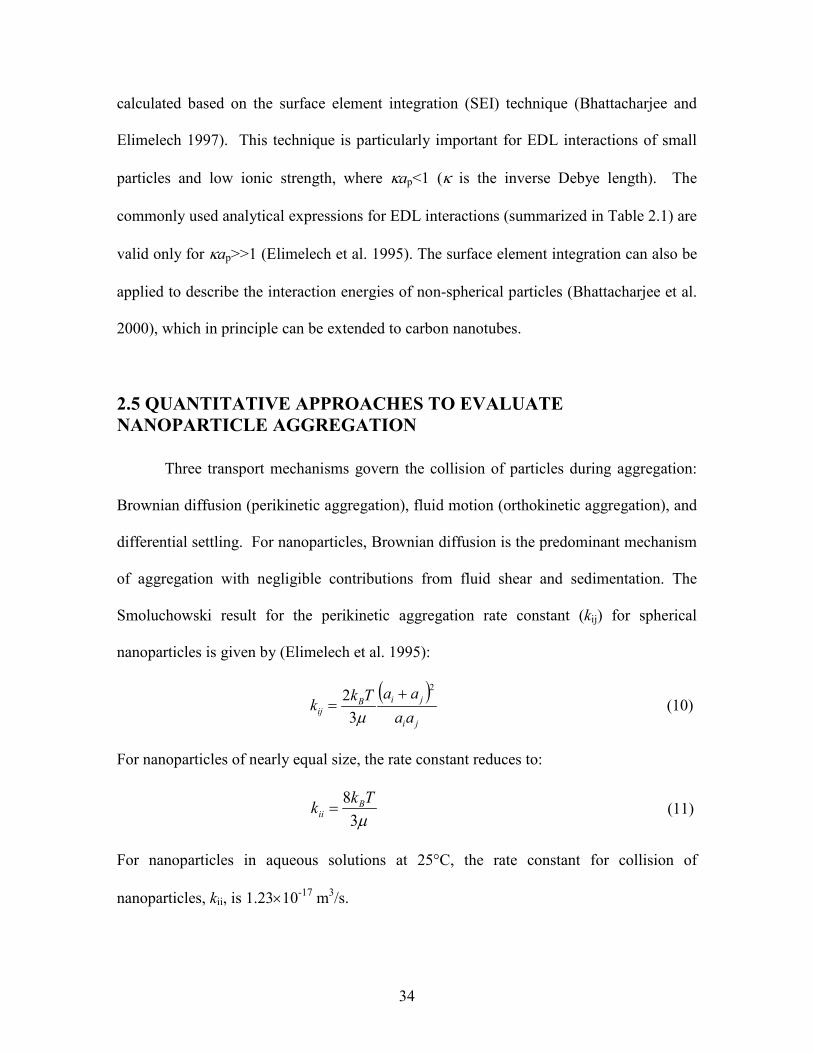
2.5 QUANTITATIVE APPROACHES TO EVALUATE NANOPARTICLE AGGREGATION
Three transport mechanisms govern the collision of particles during aggregation:
Brownian diffusion (perikinetic aggregation), fluid motion (orthokinetic aggregation), and
differential settling. For nanoparticles, Brownian diffusion is the predominant mechanism
of aggregation with negligible contributions from fluid shear and sedimentation. The
Smoluchowski result for the perikinetic aggregation rate constant (kij) for spherical
nanoparticles is given by (Elimelech et al. 1995):
( )
ji
jiBij aa
aaTkk2
32 +
=µ
(10)
For nanoparticles of nearly equal size, the rate constant reduces to:
µ3
8 Tkk Bii = (11)
For nanoparticles in aqueous solutions at 25°C, the rate constant for collision of
nanoparticles, kii, is 1.23×10⁻¹⁷ m3/s.
35
Eqs 10 and 11 highlight two important features. First, for nanoparticles of equal
size, the rate constant kii is independent of particle size. This surprising result is because
increasing particle size leads to a lower diffusion coefficient but also to a larger collision
radius, such that these two effects cancel each other (Elimelech et al. 1995). The second
important feature (eq 10) is that for particles of different size, the aggregation rate constant
will always be greater than that for equal-size particles, which may be significant when
small nanoparticles aggregate with much larger suspended particles in aquatic
environments.
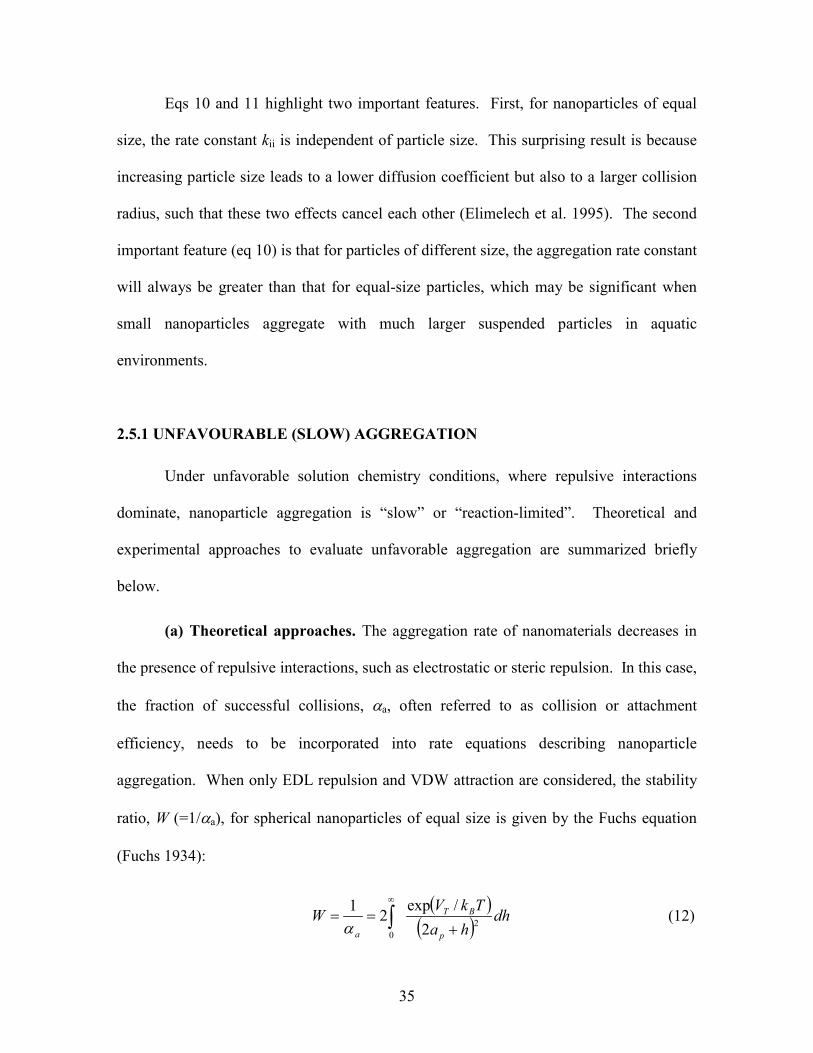
2.5.1 UNFAVOURABLE (SLOW) AGGREGATION
Under unfavorable solution chemistry conditions, where repulsive interactions
dominate, nanoparticle aggregation is “slow” or “reaction-limited”. Theoretical and
experimental approaches to evaluate unfavorable aggregation are summarized briefly
below.
(a) Theoretical approaches. The aggregation rate of nanomaterials decreases in
the presence of repulsive interactions, such as electrostatic or steric repulsion. In this case,
the fraction of successful collisions, αa, often referred to as collision or attachment
efficiency, needs to be incorporated into rate equations describing nanoparticle
aggregation. When only EDL repulsion and VDW attraction are considered, the stability
ratio, W (=1/αa), for spherical nanoparticles of equal size is given by the Fuchs equation
(Fuchs 1934):
( )( ) dh
haTkVW
p
BT
a2
0 2/exp21+
== ∫∞
α (12)

36
A simple approximation of this equation is given by (Elimelech et al. 1995):
−≈
TkVa
Bpa
maxexp2κα (13)
Because of the exponential dependence of αa on maxV , the equation predicts very
low attachment efficiencies for energy barriers above a few kBT. This equation also
predicts that small changes in electrolyte concentration can have a dramatic effect on the
rate of aggregation. Previous aggregation kinetics studies (Elimelech et al. 1995, Ottewill
and Shaw 1966) reveal that eq 12 markedly under predicts the attachment efficiency of a
wide range of colloidal particles, attributing the discrepancy to physical and chemical
heterogeneities of particle surfaces, as well as aggregation in secondary minima (Marmur
1979). Recent studies with nC60, however, demonstrated remarkable agreement between
experimental results of aggregation kinetics and theoretical predictions (Chen and
Elimelech 2006, 2009).
Note that the above analysis does not consider the role of hydrodynamic
interactions. It is possible to incorporate the role of hydrodynamic interaction in the
Fuchs’ integral equation (Chen and Elimelech 2006, Elimelech et al. 1995). Such analysis
has been successfully applied for the aggregation kinetics of nC60 by Chen and Elimelech
(Chen and Elimelech 2006, 2009). Incorporation of hydrodynamic interaction in eq 12,
however, has only a small effect on the attachment efficiency, αa, reducing it by a factor
of two or less.
We note that the theoretical approaches for nanoparticle aggregation (as well as
nanoparticle deposition to be discussed later) are limited to spherical or, in practice, near-
spherical nanoparticles. While these approaches are adequate for most engineered

37
nanoparticles, a notable class of nanomaterials, namely carbon nanotubes (CNTs), cannot
be treated with these approaches. CNTs have a very large aspect ratio (i.e., ratio of length
to diameter), that often exceeds 1000. CNTs, particularly SWNTs, are also bundled and
are not in the form of separate nanotubes in aquatic environments. The complex nature of
CNTs precludes the use of useful theories to predict their aggregation (or deposition)
behavior. Hence, experimental approaches, as those described below, are often used to
describe their aggregation (or deposition) kinetics.
(b) Experimental approaches. Several methods are available to monitor the rate
of aggregation of nanomaterials. Among these methods are dynamic light scattering
(DLS), small angle light scattering (SALS), and fluorescence correlation spectroscopy
(FCS).
Dynamic light scattering (DLS). DLS is the most common method to quantify the
aggregation rate of nanomaterials. This technique is also known as photon correlation
spectroscopy (PCS) or quasi-elastic light scattering (QELS). In this technique, the
diffusion coefficient of aggregating nanoparticles is determined from the autocorrelation
function obtained from the fluctuations of the scattered light intensity as a result of the
Brownian motion of nanoparticles. The effective aggregate size is calculated from the
diffusion coefficient using the Stokes-Einstein equation. DLS has been used to determine
aggregation kinetics of a wide variety of nanomaterials (Table 2.2).
Small-angle light scattering (SALS). At very low scattering angles, the forward
scattering intensity is proportional to the square of the particle/aggregate volume, and is
independent of their shape or orientation. Although the form factor tends to be unity at all
scattering angles for small nanoparticles, it varies significantly at high scattering angles

38
for nanoparticle aggregate sizes of 100 nm or more (Ofoli and Prieve 1997). Therefore,
SALS can be useful to derive absolute aggregation rate constants for nanomaterials.
Fluorescence correlation spectroscopy (FCS). In this approach, the
particle/aggregate diffusion coefficient is determined for fluorescently-labeled particles
passing through an optically-defined confocal volume. Temporal fluctuations in the
measured fluorescence intensity are used to derive an autocorrelation curve which is
related to the translational diffusion of the fluorophore through the confocal volume
(Thompson 1991). FCS has been used to determine the diffusion coefficients and
aggregation behavior of QDs, nTiO2, and nZnO (Domingos et al. 2009a, b).

39
Table 2.2 Summary of Laboratory Studies on Nanoparticle Aggregation
Nanoparticle Type
Nominal size and Concentration Experimental Approach Solution Chemistry Main Findings and Conclusions References
n B dTEM = 25 nm C = n/a
DLS 20-1000 mM NaCl 0.2-20 mM MgCl2
0.2-10 mM CaCl2
pH 5.6
Aggregation is similar to classical colloidal particles and follows DLVO theory
Liu et al. 2009
n C60, n C70
and organic derivatives
d = n/a C = n/a
DLS 10 mM NaCl, pH 4-10 Isoelectric point ~0, nanoparticles stable at pH > 3.0; synthesis parameters control their stability and fate
Ma and Bouchard, 2009
n C60 dDLS = 101.0 nm C = 11.62 mg/L dDLS = 166.2 nm C = 3.34 mg/L
time-resolved DLS 10-1000 mM KCl, pH 5.5 n C60 prepared by prolonged stirring in water more stable than n C60 prepared by sonication in toluene; stability curves in agreement with DLVO theory
Chen and Elimelech, 2009
n C60 and organic derivatives
d = n/a C = 0.22-2.42 mg/L
time-resolved DLS 25-1000 mM NaCl, pH = n/a Presence of phenyl alkyl ester moieties increases colloidal stability
Bouchard et al. 2009
n C60 dDLS = 92 ± 0.3 nm C = 1.0-2.7 mg/L
DLS 1-100 mM NaCl 1-100 mM CaCl2
pH 7.0
Suspension stable at ≤1 mM ionic strength, regardless of electrolyte species, solution addition rate, or mixing sequence
Wang et al. 2008
n C60 dTEM =59.2 ± 22.7 nm C = 5.92 mg/L
time-resolved DLS TEM
90-650 mM NaCl ± 1-5 mg/L HA 4-100 mM MgCl2 ± 1 mg/L HA 2.5-40 mM CaCl2 ± 1 mg/L HA pH 7.5-8.5
Aggregation kinetics consistent with DLVO theory; HA increases n C60 stability at low ionic strength due to steric repulsion; at > 10 mM CaCl2, intermolecular bridging of HA
macromolecules with Ca2+ results in increased light scattering and α a >1.0
Chen and Elimelech, 2007
n C60 dTEM =59.2 ± 22.7 nm C = 5.92 mg/L
time-resolved DLS 60-350 mM NaCl 2.5-20 mM CaCl2
pH 5.2
Stability ratios in good agrement with DLVO theory with reaction-limited and diffusion-limited aggregation zones clearly defined; CCCs at 120 and 4.8 mM for NaCl and CaCl2, respectively
Chen and Elimelech, 2006
n C60 and n C70 dDLS = 63 nm C = n/a
DLS TEM
171 mM NaCl pH = n/a
Monodisperse and polycrystalline n C60 clusters negatively charged and stable in pure water due to electrostatic repulsion; adding salt destabilizes cluster suspension
Deguchi et al. 2001
n C60 dTEM = 7-36 nm C = 130 mg/L
TEM DI water, pH = n/a n C60 nanoparticles form fractal clusters in hydrated state; size of individual clusters can be as low as 1-4 nm
Andrievsky et al. 1999

40
n C60 d ≤ 200 nm C = 80-140 mg/L
UV-Vis spectroscopy 0.005-85 mM NaCl 0.005-85 mM NH4Cl 0.005-85 mM CaCl2
0.005-85 mM Na2SO4
0.005-85 mM La(NO3)3
pH 5-6
n C60 nanoparticles behave as typical colloidal particles and follow Schulze-Hardy rule
Mchedlov-Petrossyan et al. 1997
fullerols (C60(OH)n)
dTEM = 100-250 nm C = 30-220 mg/L
UV-vis spectroscopy SEM TEM
0.1-500 mM Fe(NO3)3, 500 mM each of Al(NO3)3, CaCl2, CoCl2, CuCl2, KMnO4, Ag(NO3) and ZnCl2
pH 3-9
Fullerols react rapidly with metal to produce metal-fullerol cross-linked aggregates
Anderson and Barron, 2005
MWNTs dTEM = 0.6 ± 0.5 nm L* = 0.1-5.8 µm C = 0.75-7.5 mg/L
time-resolved DLS TEM AFM XPS
35-900 mM NaCl, pH 4, 6 and 8 Good correlation between CCC, total oxygen concentration, and MWNT surface charge
Smith et al. 2009
MWNTs dTEM = 0.6 ± 0.5 nm L* = 0.1-5.8 µm C < 3.0 mg/L
time-resolved DLS 30-900 mM NaCl 30-200 mM Na2SO4
1-8 mM MgCl2
0.7-6.2 mM CaCl2
pH 3-10
Oxidized MWNT CCC values consistent with electrostatic stabilization; surface charge correlates with pH-dependent MWNT colloidal stability variations
Smith et al. 2009
MWNTs dTEM < 10-100 nm L* = 1-2 µm C = 100-200 mg/L
TEM UV-vis spectroscopy
1-20 mM Na + 25 mg/L TA 0.05-1.0 mM Mg + 25 mg/L TA 0.05-1.0 mM Ca + 25 mg/L TA 0-0.04 mM La + 25 mg/L TA pH 3-11
Aggregation rate independent of MWNT diameter; CCC values proportional to valence by an exponential factor of 5.5
Lin et al. 2009
MWNTs d* = 140 ± 30 nm L* = 7 ± 2 µm C = 50-500 mg/L
thermal optical transmittance analyzer UV-vis spectroscopy
Milli-Q water ± 1% SDS model 10-100 mg/L NOM solutions river water pH = n/a
MWNTs remain stable in presence of organic matter and river water; stability increases in presence of surfactant
Hyung et al. 2007
MWNTs dTEM = 17.6 ± 7.9 nm L* = 1.5 ± 1.5 µm C = n/a
time-resolved DLS 1-500 mM NaCl ± 5 mg/L HA 0.1-30 mM CaCl2 ± 5 mg/L HA 0.05-30 mM MgCl2 ± 5 mg/L HA pH 3-9
Electrostatic interactions control MWNT stability; HA increases MWNT stability due to steric repulsion
Saleh et al. 2008
MWNTs d* = 1.2-3.0 nm fractal analysis performed C = n/a
DLS 100 mg/L NOM, pH = n/a Functionalization increases stability: (hydroxyl-modified > carboxyl-modified > bare)
Kennedy et al. 2008
MWNTs dTEM ~ 30 nm C = 50 mg/L
UV-vis spectroscopy DI water 172 mM NaCl pH 0-12
COOH functionalized MWNTs stable at pH ≥ 4 as a result of carboxylic acid deprotonation to carboxylate anions
Shieh et al. 2007

41
SWNTs d = n/a C = 100 mg/L
absorbance spectroscopy/ photoluminescence
57.5-570 mM NaCl + 1% SDS 8.75 mM MgSO4 + 1% SDS 6.9 mM MgCl2 + 1% SDS 3.8 mM ErCl3 + 1% SDS pH = n/a
Once intertube van der Waals attraction overcome by sonication, SDS sorbed to SWNTs prevents reaggregation
Niyogi et al. 2007
SWNTs d* = 1.2 nm C < 600 mg/L
UV-vis spectroscopy 1-100 mM NaCl KCl, MgCl2, CaCl2, LaCl3, and CeCl3
also tested pH = n/a
SWNTs treated with H2SO4/H2O2 well-dispersed in water; CCC values follow Schulze-Hardy rule
Sano et al. 2001
SWNTs d* = 0.8-1.6 nm L* = 5-30 µm dRS = 0.9-1.4 nm C < 33 mg/L
time-resolved DLS 1-100 mM NaCl 0.1-10 mM CaCl2
± 2.5mg/L (as TOC) HA or biomacromolecules pH 6
HA and biomacromolecules (BSA, alginate, LB) impart steric stabilization; BSA has most dramatic effect due to globular molecular structure
Saleh et al. 2010
QD d* = 3.5-4.5 nm C = 680 mg/L
DLS 0-150 mM KCl 0-20 mM CaCl2
0-20 mM MgCl2
0-13.3 mM Al2(SO4)3
pH 5, 8
QD stability controlled by ionic nature in solution; divalent and trivalent cations form strong complexes with QD capping ligands/functional groups, bridging QDs or neutralizing their surface charges
Zhang et al. 2008
QD d* = 3.5 nm C = 100 mg/L
DLS microscopy
DI water, pH 3-12 Decrease in pH causes surface ligand/functional group detachment; surface protonation promotes QD aggregation
Zhang et al. 2008
QD d = n/a C = 0.37-0.67 mM (Cd)
FCS 1-100 mM Na2HPO4 + 0.2-20 mM KH2PO4 + 0.3-27 mM KCl + 1.4-1370 mM NaCl pH 7.4-9.0
Aggregation rate depends on QD size (small QDs aggregate quickly); above 'photoactivation critical concentration', aggregation and subsequent photoactivation rapid under laser irradiation
Dong et al. 2007
n Ag dTEM = 1-3 nm C = n/a
UV-vis spectroscopy TEM
0-800 mM Ba2+
0-800 mM Ca2+
0-20 mM each of Zn2+, Cr3+, Cu2+, Pb2+
pH 9.3
Change in position of absorption spectra during cation induced aggregation useful in identifying interaction mechanism between Ag nanoparticles and electrophilic transition metal cations or less polarizable alkaline metals
Liu et al. 2003
n Ag dDLS = 23-42 nm
C = 2.6 x 10¹⁰ - 7.0 x 10¹¹
particles/mL
DLS UV-vis spectroscopy
10-1000 mM NaCl 200 mM NaCl + 0.005-0.1% hydroxy-ethylcellulose pH = n/a
Fractal dimensions increase with time in reaction limited aggregation regime but not in diffusion limited aggregation regime
Trinh et al. 2009
n ZVI d = n/a C = 1 mg/L
photography spectroscopy
1.2 mM NaHCO3 ± 20-200 mg/L NOM, pH 7.1
NOM sorption onto n ZVI results in reduced sticking coefficient and enhanced stability
Johnson et al. 2009

42
Note: d* and L* are diameters and lengths provided by particle suppliers.
n ZVI dDLS ≤ 200 nm C = 154 mg/L
DLS ≤ 500 mM NaCl ± ≤1 g/L guar gum ≤10 mM CaCl2 ± ≤1 g/L guar gum pH 7.0
At high salt concentrations (500 mM NaCl and 3 mM CaCl2), guar gum stabilizes n ZVI
Tiraferri et al. 2008
n ZVI dTEM = 10-80 nm C = 3000 mg/L
DLS 1 mM NaHCO3 ± 5-1000 mg/L polystyrene sulfonate 1 mM NaHCO3 ± 5-1000 mg/L CMC 1 mM NaHCO3 ± 5-1000 mg/L PA pH 9.5-10.5
Larger n ZVI particles unstable due to strong attractive magnetic forces
Phenrat et al. 2008
n ZVI dDLS = 15.2-3000 nm C = n/a
DLS ≤200 mM NaCl ≤10 mM CaCl2
pH = n/a
High cation concentrations promote aggregation of stable n ZVI particles
He and Zhao, 2007
n ZVI dTEM = 10-80 nm C = 3000 mg/L
DLS optical microscopy
1 mM NaHCO3, pH 7.4 Aggregation rapid; increased aggregation with increasing saturation magnetization (magnetic moment)
Phenrat et al. 2007
n TiO2 dRG = 6-7 nm C = 3000-10000 mg/L
absorption spectroscopy 500-2000 mM KCl, pH 0-2.0 Aggregation slow at pH 0.1-2.0; aggregate structure depends on ionic strength and medium pH
Pavlova-Verevkina et al. 2009
n TiO2 d* = 5 nm C = 1 mg/L
FCS 5-100 mM NaNO3 ± 0.2-5 mg/L FA pH 2-8
Rapid aggregation in vicinity of pHZPC; adsorbed FA increases nanoparticle stability due to increased steric repulsion
Domingos et al. 2009
n TiO2 d* = 4-6 nm C = 80-83 mg/L
DLS 4.5-16.5 mM NaCl 12.8 mM CaCl2
pH 4.8-8.2
Aggregation rate significantly higher in CaCl2 than in NaCl French et al. 2009
n TiO2 d* = 35 nm C = 2000 mg/L (40mg/g of soil)
DLS 50 g/L diluted soil solution pH 6.15-8.58
In soil solution, high ionic strength and low DOC result in heightened aggregation rates
Fang et al. 2009
n TiO2 d* = 5, 32 nm C = 2-200 mg/L
DLS 20 mM NaCl ± 0.1-2.2 mM organic acids, pH 2-6.5
Aggregation occurs at all pH values; finer particles aggregate faster than larger particles
Pettibone et al. 2008
n TiO2 d = n/a C = 30 mg/L
DLS 0.01-10 mM KCl 1 mM each LiCl, KBr, CsCl, LiF pH 2-12
Hydrated ion radius determines extent of adsorption; isoelectric point changes due to ion adsorption
Tkachenko et al. 2006
n TiO2 d* = 7-20 nm C = n/a
fractal dimension measurement
DI water pH = n/a
Diffusion-limited aggregation results in fractal-like aggregates
Tseng and Lin, 2003

43
2.5.2 FAVORABLE (FAST) AGGREGATION
Under favorable solution chemistry conditions, in the absence of repulsive energy
barriers, nanoparticle aggregation is “fast” or “diffusion-limited”. Theoretical and
experimental approaches to evaluate favorable aggregation are briefly outlined below.
(a) Theoretical approaches. The transition from unfavorable to favorable
aggregation occurs over a very narrow range of electrolyte concentration, at the salt
concentration where the energy barrier for successful collision vanishes. This behavior
can, in principle, be predicted from eq 12. The salt concentration corresponding to this
transition is called the critical coagulation concentration (CCC). The magnitude of the
CCC depends on the counterion valence (z), the nanoparticle zeta potential (ζ ), and the
Hamaker constant A121 according to (Elimelech et al. 1995):
∝
Tkze
AzCCC
B4tanh1 4
2121
6
ζ (14)
This equation shows that at large zeta potentials (i.e., 14/ >>Tkze Bζ ), the CCC is
proportional to z–6. This relationship is known as the Schulze-Hardy rule. However, at
low zeta potentials (i.e., 14/ <<Tkze Bζ ), which is common for different engineered
nanomaterials, the CCC is proportional to z–2. In practice, the CCC dependence on z for a
wide range of nanomaterials should be in between z–6 to z–2.
(b) Experimental approaches. The fast aggregation rate constant can be
determined from any of the methods described earlier when carrying out aggregation
experiments at high salt concentrations, above the CCC. Once the favorable aggregation
rate is determined, the collision (attachment) efficiency, αa, can be determined by
normalizing the aggregation rate constant obtained at a given solution chemistry with the

44
favorable aggregation rate constant. For instance, when using DLS, αa can be obtained
from the slopes of the initial change of the hydrodynamic radius with time (Chen and
Elimelech 2007, Chen et al. 2006):
favt
h
fav
t
h
a
dttda
N
dttda
N
,0,0
00
)(1
)(1
→
→
=α (15)
where the subscript “fav” denotes favorable aggregation. This experimental approach can
be used to determine the attachment efficiency of all types of nanomaterials, including
non-spherical nanomaterials such as CNTs.
2.6 QUANTITATIVE APPROACHES TO EVALUATE NANOPARTICLE DEPOSITION
The transport and deposition of nanoparticles in saturated granular porous media is
generally governed by Brownian diffusion (Guzman et al. 2006, Lecoanet et al. 2004),
with negligible contributions from gravitational sedimentation and interception. The
importance of Brownian diffusion increases with decreasing particle size, thereby
increasing the number of collisions between nanoparticles and collector (e.g., aquifer
grain) surfaces. Particle deposition onto a collector surface depends on a number of
factors, including particle and grain sizes, particle and collector surface potentials,
solution chemistry of the suspending medium, and the Hamaker constant of the particle-
fluid-collector (Elimelech et al. 1995). In natural or engineered aquatic environments, the
interactions between nanoparticles and collector surfaces generally described by the
DLVO theory of colloidal stability can either be attractive or repulsive. The particle
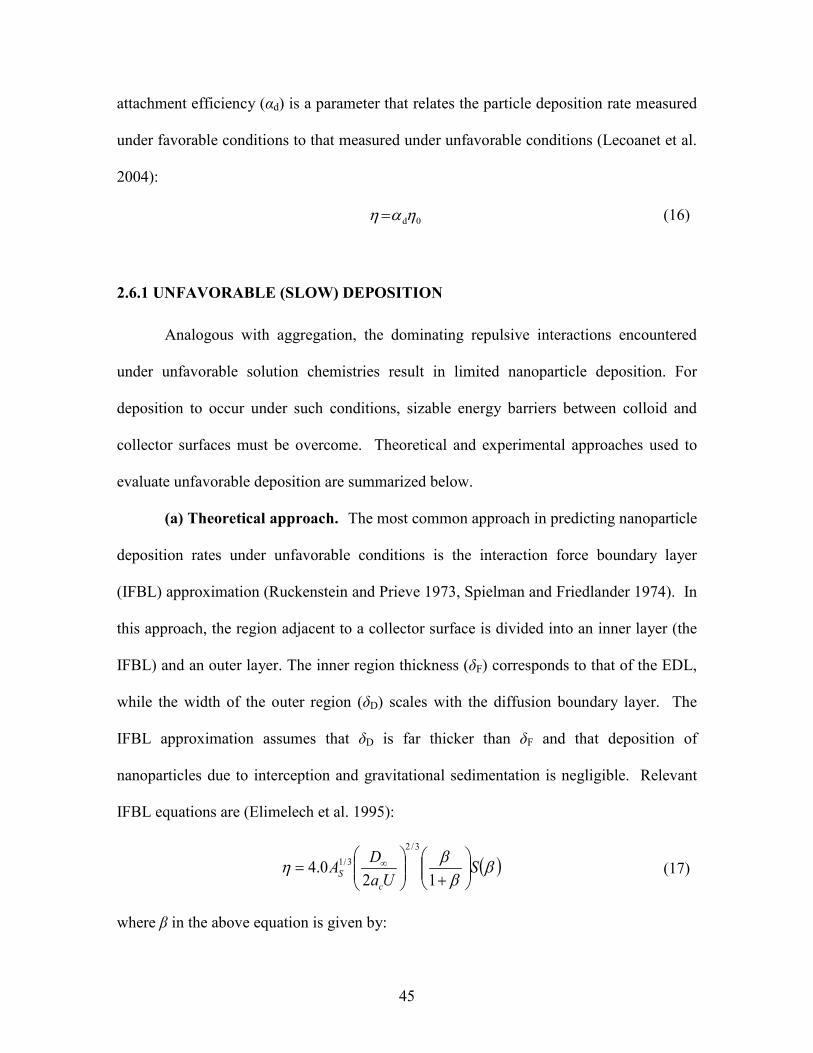
45
attachment efficiency (αd) is a parameter that relates the particle deposition rate measured
under favorable conditions to that measured under unfavorable conditions (Lecoanet et al.
2004):
0dηαη = (16)
2.6.1 UNFAVORABLE (SLOW) DEPOSITION
Analogous with aggregation, the dominating repulsive interactions encountered
under unfavorable solution chemistries result in limited nanoparticle deposition. For
deposition to occur under such conditions, sizable energy barriers between colloid and
collector surfaces must be overcome. Theoretical and experimental approaches used to
evaluate unfavorable deposition are summarized below.
(a) Theoretical approach. The most common approach in predicting nanoparticle
deposition rates under unfavorable conditions is the interaction force boundary layer
(IFBL) approximation (Ruckenstein and Prieve 1973, Spielman and Friedlander 1974). In
this approach, the region adjacent to a collector surface is divided into an inner layer (the
IFBL) and an outer layer. The inner region thickness (δF) corresponds to that of the EDL,
while the width of the outer region (δD) scales with the diffusion boundary layer. The
IFBL approximation assumes that δD is far thicker than δF and that deposition of
nanoparticles due to interception and gravitational sedimentation is negligible. Relevant
IFBL equations are (Elimelech et al. 1995):
( )β
ββη S
UaDA
cS
+
= ∞
120.4
3/23/1 (17)
where β in the above equation is given by:

46
( )
Γ=
∞
∞−
DaK
UaDA cF
cs
3/13/13/1
312
31β (18)
Here, KF is the pseudo-first order rate constant (Elimelech et al. 1995):
( ) ( )[ ]
1
01 1/exp
−
∞
−= ∫D
dyTkVHgDK BTF
δ
(19)
Similar to the analysis of unfavorable aggregation (eqs 12 and 13), the deposition
rate is very sensitive to VT/kBT. Previous deposition kinetics studies indicate that eq 17
markedly underpredicts the deposition rate for a wide range of colloidal particles and
collector surfaces (Elimelech et al. 1995). This discrepancy is commonly attributed to
chemical and physical heterogeneities of particle and collector surfaces as well as
deposition in secondary minima.
(b) Experimental approaches. There exist two main experimental approaches to
evaluate nanoparticle deposition rates onto collector surfaces in aqueous environments.
The most commonly used approach is the laboratory-scale packed-bed column experiment
(Brant et al. 2005, Doshi et al. 2008, Espinasse et al. 2007, Lecoanet et al. 2004, Lecoanet
and Wiesner 2004, Li et al. 2008, Tufenkji and Elimelech 2005). Another experimental
technique that has recently been used to study nanoparticle deposition kinetics is the
quartz crystal microbalance (QCM) (Fatisson et al. 2009, Quevedo and Tufenkji 2009).
Laboratory column studies are performed using columns packed with granular materials
(e.g., glass beads, sand, or soil) and injecting the particles of interest at a known influent
concentration, C0, for a time period t0. The particles are generally suspended in natural or
artificial (model) aquatic matrices of known composition. Particle retention in the packed-
bed is evaluated by measuring the effluent particle concentration (C) as a function of time
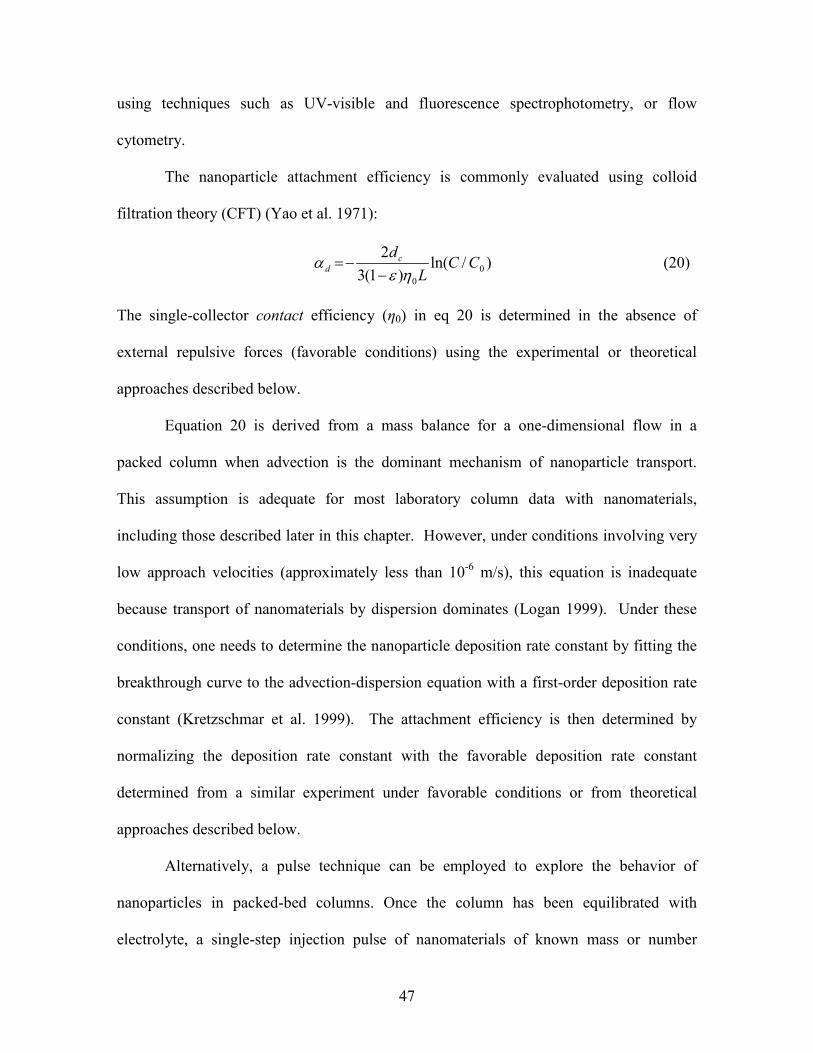
47
using techniques such as UV-visible and fluorescence spectrophotometry, or flow
cytometry.
The nanoparticle attachment efficiency is commonly evaluated using colloid
filtration theory (CFT) (Yao et al. 1971):
)/ln(
)1(32
00
CCL
dcd ηε
α−
−= (20)
The single-collector contact efficiency (η0) in eq 20 is determined in the absence of
external repulsive forces (favorable conditions) using the experimental or theoretical
approaches described below.
Equation 20 is derived from a mass balance for a one-dimensional flow in a
packed column when advection is the dominant mechanism of nanoparticle transport.
This assumption is adequate for most laboratory column data with nanomaterials,
including those described later in this chapter. However, under conditions involving very
low approach velocities (approximately less than 10-6 m/s), this equation is inadequate
because transport of nanomaterials by dispersion dominates (Logan 1999). Under these
conditions, one needs to determine the nanoparticle deposition rate constant by fitting the
breakthrough curve to the advection-dispersion equation with a first-order deposition rate
constant (Kretzschmar et al. 1999). The attachment efficiency is then determined by
normalizing the deposition rate constant with the favorable deposition rate constant
determined from a similar experiment under favorable conditions or from theoretical
approaches described below.
Alternatively, a pulse technique can be employed to explore the behavior of
nanoparticles in packed-bed columns. Once the column has been equilibrated with
electrolyte, a single-step injection pulse of nanomaterials of known mass or number

48
concentration is introduced into the column. Assuming a semi-infinite column under
clean-bed conditions, the particle concentration, C(x,t), in the column at depth x and time t
is given by the one-dimensional advection-dispersion equation (Chen et al. 2001, Jaisi and
Elimelech 2009):
( ) ( )
−−−=
Dtvtxtk
DtxntxC do 4
expexp2
),(2
3π (21)
A nonlinear least-squares analysis can be employed to fit eq 21 to the breakthrough curves
obtained subsequent to the pulse injection. Both kd and D are obtained simultaneously
with this analysis. Again, αd is determined by normalizing this deposition rate constant
with the favorable deposition rate constant determined from a similar experiment
conducted under favorable conditions.
The QCM has recently been demonstrated to be useful in measuring the deposition
kinetics of nanoparticles onto model collector surfaces (Fatisson et al. 2009, Quevedo and
Tufenkji 2009). In this technique, particle deposition occurs on a clean or functionalized
silica-coated QCM crystal that is excited to oscillate at its fundamental resonance
frequency. As particles deposit onto the crystal, the increase in mass (m) on the collector
surface results in measurable decrease in the crystal’s resonance frequency (f). For
homogeneous, very thin, or quasi-rigid layers, the frequency shift of the oscillating crystal
(f) is directly related to the increase in mass per unit area (mf) by the Sauerbrey
relation (Sauerbrey 1959). As the frequency shift (Δf) is proportional to a change in mass
(Δmf) at the crystal surface, the rate of change of Δf is equivalent to the rate of mass
change on the crystal surface (i.e., the rate of particle deposition or release). Hence, the

49
nanoparticle deposition rate (rd) can be determined by evaluating the initial slope in the Δf
measurements (Fatisson et al. 2009) using:
dt
fdrd∆
= (22)
When the QCM flow chamber is designed with a parallel-plate geometry, the
Smoluchowski-Levich approximation can be used to evaluate the theoretical particle
deposition rate ( SLdr ) in the absence of repulsive interactions:
3/10538.0
= ∞
xhPe
aCDr c
p
SLd (23)
Two-dimensional microchannel structures have also been used to study
nanoparticle deposition (Guzman et al. 2006, Jeong and Kim 2009). Photolithography and
chemical etching are employed to construct porous microchannels. Particle suspensions of
known concentration are injected into the 2-dimensional structure and the effluent
concentration exiting the set-up can be determined using various detection methods.
Additionally, pore clogging by large nanoparticle aggregates can be visualized by
mounting the microchannels onto a microscope stage (Guzman et al. 2006). Parallel-plate
flow chambers can also be packed with collector grains, allowing for the visualization of
particle deposition and pore clogging. While visualization of nanoparticles in such set-ups
is challenging, the behavior of particle aggregates can sometimes be examined by
mounting the set-up onto a microscope stage.
2.6.2 FAVORABLE (FAST) DEPOSITION
When deposition is favorable, the nanoparticle deposition rate approaches the
mass-transport limited rate. In this case, αd approaches unity, andη=η0. Several

50
theoretical and experimental approaches have been proposed to evaluate η0 for
nanoparticles and are described here.
(a) Theoretical approaches. The single-collector contact efficiency, η0, is a ratio
between the total rate of particle-collector contacts and the rate at which particles flow
towards a collector grain. Particle transport to the grain results from sedimentation,
interception, and Brownian diffusion, with diffusion dominating for nanomaterials. The
single-collector contact efficiency accounts for particle transport via interception (ηI),
gravitational sedimentation (ηG), and Brownian diffusion (ηD) and can be determined by
rigorously solving the convective-diffusion equation (Tufenkji and Elimelech 2004).
Semiempirical correlation equations based on numerical solutions of the convective-
diffusion equation have been developed (Rajagopalan and Tien 1976, Tufenkji and
Elimelech 2004). A correlation equation developed by Tufenkji and Elimelech overcomes
the limitations of previous approaches that are particularly important for nano-sized
particles (Tufenkji and Elimelech 2004). Specifically, this equation considers the
influence of hydrodynamic and VDW interactions on Brownian diffusion. Moreover, the
impact of VDW forces on the transport of particles by gravitational sedimentation is also
considered (Tufenkji and Elimelech 2004). This latter mechanism can be significant for
nanoparticles of high density, such as metal oxides. Hence, the single-collector contact
efficiency for nanoparticle transport in saturated granular porous media under conditions
favorable for deposition can be determined using (Tufenkji and Elimelech 2004):
053.011.124.0125.0675.1052.0715.0081.03/1 22.055.04.2 vdWGRARSvdWPeRso NNNNNANNNA −−− ++=η (24)
The dimensionless parameters in eq 24 have all been defined elsewhere (Tufenkji and
Elimelech 2004).
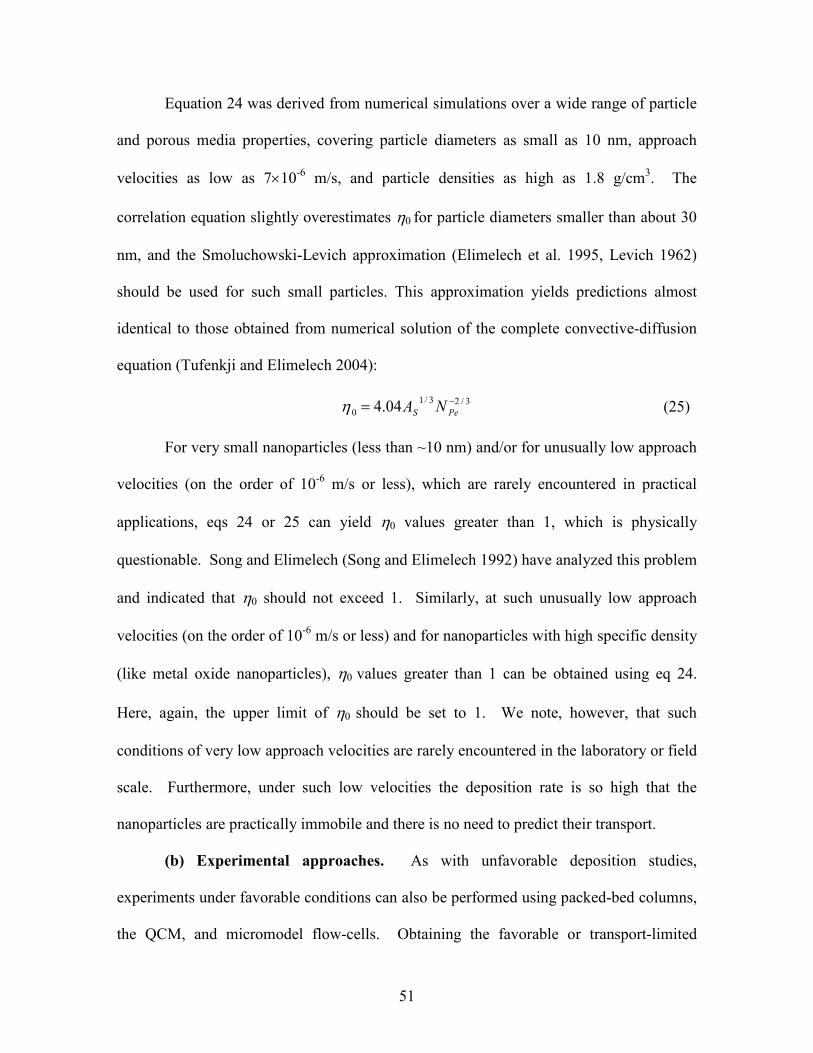
51
Equation 24 was derived from numerical simulations over a wide range of particle
and porous media properties, covering particle diameters as small as 10 nm, approach
velocities as low as 7×10⁻⁶ m/s, and particle densities as high as 1.8 g/cm3. The
correlation equation slightly overestimates η0 for particle diameters smaller than about 30
nm, and the Smoluchowski-Levich approximation (Elimelech et al. 1995, Levich 1962)
should be used for such small particles. This approximation yields predictions almost
identical to those obtained from numerical solution of the complete convective-diffusion
equation (Tufenkji and Elimelech 2004):
3/23/1
0 04.4 −= PeS NAη (25)
For very small nanoparticles (less than ~10 nm) and/or for unusually low approach
velocities (on the order of 10-6 m/s or less), which are rarely encountered in practical
applications, eqs 24 or 25 can yield η0 values greater than 1, which is physically
questionable. Song and Elimelech (Song and Elimelech 1992) have analyzed this problem
and indicated that η0 should not exceed 1. Similarly, at such unusually low approach
velocities (on the order of 10-6 m/s or less) and for nanoparticles with high specific density
(like metal oxide nanoparticles), η0 values greater than 1 can be obtained using eq 24.
Here, again, the upper limit of η0 should be set to 1. We note, however, that such
conditions of very low approach velocities are rarely encountered in the laboratory or field
scale. Furthermore, under such low velocities the deposition rate is so high that the
nanoparticles are practically immobile and there is no need to predict their transport.
(b) Experimental approaches. As with unfavorable deposition studies,
experiments under favorable conditions can also be performed using packed-bed columns,
the QCM, and micromodel flow-cells. Obtaining the favorable or transport-limited
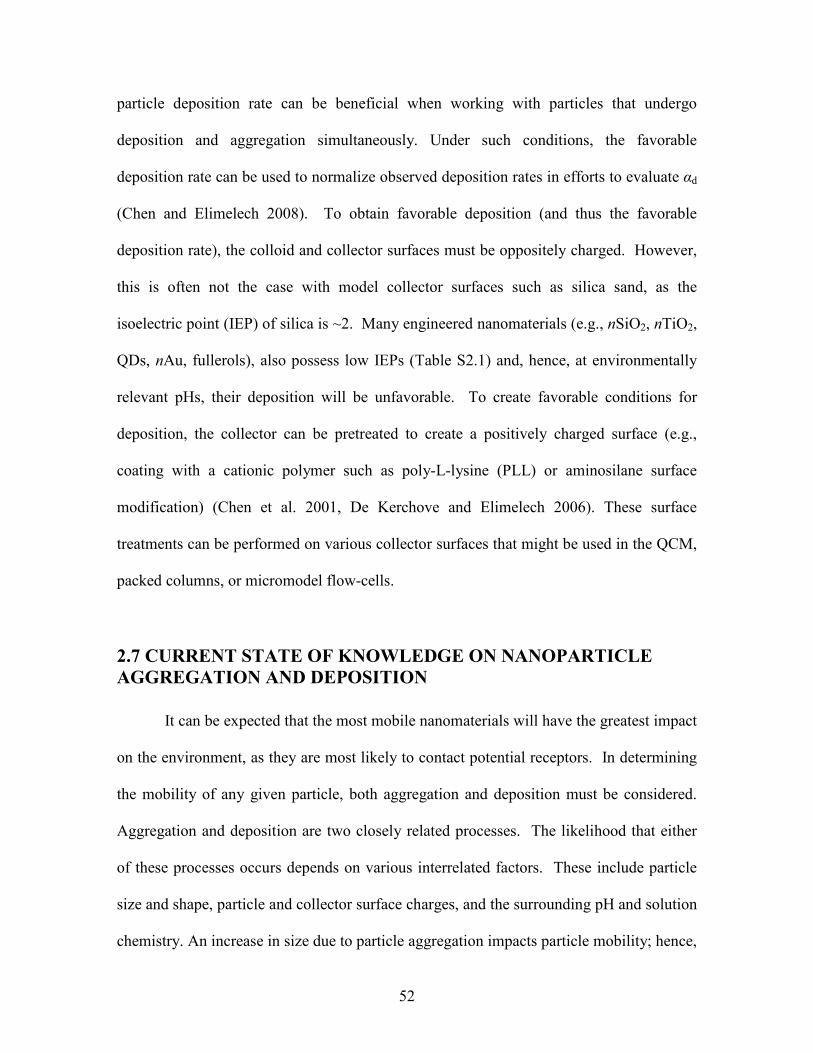
52
particle deposition rate can be beneficial when working with particles that undergo
deposition and aggregation simultaneously. Under such conditions, the favorable
deposition rate can be used to normalize observed deposition rates in efforts to evaluate αd
(Chen and Elimelech 2008). To obtain favorable deposition (and thus the favorable
deposition rate), the colloid and collector surfaces must be oppositely charged. However,
this is often not the case with model collector surfaces such as silica sand, as the
isoelectric point (IEP) of silica is ~2. Many engineered nanomaterials (e.g., nSiO2, nTiO2,
QDs, nAu, fullerols), also possess low IEPs (Table S2.1) and, hence, at environmentally
relevant pHs, their deposition will be unfavorable. To create favorable conditions for
deposition, the collector can be pretreated to create a positively charged surface (e.g.,
coating with a cationic polymer such as poly-L-lysine (PLL) or aminosilane surface
modification) (Chen et al. 2001, De Kerchove and Elimelech 2006). These surface
treatments can be performed on various collector surfaces that might be used in the QCM,
packed columns, or micromodel flow-cells.
2.7 CURRENT STATE OF KNOWLEDGE ON NANOPARTICLE AGGREGATION AND DEPOSITION
It can be expected that the most mobile nanomaterials will have the greatest impact
on the environment, as they are most likely to contact potential receptors. In determining
the mobility of any given particle, both aggregation and deposition must be considered.
Aggregation and deposition are two closely related processes. The likelihood that either
of these processes occurs depends on various interrelated factors. These include particle
size and shape, particle and collector surface charges, and the surrounding pH and solution
chemistry. An increase in size due to particle aggregation impacts particle mobility; hence,
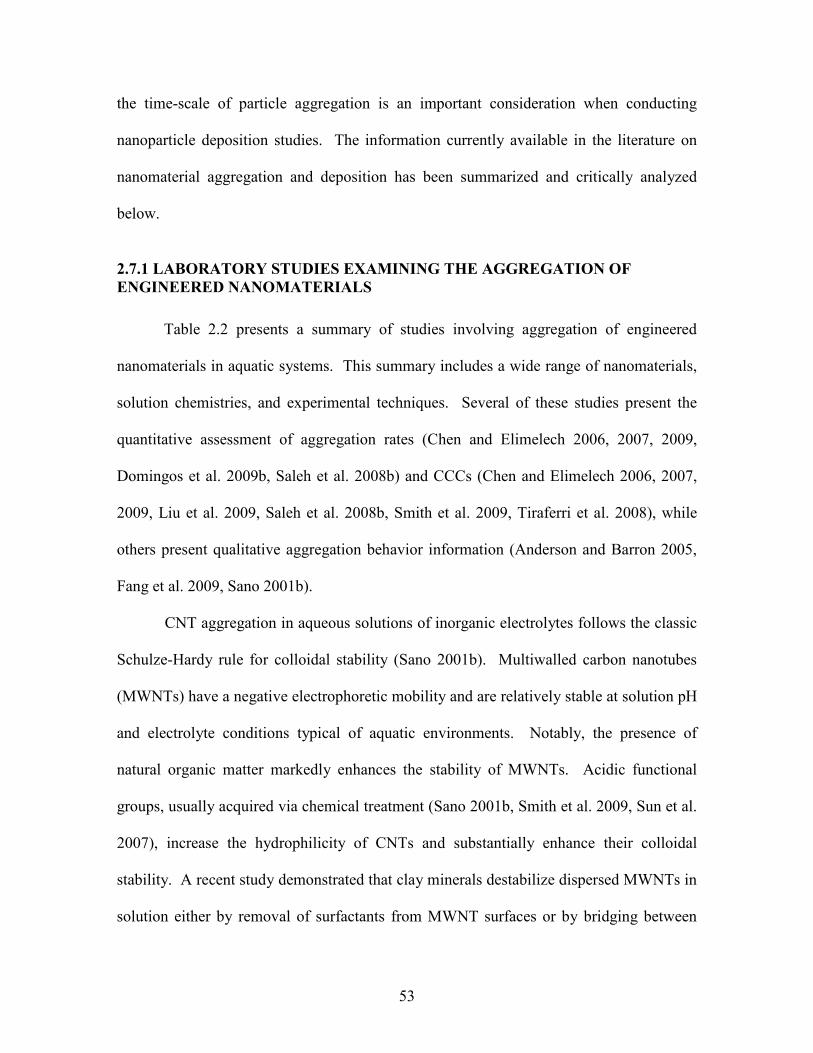
53
the time-scale of particle aggregation is an important consideration when conducting
nanoparticle deposition studies. The information currently available in the literature on
nanomaterial aggregation and deposition has been summarized and critically analyzed
below.
2.7.1 LABORATORY STUDIES EXAMINING THE AGGREGATION OF ENGINEERED NANOMATERIALS
Table 2.2 presents a summary of studies involving aggregation of engineered
nanomaterials in aquatic systems. This summary includes a wide range of nanomaterials,
solution chemistries, and experimental techniques. Several of these studies present the
quantitative assessment of aggregation rates (Chen and Elimelech 2006, 2007, 2009,
Domingos et al. 2009b, Saleh et al. 2008b) and CCCs (Chen and Elimelech 2006, 2007,
2009, Liu et al. 2009, Saleh et al. 2008b, Smith et al. 2009, Tiraferri et al. 2008), while
others present qualitative aggregation behavior information (Anderson and Barron 2005,
Fang et al. 2009, Sano 2001b).
CNT aggregation in aqueous solutions of inorganic electrolytes follows the classic
Schulze-Hardy rule for colloidal stability (Sano 2001b). Multiwalled carbon nanotubes
(MWNTs) have a negative electrophoretic mobility and are relatively stable at solution pH
and electrolyte conditions typical of aquatic environments. Notably, the presence of
natural organic matter markedly enhances the stability of MWNTs. Acidic functional
groups, usually acquired via chemical treatment (Sano 2001b, Smith et al. 2009, Sun et al.
2007), increase the hydrophilicity of CNTs and substantially enhance their colloidal
stability. A recent study demonstrated that clay minerals destabilize dispersed MWNTs in
solution either by removal of surfactants from MWNT surfaces or by bridging between

54
clay minerals and MWNTs by surfactant molecules (Han 2008). In contrast to MWNTs,
studies considering single-walled carbon nanotube (SWNT) aggregation are limited.
SWNTs are highly bundled and are difficult to disperse even with sonication. However,
once inter-tube VDW attraction is overcome, adsorption of surfactants such as SDS to
SWNTs induces significant electrostatic repulsion, preventing SWNT re-aggregation
(Niyogi et al. 2007). A recent study on SWNT aggregation kinetics has demonstrated that
humic substances and biomacromolecules of relevance to biological media sterically
stabilize SWNTs (Saleh et al. 2010).
The early stages of fullerene nanoparticle aggregation in the presence of both
monovalent and divalent salts are consistent with the DLVO theory of colloidal stability
(Chen and Elimelech 2006, 2007, 2009). The presence of humic acid results in greater
stability of nC60 suspensions as a result of steric repulsion (Chen and Elimelech 2007). In
identical polar solvents, the likelihood of aggregation among fullerene nanoparticles is
nC60>nC70>nCmix (Alargova et al. 2001). It was suggested that the original size and
crystallographic face/lattice that control packing also play roles in aggregation in both
polar solvents and aqueous solutions (Deguchi et al. 2001, Dresselhaus et al. 1996).
Labille et al. (Labille et al. 2006, 2009) found that nC60 gradually becomes hydrophilic
due to hydration and surface hydroxylation in the presence of water. It was hypothesized
that this mechanism may be responsible for the gradual acquisition of titratable negative
surface charge on the otherwise unfunctionalized fullerenes (Labille et al. 2006, 2009).
However, a recent study indicates that the mechanism of surface charge acquisition by
nC60 is still not well understood (Chen & Elimelech 2009).

55
Aggregation and stability of CNTs and nC60 depends on their surface properties,
electrolyte concentration and type, and the specific adsorption mechanism of
macromolecules, polymers, or surfactants. For example, humic and fulvic acid molecules
adsorb onto MWNTs by π-π interactions in which cross-linked aromatic networks on the
molecules interact with aromatic rings on the MWNTs (Hyung et al., 2007, Hyung and
Kim 2008). In fact, the sorption capacity and hence the stability of CNTs have been
directly correlated to the aromatic content of NOM (Hyung and Kim 2008).
The presence of redox sensitive elements in nanoparticle structures may promote
their dissolution and transformation. For example, oxidation of Fe in nZVI produces a
thin shell of hematite (Fe2O3) on the Fe0 core. The physicochemical properties of nZVI
with thick hematite shells are more likely similar to those of hematite particles. However,
because nZVI are often prepared with polymer and/or surfactant coatings, the properties of
the Fe2O3 shell and Fe0 core play a small role in the aggregation and deposition of nZVI.
The stability and aggregation behavior of nZVI has been studied in the presence of
different polymers and surfactants (Phenrat et al. 2007, 2008, Tiraferri et al. 2008).
Polymers and surfactants impart steric repulsive forces that oppose the long-range
attractive magnetic forces between nZVI particles. The properties of polymer-coated
nZVI are influenced by the chemical composition and structure of the polymer coating
(Phenrat et al. 2009). Besides imparting a more negative surface charge due to sorption,
surfactants such as poly(vinyl alcohol-co-vinyl acetate-co-itaconic acid), PV3A, also
decrease the isoelectric point (Sun et al. 2007). These results collectively suggest that the
properties of nZVI are controlled by the characteristics of the surfactant or polymer added
to achieve a targeted nZVI application.
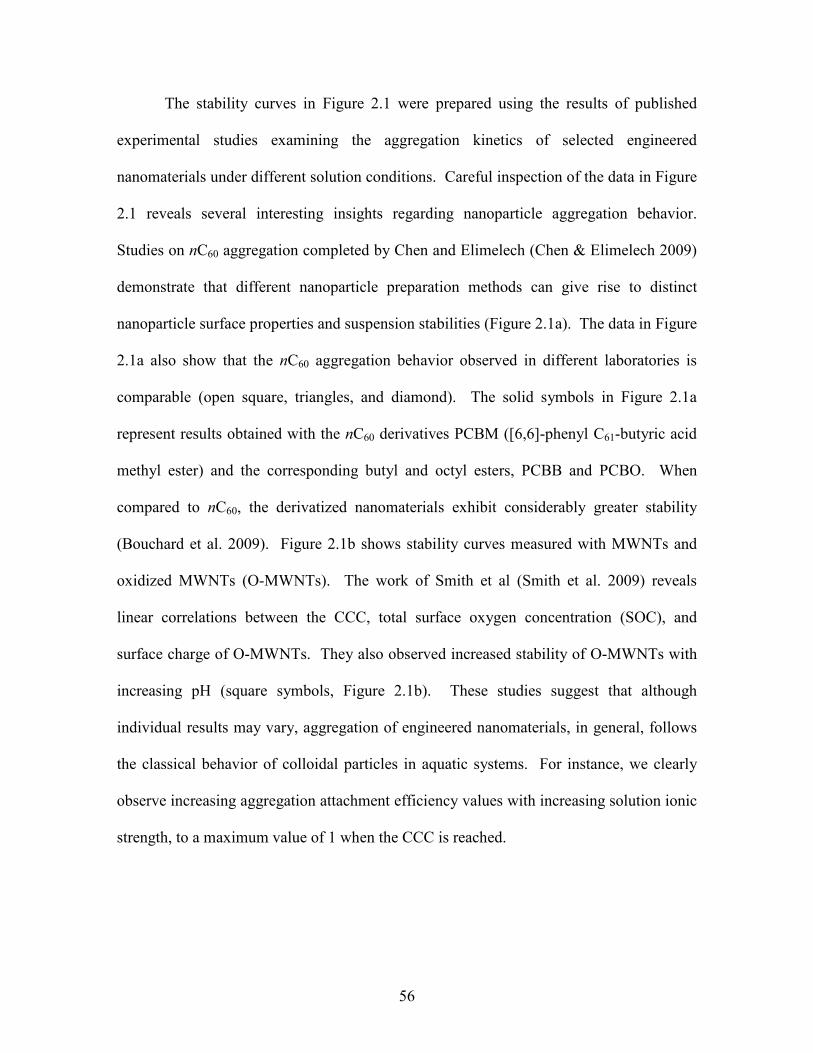
56
The stability curves in Figure 2.1 were prepared using the results of published
experimental studies examining the aggregation kinetics of selected engineered
nanomaterials under different solution conditions. Careful inspection of the data in Figure
2.1 reveals several interesting insights regarding nanoparticle aggregation behavior.
Studies on nC60 aggregation completed by Chen and Elimelech (Chen & Elimelech 2009)
demonstrate that different nanoparticle preparation methods can give rise to distinct
nanoparticle surface properties and suspension stabilities (Figure 2.1a). The data in Figure
2.1a also show that the nC60 aggregation behavior observed in different laboratories is
comparable (open square, triangles, and diamond). The solid symbols in Figure 2.1a
represent results obtained with the nC60 derivatives PCBM ([6,6]-phenyl C61-butyric acid
methyl ester) and the corresponding butyl and octyl esters, PCBB and PCBO. When
compared to nC60, the derivatized nanomaterials exhibit considerably greater stability
(Bouchard et al. 2009). Figure 2.1b shows stability curves measured with MWNTs and
oxidized MWNTs (O-MWNTs). The work of Smith et al (Smith et al. 2009) reveals
linear correlations between the CCC, total surface oxygen concentration (SOC), and
surface charge of O-MWNTs. They also observed increased stability of O-MWNTs with
increasing pH (square symbols, Figure 2.1b). These studies suggest that although
individual results may vary, aggregation of engineered nanomaterials, in general, follows
the classical behavior of colloidal particles in aquatic systems. For instance, we clearly
observe increasing aggregation attachment efficiency values with increasing solution ionic
strength, to a maximum value of 1 when the CCC is reached.
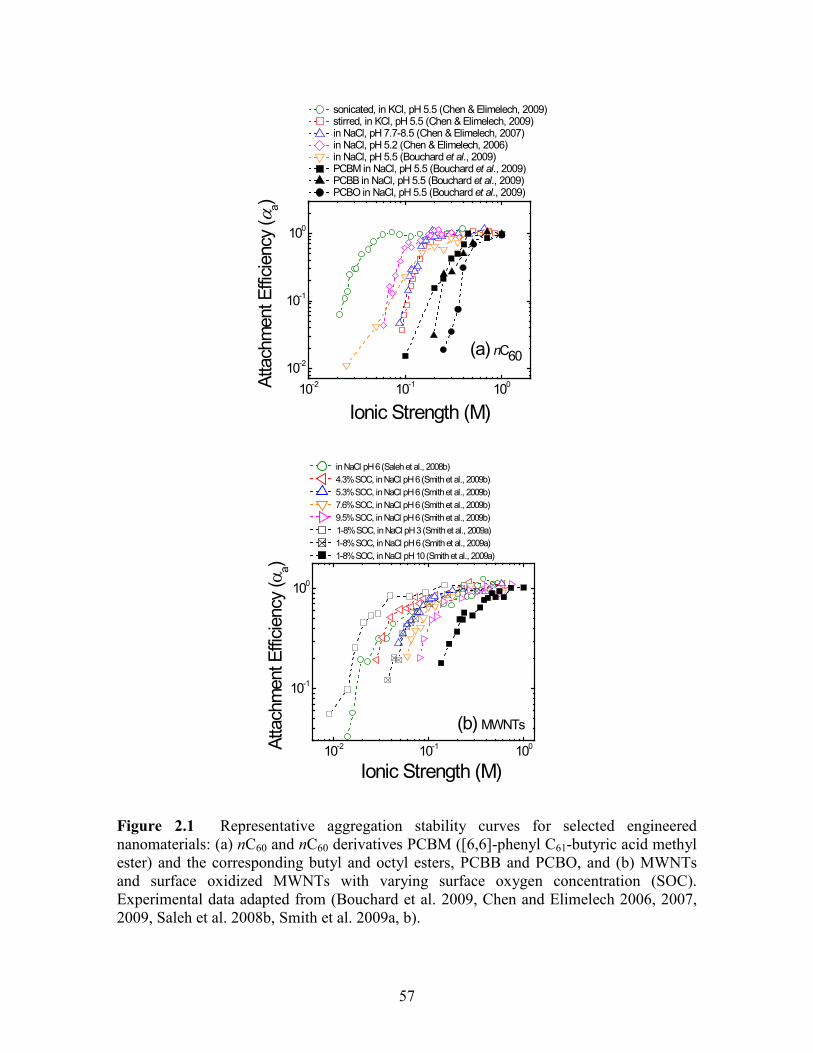
57
Figure 2.1 Representative aggregation stability curves for selected engineered nanomaterials: (a) nC60 and nC60 derivatives PCBM ([6,6]-phenyl C61-butyric acid methyl ester) and the corresponding butyl and octyl esters, PCBB and PCBO, and (b) MWNTs and surface oxidized MWNTs with varying surface oxygen concentration (SOC). Experimental data adapted from (Bouchard et al. 2009, Chen and Elimelech 2006, 2007, 2009, Saleh et al. 2008b, Smith et al. 2009a, b).
10-2 10-1 100
10-2
10-1
100
sonicated, in KCl, pH 5.5 (Chen & Elimelech, 2009) stirred, in KCl, pH 5.5 (Chen & Elimelech, 2009) in NaCl, pH 7.7-8.5 (Chen & Elimelech, 2007) in NaCl, pH 5.2 (Chen & Elimelech, 2006) in NaCl, pH 5.5 (Bouchard et al., 2009) PCBM in NaCl, pH 5.5 (Bouchard et al., 2009) PCBB in NaCl, pH 5.5 (Bouchard et al., 2009) PCBO in NaCl, pH 5.5 (Bouchard et al., 2009)
Atta
chm
ent E
fficie
ncy
(αa)
Ionic Strength (M)
(a) nC60
10-2 10-1 100
10-1
100
in NaCl pH 6 (Saleh et al., 2008b) 4.3% SOC, in NaCl pH 6 (Smith et al., 2009b) 5.3% SOC, in NaCl pH 6 (Smith et al., 2009b) 7.6% SOC, in NaCl pH 6 (Smith et al., 2009b) 9.5% SOC, in NaCl pH 6 (Smith et al., 2009b) 1-8% SOC, in NaCl pH 3 (Smith et al., 2009a) 1-8% SOC, in NaCl pH 6 (Smith et al., 2009a) 1-8% SOC, in NaCl pH 10 (Smith et al., 2009a)
Atta
chm
ent E
fficie
ncy
(αa)
Ionic Strength (M)
(b) MWNTs
58
2.7.2 LABORATORY STUDIES EXAMINING THE DEPOSITION OF ENGINEERED NANOMATERIALS
To date, laboratory studies examining the transport and deposition of engineered
nanomaterials in aqueous environments have been performed using a variety of materials,
including metallic, metal oxide, carbon-based, and semi-conductor based particles. These
studies are summarized in Table 2.3, listing the type of experimental approach used in
each study, as well as the solution chemistry, and collector and particle surface properties.
The key findings of each study are also included. The summary presented suggests that it
is not straightforward to draw conclusions from the transport studies performed thus far.
Even when considering one type of particle, several factors complicate comparison
between studies. These include variability in particle size and concentration, water
chemistry (i.e., electrolyte species, ionic strength, and pH), flow velocity, and choice of
collector surface. Moreover, given the importance of particle surface properties, direct
comparisons between experiments involving bare and surface-modified nanoparticles are
difficult to make.
Column studies are currently the most commonly used technique to elucidate
nanoparticle deposition behavior. Experiments in columns packed with glass beads have
indicated that SWNTs are mobile (Lecoanet et al. 2004). Additionally, carboxylated
SWNT transport in packed sand columns generally follows the behavior expected from
DLVO theory, with straining limiting mobility at low ionic strength (Jaisi et al. 2008). A
number of column studies have been performed to analyze the transport and retention of
nC60, employing glass beads, sand, and soil (Brant et al. 2005, Cheng et al. 2005,
Espinasse et al. 2007, Lecoanet and Wiesner 2004, Li et al. 2008, Wang et al. 2008a, b).
At low ionic strength (3 mM), and in the presence of coarser sand (d50=335 μm), nC60

59
elutes from packed sand columns with little retention. However, when finer sand
(d50=125 μm) and higher solution ionic strengths (30 mM) are encountered, a majority of
the nanoparticles are retained (Wang et al. 2008b). In packed soil columns, nC60 are most
mobile at higher flow velocities (11.4 and 3.8 m/day), with only limited nanoparticle
mobility and extremely rapid deposition encountered at a lower flow velocity (0.38
m/day) representative of groundwater flow (Cheng et al. 2005). Clearly, the choice of
granular material, solution chemistry, and flow velocity all play major roles in
nanoparticle deposition.

60
Table 2.3 Summary of Laboratory Studies on Nanoparticle Deposition
Nanoparticle Type Deposition System Particle Size and Concentration Collector Surfaces Solution Chemistry Main Findings and Conclusions References
n Al packed column H: 16 cm, D: 1.5 cm
d* = 100 nm large 1-10 µm agglomerates C = 50 mg/L
quartz sand d = n/a
0.01M NaCl, pH 4, 7 Greater mobility at pH 4; cumulative n Al mass in column leachate increases constantly for carboxylate ligand coated particles
Doshi et al. 2008
alumoxane packed column H: 9.25 cm, D: 2.5 cm
dDLS = 74 nm C = 10 mg/L
glass beads d = 300-425 µm (d50 = 355 µm)
0.01 M NaCl, pH 7 High mobility; > 80% passage Lecoanet et al. 2004
n B packed column H: 15 cm, D: 1.5 cm
d* = 10-20 nm dTEM = 25 nm dDLS varies with pH C = 50 mg/L
quartz sand d = 212-270 µm (d50 = 250 µm)
0.01-0.4 M NaCl, pH 5.6
Attachment efficiency increases with increasing IS up until 0.2 M; heightened [n B] in effluent with increasing flow velocity
Liu et al. 2009
n CeO2 model wastewater treatment plant (biological treatment only)
dXDC,TEM = 20-100 nm C = 100 ppm ± dispersing agents
fresh, stabilized clearing sludge 1.5-2.5 g/L dry content
nCeO2, synthetic wastewater and drinking water mixed into aeration chamber, pH 8-8.5
Significant portion of n CeO2 cleared via adsorption to bacteria (aggregate formation); high unagglomerated n CeO2
levels in outflow
Limbach et al. 2008
n CuO 2-D flow cell L*: 11.3 cm
dELS = 118-637 nm d50 = 372 nm C = 9 mg/L ± SDS
etched glass d = 0.87 mm
0.01 M NaCl, pH 7 n CuO aggregates form within porous medium; velocity affects aggregate deposition density and location; SDS enhances particle elution
Jeong & Kim, 2009
ferroxane packed column H: 9.25 cm, D: 2.5 cm
dDLS = 303 nm C = 10 mg/L
glass beads d = 300-425 µm (d50 = 355 µm)
0.01 M NaCl, pH 7 Least mobile of 8 nanoparticles tested in study; mobility appears to decrease with time
Lecoanet et al. 2004
n C60 packed column H: 9.25 cm, D: 2.5 cm
dDLS,TEM = 19, 135, 168 nm C = 10 mg/L
glass beads d50 = 355 µm
0.001, 0.1 M NaCl, pH 7 Increased deposition with increasing IS; repulsive interactions between EDLs key to n C60 stability in suspension
Brant et al. 2005
n C60 QCM dDLS = 50.5 nm C = 5.8 mg/L
silica surface (bare or coated)
1-100 mM NaCl, pH 5.5 0.3-3 mM CaCl2, pH 5.5
Behavior consistent with DLVO theory; humic acid and alginate decrease deposition rate due to steric repulsion
Chen and Elimelech, 2008
n C60 QCM-D dDLS = 55.7 nm C ~ 3 mg/L
silica surface (bare or coated)
1-300 mM NaCl, pH 5.2 0.1-1.0 mM CaCl2, pH 5.2
Above CCC, rate of deposition decreases as a result of concurrent n C60 aggregation
Chen and Elimelech, 2006
n C60 packed column H: 5 cm, D: 0.9 cm
dTEM ~ 100 nm C = 48 mg/L
Lula soil (92% sand, 6% silt, 2% clay) d50 ~ 250 µm
0.02M (NaCl + NaN3), pH 6.7-7.2
n C60 particles most mobile at higher velocities; column ripening possibly observed at low velocity
Cheng et al. 2005
n C60 packed column H: 6.3 cm, D: 2.65 cm
TTA/nC60: dDLS = 92 nm C = 1.26 ppm THF/nC60: dDLS = 111 nm C = 2.34 ppm
glass beads d50 = 360 µm
0.01-0.6 M NaCl ± TA, alginate, pH 6.5-7.5 other electrolytes considered
Increased deposition with increasing IS and decreasing velocity; transport affected by preparation method
Espinasse et al. 2007
n C60 packed column H: 4.3 cm, D: 1.6 cm
dDLS = 101 nm C = 65 ± 5 µg (pulse injection)
natural soil (58% sand, 29% clay, 13% silt) d = 420-1000 µm
KCl (selected IS to compare with SWNT studies) pH 5.6-5.8
Compared to SWNT transport in soil packed columns, fullerene deposition more sensitive to IS; exhibits lower deposition rates
Jaisi & Elimelech, 2009
n C60 packed column H: 9.25 cm, D: 2.5 cm
dDLS = 168 nm C = 10 mg/L
glass beads d = 300-425 µm (d50 = 355 µm)
0.01 M NaCl, pH 7 Fullerenes experience greater retention than fullerols and SWNTs
Lecoanet et al. 2004

61
n C60 packed column H: 9.25 cm, D: 2.5 cm
dDLS = 168 nm C = 10 mg/L
glass beads d = 300-425 µm (d50 = 355 µm)
0.01 M NaCl, pH 7 Higher velocities alter breakthrough curve appearance but do not result in increased elution
Lecoanet & Wiesner, 2004
n C60 packed column H: 15 cm, D: 2.5 cm
dDLS = 120 nm C ~ 3 mg/L
Ottawa sand (4 fraction sizes) d50 = 125, 165, 355, 710 µm
3.065 mM (CaCl2 + NaHCO3), pH 7
Transport behavior not in agreement with DLVO theory; primary minimum deposition attributed to surface charge heterogeneities
Li et al. 2008
n C60 packed column H: 15 cm, D: 2.5 cm
dDLS = 95 nm C = 1-3 mg/L
Ottawa sand d50 = 360 µm glass beads d50 = 360 µm
DI water 1 mM CaCl2, pH 7
Transport and deposition behavior consistent with batch retention data and DLVO theory
Wang et al. 2008
n C60 packed column H: 15 cm, D: 2.5 cm
dDLS = 92 nm (stock) C ~ 3 mg/L
quartz sand d50 = 125, 335 µm
3, 30 mM NaCl, pH 7 3, 30 mM CaCl2, pH 7
Little n C60 retention observed in coarser sand at low IS; > 95% retention at high IS with finer sand (regardless of electrolyte)
Wang et al. 2008
fullerols C60(OH)n
packed column H: 6.3 cm, D: 2.65 cm
dDLS = 120 nm C = 18 mg/L
glass beads d50 = 360 µm
0.01-0.3 M NaCl, pH 6.5-7.5 Increased α d with increasing IS Espinasse et al. 2007
fullerols C60(OH)n
packed column H: 9.25 cm, D: 2.5 cm
d* = 1.2 nm C = 10 mg/L
glass beads d = 300-425 µm (d50 = 355 µm)
0.01 M NaCl, pH 7 Fullerols have little affinity for porous media Lecoanet et al. 2004
fullerols C60(OH)n
packed column H: 9.25 cm, D: 2.5 cm
d* = 1.2 nm C = 10 mg/L
glass beads d = 300-425 µm (d50 = 355 µm)
0.01 M NaCl, pH 7 Extremely low attachment levels; 99% passage achieved at two different flow velocities
Lecoanet & Wiesner, 2004
Pd-n ZVI subsurface delivery test site 4.5 x 3.0 m, 6 m deep
dSEM = 100-200 nm 1.7 kg nanoparticles injected
aquifer hydraulic conductivity = 0.2 cm/s groundwater present = 14.1 m3
groundwater: pH 4.6-5.2 prior to injection pH 5.1-7.7 post injection
Pd-n ZVI behavior in line with classical colloid transport concepts and reactions in porous media
Elliot & Zhang, 2001
Pd-n ZVI packed column H: 3.4 cm, D: 1 cm
bare particles: form dendritic flocs (TEM) CMC-stabilized particles: dTEM = 4.3 nm dDLS = 17.2 nm C = 1 g/L
soil (84% sand, 10% silt, 6% clay) d = n/a
particle suspensions, pH 6.8, 8.3 DI water to elute retained particles
CMC-stabilized particles well dispersed in soil; ~ 98% of stabilized Fe-Pd collected from eluent (no irreversible binding)
He et al. 2007
n ZVI packed column H: 71 ± 4 cm, D: 1.6 cm
dTEM = 50-100 nm C = 10 mg/mL
Ottawa sand d = 160 ± 45 µm
PAA + PSS + bentonite clay mixtures in water, pH = n/a
Particle elution dependent on electrolyte composition but not on total [poly(anion)]; higher PSS and lower PAA and clay concentrations result in highest elution
Hydutsky et al. 2007
n ZVI packed column H: 10 cm, D: 2.5 cm H: 50 cm, D: 6 cm
bare: dSEM = 10-160 nm surfactant stabilized: dTEM = 2-10 nm C = 1 g/L
glass beads sand (unbaked and baked) all collector types: d = 425-600 µm
0.01 M NaCl (± surfactant), pH 7
Adding surfactant, breakthrough occurs earlier in column packed with glass beads; n ZVI is immobile in absence of surfactant
Kanel et al. 2007
n ZVI 2-D physical model L*: 50 cm, W: 2 cm, H: 28.5 cm
size = n/a C = 4 g/L
silica beads d50 = 1,100 ± 100 µm
freshwater steady-state flow pH = n/a
Nonstabilized n ZVI not transported; PAA-n ZVI transported with negligible retardation; transport influenced by density gradients
Kanel et al. 2008
n ZVI packed column H: 25.5 cm, D: 1.1 cm
3 particle fractions prepared DLS size distributions determined C = 0.03-6 g/L
quartz sand d50 = 300 µm
10 mM (NaCl + NaHCO3), pH 8
At 0.03 g/L concentration, all modified n ZVI particles mobile; at higher concentrations, larger particles with higher Fe0 content experience heightened deposition
Phenrat et al. 2009
n ZVI packed column (+ QCM-D) H: 60 cm, D: 1.1 cm
bare: dDLS = 146 nm Triblock co-polym mod.: dDLS = 212 nm PA mod.: dDLS = 66 nm SDBS mod.: dDLS = 190 nm C = 30 mg/L
quartz sand d50 = 300 µm
1-1000 mM NaCl, pH 7.7 0.1-50 mM CaCl2, pH 7.7
Bare n ZVI was immobile, while both PA and SDBS-modified particles mobile at lower IS; triblock co-polymer-modified particles have greatest mobility
Saleh et al. 2008
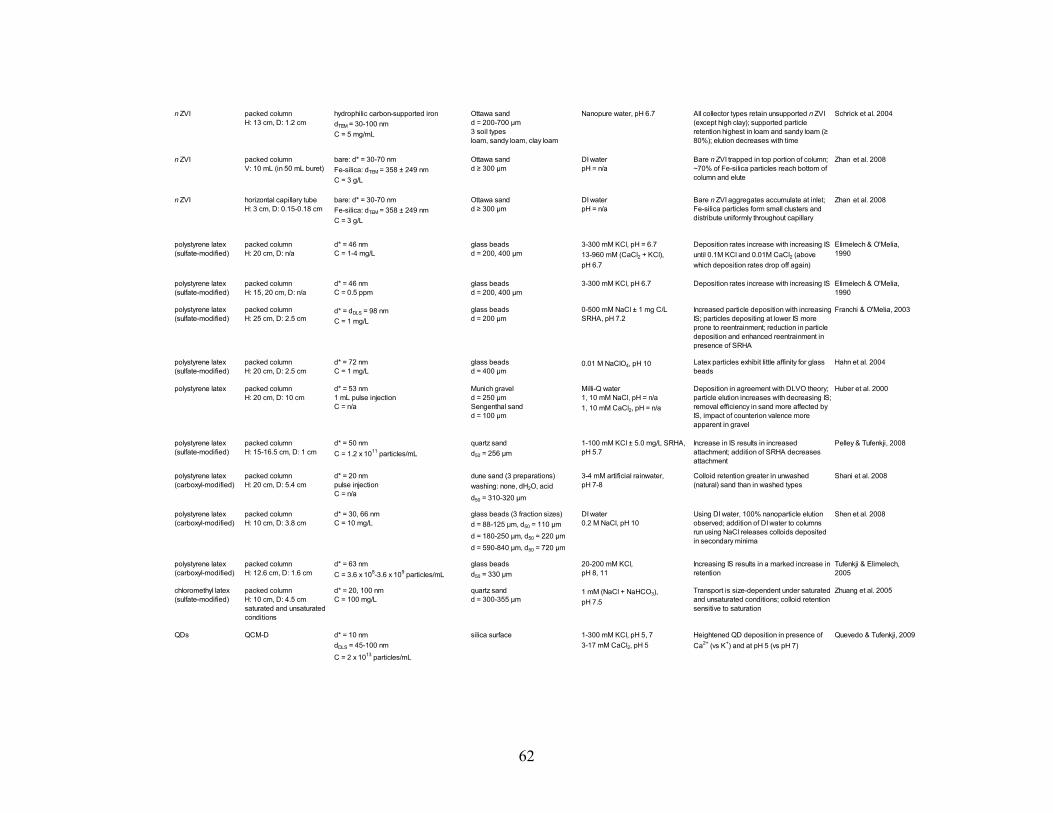
62
n ZVI packed column H: 13 cm, D: 1.2 cm
hydrophilic carbon-supported iron dTEM = 30-100 nm C = 5 mg/mL
Ottawa sand d = 200-700 µm 3 soil types loam, sandy loam, clay loam
Nanopure water, pH 6.7 All collector types retain unsupported n ZVI (except high clay); supported particle retention highest in loam and sandy loam (≥ 80%); elution decreases with time
Schrick et al. 2004
n ZVI packed column V: 10 mL (in 50 mL buret)
bare: d* = 30-70 nm Fe-silica: dTEM = 358 ± 249 nm C = 3 g/L
Ottawa sand d ≥ 300 µm
DI water pH = n/a
Bare n ZVI trapped in top portion of column; ~70% of Fe-silica particles reach bottom of column and elute
Zhan et al. 2008
n ZVI horizontal capillary tube H: 3 cm, D: 0.15-0.18 cm
bare: d* = 30-70 nm Fe-silica: dTEM = 358 ± 249 nm C = 3 g/L
Ottawa sand d ≥ 300 µm
DI water pH = n/a
Bare n ZVI aggregates accumulate at inlet; Fe-silica particles form small clusters and distribute uniformly throughout capillary
Zhan et al. 2008
polystyrene latex (sulfate-modified)
packed column H: 20 cm, D: n/a
d* = 46 nm C = 1-4 mg/L
glass beads d = 200, 400 µm
3-300 mM KCl, pH = 6.7 13-960 mM (CaCl2 + KCl), pH 6.7
Deposition rates increase with increasing IS until 0.1M KCl and 0.01M CaCl2 (above which deposition rates drop off again)
Elimelech & O'Melia, 1990
polystyrene latex (sulfate-modified)
packed column H: 15, 20 cm, D: n/a
d* = 46 nm C = 0.5 ppm
glass beads d = 200, 400 µm
3-300 mM KCl, pH 6.7 Deposition rates increase with increasing IS Elimelech & O'Melia, 1990
polystyrene latex (sulfate-modified)
packed column H: 25 cm, D: 2.5 cm
d* = dDLS = 98 nm C = 1 mg/L
glass beads d = 200 µm
0-500 mM NaCl ± 1 mg C/L SRHA, pH 7.2
Increased particle deposition with increasing IS; particles depositing at lower IS more prone to reentrainment; reduction in particle deposition and enhanced reentrainment in presence of SRHA
Franchi & O'Melia, 2003
polystyrene latex (sulfate-modified)
packed column H: 20 cm, D: 2.5 cm
d* = 72 nm C = 1 mg/L
glass beads d = 400 µm
0.01 M NaClO4, pH 10 Latex particles exhibit little affinity for glass beads
Hahn et al. 2004
polystyrene latex packed column H: 20 cm, D: 10 cm
d* = 53 nm 1 mL pulse injection C = n/a
Munich gravel d = 250 µm Sengenthal sand d = 100 µm
Milli-Q water 1, 10 mM NaCl, pH = n/a 1, 10 mM CaCl2, pH = n/a
Deposition in agreement with DLVO theory; particle elution increases with decreasing IS; removal efficiency in sand more affected by IS, impact of counterion valence more apparent in gravel
Huber et al. 2000
polystyrene latex (sulfate-modified)
packed column H: 15-16.5 cm, D: 1 cm
d* = 50 nm C = 1.2 x 10¹¹ particles/mL
quartz sand d50 = 256 µm
1-100 mM KCl ± 5.0 mg/L SRHA, pH 5.7
Increase in IS results in increased attachment; addition of SRHA decreases attachment
Pelley & Tufenkji, 2008
polystyrene latex (carboxyl-modified)
packed column H: 20 cm, D: 5.4 cm
d* = 20 nm pulse injection C = n/a
dune sand (3 preparations) washing: none, dH2O, acid d50 = 310-320 µm
3-4 mM artificial rainwater, pH 7-8
Colloid retention greater in unwashed (natural) sand than in washed types
Shani et al. 2008
polystyrene latex (carboxyl-modified)
packed column H: 10 cm, D: 3.8 cm
d* = 30, 66 nm C = 10 mg/L
glass beads (3 fraction sizes) d = 88-125 µm, d50 = 110 µm d = 180-250 µm, d50 = 220 µm d = 590-840 µm, d50 = 720 µm
DI water 0.2 M NaCl, pH 10
Using DI water, 100% nanoparticle elution observed; addition of DI water to columns run using NaCl releases colloids deposited in secondary minima
Shen et al. 2008
polystyrene latex (carboxyl-modified)
packed column H: 12.6 cm, D: 1.6 cm
d* = 63 nm C = 3.6 x 10⁸-3.6 x 10⁹ particles/mL
glass beads d50 = 330 µm
20-200 mM KCl, pH 8, 11
Increasing IS results in a marked increase in retention
Tufenkji & Elimelech, 2005
chloromethyl latex (sulfate-modified)
packed column H: 10 cm, D: 4.5 cm saturated and unsaturated conditions
d* = 20, 100 nm C = 100 mg/L
quartz sand d = 300-355 µm
1 mM (NaCl + NaHCO3), pH 7.5
Transport is size-dependent under saturated and unsaturated conditions; colloid retention sensitive to saturation
Zhuang et al. 2005
QDs QCM-D d* = 10 nm dDLS = 45-100 nm
C = 2 x 10¹³ particles/mL
silica surface 1-300 mM KCl, pH 5, 7 3-17 mM CaCl2, pH 5
Heightened QD deposition in presence of Ca2+ (vs K+) and at pH 5 (vs pH 7)
Quevedo & Tufenkji, 2009

63
nS iO2 packed column H: 9.25 cm, D: 2.5 cm
2 particle sizes type 1: dDLS = 57 nm, d* = 47 nm type 2: dDLS = 135 nm, d* = 103 nm C = 10 mg/L
glass beads d = 300-425 µm (d50 = 355 µm)
0.01 M NaCl, pH 7 Smaller silica particles very mobile with low affinity for collector; heightened retention with larger particles
Lecoanet et al. 2004
nS iO2 packed column H: 9.25 cm, D: 2.5 cm
dDLS = 57 nm C = 10 mg/L
glass beads d = 300-425 µm (d50 = 355 µm)
0.01 M NaCl, pH 7 Very low retention; flow rate has no significant impact on silica removal
Lecoanet & Wiesner, 2004
SWNTs packed column H: 6.3 cm, D: 1.6 cm
dRS = 0.9-1.6 nm C = 87 mg/L
quartz sand d = 225-300 µm (d50 = 263 µm) (bare and silanized)
0.1-55 mM KCl ± 5 mg/L SRHA, pH 7.0 10 mM (KCl + CaCl2) ± 5 mg/L SRHA, pH 7.0
Results consistent with DLVO theory; SWNT straining restricts mobility at low IS
Jaisi et al. 2008
SWNTs packed column H: 4.3 cm, D: 1.6 cm
dDLS = 244 nm 7-125 µg (pulse injection)
soil (58% sand, 29% clay, 13% silt) d = 420-1000 µm
0.1-100 mM KCl, pH 5.6-5.8 0.03-10 mM CaCl2, pH 5.6-5.8
High retention with little change above 0.3 mM KCl or 0.1 mM CaCl2; physical straining plays important role in SWNT deposition
Jaisi & Elimelech, 2009
SWNTs packed column H: 9.25 cm, D: 2.5 cm
d* = 0.7-1.1 nm L* = 80-200 nm dDLS = 21 nm C = 10 mg/L
glass beads d = 300-425 µm (d50 = 355 µm)
0.01 M NaCl, pH 7 SWNTs show little affinity for porous media Lecoanet et al. 2004
SWNTs packed column H: 9.25 cm, D: 2.5 cm
d* = 0.7-1.1 nm L* = 80-200 nm dDLS = 21 nm C = 10 mg/L
glass beads d = 300-425 µm (d50 = 355 µm)
0.01 M NaCl, pH 7 Extremely low attachment; increased velocity alters breakthrough curve appearance
Lecoanet & Wiesner, 2004
MWNTs packed column H: 10 cm, D: 5 cm
dTEM = 7-70 nm L*SEM = 100 nm-2 µm, avg. 407 nm C = 100 mg/L
quartz sand d50 = 476 µm glass beads d = 425-500 µm
10 mM solution (NaHCO3 + Na2CO3 + NaBr or NaCl), pH 10 0.1 mM NaOH solution, pH 10
Breakthrough curves at 43, 21 and 4.0 m/d similar, with time-dependent C/Co; particle mobility likely enhanced beyond critical pore water velocity
Liu et al. 2009
SWNTs & MWNTs packed column H: 15 cm, D: 2.5 cm
SWNTs: d* = 1.4 nm MWNTs: d* = 35 ± 10 nm C = n/a
quartz sand d50 = 350 µm
0.01-10 mM KCl 0.01-10 mM CaCl2
pH = n/a
Filtration of MWNTs higher than SWNTs; straining insignificant
Wang et al. 2008
n TiO2 soil cell H: 1.27 cm, D: 2.54 cm
d* = 21 nm dDLS = 123.2 ± 7.6 nm C = 25 mg/L
glass beads d = 500 µm
0.2 mM NaCl, pH 10 Considers unsaturated n TiO2 transport; increased retention with decreasing saturation and slower drainage rates
Chen et al. 2008
n TiO2 packed column H: 30 cm, D: 1.5 cm
dAFM < 0.1µm C = 50, 75, 100 mg/L
quartz sand d50 = 200 µm
0.01 M NaCl, pH 4.5 Very high particle retention; existing models limited in ability to predict n TiO2 behavior
Choy et al. 2008
n TiO2 pyrex wafers (2-D microchannel model) L*: 7.0 cm, W: 3.0 cm, H: 87-92 µm
dXRD = 5-12 nm dDLS depends on pH C = 0.07-0.14 g/L
pyrex d = 700 µm
hydrolysis synthesis solution, pH 1, 3, 7, 10, 12
Suspended nanoparticle aggregates very mobile; lower mobility seen at pH 3 and 7 (aggregates settle at pH 7)
Guzman et al. 2006
n TiO2 packed column H: 10 cm, D: 2.5 cm
d* = 35 nm C = 2 g/L
12 surface soil types d50 = 30-132 µm
0.15-4.95 mM soil suspensions, pH 6.2-8.6
n TiO2 most mobile in soil solutions with larger grain diameters and lower IS; heightened retention with increasing clay content and salinity
Fang et al. 2009
n TiO2 QCM-D d* = 5 nm dDLS = 350-750 nm dFCS = 7-189 nm dAFM = 30 nm dTEM ~ 30 nm with larger aggregates C = 10 mg/L
silica surface 1-200 mM NaNO3, pH 3, 5, 9 1-100 mM Ca(NO3)2, pH 3, 9
Strong attractive electrostatic interactions between silica and n TiO2 at pH 3, 5 and at low IS; generally good agreement with DLVO theory (at pH 3 and 9)
Fatisson et al. 2009

64
Note: d* and L* are diameters and lengths provided by particle suppliers.
n TiO2 packed column H: 10 cm, D: 1.1 cm
d* = 10 nm bare: dTEM = 14 ± 1 nm CMC-modified: dTEM = 15 ± 1 nm dDLS varies with solution chemistry C = 20 mg/L
quartz sand d50 = 290 µm ± aluminum or iron hydroxide coating
ultrapure water 1, 30 mM NaCl, pH 5.5-7.6 30 mM CaCl2, pH 7.1
CMC coating greatly enhances mobility (bare n TiO2 is immobile)
Joo et al. 2009
n TiO2 packed column H: 9.25 cm, D: 2.5 cm
d* = 40 nm dDLS = 198 nm C = 10 mg/L
glass beads d = 300-425 µm (d50 = 355 µm)
0.01 M NaCl, pH 7 n TiO2 exhibits greater retention than alumoxane but more mobile than ferroxane; mobility slightly increasing with time
Lecoanet et al. 2004
n TiO2 packed column H: 9.25 cm, D: 2.5 cm
d* = 40 nm dDLS = 198 nm C = 10 mg/L
glass beads d = 300-425 µm (d50 = 355 µm)
0.01 M NaCl, pH 7 Decreased n TiO2 retention at higher Darcy velocities
Lecoanet & Wiesner, 2004
n TiO2 packed column H: 100 cm, D: 1.27 cm
d* = 40-60 nm (before functionalization) Injected as ~ 60 wt% aqueous slurry
quartz sand 20-30 mesh
~ 60 wt% n TiO2 aqueous slurry + 2% ammonium carboxylate, pH = n/a
Functionalized n TiO2 distributed uniformly throughout column, Cu-EDA functionalized n TiO2 candidate for groundwater treatment
Mattigod et al. 2005
65
Packed column studies have demonstrated that the transport behavior of nC60
particles is in good qualitative agreement with DLVO theory (Li et al. 2008, Wang et al.
2008b). In addition to packed-bed column studies, the QCM has been employed to
examine nanoparticle deposition onto and release from surfaces in aquatic environments
(Chen and Elimelech 2006, 2008, Fatisson et al. 2009, Quevedo and Tufenkji 2009).
QCM studies indicate that nC60 deposition behavior is generally consistent with DLVO
theory (Chen and Elimelech 2006, 2008).
Several studies have also reported the deposition behavior of inorganic
nanoparticles (Table 2.3). Bare and surface-modified nAl have demonstrated dissimilar
deposition behaviors, even though the core material remains the same (Doshi et al. 2008).
Column studies with nZVI also indicate that surface modifications alter nanoparticle
deposition behavior (Saleh et al. 2007). A field study involving the injection of bimetallic
(Fe/Pd) nanoparticles at a contaminated test site found particle behavior to be in general
agreement with classical colloid transport concepts (Elliott and Zhang 2001). QCM
studies have established that the deposition behavior of bare and surface-modified nZVI
onto silica surfaces is very different, as particles modified with an amphiphilic triblock
copolymer were found to exhibit significantly heightened mobility. QCM data obtained in
this study corresponds with column transport results (Saleh et al. 2007). However, in
these studies, surface-modified nZVI deposition was not in qualitative agreement with
DLVO theory.
Several studies have examined the transport potential of nTiO2 in saturated
granular porous media (Choy et al. 2008, Lecoanet et al. 2004, Lecoanet and Wiesner
2004). nTiO2 retention in packed sand columns has been found to be high regardless of
particle concentrations and flow velocities (Choy et al. 2008). Additionally, it appears
66
that distinct transport processes likely occur at different column depths. Attempting to
predict titania retention within packed sand columns utilizing an empirical kinetic
transport model has indicated that existing models cannot predict nTiO2 particle retention
(Choy et al. 2008). nTiO2 transport has been found to depend on both particle surface
potential and particle aggregate size (Guzman et al. 2006). Micromodel flow cell analysis
of nTiO2 transport and retention over a wide range of solution chemistries has been
conducted (Guzman et al. 2006). While the largest titania aggregate sizes are encountered
at pH values closest to the pHzpc, these aggregates have been found to remain highly
mobile. QCM deposition behavior of nTiO2 onto silica was found to be in good
qualitative agreement with DLVO theory (Fatisson et al. 2009). Working in a similar
system with QD suspensions, heightened deposition is observed in the presence of
divalent cations versus monovalent cations, with QD aggregation resulting in lowered
deposition rates at higher ionic strengths (Quevedo and Tufenkji 2009).
Although it is not straightforward to compare the results of deposition studies
conducted with various engineered nanomaterials under dissimilar experimental
conditions (e.g., solution chemistry, collector surfaces, and nanoparticle preparation
methods), Figure 2.2 presents a direct comparison of data obtained in different
laboratories with a wide range of nanomaterials. The deposition stability curves in Figure
2.2 show that nanoparticles of very dissimilar composition (e.g., nB and sulfate modified
latex (SML)) can exhibit comparable deposition behavior. It is interesting to note that
much of the experimental data falls in a given region of the plot and exhibits an increase in
αd with increasing ionic strength. SWNTs generally experience greater retention in
granular media, likely due to the influence of physical straining as discussed above. The
solid black circles, squares and triangles in Figure 2.2 represent data obtained using nZVI

67
with differing surface modifications. These nanomaterials generally exhibit greater
stability as a result of steric stabilization imparted by their polymer coatings. Similar to
the conclusion drawn from inspection of Figure 2.1, the data in Figure 2.2 shows that the
deposition of engineered nanomaterials also generally follows the classical behavior of
colloids, with the exception of those particles that experience additional mechanisms such
as steric stabilization or physical straining.
Figure 2.2 Representative deposition stability curves for selected engineered nanomaterials, including nB, nC60, carboxyl-modified latex (CML), sulfate-modified latex (SML), nZVI, and SWNTs. Experimental data adapted from (Elimelech and O'Melia 1990a, Espinasse et al. 2007, Franchi and O'Melia 2003, Jaisi et al. 2008, Liu et al. 2009, Pelley and Tufenkji 2008, Saleh et al. 2008a, Tufenkji and Elimelech 2005).
10-4 10-3 10-2 10-1 100
10-4
10-3
10-2
10-1
100
Atta
chm
ent E
fficie
ncy
(αd)
Ionic Strength (M)
nB in NaCl, pH~5.6 (Liu et al., 2009) TTA-nC60 in NaCl, pH~7 (Espinasse et al., 2007) TTA-nC60 in NaNO3, pH~7 (Espinasse et al., 2007) 46 nm CML in KCl, pH 6.7 (Elimelech & O'Melia, 1990a) 121 nm CML in KCl, pH 6.7 (Elimelech & O'Melia, 1990a) 63 nm CML in KCl, pH 8 (Tufenkji & Elimelech, 2005) 63 nm CML in KCl, pH 11 (Tufenkji & Elimelech, 2005) 50 nm SML in NaCl, pH 7.2 (Franchi & O'Melia, 2003) 50 nm SML in NaCl, pH 5.7 (Pelley & Tufenkji, 2008) 110 nm SML in NaCl, pH 5.7 (Pelley & Tufenkji, 2008) SDBS-nZVI in NaCl, pH 7.7 (Saleh et al., 2008a) PMAA...-nZVI in NaCl, pH 7.7 (Saleh et al., 2008a) PA-nZVI in NaCl, pH 7.7 (Saleh et al., 2008a) SWNT in KCl, pH 7 (Jaisi et al., 2008)

68
2.8 CHALLENGES IN QUANTIFYING NANOPARTICLE DEPOSITION AND AGGREGATION IN THE ENVIRONMENT
Contemporary reviews and viewpoints have touched upon the challenges
associated with characterizing nanomaterials in environmental settings. Many of these
same challenges apply when considering nanoparticle aggregation and deposition in
natural settings, given that in-depth particle characterization is required to fully understand
particle mobility. Generally, difficulties arise due to a lack of analytical tools capable of
characterizing and quantifying particles in complex environmental matrices. As a result,
most deposition and aggregation studies have been conducted with simplified model
laboratory systems. However, while providing important insights, particle behavior in
model laboratory systems might not be representative of that observed in far more
complex natural environments.
Nanoparticle transport, persistence, and bioavailability in the environment are
essential aspects to consider in assessing and managing risks (Wiesner et al. 2009).
Factors such as microorganisms, naturally-occurring colloids and organic matter,
biomacromolecules (e.g., proteins and polysaccharides), sunlight, and oxidants/reductants
will complicate particle behavior in natural environments (Klaine et al. 2008, Wiesner and
Bottero 2007), likely resulting in deviations from laboratory-scale experimental
observations. Nanoparticles undergoing aggregation will sediment, thus becoming far less
mobile. These aggregates may be ingested by organisms, potentially making their way
into food chains (Wiesner and Bottero 2007). The impact that biota such as biofilms and
invertebrates have on particle behavior remains unclear and must also be considered in
natural settings (Klaine et al. 2008).
69
Along with engineered nanoparticles, naturally occurring nanoparticles can also be
found in the environment (Wiesner et al. 2009). Unintentional or incidental nanoparticles
are a third source, and can originate from combustion, weathering, and oxidation
processes among others (Farré et al. 2009, Wiesner et al. 2009). When dealing with
engineered, natural, and incidental nanoparticles simultaneously, establishing the source
for any given particle is complicated (Burleson et al. 2004). Additionally, background
levels of certain elements (e.g., iron) in the environment may be significant (Klaine et al.
2008). As a result, differentiating between the background elements and the engineered
nanoparticles becomes a necessary and complicated task.
A majority of the aggregation and deposition studies conducted thus far have
involved bare, non-functionalized nanomaterials. However, nanoparticles released into
the environment may be either matrix bound or functionalized, thus altering their behavior
(Nowack and Bucheli 2007). In the aim of understanding and predicting nanoparticle fate
in aqueous environments, an in-depth characterization of particle surfaces following
functionalization is necessary. A review describing the experimental methods available
for analyzing nanoparticle surface chemistry and structure following intentional surface
modification has been compiled (Chen et al. 2010). Regardless of prior characterization,
additional particle modifications and chemical transformations can also occur upon release
into the environment (Wiesner and Bottero 2007). For example, particles may undergo
redox reactions or become coated with organic matter (Wiesner et al. 2009). Organic
matter alters surface charge, thus affecting particle stability and aggregate size. Bridging
due to the adsorption of certain polymers onto particle surfaces can result in heightened
aggregation. Both chemical and biological processes may result in inadvertent surface

70
functionalization (Farré et al. 2009). On the other hand, such processes may wear down or
alter existing surface functionality and particle coatings.
Environmental measurements are complex, with trace amounts of particles
dispersed in a highly heterogeneous matrix. Currently, environmental nanomaterial
concentrations, along with particle distribution and physicochemical data in natural
settings, remain largely unavailable (Gottschalk et al. 2009, Klaine et al. 2008). Analytical
tools enabling the quantification of nanomaterials in multifaceted environmental matrices
must be developed in order to better understand particle behavior. While techniques
capable of identifying nanoparticles in sediments are available, they are incapable of
quantifying the particles (Farré et al. 2009). Quantification will be further hindered by
spatial and temporal variations in concentration (Klaine et al. 2008). In the absence of
appropriate tools, recent studies have modeled predicted environmental concentrations as
a substitute (Gottschalk et al. 2009, Mueller and Nowack 2008).
Along with information regarding particle concentration, additional properties
such as the size distribution must be determined to fully comprehend the aggregation and
deposition processes. A recent review by Tiede et al. (Tiede et al. 2008) provides a
detailed summary of the analytical tools currently available for nanoparticle
characterization. While various characterization techniques can be employed, only a
handful can deal with multifaceted environmental samples. Such samples present an
assortment of elemental constituents and can potentially include multiple nanoparticle
types. To further complicate matters, particles will likely be polydispersed in natural
settings, making particle size determination more difficult. The nanoparticles encountered
may also be in the dissolved, colloidal and particulate phases (Klaine et al. 2008, Tiede et
al. 2008).
71
Two key questions about nanoparticle aggregation and deposition were pointed out
in the Introduction section of the manuscript; namely, “How do specific particle and
environmental properties affect deposition and aggregation?”, and “Are the current
approaches and models used in quantifying colloidal interactions and transport
applicable to nanomaterials?”. This critical review begins to address these questions;
however, it is evident that our current understanding of nanoparticle deposition and
aggregation precludes a definitive unified answer. Although generalizations on the role of
specific particle and environmental properties cannot yet be established, a comprehensive
analysis of published studies (Figures 2.1 and 2.2, and Tables 2.2 and 2.3) reveals that
traditional DLVO theory can generally semi-quantitatively describe nanoparticle
aggregation and deposition behavior. However, certain particle properties can lead to
non-DLVO behavior. For instance, surface modifications such as polymer or surfactant
coatings can give rise to steric stabilization, resulting in decreased nanomaterial deposition
or aggregation. Moreover, unusual particle shapes, such as in the case of CNTs, can give
rise to additional capture mechanisms (e.g., straining) which result in unpredicted
nanomaterial transport patterns. Most common experimental and theoretical approaches
used for the evaluation of nanomaterial deposition and aggregation are applicable for
spherical particles. However, we have noted above certain limitations for non-spherical or
very small particles.

72
2.9 ACKNOWLEDGEMENTS
This research was supported by NSERC, McGill Engineering Doctoral Awards to
ARP and IQP, the Canada Research Chairs Program, and the U.S. NSF under Research
Grants CBET-0828795 and BES 0646247.
73
2.10 NOMENCLATURE
Symbols
A Hamaker constant
As porosity-dependent parameter of Happel’s model, ( ) wPAs /12 5−=
ac collector radius
ah hydrodynamic radius
ai, ap particle radius, i = 1, 2
b fluid envelope radius in Happel’s model, ( ) 3/11 ε−= cab
C effluent particle concentration
C0 influent particle concentration
C/C0 normalized effluent particle concentration
C(x,t) particle concentration at depth x and time t
D hydrodynamic dispersion coefficient
D∞ diffusion coefficient in an infinite medium, ( )pB aTkD πµ6=∞
dc average collector grain diameter
e electron charge, 1.602 ×10⁻¹⁹ C
FST steric force
f resonance frequency
g1(H) universal hydrodynamic function, g1(H) = 1/f1(H)
H dimensionless separation distance, H = h/ap
h surface-to-surface separation distance
hc height of parallel-plate chamber
KF pseudo-first order rate constant

74
kB Boltzmann constant, 1.3805×10⁻²³ J/K
kd particle deposition rate coefficient
kij perikinetic aggregation rate constant between dissimilar-size particles
kii perikinetic aggregation rate constant between equal-size particles
L bed depth
l film thickness
M magnetization
m mass
N0 initial particle number concentration
n0 ratio of total injected particles to volumetric flow rate
P ratio of ac/b, P= ( ) 3/11 −− ε
Pe Péclet number, ∞= DUaPe p /2
r radial coordinate
rd particle deposition rate
S(β) β function: Spielman and Friedlander (Spielman and Friedlander 1974)
s distance between polymer chains on a surface
t time
T absolute temperature
U approach (Darcy) velocity
v fluid interstitial velocity, ν = U/ε
VEDL electrical double-layer interaction energy
VM magnetic interaction energy
VST steric interaction energy

75
VVDW van der Waals interaction energy
maxV energy barrier height
VT total interaction energy
w porosity-dependent parameter, w = 2 – 3P + 3P5 – 2P6
W stability ratio
x distance from inlet (along flow)
y boundary layer coordinate perpendicular to collector
z counterion valence
Greek Symbols
αa aggregation attachment efficiency
αd deposition attachment efficiency
Γi dimensionless surface potential for particle or collector,
=
TkzeΓ
B
ii 4
tanh ψ
δD diffusion boundary layer thickness
δF electrical double-layer thickness
ε porosity
ε0 dielectric permittivity in vacuum, 8.85× 10⁻¹² F/m
εr relative dielectric permittivity of solution
ζ zeta potential
η single-collector removal efficiency
η0 overall single-collector contact efficiency
ηD single-collector contact efficiency for transport by diffusion

76
ηG single-collector contact efficiency for transport by gravity
ηI single-collector contact efficiency for transport by interception
κ inverse Debye length
λ characteristic wavelength
µ absolute viscosity of fluid
ψ surface potential

77
2.11 REFERENCES
Alargova, R.G., Deguchi, S. and Tsujii, K. (2001) Stable colloidal dispersions of fullerenes in polar organic solvents. Journal of The Americal Chemical Society 123(43), 10460-10467. Alexander, S. (1977) Adsorption of chain molecules with a polar head. A scaling description. Journal of Physics (Paris) 38(8), 983-987. Anderson, R. and Barron, A.R. (2005) Reaction of hydroxyfullerene with metal salts: A route to remediation and immobilization. Journal Of The American Chemical Society 127(30), 10458-10459. Andrievsky, G.V., Klochkov, V.K., Karyakina, E.L. and McHedlov-Petrossyan, N.O. (1999) Studies of aqueous colloidal solutions of fullerene C60 by electron microscopy. Chemical Physics Letters 300(3-4), 392-396. Auffan, M., Rose, J., Bottero, J.-Y., Lowry, G.V., Jolivet, J.-P. and Wiesner, M.R. (2009) Towards a definition of inorganic nanoparticles from an environmental, health and safety perspective. Nature Nanotechnology 4, 634-641. Bergström, L. (1997) Hamaker constants of inorganic materials. Advances in Colloid and Interface Science 70, 125-169. Bhattacharjee, S., Chen, J.Y. and Elimelech, M. (2000) DLVO interaction between spheroidal particles and a flat surface. Colloids and Surfaces A 165(1-3), 143-156. Bhattacharjee, S. and Elimelech, M. (1997) Surface element integration: A novel technique for evaluation of DLVO interaction between a particle and a flat plate. Journal of Colloid and Interface Science 193(2), 273-285. Bouchard, D., Ma, X. and Issacson, C. (2009) Colloidal properties of aqueous fullerenes: Isoelectric points and aggregation kinetics of C60 and C60 derivatives. Environmental Science & Technology 43(17), 6597-6603. Brant, J., Lecoanet, H. and Wiesner, M.R. (2005) Aggregation and deposition characteristics of fullerene nanoparticles in aqueous systems. Journal of Nanoparticle Research 7(4-5), 545-553. Burleson, D.J., Driessen, M.D. and Penn, R.L. (2004) On the characterization of environmental nanoparticles. Journal of Environmental Science and Health - Part A Toxic/Hazardous Substances and Environmental Engineering 39(10), 2707-2753. Byrd, T.L. and Walz, J.Y. (2005) Interaction force profiles between Cryptosporidium parvum oocysts and silica surfaces. Environmental Science and Technology 39(24), 9574-9582.

78
Chen, J.Y., Klemic, J.F. and Elimelech, M. (2002) Micropatterning microscopic charge heterogeneity on flat surfaces for studying the interaction between colloidal particles and heterogeneously charged surfaces. Nano Letters 2(4), 393-396. Chen, J.Y., Ko, C.H., Bhattacharjee, S. and Elimelech, M. (2001) Role of spatial distribution of porous medium surface charge heterogeneity in colloid transport. Colloids and Surfaces A: Physicochemical and Engineering Aspects 191(1-2), 3-15. Chen, K.L. and Elimelech, M. (2006) Aggregation and deposition kinetics of fullerene (C60) nanoparticles. Langmuir 22(26), 10994-11001. Chen, K.L. and Elimelech, M. (2007) Influence of humic acid on the aggregation kinetics of fullerene (C60) nanoparticles in monovalent and divalent electrolyte solutions. Journal of Colloid and Interface Science 309(1), 126-134. Chen, K.L. and Elimelech, M. (2008) Interaction of fullerene (C60) nanoparticles with humic acid and alginate coated silica surfaces: Measurements, mechanisms, and environmental implications. Environmental Science and Technology 42(20), 7607-7614. Chen, K.L. and Elimelech, M. (2009) Relating colloidal stability of fullerene (C60) nanoparticles to nanoparticle charge and electrokinetic properties. Environmental Science & Technology 43(19), 7270–7276. Chen, K.L., Mylon, S.E. and Elimelech, M. (2006) Aggregation kinetics of alginate-coated hematite nanoparticles in monovalent and divalent electrolytes. Environmental Science and Technology 40(5), 1516-1523. Chen, K.L., Smith, B.A., Ball, W.P. and Fairbrother, D.H. (2010) Assessing the colloidal properties of engineered nanoparticles in water: case studies from fullerene C60 nanoparticles and carbon nanotubes. Environmental Chemistry 7(1), 10-27. Chen, L., Sabatini, D.A. and Kibbey, T.C.G. (2008) Role of the air-water interface in the retention of TiO2 nanoparticles in porous media during primary drainage. Environmental Science and Technology 42(6), 1916-1921. Cheng, X., Kan, A.T. and Tomson, M.B. (2005) Study of C60 transport in porous media and the effect of sorbed C60 on naphthalene transport. Journal of Materials Research 20(12), 3244-3254. Choy, C.C., Wazne, M. and Meng, X. (2008) Application of an empirical transport model to simulate retention of nanocrystalline titanium dioxide in sand columns. Chemosphere 71(9), 1794-1801.

79
Dagtepe, P. and Chikan, V. (2008) Effect of Cd/Te ratio on the formation of CdTe magic-sized quantum dots during aggregation. Journal of Physical Chemistry A 112(39), 9304-9311. De Gennes, P.G. (1985) Etalement «sec» d'une goutte sur une surface aléatoire. Comptes rendus des seances de l'Academie des sciences. Serie 2, Mecanique, Physique, Chimie, Sciences de la Terre, Sciences de l'univers 300(4), 129-132. De Gennes, P.G. (1987) Polymers at an interface; a simplified view. Advances in Colloid and Interface Science 27(3-4), 189-209. De Kerchove, A.J. and Elimelech, M. (2006) Structural growth and viscoelastic properties of adsorbed alginate layers in monovalent and divalent salts. Macromolecules 39(19), 6558-6564. De Vicente, J., Delgado, A.V., Plaza, R.C., Durán, J.D.G. and González-Caballero, F. (2000) Stability of cobalt ferrite colloidal particles. Effect of pH and applied magnetic fields. Langmuir 16(21), 7954-7961. Deguchi, S., Alargova, R.G. and Tsujii, K. (2001) Stable dispersions of fullerenes, C60 and C70, in water. Preparation and characterization. Langmuir 17(19), 6013-6017. Derjaguin, B.V. and Landau, L.D. (1941) Theory of stability of strongly charged lyophobic sols and the adhesion of strongly charged particles in solutions of electrolytes. Acta Physicochimica URSS 14, 633-662. Domingos, R.F., Baalousha, M.A., Ju-Nam, Y., Reid, M.M., Tufenkji, N., Lead, J.R., Leppard, G.G. and Wilkinson, K.J. (2009a) Characterizing manufactured nanoparticles in the environment: Multimethod determination of particle sizes. Environmental Science & Technology 43(19), 7277-7284. Domingos, R.F., Tufenkji, N. and Wilkinson, K.J. (2009b) Aggregation of titanium dioxide nanoparticles: Role of a fulvic acid. Environmental Science and Technology 43(5), 1282-1286. Dong, C.Q., Qian, H.H., Fang, N.H. and Ren, J.C. (2007) On-line investigation of laser-induced aggregation and photoactivation of CdTe quantum dots by fluorescence correlation spectroscopy. Journal of Physical Chemistry C 111(22), 7918-7923. Doshi, R., Braida, W., Christodoulatos, C., Wazne, M. and O'Connor, G. (2008) Nano-aluminum: Transport through sand columns and environmental effects on plants and soil communities. Environmental Research 106(3), 296-303. Dresselhaus, M.S., Dresselhaus, G. and Eklund, P.C. (1996) Science of Fullerenes and Carbon Nanotubes, Academic Press, San Diego, CA, .
80
Elimelech, M., Gregory, J., Jia, X. and Williams, R.A. (1995) Particle Deposition and Aggregation: Measurement, Modeling, and Simulation, Butterworth-Heinemann, Oxford. Elimelech, M. and O'Melia, C.R. (1990a) Effect of particle size on collision efficiency in the deposition of brownian particles with electrostatic energy barriers. Langmuir 6(6), 1153-1163. Elimelech, M. and O'Melia, C.R. (1990b) Kinetics of deposition of colloidal particles in porous media. Environmental Science and Technology 24(10), 1528-1536. Elliott, D.W. and Zhang, W.X. (2001) Field assessment of nanoscale bimetallic particles for groundwater treatment. Environmental Science and Technology 35(24), 4922-4926. Espinasse, B., Hotze, E.M. and Wiesner, M.R. (2007) Transport and retention of colloidal aggregates of C60 in porous media: Effects of organic macromolecules, ionic composition, and preparation method. Environmental Science and Technology 41(21), 7396-7402. Esquivel, E.V. and Murr, L.E. (2004) A TEM analysis of nanoparticulates in a polar ice core. Materials Characterization 52(1), 15-25. Fang, J., Shan, X., Wen, B., Lin, J. and Owens, G. (2009) Stability of titania nanoparticles in soil suspensions and transport in saturated homogeneous soil columns. Environmental Pollution 157(4), 1101-1109. Farré, M., Gajda-Schrantz, K., Kantiani, L. and Barceló, D. (2009) Ecotoxicity and analysis of nanomaterials in the aquatic environment. Analytical and Bioanalytical Chemistry 393(1), 81-95. Fatisson, J., Domingos, R.F., Wilkinson, K.J. and Tufenkji, N. (2009) Deposition of TiO2 nanoparticles onto silica measured using a quartz crystal microbalance with dissipation monitoring. Langmuir 25(11), 6062-6069. Franchi, A. and O'Melia, C.R. (2003) Effects of natural organic matter and solution chemistry on the deposition and reentrainment of colloids in porous media. Environmental Science and Technology 37(6), 1122-1129. French, R.A., Jacobson, A.R., Kim, B., Isley, S.L., Penn, L. and Baveye, P.C. (2009) Influence of ionic strength, pH, and cation valence on aggregation kinetics of titanium dioxide nanoparticles. Environmental Science and Technology 43(5), 1354-1359. Fuchs, N. (1934) Uber die stabilitat und aufladung der aerosole. Z. Physik 89, 736-743. Gottschalk, F., Sonderer, T., Scholz, R.W. and Nowack, B. (2009) Modeled environmental concentrations of engineered nanomaterials (TiO2, ZnO, Ag, CNT, fullerenes) for different regions. Environmental Science and Technology 43(24), 9216-9222.
81
Gregory, J. (1975) Interaction of unequal double layers at constant charge. Journal of Colloid and Interface Science 51(1), 44-51. Gregory, J. (1981) Approximate expressions for retarded van der waals interaction. Journal of Colloid and Interface Science 83(1), 138-145. Guzman, K.A.D., Finnegan, M.P. and Banfield, J.F. (2006) Influence of surface potential on aggregation and transport of titania nanoparticles. Environmental Science & Technology 40(24), 7688-7693. Hahn, M.W., Abadzic, D. and O'Melia, C.R. (2004) Aquasols: On the role of secondary minima. Environmental Science and Technology 38(22), 5915-5924. Hahn, M.W. and O'Melia, C.R. (2004) Deposition and reentrainment of Brownian particles in porous media under unfavorable chemical conditions: Some concepts and applications. Environmental Science and Technology 38(1), 210-220. Hamaker, H.C. (1937) The London-van der Waals attraction between spherical particles. Physica 4(10), 1058-1072. Han, Z., Zhang, F., Lin, D., Xing, B. (2008) Clay minerals affect the stability of surfactant-facilitated carbon nanotube suspensions. Environmental Science & Technology 42(18), 6869-6875. He, F., Zhao, D., Liu, J. and Roberts, C.B. (2007) Stabilization of Fe - Pd nanoparticles with sodium carboxymethyl cellulose for enhanced transport and dechlorination of trichloroethylene in soil and groundwater. Industrial and Engineering Chemistry Research 46(1), 29-34. He, F. and Zhao, D. (2007) Manipulating the size and dispersibility of zerovalent iron nanoparticles by use of carboxymethyl cellulose stabilizers. Environmental Science & Technology 41(17), 6216-6221. Healy, T.W., Homola, A., James, R.O. and Hunter, R.J. (1978) Coagulation of amphoteric latex colloids: reversibility and specific ion effects. Faraday Discussions 65, 156-163. Huber, N., Baumann, T. and Niessner, R. (2000) Assessment of colloid filtration in natural porous media by filtration theory. Environmental Science and Technology 34(17), 3774-3779. Hydutsky, B.W., Mack, E.J., Beckerman, B.B., Skluzacek, J.M. and Mallouk, T.E. (2007) Optimization of nano- and microiron transport through sand columns using polyelectrolyte mixtures. Environmental Science and Technology 41(18), 6418-6424.

82
Hyung, H., Fortner, J. D., Hughes, J. B. and Kim, J. H. (2007) Natural organic matter stabilizes carbon nanotubes in the aqueous phase. Environmental Science & Technology 41(1), 179-184. Hyung, H. and Kim, J.H. (2008) Natural organic matter (NOM) adsorption to multi-walled carbon nanotubes: Effect of NOM characteristics and water quality parameters. Environmental Science and Technology 42(12), 4416-4421. Jaisi, D.P. and Elimelech, M. (2009) Single-walled carbon nanotubes exhibit limited transport in soil columns. Environmental Science and Technology 43(24), 9161-9166. Jaisi, D.P., Saleh, N., Blake, R. and Elimelech, M. (2008) Transport of single-walled carbon nanotubes in porous media: Filtration mechanisms and reversibility. Environmental Science & Technology 42(22), 8317–8323. Jeong, S.W. and Kim, S.D. (2009) Aggregation and transport of copper oxide nanoparticles in porous media. Journal of Environmental Monitoring 11(9), 1595-1600. Johnson, R.L., Johnson, G.O., Nurmi, J.T. and Tratnyek, P.G. (2009) Natural organic matter enhanced mobility of nano zerovalent iron. Environmental Science & Technology 43(14), 5455-5460. Kanel, S.R., Goswami, R.R., Clement, T.P., Barnett, M.O. and Zhao, D. (2008) Two dimensional transport characteristics of surface stabilized zero-valent iron nanoparticles in porous media. Environmental Science and Technology 42(3), 896-900. Kanel, S.R., Nepal, D., Manning, B. and Choi, H. (2007) Transport of surface-modified iron nanoparticle in porous media and application to arsenic(III) remediation. Journal of Nanoparticle Research 9(5), 725-735. Kennedy, A.J., Hull, M.S., Steevens, J.A., Dontsova, K.M., Chappell, M.A., Gunter, J.C. and Weiss, C.A. Jr. (2008) Factors influencing the partitioning and toxicity of nanotubes in the aquatic environment. Environmental Toxicology and Chemistry 27(9), 1932-1941. Klaine, S.J., Alvarez, P.J.J., Batley, G.E., Fernandes, T.F., Handy, R.D., Lyon, D.Y., Mahendra, S., McLaughlin, M.J. and Lead, J.R. (2008) Nanomaterials in the environment: Behavior, fate, bioavailability, and effects. Environmental Toxicology and Chemistry 27(9), 1825-1851. Kretzschmar, R., Borkovec, M., Grolimund, D. and Elimelech M. (1999) Mobile subsurface colloids and their role in contaminant transport. Advances in Agronomy 66, 121-194. Labille, J., Brant, J., Villieras, F., Pelletier, M., Thill, A., Masion, A., Wiesner, M., Rose, J. and Bottero, J-Y. (2006) Affinity of C60 fullerenes with water. Fullerenes, Nanotubes, and Carbon Nanostructures. 14(2-3), 307–314.

83
Labille, J., Masion, A., Ziarelli, F., Rose, J., Brant, J., Villieras, F., Pelletier, M., Borschneck, D., Wiesner, M.R. and Bottero, J.Y. (2009) Hydration and dispersion of C60 in aqueous systems: The nature of water-fullerene interactions. Langmuir 25(19), 11232-11235. Lecoanet, H.F., Bottero, J.Y. and Wiesner, M.R. (2004) Laboratory assessment of the mobility of nanomaterials in porous media. Environmental Science and Technology 38(19), 5164-5169. Lecoanet, H.F. and Wiesner, M.R. (2004) Velocity effects on fullerene and oxide nanoparticle deposition in porous media. Environmental Science and Technology 38(16), 4377-4382. Levich, V.G. (1962) Physicochemical Hydrodynamics, Prentice Hall, Englewood Cliffs, NJ. Li, Y., Wang, Y., Pennell, K.D. and Abriola, L.M. (2008) Investigation of the transport and deposition of fullerene (C60) nanoparticles in quartz sands under varying flow conditions. Environmental Science & Technology 42(19), 7174-7180. Limbach, L.K., Bereiter, R., Müller, E., Krebs, R., Gälli, R. and Stark, W.J. (2008) Removal of oxide nanoparticles in a model wastewater treatment plant: Influence of agglomeration and surfactants on clearing efficiency. Environmental Science & Technology 42(15), 5828-5833. Lin, D. and Xing, B. (2008) Tannic acid adsorption and its role for stabilizing carbon nanotube suspensions. Environmental Science & Technology 42(16), 5917-5923. Lin, D.H., Liu, N., Yang, K., Zhu, L.Z., Xu, Y. and Xing, B.S. (2009) The effect of ionic strength and pH on the stability of tannic acid-facilitated carbon nanotube suspensions. Carbon 47(12), 2875-2882. Liu, X., Wazne, M., Christodoulatos, C. and Jasinkiewicz, K.L. (2009) Aggregation and deposition behavior of boron nanoparticles in porous media. Journal of Colloid and Interface Science 330(1), 90-96. Liu, Y., Liu, C.Y., Chen, L.B. and Zhang, Z.Y. (2003) Adsorption of cations onto the surfaces of silver nanoparticles. Journal of Colloid and Interface Science 257(2), 188-194. Logan, B.E. (1999) Environmental Transport Processes, John Wiley & Sons, Inc., New York. Ma, X. and Bouchard, D. (2009) Formation of aqueous suspensions of fullerenes. Environmental Science & Technology 43(2), 330-336.

84
Marmur, A. (1979) A kinetic theory approach to primary and secondary minimum coagulations and their combination. Journal of Colloid and Interface Science 72(1), 41-48. Mattigod, S.V., Fryxell, G.E., Alford, K., Gilmore, T., Parker, K., Serne, J. and Engelhard, M. (2005) Functionalized TiO2 nanoparticles for use for in situ anion immobilization. Environmental Science and Technology 39(18), 7306-7310. Maynard, A.D., Aitken, R.J., Butz, T., Colvin, V., Donaldson, K., Oberdörster, G., Philbert, M.A., Ryan, J., Seaton, A., Stone, V., Tinkle, S.S., Tran, L., Walker, N.J. and Warheit, D.B. (2006) Safe handling of nanotechnology. Nature 444(7117), 267-269. Mchedlov-Petrossyan, N.O., Klochkov, V.K. and Andrievsky,G.V. (1997) Colloidal dispersions of fullerene C60 in water: some properties and regularities of coagulation by electrolytes. Journal of the Chemical Society- Faraday Transections 93(24), 4343-4346. Moskovits, M. and Vlckova, B. (2005) Adsorbate-induced silver nanoparticle aggregation kinetics. Journal of Physical Chemistry B 109(31), 14755-14758. Mueller, N.C. and Nowack, B. (2008) Exposure modeling of engineered nanoparticles in the environment. Environmental Science and Technology 42(12), 4447-4453. Niyogi, S., Boukhalfa, S., Chikkannanavar, S.B., McDonald, T.J., Heben, M.J. and Doorn, S.K. (2007) Selective aggregation of single-walled carbon nanotubes via salt addition. Journal of the American Chemical Society 129(7), 1898-1899. Nowack, B. and Bucheli, T.D. (2007) Occurrence, behavior and effects of nanoparticles in the environment. Environmental Pollution 150(1), 5-22. Ofoli, R.Y. and Prieve, D.C. (1997) Small-angle Rayleigh scattering by relatively large latex particles. Langmuir 13(18), 4837-4842. Ottewill, R.H. and Shaw, J.N. (1966) Stability of monodisperse polystyrene latex dispersions of various sizes. Discussions of the Faraday Society 42, 154-163. Pavlova-Verevkina, O.B., Ozerina, L.A., Politova, E.D., Surin, N.M. and Ozerin, A.N. (2009) Effect of electrolytes on the slow aggregation of TiO2 nanocrystals. Colloid Journal 71(4), 529-533. Pelley, A.J. and Tufenkji, N. (2008) Effect of particle size and natural organic matter on the migration of nano- and microscale latex particles in saturated porous media. Journal of Colloid and Interface Science 321(1), 74-83. Pettibone, J.M., Cwiertny, D.M., Scherer, M. and Grassian, V.H. (2008) Adsorption of organic acids on TiO2 nanoparticles: Effects of pH, nanoparticle size, and nanoparticle aggregation. Langmuir 24(13), 6659-6667.

85
Phenrat, T., Kim, H.J., Fagerlund, F., Illangasekare, T., Tilton, R.D. and Lowry, G.V. (2009) Particle size distribution, concentration, and magnetic attraction affect transport of polymer-modified Fe0 nanoparticles in sand columns. Environmental Science and Technology 43(13), 5079-5085. Phenrat, T., Liu, Y.Q., Tilton, R.D. and Lowry, G.V. (2009) Adsorbed polyelectrolyte coatings decrease Fe0 nanoparticle reactivity with TCE in water: Conceptual model and mechanisms. Environmental Science & Technology 43(5), 1507-1514. Phenrat, T., Saleh, N., Sirk, K., Tilton, R. and Lowry, G.V. (2007) Aggregation and sedimentation of aqueous nanoscale zerovalent iron dispersions. Environmental Science & Technology 41(1), 284–290. Phenrat, T., Saleh, N., Sirk, K., Kim, H.-J., Tilton, R.D. and Lowry, G.V. (2008) Stabilization of aqueous nanoscale zerovalent iron dispersions by anionic polyelectrolytes: Adsorbed anionic polyelectrolyte layer properties and their effect on aggregation and sedimentation. Journal of Nanoparticle Research 10(5), 795-814. Quevedo, I.R. and Tufenkji, N. (2009) Influence of solution chemistry on the deposition and detachment kinetics of a CdTe quantum dot examined using a quartz crystal microbalance. Environmental Science and Technology 43(9), 3176-3182. Rajagopalan, R. and Tien, C. (1976) Trajectory analysis of deep-bed filtration with the sphere-in-cell porous media model. AIChE (American Institute of Chemical Engineers) Journal 22(3), 523-533. Ross, S. and Morrison, I.D. (1988) Colloidal Systems and Interfaces, John Wiley & Sons, Inc., New York. Ruckenstein, E. and Prieve, D.C. (1973) Rate of deposition of Brownian particles under the action of London and double-layer forces. Journal of the Chemical Society, Faraday Transactions 2: Molecular and Chemical Physics 69, 1522-1536. Saleh, N., Kim, H.J., Phenrat, T., Matyjaszewski, K., Tilton, R.D. and Lowry, G.V. (2008a) Ionic strength and composition affect the mobility of surface-modified Fe0 nanoparticles in water-saturated sand columns. Environmental Science and Technology 42(9), 3349-3355. Saleh, N., Sirk, K., Liu, Y., Phenrat, T., Dufour, B., Matyjaszewski, K., Tilton, R.D. and Lowry, G.V. (2007) Surface modifications enhance nanoiron transport and NAPL targeting in saturated porous media. Environmental Engineering Science 24(1), 45-57. Saleh, N.B., Pfefferle, L.D. and Elimelech, M. (2008b) Aggregation kinetics of multiwalled carbon nanotubes in aquatic systems: Measurements and environmental implications. Environmental Science and Technology 42(21), 7963-7969.

86
Saleh, N.B., Pfefferle, L.D. and Elimelech, M. (2010) Influence of biomacromolecules and humic acid on the aggregation kinetics of single-walled carbon nanotubes. Environmental Science and Technology 44(7), 2412-2418. Samoilova, N., Kurskaya, E., Krayukhina, M., Askadsky, A. and Yamskov, I. (2009) Copolymers of maleic acid and their amphiphilic derivatives as stabilizers of silver nanoparticles. Journal of Physical Chemistry B 113(11), 3395-3403. Sano, M., Kamino, A., Okamura, J. and Shinkai, S. (2001a) Self-organization of PEO-graft-single-walled carbon nanotubes in solutions and Langmuir-Blodgett films. Langmuir 17(17), 5125-5128. Sano, M., Okamura, J. and Shinkai, S. (2001b) Colloidal nature of single-walled carbon nanotubes in electrolyte solution: The Schulze-Hardy rule. Langmuir 17(22), 7172-7173. Sauerbrey, G. (1959) Verwendung von schwingquarzen zur wagung dunner schichten und zur mikrowagung. Zeitschrift für Physik 155(2), 206-222. Schrick, B., Hydutsky, B.W., Blough, J.L. and Mallouk, T.E. (2004) Delivery vehicles for zerovalent metal nanoparticles in soil and groundwater. Chemistry of Materials 16(11), 2187-2193. Shani, C., Weisbrod, N. and Yakirevich, A. (2008) Colloid transport through saturated sand columns: Influence of physical and chemical surface properties on deposition. Colloids and Surfaces A: Physicochemical and Engineering Aspects 316(1-3), 142-150. Shen, C., Huang, Y., Li, B. and Jin, Y. (2008) Effects of solution chemistry on straining of colloids in porous media under unfavorable conditions. Water Resources Research 44(W05419), 1-12. Shieh, Y.T., Liu, G.L., Wu, H.H. and Lee, C.C. (2007) Effects of polarity and pH on the solubility of acid-treated carbon nanotubes in different media. Carbon 45(9), 1880-1890. Smith, B., Wepasnick, K., Schrote, K.E., Bertele, A.H., Ball, W.P., O'Melia, C. and Fairbrother, D.H. (2009a) Colloidal properties of aqueous suspensions of acid-treated, multi-walled carbon nanotubes. Environmental Science and Technology 43(3), 819-825. Smith, B., Wepasnick, K., Schrote, K.E., Cho, H.H., Ball, W.P. and Fairbrother, D.H. (2009b) Influence of surface oxides on the colloidal stability of multi-walled carbon nanotubes: A structure-property relationship. Langmuir 25(17), 9767-9776. Song, L. and Elimelech, M. (1992) Deposition of Brownian particles in porous media: Modified boundary conditions for the sphere-in-cell model. Journal of Colloid and Interface Science 153(1), 294-297.
87
Song, L., Johnson, P.R. and Elimelech, M. (1994) Kinetics of colloid deposition onto heterogeneously charged surfaces in porous media. Environmental Science and Technology 28(6), 1164-1171. Spielman, L.A. and Friedlander, S.K. (1974) Role of the electrical double layer in particle deposition by convective diffusion. Journal of Colloid and Interface Science 46(1), 22-31. Sun, Y.P., Li, X.Q., Zhang, W.X. and Wang, H.P. (2007) A method for the preparation of stable dispersion of zero-valent iron nanoparticles. Colloids and Surfaces A: Physicochemical and Engineering Aspects 308(1-3), 60–66. Sung, H.J., Al-Abed, S.R. and Luxton, T. (2009) Influence of carboxymethyl cellulose for the transport of titanium dioxide nanoparticles in clean silica and mineral-coated sands. Environmental Science and Technology 43(13), 4954-4959. Thompson, N.L. (1991) Topics in Fluorescence Spectroscopy, Volume 1 Techniques. Lakowicz, J.R. (editor), Plenum Press, New York. Tiede, K., Boxall, A.B.A., Tear, S.P., Lewis, J., David, H. and Hassellov, M. (2008) Detection and characterization of engineered nanoparticles in food and the environment. Food Additives and Contaminants - Part A Chemistry, Analysis, Control, Exposure and Risk Assessment 25(7), 795-821. Tiraferri, A., Chen, K.L., Sethi, R. and Elimelech, M. (2008) Reduced aggregation and sedimentation of zero-valent iron nanoparticles in the presence of guar gum. Journal of Colloid and Interface Science 324(1-2), 71-79. Tkachenko, N.H., Yaremko, Z.M. and Bellmann, C. (2006) Effect of 1-1-charged ions on aggregative stability and electrical surface properties of aqueous suspensions of titanium dioxide. Colloids and Surfaces A: Physicochemical and Engineering Aspects 279(1-3), 10-19. Trinh, L.T.T., Kjøniksen, A.L., Zhu, K., Knudsen, K.D., Volden, S., Glomm, W.R. and Nyström, B. (2009) Slow salt-induced aggregation of citrate-covered silver particles in aqueous solutions of cellulose derivatives. Colloid and Polymer Science 287(12), 1391-1404. Tseng, W.J. and Lin, K.C. (2003) Rheology and colloidal structure of aqueous TiO2 nanoparticle suspensions. Materials Science and Engineering A 355(1-2), 186-192. Tufenkji, N. and Elimelech, M. (2004) Correlation equation for predicting single-collector efficiency in physicochemical filtration in saturated porous media. Environmental Science and Technology 38(2), 529-536. Tufenkji, N. and Elimelech, M. (2005) Breakdown of colloid filtration theory: Role of the secondary energy minimum and surface charge heterogeneities. Langmuir 21(3), 841-852.

88
Vaisman, L., Marom, G. and Wagner, H.D. (2006) Dispersions of surface-modified carbon nanotubes in water-soluble and water-insoluble polymers. Advanced Functional Materials 16(3), 357-363. Verwey, E.J.W. and Overbeek, J.T.G. (1948) Theory of the Stability of Lyophobic Colloids, Elsevier, Amsterdam. Wang, P., Shi, Q.H., Liang, H.J., Steuerman, D.W., Stucky, G.D. and Keller, A.A. (2008) Enhanced environmental mobility of carbon nanotubes in the presence of humic acid and their removal from aqueous solution. Small 4(12), 2166-2170. Wang, Y., Li, Y., Fortner, J.D., Hughes, J.B., Abriola, L.M. and Pennell, K.D. (2008a) Transport and retention of nanoscale C60 aggregates in water-saturated porous media. Environmental Science and Technology 42(10), 3588-3594. Wang, Y., Li, Y. and Pennell, K.D. (2008b) Influence of electrolyte species and concentration on the aggregation and transport of fullerene nanoparticles in quartz sands. Environmental Toxicology and Chemistry 27(9), 1860-1867. Wiesner, M.R. and Bottero, J.-Y. (2007) Environmental Nanotechnology, The McGraw-Hill Companies, New York. Wiesner, M.R., Lowry, G.V., Jones, K.L., Hochella, M.F.J., DiGiulio, R.T., Casman, E. and Bernhardt, E.S. (2009) Decreasing uncertainties in assessing environmental exposure, risk, and ecological implications of nanomaterials. Environmental Science and Technology 43(17), 6458-6462. Xueying, L., O'Carroll, D.M., Petersen, E.J., Qingguo, H. and Anderson, C.L. (2009) Mobility of multiwalled carbon nanotubes in porous media. Environmental Science and Technology 43(21), 8153-8158. Yao, K.M., Habibian, M.T. and O'Melia, C.R. (1971) Water and waste water filtration: Concepts and applications. Environmental Science and Technology 5(11), 1105-1112. Zhan, J., Zheng, T., Piringer, G., Day, C., McPherson, G.L., Lu, Y., Papadopoulos, K. and John, V.T. (2008) Transport characteristics of nanoscale functional zerovalent iron/silica composites for in situ remediation of trichloroethylene. Environmental Science and Technology 42(23), 8871-8876. Zhang, Y., Chen, Y., Westerhoff, P., Crittenden, J.C. (2008a) Stability and removal of water soluble CdTe quantum dots in water. Environmental Science and Technology 42(1), 321-325.
89
Zhang, Y., Mi, L., Wang, P.N., Ma, J. and Chen, J.Y. (2008b) pH-dependent aggregation and photoluminescence behavior of thiol-capped CdTe quantum dots in aqueous solutions. Journal of Luminescence 128(12), 1948-1951. Zhuang, J., Qi, J. and Jin, Y. (2005) Retention and transport of amphiphilic colloids under unsaturated flow conditions: Effect of particle size and surface property. Environmental Science and Technology 39(20), 7853-7859.

90
2.12 SUPPLEMENTARY MATERIAL FOR CHAPTER 2
The purpose of this section is to provide additional information of interest to the
reader; namely, tables summarizing major nanomaterials and listing values of Hamaker
constants for particle-particle and particle-collector interactions in water.

91
Table S2.1 Summary of Major Nanomaterials of Interest and Their Key Properties

92
Table S2.2 Hamaker Constants (A123) for Unretarded Interactions between a Nanoparticle and Silica Collector in Water
Material Hamaker constant A 123 (10-20J) References
aluminum oxide (Al2O3) 1.9 Ackler et al. 1996
cadmium sulfide (CdS) 0.72 Bergström, 1997
gold (Au) 3.2 Rabinovich & Churaev, 1990
iron oxide (Fe2O3) 2.1 Wang et al. 1992
magnesium oxide (MgO) 0.81 Bergström, 1997
quartz (SiO2) 0.63 Bergström, 1997
silica (SiO2) 0.77 Butt et al., 2005
titanium dioxide (TiO2) 1.4 Butt et al., 2005
titanium dioxide (TiO2) 4.5 Ackler et al., 1996
zinc oxide (ZnO) 0.58 Bergström, 1997
zinc sulfide (ZnS) 1.02 Bergström, 1997

93
Table S2.3 Hamaker Constants (A121) for Unretarded Interactions between Nanoparticles in Water
Material Hamaker Constant, A 121 (10-20J) References
aluminum oxide (Al2O3) 5.3 Butt et al., 2005
cadmium sulfide (CdS) 3.4 Bergström, 1997
carbon (C) 1.20 Stein, 1995
cerium oxide (CeO2) 5.57 Karimian & Babaluo, 2007
copper (Cu) 17.5 Visser, 1972
diamond (C) 13.8 Bergström, 1997
fullerenes (C60) 0.67 Chen & Elimelech, 2006
fullerenes (C60) 0.85 Chen & Elimelech, 2009
gold (Au) 27 Rabinovich & Churaev, 1990
graphite (C) 3.7 Bernhardt, 1988
iron (Fe) 5.38 Visser, 1972
iron oxide (Fe2O3) 5.4 Amal, 1990
lead (Pb) 30 Visser, 1972
lead sulfide (PbS) 0.31 Bergström, 1997
magnesium oxide (MgO) 2.21 Bergström, 1997
quartz - crystalline (SiO2) 1.7 Hough & White, 1980
quartz - fused (SiO2) 0.63 Israelechvili, 1992
selenium (Se) 4.77 Bargeman & van Voorst Vader, 1972
silica (SiO2) 0.85 Butt et al., 2005
silica (SiO2) 0.46 Bergström, 1997
silica - fused (SiO2) 0.849 Hough & White, 1980
silver (Ag) 28.2 Israelechvili, 1992
tin (Sn) 31 Visser, 1972
titanium dioxide (TiO2) 6 Butt et al., 2005
titanium dioxide - anatase (TiO2) 0.35 Gómez-Merino et al. 2007
titanium dioxide - rutile (TiO2) 26 Israelechvili, 1992
tungsten oxide (WO3) 1.9 Andersson & Bergström, 2002
zinc oxide (ZnO) 1.9 Bernhardt, 1988
zinc oxide (ZnO) 1.89 Bergström, 1997
zinc sulfide (ZnS) 4.8 Bergström, 1997
zinc sulfide (ZnS) 5.74 Bergström, 1997
zirconia (ZrO2) 6 Butt et al., 2005

94
REFERENCES FOR SUPPLEMENTARY MATERIAL SECTION
Ackler, H.D., French, R.H. and Chiang, Y.M. (1996) Comparisons of Hamaker constants for ceramic systems with intervening vacuum or water: From force laws and physical properties. Journal of Colloid and Interface Science 179(2), 460-469. Amal, R., Coury, J.R., Raper, J.A., Walsh, W.P. and Waite, T.D. (1990) Structure and kinetics of aggregating colloidal haematite. Colloids and Surfaces 46(1), 1-19. Andersson, K.M. and Bergström, L. (2002) DLVO interactions of tungsten oxide and cobalt oxide surfaces measured with the colloidal probe technique. Journal of Colloid and Interface Science 246(2), 309-315. Arnaud, I., Abid, J.P., Roussel, C. and Girault, H.H. (2005) Size-selective separation of gold nanoparticles using isoelectric focusing electrophoresis (IEF). Chemical Communications 6, 787-788. Bargeman, D. and van Voorst Vader, F. (1972) van der Waals forces between immersed particles. Journal of Electroanalytical Chemistry 37(1), 45-52. Bergström, L. (1997) Hamaker constants of inorganic materials. Advances in Colloid and Interface Science 70, 125-169. Bernhardt, C. (1988) Preparation of suspensions for particle size analysis. Methodical recommendations, liquids and dispersing agents. Advances in Colloid and Interface Science 29(1-2), 79-139. Bouchard, D., Ma, X. and Issacson, C. (2009) Colloidal properties of aqueous fullerenes: Isoelectric points and aggregation kinetics of C60 and C60 derivatives. Environmental Science and Technology 43(17), 6597-6603. Butt, H.-J., Cappella, B. and Kappl, M. (2005) Force measurements with the atomic force microscope: Technique, interpretation and applications. Surface Science Reports 59(1-6), 1-152. Chen, K.L. and Elimelech, M. (2009) Relating colloidal stability of fullerene (C60) nanoparticles to nanoparticle charge and electrokinetic properties. Environmental Science and Technology 43(19), 7270–7276. Chen, K.L. and Elimelech, M. (2006) Aggregation and deposition kinetics of fullerene (C60) nanoparticles. Langmuir 22(26), 10994-11001. Chen, K.L., Smith, B.A., Ball, W.P. and Fairbrother, D.H. (2010) Assessing the colloidal properties of engineered nanoparticles in water: case studies from fullerene C60 nanoparticles and carbon nanotubes. Environmental Chemistry 7, 1-18.

95
Das, M., Saxena, N. and Dwivedi, P.D. (2009) Emerging trends of nanoparticles application in food technology: Safety paradigms. Nanotoxicology 3(1), 10-18. Ghosh, S., Mashayekhi, H., Pan, B., Bhowmik, P. and Xing, B.S. (2008) Colloidal behavior of aluminum oxide nanoparticles as affected by pH and natural organic matter. Langmuir 24(21), 12385-12391. Gómez-Merino, A.I., Rubio-Hernández, F.J., Velázquez-Navarro, J.F., Galindo-Rosales, F.J. and Fortes-Quesada, P. (2007) The Hamaker constant of anatase aqueous suspensions. Journal of Colloid and Interface Science 316(2), 451-456. Guzman, K.A.D., Finnegan, M.P. and Banfield, J.F. (2006) Influence of surface potential on aggregation and transport of titania nanoparticles. Environmental Science and Technology 40(24), 7688-7693. Hough, D.B. and White, L.R. (1980) The calculation of Hamaker constants from Liftshitz theory with applications to wetting phenomena. Advances in Colloid and Interface Science 14(1), 3-41. Israelachvili, J. (1992) Intermolecular and Surface Forces, 2nd Edition, Academic Press, London. Jaisi, D.P., Saleh, N., Blake, R. and Elimelech, M. (2008) Transport of single-walled carbon nanotubes in porous media: Filtration mechanisms and reversibility. Environmental Science and Technology 42(22), 8317–8323. Karimian, H. and Babaluo, A.A. (2007) Halos mechanism in stabilizing of colloidal suspensions: Nanoparticle weight fraction and pH effects. Journal of the European Ceramic Society 27(1), 19-25. Klaine, S.J., Alvarez, P.J.J., Batley, G.E., Fernandes, T.F., Handy, R.D., Lyon, D.Y., Mahendra, S., McLaughlin, M.J. and Lead, J.R. (2008) Nanomaterials in the environment: Behavior, fate, bioavailability, and effects. Environmental Toxicology and Chemistry 27(9), 1825-1851. Lecoanet, H.F. and Wiesner, M.R. (2004) Velocity effects on fullerene and oxide nanoparticle deposition in porous media. Environmental Science and Technology 38(16), 4377-4382. Limbach, L.K., Bereiter, R., Müller, E., Krebs, R., Gälli, R. and Stark, W.J. (2008) Removal of oxide nanoparticles in a model wastewater treatment plant: Influence of agglomeration and surfactants on clearing efficiency. Environmental Science and Technology 42(15), 5828-5833.
96
Lin, W., Huang, Y.W., Zhou, X.D. and Ma, Y. (2006) Toxicity of cerium oxide nanoparticles in human lung cancer cells. International Journal of Toxicology 25(6), 451-457. Lin, D.H., Liu, N., Yang, K., Zhu, L.Z., Xu, Y. and Xing, B.S. (2009) The effect of ionic strength and pH on the stability of tannic acid-facilitated carbon nanotube suspensions. Carbon 47(12), 2875-2882. Ma, X. and Bouchard, D. (2009) Formation of aqueous suspensions of fullerenes. Environmental Science and Technology 43(2), 330-336. Necula, B.S., Apachitei, I., Fratila-Apachitei, L.E., Teodosiu, C. and Duszczyk, J. (2007) Stability of nano-/microsized particles in deionized water and electroless nickel solutions. Journal of Colloid and Interface Science 314(2), 514-522. Quevedo, I.R. and Tufenkji, N. (2009) Influence of solution chemistry on the deposition and detachment kinetics of a CdTe quantum dot examined using a quartz crystal microbalance. Environmental Science and Technology 43(9), 3176-3182. Rabinovich, Y.I. and Churaev, N.V. (1990) Results of numerical calculations of dispersion forces for solids, liquid interlayers, and films. Colloid Journal of the USSR 52(2), 256-262. Song, X., Jiang, N., Li, Y., Xu, D. and Qiu, G. (2008) Synthesis of CeO2-coated SiO2 nanoparticle and dispersion stability of its suspension. Materials Chemistry and Physics 110(1), 128-135. Stein, H.N. (1996) The Preparation of Dispersions in Liquids, Marcel Dekker, Inc., New York. Sun, Y.P., Li, X.Q., Zhang, W.X. and Wang, H.P. (2007) A method for the preparation of stable dispersion of zero-valent iron nanoparticles. Colloids And Surfaces A: Physicochemical and Engineering Aspects 308(1-3), 60–66. Tabatabaei, S., Shukohfar, A., Aghababazadeh, R. and Mirhabibi, A. (2006) Experimental study of the synthesis and characterisation of silica nanoparticles via the sol-gel method. Journal of Physics: Conference Series 26(1), 371-374. Theodore, L. (2006) Nanotechnology: Basic Calculations for Engineers and Scientists, John Wiley & Sons, Inc., Hoboken, NJ. Tkachenko, N.H., Yaremko, Z.M. and Bellmann, C. (2006) Effect of 1-1-charged ions on aggregative stability and electrical surface properties of aqueous suspensions of titanium dioxide. Colloids and Surfaces A: Physicochemical and Engineering Aspects 279(1-3), 10-19.

97
Visser, J. (1972) On Hamaker constants: A comparison between Hamaker constants and Lifshitz-van der Waals constants. Advances in Colloid and Interface Science 3(4), 331-363. Wang, Y.M., Forssberg, E. and Pugh, R.J. (1992) The influence of pH on the high-gradient magnetic separation of less-than-10-μM particles of hematite and quartz. International Journal of Mineral Processing 36(1-2), 93-105. Wang, J., Gao, L., Sun, J. and Li, Q. (1999) Surface characterization of NH4PAA-stabilized zirconia suspensions. Journal of Colloid and Interface Science 213(2), 552-556. Wiesner, M.R. and Bottero, J.-Y. (2007) Environmental Nanotechnology, The McGraw-Hill Companies, New York. Wielgus, A.R., Zhao, B., Chignell, C.F., Hu, D.N. and Roberts, J.E. (2010) Phototoxicity and cytotoxicity of fullerol in human retinal pigment epithelial cells. Toxicology and Applied Pharmacology 242(1), 79-90. Xia, T., Kovochich, M., Brant, J., Hotze, M., Sempf, J., Oberley, T., Sioutas, C., Yeh, J.I., Wiesner, M.R. and Nel, A.E. (2006) Comparison of the abilities of ambient and manufactured nanoparticles to induce cellular toxicity according to an oxidative stress paradigm. Nano Letters 6 (8), 1794-1807. Zhang, Y., Chen, Y., Westerhoff, P. and Crittenden, J.C. (2008) Stability and removal of water soluble CdTe quantum dots in water. Environmental Science and Technology 42(1), 321-325.
98
CHAPTER 3: DEPOSITION OF TITANIUM DIOXIDE NANOPARTICLE AGGREGATES IN GRANULAR POROUS
MEDIA: EFFECT OF pH AND IONIC STRENGTH
99
3.1 PREFACE
Our first metal oxide nanoparticle transport experiments examined bare titanium
dioxide (nTiO2) deposition behavior in pure quartz sand-packed columns (this work is
presented in Chapters 3 and 4). Particle suspensions were prepared in monovalent sodium
nitrate (NaNO3) at different ionic strengths (IS) and solution pH values. The work
presented in Chapter 3 was published as a short paper in the Proceedings of the 3rd
International Conference on Nanotechnology: Fundamentals and Applications 2012
(ISBN: 978-0-9867183-3-5).

100
3.2 ABSTRACT
With a broad range of commercial applications, the release of nanosized titanium
dioxide (nTiO2) into the environment is inevitable, and insight into its behavior upon
release is required. To further our understanding regarding nTiO2 transport through
subsurface environments, laboratory-scale sand-packed column experiments examining
the influence of water chemistry (pH and ionic strength (IS)) on particle deposition were
conducted. Prior to the transport studies, titania nanoparticles (NPs) were characterized
using dynamic light scattering, laser Doppler velocimetry and scanning electron
microscopy to establish aggregate size, surface potential and aggregate morphology,
respectively. Overall, the nTiO2 particles exhibited extensive aggregation, regardless of
pH and IS. Furthermore, the particle aggregates experienced significant retention within
the sand-packed columns. The particle attachment efficiency (α) onto sand was found to
increase with increasing IS in the range of low IS. At higher IS, α (pH 7) > α (pH 3) > α
(pH 9), likely due to enhanced NP aggregation and physical straining within the granular
matrix. Finally, nTiO2 elution was generally found to decrease over time, again indicative
of physical straining.

101
3.3 INTRODUCTION
Known for its ability to absorb UV radiation, nanosized titanium dioxide (nTiO2)
is a common ingredient in cosmetic and dermatological products (Mueller and Nowack
2008). It is also found in paints, coatings, and building materials (Aitken et al. 2006). The
environmental discharge of nanomaterials (NMs) such as nTiO2 can occur at the
manufacturing, consumption and disposal stage of particle life (Mueller and Nowack
2008). This release can result in heightened human and environmental exposure to
potentially harmful particles. Toxicological studies are currently revealing the potential
organismal health threats posed by nTiO2 exposure. Research has indicated that nTiO2
may be harmful to humans, rodents and other organisms (Duan et al. 2010, Iavicoli et al.
2011, Sharma 2009). Still, regardless of potential environmental and health impacts, the
effect that release of nTiO2 will have depends greatly on particle mobility and
bioavailability. The current study examines the influence of solution pH and IS on nTiO2
transport behavior in model aquatic environments. Additional transport studies involving
both bare and polymer-coated nTiO2 have been conducted by this group (Petosa et al.
2012) and are presented in Chapter 4.
3.4 MATERIALS AND METHODS
Bare, 5 nm nTiO2 (Nanostructured & Amorphous Materials, Inc.) powders were
used in this study. Stock suspensions (500 mg/L) were prepared by weighing 25 mg of the
nanoparticles (NPs) into 50 mL DI water, and then mixing at high speed with a tabletop
vortexer (Fisher). Suspensions for experimentation (30 mg/L nTiO2 concentration) were
prepared by diluting the stock suspensions in sodium nitrate (NaNO3, Sigma-Aldrich)

102
electrolytes with IS ranging between 1–200 mM. NaOH or HNO3 (Fisher) was used to set
nTiO2 suspension pH to 3, 7 or 9. All NP suspensions were stored for ~ 20 hrs to allow for
equilibration. Prior to each experiment, suspensions were inverted manually and then
analyzed.
NP hydrodynamic diameter was determined by dynamic light scattering (DLS,
Malvern Zetasizer Nano) and by nanoparticle tracking analysis (NTA, Nanosight LM20
NTA system). At least three independent samples were analyzed using DLS and NTA. NP
electrophoretic mobility (EPM) was determined by laser Doppler velocimetry (ZetaSizer
Nano ZS, Malvern). All EPM measurements were performed at 25oC, with an applied
electrical field of 4.9 ± 0.1 V. Field emission gun scanning electron microscopy (FEG-
SEM, Hitachi S-4700) was employed to characterize nTiO2 aggregate morphology as
previously described (Petosa et al. 2012).
NP transport studies were performed as described elsewhere (Petosa et al. 2012).
Briefly, glass columns (16 mm inner diameter, GE Life Sciences) were wet packed with
high purity quartz sand (-50 +70 mesh size, d50=256 µm, Sigma-Aldrich), yielding a
packed-bed porosity of 0.37. UV-visible spectrophotometry (1 cm flow-through cell,
Agilent 8453) was used to obtain online influent (C0) and effluent (C) particle
concentration measurements. A flow rate of 0.5 mL/min was employed (approach velocity
of 3.6 m/day) and at least five pore volumes (PVs) of the NP suspension were injected.
Deposition data was reproducible and each breakthrough curve reported is the average of
3 column runs.
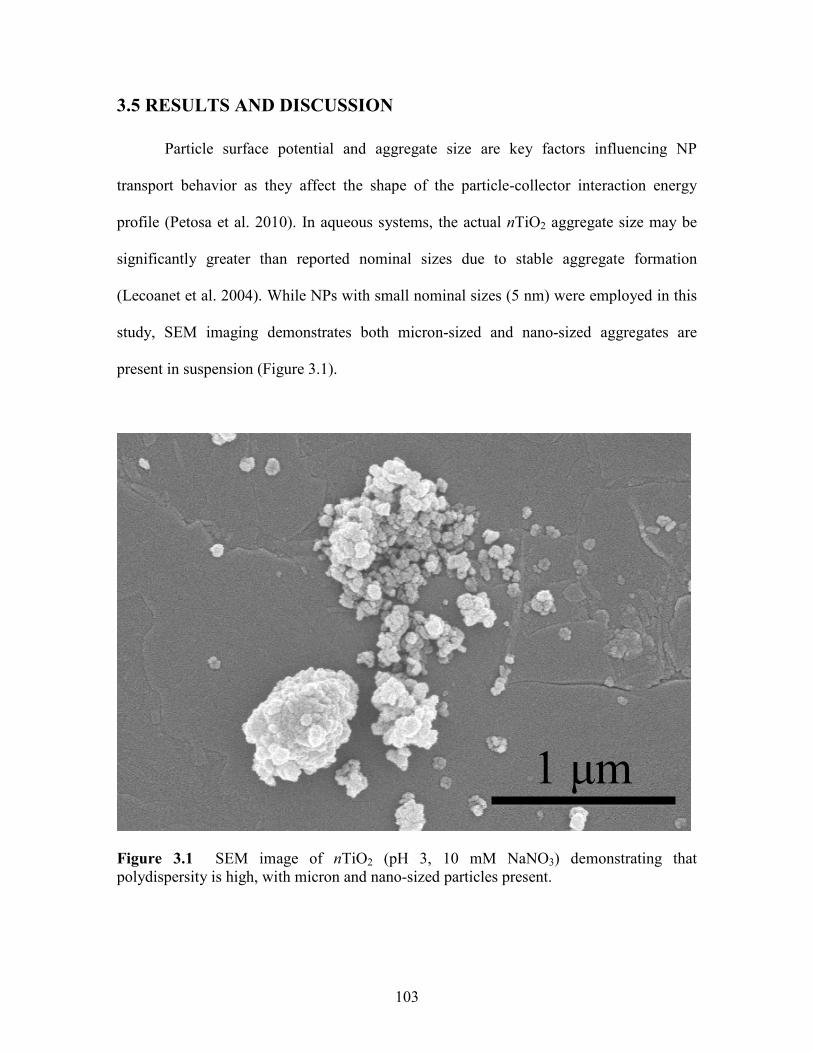
103
3.5 RESULTS AND DISCUSSION
Particle surface potential and aggregate size are key factors influencing NP
transport behavior as they affect the shape of the particle-collector interaction energy
profile (Petosa et al. 2010). In aqueous systems, the actual nTiO2 aggregate size may be
significantly greater than reported nominal sizes due to stable aggregate formation
(Lecoanet et al. 2004). While NPs with small nominal sizes (5 nm) were employed in this
study, SEM imaging demonstrates both micron-sized and nano-sized aggregates are
present in suspension (Figure 3.1).
Figure 3.1 SEM image of nTiO2 (pH 3, 10 mM NaNO3) demonstrating that polydispersity is high, with micron and nano-sized particles present.
1 μm

104
NP EPMs were determined to provide an indication of the NP surface charge
under different solution conditions and to obtain the pH of zero charge (pHzpc). In this
study, the nTiO2 pHpzc was determined to be 5.6. As a result, nTiO2 EPM determined as a
function of solution pH and IS is positive at pH 3 (ranging between 2.47 and 1.80
µmcmV-1s-1) and negative at pHs 7 and 9 (Table 3.1). The absolute EPM did not decrease
with increasing IS (i.e., with increased electrical double (EDL) compression). This
unexpected behavior is likely an experimental artifact due to the high suspension
polydispersity (Table 3.1 lists values of the suspension polydispersity index, PdI, which
ranges between 0 and 1).
Table 3.1 nTiO2 EPM and hydrodynamic diameter determined by DLS (dDLS) and NTA (dNTA). PDI is the reported polydispersity index.

105
DLS particle sizing indicates the presence of large aggregates in the nTiO2
suspensions (Table 3.1), regardless of pH and IS. Nonetheless, an increase in aggregate
size with increasing solution IS is generally observed (Table 3.1). Theoretically, NP
aggregation is greatest in the vicinity of the pHzpc, as VDW attractive forces dominate and
EDL repulsion becomes less important (Ghosh et al. 2008). Still, nTiO2 aggregation has
been observed at pH values away from the pHpzc (e.g., pH 3, 12), where all particles carry
like charges (Guzman et al. 2006). Determining particle size by DLS at pH 7 was
complicated by the high suspension polydispersity encountered at that pH (Table 3.1).
While DLS was incapable of confirming whether aggregates were largest near the pHpzc,
NTA data obtained at 10 mM NaNO3 (pH 3, 7, 9) suggest that nTiO2 aggregates are
largest at pH 7 (dNTA=690 nm), the condition closest to the pHpzc (Table 3.1).
To quantitatively compare NP deposition behavior, the colloid filtration theory
(Yao et al. 1971) and the normalized effluent NP concentrations (C/C0) obtained (from NP
breakthrough curves) were employed to determine NP attachment efficiencies (α) as
follows:
)/ln(
)1(32
00
CCL
dc
ηεα
−−= (1)
Here, dc is the collector (grain) diameter, ε is the packed bed porosity, L is the packed bed
length and η0 is the single-collector contact efficiency, determined using the Tufenkji-
Elimelech correlation equation (Tufenkji and Elimelech 2004).
Considering the traditional Derjaguin-Landau-Verwey-Overbeek (DLVO) theory
of colloidal stability, nTiO2 deposition is expected to be favorable at pH 3, due to
oppositely charged particles and sand grains. At pH 7 and 9, unfavorable deposition is
expected, with increasing deposition at higher IS due to EDL compression.

106
Experimentally, however, significant nTiO2 deposition is observed regardless of pH and
IS (Figure 3.2), with calculated α values ranging between 0.75 and 1 under most
conditions. Generally, α is highest at pH 7, followed by α (pH 3) and α (pH 9). Based on
the pHzpc, aggregation is expected to be greatest at pH 7. NTA particle sizes (Table 3.1)
suggest that aggregates are largest at pH 7, followed by pH 9 and then pH 3 (Table 3.1).
Increasing solution IS results in EDL compression, thus further enhancing NP aggregation
(as observed by DLS; Table 3.1). Since the transport experiments were conducted using
fine silica sand, the retention of larger aggregates by physical straining is likely, leading to
particle entrapment within the clogged pores. Indeed, the trend in NP retention is in
agreement with a mechanism of physical straining, as retention is greatest at pH 7, where
the largest aggregates are expected. Also, under most conditions examined (except at pH
3, 1 and 10 mM NaNO3), NP deposition increases with time, indicative of enhanced
physical straining due to pore clogging or the presence of larger aggregates in the influent
NP suspensions (Figure 3.2). In contrast to this study, Ben-Moshe et al. observed higher
nTiO2 particle elution at pH 7, with 62% and 13% of particles eluting at 10 and 100 mM
NaCl, respectively (Ben-Moshe et al. 2010). In their study, larger spherical glass bead
collectors (d=1 mm) were used, while the present study made use of fine (d=256 μm)
angular sand. The use of larger, rounder collectors would lessen the impact of physical
straining (Tufenkji et al. 2004).

107
Figure 3.2 nTiO2 breakthrough curves as a function of NaNO3 IS at (a) pH 3, (b) pH 7, and (c) pH 9. Experiments were conducted using columns packed with clean quartz sand. (d) nTiO2 particle attachment efficiencies (α) determined using Eq. (1) and the measured particle breakthrough data.
3.6 CONCLUSIONS
This study found that nTiO2 aggregated rapidly, yielding highly polydisperse
suspensions. Additionally, the particle EPM alone was insufficient in predicting NP
suspension stability, as particles exhibiting large absolute EPMs experienced significant
aggregation. Aggregation occurred at all pH values tested, regardless of the pHzpc. While
nTiO2 deposition onto sand surfaces was generally high, it was also found to be dynamic,
with decreasing particle elution over time observed due to physical straining. This data
suggests that upon release into the aquatic environment, bare nTiO2 may experience
limited mobility due to aggregate formation. However, given that a majority of
commercially and industrially employed NPs will be surface-functionalized, stabilized, or
1 2 30.0
0.1
0.2
0.3
0.4
C/C 0
Pore Volumes
1 2 30.0
0.1
0.2
0.3
0.4
C/C 0
Pore Volumes
(a) pH 3
(d)
(b) pH 7
(c) pH 9
0 50 100 150 2000.00.20.40.60.81.01.2
Atta
chm
ent E
fficie
ncy
Ionic Strength (mM)
pH 3 pH 7 pH 9
1 2 30.0
0.1
0.2
0.3
0.4
Pore Volumes
1 mM NaNO3
10 mM NaNO3
60 mM NaNO3
100 mM NaNO3
200 mM NaNO3C/C 0
108
matrix-embedded, various derivatives of these basic metal oxide NP types may exhibit far
greater mobility upon release.
3.7 ACKNOWLEDGEMENTS
This research was supported by NSERC, the Canada Research Chairs Program and
the Canada Foundation for Innovation. ARP is funded by NSERC and a McGill
Engineering Doctoral Award. FR and SJB are partially supported by McGill Summer
Undergraduate Research in Engineering awards. The authors thank K.J. Wilkinson and F.
Duquette-Murphy for NTA assistance, and J. Fatisson for SEM assistance.
109
3.8 REFERENCES
Aitken, R.J., Chaudhry, M.Q., Boxall, A.B.A. and Hull, M. (2006) Manufacture and use of nanomaterials: Current status in the UK and global trends. Occupational Medicine 56(5), 300-306. Ben-Moshe, T., Dror, I. and Berkowitz, B. (2010) Transport of metal oxide nanoparticles in saturated porous media. Chemosphere 81(3), 387-393. Duan, Y., Liu, J., Ma, L., Li, N., Liu, H., Wang, J., Zheng, L., Liu, C., Wang, X., Zhao, X., Yan, J., Wang, S., Wang, H., Zhang, X. and Hong, F. (2010) Toxicological characteristics of nanoparticulate anatase titanium dioxide in mice. Biomaterials 31(5), 894-899. Ghosh, S., Mashayekhi, H., Pan, B., Bhowmik, P. and Xing, B.S. (2008) Colloidal behavior of aluminum oxide nanoparticles as affected by pH and natural organic matter. Langmuir 24(21), 12385-12391. Guzman, K.A.D., Finnegan, M.P. and Banfield, J.F. (2006) Influence of surface potential on aggregation and transport of titania nanoparticles. Environmental Science & Technology 40(24), 7688-7693. Iavicoli, I., Leso, V., Fontana, L. and Bergamaschi, A. (2011) Toxicological effects of titanium dioxide nanoparticles: A review of in vitro mammalian studies. European Review for Medical and Pharmacological Sciences 15(5), 481-508. Lecoanet, H.F., Bottero, J.Y. and Wiesner, M.R. (2004) Laboratory assessment of the mobility of nanomaterials in porous media. Environmental Science and Technology 38(19), 5164-5169. Mueller, N.C. and Nowack, B. (2008) Exposure modeling of engineered nanoparticles in the environment. Environmental Science and Technology 42(12), 4447-4453. Petosa, A.R., Brennan, S.J., Rajput, F. and Tufenkji, N. (2012) Transport of two metal oxide nanoparticles in saturated granular porous media: Role of water chemistry and particle coating. Water Research 46(4), 1273-1285. Petosa, A.R., Jaisi, D.P., Quevedo, I.R., Elimelech, M. and Tufenkji, N. (2010) Aggregation and deposition of engineered nanomaterials in aquatic environments: Role of physicochemical interactions. Environmental Science and Technology 44(17), 6532-6549. Sharma, V.K. (2009) Aggregation and toxicity of titanium dioxide nanoparticles in aquatic environment--a review. Journal of Environmental Science and Health. Part A, Toxic/Hazardous Substances & Environmental Engineering 44(14), 1485-1495.
110
Tufenkji, N. and Elimelech, M. (2004) Correlation equation for predicting single-collector efficiency in physicochemical filtration in saturated porous media. Environmental Science and Technology 38(2), 529-536. Tufenkji, N., Miller, G.F., Ryan, J.N., Harvey, R.W. and Elimelech, M. (2004) Transport of Cryptosporidium oocysts in porous media: Role of straining and physicochemical filtration. Environmental Science and Technology 38(22), 5932-5938. Yao, K.M., Habibian, M.T. and O'Melia, C.R. (1971) Water and waste water filtration: Concepts and applications. Environmental Science and Technology 5(11), 1105-1112.
111
CHAPTER 4: TRANSPORT OF TWO METAL OXIDE NANOPARTICLES IN SATURATED GRANULAR POROUS MEDIA: ROLE OF WATER CHEMISTRY AND PARTICLE
COATING

112
4.1 PREFACE
Following on the work presented in Chapter 3, additional bare nanosized titanium
dioxide (nTiO2) transport experiments were performed. In conducting these experiments,
it became apparent that suspended nTiO2 particles exhibited extensive aggregation and
significant retention within the packed columns, regardless of sodium nitrate (NaNO3) pH
and ionic strength (IS). Along with sodium, divalent calcium and magnesium are major
constituents in natural groundwater environments. Thus, attempts were made to suspend
the particles in divalent salts such as calcium chloride (CaCl2) and examine their transport
behavior. However, stable bare nTiO2 suspensions could not be obtained in divalent salt
solutions, limiting the number of conditions that could be examined. Given this limitation
and the fact that NPs in commercial products are generally surface-functionalized,
stabilized, or matrix-embedded, experiments examining the transport of polymer-coated
particles in more complex aquatic matrices were undertaken.
Along with bare nTiO2 experiments, transport studies with poly(acrylic acid)
(PAA)-coated nTiO2 were performed and the impact of the PAA coating on particle
stability and retention examined. Furthermore, experiments with bare and PAA-coated
nanosized zinc oxide (nZnO), another common metal oxide nanoparticle, were performed.
Transport experiments with the polymer-coated nTiO2 and nZnO in CaCl2 suspensions
were included in this study. The work presented in Chapter 4 was published in Water Res
2012; 46 (4): 1273-1285.
113
4.2 ABSTRACT
The growing use of nanosized titanium dioxide (nTiO2) and zinc oxide (nZnO) in a
large number of commercial products raises concerns regarding their release and
subsequent mobility in natural aquatic environments. In this study, laboratory-scale sand-
packed column experiments were conducted with bare and polymer-coated nTiO2 and
nZnO to improve our understanding of the mobility of these nanoparticles in natural or
engineered water saturated granular systems. The nanoparticles were characterized over a
range of environmentally relevant water chemistries using multiple complimentary
techniques: dynamic light scattering, nanoparticle tracking analysis, transmission electron
microscopy, and scanning electron microscopy. Overall, bare (uncoated) nanoparticles
exhibit high retention within the water saturated granular matrix at solution ionic strengths
(IS) as low as 0.1 mM NaNO3 for bare nTiO2 and 0.01 mM NaNO3 for bare nZnO. Bare
nTiO2 and nZnO also display dynamic (time-dependent) deposition behaviors under
selected conditions. In contrast, the polymer-coated nanoparticles are much less likely to
aggregate and exhibit significant transport potential at IS as high as 100 mM NaNO3 or 3
mM CaCl2. These findings illustrate the importance of considering the extent and type of
surface modification when evaluating metal oxide contamination potential in granular
aquatic environments.
114
4.3 INTRODUCTION
The nanotechnology industry is expected to reach a market value of $1 trillion by
2015 (Robichaud et al. 2005). According to the US National Nanotechnology Initiative, a
substance can be classified as a nanomaterial (NM) if its constituent particles, or
nanoparticles (NPs), possess one or more dimensions between 1 and 100 nm in size
(Englert 2007, Robichaud et al. 2005). With the number of NM-containing industrial
products growing, the toxicity of their nanosized components has been brought to
question, with the scientific community and public expressing their concerns (Maynard et
al. 2006, Suzuki et al. 2007). Environmental discharge can occur as a result of NM
manufacturing, consumption and disposal (Mueller and Nowack 2008, Nowack and
Bucheli 2007, Wiesner and Bottero 2007) and NM release into aquatic systems can result
in heightened human and environmental exposure to potentially harmful particles.
Nanosized titanium dioxide (nTiO2) and zinc oxide (nZnO) are known for their
ability to absorb UV radiation, and are included in cosmetic and dermatological products
(Dufour et al. 2006, Englert 2007, Mueller and Nowack 2008, Sayes et al. 2006). nTiO2 is
also sought for its photovoltaic and photocatalytic properties (Tseng and Lin 2003) and is
an ingredient in paints, coatings, and building materials (Aitken et al. 2006). Moreover,
nTiO2 is a promising candidate for the remediation of contaminated subsurface
environments as a high specific surface area enables it to adsorb heavy metals and it has
been found to effectively remove arsenic, uranium, lead and technetium (Choy et al. 2008,
Pena et al. 2005). nZnO, another versatile inorganic NP, is utilized in electronics, optics,
photonics and pigment applications such as coatings and paints (Adams et al. 2006, Lin
and Xing 2008, Wang 2004). Dual semiconducting and piezoelectric properties make
115
nZnO a valuable material in optoelectronic and photovoltaic devices, lasers, transducers
and sensors (Wang 2004, Zhou et al. 2006).
Toxicological studies are gradually shedding light on the potential organismal
health threats posed by nTiO2 and nZnO exposure. Both in vitro and in vivo toxicity
studies have indicated that these particles could be harmful to humans (Huang et al. 2010,
Moos et al. 2010, Schanen et al. 2009, Sharma et al. 2009), rodents (Duan et al. 2010, Hu
et al. 2010, Ma et al. 2010, Warheit et al. 2007), fish (Bai et al. 2010, Federici et al. 2007,
Hao et al. 2009), bacteria (Fang et al. 2010, Ge et al. 2011, Reddy et al. 2007, Sinha et al.
2011) and other organisms (Mortimer et al. 2010, Roh et al. 2010, Valant et al. 2009).
Because of their significant commercial relevance and potential toxicity, the
environmental fate of nTiO2 and nZnO is of growing interest. Once released into aquatic
environments, the potential ecotoxicological and public health risks associated with metal
oxide nanoparticles will be influenced by their fate and transport within these systems.
Hence, a number of researchers have examined the aggregation and deposition behavior of
various NPs in granular aqueous systems in an effort to better understand their
contamination potential in the natural subsurface (groundwater) or engineered (deep-bed)
water filtration systems (Petosa et al. 2010).
Limited studies have examined nTiO2 aggregation and deposition in granular
porous media, with conflicting findings (Petosa et al. 2010). For example, Choy et al.
(Choy et al. 2008) investigated the transport of nTiO2 suspensions through sand-packed
columns at various flow velocities. Under all conditions examined, high particle retention
was observed. Retention was unaffected by flow velocity and a majority of the particles
were retained in the first few centimeters of sand. These researchers suggested that
distinct transport processes may occur at different column depths (Choy et al. 2008). In
116
contrast, Guzman et al. (Guzman et al. 2006) found that although nTiO2 aggregated over a
large range of solution chemistries, aggregates were not retained even under favorable
deposition conditions (i.e., oppositely charged NP and collector surfaces). In contrast,
Fatisson et al. (Fatisson et al. 2009) showed that deposition of nTiO2 did readily occur
under conditions favorable for deposition onto a model sand (silica) surface. Indeed, these
researchers found that nTiO2 deposition rates onto silica were greatest under conditions
deemed favorable for deposition; namely, low IS and pH below the NP point of zero
charge (pHpzc). Nano-TiO2 deposition rates onto the model sand surface were much lower
when particles and collector surfaces carried a like charge at a pH of 9 (Fatisson et al.
2009).
Very few studies have examined nZnO transport and deposition in aquatic systems
and none have investigated transport in water-saturated sand media. Ben-Moshe et al.
examined the transport behavior of nTiO2 and nZnO particles in columns packed with
glass beads. These researchers demonstrated that while increasing solution IS resulted in
heightened metal oxide NP deposition, the presence of dissolved humic acid enhanced NP
mobility. At neutral pH, nTiO2 exhibited far greater mobility than nZnO (62% elution
versus 1.4% elution in 10 mM NaCl, respectively). In the presence of humic acid, nZnO
elution from the column packed with glass beads was found to range between 68 to 74%
(depending on the flow rate), while 98% of the nTiO2 eluted (regardless of flow rate)
(Ben-Moshe et al. 2010). Jiang et al. examined the deposition kinetics of nZnO onto bare
and humic acid coated silica surfaces (Jiang et al. 2010). Overall, the results of their study
were in qualitative agreement with the Derjaguin-Landau-Verwey-Overbeek (DLVO)
theory of colloidal stability (Derjaguin and Landau 1941, Verwey and Overbeek 1948);
namely, greater nZnO deposition onto bare silica was observed with increasing solution IS

117
when particle and collector surfaces were negatively charged. Moreover, while the
presence of divalent salt resulted in heightened deposition, the presence of humic acid on
the silica surface generally hindered deposition.
The purpose of this study is to evaluate the transport potential of bare and
polymer-coated nTiO2 and nZnO particles in granular aquatic environments. Well-
controlled laboratory experiments were conducted to assess the transport behavior of
selected bare and polymer-coated metal oxide NPs over a range of solution IS in the
presence of monovalent and divalent salts. The hydrodynamic diameters of the suspended
NPs were also evaluated using dynamic light scattering (DLS) and nanoparticle tracking
analysis (NTA). The flow rate and sandy collectors employed in this study may be
representative of those which are encountered in riverbank and slow sand filtration (Ray et
al. 2003), thus providing insight into the effectiveness of these two treatment approaches
in retaining suspended metal oxide NPs.
4.4 MATERIALS AND METHODS
4.4.1 NANOPARTICLE SUSPENSION PREPARATION
Bare nTiO2 (5 nm by transmission electron microscopy (TEM)) and nZnO (20 nm
by TEM) (Nanostructured & Amorphous Materials, Inc.) and polymer-coated nTiO2 (3-4
nm by TEM) and nZnO (3-9 nm by TEM) powders (Vive NanoTM, now known as Vive
Crop ProtectionTM) were used to prepare the NP suspensions. The crystalline form of the
NPs was anatase for the nTiO2 and amorphous for nZnO. Details on product purity are
provided in the Supplementary Material section. The Vive NanoTM particles are coated
with partially crosslinked poly(acrylic acid). Bare and polymer-coated particle stock

118
suspensions were prepared using (with minor alterations) the Protocol for Nanoparticle
Dispersion provided by the PROSPEcT Global Nanomaterials Safety partnership
(http://www.nanotechia-
prospect.org/managed_assets/files/prospect_dispersion_protocol.pdf). Briefly, 0.1 g of
NP powder was weighed into a 250 mL beaker containing a few drops of deionized (DI)
water. The NPs were then mixed with a stainless steel spatula, and the beaker filled to
200 mL with DI water, stirred, and then ultrasonicated for 60 sec (90% amplitude, 4A,
50/60 Hz, Hielscher UP200S Ultrasonic Processor), yielding a 0.5 g/L stock suspension.
All stock suspensions were kept for a maximum of two days at 4°C.
nTiO2 and nZnO suspensions for experimentation (30 and 100 mg/L
concentrations, respectively) were prepared by diluting the stock suspensions in sodium
nitrate (NaNO3, Sigma-Aldrich) with IS ranging from 0.1 – 1000 mM for nTiO2 and 0.01
to 1000 mM for nZnO. Polymer-coated nanoparticle suspensions were also examined in
solutions of 1 – 10 mM CaCl2 (Sigma-Aldrich). The pH of nTiO2 suspensions was
maintained at 7 using 1 mM MOPS (3-(N-morpholino)propanesulfonic acid, Sigma-
Aldrich). Theoretical predictions of ZnO dissolution (based on the chemical equilibrium
model Visual MINTEQ) indicate that virtually all of the nZnO would dissolve at or below
pH 7. For this reason, experiments conducted with nZnO were performed at pH 8. NP
suspensions were stored for ~20 hrs (in the dark) prior to conducting characterization and
transport experiments. Immediately prior to each experiment, suspension flasks were
gently inverted manually and then analyzed.

119
4.4.2 NANOPARTICLE IMAGING
Field emission gun scanning electron microscopy (FEG-SEM) (Hitachi S-4700)
was employed to characterize nZnO aggregates. Prior to imaging, nTiO2 suspensions
were left to dry on glass slides and Au/Pd coated using a sputter coater. SEM slides (glass
coverslips) were prepared as follows. First, coverslips were soaked in 100 mL of 70%
HNO3 in a glass beaker at room temperature for 10 min with occasional swirling. The
coverslips were rinsed with tap water for 30 min, then rinsed with DI water and left to
soak in DI water for 10 min (with occasional swirling). This rinsing procedure was
repeated three times. Finally, the coverslips were soaked in 100 mL methanol (Fisher) for
an additional 10 min, air-dried in a fume hood overnight and then stored in a clean glass
Petri dish. To prepare SEM samples, coverslips were placed into a 24-well polystyrene
plate, rinsed three times with 1 mL DI water and then once with NP suspension to avoid
dilution. Next, 1 mL of NP suspension was added to each well. After 4 h, the remaining
liquid was carefully removed using a pipette and the glass slides were left to dry
overnight. SEM analysis was performed the following day, subsequent to Au/Pd coating.
TEM images of bare nTiO2 and nZnO powders were obtained by dusting particles
onto a carbon/formvar-coated copper grid and using a model JEM-2100F field emission
electron microscope set at 200 kV (JEOL Canada Inc., St Hubert, QC, Canada).
4.4.3 NANOPARTICLE SIZE AND ELECTROKINETIC CHARACTERIZATION
NP hydrodynamic diameters (number mean) were determined by dynamic light
scattering (DLS) using a Malvern Zetasizer Nano. Hydrodynamic diameters were also
determined by nanoparticle tracking analysis (NTA), using a Nanosight LM10 (with an
120
LM14 viewing unit) NTA system (Nanosight, Wiltshire, UK). At least three independent
replicate samples were analyzed using DLS and NTA. NP electrophoretic mobilities
(EPMs) were determined by laser Doppler velocimetry (ZetaSizer Nano ZS, Malvern).
All EPM measurements were performed at 25oC, with an applied electrical field (E) of 4.9
± 0.1 V/m.
4.4.4 NANOPARTICLE TRANSPORT AND DEPOSITION STUDIES
Nanoparticle transport studies were performed using glass columns (16 mm inner
diameter, GE Life Sciences) packed with high purity fine quartz sand (-50 +70 mesh size,
d50 = 256 µm, Sigma-Aldrich). Prior to use, sand was acid-washed as previously
described (Litton and Olson 1993, Pelley and Tufenkji 2008) to remove impurities.
Before all transport experiments, the required mass of sand was soaked in
electrolyte for a minimum of 16 hrs. To ensure uniform packing, sand was wet packed
into glass columns using gentle vibration yielding a packed-bed porosity of 0.37. To
further condition the collector surfaces, at least ten pore volumes (PVs) of electrolyte (at
the desired pH and IS) were pumped through the packed column prior to injecting the NP
suspension. A UV-visible spectrophotometer (1 cm flow-through cell, Agilent 8453) was
used to obtain real-time influent (C0) and effluent (C) particle concentration
measurements. The presence of a polymer coating altered the wavelengths at which NPs
could be monitored. While bare nTiO2 and nZnO were observed at λ=550 and 369 nm
respectively, polymer-coated NPs were observed at λ=250 (nTiO2) and 300 nm (nZnO).
At least three PVs of the NP suspension were injected into the column to allow
observation of initial particle breakthrough and any time-dependent changes in NP elution
121
behavior. The flow rate for all deposition experiments was 0.5 mL/min (equivalent to an
approach or Darcy velocity of 3.6 m/day). Deposition data was highly reproducible and
each breakthrough curve reported is the average of 3 column experiments.
To confirm the results obtained by UV-visible spectrophotometry, column influent
and effluent NP concentrations were also obtained using inductively coupled plasma
atomic emission spectroscopy (ICP-AES) (Thermo Jarrell Ash, Trace Scan). Column
effluent samples (0.5 mL) were collected in polypropylene tubes following UV-visible
analysis, digested with 100 µL of 70% HNO3 and then stored overnight at 4oC. Prior to
ICP-AES analysis, 400 µL of each sample was diluted in 1600 µL of the corresponding
NaNO3 electrolyte. Representative ICP-AES data is provided (Supplementary Material,
Figure S4.1). Additionally, the relative stability of the NP suspensions was confirmed by
sedimentation tests (UV-visible spectrophotometry) and DLS measurements (ZetaSizer
Nano) (data not shown). In this study, suspensions are referred to as stable when
sedimentation tests and DLS measurements indicated that sample absorbance and
aggregate size, respectively, did not fluctuate over the time course of a column
experiment.
4.4.5 nZnO DISSOLUTION
It is known that nZnO is prone to dissolution (Domingos et al. 2009a, Franklin et
al. 2007). The extent of nZnO dissolution was verified experimentally using a dialysis
technique as described by Franklin et al. (Franklin et al. 2007) with some minor
alterations. Briefly, 1000 Da MWCO Spectra/Por 7 dialysis membranes were filled with
DI water and placed into 5 L beakers containing 100 mg/L nZnO suspensions (pH 8, 1

122
mM NaNO3). The concentration of Zn2+ ion present in 100 mg/L ZnO particle
suspensions (pH 8 ± 0.2) was determined over a time span of 26 h (Figure S4.2), which is
equivalent to the duration of a complete transport experiment including suspension
preparation and equilibration periods. Prior to sampling, the membrane surface was wiped
carefully with a Kimwipe, and samples were removed from within the dialysis membranes
using a syringe (mounted with a BD 18G1 needle). Next, 4 mL of sample was placed into
a polypropylene tube containing 1 mL HNO3, and the samples were digested for 1 hr at
90oC, stored overnight at room temperature and finally analyzed by ICP-AES. Two
samples originating from different dialysis bags were analyzed for each time point and the
suspension pH remained 8 ± 0.1 throughout the dialysis experiments. As only a negligible
fraction (~1-2%) of the nZnO was found to dissolve over the time course of an experiment
(Supplementary Material, Figure S4.2), it can be assumed that dissolution does not affect
particle deposition or aggregation under the conditions examined here. nZnO dissolution
at pH 8 was also determined theoretically using the chemical equilibrium model Visual
MINTEQ ver. 3.0, and the concentration of dissolved Zn2+ predicted to be ~1.5 mg/L.
4.5 RESULTS AND DISCUSSION
4.5.1 NANOPARTICLE PROPERTIES
4.5.1.1 Size of suspended nTiO2 and nZnO particles
Particle size is one of the key factors influencing NP transport behavior in granular
aqueous systems (Petosa et al. 2010). In aquatic environments, the actual size of many
NMs is typically far greater than reported nominal sizes due to stable aggregate formation
(Dhawan et al. 2006, Lecoanet et al. 2004, Lecoanet and Wiesner 2004). In this study,

123
several complimentary particle sizing techniques were used to characterize the nTiO2 and
nZnO suspensions and original powders. Although all NP suspensions used in this study
were prepared from powders having small nominal sizes (3-5 nm and 3-20 nm for nTiO2
and nZnO, respectively), SEM imaging clearly demonstrates polydispersity within the
suspensions, with micron-sized and nano-sized aggregates present (Figure 4.1).
Figure 4.1 SEM image of bare nZnO (pH 8, 0.1 mM NaNO3).
TEM images of the bare NP powders demonstrate that many particles aggregated
even prior to suspension preparation (Figure 4.2). Although this is expected because of
the strong van der Waals force in the solid state, it is interesting that the two different
metal oxides exhibit different types of aggregation. TEM images of the bare nTiO2
powder show the formation of densely packed aggregates (Figure 4.2b), whereas images
of the bare nZnO powder reveal the presence of less densely packed aggregates, with

124
clearly defined individual particles within the aggregates (Figure 4.2d). TEM images of
nZnO also confirm the 20 nm nominal size.
Figure 4.2 TEM images of (a, b) bare nTiO2 and (c, d) bare nZnO powders.
In addition to the SEM and TEM imaging, DLS particle sizing also signals the
presence of large aggregates (> 500 nm) in the suspensions of bare NPs at higher IS
20 nm
(c)
50 nm
(a)
50 nm
(b)
20 nm
(d)

125
(Table 4.1). Bare nTiO2 particle sizes obtained by DLS generally reveal an increase in
particle (or aggregate) size with increasing solution IS. Specifically, for the bare nTiO2,
the particle size increases from ~128 nm at 0.1 mM NaNO3 to ~934 nm at 100 mM
NaNO3 (based on DLS). As expected, the NTA measurements do not capture the larger
sized particles present at high IS (Carr et al. 2008). Bare nZnO is examined over a smaller
range of IS due to the decreased stability of this material; namely, the bare nZnO particle
size exceeds 1 µm at an IS of 10 mM NaNO3 (Table 4.1). DLS and NTA measurements
suggest that bare nZnO size increases with heightened salt concentrations, as expected due
to electrical double layer (EDL) compression and subsequent aggregation. The bare
nTiO2 and nZnO particles were not studied in divalent salt solutions as preliminary
measurements revealed these suspensions to be highly unstable, even at very low solution
IS.
Table 4.1 also lists values of the polydispersity index (PdI) from the DLS
measurements. The PdI is an indicator of the polydispersity of the suspension where a
value < 0.1 reflects a relatively narrow monomodal distribution, a value between 0.1 and
0.5 suggests a broader distribution, and a value exceeding 0.5 indicates that the particle
size distribution is very broad and the cumulants analysis approach may not be valid.
Interestingly, PdI values are on the order of 0.5 or greater for suspensions of bare nTiO2
but lower (on the order of 0.3) for the bare nZnO even though the latter exhibits a lower
critical coagulation concentration (CCC) as estimated from the sizing data. This suggests
that the bare nTiO2 forms aggregates of varying size whereas the size distribution of nZnO
aggregates is narrower.

126
Table 4.1 Measured hydrodynamic diameter, electrophoretic mobility (EPM) and calculated attachment efficiencies for nTiO2 and nZnO.
ParticleIonic
Strength (mM NaNO3)
Ionic Strength
(mM CaCl2)pH dDLS*
(nm)DLS PdI dNTA*
(nm)EPM*
(μmcmV-1s-1)α DLS
a α NTAa
0.1 128 ± 21 0.53 155 ± 7 -1.60 ± 0.03 0.20 ± 0.01 0.23 ± 0.011 1001 ± 50 0.46 153 ± 17 -1.32 ± 0.19 0.59 ± 0.01 0.45 ± 0.0110 1001 ± 83 0.47 296 ± 20 -1.06 ± 0.01 0.78 ± 0.08 0.94 ± 0.09
100 934 ± 149 0.71 316 ± 214 -0.95 ± 0.07 1.1 ± 0.06 1.2 ± 0.07
1 18 ± 2 0.29 100 ± 11 -2.38 ± 0.16 0.014 ± 0.001 0.055 ± 0.00510 19 ± 2 0.33 106 ± 5 -2.43 ± 0.07 0.014 ± 0.002 0.056 ± 0.009
100 22 ± 3 0.26 119 ± 10 -1.53 ± 0.18 0.016 ± 0.004 0.060 ± 0.02200 67 ± 2 0.25 114 ± 8 -1.48 ± 0.10 ND ND1000 214 ± 49 0.85 108 ± 15 NM 0.81 ± 0.04 0.48 ± 0.02
1 32 ± 20 0.23 102 ± 4 -2.55 ± 0.18 1.4×10⁻⁴ ± 2.5×10⁻⁴ 3.4×10⁻⁴ ± 6.2×10⁻⁴
3.33 73 ± 11 0.28 134 ± 15 -1.22 ± 0.02 0.069 ± 0.05 0.11 ± 0.078 393 ± 48 1.0 169 ± 29 -0.95 ± 0.06 0.63 ± 0.16 0.42 ± 0.1110 ND ND 159 ± 47 -0.99 ± 0.03 ND 0.59 ± 0.13
0.01 201 ± 9 0.30 139 ± 10 1.53 ± 0.10 0.77 ± 2.9×10⁻⁴ 0.59 ± 2.3×10⁻⁴
0.1 169 ± 7 0.21 140 ± 7 1.95 ± 0.02 0.62 ± 0.02 0.54 ± 0.021 361 ± 25 0.33 137 ± 5 2.00 ± 0.07 0.88 ± 0.08 0.49 ± 0.043 1123 ± 116 0.38 177 ± 16 1.29 ± 0.17 0.35 ± 0.02 0.50 ± 0.0210 1357 ± 196 0.31 213 ± 50 0.56 ± 0.07 0.40 ± 0.07 0.88 ± 0.15
10 10 ± 1 0.64 144 ± 15 -1.95 ± 0.08 2.4×10 -6 1.9×10 -5
100 13 ± 1 0.52 180 ± 22 -0.98 ± 0.11 7.4×10⁻⁴ ± 0.001 0.0058 ± 0.01300 266 ± 13 0.93 199 ± 23 NM 0.12 ± 0.04 0.10 ± 0.031000 255 ± 45 0.58 203 ± 32 NM 0.12 ± 0.003 0.11 ± 0.003
1 176 ± 13 0.23 168 ± 9 -1.75 ± 0.08 0.020 ± 0.02 0.019 ± 0.023.33 374 ± 17 0.84 261 ± 15 -1.47 ± 0.05 0.071 ± 0.06 0.068 ± 0.06
8 340 ± 192 1 284 ± 127 -1.08 ± 0.05 1.1 ± 0.21 1.0 ± 0.2010 393 ± 49 1 256 ± 118 -1.00 ± 0.06 1.4 ± 0.05 1.4 ± 0.04
* Values represent means ± 95% CI.
ND = This measurement or calculated value was not determined.NM = This value is not reported as reproducible measurements could not be obtained.
a Values in italics are estimated using C/C 0 = 0.9999 as complete breakthrough is observed at these conditions.
n ZnO (polymer-coated) 8
7
7n TiO2 (bare)
n ZnO (bare) 8
n TiO2
(polymer-coated)

127
The polymer-coated nanoparticle suspensions are significantly more stable over a
wider range of solution chemistries (Table 4.1). Polymer-coated nTiO2 exhibits little or
no aggregation (dDLS~20 nm) and generally low polydispersity (PDI ≤ 0.3) from 1 to 100
mM NaNO3. The particle size (dDLS~200 nm) and PDI (0.85) increase significantly at the
highest IS examined (1000 mM NaNO3), yet, the aggregates are still much smaller at this
high IS than those formed with the bare nTiO2 at 100 mM NaNO3. A similar trend is
noted for polymer-coated nTiO2 suspended in CaCl2, whereby the mean DLS particle size
and the PDI greatly increased at 8 mM IS. The hydrodynamic size (by DLS) and EPM of
the polymer-coated nTiO2 could not be evaluated at IS higher than 8 mM CaCl2 due to the
significant instability of prepared suspensions. Yet, overall, the polymer coating of the
nTiO2 renders this material more stable as evidenced by the lower particle sizes measured
in the divalent salt solution versus those evaluated for the bare particle in a monovalent
salt solution. Polymer-coated nZnO is also generally stable in suspension as evidenced by
the sizing measurements: for instance, dDLS~13 nm (at 100 mM NaNO3) for the polymer-
coated particle, whereas the size of the bare NP exceeds 1300 nm at 10 mM IS.
Measurements were also conducted with polymer-coated nZnO in the presence of the
divalent salt. Although mean DLS particle sizes do not exceed those measured for the
bare particle in a monovalent salt of comparable IS, PDI values significantly exceeded 0.5
at higher CaCl2 concentrations. Hence, these DLS measurements at the highest [CaCl2]
are likely less reliable.
While DLS data is useful for identifying trends in particle size, the hydrodynamic
diameters obtained by DLS should be considered as estimates of particle or aggregate size.
DLS is best suited for the analysis of NP suspensions exhibiting simple (e.g., monomodal
or bimodal) particle size distributions (Ryan and Elimelech 1996). Many of the NP
128
suspensions employed in this study were polydisperse (Table 4.1). Since Rayleigh
scattering is proportional to the particle diameter raised to the 6th power, the reported dDLS
are biased by the largest aggregates (Domingos et al. 2009a). Hence, DLS should not be
employed as the sole characterization method. Thus, we also used TEM, SEM and NTA
to (i) investigate the aggregation state of the particles prior to suspension in background
electrolytes, (ii) confirm the presence of nanosized particles within the suspensions and
(iii) observe the impact of solution chemistry on aggregate size, respectively.
nTiO2 aggregation has been observed at extreme pHs (e.g., pH 1, 2), away from
the pHpzc, where all particles carry like charges (Guzman et al. 2006, Pettibone et al.
2008). As the pHpzc is approached, interparticle repulsive forces decrease, thus
heightening aggregation (Domingos et al. 2009b). Aqueous titania (primarily anatase,
with a nominal size between 5-12 nm) suspensions have previously been found to be more
stable under acidic conditions, with observed aggregate sizes not necessarily symmetric
around the pHpzc (Guzman et al. 2006). Those particles were synthesized by controlled
hydrolysis. In another study utilizing commercially available particles, it has been
reported that at pHs far from the pHpzc, smaller (5 nm) primary anatase nTiO2 particles
(from Nanostructured and Amorphous Materials, Inc) generated larger aggregates than 32
nm particles (from Alfa Aesar) (Pettibone et al. 2008). Thus, the small nominal particle
sizes employed in the present study potentially increased the extent of aggregation.
4.5.1.2 Electrokinetic characterization of suspended nTiO2 and nZnO particles
NP EPMs were determined to provide an indication of the NP surface charge
under different solution conditions and to obtain the pHpzc. The pHpzc for nTiO2 depends

129
on the crystal structure and particle size (Finnegan et al. 2007, Guzman et al. 2006). The
average pHpzc reported for bulk TiO2 is 5.6, with a value of 5.9 and 5.4 for the anatase and
rutile forms, respectively (Kosmulski 2002). Smaller NPs have been found to possess
lower pHpzc values (e.g., pHpzc of 4.8 for 3.6 nm nTiO2, versus 6.2 for 8.1 nm particles)
(Finnegan et al. 2007, Guzman et al. 2006). Given the reported variations in particle
isoelectric points, the pHpzc for the bare NPs employed in this study was determined
experimentally and found to be 5.6 for nTiO2 and 9.8 for nZnO (Supplementary Material,
Figure S4.3).
Table 4.1 shows that the EPM of the nTiO2 particles is negative over the range of
IS examined (0.1 – 100 mM NaNO3 for the bare NPs and 1 – 200 mM NaNO3 for the
polymer-coated NPs) at pH 7. In the monovalent salt solution, the polymer-coated nTiO2
particles are more negatively charged than the bare NPs at corresponding IS. The
polymer-coated NPs also generally exhibit a lower absolute EPM in the divalent salt
solution versus the monovalent salt solution at corresponding IS. Finally, we observe a
decrease in the absolute EPM with increasing IS (i.e., with increased compression of the
EDL) for the bare and the polymer-coated nTiO2 particles. Using 5 nm bare nTiO2
particles (anatase, Nanostructured and Amorphous Materials, Inc) suspended in NaNO3,
Domingos et al. (Domingos et al. 2009b) also observed a decrease in EPM with increasing
IS, with an EPM of approximately 1 μmcm/Vsec observed at 100 mM IS, pH 7
(comparable to the findings presented here). Their study also reports that adding fulvic
acid to the NP suspensions produced significantly more negative EPMs, with charge
reversal observed at pH values below the pHpzc. Likewise, Joo et al. (Joo et al. 2009)
reported that carboxymethylcellulose encapsulation of nTiO2 (anatase, 10 nm nominal
size) increased the absolute particle surface charge and resulted in surface charge reversal

130
at lower pH values (below pH 5). The increase in surface charge subsequently resulted in
increased interparticle repulsion and heightened mobility in sand-packed columns.
The EPM of nZnO was also determined as a function of IS at pH 8 (Table 4.1).
Generally, nZnO NPs have been found to possess positive surface potentials at or below
pH 8 (Ben-Moshe et al. 2010, Zhang et al. 2009, Zhou and Keller 2010). Here, the EPM
of bare nZnO ranges between 1.95 and 0.555 μmcm/Vsec when the IS is varied from 0.1
to 10 mM NaNO3 at pH 8 (Table 4.1). The EPM of the bare NPs generally becomes less
positive with increasing concentration of NaNO3. Chowdhury et al. (Chowdhury et al.
2010) found that increasing the IS from 0.1 to 100 mM KCl caused nZnO (10 nm nominal
size, Meliorum Technologies) EPM to decrease from 1.81 to 0.70 m2V-1s-1 (pH 7.9).
Nonetheless, increasing the IS from 0.1 to 10 mM did not result in any significant
decrease in EPM. Rather, an obvious change was only observed between 10 to 100 mM
IS. They attributed the relatively constant EPM observed below 10 mM KCl to the
dissolution of nZnO particles and the shielding effects of the Zn2+ ions present. In
contrast, Jiang et al. (Jiang et al. 2010) found the ζ-potential of bare nZnO NPs to be
negative at pH 7.8 (1–150 mM NaCl and 0.05–5 mM CaCl2) and reported that this
discrepancy was specific to particles obtained from one particular manufacturer. Whereas
the bare nZnO particles used here exhibit a positive surface charge at pH 8, polymer-
coated nZnO exhibits a negative EPM over the range of solution conditions examined.
Similarly, Zhang et al. (Zhang et al. 2009) observed charge reversal of nZnO NPs in the
presence of natural organic matter. Hence, in the presence of polymer coatings or natural
organic matter, NP surface charge reversal may occur that can subsequently affect NP
transport and deposition. Reproducible measurements of the EPM of polymer-coated
nZnO particles could not be obtained at the higher IS conditions, hence, these are not

131
reported in Table 4.1. EPM measurements conducted at lower concentrations of CaCl2
(from 1 – 10 mM) show that the EPM of these polymer-coated particles becomes less
negative with increasing IS.
4.5.2 DEPOSITION STUDIES
4.5.2.1 Transport of bare and polymer-coated nTiO2 particles in sand-packed columns
Laboratory columns packed with clean sand were used to study the transport and
deposition behavior of the metal oxide NPs over a wide range of solution chemistries.
Representative breakthrough curves for bare and polymer-coated nTiO2 particles are
shown in Figure 4.3. Error bars have been included on this figure to demonstrate the
reproducibility of the transport experiments. To quantitatively compare NP deposition
behavior at the various solution conditions investigated, the colloid filtration theory (Yao
et al. 1971) was employed to determine NP attachment efficiencies (α) onto the sand
surface, as follows:
)/ln(
)1(32
00
CCL
dc
ηεα
−−= (1)
Here, dc is the collector (sand grain) diameter, ε is the packed bed porosity, L is the packed
bed length (3 or 10 cm), and C/C0 is the normalized NP concentration obtained from the
experimental breakthrough curves during the initial (clean-bed) phase of nanoparticle
elution; specifically, the average value of C/C0 is measured between pore volumes 1.8 to
2.0 was used (as per (Tufenkji and Elimelech 2004b, 2005)). The value of the single-
collector contact efficiency (η0) is determined using the Tufenkji-Elimelech correlation
equation (Tufenkji and Elimelech 2004a).
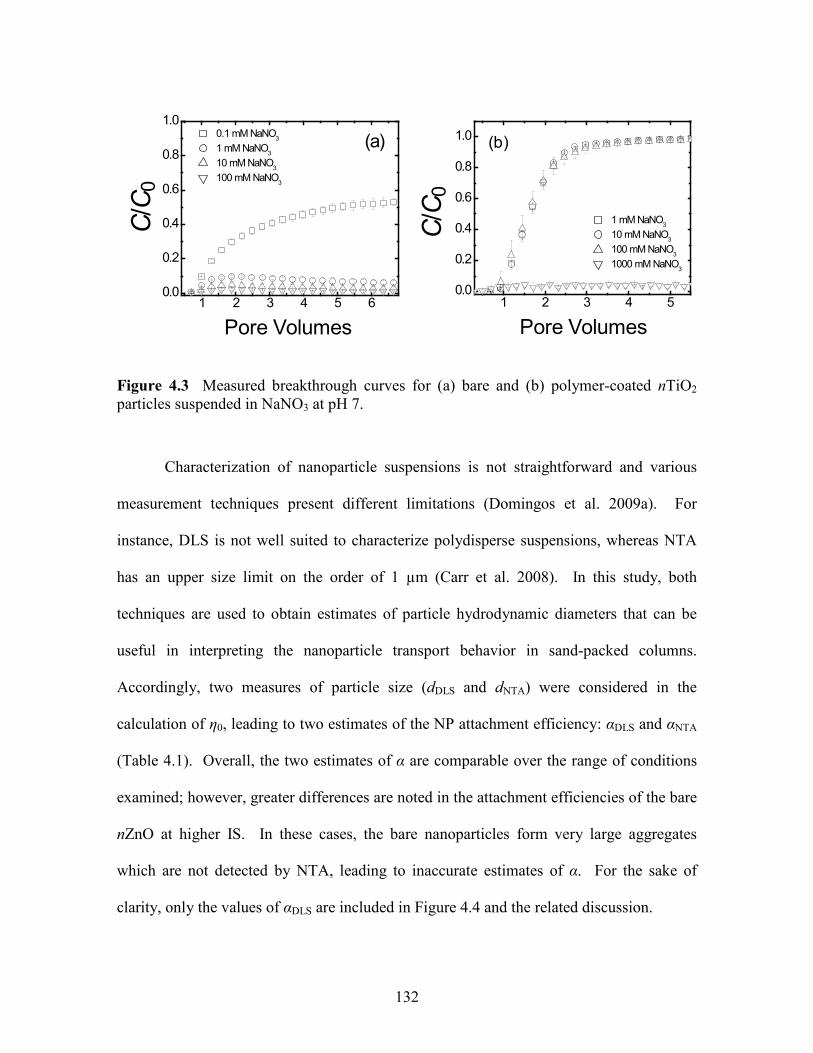
132
Figure 4.3 Measured breakthrough curves for (a) bare and (b) polymer-coated nTiO2 particles suspended in NaNO3 at pH 7.
Characterization of nanoparticle suspensions is not straightforward and various
measurement techniques present different limitations (Domingos et al. 2009a). For
instance, DLS is not well suited to characterize polydisperse suspensions, whereas NTA
has an upper size limit on the order of 1 µm (Carr et al. 2008). In this study, both
techniques are used to obtain estimates of particle hydrodynamic diameters that can be
useful in interpreting the nanoparticle transport behavior in sand-packed columns.
Accordingly, two measures of particle size (dDLS and dNTA) were considered in the
calculation of η0, leading to two estimates of the NP attachment efficiency: αDLS and αNTA
(Table 4.1). Overall, the two estimates of α are comparable over the range of conditions
examined; however, greater differences are noted in the attachment efficiencies of the bare
nZnO at higher IS. In these cases, the bare nanoparticles form very large aggregates
which are not detected by NTA, leading to inaccurate estimates of α. For the sake of
clarity, only the values of αDLS are included in Figure 4.4 and the related discussion.
1 2 3 4 5 60.0
0.2
0.4
0.6
0.8
1.0
0.1 mM NaNO3
1 mM NaNO3
10 mM NaNO3
100 mM NaNO3
C/C 0
Pore Volumes
(a)
1 2 3 4 50.0
0.2
0.4
0.6
0.8
1.0
1 mM NaNO3
10 mM NaNO3
100 mM NaNO3
1000 mM NaNO3
C/C 0
Pore Volumes
(b)(b)
Pore Volumes Pore Volumes
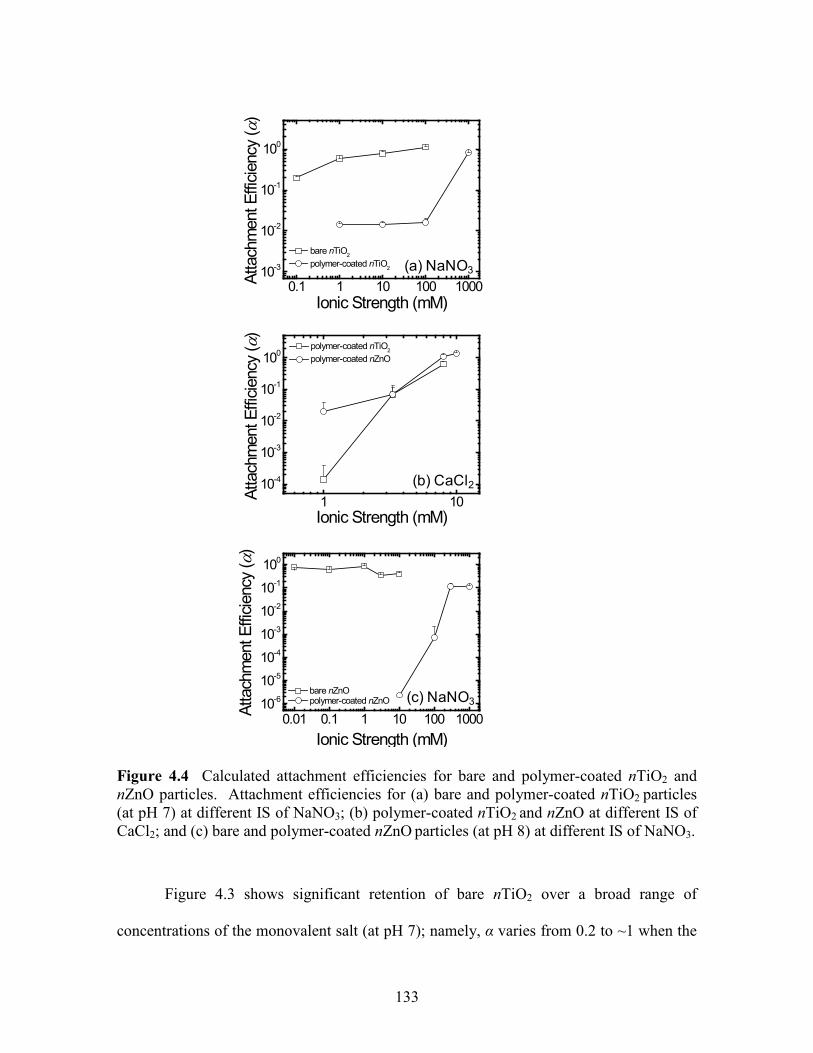
133
Figure 4.4 Calculated attachment efficiencies for bare and polymer-coated nTiO2 and nZnO particles. Attachment efficiencies for (a) bare and polymer-coated nTiO2 particles (at pH 7) at different IS of NaNO3; (b) polymer-coated nTiO2 and nZnO at different IS of CaCl2; and (c) bare and polymer-coated nZnO particles (at pH 8) at different IS of NaNO3.
Figure 4.3 shows significant retention of bare nTiO2 over a broad range of
concentrations of the monovalent salt (at pH 7); namely, α varies from 0.2 to ~1 when the
0.1 1 10 100 100010-3
10-2
10-1
100
Atta
chm
ent E
fficie
ncy
(α)
Ionic Strength (mM)
bare nTiO2
polymer-coated nTiO2
1 1010-4
10-3
10-2
10-1
100
Atta
chm
ent E
fficie
ncy
(α)
Ionic Strength (mM)
polymer-coated nTiO2
polymer-coated nZnO
0.01 0.1 1 10 100 100010-6
10-5
10-4
10-3
10-2
10-1
100
Atta
chm
ent E
fficie
ncy
(α)
Ionic Strength (mM)
bare nZnO polymer-coated nZnO
(a) NaNO3
(b) CaCl2
(c) NaNO3

134
IS is increased from 0.1 to 100 mM NaNO3 (Figure 4.3A and Table 4.1). However, the
transport and deposition behavior of the polymer-coated nTiO2 particle is dramatically
different (Figure 4.3B). Polymer-coated nTiO2 displays extremely low retention in the
sand-packed columns, with C/C0 approaching 1 at IS ranging from 1 to 200 mM NaNO3
(Figure 4.3B). Significant retention of this particle is only observed at a salt concentration
of 1 M NaNO3. These results reflect the important stabilizing property of the polymer
coating on the Vive NanoTM particles at IS between 1 and 200 mM NaNO3. A polymer
coating can give rise to electrosteric stabilization, which can prevent aggregation and
deposition (Elimelech et al. 1995, Franchi and O'Melia 2003). Moreover, the small
aggregate sizes of the polymer-coated particles (Table 4.1) reduce the likelihood of
physical straining (Bradford et al. 2002, 2003, 2006), further enhancing the extent of NP
transport. As indicated in section 4.5.1.1, the size of the polymer-coated nTiO2 particles is
considerably smaller (18-67 nm when IS varies from 1-200 mM NaNO3) than that of the
bare nTiO2 (128-934 nm when IS varies from 1-100 mM NaNO3).
When physicochemical filtration dominates the extent of NP deposition, the NP
attachment efficiency (α) is observed to vary over several orders of magnitude with
changing water chemistry (i.e., IS and pH) (Petosa et al. 2010). Figure 4.4A shows that α
values for the bare nTiO2 are generally high (≥0.2) and vary only within one order of
magnitude over a broad range of solution IS. This behavior suggests that NP retention
onto the sand surface is not solely controlled by a physicochemical mechanism of
filtration. The high “apparent” α values evaluated for the bare nTiO2 even at very low IS
(0.1 mM NaNO3) suggest that physical straining is the governing retention mechanism for
this particle. The contribution of physical straining to particle retention is not considered
in the development of the classical colloid filtration theory; hence, α values evaluated for a

135
system where straining is a contributing factor are considered here to be “apparent” α
values. Because NP transport experiments were conducted in columns packed with fine
silica sand, the retention of larger aggregates (such as those formed by the bare nTiO2) by
physical straining is very likely, leading to particle entrapment within the clogged pores.
In contrast, measured α values for the polymer-coated nTiO2 are considerably low from 1
– 100 mM NaNO3 (on the order of 10-2), but are greater at the higher IS of 1 M (Figure
4.4A and Table 4.1).
In an attempt to determine whether a divalent salt would destabilize the polymer-coated
nTiO2, suspensions were prepared in CaCl2 solutions (pH 7), at IS ranging from 1 to 333
mM. At 33.3 and 333 mM CaCl2, the polymer-coated nTiO2 suspensions are highly
unstable, resulting in erratic transport behavior; hence, this data is not included in Table
4.1 or Figure 4.5A. In contrast, DLS particle sizes are relatively small at the lower IS of 1
and 3.33 mM CaCl2 (Table 4.1). Complete particle elution is observed in 1 mM CaCl2
(Figure 4.5A), whereas greater retention occurs as the concentration of CaCl2 is increased.
In 3.33 mM CaCl2, particle elution decreases with increasing time indicating potential
filter ripening whereby deposited particles act as additional collectors (Elimelech et al.
1995, Liu et al. 1995). The extent of particle retention increases considerably with
moderate increases in CaCl2 concentration (Table 4.1 and Figure 4.5A); however, the
dynamic behavior observed at 3.33 mM CaCl2 is not noted at higher IS. The
corresponding attachment efficiencies for transport experiments conducted with the
polymer-coated nTiO2 suspended in CaCl2 are on the order of 1.4×10⁻⁴ at 1 mM IS and
increase to ~0.6 at 8 mM IS (Table 4.1 and Figure 4.4B).

136
Figure 4.5 Particle breakthrough curves in CaCl2. Breakthrough curves for (a) polymer-coated nTiO2 particles (at pH 7) at different IS of CaCl2; and (b) polymer-coated nZnO particles (at pH 8) at different IS of CaCl2.
It is interesting to note that in a study by Ben-Moshe et al. (Ben-Moshe et al.
2010), longer packed columns were used than in the current study (15 cm versus 3 cm),
yet, these researchers observed significantly greater elution of bare rutile nTiO2 (< 100 nm
nominal size, Aldrich) particles. Specifically, Ben-Moshe et al. (Ben-Moshe et al. 2010)
report 62% elution of particles when suspended in 10 mM NaCl and 13% elution in 100
mM NaCl, at pH 7. In contrast, we observed less than 7% elution of bare anatase nTiO2 in
10 and 100 mM NaNO3 (at pH 7). In their study, however, larger, spherical glass bead
collectors (d=1 mm) were used, while the present study made use of fine (d=0.26 mm)
angular sand. The use of larger, rounder collectors would lessen the impact of physical
straining on NP elution (Tufenkji et al. 2004), explaining the heightened elution reported
by (Ben-Moshe et al. 2010). Choy et al. (Choy et al. 2008) found that virtually all bare
nTiO2 particles injected into sand-packed columns were retained, with 96-100% retention
reported for experiments conducted using 10 mM NaCl. All deposition experiments were
performed at pH 4.5, below the pHpzc of the particles. Hence, the particles and collector
surfaces were oppositely charged, resulting in favorable deposition conditions.
1 2 30.0
0.2
0.4
0.6
0.8
1.0
1.2
1 mM CaCl2 3.33 mM CaCl2 8 mM CaCl2 10 mM CaCl2
C/C 0
Pore Volumes
(a) nTiO2
1 2 30.0
0.2
0.4
0.6
0.8
1.0
1.2
C/C 0
Pore Volumes
(b) nZnO
137
Furthermore, long 30 cm packed columns and very fine sand (d50=0.20 mm) were
employed, resulting in increased particle retention (Choy et al. 2008). Fatisson et al
(Fatisson et al. 2009) also found that bare nTiO2 deposition rates onto silica were greatest
under favorable deposition conditions (pH 3, low IS).
Contrary to Choy et al. and our findings, Guzman et al. (Guzman et al. 2006)
found that a large percentage (84%) of bare nTiO2 particles were transported under
favorable deposition conditions (attractive particle-collector interaction energies) at pH 3.
Their study made use of a two-dimensional porous structure (featuring 0.70 mm spheres
with 0.11 mm spacing) constructed from Pyrex wafers. In contrast to our approach,
Guzman et al. employed only those particles that remained in suspension following an
equilibration period of 3 months; namely, the most stable fraction of the nanoparticle
suspension. Hence, very large aggregates were not included in their study, thus
potentially reducing the influence of physical straining and the potential clogging of
microchannel pores. Guzman et al. (Guzman et al. 2006) also conducted additional
experiments where they injected NP aggregates into the porous matrix and found that
virtually all aggregates were retained within the porous structure.
A number of researchers have examined the transport of bare nTiO2 particles in
water saturated granular matrices; however, only a limited number of studies report the
behavior of coated or modified nTiO2 particles in these systems (Joo et al. 2009, Mattigod
et al. 2005). Joo et al (Joo et al. 2009) also found that polymer-coated anatase nTiO2
particles were much more mobile than their bare counterparts. The carboxymethyl
cellulose (CMC)-coated nTiO2 particles used in their study were more mobile in clean
quartz sand (d=0.29 mm) than in aluminum or iron hydroxide-coated sand. Mattigod et al
(Mattigod et al. 2005) found that Cu-ethylenediamine functionalized anatase nTiO2

138
particles were well dispersed in a 1 m long column packed with quartz sand. Although
other researchers have demonstrated the mobility of coated nTiO2 particles in granular
aquatic environments, the range of water chemistries examined in these earlier studies is
limited. The experiments presented here with bare and polymer-coated nTiO2 particles
(over a broad range of solution IS at pH 7) illustrate the important influence of particle
surface modifications on NP transport potential in water saturated granular porous
matrices.
4.5.2.2 Transport of bare and polymer-coated nZnO particles in sand-packed columns
The transport and deposition behavior of nZnO in sandy granular materials has not
previously been reported in the published literature. We conducted a series of
experiments using bare and polymer-coated nZnO over a range of water chemistries to
evaluate the influence of a polyelectrolyte coating on NP transport (Figures 4.4B, 4.4C
and 4.6). The retention of bare nZnO is high at all concentrations of the monovalent salt
tested, with “apparent” attachment efficiencies exceeding 0.35 at all IS (Figures 4.4C and
4.6A). Moreover, inspection of Figure 4.6A reveals that the deposition rate of bare nZnO
onto the quartz sand changes as the experiment progresses; at 0.1 and 1 mM NaNO3, the
NP deposition rate appears to decrease with time. In contrast, at the other IS examined, the
rate of nZnO deposition appears to increase with time. Under the experimental conditions
examined here (pH 8), bare nZnO is positively charged (Table 4.1), rendering deposition
onto the negatively charged sand favorable. This favorable condition for particle retention
dominates the NP transport behavior. As nZnO deposits on the silica surface, the
availability of favorable deposition sites decreases, and the likelihood of encountering
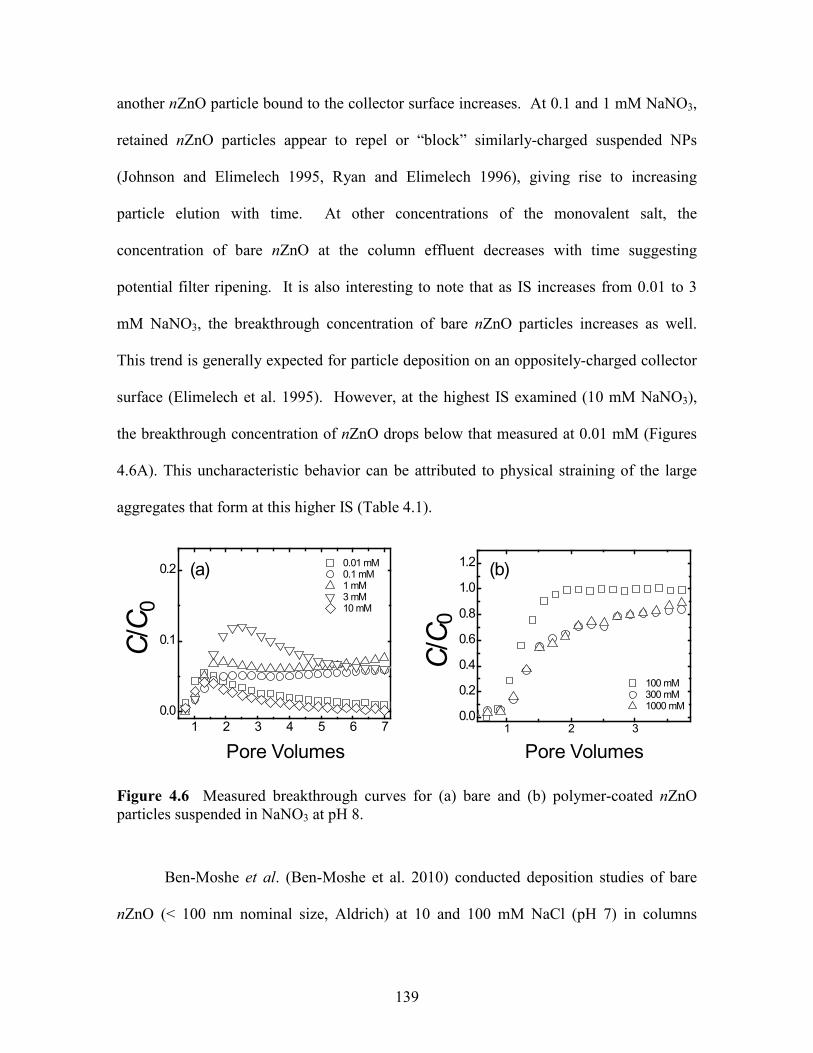
139
another nZnO particle bound to the collector surface increases. At 0.1 and 1 mM NaNO3,
retained nZnO particles appear to repel or “block” similarly-charged suspended NPs
(Johnson and Elimelech 1995, Ryan and Elimelech 1996), giving rise to increasing
particle elution with time. At other concentrations of the monovalent salt, the
concentration of bare nZnO at the column effluent decreases with time suggesting
potential filter ripening. It is also interesting to note that as IS increases from 0.01 to 3
mM NaNO3, the breakthrough concentration of bare nZnO particles increases as well.
This trend is generally expected for particle deposition on an oppositely-charged collector
surface (Elimelech et al. 1995). However, at the highest IS examined (10 mM NaNO3),
the breakthrough concentration of nZnO drops below that measured at 0.01 mM (Figures
4.6A). This uncharacteristic behavior can be attributed to physical straining of the large
aggregates that form at this higher IS (Table 4.1).
Figure 4.6 Measured breakthrough curves for (a) bare and (b) polymer-coated nZnO particles suspended in NaNO3 at pH 8.
Ben-Moshe et al. (Ben-Moshe et al. 2010) conducted deposition studies of bare
nZnO (< 100 nm nominal size, Aldrich) at 10 and 100 mM NaCl (pH 7) in columns
1 2 30.0
0.2
0.4
0.6
0.8
1.0
1.2
100 mM 300 mM 1000 mM
C /C 0
Pore Volumes
(b)
1 2 3 4 5 6 70.0
0.1
0.2
0.01 mM 0.1 mM 1 mM 3 mM 10 mM
C/C 0
Pore Volumes
(a)
Pore Volumes Pore Volumes
140
packed with glass beads. At both salt concentrations examined, significant particle
retention (> 98%) was observed. At 10 mM NaCl, the average size of the nZnO particles
was measured by DLS to be approximately 1100 nm, suggesting that very large
aggregates were present in the NP suspensions (Ben-Moshe et al. 2010). In the present
study, reproducible packed column experiments could not be conducted with bare nZnO at
salt concentrations above 10 mM due to rapid and significant NP destabilization. In
contrast, reproducible transport and characterization studies were carried out with
polymer-coated nZnO at NaNO3 concentrations as high as 1000 mM (Table 4.1 and
Figure 4.6B). While bare nZnO exhibits a positive surface charge at pH 8, the polymer-
coated NPs have a negative surface charge at this pH (Table 4.1), leading to a completely
different deposition behavior. Whereas a large proportion of the bare nZnO deposits onto
the negatively charged sand grains, virtually all of the polymer-coated nZnO elute from
the sand-packed columns at 100 mM IS and ~70% of the NPs elute when the IS is
increased to 1 M NaNO3 (Figure 4.6B). As noted above for the polymer-coated nTiO2
particles, this result can be attributed to electrosteric stabilization by the polymer coating
on the Vive NanoTM particles (Elimelech et al. 1995, Franchi and O'Melia 2003). As
mentioned previously, electrosteric stabilization results in decreased deposition onto the
sand surface, as well as decreased NP aggregate formation, thus also reducing the
likelihood of retention due to physical straining.
The measured breakthrough curves for the polymer-coated nZnO particles
suspended in the divalent salt are generally comparable to that of the polymer-coated
nTiO2 particles (Figure 4.5), with the exception of the experiment conducted at 3.3 mM
CaCl2. It is interesting to note the dynamic deposition behavior of the polymer-coated
nZnO at this condition; the measured breakthrough curve consistently exhibits a rapid
141
drop in the concentration of eluted particles with time. Careful inspection of Table 4.1
reveals that the size and PDI of the polymer-coated nZnO increase significantly at 3.3 mM
CaCl2. Hence, the favorable particle-particle interactions at this condition appear to
promote filter ripening in the granular matrix. Overall, calculated attachment efficiencies
for the negatively charged polymer-coated nZnO particles increase over several orders of
magnitude with increasing concentration of NaNO3 or CaCl2 (as noted with the polymer-
coated nTiO2) (Table 4.1 and Figure 4.4). In selected conditions as indicated above,
dynamic nanoparticle deposition behavior is observed giving rise to nanoparticle elution
profiles that rise or decrease with time. This behavior has previously been attributed to
the mechanisms of straining, ripening, blocking, and aggregation (Elimelech et al. 1995,
Liu et al. 1995, Solovitch et al. 2010) which are not considered within the classical theory
of colloid filtration theory. Hence, in the discussion above, comparison of α values is
included for purposes of qualitative interpretation of experimental observations.
4.5.2.3 Environmental Implications
Our findings provide insights into the manner in which bare and polymer-coated
metal oxide NPs may behave upon release in water-saturated granular aqueous
environments. Moreover, because the water flow rate and fine sand collectors employed
here may be relevant to riverbank and slow sand filtration (Ray et al. 2003), the data
obtained also provides insight into the capability of these water treatment techniques in
removing bare and polymer-coated metal oxide NPs from water supplies. In practice, both
these filtration techniques also possess organic layers (either at the filter surface or at the
river/aquifer interface) – an aspect that is absent in the current study. The impact that such

142
a biological layer can have on metal oxide NP removal is of interest and a subject of
ongoing studies in our laboratory. Nonetheless, when river flow is high, the organic layer
present at the river/aquifer interface may be lost, rendering a riverbank filtration system
vulnerable to contaminant breakthrough (Ray et al. 2003). The current experiments best
mimic such a high flow situation.
4.6 CONCLUSIONS
This study demonstrates that in the absence of a polymer coating, nTiO2 and nZnO
particles aggregate rapidly, yielding polydisperse suspensions. While bare nTiO2 and
nZnO deposition onto sand surfaces is generally high, it can also be dynamic, with
changes in elution behavior over time observed for selected conditions. Depending on the
solution IS, bare nZnO elution is observed to increase or decrease over time, suggesting
that a complex interplay of mechanisms controls the deposition behavior of this NP. The
suspension stability and transport behavior of the polymer-coated NPs is quite different
from their bare counterparts due to electrosteric stabilization. The polymer-coated NP
suspensions are stable over a large range of NaNO3 concentrations with nearly all of the
polymer-coated NPs eluting from the sand-packed columns at IS below 300 mM. The
surface modified particles are also more stable than the bare NPs in the presence of a
divalent salt. Whereas transport experiments could not be conducted with bare NPs in
solutions of CaCl2, the polyelectrolyte-coated NPs are moderately mobile at low
concentrations of the divalent salt. Interestingly, both polymer-coated particles exhibit
distinct elution behavior at 3.3 mM CaCl2 that is characteristic of ripening. Overall, this
data suggests that upon release into the aquatic environment, bare nZnO and nTiO2 may

143
experience limited mobility due to aggregate formation. Moreover, such particles will
likely be effectively removed by water filtration techniques such as slow sand and
riverbank filtration. However, given that a majority of commercially and industrially
employed NPs will be surface-functionalized, stabilized, or matrix-embedded, various
derivatives of these basic metal oxide NP types may exhibit far greater mobility upon
release and be more difficult to remove using contemporary water treatment approaches.
4.7 ACKNOWLEDGEMENTS
This research was supported by NSERC, the Canada Research Chairs (CRC)
Program and the Canada Foundation for Innovation (CFI). ARP is funded by both
NSERC (Postgraduate Scholarship) and McGill University (McGill Engineering Doctoral
Award). SJB and FR are partially supported by McGill Summer Undergraduate Research
in Engineering (SURE) awards. The authors also thank Francis Duquette-Murphy and
Kevin J. Wilkinson (University of Montreal) for NTA assistance, Julien Fatisson (McGill)
for SEM assistance, Andrew Golsztajn and Ranjan Roy (McGill) for ICP-AES assistance,
Jean-Philippe Masse (Centre de Caractérisation Microscopique des Matériaux, University
of Montreal) for the TEM imaging and Che O’May (McGill) for assistance with
manuscript editing.

144
4.8 REFERENCES
Adams, L.K., Lyon, D.Y., McIntosh, A. and Alvarez, P.J.J. (2006) Comparative toxicity of nano-scale TiO2, SiO2 and ZnO water suspensions. Water Science and Technology 54, 327-334. Aitken, R.J., Chaudhry, M.Q., Boxall, A.B.A. and Hull, M. (2006) Manufacture and use of nanomaterials: Current status in the UK and global trends. Occupational Medicine 56(5), 300-306. Bai, W., Zhang, Z., Tian, W., He, X., Ma, Y., Zhao, Y. and Chai, Z. (2010) Toxicity of zinc oxide nanoparticles to zebrafish embryo: A physicochemical study of toxicity mechanism. Journal of Nanoparticle Research 12(5), 1645-1654. Ben-Moshe, T., Dror, I. and Berkowitz, B. (2010) Transport of metal oxide nanoparticles in saturated porous media. Chemosphere 81(3), 387-393. Bradford, S.A., Simunek, J., Bettahar, M., Van Genuchten, M.T. and Yates, S.R. (2003) Modeling colloid attachment, straining, and exclusion in saturated porous media. Environmental Science and Technology 37(10), 2242-2250. Bradford, S.A., Simunek, J., Bettahar, M., Van Genuchten, M.T. and Yates, S.R. (2006) Significance of straining in colloid deposition: Evidence and implications. Water Resources Research 42(12). Bradford, S.A., Yates, S.R., Bettahar, M. and Simunek, J. (2002) Physical factors affecting the transport and fate of colloids in saturated porous media. Water Resources Research 38(12), 631-6312. Carr, B., Malloy, A. and Warren, J. (2008) Nanoparticle tracking analysis. Innovations in Pharmaceutical Technology 26, 38-40. Chowdhury, I., Hong, Y. and Walker, S.L. (2010) Container to characterization: Impacts of metal oxide handling, preparation, and solution chemistry on particle stability. Colloids and Surfaces A: Physicochemical and Engineering Aspects 368(1-3), 91-95. Choy, C.C., Wazne, M. and Meng, X. (2008) Application of an empirical transport model to simulate retention of nanocrystalline titanium dioxide in sand columns. Chemosphere 71(9), 1794-1801. Derjaguin, B.V. and Landau, L.D. (1941) Theory of stability of strongly charged lyophobic sols and the adhesion of strongly charged particles in solutions of electrolytes. Acta Physicochimica URSS 14, 633-662.

145
Dhawan, A., Taurozzi, J.S., Pandey, A.K., Shan, W., Miller, S.M., Hashsham, S.A. and Tarabara, V.V. (2006) Stable colloidal dispersions of C60 fullerenes in water: Evidence for genotoxicity. Environmental Science and Technology 40(23), 7394-7401. Domingos, R.F., Baalousha, M.A., Ju-Nam, Y., Reid, M.M., Tufenkji, N., Lead, J.R., Leppard, G.G. and Wilkinson, K.J. (2009a) Characterizing manufactured nanoparticles in the environment: Multimethod determination of particle sizes. Environmental Science & Technology 43(19), 7277-7284. Domingos, R.F., Tufenkji, N. and Wilkinson, K.J. (2009b) Aggregation of titanium dioxide nanoparticles: Role of a fulvic acid. Environmental Science and Technology 43(5), 1282-1286. Duan, Y., Liu, J., Ma, L., Li, N., Liu, H., Wang, J., Zheng, L., Liu, C., Wang, X., Zhao, X., Yan, J., Wang, S., Wang, H., Zhang, X. and Hong, F. (2010) Toxicological characteristics of nanoparticulate anatase titanium dioxide in mice. Biomaterials 31(5), 894-899. Dufour, E.K., Kumaravel, T., Nohynek, G.J., Kirkland, D. and Toutain, H. (2006) Clastogenicity, photo-clastogenicity or pseudo-photo-clastogenicity: Genotoxic effects of zinc oxide in the dark, in pre-irradiated or simultaneously irradiated Chinese hamster ovary cells. Mutation Research - Genetic Toxicology and Environmental Mutagenesis 607(2), 215-224. Elimelech, M., Gregory, J., Jia, X. and Williams, R.A. (1995) Particle Deposition and Aggregation: Measurement, Modeling, and Simulation, Butterworth-Heinemann, Oxford. Englert, B.C. (2007) Nanomaterials and the environment: Uses, methods and measurement. Journal of Environmental Monitoring 9(11), 1154-1161. Fang, X., Yu, R., Li, B., Somasundaran, P. and Chandran, K. (2010) Stresses exerted by ZnO, CeO2 and anatase TiO2 nanoparticles on the Nitrosomonas Europaea. Journal of Colloid and Interface Science 348(2), 329-334. Fatisson, J., Domingos, R.F., Wilkinson, K.J. and Tufenkji, N. (2009) Deposition of TiO2 nanoparticles onto silica measured using a quartz crystal microbalance with dissipation monitoring. Langmuir 25(11), 6062-6069. Federici, G., Shaw, B.J. and Handy, R.D. (2007) Toxicity of titanium dioxide nanoparticles to rainbow trout (Oncorhynchus mykiss): Gill injury, oxidative stress, and other physiological effects. Aquatic Toxicology 84(4), 415-430. Finnegan, M.P., Zhang, H. and Banfield, J.F. (2007) Phase stability and transformation in titania nanoparticles in aqueous solutions dominated by surface energy. Journal of Physical Chemistry C 111(5), 1962-1968.

146
Franchi, A. and O'Melia, C.R. (2003) Effects of natural organic matter and solution chemistry on the deposition and reentrainment of colloids in porous media. Environmental Science and Technology 37(6), 1122-1129. Franklin, N.M., Rogers, N.J., Apte, S.C., Batley, G.E., Gadd, G.E. and Casey, P.S. (2007) Comparative toxicity of nanoparticulate ZnO, bulk ZnO, and ZnCl2 to a freshwater microalga (Pseudokirchneriella subcapitata): The importance of particle solubility. Environmental Science and Technology 41(24), 8484-8490. Ge, Y., Schimel, J.P. and Holden, P.A. (2011) Evidence for Negative Effects of TiO2 and ZnO Nanoparticles on Soil Bacterial Communities. Environmental Science & Technology 45(4), 1659-1664. Guzman, K.A.D., Finnegan, M.P. and Banfield, J.F. (2006) Influence of surface potential on aggregation and transport of titania nanoparticles. Environmental Science & Technology 40(24), 7688-7693. Hao, L., Wang, Z. and Xing, B. (2009) Effect of sub-acute exposure to TiO2 nanoparticles on oxidative stress and histopathological changes in Juvenile Carp (Cyprinus carpio). Journal of Environmental Sciences 21(10), 1459-1466. Hu, R., Gong, X., Duan, Y., Li, N., Che, Y., Cui, Y., Zhou, M., Liu, C., Wang, H. and Hong, F. (2010) Neurotoxicological effects and the impairment of spatial recognition memory in mice caused by exposure to TiO2 nanoparticles. Biomaterials 31(31), 8043-8050. Huang, C.C., Aronstam, R.S., Chen, D.R. and Huang, Y.W. (2010) Oxidative stress, calcium homeostasis, and altered gene expression in human lung epithelial cells exposed to ZnO nanoparticles. Toxicology in Vitro 24(1), 45-55. Jiang, X., Tong, M., Li, H. and Yang, K. (2010) Deposition kinetics of zinc oxide nanoparticles on natural organic matter coated silica surfaces. Journal of Colloid and Interface Science 350(2), 427-434. Johnson, P.R. and Elimelech, M. (1995) Dynamics of colloid deposition in porous media: Blocking based on random sequential adsorption. Langmuir 11(3), 801-812. Joo, S.H., Al-Abed, S.R. and Luxton, T. (2009) Influence of carboxymethyl cellulose for the transport of titanium dioxide nanoparticles in clean silica and mineral-coated sands. Environmental Science and Technology 43(13), 4954-4959. Kosmulski, M. (2002) The significance of the difference in the point of zero charge between rutile and anatase. Advances in Colloid and Interface Science 99(3), 255-264.
147
Lecoanet, H.F., Bottero, J.Y. and Wiesner, M.R. (2004) Laboratory assessment of the mobility of nanomaterials in porous media. Environmental Science and Technology 38(19), 5164-5169. Lecoanet, H.F. and Wiesner, M.R. (2004) Velocity effects on fullerene and oxide nanoparticle deposition in porous media. Environmental Science and Technology 38(16), 4377-4382. Lin, D. and Xing, B. (2008) Root uptake and phytotoxicity of ZnO nanoparticles. Environmental Science and Technology 42(15), 5580-5585. Litton, G.M. and Olson, T.M. (1993) Colloid deposition rates on silica bed media and artifacts related to collector surface preparation methods. Environmental Science and Technology 27(1), 185-193. Liu, D., Johnson, P.R. and Elimelech, M. (1995) Colloid deposition dynamics in flow through porous media: Role of electrolyte concentration. Environmental Science and Technology 29(12), 2963-2973. Ma, L., Liu, J., Li, N., Wang, J., Duan, Y., Yan, J., Liu, H., Wang, H. and Hong, F. (2010) Oxidative stress in the brain of mice caused by translocated nanoparticulate TiO2 delivered to the abdominal cavity. Biomaterials 31(1), 99-105. Mattigod, S.V., Fryxell, G.E., Alford, K., Gilmore, T., Parker, K., Serne, J. and Engelhard, M. (2005) Functionalized TiO2 nanoparticles for use for in situ anion immobilization. Environmental Science and Technology 39(18), 7306-7310. Maynard, A.D., Aitken, R.J., Butz, T., Colvin, V., Donaldson, K., Oberdörster, G., Philbert, M.A., Ryan, J., Seaton, A., Stone, V., Tinkle, S.S., Tran, L., Walker, N.J. and Warheit, D.B. (2006) Safe handling of nanotechnology. Nature 444(7117), 267-269. Moos, P.J., Chung, K., Woessner, D., Honeggar, M., Cutler, N.S. and Veranth, J.M. (2010) ZnO particulate matter requires cell contact for toxicity in human colon cancer cells. Chemical Research in Toxicology 23(4), 733-739. Mortimer, M., Kasemets, K. and Kahru, A. (2010) Toxicity of ZnO and CuO nanoparticles to ciliated protozoa Tetrahymena thermophila. Toxicology 269(2-3), 182-189. Mueller, N.C. and Nowack, B. (2008) Exposure modeling of engineered nanoparticles in the environment. Environmental Science and Technology 42(12), 4447-4453. Nowack, B. and Bucheli, T.D. (2007) Occurrence, behavior and effects of nanoparticles in the environment. Environmental Pollution 150(1), 5-22.
148
Pelley, A.J. and Tufenkji, N. (2008) Effect of particle size and natural organic matter on the migration of nano- and microscale latex particles in saturated porous media Journal of Colloid and Interface Science 321(1), 74-83. Pena, M.E., Korfiatis, G.P., Patel, M., Lippincott, L. and Meng, X. (2005) Adsorption of As(V) and As(III) by nanocrystalline titanium dioxide. Water Research 39(11), 2327-2337. Petosa, A.R., Jaisi, D.P., Quevedo, I.R., Elimelech, M. and Tufenkji, N. (2010) Aggregation and deposition of engineered nanomaterials in aquatic environments: Role of physicochemical interactions. Environmental Science and Technology 44(17), 6532-6549. Pettibone, J.M., Cwiertny, D.M., Scherer, M. and Grassian, V.H. (2008) Adsorption of organic acids on TiO2 nanoparticles: Effects of pH, nanoparticle size, and nanoparticle aggregation Langmuir 24(13), 6659-6667. Ray, C., Melin, G. and Linsky, R.B. (2003) Riverbank Filtration: Improving Source-Water Quality, Kluwer Academic Publishers, Dordrecht, NL. Reddy, K.M., Feris, K., Bell, J., Wingett, D.G., Hanley, C. and Punnoose, A. (2007) Selective toxicity of zinc oxide nanoparticles to prokaryotic and eukaryotic systems. Applied Physics Letters 90(21). Robichaud, C.O., Tanzil, D., Weilenmann, U. and Weisner, M.R. (2005) Relative risk analysis of several manufactured nanomaterials: an insurance industry context. Environmental Science and Technology 39(22), 8985-8994. Roh, J.Y., Park, Y.K., Park, K. and Choi, J. (2010) Ecotoxicological investigation of CeO2 and TiO2 nanoparticles on the soil nematode Caenorhabditis elegans using gene expression, growth, fertility, and survival as endpoints. Environmental Toxicology and Pharmacology 29(2), 167-172. Ryan, J.N. and Elimelech, M. (1996) Colloid mobilization and transport in groundwater. Colloids and Surfaces A: Physicochemical and Engineering Aspects 107, 1-56. Sayes, C.M., Wahi, R., Kurian, P.A., Liu, Y., West, J.L., Ausman, K.D., Warheit, D.B. and Colvin, V.L. (2006) Correlating nanoscale titania structure with toxicity: A cytotoxicity and inflammatory response study with human dermal fibroblasts and human lung epithelial cells. Toxicological Sciences 92(1), 174-185. Schanen, B.C., Karakoti, A.S., Seal, S., Drake III, D.R., Warren, W.L. and Self, W.T. (2009) Exposure to titanium dioxide nanomaterials provokes inflammation of an in vitro human immune construct. ACS Nano 3(9), 2523-2532.

149
Sharma, V., Shukla, R.K., Saxena, N., Parmar, D., Das, M. and Dhawan, A. (2009) DNA damaging potential of zinc oxide nanoparticles in human epidermal cells. Toxicology Letters 185(3), 211-218. Sinha, R., Karan, R., Sinha, A. and Khare, S.K. (2011) Interaction and nanotoxic effect of ZnO and Ag nanoparticles on mesophilic and halophilic bacterial cells. Bioresource Technology 102(2), 1516-1520. Solovitch, N., Labille, J., Rose, J., Chaurand, P., Borschneck, D., Wiesner, M.R. and Bottero, J.Y. (2010) Concurrent aggregation and deposition of TiO2 nanoparticles in a sandy porous media. Environmental Science and Technology 44(13), 4897-4902. Suzuki, H., Toyooka, T. and Ibuki, Y. (2007) Simple and easy method to evaluate uptake potential of nanoparticles in mammalian cells using a flow cytometric light scatter analysis. Environmental Science and Technology 41(8), 3018-3024. Tseng, W.J. and Lin, K.C. (2003) Rheology and colloidal structure of aqueous TiO2 nanoparticle suspensions. Materials Science and Engineering A 355(1-2), 186-192. Tufenkji, N. and Elimelech, M. (2004a) Correlation equation for predicting single-collector efficiency in physicochemical filtration in saturated porous media. Environmental Science and Technology 38(2), 529-536. Tufenkji, N. and Elimelech, M. (2004b) Deviation from the classical colloid filtration theory in the presence of repulsive DLVO interactions. Langmuir 20(25), 10818-10828. Tufenkji, N. and Elimelech, M. (2005) Breakdown of colloid filtration theory: Role of the secondary energy minimum and surface charge heterogeneities. Langmuir 21(3), 841-852. Tufenkji, N., Miller, G.F., Ryan, J.N., Harvey, R.W. and Elimelech, M. (2004) Transport of Cryptosporidium oocysts in porous media: Role of straining and physicochemical filtration. Environmental Science and Technology 38(22), 5932-5938. Valant, J., Drobne, D., Sepčić, K., Jemec, A., Kogej, K. and Kostanjšek, R. (2009) Hazardous potential of manufactured nanoparticles identified by in vivo assay. Journal of Hazardous Materials 171(1-3), 160-165. Verwey, E.J.W. and Overbeek, J.T.G. (1948) Theory of the Stability of Lyophobic Colloids, Elsevier, Amsterdam. Wang, Z.L. (2004) Zinc oxide nanostructures: Growth, properties and applications. Journal of Physics Condensed Matter 16(25), R829-R858. Warheit, D.B., Webb, T.R., Reed, K.L., Frerichs, S. and Sayes, C.M. (2007) Pulmonary toxicity study in rats with three forms of ultrafine-TiO2 particles: Differential responses related to surface properties. Toxicology 230(1), 90-104.

150
Wiesner, M.R. and Bottero, J.-Y. (2007) Environmental Nanotechnology, The McGraw-Hill Companies, New York. Yao, K.M., Habibian, M.T. and O'Melia, C.R. (1971) Water and waste water filtration: Concepts and applications. Environmental Science and Technology 5(11), 1105-1112. Zhang, Y., Chen, Y., Westerhoff, P. and Crittenden, J. (2009) Impact of natural organic matter and divalent cations on the stability of aqueous nanoparticles. Water Research 43(17), 4249-4257. Zhou, D. and Keller, A.A. (2010) Role of morphology in the aggregation kinetics of ZnO nanoparticles. Water Research 44(9), 2948-2956. Zhou, J., Xu, N. and Wang, Z.L. (2006) Dissolving behavior and stability of ZnO wires in biofluids: A study on biodegradability and biocompatibility of ZnO nanostructures. Advanced Materials 18(18), 2432-2435.

151
4.9 SUPPLEMENTARY MATERIAL FOR CHAPTER 4
4.9.1 Product Characterization (Purity)
The following details on product purity were made available by the manufacturers:
The bare nTiO2 and nZnO (Nanostructured & Amorphous Materials, Inc.) particles have a
purity of 99 and 99.5%, respectively. The polymer-coated nZnO (Vive NanoTM) particles
are 94.8% Zn on a metals basis (excluding Na). Other impurities are Al, Mg, B, Ba, Ca,
and Si. The polymer-coated nTiO2 (Vive NanoTM) particles are 84% Ti on a metals basis
(excluding Na). Other impurities are Al, Ag, Bi, Ca, Mg, and Ga.
4.9.2 Tracking nanoparticle elution by ICP-AES
A majority of the NPs released into the environment will be matrix-bound or
modified in one way or another. Additionally, the presence of a plethora of molecules and
organisms within the natural environment will complicate particle detection by
spectrophotometric methods. As a result, quantitative elemental analyses will likely be
best suited to NP detection, bypassing recognition difficulties introduced by various
modifications and complex environmental matrices. Preliminary work was performed to
establish whether nTiO2 and nZnO particle concentrations determined by ICP-AES would
be comparable to concentrations determined by UV-visible spectrophotometry. Particle
samples exiting the UV-visible flow cell were collected in 0.5 mL aliquots, acidified and
analyzed by ICP-AES. Overall, although ICP-AES data was noisier, very similar results
were obtained using the two complimentary techniques (Figure S4.2). One disadvantage
to ICP-AES is that real-time column effluent data acquisition was not possible, thus
necessitating sample collection, preparation and subsequent analysis.

152
Figure S4.1 Tracking bare nTiO2 breakthrough curves utilizing UV-visible spectrophotometry and ICP-AES as complimentary techniques.
4.9.3 nZnO Dissolution
Figure S4.2 nZnO dissolution behavior evaluated as a function of time at pH 8 ± 0.2. The concentration of dissolved Zn2+ predicted using Visual MINTEQ is ~1.5 mg/L, which is in good agreement with the experimental results.
5 10 15 20 25 300.0
0.5
1.0
1.5
2.0
2.5
3.0
[Zn2+
] (m
g/L)
Time (hrs)
Zn2+ ion concentration
1 2 3 40.0
0.1
0.2
0.3
0.4
UV-Vis ICP-AES
C/C 0
Pore Volumes

153
8 9 10 11
-1
0
1
2
EPM
(µm
cmV-1
s-1)
pH
(b)
4.9.4 Determination of nZnO and nTiO2 pHzpc
Figure S4.3 Nanoparticle EPMs measured over a range of pHs (1 mM NaNO3) for bare (a) nTiO2, and (b) nZnO.
3 4 5 6 7-3
-2
-1
0
1
2
3
EP
M (µ
mcm
V-1s-1
)
pH
(a)

154
CHAPTER 5: MOBILITY OF NANOSIZED CERIUM DIOXIDE AND POLYMERIC CAPSULES IN QUARTZ AND
LOAMY SANDS SATURATED WITH MODEL AND NATURAL GROUNDWATERS

155
5.1 PREFACE
While divalent calcium chloride (CaCl2) salt solutions and polymer-coated
particles were included in the transport experiments presented in Chapter 4, all transport
experiments had been performed in pure quartz sand. Furthermore, transport in natural
groundwater had yet to be examined. Consequently, metal oxide transport experiments in
more complex granular matrices (i.e., agricultural soils) and aquatic matrices (i.e., natural
groundwater) were undertaken.
The work presented in Chapter 5 focused on the transport of a third polymer-
coated metal oxide, namely poly(acrylic acid) (PAA)-coated nanosized cerium dioxide
(nCeO2). The deposition behavior of an analogous nanosized polymeric capsule (nCAP)
was also considered. Once more, transport studies for particles suspended in monovalent
sodium nitrate (NaNO3) and divalent calcium chloride (CaCl2) were conducted.
Additionally, experiments were performed with particles suspended in divalent
magnesium chloride (MgCl2) and natural groundwater. Transport studies in pure quartz
sand and agricultural loamy sand-packed columns were carried out to determine whether
particle retention would be drastically altered in a more heterogeneous soil system. The
work presented in Chapter 5 was published in Water Research in 2013.

156
5.2 ABSTRACT
The environmental and health risks posed by emerging engineered nanoparticles
(ENPs) released into aquatic environments are largely dependent on their aggregation,
transport, and deposition behavior. Herein, laboratory-scale columns were used to
examine the mobility of polyacrylic acid (PAA)-coated cerium dioxide nanoparticles
(nCeO2) and an analogous nanosized polymeric capsule (nCAP) in water saturated quartz
sand or loamy sand. The influence of solution ionic strength (IS) and cation type (Na+,
Ca2+, or Mg2+) on the transport potential of these ENPs was examined in both granular
matrices and results were also compared to measurements obtained using a natural
groundwater. ENP suspensions were characterized using dynamic light scattering and
nanoparticle tracking analysis to establish aggregate size, and laser Doppler
electrophoresis to determine ENP electrophoretic mobility. Regardless of IS, virtually all
nCeO2 particles suspended in NaNO3 eluted from the quartz sand-packed columns. In
contrast, heightened nCeO2 and nCAP particle retention and dynamic (time-dependent)
transport behavior was observed with increasing concentrations of the divalent salts and in
the presence of natural groundwater. Enhanced particle retention was also observed in
loamy sand in comparison to the quartz sand, emphasizing the need to consider the nature
of the aqueous matrix and granular medium in evaluating contamination risks associated
with the release of ENPs in natural and engineered aquatic environments.
157
5.3 INTRODUCTION
Engineered nanoparticles (ENPs) exhibit appealing physicochemical properties
that are absent in larger particles with equivalent chemical compositions (Auffan et al.,
2009, Klaine et al., 2008). Consequently, ENPs of all types (e.g., carbon nanotubes,
metals and metal oxides, semiconductors, polymers) are being incorporated into a
growing number of consumer products. For example, nanosized titanium dioxide (nTiO2)
is employed in the production of sunscreens and paint, zinc oxide (nZnO) is used in
cosmetics and solar cells, and iron oxides are incorporated into pigments and used in
biological applications (Ju-Nam and Lead, 2008, Klaine et al., 2008). Comprehensive
reviews of existing ENP types and their applications are available in the literature (Ju-
Nam and Lead, 2008, Klaine et al., 2008). An inventory of consumer products containing
ENPs has also been developed by the Woodrow Wilson International Center for Scholars
(available at http://www.nanotechproject.org/).
Nanosized cerium dioxide (nCeO2) is currently employed in several applications.
It can serve as a polishing agent when manufacturing glass and can serve as a capacitor
and semiconductor (Johnson and Park, 2012). Given that nCeO2 protects against the
oxidative stress caused by reactive oxygen species, medical applications have also been
described. These include the use of nCeO2 as an antioxidant to treat retinal disorders such
as glaucoma (García et al., 2011). Since nCeO2 effectively absorbs ultraviolet radiation, it
is used in the production of sunscreens and UV blocking agents (Cassee et al., 2011).
Surface reactive properties also make nCeO2 a useful exhaust gas catalyst (Cassee et al.,
2011, Van Hoecke et al., 2011).

158
Exposure to ENPs can occur at all stages of the particle lifecycle, including
fabrication and processing, product usage and disposal (Wiesner and Bottero, 2007).
Many nCeO2 applications are dispersive in nature, increasing the risk for exposure and
heightened interactions with a variety of environmental media (Cassee et al., 2011). The
release of nCeO2 particles employed as UV blocking agents or diesel fuel additives may
threaten aquatic and sediment dwelling organisms (Van Hoecke et al., 2011). Beyond
that, ENPs entering soil environments may reach groundwater aquifers, potentially
contaminating drinking water supplies and causing unknown health, safety and
environmental issues (Klaine et al., 2008). Once introduced into natural subsurface
environments or engineered water treatment processes, particle aggregation, transport and
deposition behavior will play a major role in determining nCeO2 fate, bioavailability and
the likelihood for human exposure. Thus, a comprehensive understanding of nCeO2
transport and deposition behavior in water saturated granular systems is required for the
protection of environmental and public health.
Well-controlled laboratory experiments using columns packed with different
granular matrices can be useful for drawing links between collector (grain) properties and
the mobility of released ENPs in water saturated granular environments (Kretzschmar et
al., 1994, Petosa et al., 2010, Quevedo and Tufenkji, 2012). A number of studies have
examined the transport and deposition of ENPs in quartz sand-packed columns, providing
useful insights on the effects of environmental factors such as water chemistry, grain size,
particle size, and porewater velocities on ENP mobility (Petosa et al., 2010). However,
little is known regarding the transport and deposition of nCeO2 in water saturated granular
environments (Li et al., 2011b, Liu et al., 2012).

159
Published nCeO2 transport studies have focused on the transport of bare particles
suspended in monovalent salt solutions (namely, NaCl). In considering the effect of pH
and IS on nCeO2 deposition on sand, Li et al. observed increased particle retention under
acidic conditions (pH 3) and with increasing NaCl IS (Li et al., 2011b). Liu et al.
investigated nCeO2 deposition in sand-packed columns and using a quartz crystal
microbalance with dissipation (QCM-D). In NaCl (pH 6.5 and 8), far more nCeO2
deposition was observed in the packed columns than on silica QCM-D sensors, likely due
to physical straining as a result of ENP aggregation and heterogeneities on the quartz sand
collectors. Heightened nCeO2 mobility in the packed columns was observed in the
presence of organic matter (Liu et al., 2012). The transport of nCeO2 in the presence of
divalent salt solutions (e.g., CaCl2 and MgCl2) and natural groundwater matrices has not
been reported in the literature. Furthermore, studies investigating nCeO2 transport in
granular matrices other than quartz sand are not available.
While the types of granular materials encountered in the natural subsurface
environment can vary broadly (Kretzschmar et al., 1994), few studies have investigated
the transport behavior of selected ENPs in media other than glass beads and quartz sand
(Jaisi and Elimelech, 2009, Petosa et al., 2010). Previously, our group has shown that the
retention of two different carboxyl-terminated quantum dots (QDs) and a carboxylated
polystyrene latex nanoparticle can be enhanced by at least one order of magnitude in a
loamy sand versus a quartz sand of comparable mean grain size (Quevedo and Tufenkji,
2012). Interestingly, the 3 different ENPs exhibit similar mobility in the quartz sand, but
distinct transport behaviors in the loamy sand. This suggests that differences in the
affinities of the polymer-coated ENPs for specific soil components can control their fate
in subsurface environments. Jaisi and Elimelech investigated the transport of carboxyl-

160
functionalized single-walled carbon nanotubes (SWCNTs) in columns packed with a
complex granular matrix; namely, a sandy clay loam. Their study found SWCNT
transport to be governed by physical straining, likely due to the combined effects of a very
large NP aspect ratio, NP aggregation in solution and variability in soil particle size,
porosity and permeability (Jaisi and Elimelech, 2009).
The purpose of this work is to systematically investigate the mobility of a
polyacrylic acid (PAA)-coated nCeO2 particle in water-saturated quartz sand and loamy
sand matrices. Natural and artificial groundwaters are used to study the effect of
electrolyte species and ionic strength (IS) on selected particle properties (i.e., aggregate
size and surface potential) and transport potential. This study is the first to consider the
effects of more complex granular materials and water chemistries on the transport
behavior of nCeO2 in water saturated porous media. Moreover, the behavior of the PAA-
coated nCeO2 is compared to that of analogous PAA-based nanocapsules (nCAPs) to
assess whether both particle types exhibit similar transport potentials. The nCAPs
employed herein were designed to serve as water dispersible polymeric nanocapsules in
agricultural applications, providing a further incentive to examine their behavior in model
subsurface environments.
5.4 MATERIALS AND METHODS
5.4.1 NATURAL GROUNDWATER CHARACTERIZATION
Natural groundwater, originating from a domestic well in the township of North
Glengarry, Ontario, was thoroughly characterized (methods and results are included in the
Supplementary Material, Table S5.1 and Figure S5.1).

161
5.4.2 GRANULAR COLLECTOR SURFACE CHARACTERIZATION
Quartz sand (-50 +70 mesh size, d50=256 µm, Sigma-Aldrich) and loamy sand
(d50=225 µm) acquired at a 35 cm depth from an Agriculture and Agri-Food Canada
(AAFC) farm plot located in St-Augustin-de-Desmaures, QC, were employed as granular
materials in this study. An electrokinetic analyzer (Anton Paar Electro Kinetic Analyzer)
was used to determine the surface (zeta) potential of the quartz sand for the experimental
conditions considered herein (Supplementary Material, Table S5.2). Further collector
characterization details are described elsewhere (Quevedo and Tufenkji 2012).
5.4.3 NANOPARTICLE SUSPENSION PREPARATION
Suspensions were prepared using polymer-coated nCeO2 (Batch Number: PB 54)
and nCAP (Batch Number: PB 67) powders (Vive Crop Protection). According to the
manufacturer, the nCeO2 particles (cubic crystal structure) have a nominal size of 1-10 nm
(TEM) and are coated with partially crosslinked PAA. The composition of the empty
nCAPs is analogous to that of the polymer-coating on the ceria particles (without the
metal oxide core). The nCeO2 and nCAP synthesis is based on counter-ion induced
polyelectrolyte collapse (Coulter et al., 2010). The PAA (polyelectrolyte) employed in
producing the nCeO2 coating and nCAP particles has a 345 kDa weight average molecular
weight (Mw). Furthermore, Mw for the nCAPs is 113 kDa by gel permeation
chromatography (GPC). Details regarding nCeO2 purity and preparation of ENP
suspensions are provided in the Supplementary Material section. Briefly, a particle
concentration of 100 mg/L was employed in all experiments. Experiments with nCeO2

162
were conducted in natural groundwater or in artificial electrolyte solutions at IS ranging
from 0.1 to 1 M sodium nitrate (NaNO3), 0.33 to 10 mM calcium chloride (CaCl2) and
0.33 to 12 mM magnesium chloride (MgCl2). The nCAP suspensions were prepared in
CaCl2 (0.33 to 20 mM) or natural groundwater. Suspension pH was stabilized using 1
mM MOPS and adjusted to pH 8 using NaOH.
5.4.4 NANOPARTICLE CHARACTERIZATION
Particle electrophoretic mobilities (EPMs) were determined by laser Doppler
velocimetry (ZetaSizer Nano ZS, Malvern). All EPM measurements were performed at
25oC, with an applied electrical field (E) of 4.9±0.1 V/m. Particle hydrodynamic
diameters were determined by DLS (dDLS) using a Zetasizer Nano ZS (Malvern) and by
nanoparticle tracking analysis (NTA, dNTA) (Nanosight LM10+LM14, Wiltshire, UK). At
least six independent replicate samples were analyzed using DLS and NTA.
5.4.5 NANOPARTICLE TRANSPORT AND DEPOSITION STUDIES
ENP transport studies were performed using glass columns (16 mm inner
diameter, GE Life Sciences) packed with quartz sand or loamy sand. Packed-bed
porosities were 0.37 and 0.44 for the quartz and loamy sands, respectively. Prior to use,
the quartz sand was prepared as previously described (Pelley and Tufenkji 2008) and then
soaked in background electrolyte for a minimum of 16 hours before wet packing into a
glass column to a height of 14 cm. Gentle vibration was used to avoid air entrapment
within the packed bed, ensure uniform packing, and minimize any possible layering of the

163
quartz sand. Prior to injecting the suspended ENPs into the quartz sand-packed column,
10 pore volumes (PVs) of background electrolyte were pumped through the column.
Before use, the loamy sand was dried in an oven at 105oC for 8 hours. All clumps
in the dried soil were gently crushed using a ceramic pestle. With some modifications,
loamy sand-packed columns were prepared as previously described (Jaisi and Elimelech
2009, Kretzschmar et al. 1997) to a height of 7 cm. Briefly, loamy sand was dry-packed
into a glass column. The column was then gently vibrated for 60 s to achieve uniform
packing and purged with CO2 at low pressure (in the upward direction) for 20 minutes to
improve water saturation. Next, the packed column was saturated with 20 mM CaCl2
solution (upward direction, 0.2 mL/min flow rate) to stabilize the soil colloids. Once
saturated, the column was further conditioned with 20 mM CaCl2 at gradually increasing
flow rates (stepwise from 0.2 to 1.3 mL/min) over the course of 1 hour. Next, an
additional 40 PVs of CaCl2 were added to the column, followed by 500 PVs of
background electrolyte (both in the upward direction, 1.3 mL/min flow rate). Prior to the
transport experiments, an additional 15 PVs of electrolyte were added (downward
direction, 1.3 mL/min), followed by 1 PV at 0.4 mL/min. Beyond equilibration, the
experimental procedure was identical for quartz and loamy sand-packed columns.
Consistent packing of both column types was confirmed using 10 mM KNO3 tracer
experiments (data not shown).
For all column experiments, a 0.4 mL/min flow rate (equivalent to a Darcy
velocity of 2.86 m/day) was employed. At least 3 PVs of ENP suspensions were injected,
followed by particle-free electrolyte. Influent (C0) and effluent (C) particle concentrations
were tracked online using a UV-visible spectrophotometer (Agilent 8453) equipped with a
1 cm flow-through cell. The nCeO2 particles were monitored at a wavelength of 300 nm

164
in natural groundwater and divalent salts and at 320 nm in NaNO3. The nCAPs were
monitored at 210 nm. Very reproducible deposition data was obtained and all particle
breakthrough curves presented are the average of at least 2 column experiments. At the
highest NaNO3 IS (0.5 and 1 M), nCeO2 breakthrough curves were determined by
inductively coupled plasma mass spectrometry (ICP-MS, Agilent 7500ce) using HNO3-
digested effluent samples.
5.4.6 INTERPRETATION OF ENP TRANSPORT BEHAVIOR
Particle transport behavior under the different experimental conditions was
interpreted quantitatively using the particle attachment efficiency (α). All α values are
calculated using the colloid filtration theory (Yao et al. 1971):
(1)
Here, d50 is the mean collector grain diameter, ε is the packed-bed porosity, L is the
packed-bed length and C/C0 corresponds to the normalized particle concentration at the
column effluent. The value of C/C0 used in eq 1 was determined in two ways: (i) by
averaging measured values between 1.8-2 PVs and (ii) by numerical integration of the
area under each measured particle breakthrough curve. Values of the single-collector
contact efficiency, η0, were determined using the Tufenkji-Elimelech correlation (Tufenkji
and Elimelech 2004).
( )
−=
00
50 ln-13
2CC
Ld
ηεα

165
5.5 RESULTS AND DISCUSSION
5.5.1 PARTICLE AND QUARTZ SAND SURFACE POTENTIAL
Under the experimental conditions used here (pH 8), the EPMs of nCeO2 and
nCAP particles are negative (Table 5.1) due to the carboxylic acid groups present on the
PAA chains. The experimentally determined point of zero charge (pHzpc) for the nCeO2
and nCAP particles is below pH 2 (Figure S5.2). In the natural groundwater, the nCeO2
and nCAP EPMs are -1.2 and -0.87 µmcmV-1s-1, respectively (Table 5.1). Our
measurement for nCeO2 in groundwater is very comparable to that reported by Keller et
al. (Keller et al., 2010) for nCeO2 rods (67 × 8 nm nominal size, Meliorum Technologies):
-1.1 µmcmV-1s-1 in Santa Paula groundwater (pH 7.9) and -1.1 µmcmV-1s-1 in Santa Clara
river water (pH 8.33). While there is no indication that the particles utilized by Keller et
al. had a polymer coating such as the PAA utilized in the present study, the presence of
organic carbon (considered to be a surrogate for natural organic matter) in the aquatic
matrices was found to result in negative EPMs. Furthermore, increasing IS was found to
result in less negative EPMs due to surface charge neutralization (Keller et al., 2010). As
observed by Keller et al., nCeO2 EPMs become less negative with increasing IS in the
monovalent and divalent salt solutions utilized herein (Table 5.1). EPM values for nCeO2
range from -2.7 to -1.4 µmcmV-1s-1 when the solution IS varies between 0.33 to 10 mM
CaCl2, from -2.7 to -0.79 µmcmV-1s-1 when the solution IS varies between 0.33 to 12 mM
MgCl2 and from -1.1 to -0.57 µmcmV-1s-1 when the salt concentration is increased from
100 to 500 mM NaNO3 (Table 5.1). Likewise, nCAP particle EPM decreases from -2.3 to
-1.0 µmcmV-1s-1 when the solution IS increases from 0.33 to 20 mM CaCl2 (Table 5.1).

166
Table 5.1 Measured hydrodynamic diameter and electrophoretic mobility (EPM) for nCeO2 and nCAP particles*

167
The observed decrease in surface potential with increasing solution IS can be
directly attributed to electrical double-layer compression and the screening of particle
surface charge with increasing salt concentration. Compared to monovalent cations,
divalent cations such as Ca2+ and Mg2+ are far more effective in masking surface charge
(Hunter 2001). While divalent cation screening efficiency results in rapid nCeO2
destabilization at IS > 10 mM CaCl2 or 12 mM MgCl2, stable suspensions can be
observed in NaNO3 at IS > 500 mM. As previously suggested by Chen and Elimelech,
the decrease in EPM observed in the presence of CaCl2 and MgCl2 may be due to the
binding of Ca2+ and Mg2+ to carboxylic acid groups (Chen and Elimelech 2007).
The zeta-potential of the quartz sand in natural and artificial groundwater matrices
(pH 8) was evaluated from the measured steaming potentials. Negative zeta-potentials are
observed over the range of experimental conditions, and the absolute value of the zeta-
potential decreases with increasing IS, and in the presence of divalent cations. Details are
provided in the Supplementary Material section (Table S5.2).
5.5.2 PARTICLE SIZE
In this study, ENP hydrodynamic diameters were determined using DLS (dDLS)
and NTA (dNTA). The average size of nCeO2 particles in suspensions injected into the
packed columns generally increases with increasing IS of NaNO3, CaCl2, or MgCl2 (Table
5.1, “influent” values). Measured values of dDLS range from 137 to 712 nm (in 0.33 and
10 mM CaCl2, respectively), 81 to 533 nm (in 0.33 and 12 mM MgCl2, respectively) and
54 to 145 nm (in 100 and 500 mM NaNO3, respectively). The observed increase in
nCeO2 aggregate size with increasing IS is in qualitative agreement with the DLVO
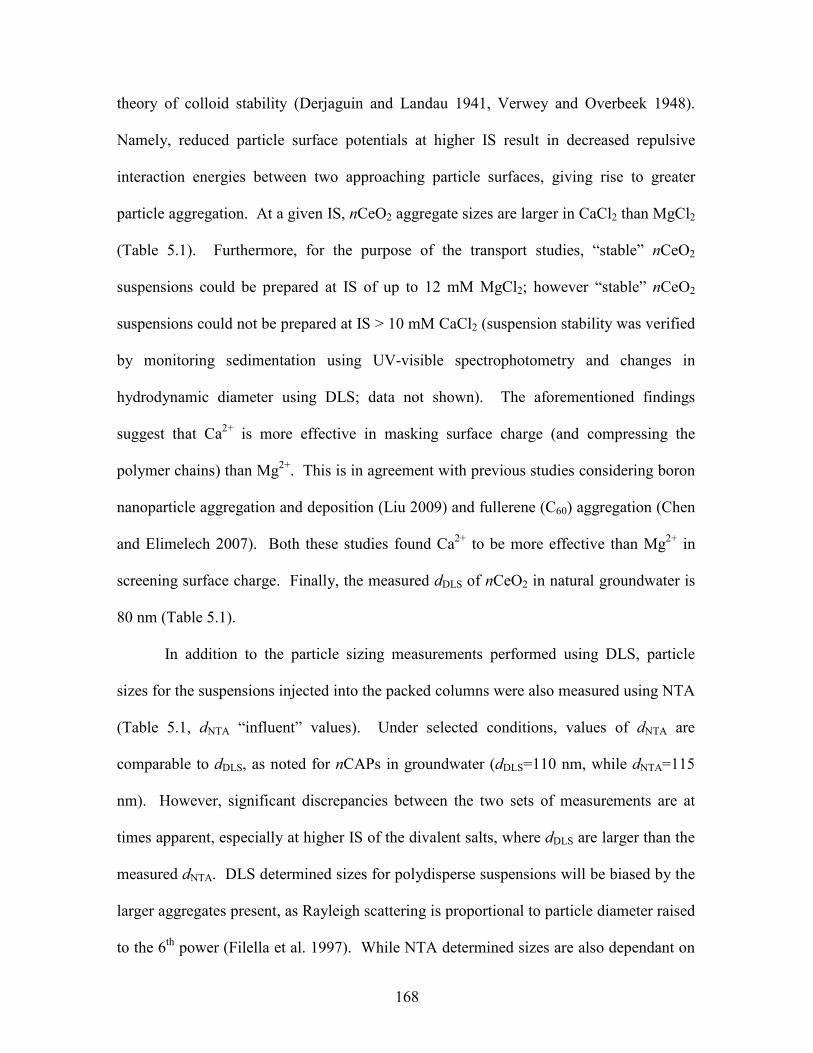
168
theory of colloid stability (Derjaguin and Landau 1941, Verwey and Overbeek 1948).
Namely, reduced particle surface potentials at higher IS result in decreased repulsive
interaction energies between two approaching particle surfaces, giving rise to greater
particle aggregation. At a given IS, nCeO2 aggregate sizes are larger in CaCl2 than MgCl2
(Table 5.1). Furthermore, for the purpose of the transport studies, “stable” nCeO2
suspensions could be prepared at IS of up to 12 mM MgCl2; however “stable” nCeO2
suspensions could not be prepared at IS > 10 mM CaCl2 (suspension stability was verified
by monitoring sedimentation using UV-visible spectrophotometry and changes in
hydrodynamic diameter using DLS; data not shown). The aforementioned findings
suggest that Ca2+ is more effective in masking surface charge (and compressing the
polymer chains) than Mg2+. This is in agreement with previous studies considering boron
nanoparticle aggregation and deposition (Liu 2009) and fullerene (C60) aggregation (Chen
and Elimelech 2007). Both these studies found Ca2+ to be more effective than Mg2+ in
screening surface charge. Finally, the measured dDLS of nCeO2 in natural groundwater is
80 nm (Table 5.1).
In addition to the particle sizing measurements performed using DLS, particle
sizes for the suspensions injected into the packed columns were also measured using NTA
(Table 5.1, dNTA “influent” values). Under selected conditions, values of dNTA are
comparable to dDLS, as noted for nCAPs in groundwater (dDLS=110 nm, while dNTA=115
nm). However, significant discrepancies between the two sets of measurements are at
times apparent, especially at higher IS of the divalent salts, where dDLS are larger than the
measured dNTA. DLS determined sizes for polydisperse suspensions will be biased by the
larger aggregates present, as Rayleigh scattering is proportional to particle diameter raised
to the 6th power (Filella et al. 1997). While NTA determined sizes are also dependant on

169
light scattering, the masking of smaller particles in the presence of larger aggregates is
less important (Domingos et al. 2009a), resulting in smaller reported diameters.
Furthermore, NTA has an upper size limit on the order of 1 µm, further decreasing
reported sizes in the presence of large aggregates (Carr et al. 2008). Thus, whereas dDLS
for nCAPs in 20 mM CaCl2 is 1073 nm (in part due to high polydispersity), dNTA at this
condition is 392 nm (Table 5.1). It should also be noted that the NTA has a lower size
limit of 30 nm that is dependent on the refractive index of the nanoparticles being
observed (Filipe et al., 2010). This may affect the determined sizes when examining
particles with very small nominal diameters (such as the 1-10 nm particles employed
herein).
The largest particle aggregates are encountered at the highest IS tested; yet,
increasing the concentration of the divalent salt beyond 0.33 mM appears to result in
decreased aggregate sizes in certain cases. This trend, apparent in the measured nCAP
hydrodynamic sizes (dDLS), as well as the dNTA for nCeO2 and nCAP particles suspended
in divalent salts, suggests that different mechanisms may be influencing the extent of
particle aggregation. While this trend is not apparent in the dDLS values determined for
nCeO2, higher dDLS standard deviations (as indicated by the 95% confidence interval) and
heightened suspension polydispersity, as indicated by the polydispersity index (PDI), are
encountered at the lowest (0.33 mM) divalent salt IS when compared to IS of 3.3 or 6.7
mM (Table 5.1). The standard deviations and PDI values observed suggest that a wider
range of aggregate sizes are present at 0.33 mM than at 3.3 and 6.7 mM, where
suspensions appear to be less polydisperse. The dDLS of the nCAP particle at the higher IS
of 3.3 and 6.7 mM CaCl2 (50 and 116 nm, respectively) are also significantly smaller than

170
the particle size at 0.33 mM (174 nm), where heightened polydispersity is again
encountered. As observed with nCeO2, nCAP size increases at the highest IS (Table 5.1).
It is known that PAA can adopt different conformations based on surrounding
solvent characteristics such as the ion species present, pH and IS (Turro and Arora 1986).
Whereas a coiled, more compressed conformation may be favored when carboxylic acid
groups are protonated (due to hydrogen bonding between monomers), deprotonation will
result in electrostatic repulsion within the PAA backbone, favoring a stretched
conformation (Sarkar and Somasundaran 2004). Likewise, while repulsive interactions
between charged carboxyl groups will result in extended PAA conformations at lower IS,
the addition of counterions (i.e., increased IS) will screen the charge, enabling the
polyelectrolyte chains to collapse (Coulter et al., 2010). Partial crosslinking of the PAA
chains by the manufacturer also likely affects the extent of PAA expansion and
compression
The fact that PAA can adopt different conformations is likely responsible for the
larger particle sizes or heightened polydispersity observed at the lowest (0.33 mM)
divalent salt IS, as a stretched polymer conformation is favored. Under these conditions,
the extended polymer chains contribute to the larger particle size detected. Increasing the
IS leads to decreased repulsion within the PAA polymer chains, enabling them to become
more coiled, compressed and uniform (as polymer chains are fastened in place by the
divalent counterions). This corresponds to the decrease in recorded size and/or PDI as IS
increases to 3.3 or 6.7 mM. Decreased electrostatic repulsion and reduced steric effects
(due to polymer compression) will ultimately favor particle aggregation, resulting in the
formation of the larger aggregates observed at the highest salt concentrations examined.

171
The influence of solution IS on the thickness of nanoparticle polymer coatings is currently
the focus of ongoing research in our group.
While nCAP composition is analogous to that of the nCeO2 polymer coating,
nCAP aggregate sizes are generally smaller than nCeO2 at a given CaCl2 IS (Table 5.1).
For instance, the dDLS of nCeO2 in 8 mM CaCl2 is 565 nm, whereas nCAP aggregates at
this IS measure 111 nm. Due to the heightened nCeO2 aggregation observed, stable ceria
suspensions can not be prepared at IS above 10 mM CaCl2. On the other hand, nCAP
suspensions can be prepared at IS as high as 20 mM CaCl2. The greater nCeO2
aggregation suggests that the polymer coating on this particle may not be completely
uniform and, hence, may not provide as effective electrosteric stabilization as that
observed for the nCAP. The pHzpc for bare nCeO2 is reported to be pH 7.6 (Li et al.
2011a). As previously observed with natural organic matter adsorbed on the surface of
metal oxide particles (Domingos et al. 2009b, Kretzschmar et al. 1997), the PAA coating
in this study significantly alters the particle surface potential, as the pHzpc for the nCeO2
particles employed is below pH 2 (Figure S5.2). Given that all experiments are conducted
at pH 8 (~pHzpc for the nCeO2 core), any exposed nCeO2 core material carries virtually no
surface charge. The nCeO2 particles with partially exposed cores will be more likely to
aggregate, as weaker repulsive forces are encountered at the uncovered sites. This
phenomenon is not an issue for the nCAPs, as they consist solely of PAA.
5.5.3 TRANSPORT AND DEPOSITION OF nCeO2 AND nCAP
The primary aim of this study is to investigate nCeO2 and nCAP deposition
behavior in quartz sand and loamy sand-packed columns. ENP transport studies were
172
conducted using natural groundwater or artificial solutions of either monovalent (NaNO3)
or divalent (CaCl2, MgCl2) salts. Given the aforementioned discrepancies between the
two particle sizing techniques, both dDLS and dNTA values were considered in calculating
the single-collector contact efficiency (η0), resulting in two estimates for the ENP
attachment efficiency, α (using eq 1). Furthermore, for each transport experiment, the
normalized particle concentration at the column effluent (C/C0) was evaluated using two
approaches: (i) averaging values between 1.8-2 PVs and, (ii) by numerical integration of
the area under each breakthrough curve. Consequently, for each experimental condition,
four distinct α values were obtained. Regardless of the sizing technique and manner in
which C/C0 is determined, the calculated α values are within a factor of 1-3 times for the
vast majority of experimental conditions (Tables S5.3 and S5.4). For simplicity,
attachment efficiencies discussed herein and presented in Table 5.1 are those obtained
using dDLS and C/C0 values evaluated by numerical integration of the particle
breakthrough curves.
5.5.3.1 Transport and deposition in the presence of monovalent salts
Regardless of [NaNO3] (IS ranging from 0.1 to 1 M), virtually all nCeO2 particles
elute from the quartz sand-packed columns (Figure 5.1a). Even at 1 M IS, only 20%
retention is observed. Given that particle and collector surfaces are negatively charged at
pH 8, lower absolute surface potentials at higher IS should render deposition more
favorable, while heightened aggregation could result in the physical straining of particles
within the packed column. Although particle EPM decreases (-1.1 to -0.57 µmcmV-1s-1)
and aggregate size increases (54 to 145 nm) when the IS increases from 100 to 500 mM

173
NaNO3 (Table 5.1), near complete particle elution is still observed over this range of IS.
Nonetheless, comparison of nCeO2 particle sizes in column influent and effluent
suspensions provides support for a mechanism of particle straining (Table 5.1). Physical
straining occurs when large aggregates become entrapped in the narrower pores between
collector surfaces (Bradford et al., 2002, Shen et al., 2008). As the pores clog, incoming
particles become entrapped, resulting in decreased elution. The data in Table 5.1 show
that, at IS > 200 mM NaNO3, nCeO2 particle sizes in the column effluent are considerably
smaller than those measured in the influent suspensions. This suggests that the larger
aggregates formed at the higher salt concentrations are preferentially retained in the
granular matrix (likely by physical straining).
Figure 5.1 nCeO2 breakthrough curves in NaNO3. Transport experiments were performed in (a) quartz and (b) loamy sand-packed columns using 100 mg/L nCeO2 suspensions (pH 8).
Significantly more retention is reported in a recent study by Li et al. (Li et al.
2011b) investigating bare nCeO2 transport and deposition in 45 cm sand-packed columns.
Although the particles used in their study were suspended in monovalent NaCl, significant
particle retention occurred at 1 mM IS under more favorable deposition conditions (pH 3)
1 2 3 4 50.0
0.2
0.4
0.6
0.8
1.0
C/C 0
Pore Volumes
(b)
1 2 3 40.0
0.2
0.4
0.6
0.8
1.0
100 mM NaNO3
200 mM NaNO3
300 mM NaNO3
500 mM NaNO3
1000 mM NaNO3
C/C 0
Pore Volumes
(a)

174
and at 10 mM IS under unfavorable deposition conditions (pH 6 and pH 9). While the
longer columns employed by Li et al. would naturally result in greater particle retention,
they also made use of coarser quartz sand (d=717 µm) and a faster 20 mL/min flow rate
(Li et al. 2011b). Hence, the observed discrepancies between the two studies are likely
due to the PAA coating on the Vive Crop ProtectionTM particles. Such a coating can
result in the electrosteric stabilization of the particles (Elimelech et al. 1995, Franchi and
O'Melia 2003), resulting in heightened particle transport.
Liu et al. (Liu et al. 2012) also report very high retention of bare nCeO2 in quartz
sand-packed columns (10 mM NaCl). While their columns were similar in length and
contained collector grains of similar composition and size (sand sifted through 250–300
µm sieves) to those used herein, only 4.3% of nCeO2 was found to elute at pH 8.5 in their
study. The nCeO2 employed by Liu et al. had a pHzpc of 6.8, rendering deposition
unfavorable at pH 8.5. The authors suggest that heightened retention under unfavorable
conditions may have resulted from surface roughness and chemical heterogeneities on the
collector surfaces (Liu et al. 2012). In the presence of organic matter (e.g., humic acid),
they observed enhanced nCeO2 stability and mobility (in 1 mM NaCl, pH 6.5), likely due
to electrosteric effects of the adsorbed humic acid. Adding 1, 3 or 6 mg/L humic acid,
resulted in increased particle elution. The heightened particle elution observed in the
presence of stabilizing humic acid (Liu et al. 2012) is in better agreement with the
polymer-coated nCeO2 transport observed in the present study (in NaNO3).
When nCeO2 particles suspended in NaNO3 are added to loamy sand-packed
columns, greater particle retention is observed, with α values as high as 0.23 at 500 mM
IS (Table 5.1). In contrast to the steady-state behavior observed in the quartz sand

175
columns (Figure 5.1a), particle elution is dynamic and increases over time in the loamy
sand (Figure 5.1b). The heightened retention observed in loamy sand is likely due to
increased favorable deposition sites within the packed bed when compared to quartz sand.
These additional sites likely result from the presence of clays within the loamy sand
(Quevedo and Tufenkji, 2012). While albite (pHzpc≈5.9) and orthoclase (pHzpc≈1) in the
clay fraction present unfavorable conditions for nCeO2 and nCAP retention at pH 8,
allophane (pHzpc≈7.8) in the clay fraction may provide additional positively charged sites
onto which negatively charged ENPs can “favorably” deposit (Quevedo and Tufenkji
2012, Sposito 1989). Although the Fe content of the loamy sand was not quantified, the
presence of Fe was confirmed by EDS. If iron oxides are present in the loamy sand, they
would also play an important role in the favorable deposition of the negatively charged
ENPs (Ryan and Elimelech, 1996).
The number of favorable deposition sites in the packed bed increases with
increasing IS due to the charge masking effect of the Na+ counterions. This leads to
increased retention with increasing IS within the loamy sand (Figure 5.1b). The dynamic
elution behavior observed is indicative of a blocking effect within the column (Liu et al.
1995, Ryan and Elimelech 1996). As favorable deposition sites become occupied, fewer
sites remain for incoming particles. Thus, the incoming particles are repelled by
deposited particles with similar surface potentials and less likely to find an available
deposition site. Electrostatic repulsion and steric interactions may also prevent incoming
particles from depositing onto sites adjacent to previously deposited particles (Ko and
Elimelech 2000). These conditions result in increased particle elution over time.
Although the size of nCeO2 particles in the column effluent were not measured for
experiments conducted with loamy sand packed columns, it is very likely that physical

176
straining also contributes to the retention of particles in this system. The extent of
physical straining is strongly influenced by the particle to grain size ratio (Tufenkji et al.,
2004); because the mean sizes of the two sands are comparable, there is a strong
possibility that straining is also playing a role in the loamy sand.
5.5.3.2 Transport and deposition in the presence of divalent salts
In the presence of divalent salts, the attachment efficiency increases over several
orders of magnitude with increasing IS (Table 5.1). For nCeO2 suspended in CaCl2 (0.33
to 10 mM), determined α values range from 7.3×10⁻⁵ to 0.17 in quartz sand, and 7.3×10⁻³
to 0.50 in loamy sand (Table 5.1). Likewise, nCeO2 attachment efficiency in quartz sand
increases from 1.5×10⁻⁴ to 0.085 when the IS of MgCl2 is increased from 0.33 to 12 mM
(Table 5.1). While dynamic (time-dependent) particle transport behavior is encountered
in both granular materials, less retention is observed in the quartz sand at any given IS.
In quartz sand, significant particle retention is observed at CaCl2 IS ≥ 6.7 mM
(Figure 5.2a). At pH 8, the nCeO2 and quartz sand have a negative surface potential,
rendering deposition unfavorable. Nonetheless, the particle and collector surface
potentials observed at 6.7 mM CaCl2 are less negative than at 0.33 mM CaCl2 (Table
S5.2). Such decreased surface potentials increase the likelihood of deposition as
electrostatic particle-surface interactions are less repulsive (Derjaguin and Landau 1941,
Elimelech and O'Melia 1990a, b, Verwey and Overbeek 1948). Furthermore, as discussed
previously, higher [CaCl2] will decrease electrostatic repulsion within the PAA coating,
favoring a compressed conformation. This will result in decreased steric repulsion,
further favoring particle deposition. Slightly more than 20% of particles suspended in 6.7

177
mM CaCl2 are retained by the quartz sand, with elution increasing over time (due to the
aforementioned blocking phenomenon). On the other hand, 75% of the nCeO2 is retained
in loamy sand at the same IS (Figure 5.2b).
Figure 5.2 nCeO2 breakthrough curves in CaCl2. Transport experiments were performed in (a) quartz and (b) loamy sand-packed columns using 100 mg/L nCeO2 suspensions (pH 8).
It is interesting to note that at 8 mM IS CaCl2, the elution of nCeO2 particles
decreases with time (Figure 5.2a). At this condition, the nCeO2 particles are larger than
those observed at lower [CaCl2] (565 nm versus 193 nm at 6.7 mM), suggesting the
decreased particle elution with time could be a result of physical straining. Here, influent
and effluent values of dDLS for nCeO2 are generally comparable at the lower
concentrations of CaCl2 (Table 5.1), indicating that particle aggregation or particle
straining do not occur during the transport experiment. Yet, at higher CaCl2
concentrations, nCeO2 particle sizes in the column effluent are consistently smaller than
influent values, suggesting that physical straining occurs. In 8 mM CaCl2, the effluent
dDLS (487 nm) is significantly smaller than the influent dDLS (565 nm). This is even more
apparent in 10 mM CaCl2, where the influent dDLS (712 nm) is considerably larger than
the effluent diameter (166 nm). While blocking of the most favorable deposition sites is
1 2 3 40.0
0.2
0.4
0.6
0.8
1.0
0.33 mM CaCl2 3.3 mM CaCl2 6.7 mM CaCl2 8.0 mM CaCl2 10.0 mM CaCl2
C/C 0
Pore Volumes1 2 3 4 5
0.0
0.2
0.4
0.6
0.8
1.0
C/C 0
Pore Volumes
(a) (b)

178
likely occurring, physical straining is likely responsible for the observed decreased
particle elution with time at higher IS.
As observed in CaCl2, nCeO2 particles suspended in MgCl2 exhibit heightened
deposition at higher IS in quartz sand (Figure 5.3). However, contrary to the physical
straining observed at 8 and 10 mM CaCl2 (Figure 5.2a), blocking is apparent at MgCl2 IS
ranging from 6.7 to 12 mM, with particle elution increasing over time (Figure 5.3). The
distinct dynamic behaviors observed likely result from differences in the aggregate sizes
encountered in the two divalent salts. Overall, aggregates in the MgCl2 solutions are
smaller than in CaCl2 at a given IS. At 8 mM IS, the nCeO2 dDLS in MgCl2 is 223 nm,
which is significantly smaller than the 565 nm dDLS measured in 8 mM CaCl2 (Table 5.1).
It appears the smaller aggregates in MgCl2 do not result in the significant physical
straining observed at higher CaCl2 IS. Consequently, once favorable deposition sites
become occupied, heightened particle elution is observed. At the highest MgCl2 IS tested
(12 mM), aggregate sizes are much larger (533 nm). Furthermore, effluent dDLS are much
smaller than influent dDLS, suggesting that the largest aggregates are preferentially
retained (Table 5.1). The fact that this does not result in significant physical straining
(based on the slope of the breakthrough curves, Figure 5.3) suggests there are likely fewer
large aggregates in the MgCl2 solutions. Although the largest may become entrapped in
the packed bed, their retention does not appear to result in the extensive pore clogging and
physical straining observed in CaCl2.

179
Figure 5.3 nCeO2 breakthrough curves in MgCl2. Transport studies were performed in quartz sand using 100 mg/L nCeO2 suspensions (pH 8).
1 2 3 40.0
0.2
0.4
0.6
0.8
1.0
0.33 mM MgCl2 6.6 mM MgCl2 8.0 mM MgCl2 12 mM MgCl2
C/C 0
Pore Volumes

180
The transport and deposition behavior of the nCAPs, consisting of the same PAA
polymer that is present on the nCeO2 particle surface, was also examined under selected
conditions. The water dispersible nCAPs are among various prototypes developed by
Vive Crop Protection to potentially deliver active agents that protect crops and heighten
yields, while decreasing the use of potentially harmful pesticides. Before such capsules
can be applied to agricultural soils on a large scale, their behavior in model subsurface
environments must be evaluated.
Similar to the trends observed for nCeO2, the nCAP breakthrough curves also
exhibit increased retention with increasing [CaCl2] in quartz sand (Figure 5.4). Moreover,
increased nCAP elution with time (indicative of particle blocking) is observed at 6.7 and
8.0 mM CaCl2. As observed with nCeO2, the dDLS of the nCAP in column effluent
suspensions is smaller than the measured hydrodynamic diameter of the influent
suspensions at higher CaCl2 IS (Table 5.1). For example, at 16 mM IS, the influent dDLS
(795 nm) is nearly twice as large as the size of the nCAPs in the column effluent. These
data suggest that larger aggregates are preferentially retained within the granular medium.
nCAP attachment efficiencies are comparable to the nCeO2 α values observed in 6.7 and 8
mM CaCl2 and in natural groundwater (Table 5.1), suggesting the two particle types have
a similar transport potential.
181
Figure 5.4 Breakthrough curves for nCAP particles in CaCl2. Transport studies were performed in quartz sand using 100 mg/L nCAP suspensions (pH 8).
5.5.3.3 Transport and deposition of ENPs suspended in a natural groundwater
In quartz sand, nCeO2 and nCAP particles suspended in natural groundwater
demonstrate significant transport potential, with particle elution gradually approaching 80
and 100%, respectively (Figure 5.5a). While the attachment efficiency for both particle
types is approximately 4×10⁻³ in quartz sand, calculated α values are an order of
magnitude larger in loamy sand (Table 5.1). A previous study conducted in our
laboratory also showed QD and carboxylated polystyrene latex nanoparticle retention in
loamy sand to be heightened by an order of magnitude compared to particle behavior in
quartz sand (Quevedo and Tufenkji 2012). The shapes of the particle breakthrough curves
from experiments conducted using the loamy sand columns and natural groundwater
indicate that particle blocking contributes to the overall nCeO2 and nCAP transport
behavior (Figure 5.5b). As observed in quartz sand, the transport potential for both
1 2 3 40.0
0.2
0.4
0.6
0.8
1.0
0.33 mM CaCl2 6.7 mM CaCl2 8.0 mM CaCl2 16 mM CaCl2 20 mM CaCl2
C/C 0
Pore Volumes

182
particles in loamy sand is very similar, with α values of 0.057 and 0.085 for nCeO2 and
nCAP, respectively. In contrast, our group previously observed that the retention
behaviors of two carboxy-terminated QDs and a carboxylated polystyrene latex
nanoparticle were distinct in loamy sand (Quevedo and Tufenkji 2012). Although the
coatings of all three particle types in the aforementioned study possessed carboxyl
functional groups, their surfaces consisted of different polymers. Consequently,
variations in transport behavior likely resulted from differences in polymer-coating
affinities for specific loamy sand components. Such apparent differences were not
encountered in the present study, as nCAP particle composition is analogous to the nCeO2
polymer coating.
Figure 5.5 Representative breakthrough curves for nCAP and nCeO2 particles suspended in natural groundwater. Breakthrough curves for nCAP particles injected into (a) quartz sand and (b) loamy sand-packed columns (pH 8) are presented.
1 2 3 40.0
0.2
0.4
0.6
0.8
1.0
nCeO2
nCAPs
C/C 0
Pore Volumes
(a)
1 2 3 4 50.0
0.2
0.4
0.6
nCeO2
nCAPs
C/C 0
Pore Volumes
(b)

183
The natural groundwater used in this study has a total IS of 7.4 mM, of which Ca2+
and Mg2+ account for 5 mM (3.6 mM Ca2+ and 1.4 mM Mg2+). Thus, it is of interest to
compare the transport of the ENPs in the artificial matrices having comparable
concentrations of the divalent cations. In quartz and loamy sands, nCeO2 attachment
efficiencies observed in natural groundwater are higher than those observed in 3.3 mM
CaCl2 and lower than those observed at 6.7 mM CaCl2. These findings correspond to the
fact that divalent cations account for 5 mM of the total 7.4 mM groundwater IS.
Likewise, in quartz sand, the nCAP α value observed in natural groundwater is lower than
that observed in 6.7 mM CaCl2.
5.5.3.4 Summary of the transport behavior of PAA-coated ENPs
One of the aims of this study is to compare nCeO2 and nCAP transport behavior. When
plotting nCeO2 and nCAP particle attachment efficiencies in quartz sand as a function of
CaCl2 IS (Figure 5.6), it is evident that nCAP α values are smaller at 0.33 mM and
comparable to nCeO2 at 6.7 and 8 mM. Beyond the current study, previous work by this
group considered the transport behavior of nTiO2, nZnO and CdTe QDs with the same
PAA-derived surface coating (Petosa et al. 2012, Quevedo and Tufenkji 2012). As in the
current study, we also observed that α increases with increasing IS for the other PAA-
coated ENPs. In Figure 5.6, we have included previously reported α values for
experiments conducted with the PAA-coated nTiO2, nZnO and CdTe QDs in CaCl2 and
quartz sand. The attachment efficiencies for these other ENPs are generally higher than
those observed with the nCAP (Figure 5.6). At 8 mM CaCl2, the nCAP α in quartz sand is
0.011, orders of magnitude smaller than the α values previously observed for nTiO2

184
(α=0.63) and nZnO (α=1.1) (Petosa et al. 2012). Likewise, α=0.69 for QDs in 5 mM
CaCl2 (Quevedo and Tufenkji 2012), which is higher than the nCAP attachment
efficiency at 20 mM IS. The data in Figure 6 demonstrate that while the transport
behavior for the various particle types is not identical (potentially due to partially exposed
cores), the nCAP transport behavior is most comparable to that of the nCeO2 particles.
Note that while nCAP, nCeO2 and nZnO studies were conducted at pH 8, nTiO2 and QD
studies were conducted at pH 7.
Figure 5.6 Attachment efficiency (α) as a function of CaCl2 IS. The α values observed for nCAP, nCeO2, QD, nTiO2 and nZnO particles in quartz sand-packed columns are plotted.
10-1 100 101
10-6
10-5
10-4
10-3
10-2
10-1
100
Atta
chm
ent E
fficie
ncy
( α)
Ionic Strength of CaCl2 (mM)
nCAP (pH 8; this study) nCeO2 (pH 8; this study) nZnO (pH 8; Petosa et al., 2012) nQDs (pH 7; Quevedo & Tufenkji, 2012) nTiO2 (pH 7; Petosa et al., 2012)

185
While the current study improves our understanding of nCeO2 transport and
deposition behavior in saturated granular environments, there are inherent limitations that
should be noted. Firstly, soil characteristics (e.g., hydraulic conductivity, mineralogical
and organic matter content) are location and depth dependent. Consequently, ENP
affinity for various soil types and in different soil horizons will vary significantly.
Nonetheless, the current study identifies particular environmental characteristics that
result in enhanced ENP mobility (e.g., sandy soils, lower salt concentrations).
Furthermore, while different natural and artificial groundwater matrices are employed, all
experiments are conducted at pH 8. Geographical variations in groundwater pH will
affect ENP deposition as changes in particle and collector surface potential, colloidal
stability, aggregate size and interactions with soil components (e.g., humic substances)
will occur (Navarro et al. 2009, Quevedo and Tufenkji 2012). Finally, the loamy sand-
packed columns employed are not extracted as undisturbed cores. Still, by conducting
well-controlled experiments using two different granular materials, we obtain useful
insight into the influence of collector grain properties and water chemistry on ENP
transport and retention.
5.6 CONCLUSIONS
This study clearly demonstrates that it is necessary to consider aquatic matrix
composition and soil type in evaluating ENP contamination risks. Overall, enhanced
nCeO2 particle retention is encountered at higher divalent salt (CaCl2 and MgCl2)
concentrations and in loamy sand. Namely, it is evident that:
186
• while virtually all nCeO2 particles suspended in [NaNO3] ≤ 500 mM elute from
the quartz sand-packed columns, heightened particle retention and dynamic
behavior (blocking) is observed in loamy sand.
• nCeO2 attachment efficiency increases over several orders of magnitude within a
narrow range of divalent salt IS (0.33–10 mM CaCl2 and 1–12 mM MgCl2).
While dynamic behavior (blocking and physical straining) is encountered in both
granular materials, lower retention is observed in quartz sand at any given IS.
• nCeO2 and nCAP attachment efficiencies for particles suspended in natural
groundwater are an order of magnitude higher in loamy sand than in quartz sand.
• the enhanced retention observed in loamy sand may partially be due to the
presence of favorable deposition sites on clays such as allophane, and metal oxides
such as iron oxide.
The aforementioned findings indicate that specific environmental conditions (e.g.,
sandy soils, decreased ionic strength, and decreased divalent salt concentrations) are more
conducive to heightened particle mobility. Finally, the transport potential of the model
polymeric capsule (nCAP) is generally greater than that of various PAA-coated ENPs
previously tested and most comparable to the nCeO2 used in the present study.
5.7 ACKNOWLEDGEMENTS
This research was supported by NSERC, the Ministère du développement
économique, innovation et exportation du Québec, the CRC Program, Environment
Canada, Vive Crop Protection, and the CFI. ARP was funded by NSERC (PGS) and a
MEDA. FR was partially supported by a McGill SURE award. The authors also thank

187
Ivan Quevedo for helpful discussions, F. Duquette-Murphy and K. J. Wilkinson (U.
Montreal) for NTA assistance and A. Tessier (Concordia) for ICP-MS assistance.

188
5.8 REFERENCES
Auffan, M., Rose, J., Bottero, J.-Y., Lowry, G.V., Jolivet, J.-P. and Wiesner, M.R. (2009) Towards a definition of inorganic nanoparticles from an environmental, health and safety perspective. Nature Nanotechnology 4, 634-641. Bradford, S.A., Yates, S.R., Bettahar, M. and Simunek, J. (2002) Physical factors affecting the transport and fate of colloids in saturated porous media. Water Resources Research 38(12), 631-6312. Carr, B., Malloy, A. and Warren, J. (2008) Nanoparticle tracking analysis. Innovations in Pharmaceutical Technology 26, 38-40. Cassee, F.R., Van Balen, E.C., Singh, C., Green, D., Muijser, H., Weinstein, J. and Dreher, K. (2011) Exposure, health and ecological effects review of engineered nanoscale cerium and cerium oxide associated with its use as a fuel additive. Critical Reviews in Toxicology 41(3), 213-229. Chen, K.L. and Elimelech, M. (2007) Influence of humic acid on the aggregation kinetics of fullerene (C60) nanoparticles in monovalent and divalent electrolyte solutions. Journal of Colloid and Interface Science 309(1), 126-134. Coulter, M.M., Dinglasan, J.A., Goh, J.B., Nair, S., Anderson, D.J. and Dong, V.M. (2010) Preparing water-dispersed palladium nanoparticles via polyelectrolyte nanoreactors. Chemical Science 1(6), 772-775. Derjaguin, B.V. and Landau, L.D. (1941) Theory of stability of strongly charged lyophobic sols and the adhesion of strongly charged particles in solutions of electrolytes. Acta Physicochimica URSS 14, 633-662. Domingos, R.F., Baalousha, M.A., Ju-Nam, Y., Reid, M.M., Tufenkji, N., Lead, J.R., Leppard, G.G. and Wilkinson, K.J. (2009a) Characterizing manufactured nanoparticles in the environment: Multimethod determination of particle sizes. Environmental Science & Technology 43(19), 7277-7284. Domingos, R.F., Tufenkji, N. and Wilkinson, K.J. (2009b) Aggregation of titanium dioxide nanoparticles: Role of a fulvic acid. Environmental Science and Technology 43(5), 1282-1286. Elimelech, M., Gregory, J., Jia, X. and Williams, R.A. (1995) Particle Deposition and Aggregation: Measurement, Modeling, and Simulation, Butterworth-Heinemann, Oxford. Elimelech, M. and O'Melia, C.R. (1990a) Effect of particle size on collision efficiency in the deposition of Brownian particles with electrostatic energy barriers. Langmuir 6(6), 1153-1163.

189
Elimelech, M. and O'Melia, C.R. (1990b) Kinetics of deposition of colloidal particles in porous media. Environmental Science and Technology 24(10), 1528-1536. Filella, M., Zhang, J., Newman, M.E. and Buffle, J. (1997) Analytical applications of photon correlation spectroscopy for size distribution measurements of natural colloidal suspensions: Capabilities and limitations. Colloids and Surfaces A: Physicochemical and Engineering Aspects 120(1-3), 27-46. Filipe, V., Hawe, A. and Jiskoot, W. (2010) Critical evaluation of nanoparticle tracking analysis (NTA) by NanoSight for the measurement of nanoparticles and protein aggregates. Pharmaceutical Research 27(5), 796-810. Franchi, A. and O'Melia, C.R. (2003) Effects of natural organic matter and solution chemistry on the deposition and reentrainment of colloids in porous media. Environmental Science and Technology 37(6), 1122-1129. García, A., Espinosa, R., Delgado, L., Casals, E., González, E., Puntes, V., Barata, C., Font, X. and Sánchez, A. (2011) Acute toxicity of cerium oxide, titanium oxide and iron oxide nanoparticles using standardized tests. Desalination 269(1-3), 136-141. Hunter, R.J. (2001) Foundations of Colloid Science, Oxford University Press Inc., New York. Jaisi, D.P. and Elimelech, M. (2009) Single-walled carbon nanotubes exhibit limited transport in soil columns. Environmental Science and Technology 43(24), 9161-9166. Johnson, A.C. and Park, B. (2012) Predicting contamination by the fuel additive cerium oxide engineered nanoparticles within the United Kingdom and the associated risks. Environmental Toxicology and Chemistry 31(11), 2582-2587. Ju-Nam, Y. and Lead, J.R. (2008) Manufactured nanoparticles: An overview of their chemistry, interactions and potential environmental implications. Science of the Total Environment 400(1-3), 396-414. Keller, A.A., Wang, H., Zhou, D., Lenihan, H.S., Cherr, G., Cardinale, B.J., Miller, R. and Zhaoxia, J.I. (2010). Stability and aggregation of metal oxide nanoparticles in natural aqueous matrices. Environmental Science and Technology 44(6), 1962-1967. Klaine, S.J., Alvarez, P.J.J., Batley, G.E., Fernandes, T.F., Handy, R.D., Lyon, D.Y., Mahendra, S., McLaughlin, M.J. and Lead, J.R. (2008) Nanomaterials in the environment: Behavior, fate, bioavailability, and effects. Environmental Toxicology and Chemistry 27(9), 1825-1851. Ko, C.H. and Elimelech, M. (2000) The 'shadow effect' in colloid transport and deposition dynamics in granular porous media: Measurements and mechanisms. Environmental Science and Technology 34(17), 3681-3689.
190
Kretzschmar, R., Barmettler, K., Grolimund, D., Yan, Y.D., Borkovec, M. and Sticher, H. (1997) Experimental determination of colloid deposition rates and collision efficiencies in natural porous media. Water Resources Research 33(5), 1129-1137. Kretzschmar, R., Robarge, W.P. and Amoozegar, A. (1994) Filter efficiency of three saprolites for natural clay and iron oxide colloids. Environmental Science and Technology 28(11), 1907-1915. Li, K., Zhang, W., Huang, Y. and Chen, Y. (2011a) Aggregation kinetics of CeO2 nanoparticles in KCl and CaCl2 solutions: Measurements and modeling. Journal of Nanoparticle Research 13(12), 6483-6491. Li, Z., Sahle-Demessie, E., Hassan, A.A. and Sorial, G.A. (2011b) Transport and deposition of CeO2 nanoparticles in water-saturated porous media. Water Research 45(15), 4409-4418. Liu, D., Johnson, P.R. and Elimelech, M. (1995) Colloid deposition dynamics in flow through porous media: Role of electrolyte concentration. Environmental Science and Technology 29(12), 2963-2973. Liu, X., Chen, G. and Su, C. (2012) Influence of collector surface composition and water chemistry on the deposition of cerium dioxide nanoparticles: QCM-D and column experiment approaches. Environmental Science and Technology 46(12), 6681-6688. Liu, X., Wazne, M., Christodoulatos, C., Jasinkiewicz, K.L. (2009) Aggregation and deposition behavior of boron nanoparticles in porous media. Journal of Colloid and Interface Science 330(1), 90-96. Navarro, D.A.G., Watson, D.F., Aga, D.S. and Banerjee, S. (2009) Natural organic matter-mediated phase transfer of quantum dots in the aquatic environment. Environmental Science and Technology 43(3), 677-682. Pelley, A.J. and Tufenkji, N. (2008) Effect of particle size and natural organic matter on the migration of nano- and microscale latex particles in saturated porous media Journal of Colloid and Interface Science 321(1), 74-83. Petosa, A.R., Brennan, S.J., Rajput, F. and Tufenkji, N. (2012) Transport of two metal oxide nanoparticles in saturated granular porous media: Role of water chemistry and particle coating. Water Research 46(4), 1273-1285. Petosa, A.R., Jaisi, D.P., Quevedo, I.R., Elimelech, M. and Tufenkji, N. (2010) Aggregation and deposition of engineered nanomaterials in aquatic environments: Role of physicochemical interactions. Environmental Science and Technology 44(17), 6532-6549.
191
Quevedo, I.R. and Tufenkji, N. (2012) Mobility of functionalized quantum dots and a model polystyrene nanoparticle in saturated quartz sand and loamy sand. Environmental Science and Technology 46(8), 4449-4457. Ryan, J.N. and Elimelech, M. (1996) Colloid mobilization and transport in groundwater. Colloids and Surfaces A: Physicochemical and Engineering Aspects 107, 1-56. Sarkar, D. and Somasundaran, P. (2004) Conformational dynamics of poly(acrylic acid). A study using surface plasmon resonance spectroscopy. Langmuir 20(11), 4657-4664. Shen, C., Huang, Y., Li, B. and Jin, Y. (2008) Effects of solution chemistry on straining of colloids in porous media under unfavorable conditions. Water Resources Research 44(W05419), 1-12. Sposito, G. (1989) The Chemistry of Soils, Oxford University Press, Inc., New York. Tufenkji, N. and Elimelech, M. (2004) Correlation equation for predicting single-collector efficiency in physicochemical filtration in saturated porous media. Environmental Science and Technology 38(2), 529-536. Tufenkji, N., Miller, G.F., Ryan, J.N., Harvey, R.W. and Elimelech, M. (2004). Transport of Cryptosporidium oocysts in porous media: Role of straining and physicochemical filtration. Environmental Science and Technology 38(22), 5932-5938. Turro, N.J. and Arora, K.S. (1986) Pyrene as a photophysical probe for intermolecular interactions of water-soluble polymers in dilute solutions. Polymer 27(5), 783-796. Van Hoecke, K., De Schamphelaere, K.A.C., Van Der Meeren, P., Smagghe, G. and Janssen, C.R. (2011) Aggregation and ecotoxicity of CeO2 nanoparticles in synthetic and natural waters with variable pH, organic matter concentration and ionic strength. Environmental Pollution 159(4), 970-976. Verwey, E.J.W. and Overbeek, J.T.G. (1948) Theory of the Stability of Lyophobic Colloids, Elsevier, Amsterdam. Wiesner, M.R. and Bottero, J.-Y. (2007) Environmental Nanotechnology, The McGraw-Hill Companies, New York. Yao, K.M., Habibian, M.T. and O'Melia, C.R. (1971) Water and waste water filtration: Concepts and applications. Environmental Science and Technology 5(11), 1105-1112.
192
5.9 SUPPLEMENTARY MATERIAL FOR CHAPTER 5
5.9.1 Groundwater Characterization
Prior to use, natural groundwater, originating from a domestic well in the township
of North Glengarry, Ontario, was thoroughly characterized. Anion and cation
concentrations were determined by ion chromatography (IC, Metrohm 820 Separation
Center, 819 IC Detector, Metrosep A Supp 7-250 column) and inductively coupled
plasma atomic emission spectroscopy (ICP-AES, Thermo Jarrell Ash Trace Scan),
respectively. Total organic carbon, total nitrogen and total inorganic carbon analyses
were conducted (Shimadzu TOC-VCPH Total Organic Carbon Analyzer, 4 μg/L
detection limit and Shimadzu TNM-1 Total Nitrogen Measuring Unit, 5 μg/L
detection limit). Chemical oxygen demand (COD) was also verified using a 0-1500
ppm O2 COD kit (SCP Science AccuSPEC).
Groundwater characterization data is presented in Table S5.1 and Figure S5.1.
Elemental analysis by ICP-AES found the water contains 72.3 ppm calcium, 17.0 ppm
magnesium, 6.7 ppm silicon, 6.7 ppm sulfur and 3.9 ppm sodium. Additionally, lesser
amounts of potassium (0.7 ppm) and barium (0.1 ppm) are present. Anions encountered
in the groundwater include sulfate (SO42-), chloride (Cl-) and fluoride (F-) at
concentrations of 20.4, 2.1 and 0.6 ppm, respectively. Nitrogen and organic carbon are
not detectable, while 55.9 mg/L of inorganic carbon are present. Moreover, the natural
groundwater employed in this study has a very low chemical oxygen demand (COD,
Figure S5.1), further confirming that all carbon is in the inorganic form and that the water
is biologically inactive. Based on the characterization experiments conducted, and

193
500 600 700 800
0.0
0.3
0.6
0.9
Abso
rban
ce
Wavelength (nm)
200 ppm Standard Natural Groundwater
assuming all carbon is in the form of carbonate (CO32-), the calculated groundwater IS is
7.4 mM.
Table S5.1 Summary of natural groundwater characterization data.
Figure S5.1 Groundwater chemical oxygen demand (COD). Absorbance values obtained for natural groundwater and a 200 ppm standard are plotted.
8.0 ± 0.1
7.4 mM
calcium (Ca) 72.3 ppmmagnesium (Mg) 17 ppm
silicon (Si) 6.7 ppmsulfur (S) 6.7 ppm
sodium (Na) 3.9 ppmpotassium (K) 0.7 ppmbarium (Ba) 0.1 ppm
sulfate (SO42-) 20.4 ppm
chloride (Cl-) 2.1 ppmfluoride (F-) 0.6 ppm
Total Nitrogen not detectableTotal Inorganic Carbon 55.9 mg/LTotal Organic Carbon not detectable
Total Carbon 55.9 mg/L
Groundwater Property
Elemental Composition (determined by ICP-AES)
Anionic Species (determined by LC)
Total Nitrogen/ Total Carbon
pH
IS
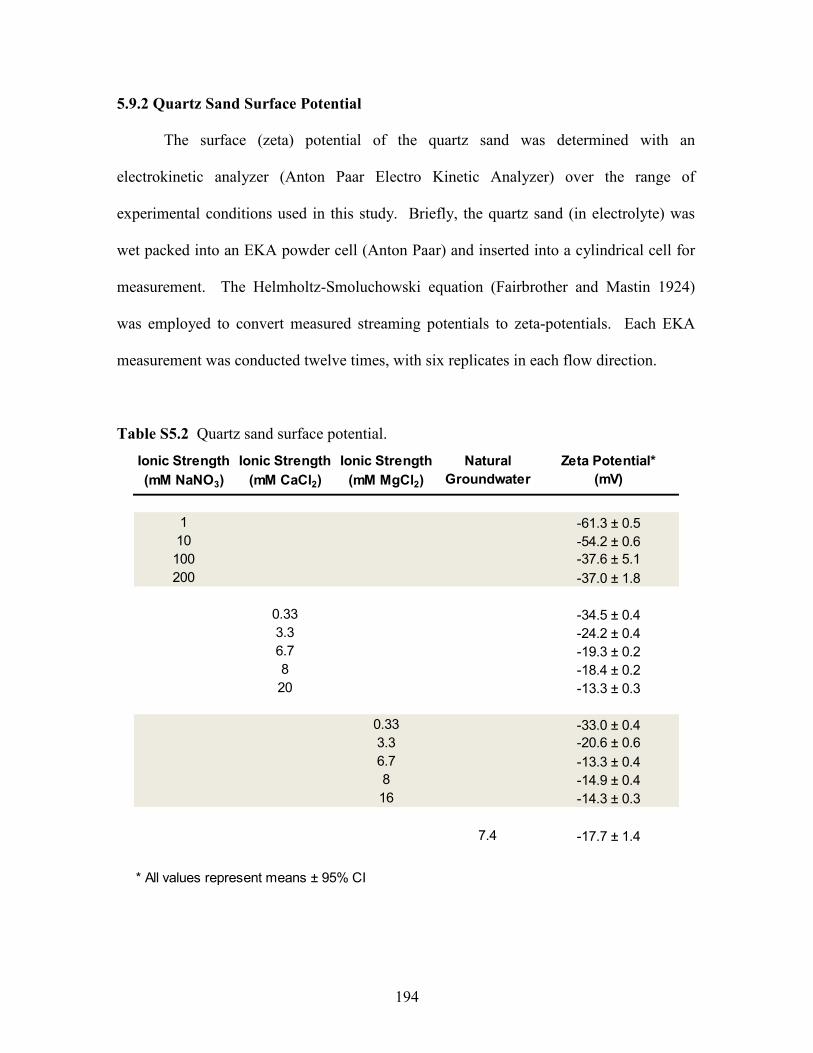
194
5.9.2 Quartz Sand Surface Potential
The surface (zeta) potential of the quartz sand was determined with an
electrokinetic analyzer (Anton Paar Electro Kinetic Analyzer) over the range of
experimental conditions used in this study. Briefly, the quartz sand (in electrolyte) was
wet packed into an EKA powder cell (Anton Paar) and inserted into a cylindrical cell for
measurement. The Helmholtz-Smoluchowski equation (Fairbrother and Mastin 1924)
was employed to convert measured streaming potentials to zeta-potentials. Each EKA
measurement was conducted twelve times, with six replicates in each flow direction.
Table S5.2 Quartz sand surface potential.
Ionic Strength (mM NaNO3)
Ionic Strength (mM CaCl2)
Ionic Strength (mM MgCl2)
Natural Groundwater
Zeta Potential* (mV)
1 -61.3 ± 0.510 -54.2 ± 0.6100 -37.6 ± 5.1200 -37.0 ± 1.8
0.33 -34.5 ± 0.43.3 -24.2 ± 0.46.7 -19.3 ± 0.28 -18.4 ± 0.220 -13.3 ± 0.3
0.33 -33.0 ± 0.43.3 -20.6 ± 0.66.7 -13.3 ± 0.48 -14.9 ± 0.416 -14.3 ± 0.3
7.4 -17.7 ± 1.4
* All values represent means ± 95% CI
195
5.9.3 Porous Media Physicochemical Properties
As previously reported (Quevedo and Tufenkji, 2012), the pure quartz sand
and loamy sand column-packing materials employed in this study were
characterized in our laboratory or at the Materials Characterization Laboratory of
McGill University. While the mean grain size (d50) for the two granular materials
employed is comparable (256 and 225 µm for quartz and loamy sand, respectively),
the grain size distribution in the quartz sand is more uniform (coefficient of
uniformity, d60/d10 = 1.4) than that of the loamy sand (d60/d10 = 2.1). Furthermore,
the loamy sand presents a broader distribution of pore sizes and a smaller average
pore diameter than the pure quartz sand. Aside from quartz, the loamy sand also
contains albite, allophane and orthoclase. Physicochemical properties for both
collector types are provided in Quevedo and Tufenkji, 2012 (Quevedo and Tufenkji,
2012).
5.9.4 Nanoparticle Suspension Preparation
A particle concentration of 100 mg/L was employed in all experiments. For
suspensions prepared in natural groundwater, 20 mg engineering nanoparticle (ENP)
powder was added directly into 20 mL groundwater (pH 8) and mixed with a stainless
steel spatula. Next, an additional 180 mL of groundwater was added, resulting in the
desired [100 mg/L]. The suspension was then ultrasonicated (90% amplitude, 4A, 50/60
Hz, Hielscher UP200S Ultrasonic Processor) for 120 s to ensure good dispersion.
Prior to suspension in artificial water matrices, particle stock suspensions were
prepared by weighing 40 mg of ENP powder into a 250 mL beaker containing 20 mL of
196
filtered deionized water (DIW). ENPs were mixed with a stainless steel spatula and the
beaker filled to 200 mL with DIW. Next, the NPs were ultrasonicated for 120 s, yielding
well-dispersed 0.2 g/L stock suspensions. All stock suspensions were kept in the dark at
room temperature for a maximum of three days prior to use. The stock suspensions were
then diluted in monovalent and divalent electrolytes to obtain the desired [100 mg/L].
Experiments with nCeO2 were conducted in natural groundwater and at IS ranging from
0.1 to 1 M sodium nitrate (NaNO3, Fluka), 0.33 to 10 mM calcium chloride (CaCl2,
Sigma-Aldrich) and 0.33 to 12 mM magnesium chloride (MgCl2, Sigma-Aldrich). The
nCAP suspensions were prepared in CaCl2 (0.33 to 20 mM) and natural groundwater.
Suspension pH was stabilized using 1 mM 3-(N-morpholino) propanesulfonic acid
(MOPS, Sigma-Aldrich) and adjusted (to pH 8) using NaOH.
The relative stability of the ENP suspensions was verified with sedimentation tests
(UV-visible spectrophotometry) and dynamic light scattering (DLS) measurements (data
not shown). In this study, suspensions are referred to as stable when sedimentation tests
and DLS measurements indicated that sample absorbance and aggregate size,
respectively, remained constant over the time course of a column experiment.
The following polymer-coated nCeO2 details were provided by the manufacturer:
The nCeO2 (Vive Crop ProtectionTM) particles have a cubic crystal structure, and are 17%
Ce on a per residue basis and 89% Ce on a metals basis (excluding Na). The reported
impurities are Al, B, Ca, Cr, and Ga.
5.9.5 Point of Zero Charge (in 1 mM NaNO3)

197
The point of zero charge (pHzpc) for the nCeO2 and nCAP particles was determined
by performing EPM measurements at various pH values (Figure S5.2). For both particles,
the pHzpc is below pH 2.
Figure S5.2 Particle point of zero charge (pHzpc). Here, nCeO2 and nCAP EPMs are plotted as a function of suspension pH.
5.9.6 Summary of Attachment Efficiencies (α)
In this study, four different attachment efficiencies (α) were obtained for each
experimental condition. Aggregate sizes acquired using two complementary particle
sizing techniques, dynamic light scattering (DLS) and nanoparticle tracking analysis
(NTA), were considered in calculating the single-collector contact efficiency (η0),
resulting in two estimates for the ENP attachment efficiency. Likewise, the normalized
particle concentration at the column effluent (C/C0) was evaluated at 1.8-2 PVs and by
numerical integration of the area under each breakthrough curve, again resulting in two
2 4 6 8 10-3.0-2.5-2.0-1.5-1.0-0.50.0
EP
M (µ
mcm
V-1 s
-1)
pH
nCeO2
nCAPs

198
estimates for α. Generally, all four α values obtained for a given experimental condition
are comparable, regardless of the sizing technique and manner in which C/C0 was
obtained (Tables S5.3 and S5.4).
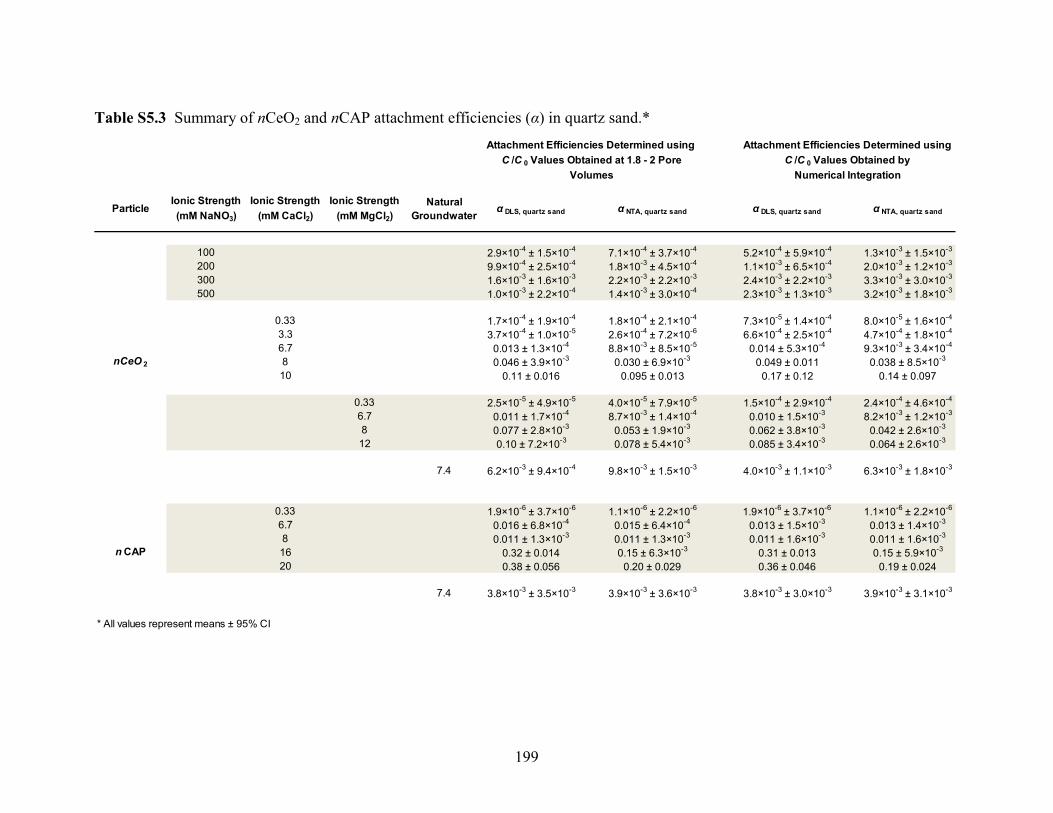
199
Table S5.3 Summary of nCeO2 and nCAP attachment efficiencies (α) in quartz sand.*
ParticleIonic Strength (mM NaNO3)
Ionic Strength (mM CaCl2)
Ionic Strength (mM MgCl2)
Natural Groundwater α DLS, quartz sand α NTA, quartz sand α DLS, quartz sand α NTA, quartz sand
100 2.9×10⁻⁴ ± 1.5×10⁻⁴ 7.1×10⁻⁴ ± 3.7×10⁻⁴ 5.2×10⁻⁴ ± 5.9×10⁻⁴ 1.3×10⁻³ ± 1.5×10⁻³
200 9.9×10⁻⁴ ± 2.5×10⁻⁴ 1.8×10⁻³ ± 4.5×10⁻⁴ 1.1×10⁻³ ± 6.5×10⁻⁴ 2.0×10⁻³ ± 1.2×10⁻³
300 1.6×10⁻³ ± 1.6×10⁻³ 2.2×10⁻³ ± 2.2×10⁻³ 2.4×10⁻³ ± 2.2×10⁻³ 3.3×10⁻³ ± 3.0×10⁻³
500 1.0×10⁻³ ± 2.2×10⁻⁴ 1.4×10⁻³ ± 3.0×10⁻⁴ 2.3×10⁻³ ± 1.3×10⁻³ 3.2×10⁻³ ± 1.8×10⁻³
0.33 1.7×10⁻⁴ ± 1.9×10⁻⁴ 1.8×10⁻⁴ ± 2.1×10⁻⁴ 7.3×10⁻⁵ ± 1.4×10⁻⁴ 8.0×10⁻⁵ ± 1.6×10⁻⁴
3.3 3.7×10⁻⁴ ± 1.0×10⁻⁵ 2.6×10⁻⁴ ± 7.2×10⁻⁶ 6.6×10⁻⁴ ± 2.5×10⁻⁴ 4.7×10⁻⁴ ± 1.8×10⁻⁴
6.7 0.013 ± 1.3×10⁻⁴ 8.8×10⁻³ ± 8.5×10⁻⁵ 0.014 ± 5.3×10⁻⁴ 9.3×10⁻³ ± 3.4×10⁻⁴
8 0.046 ± 3.9×10⁻³ 0.030 ± 6.9×10⁻³ 0.049 ± 0.011 0.038 ± 8.5×10⁻³
10 0.11 ± 0.016 0.095 ± 0.013 0.17 ± 0.12 0.14 ± 0.097
0.33 2.5×10⁻⁵ ± 4.9×10⁻⁵ 4.0×10⁻⁵ ± 7.9×10⁻⁵ 1.5×10⁻⁴ ± 2.9×10⁻⁴ 2.4×10⁻⁴ ± 4.6×10⁻⁴
6.7 0.011 ± 1.7×10⁻⁴ 8.7×10⁻³ ± 1.4×10⁻⁴ 0.010 ± 1.5×10⁻³ 8.2×10⁻³ ± 1.2×10⁻³
8 0.077 ± 2.8×10⁻³ 0.053 ± 1.9×10⁻³ 0.062 ± 3.8×10⁻³ 0.042 ± 2.6×10⁻³
12 0.10 ± 7.2×10⁻³ 0.078 ± 5.4×10⁻³ 0.085 ± 3.4×10⁻³ 0.064 ± 2.6×10⁻³
7.4 6.2×10⁻³ ± 9.4×10⁻⁴ 9.8×10⁻³ ± 1.5×10⁻³ 4.0×10⁻³ ± 1.1×10⁻³ 6.3×10⁻³ ± 1.8×10⁻³
0.33 1.9×10⁻⁶ ± 3.7×10⁻⁶ 1.1×10⁻⁶ ± 2.2×10⁻⁶ 1.9×10⁻⁶ ± 3.7×10⁻⁶ 1.1×10⁻⁶ ± 2.2×10⁻⁶
6.7 0.016 ± 6.8×10⁻⁴ 0.015 ± 6.4×10⁻⁴ 0.013 ± 1.5×10⁻³ 0.013 ± 1.4×10⁻³
8 0.011 ± 1.3×10⁻³ 0.011 ± 1.3×10⁻³ 0.011 ± 1.6×10⁻³ 0.011 ± 1.6×10⁻³
16 0.32 ± 0.014 0.15 ± 6.3×10⁻³ 0.31 ± 0.013 0.15 ± 5.9×10⁻³
20 0.38 ± 0.056 0.20 ± 0.029 0.36 ± 0.046 0.19 ± 0.024
7.4 3.8×10⁻³ ± 3.5×10⁻³ 3.9×10⁻³ ± 3.6×10⁻³ 3.8×10⁻³ ± 3.0×10⁻³ 3.9×10⁻³ ± 3.1×10⁻³
* All values represent means ± 95% CI
n CAP
Attachment Efficiencies Determined using C /C 0 Values Obtained at 1.8 - 2 Pore
Volumes
Attachment Efficiencies Determined using C /C 0 Values Obtained by
Numerical Integration
nCeO 2
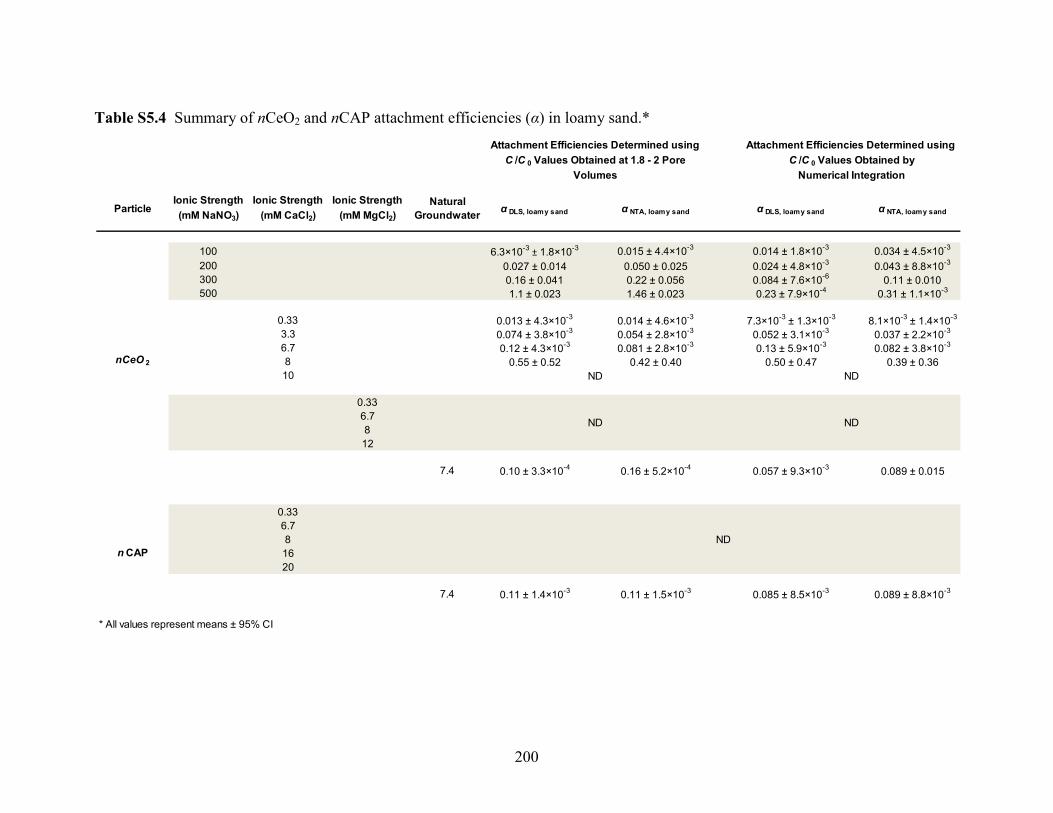
200
Table S5.4 Summary of nCeO2 and nCAP attachment efficiencies (α) in loamy sand.*
ParticleIonic Strength (mM NaNO3)
Ionic Strength (mM CaCl2)
Ionic Strength (mM MgCl2)
Natural Groundwater α DLS, loamy sand α NTA, loamy sand α DLS, loamy sand α NTA, loamy sand
100 6.3×10⁻³ ± 1.8×10⁻³ 0.015 ± 4.4×10⁻³ 0.014 ± 1.8×10⁻³ 0.034 ± 4.5×10⁻³
200 0.027 ± 0.014 0.050 ± 0.025 0.024 ± 4.8×10⁻³ 0.043 ± 8.8×10⁻³
300 0.16 ± 0.041 0.22 ± 0.056 0.084 ± 7.6×10⁻⁶ 0.11 ± 0.010500 1.1 ± 0.023 1.46 ± 0.023 0.23 ± 7.9×10⁻⁴ 0.31 ± 1.1×10⁻³
0.33 0.013 ± 4.3×10⁻³ 0.014 ± 4.6×10⁻³ 7.3×10⁻³ ± 1.3×10⁻³ 8.1×10⁻³ ± 1.4×10⁻³
3.3 0.074 ± 3.8×10⁻³ 0.054 ± 2.8×10⁻³ 0.052 ± 3.1×10⁻³ 0.037 ± 2.2×10⁻³
6.7 0.12 ± 4.3×10⁻³ 0.081 ± 2.8×10⁻³ 0.13 ± 5.9×10⁻³ 0.082 ± 3.8×10⁻³
8 0.55 ± 0.52 0.42 ± 0.40 0.50 ± 0.47 0.39 ± 0.3610
0.336.7812
7.4 0.10 ± 3.3×10⁻⁴ 0.16 ± 5.2×10⁻⁴ 0.057 ± 9.3×10⁻³ 0.089 ± 0.015
0.336.781620
7.4 0.11 ± 1.4×10⁻³ 0.11 ± 1.5×10⁻³ 0.085 ± 8.5×10⁻³ 0.089 ± 8.8×10⁻³
* All values represent means ± 95% CI
n CAPND
Attachment Efficiencies Determined using C /C 0 Values Obtained at 1.8 - 2 Pore
Volumes
Attachment Efficiencies Determined using C /C 0 Values Obtained by
Numerical Integration
nCeO 2
ND ND
ND ND
201
REFERENCES FOR SUPPLEMENTARY MATERIAL SECTION
Fairbrother, F. and Mastin, H. (1924) Studies in electro-endosmosis. Part I. Journal of the Chemical Society, Transactions 125, 2319-2330. Quevedo, I.R. and Tufenkji, N. (2012) Mobility of functionalized quantum dots and a model polystyrene nanoparticle in saturated quartz sand and loamy sand. Environmental Science and Technology 46(8), 4449-4457.

202
CHAPTER 6: SUMMARY AND CONCLUSIONS
203
The transport behavior of nanosized cerium dioxide (nCeO2), titanium dioxide
(nTiO2) and zinc oxide (nZnO) in saturated porous media was extensively examined using
laboratory scale columns packed with quartz sand or loamy sand. Bare and poly(acrylic
acid) (PAA)-coated engineered nanomaterial (ENM) transport was investigated in
artificial and natural groundwater matrices and the influence of water chemistry (namely
pH, ionic strength (IS), cation type and cation valence) on particle deposition was
examined. Furthermore, transport experiments were conducted with a variety of
nanosized polymeric capsules (refer to Appendix 1) and PAA-coated metal oxide transport
was compared to that of an analogous nanosized PAA-based capsule (nCAP). To
facilitate the interpretation of transport study data, dynamic light scattering (DLS) and
nanoparticle tracking analysis (NTA) were used to establish ENM aggregate size in
suspension, while laser Doppler velocimetry was utilized to determine ENM
electrophoretic mobility (EPM). In Chapter 3, bare nTiO2 transport in quartz sand-packed columns saturated with
monovalent NaNO3 electrolytes was investigated and the influence of pH and IS on
particle deposition behavior considered. Regardless of pH and particle EPM, bare nTiO2
aggregated extensively, yielding highly polydisperse suspensions. Overall, bare nTiO2
deposition onto the quartz sand collector was high. Furthermore, extensive particle
aggregation resulted in physical straining within the columns (i.e., decreased particle
elution over time).
The limited particle mobility observed with bare nTiO2 particles led to the
inclusion of polymer-coated metal oxides (nCeO2, nTiO2 and nZnO) in subsequent studies
(presented in Chapters 4 and 5). In Chapter 4, bare and PAA-coated nTiO2 and nZnO
transport was investigated in quartz sand-packed columns. In the absence of a PAA

204
coating, nTiO2 and nZnO particles aggregated considerably when suspended in
monovalent NaNO3. Extensive bare particle deposition was observed in the quartz sand-
packing material, with dynamic (time-dependent) deposition behavior observed for
selected conditions. Compared to the bare particles, PAA-coated nTiO2 and nZnO
demonstrated enhanced stability in monovalent NaNO3 and in the presence of divalent
CaCl2 due to electrosteric stabilization by the polymer chains. Furthermore, nearly all
PAA-coated metal oxides eluted from quartz sand-packed columns at NaNO3 IS < 300
mM. PAA-coated nTiO2 and nZnO were also found to be moderately mobile at low
divalent CaCl2 concentrations.
In Chapter 5, aquatic matrix composition and soil type were varied to examine the
transport behavior of PAA-coated nCeO2 and an analogous nanosized PAA capsule
(nCAP). Transport studies were conducted in artificial (NaNO3, CaCl2 and MgCl2) and
natural groundwater matrices using columns packed with pure quartz sand or agricultural
loamy sand. Heightened nCeO2 retention was encountered at higher divalent salt
concentrations. Enhanced retention was also observed in the heterogeneous loamy sand,
potentially due (in part) to the presence of favorable deposition sites on clays such as
allophane. While virtually all nCeO2 particles suspended in monovalent electrolytes
eluted from the quartz sand-packed columns, heightened particle retention and dynamic
deposition behavior (blocking) was observed in loamy sand saturated with NaNO3. On
the other hand, nCeO2 attachment efficiency (α) in divalent CaCl2 and MgCl2 increased
over several orders of magnitude within a narrow range of IS, with dynamic behavior
(blocking and physical straining) encountered in both granular packing materials. Finally,
nCeO2 and nCAP attachment efficiencies were an order of magnitude higher in loamy

205
sand than in quartz sand when suspended in natural groundwater, with nCAP proving to
be a good surrogate particle for the PAA-coated nCeO2.
The deposition behavior of various nanosized polymeric capsules with distinct
compositions was investigated in Appendix 1. Overall, the aforementioned PAA-based
nCAP and a nanosized polymeric capsule composed of a poly(methacrylic acid)-
poly(ethyl acrylate) copolymer (nCAP2) were found to exhibit the greatest transport
potential in loamy sand-packed columns saturated with synthetic groundwater (containing
2.74 mM CaCl2 and 0.68 mM MgCl2). Both capsules displayed delayed particle
breakthrough from the packed columns, potentially due to a limited number of favorable
deposition sites within the heterogeneous packing material. Furthermore, nCAP2
displayed heightened particle elution at pH 8 when compared to pH 6, likely due to the
presence of clays such as albite in the loamy sand.
Overall, the findings suggest that upon discharge into the aquatic environment,
bare metal oxides may exhibit limited mobility due to extensive particle aggregation.
Consequently, effective removal of the bare particles by water filtration techniques such
as slow sand and riverbank filtration is expected. On the other hand, PAA-coated nCeO2,
nTiO2 and nZnO (along with certain nanosized polymeric capsules) exhibit a far greater
transport potential due to the electrosteric stabilization imparted by the polymer coating.
Given that a majority of commercially employed ENMs will be surface-functionalized,
stabilized, or matrix-embedded, various derivatives of basic metal oxide ENMs (such as
the PAA-coated particles employed herein) may exhibit far greater mobility upon release.
Results from column studies employing a wide range of water chemistries and two
different packing materials suggest that particle mobility would be greatest in
environments with sandy soils and lower salt concentrations. Under such conditions,

206
ENMs are more likely to reach groundwater aquifers, potentially contaminating drinking
water supplies.

207
APPENDIX 1: MOBILITY OF NANOSIZED POLYMERIC CAPSULES IN LOAMY SAND SATURATED WITH MODEL
GROUNDWATERS

208
A1.1 ABSTRACT
Vive Crop ProtectionTM, a Toronto based nanotechnology firm, is currently
engineering nanosized water dispersible polymeric capsules for agricultural applications.
The capsules will ultimately deliver active agents that protect crops and heighten yields,
while decreasing the use of potentially harmful herbicides and pesticides. Before the
capsules can be applied on a large scale, their behavior in model subsurface environments
must be determined. In collaboration with our industrial partner, we are investigating the
transport behavior of these particles in soils.
In this set of experiments, the transport behavior of various polymeric capsule
prototypes in soil-packed columns was investigated. Furthermore, all polymeric capsules
employed were characterized, with the particle size and surface potential in synthetic
groundwater determined. The findings were submitted to Vive Crop ProtectionTM to assist
them in the development of effective capsules for agricultural use.
209
A1.2 INTRODUCTION
In Chapter 5, the mobility of poly(acrylic acid) (PAA)-coated cerium dioxide
nanoparticles (nCeO2) was compared to that of an analogous nanosized PAA polymeric
capsule (nCAP) in water-saturated quartz sand or loamy sand. The nCAPs, designed and
produced by Vive Crop ProtectionTM, are to serve as water dispersible polymeric
nanocapsules in agricultural applications. They are to be loaded with active agents
(pesticides or herbicides) in the aim of improving delivery, thus decreasing the use of
costly and potentially harmful substances. Nonetheless, prior to capsule application in the
field, their behavior in laboratory-scale model subsurface environments is to be
investigated.
The original nCAP developed and tested (again referred to as nCAP herein)
consists of PAA. While highly mobile (see Chapter 5), the large number of carboxyl
functional groups on the capsule surface has been found to interact favorably with clays
present in specific soil types, thus hindering transport. This was also observed in Chapter
5, where heightened PAA-coated nCeO2 and nCAP particle retention was observed in the
presence of clays (i.e., in the loamy sand compared to the pure quartz sand).
Consequently, Vive Crop ProtectionTM has commenced the development of less polar
nCAPs in an attempt to enhance particle transport properties. In this Appendix, the
transport behavior for a variety of emerging polymeric capsules in model subsurface
environments is described.

210
A1.3 MATERIALS AND METHODS
A1.3.1 SYNTHETIC GROUNDWATER PROPERTIES
All experiments were conducted in Collaborative International Pesticides
Analytical Council (CIPAC) standard water D, a synthetic groundwater containing 2.74
mM CaCl2 and 0.68 mM MgCl2 molar concentrations. The pH was adjusted with NaOH
and the final aquatic matrix ionic strength (IS) was 10 mM.
A1.3.2 GRANULAR COLLECTOR CHARACTERIZATION
All columns were packed with loamy sand (d50=225 µm) obtained at a 35 cm
depth from an Agriculture and Agri-Food Canada (AAFC) farm plot located in St-
Augustin-de-Desmaures, QC. Granular material characterization details are provided in
Chapter 5.
A1.3.3 NANOPARTICLE SUSPENSION PREPARATION
Particle suspensions were prepared with a variety of hollow nanosized polymeric
capsules. These include nCAP, the empty capsules described in Chapter 5 consisting of
partially crosslinked PAA. The composition of the empty nCAPs is analogous to that of
the PAA-coating on the polymer-coated metal oxide particles discussed in Chapters 4 and
5 (without the metal oxide core). Studies were also carried out with nCAP2. The nCAP2
particles consist of a copolymer, with a hydrophilic poly(methacrylic acid) exterior and a
relatively hydrophobic poly(ethyl acrylate) interior. Suspensions containing nCAP3 and
nCAP4 particles, 75:25 copolymers consisting of poly(methacrylic acid-ran-styrene) and
poly(methacrylic acid-ran-butylmethacrylate), respectively, were also prepared (here
211
“ran” indicates the capsules consist of random copolymers). Finally, nCAP5 particles,
made up of a carboxymethyl cellulose (CMC)-based biopolymer, were also suspended in
synthetic groundwater.
Vive Crop ProtectionTM also provided dye-loaded nCAP particles containing the
lipophilic stain 9-diethylamino-5-benzo[α]phenoxazinone (i.e., Nile Red). The dye was
included to enable particle detection using a fluorescence spectrophotometer, as UV-
Visible spectrophotometer detection issues had been encountered with other capsule types.
Given that empty and dye-loaded nCAPs are both detectable with the UV-Visible
spectrophotometer, the impact of the dye on particle transport was determined in this
study.
Particle suspensions were prepared as previously described (Chapter 5,
Supplementary Material) in CIPAC standard water D at various pHs (unadjusted, pH 6
and pH 8). Once more, a particle concentration of 100 mg/L was employed in all
experiments. When required, suspension pH was stabilized using 1 mM MOPS and
adjusted to pH 6 or 8 using NaOH.
A1.3.4 NANOPARTICLE CHARACTERIZATION
Particle electrophoretic mobilities (EPMs) were determined by laser Doppler
velocimetry (ZetaSizer Nano ZS, Malvern). All EPM measurements (n=6 for all
suspensions) were performed at 25oC, with an applied electrical field of 4.9±0.1 V/m.
Along with determining particle EPM under all experimental conditions (i.e., column
conditions), EPM was also determined as a function of pH in an attempt to establish the
pH of zero charge (pHzpc) for all particles. Particle hydrodynamic diameters were

212
determined by dynamic light scattering (DLS) using a Zetasizer Nano ZS (Malvern). At
least six independent replicate samples were analyzed using DLS.
A1.3.5 NANOPARTICLE TRANSPORT AND DEPOSITION STUDIES
Polymeric capsule transport studies in loamy sand were performed as described in
Chapter 5. Once more, the packed-bed porosity was 0.44 (Table S5.3). The column
packing and equilibration procedures described in Chapter 5 were again employed,
resulting in 7 cm packed column heights. A flow rate of 0.4 mL/min (equivalent to a
Darcy velocity of 2.86 m/day) was employed and either 4 or ≥6.5 pore volumes (PVs) of
particles was applied to the columns. Influent (C0) and effluent (C) particle
concentrations were tracked online using a UV-visible spectrophotometer (Agilent 8453)
equipped with a 1 cm flow-through cell. All nCAP particle types were monitored at 210
nm.
A1.4 RESULTS AND DISCUSSION
A1.4.1 PARTICLE SURFACE POTENTIAL
Decreased nCAP2, nCAP3 and nCAP4 EPM is observed at lower and higher pH
values (Figure A1.1), with the largest absolute EPMs appearing between pH 4 and 6.
Furthermore, nCAP3, nCAP4 and nCAP5 EPM is very comparable at pH 8 (Figure
A1.1b). As previously reported (Chapter 5), the PAA-based nCAP absolute EPM
consistently increases with increasing pH, with a pHzpc found to be below pH 2. Of all the
capsules tested, nCAP also presents the highest absolute EPM values, while nCAP2
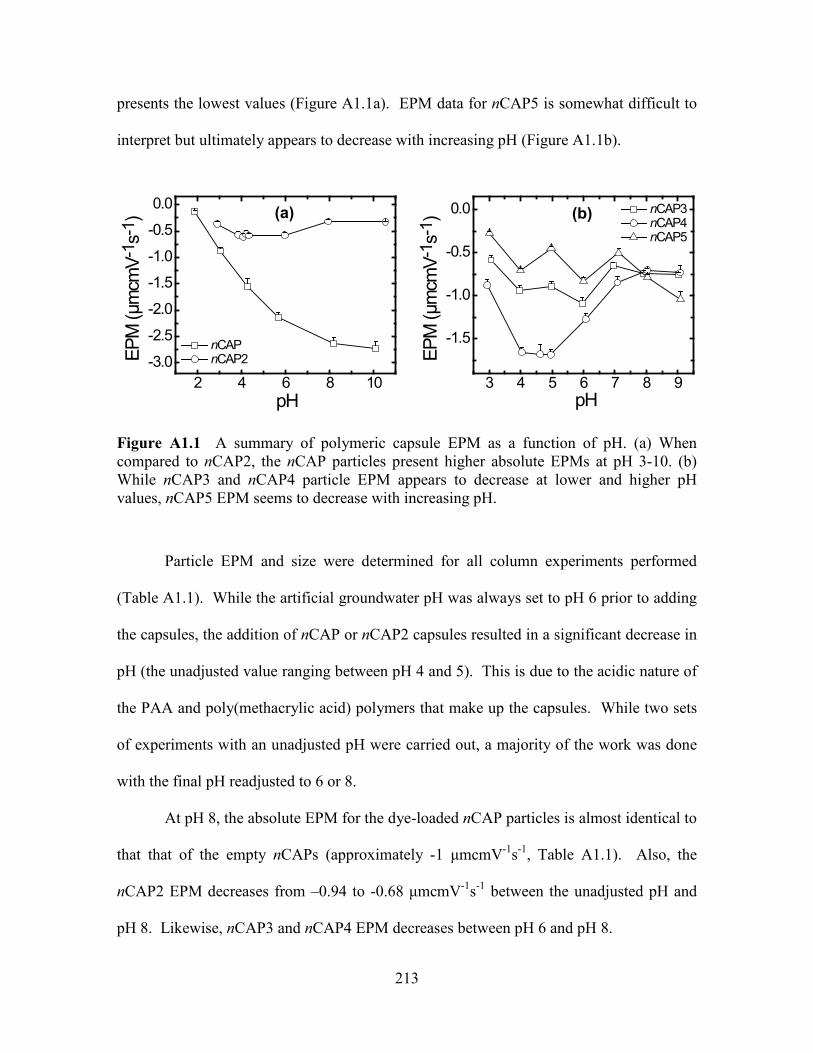
213
presents the lowest values (Figure A1.1a). EPM data for nCAP5 is somewhat difficult to
interpret but ultimately appears to decrease with increasing pH (Figure A1.1b).
Figure A1.1 A summary of polymeric capsule EPM as a function of pH. (a) When compared to nCAP2, the nCAP particles present higher absolute EPMs at pH 3-10. (b) While nCAP3 and nCAP4 particle EPM appears to decrease at lower and higher pH values, nCAP5 EPM seems to decrease with increasing pH.
Particle EPM and size were determined for all column experiments performed
(Table A1.1). While the artificial groundwater pH was always set to pH 6 prior to adding
the capsules, the addition of nCAP or nCAP2 capsules resulted in a significant decrease in
pH (the unadjusted value ranging between pH 4 and 5). This is due to the acidic nature of
the PAA and poly(methacrylic acid) polymers that make up the capsules. While two sets
of experiments with an unadjusted pH were carried out, a majority of the work was done
with the final pH readjusted to 6 or 8.
At pH 8, the absolute EPM for the dye-loaded nCAP particles is almost identical to
that that of the empty nCAPs (approximately -1 μmcmV-1s-1, Table A1.1). Also, the
nCAP2 EPM decreases from –0.94 to -0.68 μmcmV-1s-1 between the unadjusted pH and
pH 8. Likewise, nCAP3 and nCAP4 EPM decreases between pH 6 and pH 8.
2 4 6 8 10-3.0
-2.5
-2.0
-1.5
-1.0
-0.5
0.0
EPM
(µm
cmV-
1 s-1
)
pH
nCAP nCAP2
3 4 5 6 7 8 9
-1.5
-1.0
-0.5
0.0
EPM
(µm
cmV-
1 s-1
)pH
nCAP3 nCAP4 nCAP5
(a) (b)

214
Table A1.1 A summary of polymeric capsule size and EPM under all experimental conditions.
A1.4.2 PARTICLE SIZE
In synthetic groundwater, the EPM for dye-loaded nCAPs increases between the
unadjusted pH (pH 4-5) and pH 8. Over this range of pH, particle size decreases from
474 to 211 nm. This observation is in accordance with the DLVO theory of colloid
stability (Derjaguin and Landau 1941, Verwey and Overbeek 1948), as increased absolute
EPM (as observed at pH 8) should result in decreased particle aggregation due to
heightened repulsive interaction energies between two approaching nanocapsules. On the
other hand, nCAP2 particle size in synthetic groundwater at pH 4-5 is 222 nm, versus 298
nm at pH 6 and 364 nm at pH 8 (Table A1.1). Here, the increase in aggregate size with
decreased surface potential is again in agreement with DLVO theory. While reproducible
nCAP3 sizes could not be obtained at pH 6, nCAP4 size remained virtually unchanged
between pH 6 and 8 (Table A1.1).

215
A1.4.3 POLYMERIC CAPSULE TRANSPORT AND DEPOSITION
A1.4.3.1 Summary of nCAP transport behavior
Vive Crop ProtectionTM provided nCAP particles containing the lipophilic stain
Nile Red. Column experiments with the dye-loaded particles at pH 4-5 and at pH 8
exhibit very comparable findings, with virtually all particles retained in the 7 cm loamy
sand-packed columns (Figure A1.2a). When compared to their empty counterparts, the
dye-loaded nCAPs exhibit greatly reduced transport potential (Figure A1.2b). While less
than 5% of the dye-loaded particles elute at 3.5 PVs, approximately 25% of the empty
nCAPs exit the column. This is even more evident when particle injection times are
increased. While approximately 50% particle elution is observed with the empty nCAPs
at 6 PVs, less than 10% of the dye-loaded particles elute (Figure A1.2c). Given that dye-
loaded and empty nCAP particles exhibit very comparable EPM and size, it is unclear
why such heightened particle retention is observed with the dye-loaded capsules. An
investigation into potential dye-collector surface interactions may help to explain the
observed behavior. However, this is beyond the scope of the current work. Overall, it
appears an alternative dye with less of an impact on particle transport and surface
properties should be utilized to aid in tracking the capsules.
As discussed in previous chapters, the dynamic elution behavior observed
(increasing particle elution with time) at pH 8 (Figure A1.2b and c) is suggestive of a
blocking effect within the column (Liu et al. 1995, Ryan and Elimelech 1996). The
complex loamy sand packing may present a limited number of favorable deposition sites
due to collector surface roughness, surface charge heterogeneities and the presence of
clays such as allophane whose pHzpc≈7.8 (Chen et al. 2002, Petosa et al. 2010, Quevedo
216
and Tufenkji 2012, Sposito 1989). Once occupied, fewer favorable sites remain for
incoming particles, resulting in heightened particle elution. Given the polymeric
composition of the nCAPs, electrosteric repulsion may also prevent deposition onto sites
adjacent to previously deposited particles (Ko and Elimelech 2000), further increasing
particle elution.
To ensure that the increase in absorbance with time observed is not due to the
release of colloids from the loamy sand packing material, capsule-free synthetic
groundwater was introduced to fresh columns for several PVs and the absorbance
recorded. It was found that absorbance did slightly increase over time in the absence of
particles. While minimal, the observed increase was subtracted from the effluent
absorbance values obtained with capsule suspensions to avoid any experimental artifacts.
Note that all packed columns were only used once.

217
Figure A1.2 nCAP deposition behavior in loamy sand-packed columns. (a) Nile Red loaded nCAP deposition at pH 4-5 and pH 8. (b) A comparison of empty and dye-loaded nCAP deposition behavior (4 PV injection time). (c) A comparison of empty and dye-loaded nCAP deposition behavior (6.5 PV injection time).
1.0 1.5 2.0 2.5 3.0 3.5
0.0
0.1
0.2
0.3
nCAP + Nile Red (pH 8) nCAP + Nile Red (pH unadjusted)
C/C 0
Pore Volumes
1.0 1.5 2.0 2.5 3.0 3.50.0
0.1
0.2
0.3
0.4
0.5
nCAP (pH 8) nCAP + Nile Red (pH 8)
C/C 0
Pore Volumes
1 2 3 4 5 60.00.10.20.30.40.50.60.7
nCAP + Nile Red (pH 8) nCAP (pH 8)
C/C 0
Pore Volumes
(a)
(b)
(c)
218
A1.4.3.2 Summary of nCAP2 transport behavior
When 4 PV of nCAP2 particles are injected into the loamy sand-packed columns,
only limited transport is observed at pH 8, while virtually all particles are retained at pH
4-5 and pH 6 (Figure A1.3a). Nonetheless, once injection time is increased, it becomes
apparent that elution is very delayed, with significant particle breakthrough occurring
beyond 4 PVs (Figure A1.3b). Once more, a dynamic “blocking effect” is apparent, with
C/C0 found to increase with time. Furthermore, the heightened particle elution observed
at pH 8 suggests that fewer favorable deposition sites are present at the higher pH. This
may be due to the presence of albite (pHzpc≈5.9) in the loamy sand (Quevedo and Tufenkji
2012, Sposito 1989). At pH 4-5 (i.e., the unadjusted pH) and pH 6, albite may provide
additional favorable deposition sites that are unavailable at pH 8.
Furthermore, while particle elution increases between pH 4-5 and pH 8 (Figure
A1.3), particle EPM decreases (Table A1.1). This is contrary to DLVO theory, as
decreased EPM should theoretically render deposition onto the negatively charged silica
sand grains in the loamy sand-packed columns more favorable. The fact that decreased
EPM does not appear to affect particle elution suggests that particle deposition is
occurring primarily onto favorable sites such as clays and surface charge heterogeneities.
Consequently, the number of favorable sites appears to dictate the extent of particle
retention.
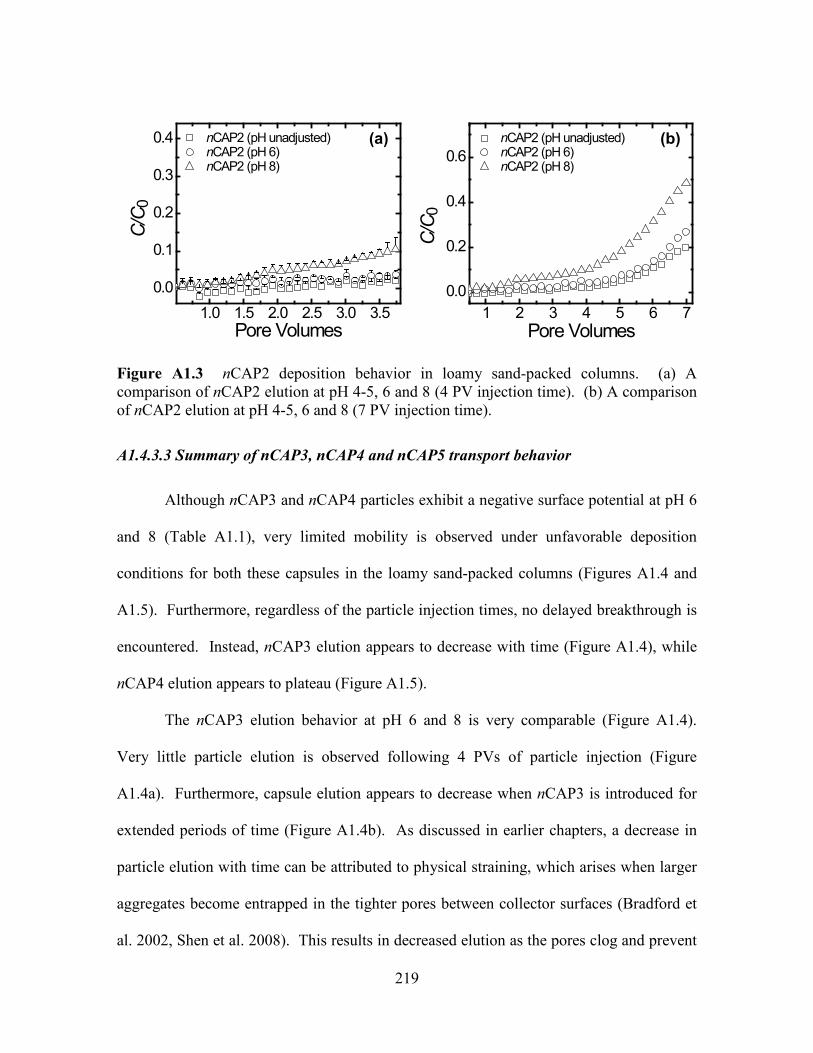
219
Figure A1.3 nCAP2 deposition behavior in loamy sand-packed columns. (a) A comparison of nCAP2 elution at pH 4-5, 6 and 8 (4 PV injection time). (b) A comparison of nCAP2 elution at pH 4-5, 6 and 8 (7 PV injection time).
A1.4.3.3 Summary of nCAP3, nCAP4 and nCAP5 transport behavior
Although nCAP3 and nCAP4 particles exhibit a negative surface potential at pH 6
and 8 (Table A1.1), very limited mobility is observed under unfavorable deposition
conditions for both these capsules in the loamy sand-packed columns (Figures A1.4 and
A1.5). Furthermore, regardless of the particle injection times, no delayed breakthrough is
encountered. Instead, nCAP3 elution appears to decrease with time (Figure A1.4), while
nCAP4 elution appears to plateau (Figure A1.5).
The nCAP3 elution behavior at pH 6 and 8 is very comparable (Figure A1.4).
Very little particle elution is observed following 4 PVs of particle injection (Figure
A1.4a). Furthermore, capsule elution appears to decrease when nCAP3 is introduced for
extended periods of time (Figure A1.4b). As discussed in earlier chapters, a decrease in
particle elution with time can be attributed to physical straining, which arises when larger
aggregates become entrapped in the tighter pores between collector surfaces (Bradford et
al. 2002, Shen et al. 2008). This results in decreased elution as the pores clog and prevent
1.0 1.5 2.0 2.5 3.0 3.50.0
0.1
0.2
0.3
0.4
nCAP2 (pH unadjusted) nCAP2 (pH 6) nCAP2 (pH 8)
C/C 0
Pore Volumes1 2 3 4 5 6 7
0.0
0.2
0.4
0.6
nCAP2 (pH unadjusted) nCAP2 (pH 6) nCAP2 (pH 8)
C/C 0
Pore Volumes
(a) (b)

220
the passage of incoming particles. Nonetheless, given that measured nCAP3 aggregate
sizes are not larger than those observed for the other capsules (Table A1.1), additional
factors may also be involved.
Figure A1.4 nCAP3 deposition behavior in loamy sand-packed columns. (a) A comparison of nCAP3 elution at pH 6 and 8 (4 PV injection time). (b) A comparison of nCAP3 elution at pH 6 and 8 (7 PV injection time).
The nCAP4 elution data collected at pH 6 is somewhat noisy due to low sample
absorbance in the UV-visible range (Figure A1.5). Consequently, it is difficult to
determine whether particle elution really does diminish at pH 8 when compared to pH 6.
Nonetheless, retention is generally high and particle elution appears to plateau at
approximately 2 PVs (Figure A1.5a). This remains unchanged when nCAP4 is introduced
for a protracted amount of time (Figure A1.5b).
1 2 3 4 5 6 70.0
0.1
0.2
0.3
nCAP3 (pH 6) nCAP3 (pH 8)
C/C 0
Pore Volumes1.0 1.5 2.0 2.5 3.0 3.5
0.0
0.1
0.2
0.3
nCAP3 (pH 6) nCAP3 (pH 8)
C/C 0
Pore Volumes
(a) (b)

221
Figure A1.5 nCAP4 deposition behavior in loamy sand-packed columns. (a) A comparison of nCAP4 elution at pH 6 and 8 (4 PV injection time). (b) A comparison of nCAP4 elution at pH 6 and 8 (7 PV injection time).
Column transport experiments were not conducted with nCAP5 as a suitable
detection technique was not available. Unlike the other capsules, nCAP5 absorption in the
UV-visible spectrum is too low to allow for reliable particle detection. Increasing the
capsule suspension pH to 8 results in heightened nCAP2, nCAP3 and nCAP4 absorbance
at lower wavelengths (the nCAP2 absorbance spectra in artificial groundwater is presented
in Figure A1.6a). This facilitates the detection of particles eluting from the packed
columns and is responsible for the decreased noise when tracking nCAP3 and nCAP4
elution at pH 8 (Figures A1.4 and A1.5). However, this phenomenon is not observed with
nCAP5 (Figure A1.6b). Any further work with this capsule will require particle labeling
or an alternate detection method.
1 2 3 4 5 6 7
0.0
0.1
0.2
0.3
0.4
nCAP4 (pH 6) nCAP4 (pH 8)
C/C 0
Pore Volumes1 2 3
0.0
0.1
0.2
0.3
0.4
nCAP4 (pH 6) nCAP4 (pH 8)
C/C 0
Pore Volumes
(a) (b)

222
Figure A1.6 Absorbance spectra for (a) nCAP2 and (b) nCAP5.
A1.5 CONCLUSIONS
The aforementioned findings have been submitted to Vive Crop ProtectionTM. The
empty nCAP and nCAP2 prototypes appear to be the most promising capsules tested thus
far, as they exhibit the greatest transport potential in agricultural soil. Both capsule types
display delayed particle breakthrough from the loamy sand-packed columns, likely due to
the presence of a limited number of favorable deposition sites. Furthermore, nCAP2
exhibits heightened elution at pH 8, likely due to the presence of clays such as albite in
the loamy sand. While limited nCAP4 elution is observed, it is difficult to detect at pH 6
due to the low sample absorbance encountered in the UV-visible range. The least mobile
capsule tested is nCAP3. Also, labeling or an alternative detection technique is required if
transport studies are to be conducted with nCAP5, as it cannot be detected by UV-Visible
spectrophotometry. It should be noted that the Nile Red dye appears to be a poor labeling
option as it greatly hinders capsule transport.
200 400 600 8000.00.20.40.60.81.01.21.4
Abso
rban
ce
Wavelength
pH unadjusted pH 8
200 400 600 8000.000.050.100.150.200.250.30
Abso
rban
ce
Wavelength (nm)
pH unadjusted pH 8
(a) (b)

223
A1.6 ACKNOWLEDGEMENTS
This research was supported by NSERC, the Ministère du développement
économique, innovation et exportation du Québec, the CRC Program, Environment
Canada, Vive Crop ProtectionTM, and the CFI. ARP was funded by NSERC (PGS) and a
MEDA. FR was partially supported by a McGill SURE award. The authors also thank
Darren Anderson, Matthew Coulter and Jordan Dinglasan (Vive Crop ProtectionTM) for
helpful discussions.
224
A1.7 REFERENCES
Bradford, S.A., Yates, S.R., Bettahar, M. and Simunek, J. (2002) Physical factors affecting the transport and fate of colloids in saturated porous media. Water Resources Research 38(12), 631-6312. Chen, J.Y., Klemic, J.F. and Elimelech, M. (2002) Micropatterning microscopic charge heterogeneity on flat surfaces for studying the interaction between colloidal particles and heterogeneously charged surfaces. Nano Letters 2(4), 393-396. Derjaguin, B.V. and Landau, L.D. (1941) Theory of stability of strongly charged lyophobic sols and the adhesion of strongly charged particles in solutions of electrolytes. Acta Physicochimica URSS 14, 633-662. Ko, C.H. and Elimelech, M. (2000) The 'shadow effect' in colloid transport and deposition dynamics in granular porous media: Measurements and mechanisms. Environmental Science and Technology 34(17), 3681-3689. Liu, D., Johnson, P.R. and Elimelech, M. (1995) Colloid deposition dynamics in flow through porous media: Role of electrolyte concentration. Environmental Science and Technology 29(12), 2963-2973. Petosa, A.R., Jaisi, D.P., Quevedo, I.R., Elimelech, M. and Tufenkji, N. (2010) Aggregation and deposition of engineered nanomaterials in aquatic environments: Role of physicochemical interactions. Environmental Science and Technology 44(17), 6532-6549. Quevedo, I.R. and Tufenkji, N. (2012) Mobility of functionalized quantum dots and a model polystyrene nanoparticle in saturated quartz sand and loamy sand. Environmental Science and Technology 46(8), 4449-4457. Ryan, J.N. and Elimelech, M. (1996) Colloid mobilization and transport in groundwater. Colloids and Surfaces A: Physicochemical and Engineering Aspects 107, 1-56. Shen, C., Huang, Y., Li, B. and Jin, Y. (2008) Effects of solution chemistry on straining of colloids in porous media under unfavorable conditions. Water Resources Research 44(W05419), 1-12. Sposito, G. (1989) The Chemistry of Soils, Oxford University Press, Inc., New York. Verwey, E.J.W. and Overbeek, J.T.G. (1948) Theory of the Stability of Lyophobic Colloids, Elsevier, Amsterdam.

225
PERMISSION DOCUMENTS FOR ARTICLES INCLUDED HEREIN WERE PROVIDED WITH INITIAL SUBMISSION
(i.e., PAPER COPIES)


![[cover] AWFUL DISCLOSURES MARIA MONK, AS EXHIBITED …](https://static.fdocuments.us/doc/165x107/61973d4076e9a6227e218209/cover-awful-disclosures-maria-monk-as-exhibited-.jpg)