Transport Committee Inquiry - cost of motor insurance ... · The motor insurance industry lost...
98
Consultation response Transport Committee Inquiry - Cost of motor insurance November 2010
Transcript of Transport Committee Inquiry - cost of motor insurance ... · The motor insurance industry lost...

Consultation response Transport Committee Inquiry - Cost of motor insurance
November 2010

About the Actuarial Profession
The Institute and Faculty of Actuaries is the chartered professional body for actuaries in the United Kingdom. A rigorous examination system is supported by a programme of continuous professional development and a professional code of conduct supports high standards, reflecting the significant role of the Profession in society.
Actuaries’ training is founded on mathematical and statistical techniques used in insurance, pension fund management and investment and then builds the management skills associated with the application of these techniques. The training includes the derivation and application of ‘mortality tables’ used to assess probabilities of death or survival. It also includes the financial mathematics of interest and risk associated with different investment vehicles – from simple deposits through to complex stock market derivatives.
Actuaries provide commercial, financial and prudential advice on the management of a business’ assets and liabilities, especially where long term management and planning are critical to the success of any business venture. A majority of actuaries work for insurance companies or pension funds – either as their direct employees or in firms which undertake work on a consultancy basis – but they also advise individuals and offer comment on social and public interest issues. Members of the Profession have a statutory role in the supervision of pension funds and life insurance companies as well as a statutory role to provide actuarial opinions for managing agents at Lloyd’s.

The Institute and Faculty of Actuaries
Submission to the Commons Select Committee on Transport
David Brown MA PhD FIA
Chair of the Actuarial Profession’s Third Party (Motor) Working Party
1. Background
Motor insurance offers cover to both personal and commercial customers in the UK and is compulsory in respect of third party property damage and third party bodily injury. Insurers collect of the order of £10bn in premiums each year. The Actuarial Profession commissioned a working party to investigate third party motor insurance based on some worrying inflationary trends being reported by individual insurers. The working party reported its findings at the UK Actuarial Profession’s annual General Insurance conference (GIRO) in October 2010. These findings were based on data it collected from 89% of the UK regulated motor market. In addition the working party also carried out research on international trends and the link between the legal framework and claim inflation.
2. A loss-making business
The motor insurance industry lost money in 2009 (as per the FSA returns based on combined operating ratios) - a loss of 21p for every £1 of premium for personal policies and an equivalent loss of 8p for commercial policies. The indications from the working party data are that the cost of bodily injury claims (which comprise around 50% of the cost of claims) are increasing at around 30% per annum. Insurance premiums are already rising significantly as a consequence. All this increase in claims cost is occurring, despite the number of accidents having decreased over recent years. The Confused.Com/EMB press release on 12 October cited market increases of 37.5% for comprehensive policies over the last year (more for non comprehensive policies). Customers shopping around will however pay increases substantially less than this. It is highly likely that material further increases will be required before the UK insurance market moves from a position of running heavy sustained losses to one where it can be placed on a sound and sustainable economic footing.
3. Drivers of rising claims costs
There are three elements in the inflating cost of the motor insurance to which we would like to draw the Committee's attention:
An ABI survey reports annual increases in the cost of insurance fraud of 14%, with a cost specifically to motor insurers of £410m

The increase in claims management companies and their activity in generating additional bodily injury claims and claimants in motor accidents
Linked to the above, the increasing proportion of claims which come with legal costs attached to them (where legal costs are incurred they typically make up about 40% of the total bodily injury claims cost).
At least the last two of these elements of cost are containable by appropriate legislation.
4. Other UK and international regimes
Scotland does not allow referral fees for lawyers. Scotland also does not show the high levels of bodily injury inflation seen in England. Other countries, depending on their legislation either have or do not have a problem. For example in addition to Scotland, France, Germany, Spain, China and Switzerland do not appear to currently have a problem. Ireland has largely contained the legal cost element. But on the other hand Hong Kong and Poland very much have a growing problem, and countries such as the USA have (depending on the state) a severe problem. Legislative approach underpins many of these differences.
5. Impact of new and potential measures
New measures were introduced in the UK on 30 April 2010 (the Ministry of Justice Reforms) whereby claims can enter a prescribed, time and cost limited process under certain conditions. It is possible that these may contain some legal cost elements. The current expectation of the working party however is that any cost containment may be very partial. Currently consultation is underway on the recommendation by Lord Justice Jackson (January 2010):
Banning referral fees Abolishing the recoverability of success fees and ATE premiums Increasing general damages awards by 10% Introducing “qualified one way costs shifting” Introducing fixed legal costs for fast track cases worth up to £25,000 Promoting Before the Event legal expense insurance
We believe that the findings of the working party provide important input to this consultation. In particular they identify the scale of the financial problems that the Lord Justice Jackson recommendations seek to address.
6. Further information
A summary report is attached in the form of a PowerPoint presentation. In addition, members of the working party would be happy to meet with the Transport Select Committee to discuss their findings in more depth.

If you have any questions or would like to discuss any of these matters further, please contact: Peter Stirling, Secretary to the General Insurance practice executive committee, The Institute and Faculty of Actuaries, Staple Inn Hall, High Holborn, London WC1V 7QJ 020 7632 2177

© 2010 The Actuarial Profession www.actuaries.org.uk
Third Party Working party
Appendix to Submission to
Commons Transport Select Committee
November 2010

1
Context
Why did we look in to this?• Poor financial results despite fewer accidents• Concern over the impact of increasing claim farming activity• Is this impact limited to North West or widespread?• Is it company specific or industry wide?• Is it limited to personal lines or commercial lines?• When did it start?• How do/can we solve it?
1© 2010 The Actuarial Profession www.actuaries.org.uk

2
Motor Market Size and Results
• 2009 NEP for FSA regulated entities > £8 billion– £6.3 billion personal motor– £1.8 billion commercial motor
• Other notables include Admiral (£900+ million), Zurich (c. £800 million), IAG (£364 million)
• 2009 claims ratio 89.7%– 92.6% excluding prior year releases
• Motor COR 118.2%– 121.1% for personal and 107.7% for commercial
(Source: FSA Returns)
2© 2010 The Actuarial Profession www.actuaries.org.uk

3
Preliminary ResultsReported Numbers of Claims (TPD and TPI)
3© 2010 The Actuarial Profession www.actuaries.org.uk
From the working party data the number of accidents reported to insurers has been decreasing in recent years, but the number of bodily injury claims has been increasing. This has at least partially been recognised in insurers’ results – see Appendix A
Third Party Property DamageThird Party Bodily Injury

4
Acknowledgements
Working partyDavid BrownKarl MurphySimon BlackGrant MitchellRichard VarleyJacques DuPreezAnita MortonJonathan Edwards
Special thanks• EMB -Oscar Huerta, Robin
Harbage, Alex Craig• Direct Line - Axel Wolfstein,
Leonardo Martinelli• Aviva - Brian Huston, James
Russell, Dave Bennett, James Ashdown, Steve Cant
• AXA - Fabrice Brossart, Nathan Lam, Nick Porter, John Jones, Tom Ellis, Kurt Van Der Walt, Phil Rawlings
• RSA - Agnieszka Wronska, Alice To, John Lewis
• Russell Jones & Walker - Adam Tulk
DataRBSAvivaRSAZurichAXACFSEsureLV/HighwayAllianzNFU MutualFortis

5
The ways in which claims get notified to insurers are increasingly complex with more mouths to feed ..
5© 2010 The Actuarial Profession www.actuaries.org.uk

6
But the two main parties are the Accident Management Companies and the Claims Management Companies
• Specialist repair/hire services - “bent metal”• Adverse Impact on Third Party Damage costs
during past decade largely driven by Credit Hire• Mutually beneficial relationship with
brokers/insurers• Dominated by Helphire (PLC) and Drive Assist
(private)• The ABI GTA and market saturation may mean that
the model is mature and that costs are not escalating at more than normal inflationary rates
• There is however a risk that the Regulation of CMCs may lead to sharp practice being lead from AMCs in the future.
• Receive referral fees for TPI cases - Not solicitors– CFAs (“No Win, No Fee”) allowed since 1995– Legal Aid removed in personal injury cases
from April 2000– Predictable costs for low value claims since
October 2003• Claims Management Regulator established 23 April
2007 – 60% increase in number of “PI” firms from
2008 to 2009• Ministry of Justice Reforms: 30th April 2010
– aims to reduce fees (88% of claims under £5k paid in fees)
• Jackson Review: partial consultation Autumn 2010– implementation date uncertain– stop recoverability of success fees
6© 2010 The Actuarial Profession www.actuaries.org.uk
Accident Management Companies (“AMCs”) Claims Management Companies (“CMCs”)
7
0%
5%
10%
15%
20%
25%
3 6 9 12 15 18 21 24 27 30 33 36 39 42 45 48 51 54 57 60 63 66 69 72
Development Month
TPI numbers to TPD numbers (inc nils) ratio
2004
2005
2006
2007
2008
2009
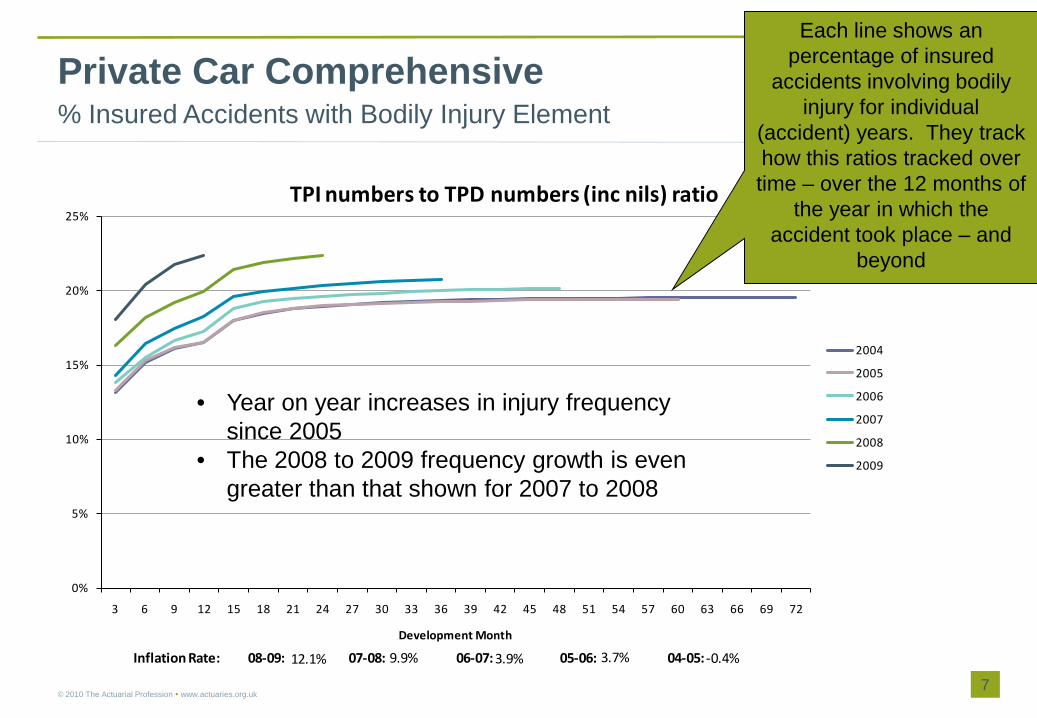
Inflation Rate: 08-09: 07-08: 06-07: 05-06: 04-05: -0.4%3.7%3.9%9.9%12.1%
Private Car Comprehensive% Insured Accidents with Bodily Injury Element
7© 2010 The Actuarial Profession www.actuaries.org.uk
• Year on year increases in injury frequency since 2005
• The 2008 to 2009 frequency growth is even greater than that shown for 2007 to 2008
Each line shows an percentage of insured
accidents involving bodily injury for individual
(accident) years. They track how this ratios tracked over time – over the 12 months of
the year in which the accident took place – and
beyond

8
6,000
6,500
7,000
7,500
8,000
8,500
3 6 9 12 15 18 21 24 27 30 33 36 39 42 45 48 51 54 57 60 63 66 69 72
Development Month
Incurred Average Cost
2004
2005
2006
2007
2008
2009
Inflation Rate: 08-09: 07-08: 06-07: 05-06: 04-05:2.0%3.0%1.0%4.7%3.2%
Private Car ComprehensiveThird Party Capped Injury
8© 2010 The Actuarial Profession www.actuaries.org.uk
• Average cost trends generally show a reduction over time (redundancy)• There is evidence of a changing pattern in the latest years compared to
previous development• Average incurred inflation appears to be a relatively stable 3%. The
next slide suggests that loss adjuster views are too benign based on actual data when claims settle
Each line shows average cost of bodily injury claims
as assessed by loss adjusters (not actuaries) for individual (accident) years. They track how this ratios
tracked over time – over the 12 months of the year in which the accident took
place – and beyond
9
0
1,000
2,000
3,000
4,000
5,000
6,000
7,000
3 6 9 12 15 18 21 24 27 30 33 36 39 42 45 48 51 54 57 60 63 66 69 72
Development Month
Average Cost of Settled Claims (incl Nils)
2004
2005
2006
2007
2008
2009
Inflation Rate: 08-09: 07-08: 06-07: 05-06: 04-05:4.5%6.2%9.6%20.3%20.2%
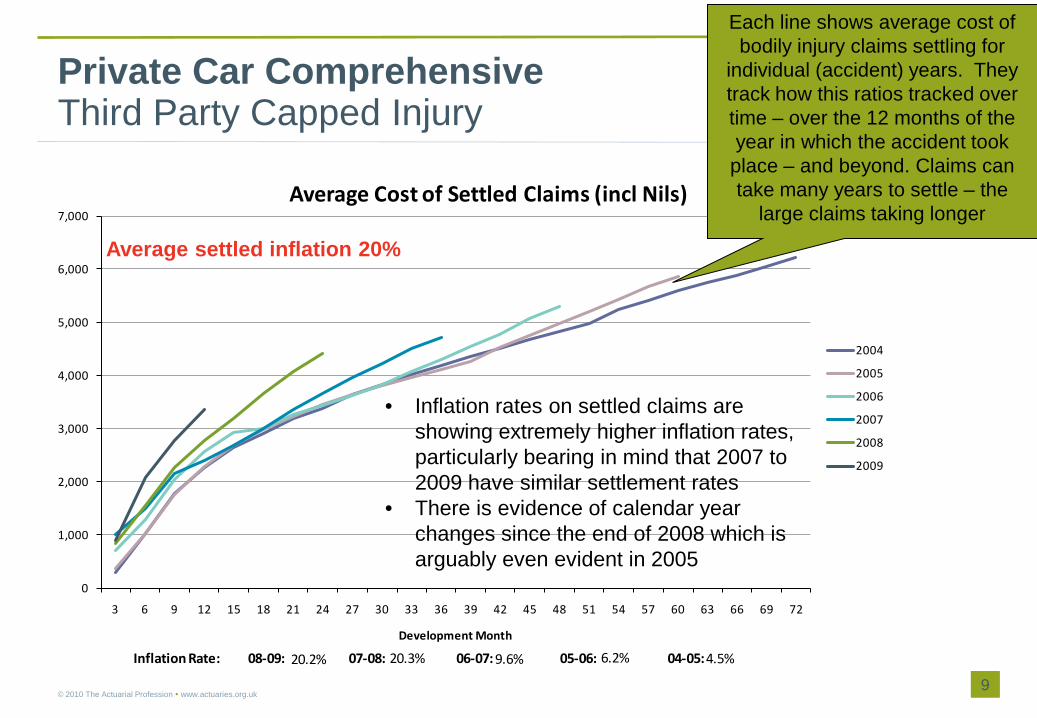
Private Car ComprehensiveThird Party Capped Injury
9© 2010 The Actuarial Profession www.actuaries.org.uk
• Inflation rates on settled claims are showing extremely higher inflation rates, particularly bearing in mind that 2007 to 2009 have similar settlement rates
• There is evidence of calendar year changes since the end of 2008 which is arguably even evident in 2005
Average settled inflation 20%
Each line shows average cost of bodily injury claims settling for
individual (accident) years. They track how this ratios tracked over time – over the 12 months of the year in which the accident took
place – and beyond. Claims can take many years to settle – the
large claims taking longer

10
The Growth of Bodily Injury Correlates with the Growth in Claims Management Companies
10© 2010 The Actuarial Profession www.actuaries.org.uk
R2 = 0.6564
0.0%
5.0%
10.0%
15.0%
20.0%
25.0%
30.0%
35.0%
40.0%
45.0%
0.0% 50.0% 100.0% 150.0% 200.0% 250.0%
Increase in CMCs vs Increase in BI Frequency
BI Increase Linear (BI Increase)
The map indicates the growth of claims management companies geographically (red representing highest growth)
The graph shows the relationship (in different geographical regions) between growth of claims management companies and increase in bodily injury claims frequency

11
-
5,000,000
10,000,000
15,000,000
20,000,000
25,000,000
30,000,000
35,000,000
40,000,000
0
0.05
0.1
0.15
0.2
0.25
0.3
0.35
0.4
2005 2006 2007 2008 2009
Polic
y Ye
ars
Accident Year
TPI/TPD Numbers
Total Exposure London + South East (excl Kent and Essex) CentralNorth West Kent + Essex (Excl M25) North EastYorkshire Total
TPI / TPD numbers (% of insured accident involving bodily injury) by TV region (Private Car Comprehensive)
11© 2010 The Actuarial Profession www.actuaries.org.uk
• North West the biggest problem• All TV regions are showing
increases in frequency over time• But London the greatest growth• Latter years are undeveloped
-
5,000,000
10,000,000
15,000,000
20,000,000
25,000,000
30,000,000
35,000,000
40,000,000
0
0.05
0.1
0.15
0.2
0.25
0.3
0.35
0.4
2005 2006 2007 2008 2009
Polic
y Ye
ars
Accident Year
TPI / TPD Numbers
Total Exposure East Anglia BorderNorth East Scotland Wales West + West CountryScotland Total
• Notably Scottish TV regions show flatter trends probably linked to different legal systems

12
Main lessons from outside England and Wales
• Farming is continent agnostic– North America, Australia, Asia and Europe all suffer– China, France, Germany, Russia, Spain and Switzerland appear immune
• Legislation has– Stopped farming (Germany, Switzerland, France)– Reduced the impact (Ireland)– Failed to respond => a growing issue (Hong Kong, Poland)
• French solution has natural flair; Irish Injuries Board made a real difference• No obvious link between route to market and claim farming• Insurance viewed as a necessary evil/tax and insurers are “fair game”• Lawyers will find a way to generate and recover fees

13
England, Scotland and Ireland
Scotland• Legal System very different to England/Wales in respect of recovering legal costs• Scottish system is more ‘proportional’ - small claims attract costs on a fixed/scale
basis (English/Welsh based on a what the court would allow based on hours worked, area of the country and additional disbursements)
• Predictive Costs has limited cost recovery for un-litigated claims• Lawyers adept at getting cases out of the Predictive Fees regime into normal
litigation and enhancing their cost recovery
England versus Ireland• MOJ Reforms (England) only deal with claims up to £10,000 - Injuries Board
considers claims of any value• Irish statistics demonstrate a marked reduction in legal costs - it is too early to tell
what the MOJ impact has been• Both systems adhere to strict timescales to speed up settlement, in Ireland the
time from consent to award has reduced from 36 months to just 7 months• The Irish “Amending legislation” demonstrates a continuous drive to reduce
unnecessary litigation – it will be interesting to see whether similar amendments result in England.

14
Conclusions
The Losses coming through on Motor Bodily Injury are significant but may be understated.•Numbers of claims..10% annual increases in bodily injury claim frequencies in the context of (slightly) reducing accident frequencies.•Average Claim Amount. Data based on loss adjuster estimates (incurreds) does not show the levels of inflation seen in actual claims settling. The average cost inflation indicated by the actual data is 20% (17% higher than the indications coming through from loss adjusters). To the extent that individual company actuaries have relied on loss adjuster data, their estimates of the costs of claims will be too low. •If reserving actuaries are basis their projection on they may be under-calling the reserves and “profitability” of individual companies and therefore the market may be overstated.
Pricing increases have gone in. However with 30% inflation on 50% of the cost of motor and a starting point of (potentially understated) losses ..•Frequency + 10% p.a. (’07 – ’09)•Average costs +20% (’08 – ’09)•Combined…..+30%
There is likely to be a need for further significant price increases
Claims farming is a major contributor to increasing costsFarming is continent agnostic
•North America, Australia, Asia and Europe all suffer
•China, France, Germany, Russia, Spain and Switzerland appear immune
Legislation can help•Stopped farming (Germany, Switzerland, France, Scotland)
•Reduced the impact (Ireland)
•Failed to respond => a growing issue (Hong Kong, Poland)
French solution has natural flair; Irish Injuries Board made a real difference
Ministry of Justice changes have just been implemented . It is not clear what impact they will have. The belief of the working party is that MOJ is only a partial solution.
Consultation is due on Lord Justice Jackson report in Autumn 2010. The proposals are:
•Banning referral fees
•Abolishing the recoverability of success fees and ATE premiums
•Increasing general damages awards by 10%
•Introducing “qualified one way costs shifting”
•Introducing fixed legal costs for fast track cases worth up to £25,000
•Promoting Before the Event legal expense insurance
The findings of the working party are pertinent to this, and would justify elements of the Jackson proposals
14
Challenges for the Insurance Industry Challenges for Policy Makers

© 2010 The Actuarial Profession www.actuaries.org.uk
Appendices
October 2010
Institute of ActuariesThird Party Working Party

16
Want to know more?
• Insurer Quotes/Results• What is claims farming?• What is the legal history?• Industry Data• International Approaches
• Appendix A• Appendix B• Appendix C• Appendix D• Appendix E

© 2010 The Actuarial Profession www.actuaries.org.uk
Appendix A. Company Quotes and Results
October 2010
Institute of ActuariesThird Party Working Party

18
Groupama
“Groupama chief executive attributes recent slump in profits to the increase in claims farming"
“All other lines are performing in-line with expectation…we have been surprised with the injury inflation….”
“There has been an increase in whiplash claims suddenly people seem to have more sensitive necks. Whether it is linked to the recession or a further significant increase in claims farming activities I am not sure but it could be both. It certainly took us by surprise.”
Accidents fell 5% overall during the first half of the year, the number of PI claims increased by 22%. The number of claimants per accident also rose from 1.2 to 1.5.
Appealing to the insurance industry to help tackle the issue of claims farming, he added: “I would call on my fellow industry leaders to take action because we have to reduce this activity. It is not good for the industry and it is not good for the customers, as it is increasing premiums.”
Post Magazine, 9 September 2009
18© 2010 The Actuarial Profession www.actuaries.org.uk
19
RBSI
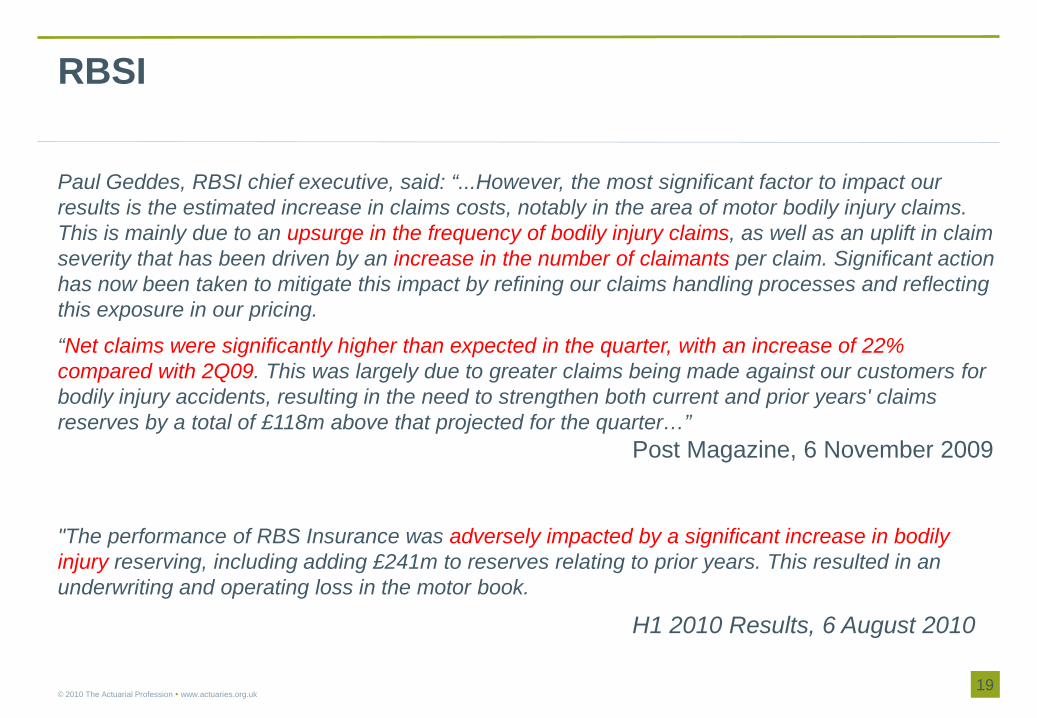
Paul Geddes, RBSI chief executive, said: “...However, the most significant factor to impact our results is the estimated increase in claims costs, notably in the area of motor bodily injury claims. This is mainly due to an upsurge in the frequency of bodily injury claims, as well as an uplift in claim severity that has been driven by an increase in the number of claimants per claim. Significant action has now been taken to mitigate this impact by refining our claims handling processes and reflecting this exposure in our pricing.
“Net claims were significantly higher than expected in the quarter, with an increase of 22% compared with 2Q09. This was largely due to greater claims being made against our customers for bodily injury accidents, resulting in the need to strengthen both current and prior years' claims reserves by a total of £118m above that projected for the quarter…”
Post Magazine, 6 November 2009
"The performance of RBS Insurance was adversely impacted by a significant increase in bodily injury reserving, including adding £241m to reserves relating to prior years. This resulted in an underwriting and operating loss in the motor book.
H1 2010 Results, 6 August 2010
19© 2010 The Actuarial Profession www.actuaries.org.uk

20
Zurich
The motor personal lines business is reflecting the difficult economic environment putting pressure on our generally strong margins. In the UK, the loss ratio deteriorated driven by the so-called credit hire practices as well as an overall increase in personal injury claims. We continue to respond to these developments through rate changes and through a dedicated claims management strategy.
Financial Statement 2009Steve Lewis, chief executive of Zurich’s UK general insurance business said, “We have seen a 30% increase in bodily injury frequency with a worsening trend throughout 2009. This, combined with high inflation, has resulted in a 50% increase in the cost of covering bodily injury losses in the last few years.
Post Magazine 14 Jan 2010
20© 2010 The Actuarial Profession www.actuaries.org.uk

21
IAG
“Insurance Australia Group (IAG) today announced that due to a significant deterioration in UK claim experience, in particular bodily injury claims, it had conducted a further independent actuarial review of its UK business. As a result, in FY10 the Group expects to recognise an associated one-off, pre-tax charge of approximately $365 million…”
“The anticipated $365 million charge in FY10 mainly relates to claim reserve strengthening…”
“…the Group had previously highlighted an increase in the cost of bodily injury claims relating to the 2007 and prior underwriting years, however, the latest actuarial review has confirmed the scope of the issue is greater than originally anticipated.”
“The UK insurance industry has seen a significant increase in the cost of bodily injury claims. This includes a notable rise in the number of injured parties per accident, primarily driven by the ‘claim farming’ activities of accident lawyers. Recent industry reports indicate significant claims inflation in this area driven by increases in both frequency and severity. Economically-inspired claim activity is also growing in a tough environment”
Financial Statements 2 June 2010

22
Fortis
• Fortis commented that the performance in the private car book continues to be impacted by the industry-wide issues of increased personal injury claims and the need for further rate strengthening.
Post Magazine, 25 Aug 2010

© 2010 The Actuarial Profession www.actuaries.org.uk
Appendix B. What is Claims Farming?
October 2010
Institute of ActuariesThird Party Working Party
24
The claims process - Overview
Outcome of claims process for claimants• Repair• Car hire• Compensation for InjuryFactors affecting route through process• Who did you call first?• Who is at fault?• Is your insurer helping enough?
24© 2010 The Actuarial Profession www.actuaries.org.uk

25
The claims process - Overview
25© 2010 The Actuarial Profession www.actuaries.org.uk

26
Introducing Claims Management Companies
Accident Management Companies (“AMCs”)• Third Party Property Damage• Specialist repair/hire servicesClaims Management Companies (“CMCs”)• Third Party Personal Injury• Not solicitors• Authorised to receive referral fees
26© 2010 The Actuarial Profession www.actuaries.org.uk

27
Accident Management Companies (“AMCs”)
Services provided• Credit repair• Credit hire• Fleet support• Claims administration• Third party capture• TPPI referral.
27© 2010 The Actuarial Profession www.actuaries.org.uk

28
Accident Management Companies (“AMCs”)
History• Market has grown since the 1980s• Initial demand from unhappy insurance claimants:
– Poor service levels from insurers– Courtesy car not “like for like”
• Rapid growth in last 10 years– Referral fees to brokers and insurers– Outsourcing of claims handling
28© 2010 The Actuarial Profession www.actuaries.org.uk

29
Accident Management Companies (“AMCs”)
Sources of new business• Chiefly from contracts with brokers and insurers• Referrals may come from garages / solicitors• Some business won by direct advertising (e.g. web searches)• Specialist market in fleet claims management• Common ownership of insurer / broker / AMC / law firm / etc..
29© 2010 The Actuarial Profession www.actuaries.org.uk

30
Accident Management Companies (“AMCs”)
Costs to the industry• Extra layer of costs?
– Service element payable by insured– “Impecunious” insured may recover this element from insurer
• Inflated costs?– Incentive to delay repair– Very high hire costs (e.g. £122,000)– No incentive to minimise repair costs
30© 2010 The Actuarial Profession www.actuaries.org.uk
31
Accident Management Companies (“AMCs”)
Benefits to the industry• More competitive market in claims processing• Insurers more pro-active in resolving claims• Valuable service for fleet managersRegulation of AMCs• AMCs unregulated, but represented by NACHO• ABI GTA controls costs
31© 2010 The Actuarial Profession www.actuaries.org.uk

32
Accident Management Companies (“AMCs”)
ABI GTA• First and Second Tier subscribers• Agreed car hire day rates (retail)• Agreement on where extra charges apply, eg:
– Sat Nav: No– Automatics/Convertibles: Yes
• “First to the customer” rule• Monitoring and reporting of repair times• Penalties for late payment
32© 2010 The Actuarial Profession www.actuaries.org.uk

33
Accident Management Companies (“AMCs”)
State of the Market• Dominated by Helphire (PLC) and Drive Assist (private)• Smaller players: Accident Exchange, Kindertons, AI• Circa £600m annual industry turnover• Turnover flat since 2008 and tight credit is a problem
33© 2010 The Actuarial Profession www.actuaries.org.uk

34
Claims Management Companies (“CMCs”)
Services provided• Referral of cases to PI solicitors• Arranging of finance and ATE insuranceHistory• Linked to the rise in “no win no fee”• Different system in Scotland• Covered in detail in legal section
34© 2010 The Actuarial Profession www.actuaries.org.uk

35
How they get business• Predominantly by advertising• Cold calling forbidden but numerous examples of:
– Unsolicited text messages following web insurance quote– Phone calls from AMC inviting claims for “neck injury”– Leafleting on the streets of Newcastle– Recent initiatives to target old claims:
– details sold by aggregators, or– well known broker re-opening closed claims
Claims Management Companies (“CMCs”)
35© 2010 The Actuarial Profession www.actuaries.org.uk
FREEMSG: Our records indicate you may be
entitled to 3750 pounds for the Accident you had. To claim for free reply with
YES to this msg. To opt out text STOP

36
Claims Management Companies (“CMCs”)
Costs to insurers• Recent upsurge in PI claims, especially small Benefits of CMC involvement• More equitable treatment of accident victims?Regulation of CMCs• Claims Management Regulator est. 23 April 1997• More detail in legal section• Has regulation pushed “cowboys” into the AMC market?
36© 2010 The Actuarial Profession www.actuaries.org.uk

37
Claims Management Companies (“CMCs”)
State of the Market• CMR figures comparing 2008 with 2009 show:
– 60% increase in number of regulated “PI” firms – 25% increase in revenues to £287m
• Location of firms broadly matchesPI risk level - cause or effect?
37© 2010 The Actuarial Profession www.actuaries.org.uk

38
Role of insurers
Conditions for growth• Poor service levels led to initial demand for AMC servicesInsurance industry fight back• Industry has responded to higher costs with:
– bilateral agreements– complicity with system (to gain referral fees)– marketing of legal insurance (non risk income)
The customer pays!
38© 2010 The Actuarial Profession www.actuaries.org.uk
© 2010 The Actuarial Profession www.actuaries.org.uk
Appendix CWhat’s the Legal Background?
October 2010
Institute of ActuariesThird Party Working Party

40
A brief history of claims farming…
• Until 1984, advertising by solicitors was banned • Conditional Fee Agreements (“No Win, No Fee”) have been
allowed in personal injury cases since 1995• Legal Aid removed in personal injury cases from April 2000Rapid expansion in accident management companies
• October 2003 - predictable costs introduced for low value personal injury claims
• 2004 - Law Society relaxed its rules to permit solicitors to pay referral fees to introducers of personal injury claims
40© 2010 The Actuarial Profession www.actuaries.org.uk

41
Regulation of Claims Management Companies
• Concerns about the method of operation of some claims management companies led to a provision in the Compensation Act 2006 for such companies to be regulated
• Any business providing claims management services to be either authorised by the Claims Management Regulator or exempt
• By May 2009, 2928 firms had been authorised, with over 1500 active in personal injury claims with a combined turnover of nearly £300m.
• The Ministry of Justice has reported on its experience of regulation
• The regulation only applies to England and Wales41
© 2010 The Actuarial Profession www.actuaries.org.uk

42
Case Law
• Case law continues to emerge as to the recoverability of credit hire fees.– Dimond v Lovell (2002)– Lagden v O’Connor (2003) – impecuniosity– Copley v Lawn (2009)
42© 2010 The Actuarial Profession www.actuaries.org.uk
43
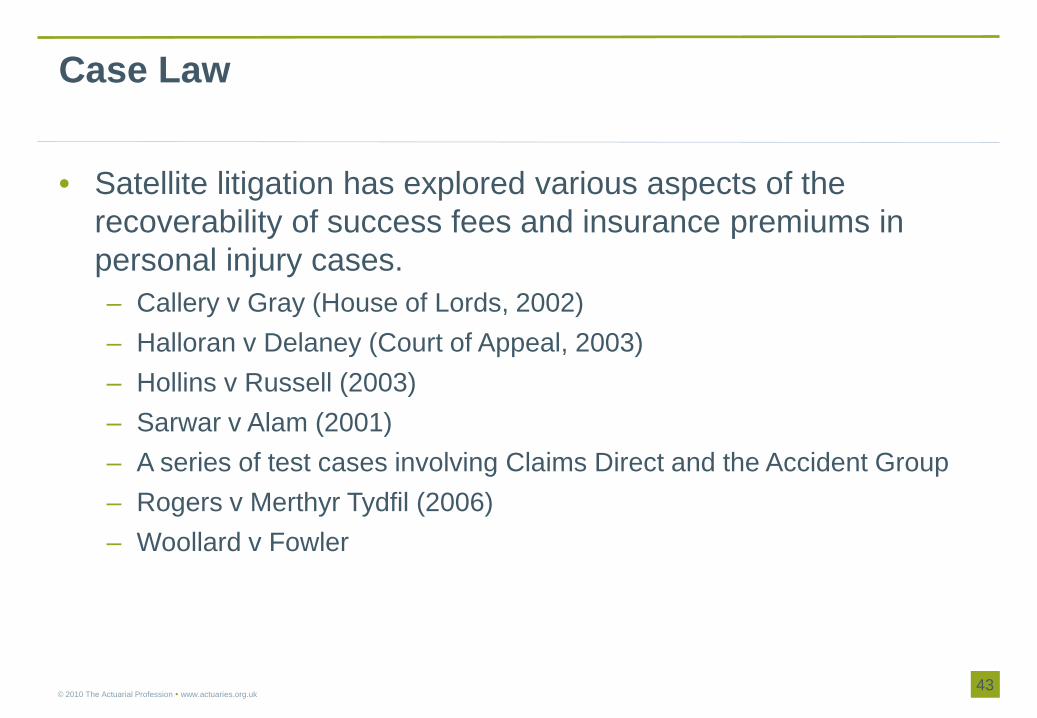
Case Law
• Satellite litigation has explored various aspects of the recoverability of success fees and insurance premiums in personal injury cases.– Callery v Gray (House of Lords, 2002)– Halloran v Delaney (Court of Appeal, 2003)– Hollins v Russell (2003)– Sarwar v Alam (2001)– A series of test cases involving Claims Direct and the Accident Group– Rogers v Merthyr Tydfil (2006)– Woollard v Fowler
43© 2010 The Actuarial Profession www.actuaries.org.uk
44
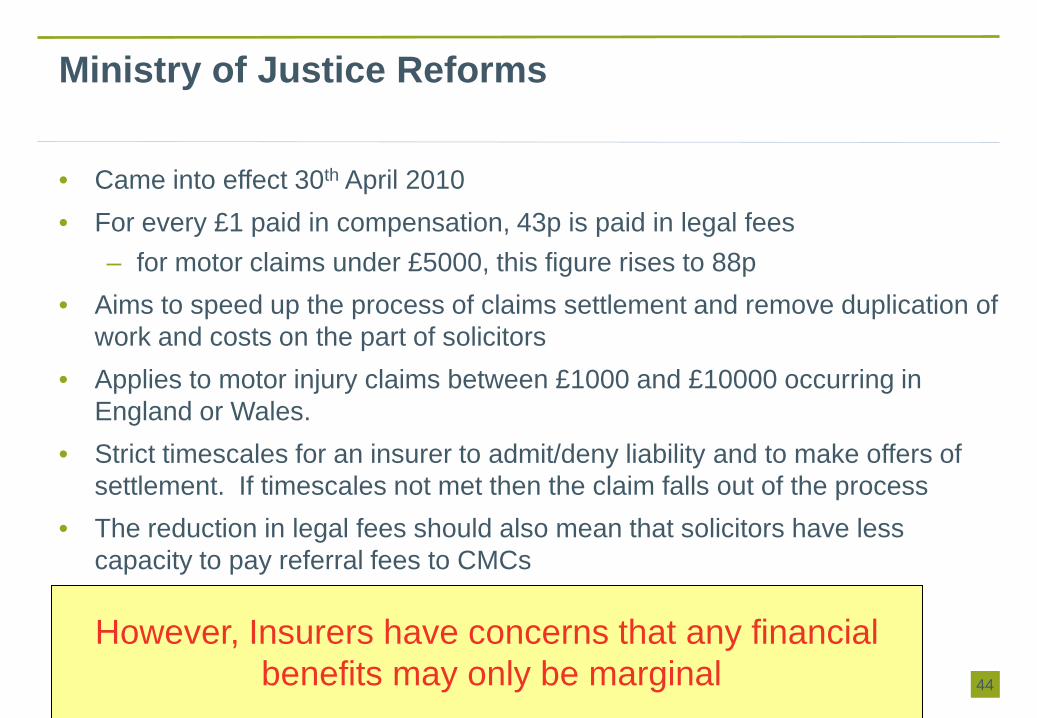
Ministry of Justice Reforms
• Came into effect 30th April 2010• For every £1 paid in compensation, 43p is paid in legal fees
– for motor claims under £5000, this figure rises to 88p• Aims to speed up the process of claims settlement and remove duplication of
work and costs on the part of solicitors• Applies to motor injury claims between £1000 and £10000 occurring in
England or Wales.• Strict timescales for an insurer to admit/deny liability and to make offers of
settlement. If timescales not met then the claim falls out of the process• The reduction in legal fees should also mean that solicitors have less
capacity to pay referral fees to CMCs
44© 2010 The Actuarial Profession www.actuaries.org.uk
However, Insurers have concerns that any financialbenefits may only be marginal

45
Jackson Review
• In January 2010, Lord Justice Jackson published the report on his comprehensive review of civil litigation costs
• Jackson concluded that costs are often disproportionate and impede access to justice and recommended– Banning referral fees – Abolishing the recoverability of success fees and ATE premiums– Increasing general damages awards by 10%– Introducing “qualified one way costs shifting”– Introducing fixed legal costs for fast track cases worth up to £25,000– Promoting Before the Event legal expense insurance
45© 2010 The Actuarial Profession www.actuaries.org.uk

46
Jackson Review
• By banning referral fees and giving claimants a financial interest in the level of costs being incurred on their behalf, the reforms would do much to restrict claims farming
• The Solicitors Regulatory Authority argue that the reforms would restrict access to justice
• Oxera / ABI find that there are more cost-effective ways to promote access to justice
• Report for Legal Services Board finds no evidence of consumer detriment from referral fees
• Government consultation on some aspects of Jackson due to commence in the autumn, but it remains uncertain whether or when the Government will introduce the reforms
46© 2010 The Actuarial Profession www.actuaries.org.uk

47
Regulation of AMCs
• No formal regulation• Some of the case law on Credit Hire is relevant• In 1999, the ABI developed General Terms of Agreement (GTA)
to which insurers and credit hire organisations could subscribe– Not all insurers subscribe– Axa withdrew in 2009 believing they could achieve a better
deal outside the agreement.

© 2010 The Actuarial Profession www.actuaries.org.uk
Appendix DIndustry Results
October 2010
Institute of ActuariesThird Party Working Party

49
Industry Results
• A significant number of insurers contributed a vast array of information on third party claims (injury and property damage) that made this section happen
• In total, over 85% of FSA regulated companies (measured by 2008 premium volumes) contributed, and so the results form as complete a study as probably is possible
• Analysis of the above data carried out by EMB on an anonymised basis• Most of the graphs show industry accident year triangulation progressions• This facilitates the comparison of experience on a “like-for-like” basis (at least in
relation to development)• Inflation rates shown are the latest point in the year compared to the previous
accident year at the same point in development• Geographical data on a different basis and shows the latest positions• Note that there may be some inconsistencies between different graphs because of
different formats and data availability
49© 2010 The Actuarial Profession www.actuaries.org.uk

© 2010 The Actuarial Profession www.actuaries.org.uk
D.1 Industry ResultsThird Party Damage
October 2010
Institute of ActuariesThird Party Working Party

51
0%
1%
2%
3%
4%
5%
6%
3 6 9 12 15 18 21 24 27 30 33 36 39 42 45 48 51 54 57 60 63 66 69 72
Development Month
Reported Frequency
2004
2005
2006
2007
2008
2009
Inflation Rate: 08-09: 07-08: 06-07: 05-06: 04-05:3.9%1.1%4.2%-3.8%-0.7%
Private Car ComprehensiveThird Party Damage
51© 2010 The Actuarial Profession www.actuaries.org.uk
• No particular trends in overall TPD frequency
• Slight reduction over the last two years

52
0
200
400
600
800
1,000
1,200
1,400
1,600
3 6 9 12 15 18 21 24 27 30 33 36 39 42 45 48 51 54 57 60 63 66 69 72
Development Month
Incurred Average Cost
2004
2005
2006
2007
2008
2009
Inflation Rate: 08-09: 07-08: 06-07: 05-06: 04-05:7.2%9.3%6.6%8.0%2.6%
Private Car ComprehensiveThird Party Damage
52© 2010 The Actuarial Profession www.actuaries.org.uk
• Severity showing high levels of inflation, particularly between earlier accident periods
• Latest inflation is more modest

53
0
200
400
600
800
1,000
1,200
1,400
3 6 9 12 15 18 21 24 27 30 33 36 39 42 45 48 51 54 57 60 63 66 69 72
Development Month
Average Cost of Settled Claims (incl Nils)
2004
2005
2006
2007
2008
2009
Inflation Rate: 08-09: 07-08: 06-07: 05-06: 04-05:6.0%9.1%11.1%11.5%7.6%
Private Car ComprehensiveThird Party Damage
53© 2010 The Actuarial Profession www.actuaries.org.uk
• Settled average cost inflation indicates there’s still a problem
• There are many drivers including credit hire, vehicle specification offset by market initiatives

54
0%
20%
40%
60%
80%
100%
120%
3 6 9 12 15 18 21 24 27 30 33 36 39 42 45 48 51 54 57 60 63 66 69 72
Development Month
Settlement Rate (incl nils)
2004
2005
2006
2007
2008
2009
Inflation Rate: 08-09: 07-08: 06-07: 05-06: 04-05:0.1%0.0%0.3%0.9%1.9%
Private Car ComprehensiveThird Party Damage
54© 2010 The Actuarial Profession www.actuaries.org.uk
• Broadly consistent settlement rates• Some evidence of slight speeding up

© 2010 The Actuarial Profession www.actuaries.org.uk
D.2 Industry ResultsGeography
October 2010
Institute of ActuariesThird Party Working Party

56
0%
5%
10%
15%
20%
25%
3 6 9 12 15 18 21 24 27 30 33 36 39 42 45 48 51 54 57 60 63 66 69 72
Development Month
TPI numbers to TPD numbers (inc nils) ratio
2004
2005
2006
2007
2008
2009
Inflation Rate: 08-09: 07-08: 06-07: 05-06: 04-05: -0.4%3.7%3.9%9.9%12.1%
Private Car ComprehensiveTPI to TPD Numbers Ratio
56© 2010 The Actuarial Profession www.actuaries.org.uk
• Year on year increases in injury frequency since 2005
• The 2008 to 2009 frequency growth is even greater than that shown for 2007 to 2008

57
Audience survey
• Which TV region has shown the highest increase in TPI to TPD experience since 2005?– North West– North East– Yorkshire– Central– London and South East (excluding Kent and Essex)– Kent and Essex– Wales– West & West Country– East Anglia– North East Scotland– Border– Scotland
57© 2010 The Actuarial Profession www.actuaries.org.uk

58
-
5,000,000
10,000,000
15,000,000
20,000,000
25,000,000
30,000,000
35,000,000
40,000,000
0
0.05
0.1
0.15
0.2
0.25
0.3
0.35
0.4
2005 2006 2007 2008 2009
Polic
y Ye
ars
Accident Year
TPI/TPD Numbers
Total Exposure London + South East (excl Kent and Essex) CentralNorth West Kent + Essex (Excl M25) North EastYorkshire Total
TPI / TPD numbers by TV region (Private Car Comprehensive)
58© 2010 The Actuarial Profession www.actuaries.org.uk
• North West the biggest problem• All TV regions are showing
increases in frequency over time• Latter years are undeveloped

59
-
5,000,000
10,000,000
15,000,000
20,000,000
25,000,000
30,000,000
35,000,000
40,000,000
0
0.05
0.1
0.15
0.2
0.25
0.3
0.35
0.4
2005 2006 2007 2008 2009
Polic
y Ye
ars
Accident Year
TPI / TPD Numbers
Total Exposure East Anglia BorderNorth East Scotland Wales West + West CountryScotland Total
TPI / TPD numbers by TV region (Private Car Comprehensive)
59© 2010 The Actuarial Profession www.actuaries.org.uk
• Notably Scottish TV regions show flatter trends probably linked to different legal systems

60
Intensity of registered Claims Management Companies (CMCs) by postcode
60© 2010 The Actuarial Profession www.actuaries.org.uk

61
-
5,000,000
10,000,000
15,000,000
20,000,000
25,000,000
30,000,000
35,000,000
40,000,000
0.8
0.9
1
1.1
1.2
1.3
1.4
1.5
2005 2006 2007 2008 2009
Polic
y Ye
ars
Accident Year
TPI/TPD Numbers Rescaled
Total Exposure London + South East (excl Kent and Essex) CentralNorth West Kent + Essex (Excl M25) North EastYorkshire Total
Change in TPI / TPD Numbers (Private Car Comprehensive)
61© 2010 The Actuarial Profession www.actuaries.org.uk

62
A Myth Destroyed
• Although the North West shows the highest level of TPI to TPD experience, the change over the last few years has been greater in London
• A plausible hypothesis is that the whole of England “aspires” to the experience of the North West
62© 2010 The Actuarial Profession www.actuaries.org.uk

63
-
5,000,000
10,000,000
15,000,000
20,000,000
25,000,000
30,000,000
35,000,000
40,000,000
0.8
0.9
1
1.1
1.2
1.3
1.4
1.5
2005 2006 2007 2008 2009
Polic
y Ye
ars
Accident Year
TPI / TPD Numbers Rescaled
Total Exposure East Anglia BorderNorth East Scotland Wales West + West CountryScotland Total
Change in TPI / TPD Numbers (Private Car Comprehensive)
63© 2010 The Actuarial Profession www.actuaries.org.uk

64
Third Party Injury average cost by TV region
64© 2010 The Actuarial Profession www.actuaries.org.uk
-
2,000,000.00
4,000,000.00
6,000,000.00
8,000,000.00
10,000,000.00
12,000,000.00
6,000.00
7,000.00
8,000.00
9,000.00
10,000.00
11,000.00
12,000.00
13,000.00
14,000.00
15,000.00
East Anglia Border London + South East (excl Kent
and Essex)
Central North East Scotland
North West Wales Kent + Essex (Excl M25)
Scotland North East West + West Country
Yorkshire
Polic
y Ye
ars
TV Region
TPI Severity (05-09)
Total Exposure TPI Severity National Average
• London and the NW have slightly lower severity than average, but not significantly so
• Rural areas have the highest average costs, perhaps reflecting a higher proportion of larger claims
• “Scotland” (i.e. excluding NE Scotland and Border) has much lower average cost
• Uncapped data

65
-
2,000,000.00
4,000,000.00
6,000,000.00
8,000,000.00
10,000,000.00
12,000,000.00
1,000.00
1,100.00
1,200.00
1,300.00
1,400.00
1,500.00
1,600.00
1,700.00
East Anglia Border London + South East (excl Kent
and Essex)
Central North East Scotland
North West Wales Kent + Essex (Excl M25)
Scotland North East West + West Country
Yorkshire
Polic
y Ye
ars
TV Region
TPD Severity (05-09)
Total Exposure TPD Severity National Average
Third Party Damage average cost by TV region
65© 2010 The Actuarial Profession www.actuaries.org.uk
• Highest TPD severities in London and NW
• Scottish, West Country and Welsh regions showing significantly lower than average severities
• Uncapped data

66
Comp TPD Severity against Comp TPI Frequency
66© 2010 The Actuarial Profession www.actuaries.org.uk
R² = 0.6877
0.00%
0.20%
0.40%
0.60%
0.80%
1.00%
1.20%
1.40%
1.60%
1.80%
1300 1350 1400 1450 1500 1550 1600 1650 1700
Increase in TPD Sev vs Increase in BI Frequency
TPI Freq (05-09) Linear (TPI Freq (05-09))
There is a correlation between TPD and TPI is there a correlation between the activity of AMCs which drive TPD severity and CMCs which drive TPI freq (& severity)

67
Change in numbers of registered CMCs against change in frequency
67© 2010 The Actuarial Profession www.actuaries.org.uk
R2 = 0.6564
0.0%
5.0%
10.0%
15.0%
20.0%
25.0%
30.0%
35.0%
40.0%
45.0%
0.0% 50.0% 100.0% 150.0% 200.0% 250.0%
Increase in CMCs vs Increase in BI Frequency
BI Increase Linear (BI Increase)
• There is a strong correlation between growth in numbers of CMCs and the increase in injury frequency

© 2010 The Actuarial Profession www.actuaries.org.uk
D.3 Industry ResultsThird Party Injury
October 2010
Institute of ActuariesThird Party Working Party
69
0.0%
0.2%
0.4%
0.6%
0.8%
1.0%
1.2%
1.4%
3 6 9 12 15 18 21 24 27 30 33 36 39 42 45 48 51 54 57 60 63 66 69 72
Development Month
Reported Frequency
2004
2005
2006
2007
2008
2009
Inflation Rate: 08-09: 07-08: 06-07: 05-06: 04-05:3.5%4.9%8.2%5.7%11.2%
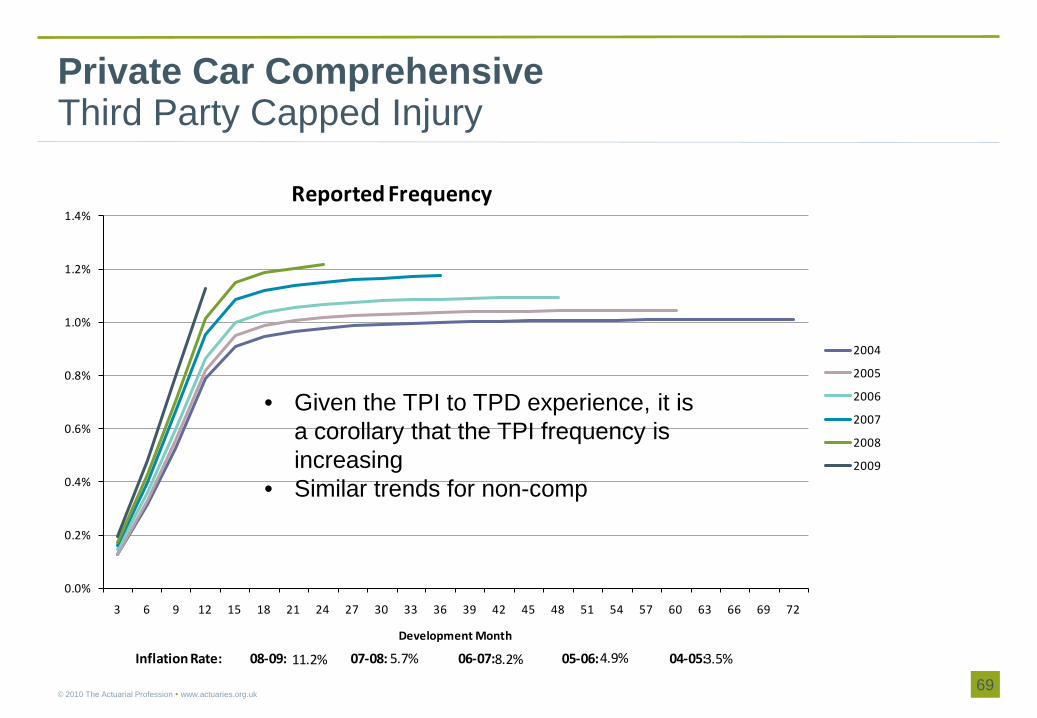
Private Car ComprehensiveThird Party Capped Injury
69© 2010 The Actuarial Profession www.actuaries.org.uk
• Given the TPI to TPD experience, it is a corollary that the TPI frequency is increasing
• Similar trends for non-comp

70
0.0%
0.2%
0.4%
0.6%
0.8%
1.0%
1.2%
1.4%
1.6%
1.8%
3 6 9 12 15 18 21 24 27 30 33 36 39 42 45 48 51 54 57 60 63 66 69 72
Development Month
Reported Frequency
2004
2005
2006
2007
2008
2009
Inflation Rate: 08-09: 07-08: 06-07: 05-06: 04-05: 2.4%2.2%8.9%2.8%7.7%
Commercial VehicleThird Party Capped Injury
70© 2010 The Actuarial Profession www.actuaries.org.uk

71
0.00%
0.50%
1.00%
1.50%
2.00%
2.50%
3.00%
3.50%
4.00%
3 6 9 12 15 18 21 24 27 30 33 36 39 42 45 48 51 54 57 60 63 66 69 72
Development Month
Reported Frequency
2004
2005
2006
2007
2008
2009
Inflation Rate: 08-09: 07-08: 06-07: 05-06: 04-05:10.6%9.8%7.0%-5.5%4.8%
FleetThird Party Capped Injury
71© 2010 The Actuarial Profession www.actuaries.org.uk
• Although frequency growth is not as high as car, this is in the context of a significantly lower accident frequency

72
6,000
6,500
7,000
7,500
8,000
8,500
3 6 9 12 15 18 21 24 27 30 33 36 39 42 45 48 51 54 57 60 63 66 69 72
Development Month
Incurred Average Cost
2004
2005
2006
2007
2008
2009
Inflation Rate: 08-09: 07-08: 06-07: 05-06: 04-05:2.0%3.0%1.0%4.7%3.2%
Private Car ComprehensiveThird Party Capped Injury
72© 2010 The Actuarial Profession www.actuaries.org.uk
• Average cost trends generally show a reduction over time
• There is evidence of a changing pattern in the latest years compared to previous development
• Average incurred inflation appears to be a relatively stable 3%

73
0%
20%
40%
60%
80%
100%
120%
3 6 9 12 15 18 21 24 27 30 33 36 39 42 45 48 51 54 57 60 63 66 69 72
Development Month
Settlement Rate (incl nils)
2004
2005
2006
2007
2008
2009
Inflation Rate: 08-09: 07-08: 06-07: 05-06: 04-05:0.3%3.2%2.9%-0.7%-3.3%
Private Car ComprehensiveThird Party Capped Injury
73© 2010 The Actuarial Profession www.actuaries.org.uk
• Part of changes in incurred average cost trends will be distorted by changing settlement rates
• However, the 2008 to 2009 settlement rates are quite consistent

74
0%
10%
20%
30%
40%
50%
60%
70%
80%
90%
100%
3 6 9 12 15 18 21 24 27 30 33 36 39 42 45 48 51 54 57 60 63 66 69 72
Development Month
Ratio of Paid to Incurred
2004
2005
2006
2007
2008
2009
Inflation Rate: 08-09: 07-08: 06-07: 05-06: 04-05:1.8%1.7%2.7%4.9%8.7%
Private Car ComprehensiveThird Party Capped Injury
74© 2010 The Actuarial Profession www.actuaries.org.uk
• There is evidence that case estimates are weakening, given consistent settlement rates in the later years
75
0
1,000
2,000
3,000
4,000
5,000
6,000
7,000
3 6 9 12 15 18 21 24 27 30 33 36 39 42 45 48 51 54 57 60 63 66 69 72
Development Month
Average Cost of Settled Claims (incl Nils)
2004
2005
2006
2007
2008
2009
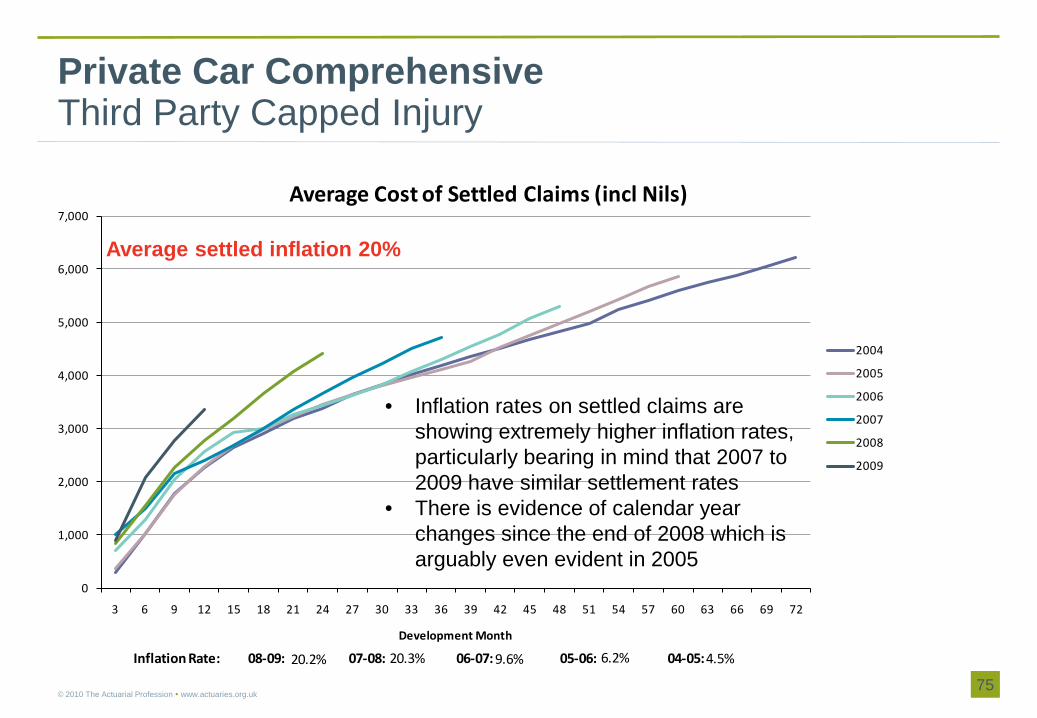
Inflation Rate: 08-09: 07-08: 06-07: 05-06: 04-05:4.5%6.2%9.6%20.3%20.2%
Private Car ComprehensiveThird Party Capped Injury
75© 2010 The Actuarial Profession www.actuaries.org.uk
• Inflation rates on settled claims are showing extremely higher inflation rates, particularly bearing in mind that 2007 to 2009 have similar settlement rates
• There is evidence of calendar year changes since the end of 2008 which is arguably even evident in 2005
Average settled inflation 20%

76
Claimants per Claim
• Less information available on claimants per claim• Where data was available, increase in numbers of claimants per
claim between 2008 and 2009 was in the range of 2.6% to 7%• 2008 compared to 2007 showed comparable levels of increases
However trends don’t look good…..• Frequency + 10% p.a. (’07 – ’09)• Average costs +20% (’08 – ’09)• Combined…..+30%Can pricing keep up?? Can reserving keep up??
76© 2010 The Actuarial Profession www.actuaries.org.uk

© 2010 The Actuarial Profession www.actuaries.org.uk
D.4 Industry ResultsVariation by Product
October 2010
Institute of ActuariesThird Party Working Party

78
Key differences/similarities
Third Party Damage• Very similar trends observed for Car Non-Comp• General pattern similar for Commercial and Fleet
– lower frequency for 2008 and 2009 offset by higher average costThird Party Injury / Third Party Damage• Again similar trends for Car Non-Comp• And same general pattern for Commercial and FleetThird Party Injury• Incurred inflation misleading• High settled inflation across all products in recent years (non-comp anomalous)• Deterioration hits mid 2008 – correlated to CMC location• Settlement rates increased 2005-2007 but stalled/reversed since - trends more
marked in Commercial
78© 2010 The Actuarial Profession www.actuaries.org.uk

79
-
500,000
1,000,000
1,500,000
2,000,000
2,500,000
3,000,000
3,500,000
4,000,000
4,500,000
5,000,000
0
0.05
0.1
0.15
0.2
0.25
0.3
0.35
0.4
0.45
2005 2006 2007 2008 2009
Polic
y Ye
ars
Accident Year
TPI/TPD Numbers
Total Exposure London + South East (excl Kent and Essex) CentralNorth West Kent + Essex (Excl M25) North EastYorkshire Total
Fleet Experience by TV Region
79© 2010 The Actuarial Profession www.actuaries.org.uk
• As for Private Car, most regions are showing a increase in frequency
• Hypothesis: experience merging towards NW as before
• There appears to be a particular catch-up on fleet in the North East
• (Note: data may be less reliable because of differences in registered and kept addresses)

80
-
500,000
1,000,000
1,500,000
2,000,000
2,500,000
3,000,000
3,500,000
4,000,000
4,500,000
5,000,000
0
0.05
0.1
0.15
0.2
0.25
0.3
0.35
0.4
0.45
2005 2006 2007 2008 2009
Polic
y Ye
ars
Accident Year
TPI / TPD Numbers
Total Exposure East Anglia BorderNorth East Scotland Wales West + West CountryScotland Total
Fleet Experience by TV Region
80© 2010 The Actuarial Profession www.actuaries.org.uk
• Again the flattest trends are seen in Scotland
81
6,000
8,000
10,000
12,000
14,000
16,000
18,000
20,000
3 6 9 12 15 18 21 24 27 30 33 36 39 42 45 48 51 54 57 60 63 66 69 72
Development Month
Incurred Average Cost
2004
2005
2006
2007
2008
2009
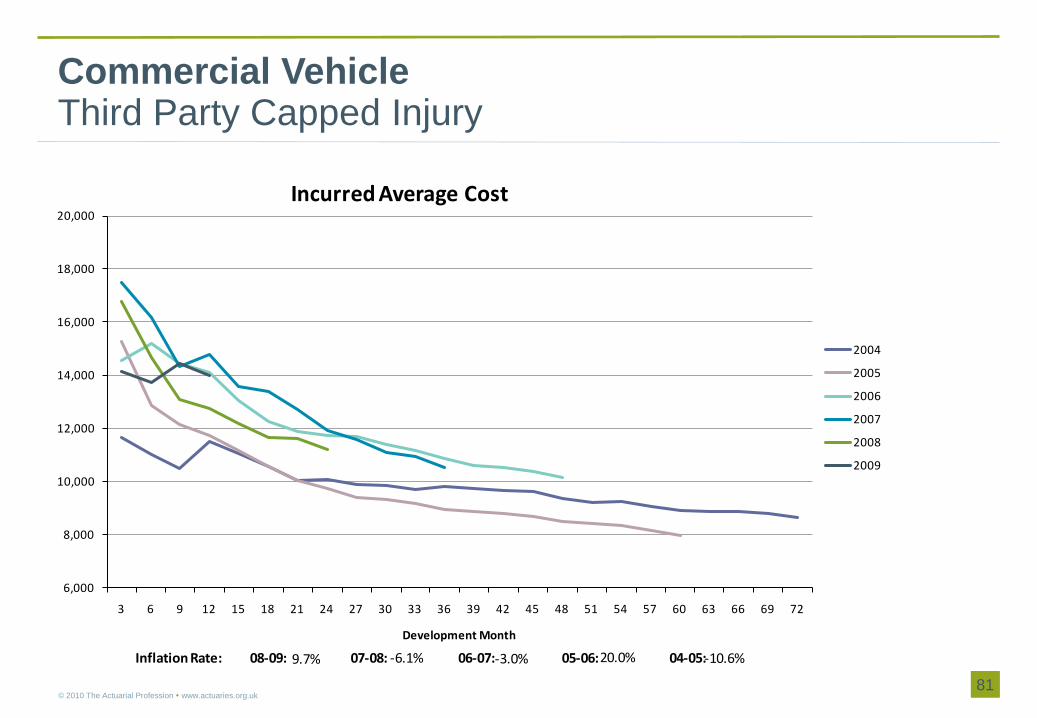
Inflation Rate: 08-09: 07-08: 06-07: 05-06: 04-05:-10.6%20.0%-3.0%-6.1%9.7%
Commercial VehicleThird Party Capped Injury
81© 2010 The Actuarial Profession www.actuaries.org.uk

82
0%
20%
40%
60%
80%
100%
120%
3 6 9 12 15 18 21 24 27 30 33 36 39 42 45 48 51 54 57 60 63 66 69 72
Development Month
Settlement Rate (incl nils)
2004
2005
2006
2007
2008
2009
Inflation Rate: 08-09: 07-08: 06-07: 05-06: 04-05:0.7%4.9%11.2%8.3%-15.1%
Commercial VehicleThird Party Capped Injury
82© 2010 The Actuarial Profession www.actuaries.org.uk
• Settlement rates have actually slowed down in 2009 on CV business, breaking the trend of previous improvements

83
0%
10%
20%
30%
40%
50%
60%
70%
80%
90%
100%
3 6 9 12 15 18 21 24 27 30 33 36 39 42 45 48 51 54 57 60 63 66 69 72
Development Month
Ratio of Paid to Incurred
2004
2005
2006
2007
2008
2009
Inflation Rate: 08-09: 07-08: 06-07: 05-06: 04-05:13.9%4.0%9.2%15.1%1.1%
Commercial VehicleThird Party Capped Injury
83© 2010 The Actuarial Profession www.actuaries.org.uk
• Again, evidence of case estimate weakening

84
0
1,000
2,000
3,000
4,000
5,000
6,000
7,000
8,000
9,000
3 6 9 12 15 18 21 24 27 30 33 36 39 42 45 48 51 54 57 60 63 66 69 72
Development Month
Average Cost of Settled Claims (incl Nils)
2004
2005
2006
2007
2008
2009
Inflation Rate: 08-09: 07-08: 06-07: 05-06: 04-05:4.3%11.6%8.4%20.6%48.5%
Commercial VehicleThird Party Capped Injury
84© 2010 The Actuarial Profession www.actuaries.org.uk
Settled average cost inflation 50%

© 2010 The Actuarial Profession www.actuaries.org.uk
Appendix EForeign approaches
October 2010
Institute of ActuariesThird Party Working Party

86
How is business distributed?
86© 2010 The Actuarial Profession www.actuaries.org.uk
Broker Tied Agent Direct Net/Aggs Partners & Banks
State Farming / Credit Hire an issue?
Australia Yes Injury F = Yes
Canada Yes Yes F = Not major but Tow trucks
China Not an issue!
France Yes Yes Small Small Yes No
Germany Yes Yes Yes Growing Growing F = No, CH = Yes
Hong Kong F = Growing
Ireland Yes Yes Small Yes F = Yes, CH = some
Italy Yes Yes Small Small Small F = No, CH = yes
Poland Yes Growing Growing F = Growing
Russia Small Yes Small Not really an issue
Scotland Less than England
Spain Yes Yes No
Switzerland Yes Yes Yes Yes Yes Not an issue
USA Yes Yes Yes Some Medics = enemy, CH = No, Tow trucks
87
Claim process
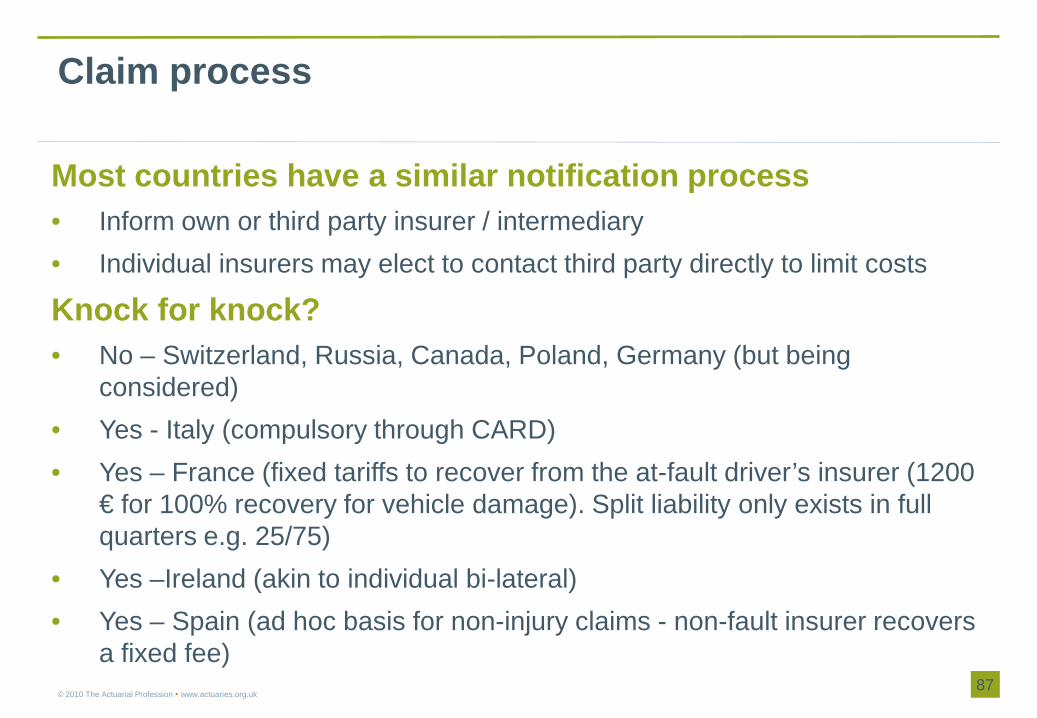
Most countries have a similar notification process• Inform own or third party insurer / intermediary• Individual insurers may elect to contact third party directly to limit costs
Knock for knock?• No – Switzerland, Russia, Canada, Poland, Germany (but being
considered)• Yes - Italy (compulsory through CARD)• Yes – France (fixed tariffs to recover from the at-fault driver’s insurer (1200
€ for 100% recovery for vehicle damage). Split liability only exists in full quarters e.g. 25/75)
• Yes –Ireland (akin to individual bi-lateral)• Yes – Spain (ad hoc basis for non-injury claims - non-fault insurer recovers
a fixed fee)87
© 2010 The Actuarial Profession www.actuaries.org.uk

88
USA
• Medical bills cause head aches– Many states have a no fault system - medical bills of the first party paid by own insurer,
irrespective of fault– Tow-truck operators cruise for accidents => referral fees $100-$200 (Canada too!)– Insurers' perspective - medical centres are the enemy: big bills spurious/no work– Victim's relationship with doctor/attorney can lead to big bills for the insurer….often the
insurer is unaware of the level of damages, and on occasions the insured receives a referral fee!
• No fault states– Should reduce the need for attorneys, in practice attorneys receive referral fees– Limit level of cover ($50k in New York), once bills exceed this (c3% of claims) and the fault
insurer is on the line => a lucrative source of funds for attorneys• Pain and suffering - at fault insurer pays (even in no fault states)
– Attorneys paid out of the claimant's award (rate agreed between the attorney and claimant -some states have maximum rate of 30%)
– Most cases are settled out of court.
88© 2010 The Actuarial Profession www.actuaries.org.uk
Farming is prevalent!

89
France
• Motorists must keep a document in their vehicles– who to contact– compensation available– likely timescales
(www.victimesindemnisees-fvi.fr/images/stories/DonneesStatistiques/rapportannuel2008.pdf)
• Compensation - virtually a fixed tariff as the awards from around 46,000 cases are published on the internet (www.victimesindemnisees-fvi.fr)
• Awards can be challenged but not common practice• Periodical payments (serious injuries) used more than in the UK• Legal cover is widely purchased
89© 2010 The Actuarial Profession www.actuaries.org.uk
Farming NOT an issue

90
Poland, Scotland and Spain
Poland• Increasingly insurance aware population – farming becoming an issue• No legislative deterrent to farming
Scotland• Legal System very different to England & Wales in respect of recovering legal costs (biggest driver of claim
farming)• Scottish system is more ‘proportional’ - small claims attract costs on a fixed/scale basis (English/Welsh based
on a what the court would allow based on hours worked, area of the country and additional disbursements)• Recently the issue of Predictive Costs has limited cost recovery for un-litigated claims• Lawyers adept at getting cases out of the Predictive Fees regime into normal litigation and enhancing their
cost recovery
Spain• Social security covers most claim items - medical expenses don’t need to be recovered• Claim process similar to UK but no claim/accident management companies• No specific legislation encourages/deters claims farming. However, Spain’s very strict data protection laws
may provide a certain level of deterrent compared to the UK.
90© 2010 The Actuarial Profession www.actuaries.org.uk
Farming a growing issue

91
Cover / Culture
91© 2010 The Actuarial Profession www.actuaries.org.uk
Courtesy car/cover available?
Choice of garage
Bodily injury: insurance or state
AMC’s advertise?
Insurance: necessary evil or valued?
Compensation Culture
3rd parties: a revenue stream?
Australia State
Canada Yes Yes Usually No Valued Some No
China
France Yes Yes Insurance Yes, not widely used
A tax Legal framework limits opportunity
No
Germany Yes Yes Insurance No Evil No No
Hong Kong Yes
Ireland Yes Yes Insurance Yes Valued Yes No
Italy Legal right/cost being challenged
Yes, credit hire & growing
Insurance Yes Both Not normally No /small
Poland Sparingly Yes Insurance (medical bills = state)
Yes Evil Growing No
Russia No Cash settlement
Yes, TRUR 160 pp, 280 in total
No Evil Yes, insurers fair game
Yes
Scotland Yes Yes Insurance Less so Evil Some Less than England!
Spain Optional extra –rarely taken
Yes Insurance (medical bills = state)
Yes, limited Valued No but gradually changing
No
Switzerland Yes Yes Both Yes Both Not really No
USA Yes Evil A sport No

92
Main lessons
• Farming is continent agnostic– North America, Australia, Asia and Europe all suffer– China, France, Germany, Russia, Spain and Switzerland appear immune
• Legislation has– Stopped farming (Germany, Switzerland, France)– Reduced the impact (Ireland)– Failed to respond => a growing issue (Hong Kong, Poland)
• The French solution has natural flair• No obvious link between route to market and claim farming• Insurance viewed as a necessary evil/tax and insurers are “fair game”• Lawyers will find a way to generate and recover fees
Real culprits:Cruising tow-trucks & medical centres