Transport Canada Border Wait-Time Project Phase 2 Proof of Concept Proof of Concept Executive...
35
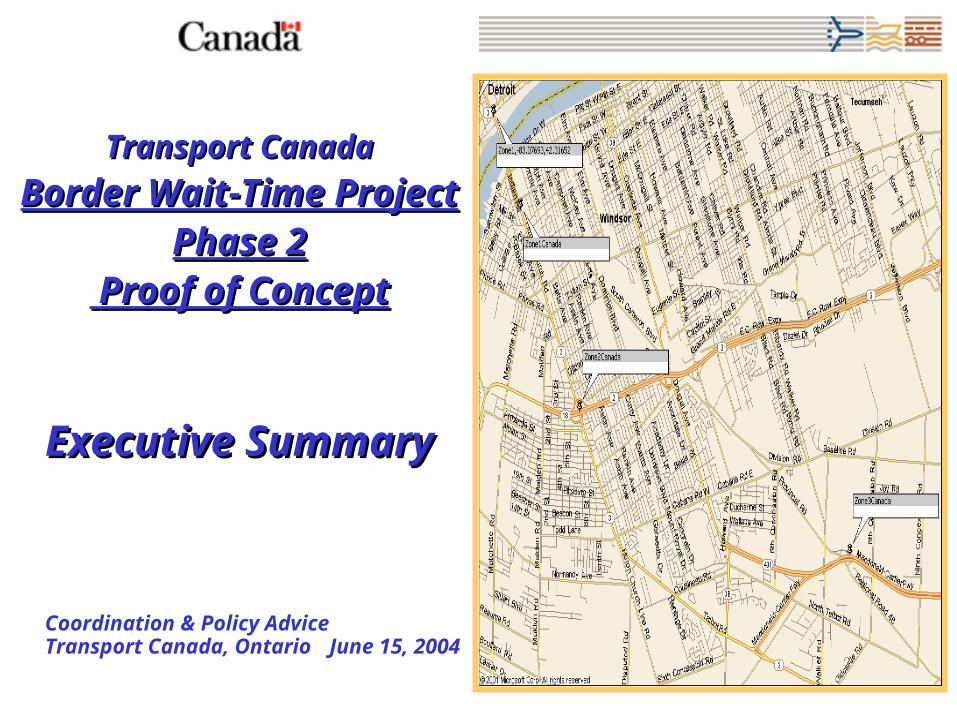
Transport Canada Transport Canada Border Wait-Time Project Border Wait-Time Project Phase 2 Phase 2 Proof of Concept Proof of Concept Executive Summary Executive Summary Coordination & Policy Advice Transport Canada, Ontario June 15, 2004
-
Upload
lucas-bruce -
Category
Documents
-
view
214 -
download
0
Transcript of Transport Canada Border Wait-Time Project Phase 2 Proof of Concept Proof of Concept Executive...
Transport CanadaTransport Canada
Border Wait-Time ProjectBorder Wait-Time ProjectPhase 2Phase 2
Proof of ConceptProof of Concept
Executive SummaryExecutive Summary
Coordination & Policy Advice Transport Canada, Ontario June 15, 2004

Study Context: Post 911 RealityStudy Context: Post 911 Reality
Congestion and excessive CV delays at Can/U.S. border crossings in the wake of 911 were symptomatic of more fundamental problems, and management system deficiencies, that evoked lingering concerns regarding Canada’s competitiveness vis-a-vis U.S. markets.
The extraordinary escalation in CV wait-time, or delays, was only the tip of the iceberg, more problematic was: the unpredictability of crossing times, the potential vulnerability to further disruption, the lack of consistent & reliable empirical data on Border Wait-Times (BWT),
and/or the absence of any systematic capacity to generate & transmit “real-time “ data on
wait times at Canada-U.S. border crossings.
The latter concerns, #3 in particular, prompted consideration of one particular aspect of the problem; I.e., whether truck/tractor logs were an untapped & potentially abundant source of empirical data on wait-times & delays at Canada/U.S. border crossings.
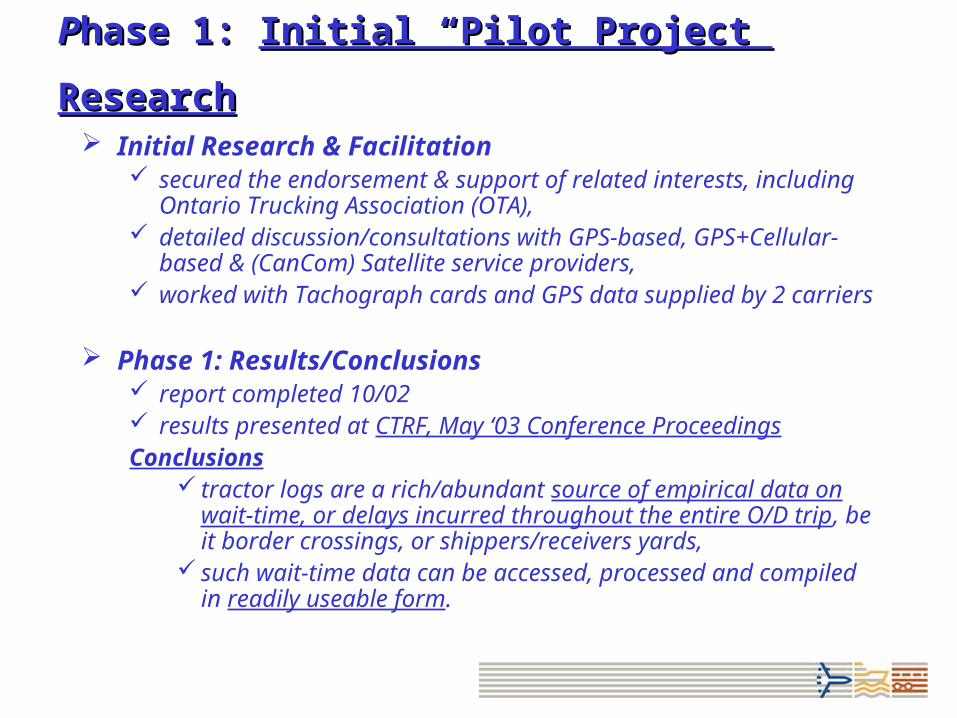
PPhase 1: hase 1: Initial “Pilot Project” ResearchInitial “Pilot Project” Research Initial Research & Facilitation
secured the endorsement & support of related interests, including Ontario Trucking Association (OTA),
detailed discussion/consultations with GPS-based, GPS+Cellular-based & (CanCom) Satellite service providers,
worked with Tachograph cards and GPS data supplied by 2 carriers
Phase 1: Results/Conclusions report completed 10/02 results presented at CTRF, May ‘03 Conference ProceedingsConclusions
tractor logs are a rich/abundant source of empirical data on wait-time, or delays incurred throughout the entire O/D trip, be it border crossings, or shippers/receivers yards,
such wait-time data can be accessed, processed and compiled in readily useable form.
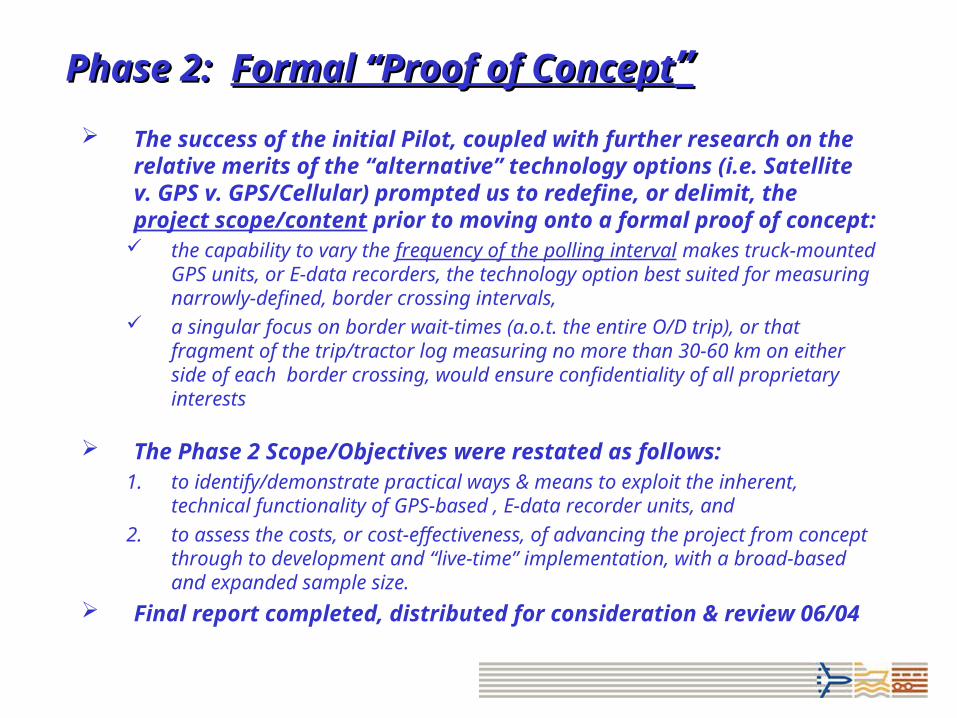
Phase 2: Phase 2: Formal “Proof of ConceptFormal “Proof of Concept””
The success of the initial Pilot, coupled with further research on the relative merits of the “alternative” technology options (i.e. Satellite v. GPS v. GPS/Cellular) prompted us to redefine, or delimit, the project scope/content prior to moving onto a formal proof of concept:
the capability to vary the frequency of the polling interval makes truck-mounted GPS units, or E-data recorders, the technology option best suited for measuring narrowly-defined, border crossing intervals,
a singular focus on border wait-times (a.o.t. the entire O/D trip), or that fragment of the trip/tractor log measuring no more than 30-60 km on either side of each border crossing, would ensure confidentiality of all proprietary interests
The Phase 2 Scope/Objectives were restated as follows:1. to identify/demonstrate practical ways & means to exploit the inherent, technical
functionality of GPS-based , E-data recorder units, and
2. to assess the costs, or cost-effectiveness, of advancing the project from concept through to development and “live-time” implementation, with a broad-based and expanded sample size.
Final report completed, distributed for consideration & review 06/04
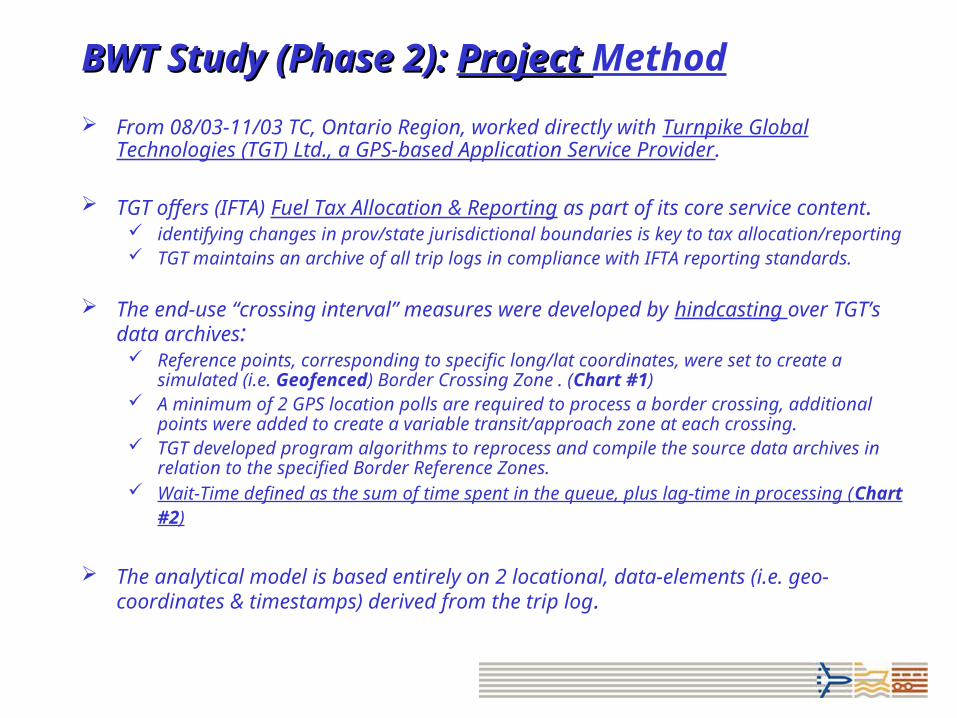
BWT Study (Phase 2): BWT Study (Phase 2): Project Project Method
From 08/03-11/03 TC, Ontario Region, worked directly with Turnpike Global Technologies (TGT) Ltd., a GPS-based Application Service Provider.
TGT offers (IFTA) Fuel Tax Allocation & Reporting as part of its core service content. identifying changes in prov/state jurisdictional boundaries is key to tax allocation/reporting TGT maintains an archive of all trip logs in compliance with IFTA reporting standards.
The end-use “crossing interval” measures were developed by hindcasting over TGT’s data archives: Reference points, corresponding to specific long/lat coordinates, were set to create a simulated
(i.e. Geofenced) Border Crossing Zone . (Chart #1) A minimum of 2 GPS location polls are required to process a border crossing, additional points
were added to create a variable transit/approach zone at each crossing. TGT developed program algorithms to reprocess and compile the source data archives in relation
to the specified Border Reference Zones.
Wait-Time defined as the sum of time spent in the queue, plus lag-time in processing (Chart #2)
The analytical model is based entirely on 2 locational, data-elements (i.e. geo-coordinates & timestamps) derived from the trip log.

Border Wait-Time Study: Border Wait-Time Study: Project MethodProject Method (Chart #1)
Start with TGT’s Data Archive @ 22k trip logs from 01/02-09/03
Designate “Border Zone” reference points
ID a border crossing: System cycles thru data, looking for change
in province/state, links point to “geocoded box” at each crossing
Points matching to recreate route Previous/Post 100 points & timestamps
found and stored for each crossing
Geofence Reference points Geocoded box set round each reference
point system “algorithm” adjusts timestamps of
points located immediately before/after reference points
Processing a Border Crossing Data filtered thru each successive stages, to
eliminate invalid crossings, system flukes,. Results of Zone Analysis stored in a final
table, then compiled by crossing Post-processing, statistical analysis can
begin.

Wait Time Schematic for U.S. Bound TrafficWait Time Schematic for U.S. Bound Traffic
Zone 3 (ON) Zone 2 (ON) Zone 1 (ON) Zone 1 (MI)
Border Crossing ZoneTransit Zone
Total Crossing Time (TCT) = Transit Zone Time + Border Crossing Zone Time Total Crossing Time (TCT) = Transit Zone Time + Border Crossing Zone Time
Border Crossing Time (BCT) = Border Crossing Zone TimeBorder Crossing Time (BCT) = Border Crossing Zone Time
Bridge Crossing
(Chart #2)

Border Wait Time Project: Border Wait Time Project: Summary HighlightsSummary Highlights The data set netted @15k crossing observations, from 01/02-09/03 (Chart #3):
not a “representative” sample, but a sound basis for (initial) empirical analysis,
The data clearly demonstrates the extent & utility of the (wait-time) interval data that can be derived from the E-tractor log, using nothing more than (2) routine by-products of the mobile tracking process: flexibility to manipulate the data by month, day of week, time of day, mimics familiar operational patterns at various crossings (Chart #4) sensitive to exogenous shifts (Orange v.Yellow) in operations (Chart #5) does not compromise proprietary interests in any material way (Chart #6)
Notwithstanding the weakness/errors in the existing data set, the results of the analysis - & corresponding lessons learned – support the conclusion that GPS-based, electronic data recorders have the inherent functionality to generate increasingly precise wait-time estimates, & also model the network linkages that exist between crossings in S. Ontario (i.e. QL\Peace; Am\BWB) bridges) initiate hi-resolution polling (i.e.400m.intervals) at crossing locations (Chart #7)
precise placement of reference points (Chart #8) more elaborate Geofencing (Chart #8)
Border Wait Time Project: Summary Highlights Border Wait Time Project: Summary Highlights (cont’d)(cont’d)
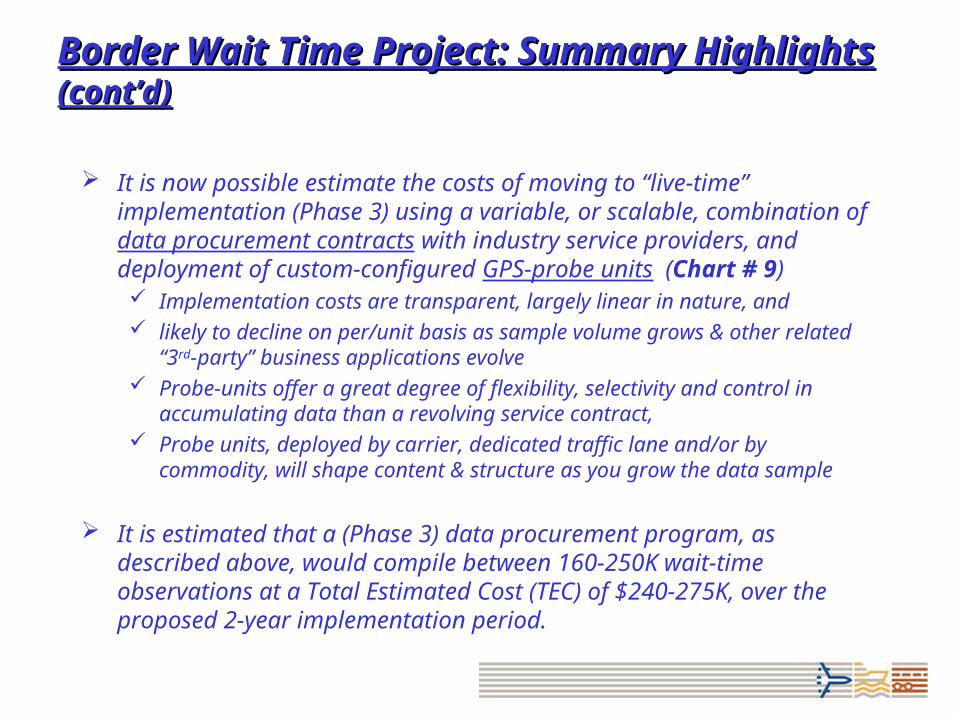
It is now possible estimate the costs of moving to “live-time” implementation (Phase 3) using a variable, or scalable, combination of data procurement contracts with industry service providers, and deployment of custom-configured GPS-probe units (Chart # 9) Implementation costs are transparent, largely linear in nature, and likely to decline on per/unit basis as sample volume grows & other related “3 rd-
party” business applications evolve Probe-units offer a great degree of flexibility, selectivity and control in
accumulating data than a revolving service contract, Probe units, deployed by carrier, dedicated traffic lane and/or by commodity, will
shape content & structure as you grow the data sample
It is estimated that a (Phase 3) data procurement program, as described above, would compile between 160-250K wait-time observations at a Total Estimated Cost (TEC) of $240-275K, over the proposed 2-year implementation period.
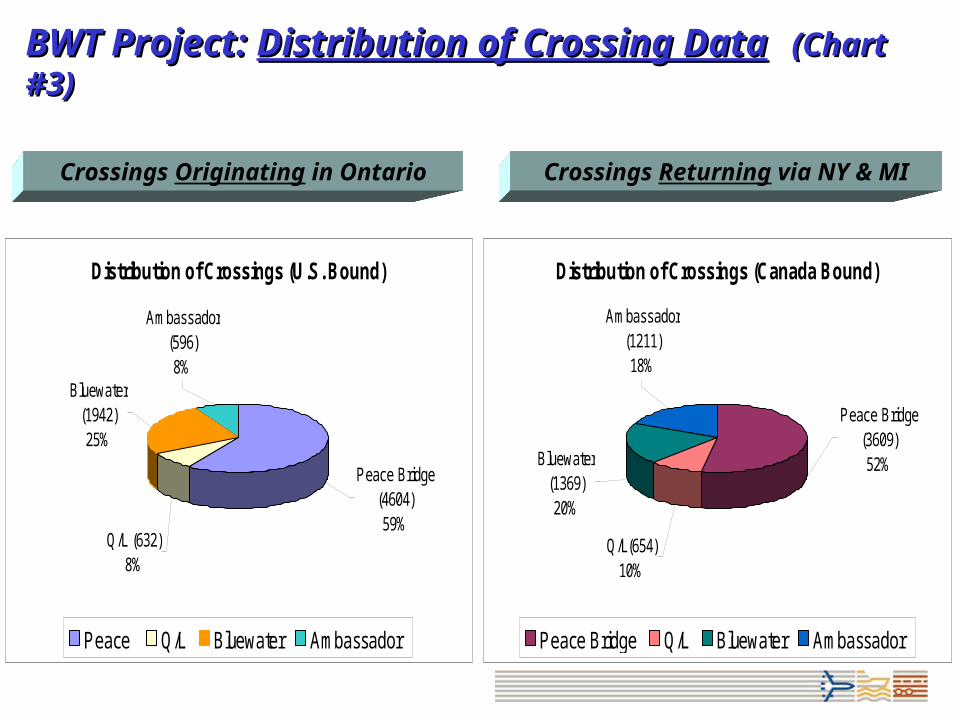
BWT Project: BWT Project: Distribution of Crossing DataDistribution of Crossing Data (Chart #3)(Chart #3)
Crossings Originating in Ontario Crossings Returning via NY & MI
Distribution of Crossings (U.S. Bound)
Ambassador (596) 8%
Bluewater (1942) 25%
Q/L (632) 8%
Peace Bridge (4604) 59%
Peace Q/L Bluewater Ambassador
Distribution of Crossings (Canada Bound)
Ambassador (1211) 18%
Bluewater (1369) 20%
Peace Bridge (3609) 52%
Q/L(654) 10%
Peace Bridge Q/L Bluewater Ambassador

BWT ProjectBWT Project: Flexibility of the Data (Chart # 4)
The TC/Turnpike data set is too small to be definitive, but this demonstration exercise has been about something more than definitive, or necessarily precise, estimates of wait-times at each crossing. The strengths of the data set are readily apparent in the flexibility it offers to manipulate the data, as well as the manner in which it replicates familiar patterns at various crossings.
Examples: The TC/Turnpike data closely replicates the peaking patterns that characterize daily operations at Peace & Ambassador Bridges. at Peace Bridge, U.S.-bound traffic builds thruout the day, reaching peak levels (circa 5-6PM) that are typically sustained well into the late evening hours. at Ambassador Bridge, peak volumes persist pretty much ‘round the clock, with any notable decreases limited to the early AM hours. in both cases, the escalation in crossing times, eflects a corresponding decrease in average speeds thruout the respective transit zones
Peace Bridge (ON) Average Crossing Times by Time of Day
0
10
20
30
40
50
60
70
0 1 2 3 4 5 6 7 8 9 10 11 12 13 14 15 16 17 18 19 20 21 22 23
Avg. TCT Avg. BCT
Ambassador Bridge (ON) Average Crossing Times by Time of Day
0
10
20
30
40
50
60
70
80
Avg. TCT Avg. BCT

BWT Project: Sensitivity of the DataBWT Project: Sensitivity of the Data (Chart #5)
The t-test was used to evaluate whether there was an notable variation in average crossing times when the Threat Advisory level was elevated from “yellow” to “orange “ alert. The Threat Advisory was elevated to alert-level Orange on four (4) separate occasions from 01/02-09/03, the times series covered by the TC/Turnpike data set.
Conclusions: all four major border crossings in S. Ont. had higher average crossing times under the “orange alert’ scenario Ambassador bridge had the highest average crossing time (66min.), with orange alert was in effect, followed by Peace bridge (61min.), Queenston/Lewiston bridge (47min.) & Bluewater bridge (31min.).the relative increase in average crossing times from “yellow” to “orange’ alert was highest for the Queenston/Lewiston & Ambassador bridges (@ 50%) and lowest for Peace bridge (< 16%)
t-Test: Two-Sample Assuming Unequal Variances
Ambassador Bridge Bluewater Bridge Peace Bridge Q/L Bridge
Orange Alert- Mean 66.49903101 31.4258658 60.65511399 47.43836806
Yellow Alert- Mean 44.80250651 24.5369849 52.36020592 31.28146766
% increase in means 48.42703274 28.07549878 15.8420081 51.65007144
Orange Alert- obs 86 308 541 121
Yellow Alert- obs 512 1634 4063 536
Df 97 366 669 108
t Stat -3.967851661 -4.052552091 -4.360306208 -4.008417932
P(T<=t) two-tail 0.000139014 6.19031E-05 1.50346E-05 0.000106096
t Critical two-tail 1.984722076 1.966468517 1.963517207 1.979765329

BWT Project: Two (2) Data Elements Only (Chart #6)
The Concept/Method as developed to this point draws on only two (2) data elements; i.e. geo-coordinates & timestamps; from the trip log. The data stream is completely agnostic and is not linked in any way to the carrier, the commodity on-board, or any other identifier.
Were the number of control data elements to include carrier type, commodity class, for example, it would be possible to differentiate crossing-time variability by carrier type or commodity class.
This would dramatically enhance the empirical value and overall utility of the interval estimates that can be derived from the trip log. Ideally, and such mechanism would link the basic location data with added sampling requirements, while preserving the anonymity of the source data
BorderID Bridge Orign
Date Time Lat’tde Long’tde Zone3 Zone2 Zone1 Border
27579 Peace ON 1/10/2002 17:57:11 42.90415 -78.89967 16:45:35 16:49:53 17:13:58 17:57:11
27580 Peace ON 1/14/2002 19:37:39 42.89137 -78.89092 18:45:53 18:50:24 19:00:00 19:37:39
27581 Peace ON 1/30/2002 20:32:21 42.90703 -78.91731 20:13:59 20:18:13 20:21:18 20:32:21
27616 Peace ON 2/11/2002 23:01:08 42.89952 -78.89584 22:45:01 22:49:22 22:54:16 23:01:08
27555 Peace ON 2/12/2002 12:54:37 42.90742 -78.91333 12:43:00 12:47:25 12:52:09 12:54:37
27603 Peace ON 2/12/2002 21:04:27 42.89925 -78.8969 20:40:14 20:44:37 20:48:17 21:04:27
27589 Peace ON 2/13/2002 15:55:35 42.90705 -78.9069 15:41:06 15:45:28 15:49:35 15:55:35
27617 Peace ON 2/13/2002 23:36:40 42.90791 -78.91231 23:19:27 23:23:50 23:28:18 23:36:40
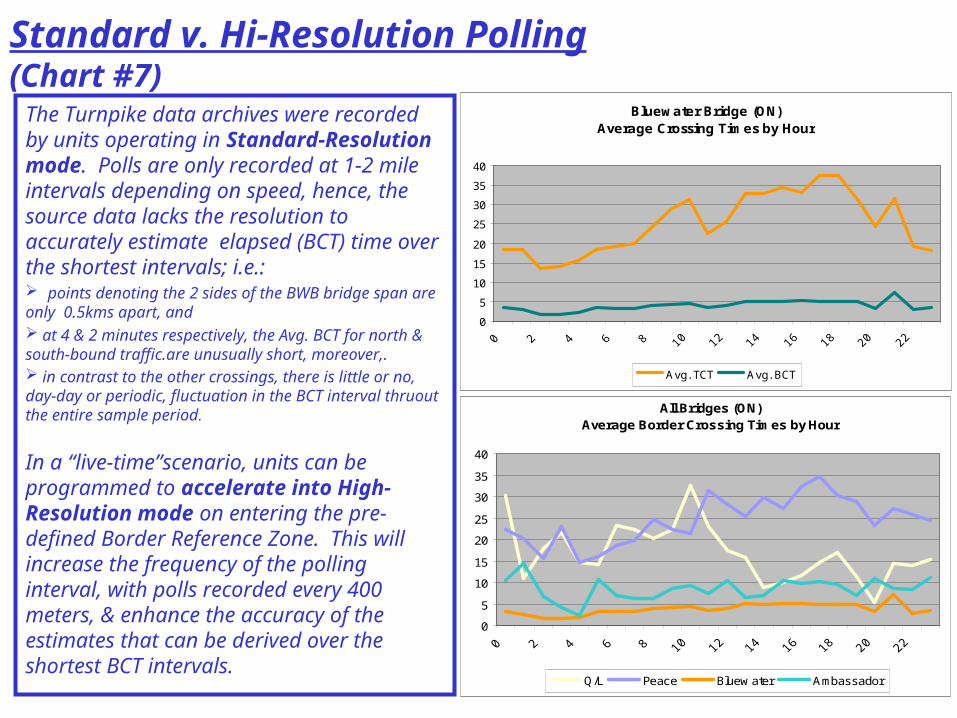
Standard v. Hi-Resolution Polling (Chart #7)
The Turnpike data archives were recorded by units operating in Standard-Resolution mode. Polls are only recorded at 1-2 mile intervals depending on speed, hence, the source data lacks the resolution to accurately estimate elapsed (BCT) time over the shortest intervals; i.e.: points denoting the 2 sides of the BWB bridge span are only 0.5kms apart, and at 4 & 2 minutes respectively, the Avg. BCT for north & south-bound traffic.are unusually short, moreover,. in contrast to the other crossings, there is little or no, day-day or periodic, fluctuation in the BCT interval thruout the entire sample period.
In a “live-time”scenario, units can be programmed to accelerate into High-Resolution mode on entering the pre-defined Border Reference Zone. This will increase the frequency of the polling interval, with polls recorded every 400 meters, & enhance the accuracy of the estimates that can be derived over the shortest BCT intervals.
Bluewater Bridge (ON) Average Crossing Times by Hour
0
5
10
15
20
25
30
35
40
Avg. TCT Avg. BCT
All Bridges (ON) Average Border Crossing Times by Hour
0
5
10
15
20
25
30
35
40
Q/L Peace Bluew ater Ambassador

Geofencing the Border Reference Zones ((Chart #8)
Geofencing the Border Reference Zone is relatively problem free, when access to a crossing is via a single linear corridor. However, errant data readings will occur when reference point are insufficient, or zone coverage is incomplete.
In retrospect, it was short-sighted to arbitrarily limit the # of reference points, or approximate the configuration of the border zones.
The GPS device has the inherent functionality to initialize multiple points in a non-linear configuration, and can be programmed to do so with relative ease. Each Reference Zone should be mapped-out, or Geofenced, with precision & detail, incorporating all the points required for complete coverage of the local network access/egress patterns
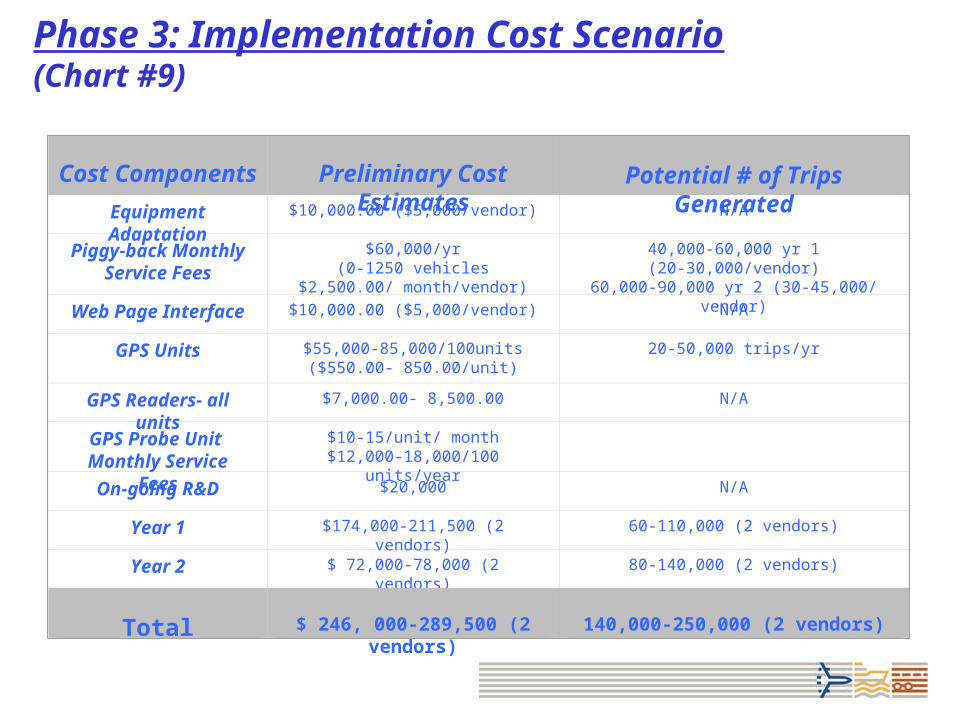
Phase 3: Implementation Cost Scenario (Chart #9)
Cost Components
Preliminary Cost Estimates Potential # of Trips Generated
Equipment Adaptation $10,000.00 ($5,000/vendor) N/A
Piggy-back Monthly Service Fees
$60,000/yr(0-1250 vehicles $2,500.00/
month/vendor)
40,000-60,000 yr 1 (20-30,000/vendor)60,000-90,000 yr 2 (30-45,000/ vendor)
Web Page Interface $10,000.00 ($5,000/vendor) N/A
GPS Units $55,000-85,000/100units ($550.00- 850.00/unit)
20-50,000 trips/yr
GPS Readers- all units $7,000.00- 8,500.00 N/A
GPS Probe Unit Monthly Service Fees
$10-15/unit/ month$12,000-18,000/100 units/year
On-going R&D $20,000 N/A
Year 1 $174,000-211,500 (2 vendors) 60-110,000 (2 vendors)
Year 2 $ 72,000-78,000 (2 vendors) 80-140,000 (2 vendors)
Total
$ 246, 000-289,500 (2 vendors)
140,000-250,000 (2 vendors)

…………. relative to Real Time measurement ?. relative to Real Time measurement ? A Real Time management solution will likely include not one but rather an
integrated set of performance measurement tools: ……. certain tools are better suited for specific purposes
Implementing a (GPS) “live-time” data procurement program would, over 1-2 years, accumulate wait-time data in sufficient volumes to establish an empirical baseline & benchmark performance standards that will compliment evolving real-time measures. ……an “early-win” opportunity
Today’s real-time measure is tomorrow’s data record, …… the initial entry in a time-series continuum.
As data begins to accumulate, a 2, 3 to 5 day (processing) turnaround time does not preclude routine publication of reports/updates, much like the system of Dashboard reports developed by FHWA to report on congested Urban corridors
If/when Reader & Repeater devices, with a rapid download capability, are installed at border crossing exits points, the current 2-5 day processing lag would be reduced to near real-time proportions
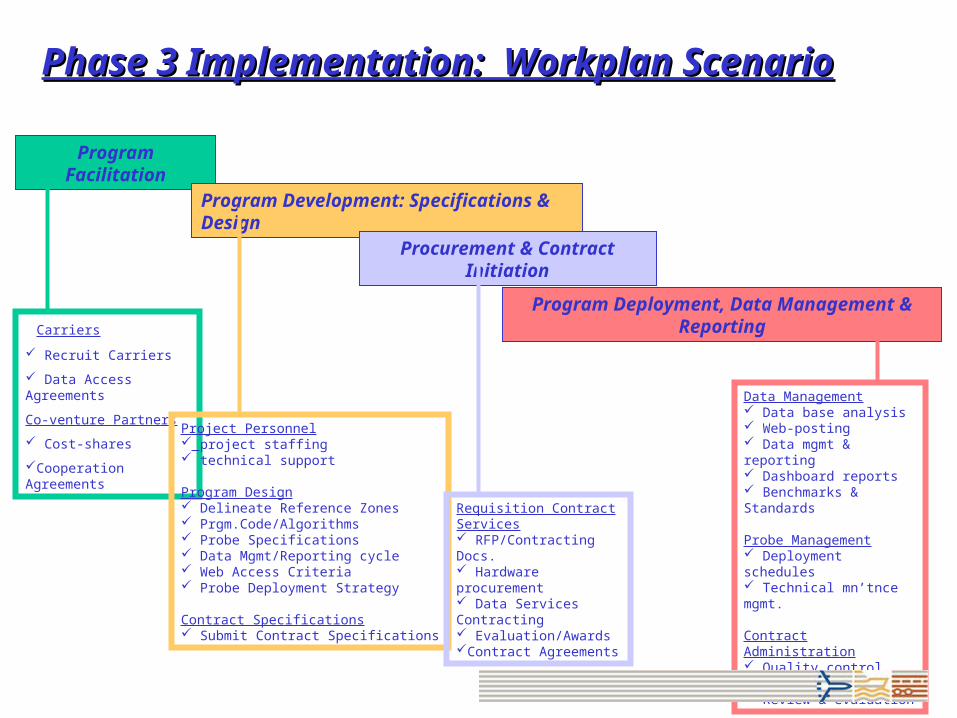
Phase 3 Implementation: Workplan ScenarioPhase 3 Implementation: Workplan Scenario
Program Facilitation
Program Development: Specifications & Design
Procurement & Contract Initiation
Program Deployment, Data Management & Reporting Carriers
Recruit Carriers
Data Access Agreements
Co-venture Partners
Cost-shares
Cooperation Agreements
Project Personnel project staffing technical support
Program Design Delineate Reference Zones Prgm.Code/Algorithms Probe Specifications Data Mgmt/Reporting cycle Web Access Criteria Probe Deployment Strategy
Contract Specifications Submit Contract Specifications
Requisition Contract Services RFP/Contracting Docs. Hardware procurement Data Services Contracting Evaluation/AwardsContract Agreements
Data Management Data base analysis Web-posting Data mgmt & reporting Dashboard reports Benchmarks & Standards
Probe Management Deployment schedules Technical mn’tnce mgmt.
Contract Administration Quality control.Mgmt. Reporting Review & evaluation

Border Wait TimesBorder Wait TimesData AnnexData Annex
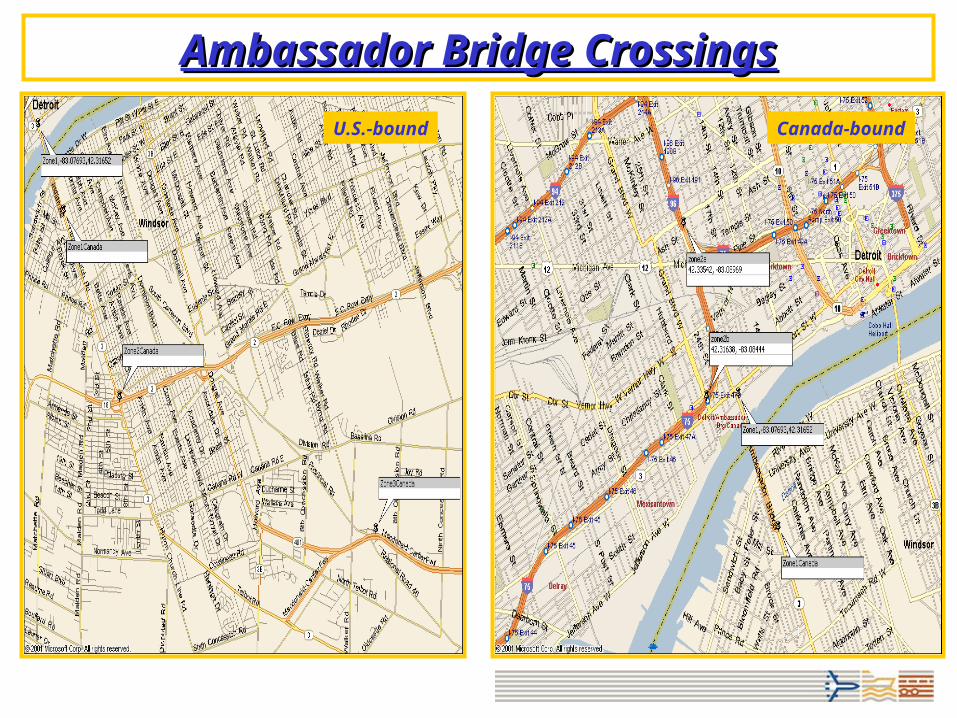
Ambassador Bridge CrossingsAmbassador Bridge Crossings
Canada-boundU.S.-bound
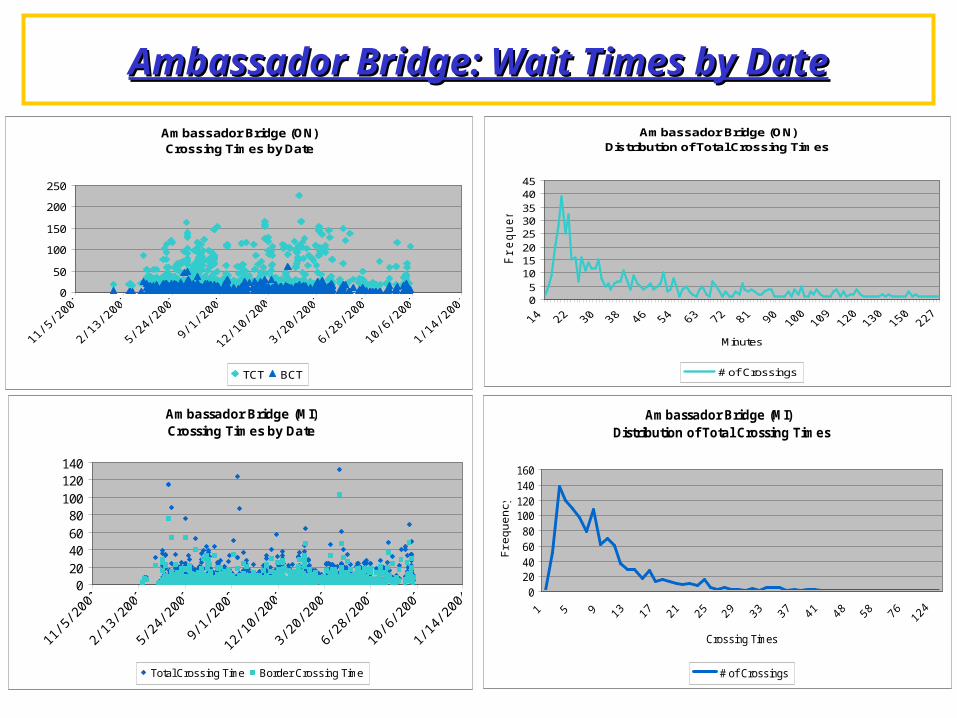
Ambassador Bridge: Wait Times by DateAmbassador Bridge: Wait Times by Date
Ambassador Bridge (MI) Distribution of Total Crossing Times
020406080
100120140160
Crossing Times
Fre
quen
cy
# of Crossings
Ambassador Bridge (MI) Crossing Times by Date
020406080
100120140
11/5
/200
1
2/13
/200
2
5/24
/200
2
9/1/
2002
12/1
0/20
02
3/20
/200
3
6/28
/200
3
10/6
/200
3
1/14
/200
4
Total Crossing Time Border Crossing Time
Ambassador Bridge (ON)Distribution of Total Crossing Times
05
1015202530354045
Minutes
Fre
quency
# of Crossings
Ambassador Bridge (ON)Crossing Times by Date
0
50
100
150
200
250
TCT BCT

Ambassador Bridge: Wait Times by Month & Weekday Ambassador Bridge: Wait Times by Month & Weekday Ambassador Bridge (ON)
Average Crossing Times by Weekday
0
10
20
30
40
50
60
70
Avg. TCT Avg. BCT
Ambassador Bridge (MI) Average Crossing Times by Month
0
5
10
15
20
25
TCT BCT
Ambassador Bridge (MI)Average Crossing Times by Weekday
0
2
4
6
8
10
12
14
TCT BCT
Ambassador Bridge (ON) Average Crossing Times by Month
0
1020
3040
50
6070
80
Avg TCt Avg. BCT
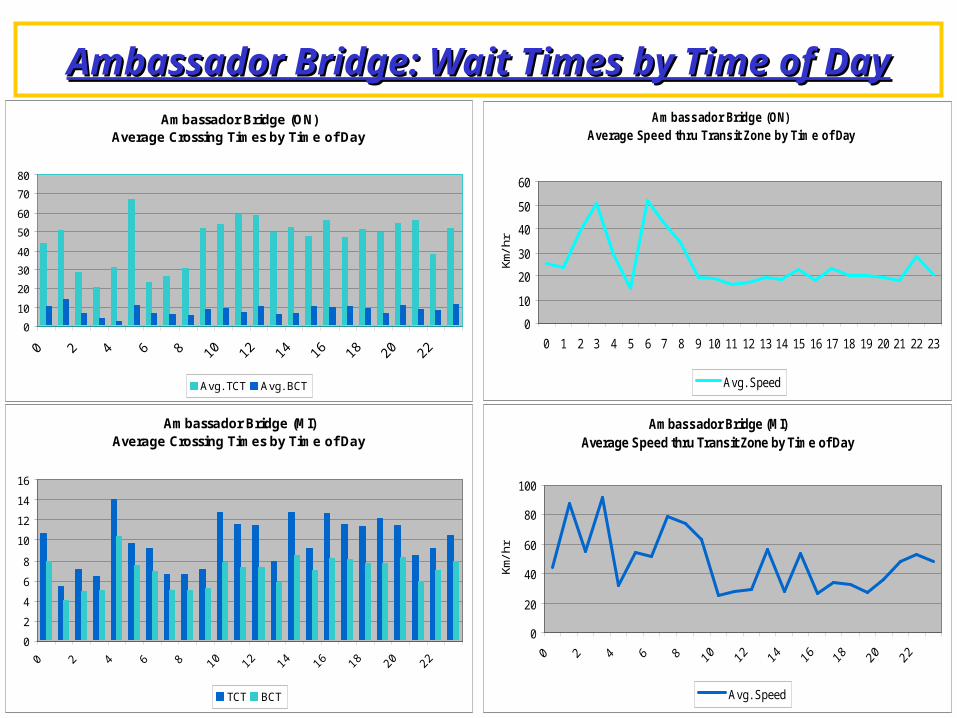
Ambassador Bridge: Wait Times by Time of DayAmbassador Bridge: Wait Times by Time of DayAmbassador Bridge (ON)
Average Crossing Times by Time of Day
0
10
20
30
40
50
60
70
80
Avg. TCT Avg. BCT
Ambassador Bridge (ON) Average Speed thru Transit Zone by Time of Day
0
10
20
30
40
50
60
0 1 2 3 4 5 6 7 8 9 10 11 12 13 14 15 16 17 18 19 20 21 22 23
Km/h
r
Avg. Speed
Ambassador Bridge (MI) Average Crossing Times by Time of Day
0
2
4
6
8
10
12
14
16
TCT BCT
Ambassador Bridge (MI) Average Speed thru Transit Zone by Time of Day
0
20
40
60
80
100
Km/h
r
Avg. Speed
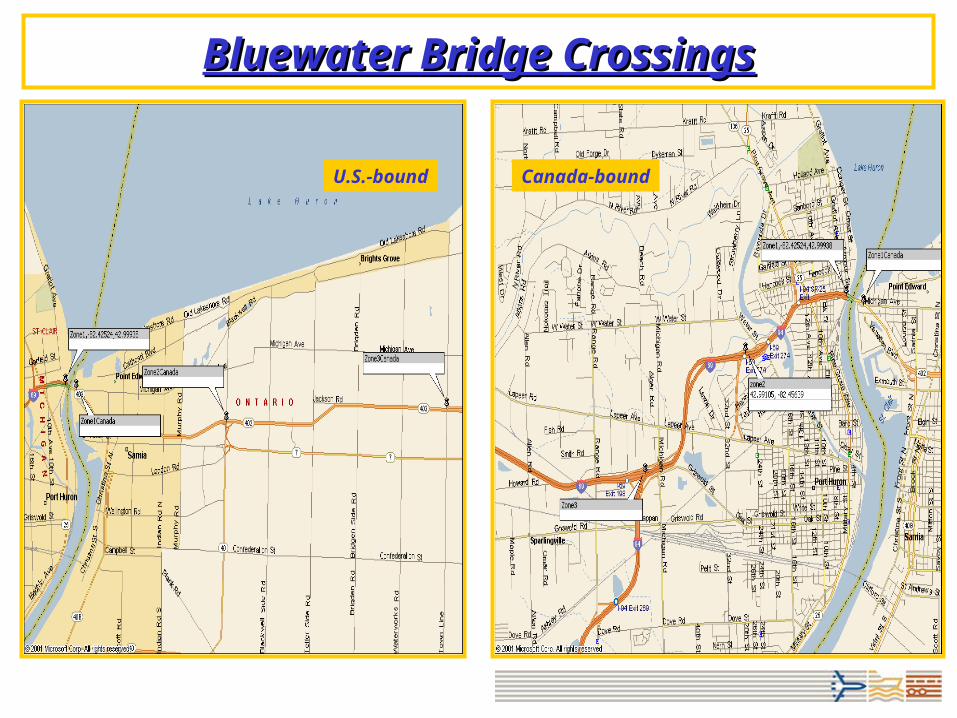
Bluewater Bridge CrossingsBluewater Bridge Crossings
Canada-boundU.S.-bound
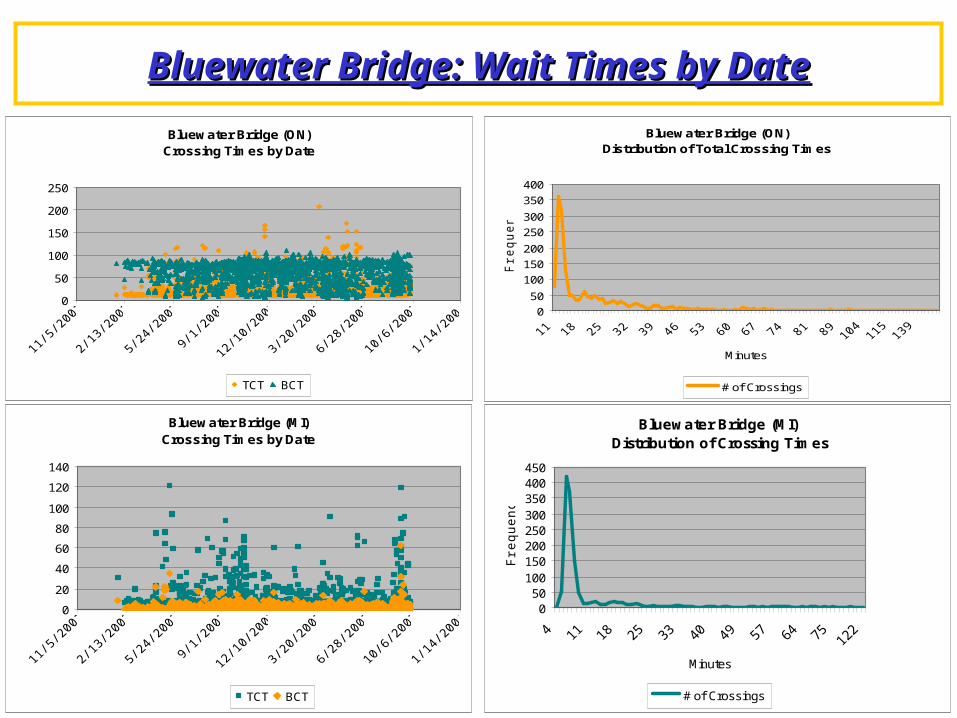
Bluewater Bridge: Wait Times by DateBluewater Bridge: Wait Times by Date
Bluewater Bridge (ON) Distribution of Total Crossing Times
0
50
100
150
200
250
300
350
400
Minutes
Fre
quency
# of Crossings
Bluewater Bridge (ON) Crossing Times by Date
0
50
100
150
200
250
TCT BCT
Bluewater Bridge (MI) Distribution of Crossing Times
050
100150200250300350400450
Minutes
Fre
quency
# of Crossings
Bluewater Bridge (MI) Crossing Times by Date
0
20
40
60
80
100
120
140
TCT BCT

Bluewater Bridge: Wait Times by Month & WeekdayBluewater Bridge: Wait Times by Month & Weekday
Bluewater Bridge (MI) Average Crossing Times by Weekday
024
68
1012
1416
TCT BCT
Bluewater Bridge (MI) Average Crossing Times by Month
0
5
10
15
20
25
30
35
TCT BCT
Bluewater Bridge (ON) Average Crossing Times by Month
0
5
10
15
20
25
30
35
40
Avg. TCT Avg. BCT
Bluewater Bridge (ON) Average Crossing Times by Weekday
0
5
10
1520
25
30
35
40
Avg. TCT Avg. BCT

Bluewater Bridge: Wait Times by Time of DayBluewater Bridge: Wait Times by Time of Day
Bluewater Bridge (ON) Average Crossing Times by Time of Day
0
5
10
15
20
25
30
35
40
Avg. TCT Avg. BCT
Bluewater Bridge (MI) Average Crossing Times by Time of Day
02
468
10
121416
1820
TCT BCT
Bluewater Bridge (MI) Average Speed thru Transit Zone by Time of Day
0
10
20
30
40
50
60
70
Km/h
r
Avg. Speed
Bluewater Bridge (ON) Average Spped thru Transit Zone by Time of Day
0
20
40
60
80
100
km/h
r
Avg. Speed
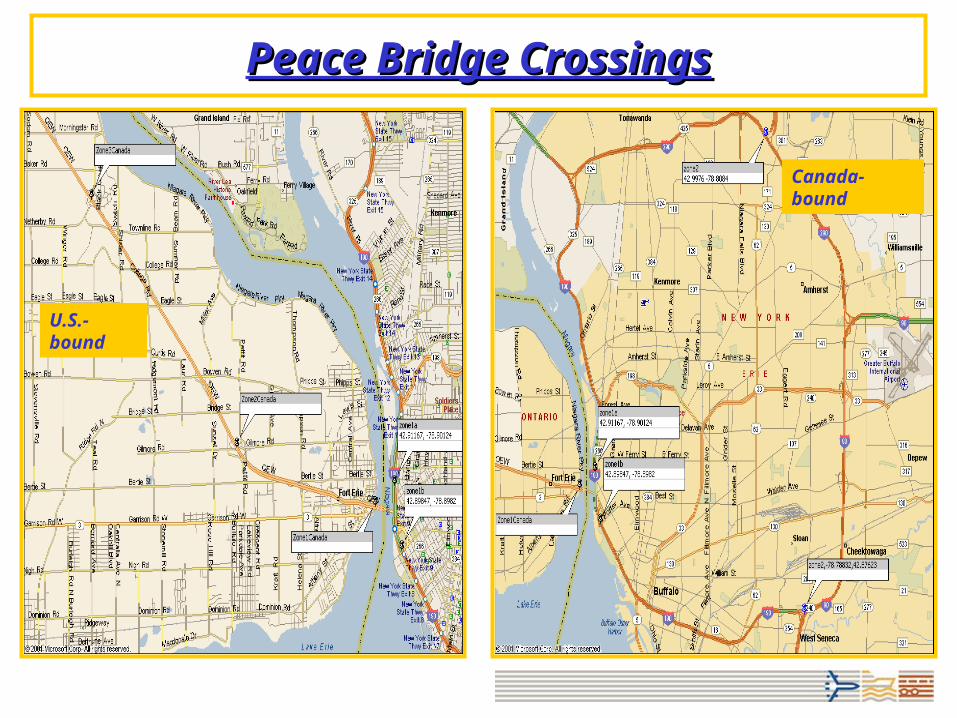
Peace Bridge CrossingsPeace Bridge Crossings
U.S.-bound
Canada-bound
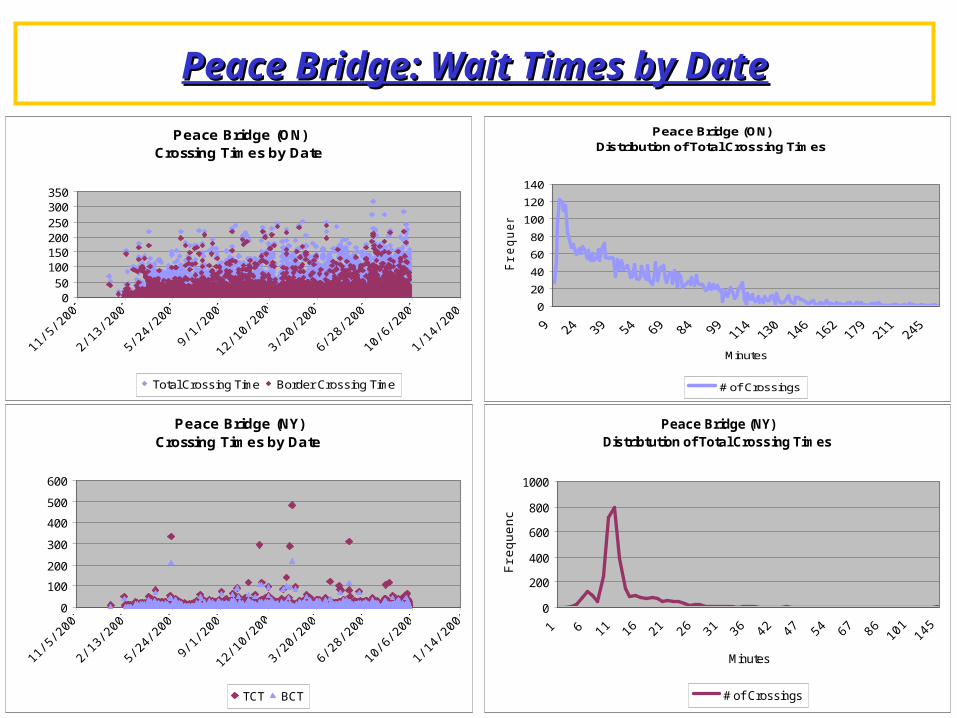
Peace Bridge: Wait Times by DatePeace Bridge: Wait Times by Date
Peace Bridge (ON) Crossing Times by Date
050
100150200250300350
Total Crossing Time Border Crossing Time
Peace Bridge (ON) Distribution of Total Crossing Times
0
20
40
60
80
100
120
140
Minutes
Fre
quency
# of Crossings
Peace Bridge (NY) Distribtution of Total Crossing Times
0
200
400
600
800
1000
Minutes
Fre
quen
cy
# of Crossings
Peace Bridge (NY) Crossing Times by Date
0
100
200
300
400
500
600
TCT BCT
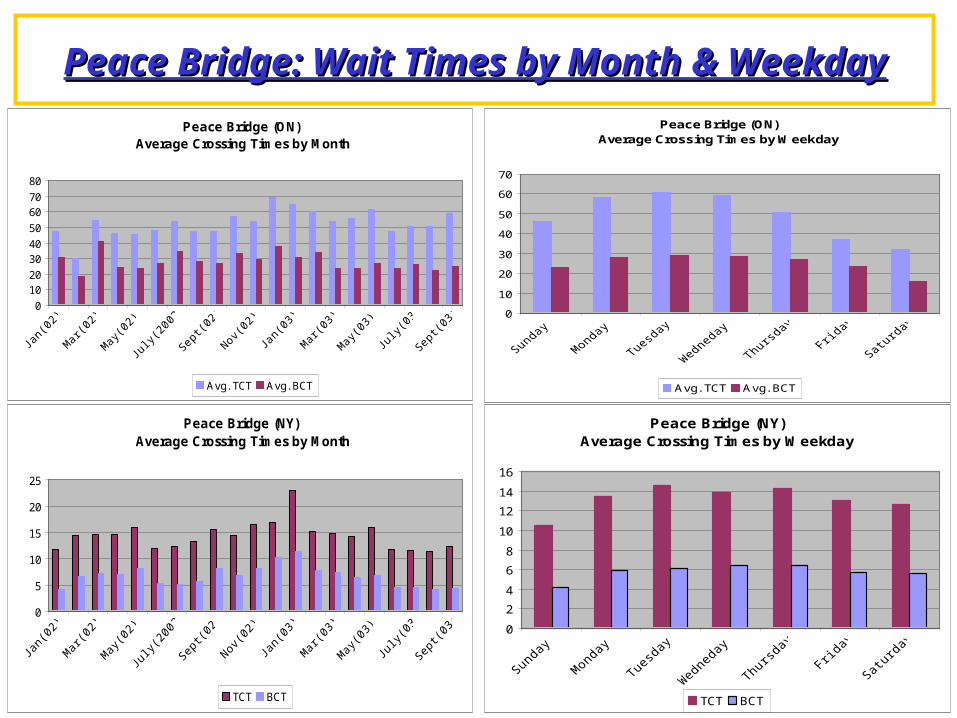
Peace Bridge: Wait Times by Month & WeekdayPeace Bridge: Wait Times by Month & Weekday
Peace Bridge (NY) Average Crossing Times by Month
0
5
10
15
20
25
TCT BCT
Peace Bridge (NY) Average Crossing Times by Weekday
0
2
4
6
8
10
12
14
16
TCT BCT
Peace Bridge (ON) Average Crossing Times by Weekday
0
10
20
30
40
50
60
70
Avg. TCT Avg. BCT
Peace Bridge (ON) Average Crossing Times by Month
0
1020
3040
50
6070
80
Jan(
02)
Mar
(02)
May
(02)
July(
2002
)
Sept(0
2)
Nov(0
2)
Jan(
03)
Mar
(03)
May
(03)
July(
03)
Sept(0
3)
Avg. TCT Avg. BCT
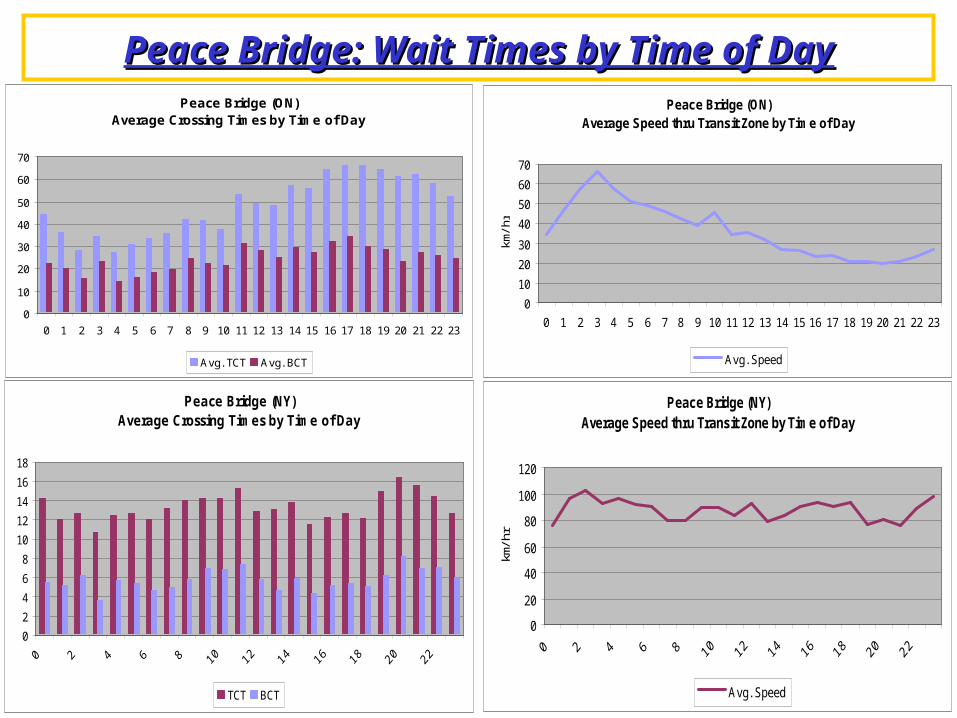
Peace Bridge: Wait Times by Time of DayPeace Bridge: Wait Times by Time of DayPeace Bridge (ON)
Average Crossing Times by Time of Day
0
10
20
30
40
50
60
70
0 1 2 3 4 5 6 7 8 9 10 11 12 13 14 15 16 17 18 19 20 21 22 23
Avg. TCT Avg. BCT
Peace Bridge (ON) Average Speed thru Transit Zone by Time of Day
0
10
20
30
40
50
60
70
0 1 2 3 4 5 6 7 8 9 10 11 12 13 14 15 16 17 18 19 20 21 22 23
km/h
r
Avg. Speed
Peace Bridge (NY)Average Crossing Times by Time of Day
0
2
4
6
8
10
12
14
16
18
TCT BCT
Peace Bridge (NY) Average Speed thru Transit Zone by Time of Day
0
20
40
60
80
100
120
km/h
r
Avg. Speed
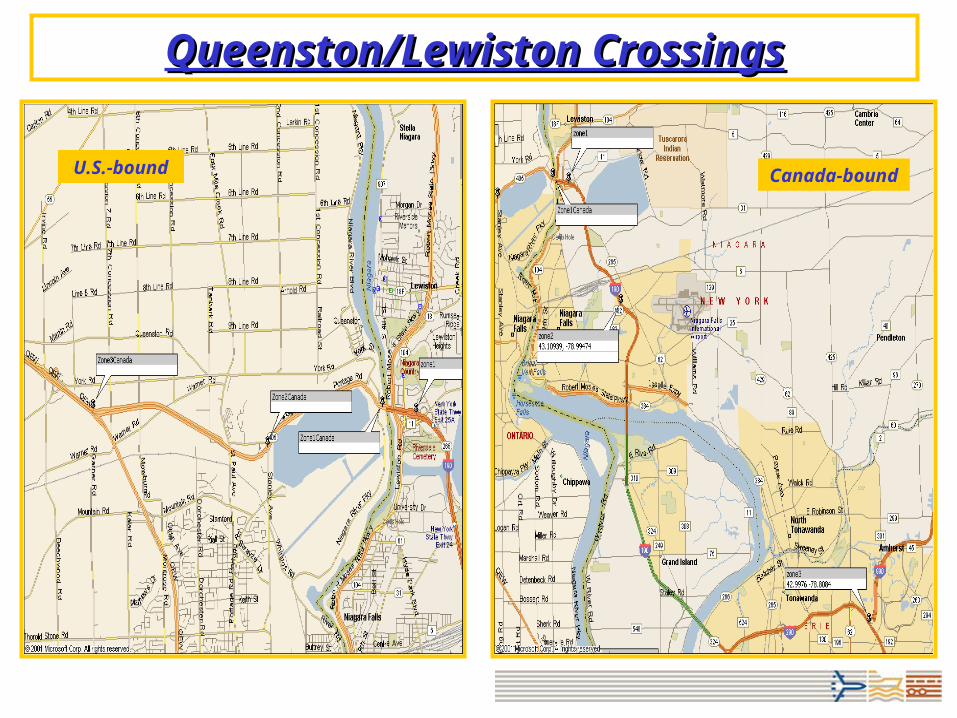
Queenston/Lewiston CrossingsQueenston/Lewiston Crossings
U.S.-bound Canada-bound

Q/L Bridge: Wait Times by DateQ/L Bridge: Wait Times by DateQueenston/Lewiston Bridge (ON)
Distribution of Total Crossing Times
0
20
40
60
80
100
Minutes
Fre
quency
# of Crossings
Queenston/Lewiston Bridge (ON) Crossing Times by Date
0
50
100
150
200
250
300
TCT BCT
Lewiston/Queenston (NY) Distribution of Total Crossing Times
0
50
100
150
200
250
Minutes
Fre
que
ncy
# of Crossings
Lewuiston Queenston Bridge (NY) Average Crossing TImes by Date
0
10
20
30
40
50
60
70
Avg. BCT Avg. TCT
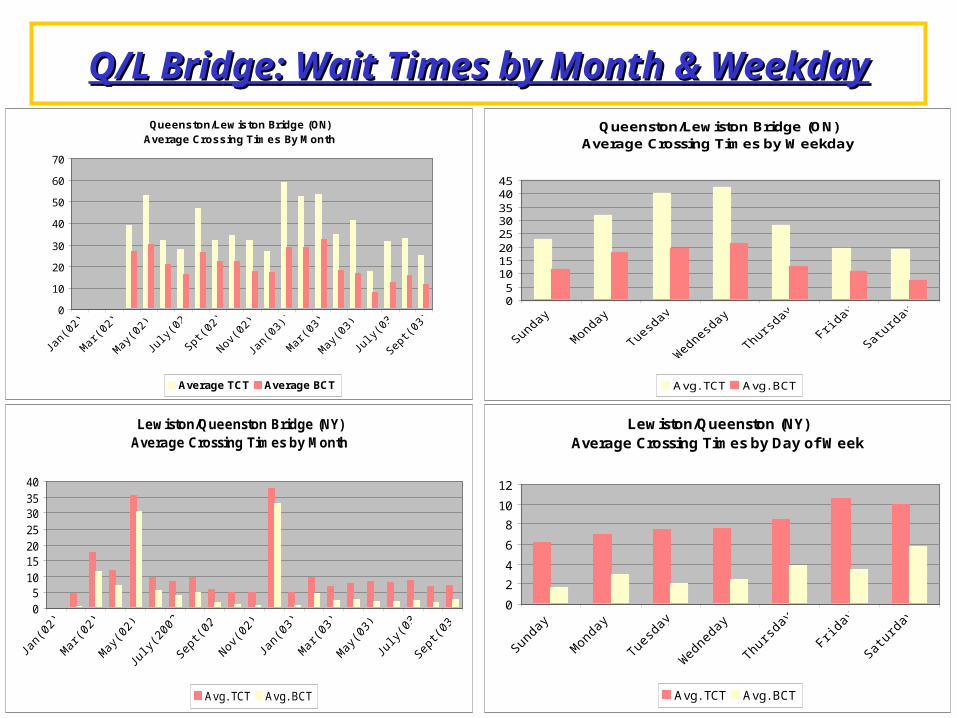
Q/L Bridge: Wait Times by Month & WeekdayQ/L Bridge: Wait Times by Month & Weekday
Lewiston/Queenston (NY) Average Crossing Times by Day of Week
0
2
4
6
8
10
12
Avg. TCT Avg. BCT
Lewiston/Queenston Bridge (NY) Average Crossing Times by Month
05
10152025303540
Avg. TCT Avg. BCT
Queenston/Lewiston Bridge (ON)Average Crossing Times By Month
0
10
20
30
40
50
60
70
Average TCT Average BCT
Queenston/Lewiston Bridge (ON) Average Crossing Times by Weekday
05
1015202530354045
Avg. TCT Avg. BCT

Q/L Bridge: Wait Times by Time of DayQ/L Bridge: Wait Times by Time of Day
Queenston/Lewiston Bridge (ON) Average Crossing Times by Time of Day
0
10
20
30
40
50
60
0 2 4 6 8 10 12 14 16 18 20 22
Avg. TCT Avg. BCT
Lewiston/Queenston Bridge (NY) Average Crossing Times by Time of Day
0
2
4
6
8
10
12
14
16
18
0 2 4 6 8 10 12 14 16 18 20 22
Avg. TCT Avg. BCT
Queenston/Lewiston Bridge (NY) Average Speed thru Transit Zone by Time of Day
0
50
100
150
200km
/hr
Avg. Speed
Queenston/Lewiston Bridge (ON)Average Speed thru Transit Zone by Time of Day
0
20
40
60
80
100
km/h
r
Avg. Speed