Transport - assets.gov.ie · 1.1.2 Planning and Development Policy 13 1.1.3 Building Back Better...
116
Transport Climate Change Sectoral Adaptaon Plan Prepared under the Naonal Adaptaon Framework Prepared by the Department of Transport, Tourism and Sport www.das.gov.ie
Transcript of Transport - assets.gov.ie · 1.1.2 Planning and Development Policy 13 1.1.3 Building Back Better...

TransportClimate Change Sectoral Adaptation Plan Prepared under the National Adaptation Framework
Prepared by the Department of Transport, Tourism and Sport
www.dttas.gov.ie

w

1
Transport Sector | Climate Change Sectoral Adaptation Plan
Table of Contents
Foreword by the Minister 3
Preface 4
List of Tables and Figures 6
1 Introduction 9
1.1 Strategic Policy Focus 10
1.1.1 International Policy Context 11
1.1.2 Planning and Development Policy 13
1.1.3 Building Back Better Principles 13
1.1.4 Emergency Planning Policy 14
1.2 Methodology 14
1.3 Strategic Environmental Assessment and Appropriate Assessment 16
2 TransportSystemCharacteristics 17
2.1. Current Sectoral Profile 18
2.2 Key Transport Infrastructure Networks 19
2.2.1 Land Transport – Roads 19
2.2.2 Land Transport – Buses 20
2.2.3 Land Transport – Heavy Rail 22
2.2.4 Land Transport – Light Rail 22
2.2.5 Aviation – Airport Infrastructure 22
2.2.6 Maritime Transport – Port and Vessel Infrastructure 24
2.3 Future Sectoral Profile 26
2.3.1 Project Ireland 2040 26
2.3.2 Transboundary Interdependencies – Trade and Tourism 28
2.3.3 Critical Infrastructure Networks 29
2.3.4 Broader Cross-Sectoral Interdependencies 33
2.3.5 Tourism and Sport 34
2.4 Establishing the Sectoral Adaptation Team 36
w
2
Transport Sector | Climate Change Sectoral Adaptation Plan
3 Climate Impact Screening for the Transport Sector 38
3.1 Observed and Projected Climate Impacts for Ireland to 2050 39
3.2 Managing Climate Uncertainty and Projected Climate Scenarios 41
3.3 Identifying Climate Impacts and Sectoral Vulnerabilities 42
3.4 Prioritising Sectoral Risks 42
3.4.1 High Climate Risk 45
3.4.2 Moderate Climate Risk 53
4 Priority Impact Assessment 62
4.1 Future-Proofing Transport: A Thresholds Analysis Approach 63
4.1.1 Thresholds Analysis for the Transport Sector 64
4.2. Geospatial and Temporal Distribution of Transport Risks 65
4.2.1 High Priority Climate Impact: Precipitation 66
4.2.2 High Priority Climate Impact: High Winds 71
4.2.3 High Priority Climate Impact: Sea Level Rise (SLR) 74
4.2.4 Moderate Priority Climate Impact: High Temperatures 75
4.2.5 Moderate Priority Climate Impact: Low Temperatures 78
4.3 Assessing Transport System Resilience 80
5 AdaptationActionPlan 83
5.1 Transport Adaptation Goals and Objectives 84
5.2 Developing Robust Adaptation Pathways 84
5.2.1 Proposed Adaptation Actions under Implementation Objective No. 1 85
5.2.2 Proposed Adaptation Actions under Implementation Objective No. 2 87
5.2.3 Proposed Adaptation Actions under Implementation Objective No. 3 89
5.2.4 Mitigation Co-Benefits 91
6 ImplementationandGovernance 92
6.1 Implementation Timeframes 93
6.2 Monitoring and Reporting 93
6.2.1 Monitoring Indicators 94
6.3 Evaluation and Review 94
References 95
Appendices 98

3
Transport Sector | Climate Change Sectoral Adaptation Plan
Foreword by the Minister
Adaptingtoourchangingclimaterepresentsaconsiderablechallenge-andpresentssignificantopportunitiesfortheIrish Transport Sector.
No one can doubt the scale of transformation needed across Government and society to tackle climate disruption. The publication this year of the Climate Action Plan has underscored our national commitment to mitigating carbon emissions, but we cannot neglect to take action to protect our critical infrastructure from the inevitable impacts of climate change.
Climate change poses significant challenges to the transport sector; in the last two years alone, we have faced an unprecedented level of destruction to infrastructure and disruption to services caused by multiple extreme weather events such as Storm Ophelia in 2017, Storm Emma in 2018, and last summer’s record-breaking heat-wave to name but a few. Ireland will continue to experience extremes of cold and heat, heavy rainfall, rising sea levels and very intense storms and winds. It is apparent that adaptation action is essential to ensure that the transport sector continues to fulfil its economic, social and environmental objectives in the years to come
This Plan is the first Sectoral Adaptation Plan for transport to be developed under the provisions of the Climate Action and Low Carbon Development Act, 2015, the National Adaptation Framework and in line with the planning process set out in the Sectoral Planning Guidelines for Climate Change Adaptation. It builds upon Developing Resilience to Climate Change in the Irish Transport Sector which was published in 2017. The Plan sets out the priority climate concerns for the transport sector, presents the links between climate impacts and risks to infrastructure, outlines the next steps required to close our knowledge gaps and complete a robust assessment of sectoral adaptive capacity. We have collaborated closely with other sectors and local authorities in preparing this Plan to consider potential synergies and conflicts as part of a holistic, all-of-Government approach.
Of course, climate adaptation planning is an iterative process and this Plan does not represent a complete roadmap to future-proofing the sector. Adaptation planning will continue to be informed by the latest scientific evidence and actions may need to be modified or escalated as appropriate. Nevertheless, the suite of measures set out in this statutory Adaptation Plan go a considerable way towards building a climate resilient future for the transport sector and safeguarding our most critical infrastructure.
Shane Ross, T.D.Minister for Transport, Tourism and Sport

4
Transport Sector | Climate Change Sectoral Adaptation Plan
Preface
Ireland’s first statutory National Adaptation Framework (NAF), prepared under Section 5 of the Climate Action and Low Carbon Development Act, 2015 (The Climate Act), was approved by Government on 19 December 2017 and was subsequently published and laid before both Houses of the Oireachtas, in line with the Climate Act, on 19 January 2018. The NAF and its successors set out the context to ensure local authorities, regions and key sectors can as-sess the key risks and vulnerabilities of climate change, implement climate resilience actions and ensure climate adaptation considerations are mainstreamed into all local, regional and national policy making. The NAF does not identify specific locations or propose adaptation measures or projects in individual sectors. Respecting the principle of subsidiarity, detailed adaptation measures will be developed across sectors and local government, in accordance with the NAF. The NAF identifies twelve key sectors under the remit of seven Government Ministers where sectoral adaptation Plans are to be prepared. This includes a Plan covering the transport sector, to be prepared by the Minister for Transport, Tourism and Sport.
A precedent adaptation Plan Developing Resilience to Climate Change in the Irish Transport Sec-tor was published in November 2017 in the context of the non-statutory National Climate Change Adaptation Framework. This was a high-level Plan which outlined initial research and analysis on the likely effects of climate change on the transport sector and possible sectoral actions to commence developing resilience to climate change.
In order to support Government Departments in developing Sectoral Plans the Department of Communications, Climate Action and Environment also developed Sectoral Planning Guide-lines for Climate Change Adaptation. The guidelines aim to ensure that a coherent and consis-tent approach to adaptation planning is adopted at national level. Under the NAF, Govern-ment Departments are required to develop their Plans in line with this guidance. A working group, led by DTTAS and involving key transport stakeholders was established at the outset of this process to scope out and develop this draft Plan in line with the Guidelines.
The process of climate adaptation evolves over time in response to ongoing assessments of impacts and vulnerabilities. Adaptation planning is therefore an iterative process, where Plans and actions can be modified and changed as new information and research becomes available. This is the first sectoral Adaptation Plan for transport to be developed under the provisions of the Climate Act, the National Adaptation Framework and in line with the planning process set out in the Sectoral Planning Guidelines for Climate Change Adaptation.
This Plan has also been developed in line with the statutory consultation processes required under Sections 5 and 6 of the Climate Act. A draft Plan was published on Monday, 15th July 2019 for the purpose of public consultation for a period of four (4) calendar weeks. The dead-line for receipt of submissions was Monday, 12th August 2019. Some twenty-one (21) sub-missions were received in response to the public consultation. Respondents included State bodies; academia; industry interest groups; private individuals; and elected representatives, amongst others. Representations received as part of these consultation processes have been considered before finalising the plan and are published with the submissions received along-
5
Transport Sector | Climate Change Sectoral Adaptation Plan
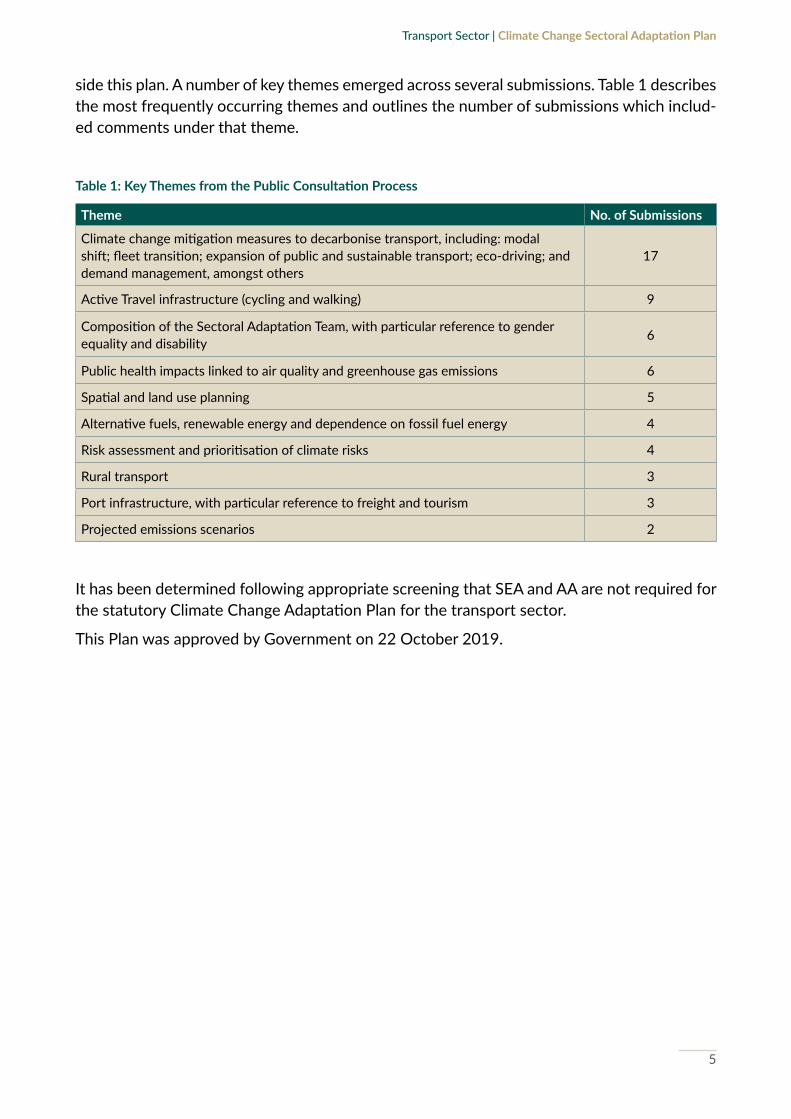
side this plan. A number of key themes emerged across several submissions. Table 1 describes the most frequently occurring themes and outlines the number of submissions which includ-ed comments under that theme.
Table1:KeyThemesfromthePublicConsultationProcess
Theme No. of Submissions
Climate change mitigation measures to decarbonise transport, including: modal shift; fleet transition; expansion of public and sustainable transport; eco-driving; and demand management, amongst others
17
Active Travel infrastructure (cycling and walking) 9
Composition of the Sectoral Adaptation Team, with particular reference to gender equality and disability 6
Public health impacts linked to air quality and greenhouse gas emissions 6
Spatial and land use planning 5
Alternative fuels, renewable energy and dependence on fossil fuel energy 4
Risk assessment and prioritisation of climate risks 4
Rural transport 3
Port infrastructure, with particular reference to freight and tourism 3
Projected emissions scenarios 2
It has been determined following appropriate screening that SEA and AA are not required for the statutory Climate Change Adaptation Plan for the transport sector.
This Plan was approved by Government on 22 October 2019.

6
Transport Sector | Climate Change Sectoral Adaptation Plan
List of Tables and Figures
Tables
Table 2.1 National Policy Objectives relating to Climate Change Adaptation in the NPF
Table 2.2 Sectors and Lead Departments in the NAF
Table 2.3 Planning Team Stakeholders for the Statutory Adaptation Plan
Table 3.1 Summary of the observed and projected impacts of climate variables for Ireland
Table 3.2 Priority Impact Chains for the Transport Sector
Table 4.1 Aggregated and anonymised data collected from 5 service operators/infrastructure providers following Storm Ali, September 2018
Table 5.1 Mitigation Co-Benefits
Table 6.1 Summary of Governance Processes for the Statutory Sectoral Adaptation Plan
List of Figures
Figure 1.1 National-level Climate Policy Hierarchy
Figure 1.2 Schematic Diagram of the Sectoral Adaptation Guidelines’ Planning Cycle
Figure 1.3 Flights grounded at Cork Airport in blizzard conditions during Storm Emma, March 2018
Figure 2.1 Distribution of Journeys by Purpose
Figure 2.2 Primary and Secondary Road Network Map
Figure 2.3 National Heavy Rail Network Map
Figure 2.4 Luas Light Rail Network Map
Figure 2.5 GDA Transport (Train and Tram) Network Map
Figure 2.6 State and Regional Airports in Ireland, 2019
Figure 2.7 Tier 1 and Tier 2 Ports in Ireland, 2019
Figure 2.8 Freight traffic on the M50 can experience costly delays due to extreme weather
Figure 2.9 Ireland’s TEN-T Core and Comprehensive Road Networks
Figure 2.10 Ireland’s current and proposed EV recharging network
Figure 2.11 Proposed CNG Stations under the Causeway Project
Figure 2.12 Surfer in Coleraine, NI during Storm Barbara, December 2016
Figure 3.1 Cyclist commuting in inclement conditions in Rathcoole, Co. Dublin during Storm Freya, March 2019
Figure 3.2 Process of Determining Sectoral Vulnerability in Climate Impact Screening

7
Transport Sector | Climate Change Sectoral Adaptation Plan
Figure 3.3 Damage to the R328 Derry to Moville Road in Co. Donegal caused by pluvial flooding during ex-Hurricane Gert, August 2017
Figure 3.4 A rainfall radar image from Met Éireann from 20 August 2017, showing a band of precipitation tracking in a north-easterly direction across Ireland during ex-Hurricane Gert
Figure 3.5 Tropical-storm-force wind speed probability (5 day forecast) provided by the U.S. National Hurricane Centre on 13 October 2017
Figure 3.6 Felled trees block Centre Park Road in Cork City after Storm Ophelia, October 2017
Figure 3.7 School transport services impacted by storm surge in Garretstown, Co. Cork during Storm Callum, October 2018
Figure 3.8 Pedestrian in inclement conditions in Salthill, Co. Galway, during Storm Callum, October 2018
Figure 3.9 Gorse fires in a period of high temperatures, Wicklow, July 2018. DART services were cancelled due to fire damage sustained to electrical and telecommunications networks
Figure 3.10 Complimentary bottles of water provided to Irish Rail customers during the heat wave, July 2018
Figure 3.11 Snow depths recorded at Met Éireann climate and synoptic stations between 28th February and 3rd March 2018
Figure 3.12 Heavy snowfall forced activities to cease at the Port of Cork during Storm Emma, February-March 2018
Figure 3.13 Tidal surge flooding exacerbated by SLR at Salthill and Monkstown DART station in Dún Laoghaire-Rathdown, Co. Dublin, February 2018
Figure 3.14 The Eastern rail line is subject to erosion as it traverses the Breaches River at Kilcoole, Co. Wicklow
Figure 4.1 Disruptions to infrastructure and transport services can cause knock-on impacts to public and private travel and commercial activity
Figure 4.2 Summary of projected high-priority climate impacts and associated risks for the transport sector to mid-century
Figure 4.3 Summary of projected moderate-priority climate impacts and associated risks for the transport sector to mid-century
Figure 4.4 Projected changes (%) in seasonal precipitation. (a) medium- to low-emission scenario; (b) high-emission scenario. In each case, the future period 2041–2060 is compared with the past period 1981–2000
Figure 4.5 Seasonal projected changes (%) in the standard deviation of daily precipitation. (a) medium to low-emission ensemble; (b) high-emission ensemble. In each case, the future period 2041–2060 is compared with the past period 1981–2000
Figure 4.6 Tracks of storms with a core mean sea level pressure of less than 940 hPa (hectopascals) and with a lifetime of at least 12 hours: (a) Past RCM simulations for 1981–2000; (b) climate prediction simulations for 2041-2060, based on RCP8.5 scenario
Figure 4.7 Seasonal projected changes (%) in the standard deviation of daily mean 60-m wind speed. (a) Medium- to low-emission ensemble; (b) high-emission ensemble. In each case, the future period 2041–2060 is compared with the past period 1981–2000

8
Transport Sector | Climate Change Sectoral Adaptation Plan
Figure 4.8 Projected change in relative sea level in 2081-2100 compared to 1986-2005 for the medium-low emission scenario RCP4.5 based on an ensemble of global climate models. Projections consider land movement due to glacial isostatic adjustment but not land subsidence due to human activities
Figure 4.9 The “very likely” seasonal increase in temperature for the (a) medium- to low-emission and (b) high-emission scenarios. In each case, the future period 2041–2060 is compared with the past period 1981–2000
Figure 4.10 The “likely” annual increase in temperature for the (a) medium- to low-emission and (b) high-emission scenarios. In each case, the future period 2041–2060 is compared with the past period 1981– 2000
Figure 4.11 Projected percentage change in annual number of frost days for the (a) medium- to low-emission and (b) high-emission scenarios. In each case, the future period 2041–2060 is compared with the past period 1981–2000
Figure 4.12 Projected percentage change in annual number of ice days for the (a) medium- to low-emission and (b) high-emission scenarios. In each case, the future period 2041–2060 is compared with the past period 1981–2000
Figure 4.13 Train damaged by falling branches during Storm Ali, September 2018

9
Transport Sector | Climate Change Sectoral Adaptation Plan
1 Introduction

10
Transport Sector | Climate Change Sectoral Adaptation Plan
Ireland’s climate is undergoing unequivocal change; scientific observations show a rise in sea level on Irish coasts, increases in annual average temperatures, changes in precipitation patterns and increasing incidences of extreme weather events1. The observed scale and rate of change in Ireland’s climate is consistent with climatic trends on a regional and global level2. Notwithstanding a degree of uncertainty about the level and extent of the likely impacts, these changes are projected to continue and to intensify over the coming decades. Notably, a recent Special Report by the Intergovernmental Panel on Climate Change3 (IPCC) indicates significant impacts are set to occur even if global warming is limited to 1.5oC over preindustrial levels, which are below business-as-usual global average temperature increases by mid-century. If greenhouse gas emissions were to completely cease from today, global climate change would continue for many decades as a result of the delayed impacts of past and current carbon emissions.
Transport is a derived demand which is essential to the functioning of a modern economy and a key enabler of all other economic activities; however, changing weather patterns and violent weather extremes associated with climate change can cause infrastructural damage and deterioration, disruptions to transport operations and unsafe travel conditions. Such disruptions to private, public and commercial travel can have significant negative impacts to Ireland’s economy, society, environment and public health. The transport sector must therefore put in place adaptation measures to address the unavoidable consequences and associated costs of climate change, as well as maximising any potential opportunities, by facilitating the development of climate resilience within key transport networks, infrastructure and services.
Adaptation measures should enable continued services and maintained infrastructure as well as safeguarding new assets from longer term impacts by ensuring that current design specifications will adequately address future infrastructure needs. Correspondingly, building long-term climate resilience should not hinder economic growth and social progress or Ireland’s ongoing mitigation efforts to decarbonise the transport sector.
1.1 Strategic Policy FocusIreland’s national policy in response to the challenge of climate change include the National Policy Position on Climate Action and Low Carbon Development4 as well as the Climate Action and Low Carbon Development Act 20155. The National Policy Position established the central objective of achieving a transition to a low carbon and climate-resilient economy by 2050. The Climate Action and Low Carbon Development Act 2015 provided the statutory basis for this national transition objective, including the development of a National Mitigation Plan6, a National Adaptation Framework7 (NAF) and the associated preparation of statutory Sectoral Adaptation Plans under the aegis of the Framework by relevant sectoral Ministers and local authorities (LAs).
This sectoral adaptation plan for the transport sector will build upon the considerable knowledge base set out in Developing Resilience to Climate Change in the Irish Transport Sector8 (2017). This was the first step in adaptation planning for the transport sector prepared under the non-statutory 2012 National Climate Change Adaptation Framework9 (NCCAF). The plan indicated the likely climate impacts for Ireland and the risks posed to transport infrastructure, as well as highlighting adaptation measures undertaken by transport stakeholders.

11
Transport Sector | Climate Change Sectoral Adaptation Plan
Figure1.1:National-levelclimatepolicyhierarchy.
Climate Action & Low Carbon
Development Act (2015)
National Adaptation Framework
(2018)
National Mitigation Plan
(2017)
Sectoral and LA
Adaptation Plans (2019)
1.1.1 InternationalPolicyContext
The international policy context for climate resilience is informed by the adoption of the Paris Agreement in December 2015 at COP21 by the United Nations Framework Convention on Climate Change (UNFCCC). Ireland ratified the Agreement on 4 November 2016 and is legally bound to fulfil the commitments made in Paris. Article 7.1 of the Agreement establishes a goal of “enhancing adaptive capacity, strengthening resilience and reducing vulnerability to climate change”10. Notably, the Agreement recognises the role of both adaptation and mitigation measures in achieving this goal; acknowledging that greater levels of mitigation can reduce the need for additional adaptation efforts and that progress towards the temperature goal of well below 2°C and pursuing 1.5°C will determine the potential for adaptation and the costs of adaptation11.
Ireland’s climate resilience ambitions are also aligned with the United Nations’ Sustainable Development Goals12 (SDGs), which set out a series of goals and targets to ensure sustainable global development by 2030 as part of Transforming Our World: the 2030 Agenda for Sustainable Development. There are 17 SDGs in total with 169 associated targets to ensure that the goals are achieved by 2030. Goal 13 on climate change addresses resilience directly. Target 13.1 is to “Strengthen resilience and adaptive capacity to climate-related hazards and natural disasters in all countries”. Resilience is also part of Goal 9 on building resilient infrastructure and of Goal 11 on inclusive, safe, resilient and sustainable cities. The Minister for Communications, Climate Action and Environment has lead responsibility for the promotion and oversight of SDGs across government; however due to the wide ranging scope of the targets under each goal, every Government Department will to a greater or lesser extent have a level of responsibility in contributing to Ireland’s implementation of the Goals. In this Plan pertinent

12
Transport Sector | Climate Change Sectoral Adaptation Plan
SDGs are aligned with corresponding actions, highlighting the interdependencies across sectors and the required whole-of-government approach to their implementation. Of equal importance, the Sendai Framework for Disaster Risk Reduction13, adopted in 2015, recognises climate change and variability as key drivers of disaster risk and sets out goals and priorities for reducing disaster risk and enhancing disaster preparedness by building resilience.
Box 1.1: Definition of Climate ResilienceThe National Adaptation Framework (2018) defines climate resilience as “…the capacity of a system, whether physical, social or ecological, to absorb and respond to climate change and by implementing effective adaptation planning and sustainable development (including governance and institutional design) to reduce the negative climate impacts while also taking advantage of any positive outcomes” 7. This will allow the system to either return to its previous state or to adapt to a new state as quickly as possible.
An increasing understanding of climate interdependenices is also recognised within legislation at the European level. An overarching policy to build resilience to the impacts of climate change is being led by the European Union (EU) Commission through the EU Strategy on Adaptation to Climate Change14, which was adopted in April 2013. The Strategy supports action by promoting greater co-ordination and information-sharing between Member States with the aim of ensuring that adaptation considerations are addressed in all relevant EU policies. It sets out a framework and mechanisms for developing preparedness in respect of current and future climate impacts across the EU. In November 2018, the Commission published an evaluation of the EU Adaptation Strategy which emphasized that EU policy must seek to create synergies between climate change adaptation, climate change mitigation, disaster risk reduction efforts and sustainable development to avoid future damage and provide for long-term economic and social welfare in Europe and in partner countries15.
Box 1.2: Definition of Adaptation and MitigationThe Climate Action and Low Carbon Development Act, 2015 defines climate change adaptation as “[…] any adjustment to
- (a) any system designed or operated by human beings, including an economic, agricultural or technological system, or
- (b) any naturally occurring system, including an ecosystem,
that is intended to counteract the effects (whether actual or anticipated) of climatic stimuli, prevent or moderate environmental damage resulting from climate change or confer environmental benefits” 4.
Climate change mitigation is defined by the Act as “[…] any human intervention aimed at reducing harmful influences on the earth’s climate system, including action aimed at reducing emissions and creating or enhancing sinks” 4.
13
Transport Sector | Climate Change Sectoral Adaptation Plan
Mitigation is not the focus of this plan. It is however recognised that there are numerous inherent synergies and conflicts between mitigation and adaptation actions. For example, installation of temperature controls such as heating and cooling systems on public transport will protect commuters from variations in temperature and safeguard public health while in transit; but the use of diesel generators powering these systems may increase localised emissions of harmful air pollutants and CO2 (carbon dioxide) emissions. Where mitigation measures have co-benefits for adaptation, these should be prioritised across the State.
1.1.2 PlanningandDevelopmentPolicy
Planning legislation can offer resilience. The Planning and Development Act, 200016 (as amended) sets out the detail for regional planning guidelines, development plans and local area plans as well as the basic framework for the development management and consent system. Section 10 of the Act requires that Development Plans shall “include objectives for [inter alia] the promotion of sustainable settlement and transportation strategies in urban and rural areas including the promotion of measures to—
• reduce energy demand in response to the likelihood of increases in energy and other costs due to long-term decline in non-renewable resources;
• reduce anthropogenic greenhouse gas emissions; and
• address the necessity of adaptation to climate change.”16
The Act also provides the statutory basis for protecting our natural and cultural heritage and carrying out Environmental Impact Assessments (EIA), a process by which the anticipated effects on the environment of a proposed development or project are measured. If the likely effects are significant, design measures and/or other relevant mitigation measures can be taken to reduce or avoid those effects. In recent years, measures have been taken to integrate climate change, including adaptation, into the EIA.
1.1.3 Building Back Better Principles
Building Back Better (BBB) Principles can be applied to adaptation planning and are particularly relevant in response to extreme weather events. BBB is an approach to post-disaster recovery that reduces vulnerability to future disasters and builds community resilience to address physical, social, environmental, and economic vulnerabilities. While BBB can be defined in many ways, at its core, it advocates for the restoration of communities and assets in a manner that makes them less vulnerable to disasters and strengthens their resilience. BBB offers the opportunity to rebuild stronger, safer, and more disaster-resilient infrastructure and systems.
BBB principles tend to require a whole-of-Government approach as it is rare that a single sector or authority controls all relevant policy levers, for instance, in transport appropriate land use, building and planning regulations are employed to reduce the possibility of building infrastructure in high-risk areas (e.g. denying permission to construct on flood plains) and

14
Transport Sector | Climate Change Sectoral Adaptation Plan
to enforce increased resilience of physical assets at the point of (re)construction. Employing BBB principles means that recovery processes can also be used as an opportunity to right size infrastructure to better meet community needs and replace damaged assets with updated alternatives. For example, when infrastructure is damaged during an extreme weather event consideration should be given to not only restorating operations but also to whether newer technologies or amended capacity is required to future proof the asset.
1.1.4 Emergency Planning Policy
Effective emergency planning and preparedness is essential to ensure operational continuity and service delivery during severe weather events. A range of Government structures was put in place to support emergency planning in Ireland in 2001 with the objective to improve coordination across existing national emergency plans. A Government Taskforce on Emergency Planning, chaired by the Minister for Defence, was established to direct and oversee the emergency planning activities of all Government departments and public authorities. As part of the work of this Taskforce, the Strategic Emergency Management (SEM): National Structures and Framework was produced to set out the national arrangements for the delivery of effective emergency management which outlines the structures for coordinating a “whole of Government” approach. Under the Framework, DTTAS is the lead department for transport-related emergencies such as air and maritime major incidents and supports other lead departments for emergencies which affect travel and transport, including weather extremes. The role of DTTAS in these situations is to oversee and co-ordinate a national level emergency response, where a national response is required. The National Emergency Coordination Group (NECG) is activated in the event of a national emergency or a crisis.
The most common emergencies that arise are unexpected events which require a rapid response from the emergency services, particularly fire services and An Garda Síochána. In the context of the projected changes to Ireland’s climate, extreme weather and flooding may be considered an emergency depending on the scale of the event and the associated sectoral and cascading impacts. State transport operators have developed response plans to minimise the impact of acute weather-related events and ensure service continuity, with clear co-benefits for adaptation.
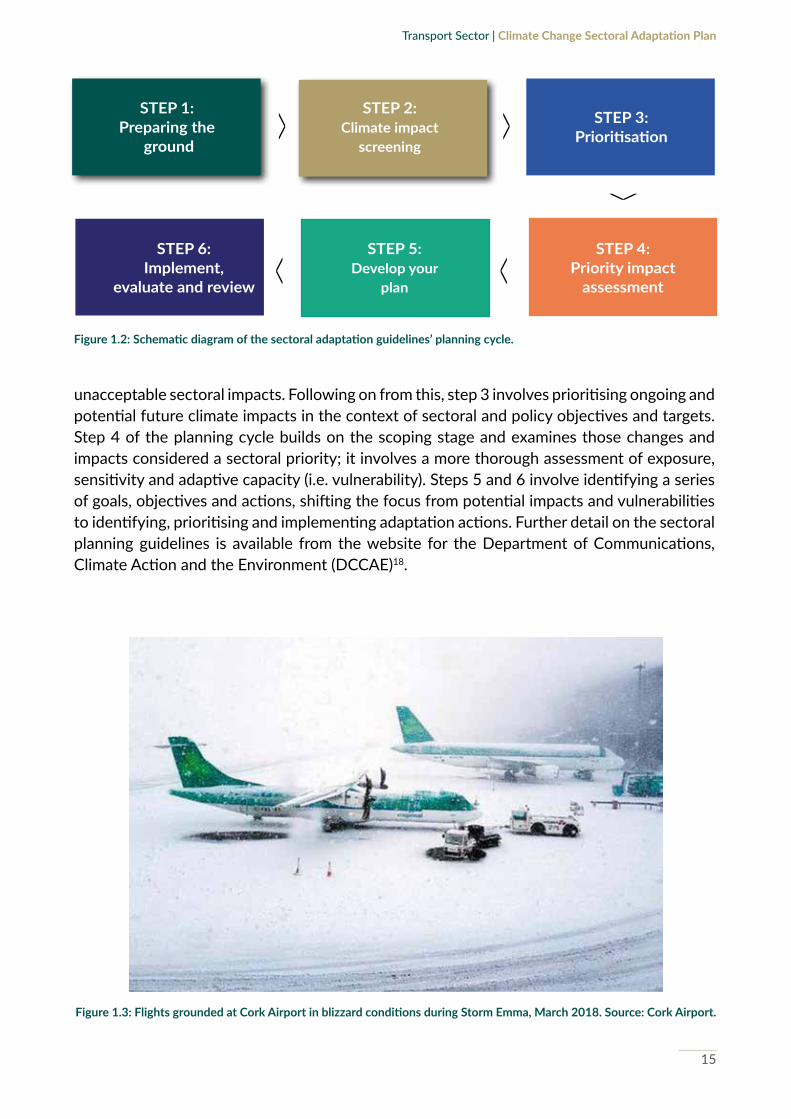
1.2 Methodology Development of this sectoral plan has followed the six step approach outlined in the the Sectoral Planning Guidelines for Climate Change Adaptation17. The twelve sectors preparing sectoral adaptation plans under the NAF are required to develop their plans in line with the process described in the guidelines to ensure that a coherent and consistent approach to adaptation planning, drawing from existing sources of climate and adaptation information, is adopted at national and sectoral scales. The sectoral planning guidelines provide for an iterative six step planning cycle set forth in Figure 1.2.
The early steps (1 & 2) focus on preparing the ground for an effective adaptation planning process and identifying what changes and impacts have the potential to give rise to wider and
15
Transport Sector | Climate Change Sectoral Adaptation Plan
Figure1.3:FlightsgroundedatCorkAirportinblizzardconditionsduringStormEmma,March2018.Source:CorkAirport.
unacceptable sectoral impacts. Following on from this, step 3 involves prioritising ongoing and potential future climate impacts in the context of sectoral and policy objectives and targets. Step 4 of the planning cycle builds on the scoping stage and examines those changes and impacts considered a sectoral priority; it involves a more thorough assessment of exposure, sensitivity and adaptive capacity (i.e. vulnerability). Steps 5 and 6 involve identifying a series of goals, objectives and actions, shifting the focus from potential impacts and vulnerabilities to identifying, prioritising and implementing adaptation actions. Further detail on the sectoral planning guidelines is available from the website for the Department of Communications, Climate Action and the Environment (DCCAE)18.
Figure1.2:Schematicdiagramofthesectoraladaptationguidelines’planningcycle.
STEP 1: Preparing the
ground
STEP 6: Implement,
evaluateandreview
STEP 2: Climate impact
screening
STEP 5:Developyour
plan
STEP 3:Prioritisation
STEP 4:Priority impact
assessment
>
>
>>
>

16
Transport Sector | Climate Change Sectoral Adaptation Plan
1.3 Strategic Environmental Assessment and Appropriate Assessment It has been determined following appropriate screening that Strategic Environmental Assessment (SEA) and Appropriate Assessment (AA) are not required for the statutory adaptation plan for the transport sector. The screening documents and determination letters describing the outcomes of the screening processes undertaken for the SEA and AA will be published alongside the Plan to the Department’s webpage www.dttas.gov.ie19 and to the central Government Publications portal.

17
Transport Sector | Climate Change Sectoral Adaptation Plan
2 Transport System Characteristics

18
Transport Sector | Climate Change Sectoral Adaptation Plan
Due to the slow response time of the global climate system to mitigation measures, changes to global climates are projected to continue and increase over the coming decades, with some changes, such as sea-level rise (SLR), projected to continue up to and beyond the end of this century. Climate impact, risks and vulnerability assessments are used to identify the nature and magnitude of these impacts and can vary widely depending on the geographic area and the sector or system20. It is therefore important to establish the transport sector profile and to identify key sectoral actors before undertaking a climate impact screening assessment.
2.1. Current Sectoral ProfileThe Irish transport sector is currently supporting a rapid growth in travel demand for a broad range of social and economic purposes; growth has resulted in more commuters, freight goods and tourists using the transport network. After a number of years of decline, during the economic recession, Ireland is presently experiencing continued growth across multiple transport domains in the land, aviation and maritime sectors, notably a significant increase in the numbers of kilometres driven on Irish roads for private cars, goods vehicles and an increase in public transport use21.
Passenger travel demand continues to rely heavily on use of the private car, primarily due to Ireland’s relatively dispersed population; at end-April 2019, just over 2,155,600 private passenger cars were registered22. The National Travel Survey23 examines transport use by adults for all types of journey in the land transport sector. The Survey shows ‘work and education’ are the major reasons for making journeys, with their share increasing from 27.8% in 2012 to 33.3% in 2016. ‘Shopping trips’ were the second biggest category accounting for 21.9% of the total, with ‘leisure trips’ at 11.6%.
Eat/drink, 2.4%
Other, 3.8%
Personal business, 5.7%
Visit family/friends, 8.6%
Leisure, 9.2%
Work, 29.3%
Education, 4.0%
Companion journeys, 15.2%
Shopping, 21.9%
Figure2.1:Distributionofjourneysbypurpose.Source:CSO21.

19
Transport Sector | Climate Change Sectoral Adaptation Plan
Recent years have seen significant increases in the use of public transport and active travel modes (cycling and walking), particularly in urban and suburban areas. Public transport passenger journeys are increasing year on year; 266 million journeys were provided by Dublin Bus, Bus Éireann, Iarnród Éireann (Irish Rail), Luas and Go-Ahead Ireland on Public Service Obligation (PSO) services in 2018, a 6.28% increase compared with 2017 figures24. Active modes represent a growing share of transport users in Ireland, notably within the Greater Dublin Area (GDA). In 2016, the numbers walking to work increased to over 175,000, although this figure still accounts for less than 10% of the commuting population. Census data indicates that the number of people commuting to work and college by bicycle increased by 43% in Ireland between 2011 and 2016, with Dublin City Council reporting c. 95,000 daily cycle journeys in the city in 2017. Despite this growth in active and sustainable transport use, registration of private passenger cars is at an all-time peak, indicating increase in the demand placed upon the transport system.
The sector is also strongly characterised by rising commercial travel demand on both domestic and international transport networks. Ireland’s road and rail networks play a vital role for economic activity by facilitating the movement of goods around the country. Road freight activity is continuing to exhibit strong growth (rising to 11.8 billion tonne-km in 2017), with rail freight utilised to a lesser extent, (carrying less than 1% of all freight tonnage in Ireland in 2017)25. Similarly, activity within the aviation and maritime sectors is increasing, with maritime freight tonnage and throughput exceeding the 2007 peak of 54.1 million in 2017, and air freight exceeding the 2006 peak levels of 145,500 tonnes24.
2.2 Key Transport Infrastructure Networks2.2.1 Land Transport – Roads
The Irish road network consists of 98,924 km of road; national roads, the primary links between cities and towns, account for 5,332 km or 5% of all roads. Of these, 969 km are motorway, an increase of 53 kilometres in 2017 due to the opening of the M17/M18 motorway from Gort to Tuam. Motorways accounted for 5% of national roads in 2017, while 301km or 16% of national roads are dual carriageway, and 4,062km or 77% are single carriageway. Collectively, these primary and secondary roads carry 45% of Ireland’s total road traffic22. The national primary and secondary road network is operated and maintained by Transport Infrastructure Ireland (TII). The regional and local road network comprises of approximately 94,000kms and carries c. 55% of all road traffic. These roads are the sole means of access for local economic activity. The 31 local authorities manage regional and local roads as well as sections of some dual carriageway and national secondary roads.
In addition to private travel and commercial (freight) transport, road infrastructure additionally facilitates almost all other travel modes, including public, commercial, rural transport, school transport, tourist bus services, the small public service vehicle (SPSV) sector, (comprising taxis, hackneys and limousines) and a national network of greenways and cycle lanes.

20
Transport Sector | Climate Change Sectoral Adaptation Plan
2.2.2 Land Transport – Buses
The national, regional and local road network supports the majority of Ireland’s public transport through the provision of urban and rural bus services. Bus services throughout the country consist of a combination of PSO (Public Service Obligation) routes which are contracted by the NTA (National Transport Authority) and commercial routes which are licensed by the NTA. The largest providers of PSO bus services in Ireland are Dublin Bus, Bus Éireann and Go-Ahead Ireland, collectively accounting for just over 176.4 million passenger journeys on subvented
Figure 2.2: Primary and secondary road network map. Source: Transport Infrastructure Ireland.
21
Transport Sector | Climate Change Sectoral Adaptation Plan
urban, commuter, and rural routes in 2018. Route-side infrastructure such as bus shelters and real-time passenger information displays are provided by the NTA, while bus depots are the property of CIÉ (Córas Iompair Éireann Group, representing Dublin Bus and Bus Éireann) and Go-Ahead Ireland. Buses are not strictly considered transport infrastructure, and thus are beyond the scope of this adaptation plan; however, due to the important role buses play in the provision of key public transport services they have been included throughout this document where relevant.
In addition to PSO services, there are also a variety of other bus services reliant on road infrastructure, including commercial licensed services, tourist transport provision, and other subsidised bus services such as the Rural Transport Programme (Local Link) and the School Transport Scheme. These non-PSO bus services also play an integral role in public service provision in connecting passengers to transport nodes where they can access other forms of transport and therefore represent significant cascading impacts when services are inhibited.
Local Link services served 1.89 million passengers in 2017, representing a significant bus service subsector26; while 117,000 passengers, including 12,700 children with special educational needs, travelled on school transport buses during the 2016-2017 school year27. Licensed public bus passenger services (or ‘commercial’ services) do not receive State funding for vehicle procurement or associated infrastructure and are operated on a ‘for-profit’ basis by a range of operators across Ireland. Commercial bus services are individually licensed by the NTA. Some commercial bus services, however, receive payments from the Department of Employment Affairs and Social Protection’s Free Travel Scheme in compensation for the revenue foregone from carrying those passengers entitled to free travel. There were a total of 127 operators with regular public bus passenger service licenses in 2017, including the coach and tour sector which serves domestic and international visitors. Almost 25.8 million passengers travelled on commercial bus services in that year, accounting for 9% of all public transport journeys in the State and 45% of all vehicle kilometres travelled by public transport.
2.2.3 LandTransport–HeavyRail
In 2018, Ireland is served nationally by a heavy rail network extending to approximately 2,400 km of operational track, c. 4,440 bridges, c. 1,100 point ends, c. 970 level crossings, 144 stations, over 3,300 cuttings and embankments, 372 platforms and 13 tunnels. The network includes the national main lines, Dublin suburban and commuter passenger routes, together with freight-only routes28. There is a cross-border connection to the railway system in Northern Ireland (NI) between Dundalk and Newry, with services in NI operated by NI Railways - Translink. Part of the Dublin suburban railway network, known as the Dublin Area Rapid Transit (DART) line, is electrified, with the remainder of the network operating through diesel traction. Iarnród Éireann (Irish Rail), a subsidiary of the CIÉ Group, owns, operates and maintains all heavy rail infrastructure in Ireland, while CIÉ retains ownership of stations and of the land underlying railway infrastructure. In 2018, the heavy rail network carried 48 million passengers23; while overall tonnage carried by rail was 546,000 tonnes (0.85% of total tonne-kilometres for the land freight sector in Ireland)24.

22
Transport Sector | Climate Change Sectoral Adaptation Plan
2.2.4 Land Transport – Light Rail
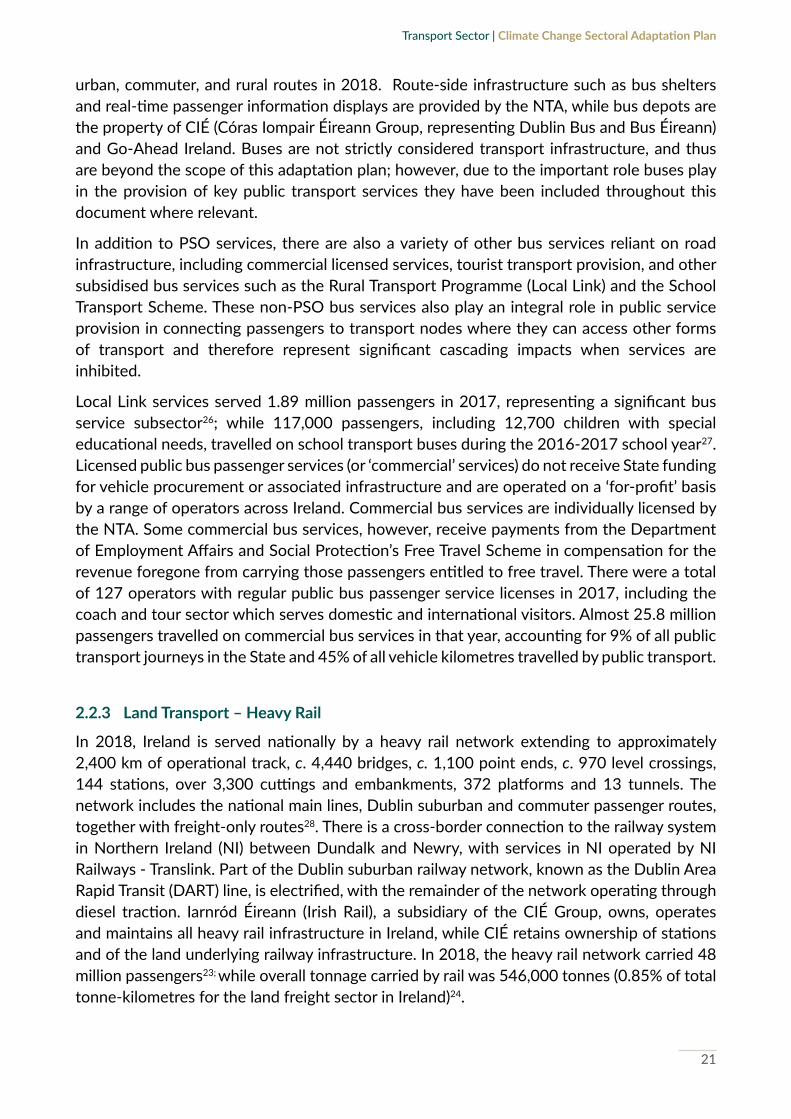
Dublin is served by the LUAS electrified light rail system, which comprises a network of 67 stops over two interconnected tracks extending to 43 kilometres. The light rail system is operated by Transdev Dublin Light Rail Ltd. under contract to TII and the NTA. The network serves routes between termini at Bride’s Glen to Broombridge (Cabra) on the Green Line; and between termini at Saggart/Tallaght to Connolly/The Point on the Red Line. Passenger carriage by light rail has grown year on year since 2010, reaching an all-time peak of 4.2 million passengers in 201823.
2.2.5 Aviation–AirportInfrastructure
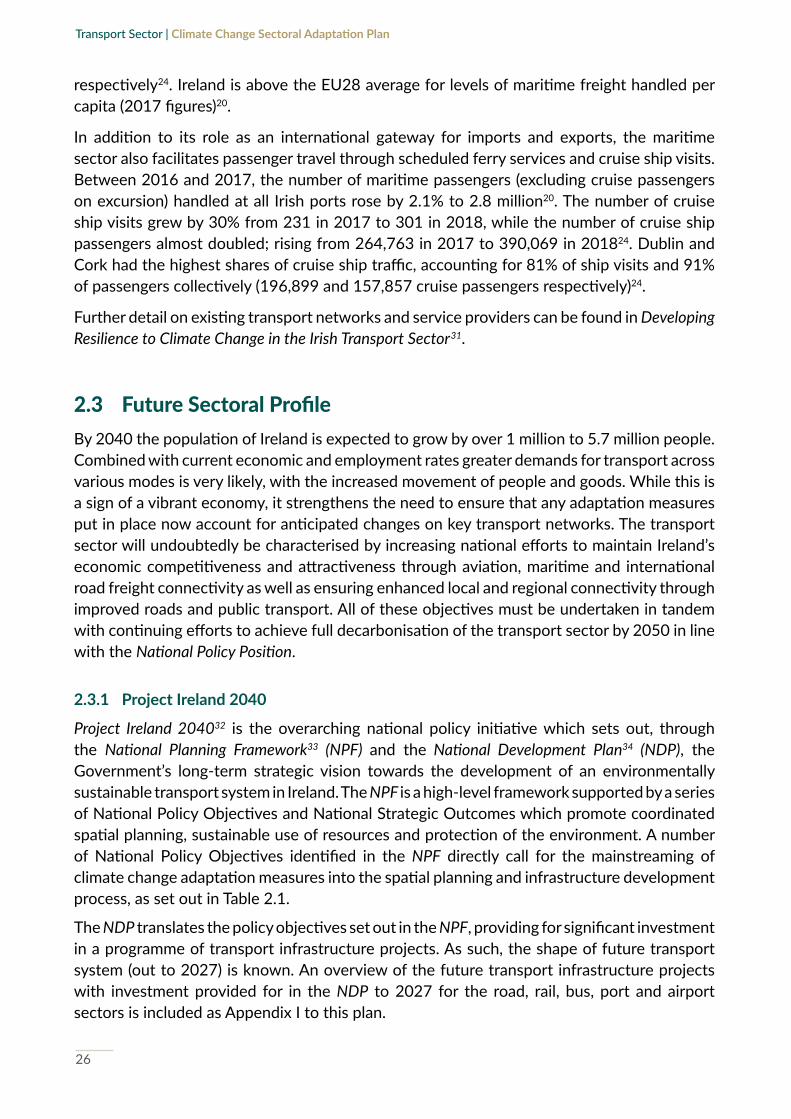
The aviation sector is critical to Ireland’s connectivity to the rest of the world for travel, business and tourism. Ireland’s aviation infrastructure is divided into two distinct categories of airports, as set out by the National Aviation Policy29; State Airports (Dublin, Cork and Shannon) which are the primary gateways through which air traffic accesses Ireland and Regional Airports (Ireland West Airport Knock, Kerry and Donegal) which play an important role in improving connectivity to their respective areas. Commercial flights to Waterford ceased in June 2016.
Ireland’s aviation sector is exhibiting continued growth in commercial flights, passengers and air freight tonnes handled. Collectively, 36.6 million passengers and a total of 266,400 commercial flights were handled at State and Regional Airports in 2018. Dublin Airport represents the largest share of passengers serving 31.3 million people in 2018, followed by Cork Airport (2.4 million) and Shannon Airport (1.7 million)24.
Air freight accounts for a tiny share (by weight) of all freight imports and exports but has also experienced growth in recent years; freight handled at Irish airports increased to an all-time high of 164,000 tonnes in 201724. This figure fell slightly to 157,400 tonnes in 2018, of which Dublin Airport handled 143,700 tonnes (88.4% of total air freight in Ireland); Cork handled 100 tonnes (an increase of 100% over 2016 figures); and Shannon handled 13,600 tonnes24.

23
Transport Sector | Climate Change Sectoral Adaptation Plan
Figure2.3:Nationalheavyrailnetworkmap.Source:IrishRail.
24
Transport Sector | Climate Change Sectoral Adaptation Plan
Figure 2.4: Luas light rail network map. Source: Transport for Ireland.
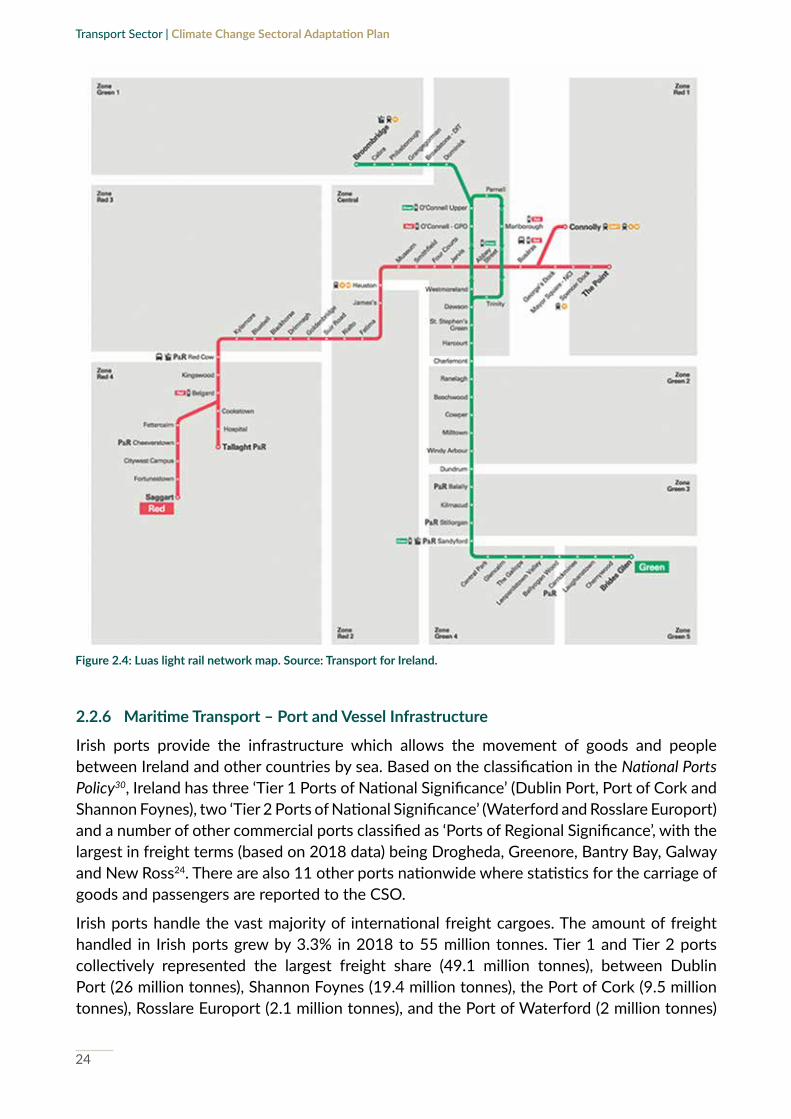
2.2.6 MaritimeTransport–PortandVesselInfrastructure
Irish ports provide the infrastructure which allows the movement of goods and people between Ireland and other countries by sea. Based on the classification in the National Ports Policy30, Ireland has three ‘Tier 1 Ports of National Significance’ (Dublin Port, Port of Cork and Shannon Foynes), two ‘Tier 2 Ports of National Significance’ (Waterford and Rosslare Europort) and a number of other commercial ports classified as ‘Ports of Regional Significance’, with the largest in freight terms (based on 2018 data) being Drogheda, Greenore, Bantry Bay, Galway and New Ross24. There are also 11 other ports nationwide where statistics for the carriage of goods and passengers are reported to the CSO.
Irish ports handle the vast majority of international freight cargoes. The amount of freight handled in Irish ports grew by 3.3% in 2018 to 55 million tonnes. Tier 1 and Tier 2 ports collectively represented the largest freight share (49.1 million tonnes), between Dublin Port (26 million tonnes), Shannon Foynes (19.4 million tonnes), the Port of Cork (9.5 million tonnes), Rosslare Europort (2.1 million tonnes), and the Port of Waterford (2 million tonnes)
25
Transport Sector | Climate Change Sectoral Adaptation Plan
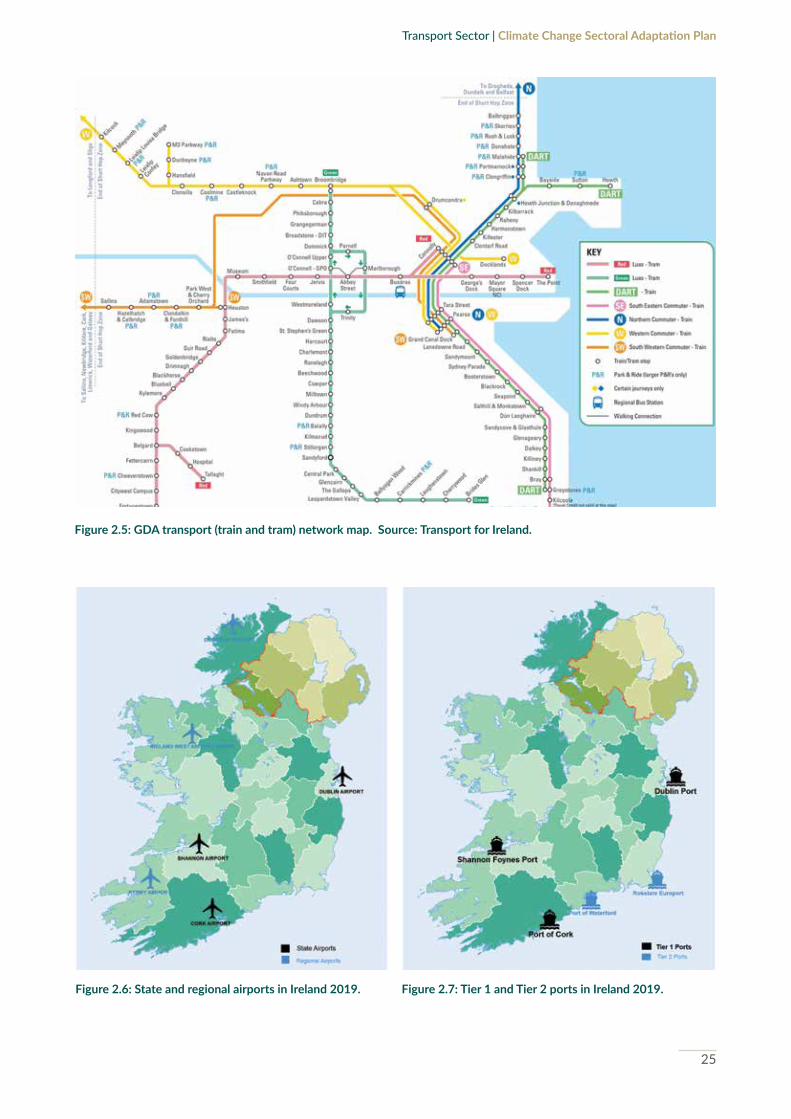
Figure2.5:GDAtransport(trainandtram)networkmap.Source:TransportforIreland.
Figure 2.6: State and regional airports in Ireland 2019. Figure 2.7: Tier 1 and Tier 2 ports in Ireland 2019.
26
Transport Sector | Climate Change Sectoral Adaptation Plan
respectively24. Ireland is above the EU28 average for levels of maritime freight handled per capita (2017 figures)20.
In addition to its role as an international gateway for imports and exports, the maritime sector also facilitates passenger travel through scheduled ferry services and cruise ship visits. Between 2016 and 2017, the number of maritime passengers (excluding cruise passengers on excursion) handled at all Irish ports rose by 2.1% to 2.8 million20. The number of cruise ship visits grew by 30% from 231 in 2017 to 301 in 2018, while the number of cruise ship passengers almost doubled; rising from 264,763 in 2017 to 390,069 in 201824. Dublin and Cork had the highest shares of cruise ship traffic, accounting for 81% of ship visits and 91% of passengers collectively (196,899 and 157,857 cruise passengers respectively)24.
Further detail on existing transport networks and service providers can be found in Developing Resilience to Climate Change in the Irish Transport Sector31.
2.3 Future Sectoral ProfileBy 2040 the population of Ireland is expected to grow by over 1 million to 5.7 million people. Combined with current economic and employment rates greater demands for transport across various modes is very likely, with the increased movement of people and goods. While this is a sign of a vibrant economy, it strengthens the need to ensure that any adaptation measures put in place now account for anticipated changes on key transport networks. The transport sector will undoubtedly be characterised by increasing national efforts to maintain Ireland’s economic competitiveness and attractiveness through aviation, maritime and international road freight connectivity as well as ensuring enhanced local and regional connectivity through improved roads and public transport. All of these objectives must be undertaken in tandem with continuing efforts to achieve full decarbonisation of the transport sector by 2050 in line with the National Policy Position.
2.3.1 ProjectIreland2040
Project Ireland 204032 is the overarching national policy initiative which sets out, through the National Planning Framework33 (NPF) and the National Development Plan34 (NDP), the Government’s long-term strategic vision towards the development of an environmentally sustainable transport system in Ireland. The NPF is a high-level framework supported by a series of National Policy Objectives and National Strategic Outcomes which promote coordinated spatial planning, sustainable use of resources and protection of the environment. A number of National Policy Objectives identified in the NPF directly call for the mainstreaming of climate change adaptation measures into the spatial planning and infrastructure development process, as set out in Table 2.1.
The NDP translates the policy objectives set out in the NPF, providing for significant investment in a programme of transport infrastructure projects. As such, the shape of future transport system (out to 2027) is known. An overview of the future transport infrastructure projects with investment provided for in the NDP to 2027 for the road, rail, bus, port and airport sectors is included as Appendix I to this plan.

27
Transport Sector | Climate Change Sectoral Adaptation Plan
Table2.1:Nationalpolicyobjectivesrelatingtoclimatechangeadaptation in theNPF.Source:Governmentof Ireland,2018.
NationalPolicyObjective41b
In line with the collective aims of national policy regarding climate adaptation, to address the effects of sea level changes and coastal flooding and erosion and to support the implementation of adaptation responses in vulnerable areas.
NationalPolicyObjective54
Reduce our carbon footprint by integrating climate action into the planning system in support of national targets for climate policy mitigation and adaptation objectives, as well as targets for greenhouse gas emissions reductions.
NationalPolicyObjective57
Ensuring flood risk management informs place-making by avoiding inappropriate development in areas at risk of flooding in accordance with The Planning System and Flood Risk Management Guidelines for Planning Authorities.
Based on NPF population projections a strategic infrastructure plan, Planning Land Use and Transport Outlook (PLUTO 2040) is currently being developed to assess the future needs for land transport in Ireland. PLUTO 2040 will help identify the infrastructural and service provision requirements to meet the needs of the 2040 population. It is expected that the
Figure2.8:FreighttrafficontheM50canexperiencecostlydelaysduetoextremeweather.Source:TII.

28
Transport Sector | Climate Change Sectoral Adaptation Plan
changing climate may have wide-ranging fiscal implications, particularly for steady-state funding requirements, to accommodate the need for adaptive measures.
2.3.2 Transboundary Interdependencies – Trade and Tourism
Following Brexit Ireland will no longer share a contiguous border with any European Union (EU) Member State. The subsequent impact on Ireland’s positioning in the international TEN-T network (see Box 2) and the implications for trade activity are still uncertain; nevertheless, disruptions to supply chains and the movement of people/goods through ports and airports are possible. Cross-border transport networks will continue to play an important role in facilitating local travel, public transport services and considerable road freight activity
Figure2.9:Ireland’sTEN-Tcoreandcomprehensiveroadnetworks.

29
Transport Sector | Climate Change Sectoral Adaptation Plan
between NI, the Border Region (Cavan, Donegal, Leitrim, Monaghan and Sligo) and the rest of the island. Ensuring network resilience in key economic corridors (such as the Dublin-Belfast road and rail corridors) will be important to preserve current high levels of economic and social activity.
Transboundary issues of common concern, including the environment, are addressed through the British–Irish Council. The Council was established under the Good Friday Agreement and comprises representatives of the Irish and British Governments and the devolved institutions in Northern Ireland, Scotland, Wales, the Isle of Man, Jersey and Guernsey. In March 2018, Ireland hosted a ministerial-level meeting of the British–Irish Council environment work sector which focused primarily on climate adaptation. Ministers agreed that shared challenges offer significant potential for cooperation in terms of sharing information and best practice across the administrations and further agreed that possibilities for better coordinated and co-funded research should be examined23. Private sector, local government, communities and civil society all have a key role in increasing climate resilience, and all administrations are committed to sharing their experiences on engaging these sectors.
Box 2.1: TEN-T (Trans-European Transport Network72)
The Trans-European Transport Network (TEN-T) is a European Commission policy directed towards the implementation and development of a multi-modal trans-European network of roads, railway lines, inland waterways, maritime shipping routes, ports, airports and rail-road terminals to facilitate the free flow of goods in the single market (EC Europa, 2019). It consists of two planning layers:
• The Comprehensive Network, covering all European regions; and
• The Core Network, a subset of the Comprehensive Network accounting for the strategically most important nodes and links within trans-European networks.
Strategically significant transport nodes on Ireland’s TEN-T Core Network include the three State Airports (Dublin; Cork; and Shannon); the three Tier 1 Ports (Dublin; Port of Cork; and Shannon Foynes); and the interconnecting road network serving these nodes: inclusive of the M50, M1/N1 linking Dublin with Belfast, the M7/N7 linking Dublin with Limerick, the N69 Limerick to Foynes, the M8/N8 linking Dublin and Cork, the Dunkettle Interchange, and the N28 Cork to Ringaskiddy.
2.3.3 CriticalInfrastructureNetworks
The NAF lists twelve sectors for which adaptation plans are required and proposes a themed approach to adaptation planning to allow for cross-sectoral identification of synergies and conflicts. Under this themed planning approach, significant interdependencies have been identified between transport infrastructure and the communications sector (specifically the commercial telecommunications sector and the broadcasting sector) and gas and electricity networks, collectively designated critical infrastructure.

30
Transport Sector | Climate Change Sectoral Adaptation Plan
Table 2.2: Sectors and lead departments in the NAF. Source: NAF: DCCAE, 2018.
Theme SectorLevel LeadDepartmentforSectoralAdaptationPlans
CriticalInfrastructure
Transport Infrastructure Department of Transport, Tourism and Sport
Electricity and Gas Networks Department of Communications, Climate Action and the EnvironmentCommunications Networks
Critical infrastructure supports and underpins the effective functioning and overall resilience of all other sectors of the economy. Extreme weather events rarely affect one sector in isolation. When transport networks (infrastructure and services) are rendered inaccessible or inoperable, this has severe knock-on impacts for access to co-located infrastructure such as overhead energy networks, transmission and distribution stations, delaying a return to normal operation.
Similarly, the transport sector is reliant on efficient telecommunications to facilitate the safe and timely transfer of domestic and international tourism and freight, to coordinate public transport provision and to communicate safety and traffic management information to transport users. In addition, energy supply is crucial to transport provision; no transport hub (ports; airports; public transport and private freight depots etc.) can operate without contingency in the absence of a power supply. This risk is exacerbated for certain key transport subsectors. Electrified rail, including the DART line and the LUAS light rail network, is wholly dependent on the supply of electrical power, and localised power outages can present severe road safety and traffic congestion risks should traffic light systems go offline.
The national electricity and gas networks are expected to play an increasingly significant role in the transport sector as decarbonisation becomes a growing national objective. The National Policy Framework for Alternative Fuels Infrastructure for Transport in Ireland, 2017-203036 suggests that the full electrification of the national car fleet represents a feasible option, where supporting grid infrastructure is developed. Under the Climate Action Plan37 a target of 936,000 electric vehicles (EVs) within the national fleet by 2030 has been established. The majority of Ireland’s public recharging network is currently operated by ESB e-cars and comprises over 800 public, standard and fast charge points (over 1100 including NI). €10 million has been pledged under the Climate Action Fund to fund the further installation of over 100 high powered (150kW) chargers at key locations on the national road network. Any interruption in supply to the on-street public recharging network or to private home chargers will negatively affect people’s ability to travel for work, education and leisure purposes and inhibit public confidence in electrified alternatives.
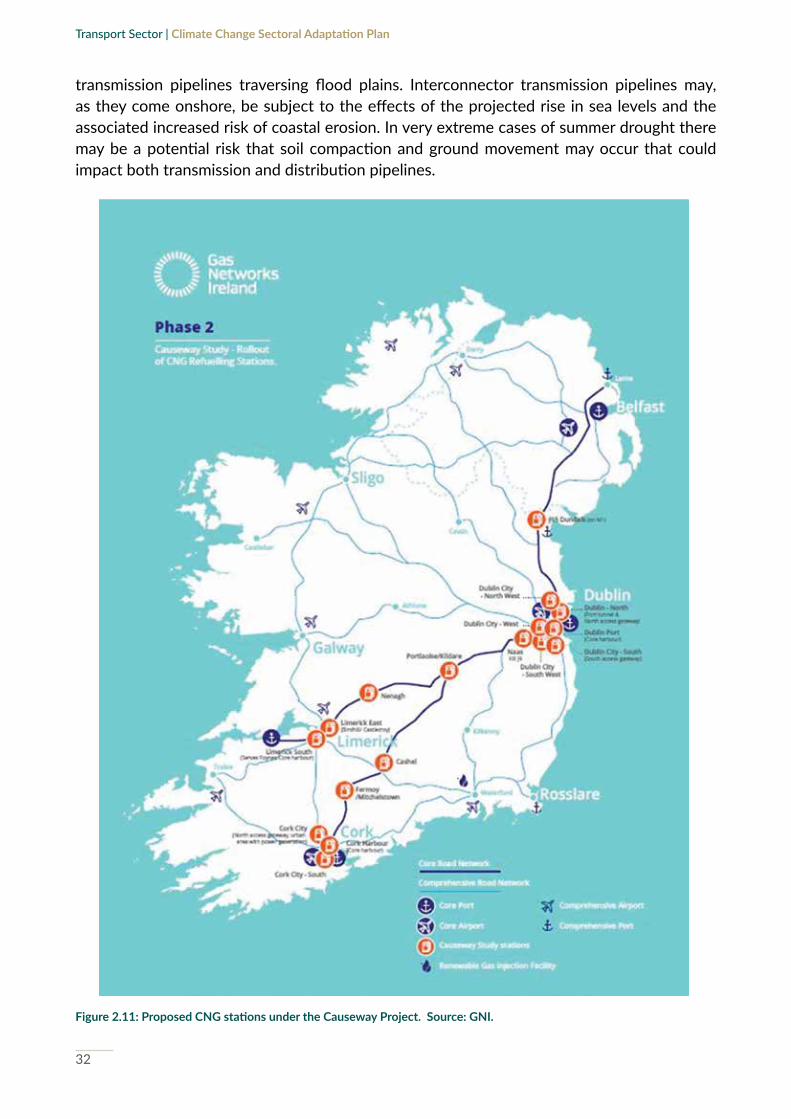
In the heavy-duty (freight truck and bus) sector, where electrification is a less mature technology, other alternative fuels such as compressed natural gas (CNG), liquefied natural gas (LNG), renewable biogas/biomethane and hydrogen, amongst others, may have a role to play. GNI (Gas Networks Ireland) has commenced the roll-out of 14 publically accessible fast-fill CNG refuelling stations, as well as a renewable gas injection point under the Causeway Project38. Grant approval has been given by the EU Commission for the Green Connects Project, which will provide for a further 21 public CNG stations installed on the TEN-T core network

31
Transport Sector | Climate Change Sectoral Adaptation Plan
and 4 direct injection facilities for renewable gas by 202339. Again, any disruption to the gas network could negatively impact on freight activity levels when refuelling opportunities are curtailed.
Ensuring resilience in the electricity and gas distribution networks is a role for the ESB Group and Gas Networks Ireland respectively and will be examined through the Sectoral Adaptation Plan for the Gas and Electricity Networks Sector. For recharging infrastructure, the supporting transmission system (overhead lines, underground cables and stations) and the distribution system need to be resilient, with enough capacity to ensure that extreme weather events resulting in outages can be accommodated without severely restricting the supply of electricity. The main identified risk to the transmission system is from flooding, arising from river or drainage system channel/infrastructure capacity exceedances, storm surges, sea level rise and also extreme precipitation levels. This affects all infrastructures on the grid. Increased wind speeds and sufficiently severe lightning are also identified as risks to transmission assets. Similarly, climate change may have an impact on the level of degradation of critical gas assets, such as refuellers, that are situated above ground. This would reduce the life of assets and therefore increase the required frequency of refurbishment and replacement of the affected assets.
The gas transmission network is, in the main, very resilient to weather events as it is an underground network. However, an increase in extreme flooding events may impact
Figure2.10:Ireland’scurrentandproposedEVrechargingnetwork.Source:ESBe-cars.
32
Transport Sector | Climate Change Sectoral Adaptation Plan
transmission pipelines traversing flood plains. Interconnector transmission pipelines may, as they come onshore, be subject to the effects of the projected rise in sea levels and the associated increased risk of coastal erosion. In very extreme cases of summer drought there may be a potential risk that soil compaction and ground movement may occur that could impact both transmission and distribution pipelines.
Figure2.11:ProposedCNGstationsundertheCausewayProject.Source:GNI.

33
Transport Sector | Climate Change Sectoral Adaptation Plan
The viability of alternative fuels for transport is likely to change in the coming years as technologies mature and develop. For example, there is no public hydrogen refuelling point currently installed in Ireland. It is nonetheless important that resilience against extreme weather is considered in future planning processes for hydrogen fuel production and distribution and other transport-adjacent infrastructures.
2.3.4 Broader Cross-Sectoral Interdependencies
Sectoral interdependencies are a product of complex and interconnected social and economic processes. Climate impacts and associated adaptation measures can therefore overlap across multiple agendas; for example, expected growth in indigenous production of renewable biogas/biomethane for use as a transport fuel indicates that adaptation planning within the agricultural and forestry sector in the coming years may have bearing on the decarbonisation objectives of the transport sector. Where transport adaptation measures have areas of intersection for parallel sectoral areas, these will be identified in the action plan.
A 2010 Forfas report identified that while not all business will be equally impacted, climate change will impact on Irish businesses through changing markets, impacts on premises and processes and increased vulnerability of supply chains; a central conclusion from the report was that properly prepared, adaptation can provide opportunities for businesses in Ireland and that threats can be managed.
Significant overlap can be expected between transport infrastructure adaptation on a national level and infrastructure under the remit of local government, particularly in relation to adaptive measures for regional and local road infrastructure. Regional and local roads represent a large proportion of Ireland’s road network and consequently support a range of economic activities. World Bank data shows that Ireland is a particularly open economy and that this openness has grown over time. In 2016, Irish exports and imports combined to an amount over twice the size of Irish gross domestic product (GDP) (221%). Only Luxembourg (407%), Hong Kong (373%), and Malta (268%) recorded higher levels of trade openness, while the OECD average was 55%. Clearly, Ireland’s economy is heavily dependent on the movement of goods and services into and out of the country, and therefore on efficient domestic and international transport networks. Moreover, research undertaken on behalf of the Western Development Commission indicate that the local and regional road networks support significant levels of travel between rural commuting towns and cities40, as well as between rural areas and gateways41.
Notably, access to healthcare providers and for emergency services (ambulance services and the coastguard) during extreme weather events is a critical function of transport infrastructure. During Storm Ophelia in 2017, which tragically resulted in three deaths, there was significant disruption in road infrastructure, air transit and electrical power, causing severe disruption to outpatient services, hospital procedures and discharges. Similarly, flood risk management processes are similarly highly interlinked with transport infrastructure adaptation in the context of health. Flooding can render roads infrastructure inaccessible and limit emergency response capacity for health-related emergencies. While warmer weather may reduce the

34
Transport Sector | Climate Change Sectoral Adaptation Plan
risk of cold-related illness and may potentially improve wellbeing and physical activity levels, extreme heat and heatwaves are also projected to increase in frequency. Extreme heat can cause heat exhaustion and heat stroke as well as aggravate pre-existing health conditions such as cardiovascular, respiratory and neurological disorders. Consideration of passenger health and welfare in extreme weather (heat waves or cold snaps) is likely to be required for public transport service providers in future business continuity management processes.
An increase in public and active travel, in line with decarbonisation objectives, will have positive co-benefits for public health. Strong evidence exists for the contribution of sport and physical activity to health and wellbeing. A 2008 review by the United States Department of Health and Human Services concluded that regularly active individuals had lower mortality rates than the least active, and health benefits of being habitually physically active applied to people regardless of age, sex, race/ethnicity, socio-economic status, and whether or not they had a disability. Similarly, research by the Economic and Social Research Institute estimated that “regular participation in sport is equivalent, in health terms, to being 14 years younger”. Research published in 2012 estimated that physical inactivity was responsible for 14.2% of all-cause mortality in Ireland; approximately 4,000 deaths being attributable to Irish people not engaging in enough physical activity, based on 2014 statistics. Furthermore, physical inactivity has been estimated to cost Ireland approximately €1.5 billion per year. Participation in sport and physical activity is effective in reducing depression, anxiety, psychological distress and emotional disturbance42. However, an increase in active travel does also confer risks; UV and sun exposure, as well as exposure to localised air pollution, with associated negative health consequences. Such risks are not static; it can reasonably be expected that climate mitigation measures such as fleet transition away from fossil fuels towards low-emission alternatives will contribute to improved air quality in the coming years.
Finally, the agri-food and seafood sectors also are particularly dependent upon road and maritime infrastructure to secure timely access to European and international markets; extreme weather events can negatively impact on the agricultural sector through restricting the transportation of agri-products both domestically and through exports.
2.3.5 Tourism and Sport
While this adaptation plan solely addresses the transport sector in line with the statutory requirement under the NAF, it can be expected that other sectors contributing to Ireland’s economy under the remit of DTTAS (tourism and sport) will face similar climate challenges. The tourism sector in particular is exposed to numerous direct and indirect impacts from climate change43. These impacts are not likely to be uniform and some areas will be more sensitive than others. Urban tourism may be less affected than coastal tourism e.g. beach tourism, marine-related attractions, or nature watching. Sea level rise, increasing ocean acidification and coastal erosion threaten Ireland’s coastal tourism infrastructure and natural attractions44.
There is little data available on changes in tourist behaviour as a consequence of climate change and it is therefore difficult to predict likely changes to the relative attractiveness of Ireland as a destination, the corresponding economic value of tourism or anticipated tourist transport demand. However, destination attractions such as Skellig Michael and

35
Transport Sector | Climate Change Sectoral Adaptation Plan
the Burren in Co. Clare which represent key cultural and natural assets (biodiversity) are especially vulnerable, indicating an important shared agenda between the tourism sector and adaptation planning for the Built and Archaeological Heritage Sector and for the Biodiversity Sector.
Sport plays an important role in Irish society, to the economy and is considered an intrinsic part of Ireland’s cultural heritage, as well as a major draw for international tourism in professional sports such as rugby, golf, soccer and boxing. Changes to Ireland’s climate, particularly the projected rise in extreme weather events, may present new risks and challenges to how national sports are played. Probability of matches being abandoned or the risk of closure to courses and pitches in vulnerable areas rises in line with future climate change scenarios. These risks can be mitigated by future proofing outdoor sport infrastructure, for example by the development of indoor or covered sports facilities to accommodate players and spectators in adverse weather conditions45.
Some important sector-specific considerations within the tourism and sport sectors are relevant for transport adaptation planning. Accessibility to important tourist sites and sports grounds, for both domestic and international tourist use, must be enabled by supporting transport infrastructure. It is of course possible that, as well as presenting challenges, projected climate change may present positive opportunities for both the tourism and sport
Figure2.12:SurferinColeraine,NIduringStormBarbara,December2016.Source:CharlesMcQuillan/GettyImages.

36
Transport Sector | Climate Change Sectoral Adaptation Plan
sectors. Climate change could facilitate diversification of tourism activities and development and consumption of sustainable tourism products, such as eco-tourism, activity tourism and an opportunity to utilise inland waterways and blueways. With a more stable summer climate and greater chance of dry weather conditions, the further expansion of outdoor leisure and recreation activities will be possible46. Projected stronger tides and waves, as well as stronger winds, would allow for the expansion of Ireland’s international watersports offering. Similarly, higher summer temperatures may allow for an increase in the use of active travel infrastructure, including cycle lanes and national greenways, with a range of implications for the transport, sport and tourism sectors collectively.
Of equal importance, the implementation of adaptive measures to transport infrastructure should take into account preservation of co-located biodiversity and heritage sites. Buildings and structures associated with public transport may be designated as protected structures or otherwise of cultural or historical significance. It is important that any future adaptation measures adhere to best practices in conservation in line with the relevant planning and development regulations, and that consideration of archaeology is fully integrated into the planning process. Biodiversity is considered by requiring large-scale infrastructural projects to consider possible impacts as part of an Environmental Impact Assessment (EIA), in line with the provisions of Directive 2014/52/EU.
2.4 Establishing the Sectoral Adaptation TeamA sectoral adaptation team, divided into a core team and a planning team, for the transport sector was established in 2016 for the preparation of the non-statutory plan Developing Resilience to Climate Change in the Irish Transport Sector. The Climate Change Unit in DTTAS, with support from the Strategic Research and Analysis Division, Aviation Services Division, Airports Division, Roads Division, Maritime Safety Division, and Public Transport Investment and Sustainability Division, comprises the Core Team. A range of transport stakeholders were represented on the broader Planning Team. The Core and Planning Teams attended stakeholder consultation, facilitated by DTTAS, in May 2018 to monitor and review implementation of the precursory non-statutory adaptation plan.
For the development of the statutory adaptation plan, DTTAS has extended the Planning Team to account for the projected changes to the way we travel and the strategic transport investment priorities in the coming years set out in Project Ireland 2040. Notably, key transport system users, including representation for commercial freight operators, tourist transport services and active travel users, are reflected in membership of the extended team. Representation for other critical infrastructure (communications and energy) networks, as well as the local government sector, is also considered.

37
Transport Sector | Climate Change Sectoral Adaptation Plan
Table2.3:PlanningTeamStakeholdersfortheStatutoryAdaptationPlan.
Stakeholder Sector
Bus Éireann Bus Services
Connaught Airport Development Company Aviation
Climate Action Regional Offices Local Government; Regional & Local Roads
Climate Ireland Climate & Meteorological Data
Coach Tourism and Transport Council Private Bus & Coach Services
Dublin Airport Authority Aviation
DCCAE Communications & Energy Networks
Drogheda Port Company Maritime
Dublin Bus Bus Services
Dublin Port Company Maritime
Dún Laoghaire-Rathdown CoCo Maritime
Fáilte Ireland Tourist Transport Services
Freight Transport Association Ireland Commercial Freight
Go-Ahead Ireland Bus Services
Irish Aviation Authority Aviation Services
Irish Road Haulage Association Commercial Freight
Met Éireann Climate Services & Meteorological Data
NTA Public & Rural Transport & Active Travel
Office of Public Works Flood Management
Irish Rail Heavy Rail & Maritime
Port of Cork Company Maritime
Port of Galway Company Maritime
Port of Waterford Company Maritime
Shannon Airport Authority Aviation
Shannon Foynes Port Company Maritime
Sport Ireland Sport
TII National Roads & Light Rail Infrastructure
Tourism Ireland Tourism

38
Transport Sector | Climate Change Sectoral Adaptation Plan
3 Climate Impact Screening for the Transport Sector

39
Transport Sector | Climate Change Sectoral Adaptation Plan
3.1 Observed and Projected Climate Impacts for Ireland to 2050Establishing a climate baseline for Ireland is necessary to inform and prioritise future risks and adaptation options; studies of Ireland’s climate clearly show that long-term prevailing weather conditions are changing. The last century was characterised by an upward trend in temperatures resulting in warmer, wetter winters and hotter, drier summers, accompanied by an increase in weather extremes. This pattern is projected to continue, with changes to include increases in average temperatures (surface air and sea surface), variation in typical precipitation patterns and ongoing sea level rise47. The changing climate leads to changes in the frequency, intensity, spatial extent, duration and timing of climate events, and can result in unprecedented extreme weather extremes.
Climate projections exist for all climate scenarios, at varying levels of confidence, for medium- (2031-2060) and long-term (2081-2100) timeframes. This adaptation plan focuses primarily on the medium-term timeframe; accounting for the periodic statutory adaptation planning as defined in the NAF (the lifetime of this plan is five years) and aligning Project Ireland 2040 timelines. A summary of global and local climate change observations and projections towards 2050 is set out in Table 3.1.
Box 3.1: Representative Concentration Pathways (RCPs)Representative Concentration Pathways (RCPs) are greenhouse gas (GHG) concentration trajectories adopted by the IPCC for its Fifth Assessment Report (AR5) in 2014. The pathways are used for climate modelling and research; they describe four possible climate futures, dependent on the level of GHG emissions in the years to come. The RCPs are
Figure3.1:CyclistcommutingininclementconditionsinRathcoole,Co.DublinduringStormFreya,March2019.
Source: Niall Carson/ PA Wire.

40
Transport Sector | Climate Change Sectoral Adaptation Plan
labelled after a possible range of radiative forcing values in the year 2100 (2.6, 4.5, 6.0, and 8.5 W/m2) accordingly the four pathways are named RCP2.6, RCP4.5, RCP6, and RCP8.5.
The RCP2.6 scenario assumes that global annual GHG emissions peak between 2010 and 2020 and emissions declining substantially thereafter. The RCP4.5 scenario is a stabilisation model which assumes that international climate policies will set out and implement measures designed to limit greenhouse gas emissions and radiative forcing, resulting in climate stabilisation by the year 210073. Emissions in RCP4.5 peak around 2040, then decline, while in RCP6, emissions peak around 2080, then decline. The RCP8.5 scenario corresponds to the pathway with the highest greenhouse gas emissions. RCP8.5 assumes the continuance of population increase, slower income growth and modest rates of technological advancements, leading to high energy demand and GHG emissions in absence of climate change policies74. In RCP8.5, emissions continue to rise throughout the 21st century.
Table3.1:SummaryoftheobservedandprojectedimpactsofclimatevariablesforIreland.Source: Desmond et al.(2017)1;Nolan(2015)48; Nolan et al.(2017)49;Nolan(2019)50;O’Sullivanet al.(2015)51.
Variable ObservedImpacts ProjectedMid-CenturyImpacts
Temperature Mean annual surface air temperatures have increased by about 0.8oC over the period 1890–2012; an average of about 0.07oC per decade.
The number of warm days (over 20°C) has increased while the number of cold days (below 0°C) and annual frost days has decreased.
Mean annual temperatures will rise by about 1oC - 1.6oC (RCP4.5 scenario) by mid-century compared to the 1961–1990 average; highest increase in the east.
Increaseinextremewarmtemperatures[up to 2.6oC summer maximums & up to 3.1oC in winter depending on emissions scenario]
Averagenumberoffrostdayswillfurtherdecrease[by 50%].
Precipitation Average annual national precipitation over the period 1981–2010 has increased by 5% relative to the period 1961–1990.
The largest increases are observed over the west of the country.
The likelihood of an extreme dry summer has doubled over the last century.
Wetterwinters (14% increase in precipitation for RCP8.5 scenario by mid-century); drier summers (between 3 - 20% reduction for the RCP4.5 and RCP8.5 scenarios respectively by mid-century).
Increase in intense rainfall (≥20mm/day) especially in winter and autumn by ~ 20%.
12%-40%increasein‘dryperiods’, for both RCP4.5 and RCP8.5 scenarios together with longer average duration (5 days with <1mm rain).
Wind Speed and Storms
There is no evidence of a sustained long-term trend in wind speed or direction but evidence exists of an increase in the frequency of days with heavy rain (10mm or more) over the period 1981–2010, relative to the period 1961–1990 (EPA, 2009).
The number and intensity of storms in the North Atlantic has increased by approximately 3 storms per decade since 1950.
Slightly fewer storms, but more intense ones. Projections indicate an overall decrease in wind speed but an increase in extreme wind speeds, particularly during winter.
The number of very intense storms is projected to increase over the North Atlantic region and the tracks of intensestormsareprojectedtoextendfurthersouth.
Increased storm surge [Atlantic coastal retreat rates likely to increase from current 0.5-1m/year].

41
Transport Sector | Climate Change Sectoral Adaptation Plan
Variable ObservedImpacts ProjectedMid-CenturyImpacts
SeaLevelsandSea Surface Temperatures
1993-2017 sea level rise of c. 35mm per decade (currently c. 3.4mm/year) has been observed. Tide gauge records pre-1990 show sea level rise of 1–2mm/year.
Sea surface temperatures have increased by 0.85°C since 1950, with 2007 the warmest year in Irish coastal records.
Rise of c. 550–600mm to 2100 [based on IPCC RCPs 2.6–4.5 and other medium-scale climate warming scenarios.
Regional SLR, allowing for isostaticcomponents, of c. 25cm (Dublin/east coast of Ireland), c. 44cm(Sligo/central western coasts) andc. 40cm (south-west Ireland) by c.2080–2100
Seasurfacetemperaturesareprojectedtocontinuewarming for the coming decade. For the Irish Sea, projections indicate a warming of 1.9°C by the end of the century.
Humidity In the period since 1961 the trend has been for a slight increase in summer and decrease in winter RH (relative humidity) values.
An increase in RH is likely, especially during winter months, while decreasesinsummerareprojected,mainlyin the South and East.
Phenology Trees and plants: evidence of change in timing of phenological phases such as bud burst, leaf unfolding, flowering, fruiting, leaf colouring and leaf fall in some trees and plants.
Growing season has extended by one week.
Projections suggest that bud burst of birch will continue to advance until 2100; rate of advance will vary with the north-east region showing the greatest advance.
Growingseasontoextendbyupto35days.
3.2 Managing Climate Uncertainty and Projected Climate ScenariosClimate change projections are subject to uncertainty; Ireland’s geographic location and the influence of the North Atlantic Drift makes it particularly difficult to present projections with a high degree of confidence. This uncertainty allows for a broad range of potential climate outcomes for Ireland to the mid-21st century (c. 2050) and further to 2100. National-level climate data is analysed through an ensemble approach using a range of Regional Climate Models (RCMs) to simulate climate change, allowing for a medium-low emission scenario (aligning with RCP4.5) and a high emission scenario (aligning with RCP8.5) to be developed with a measure of confidence41. Simulations were run for a reference period 1981–2000 and future period 2041–2060. The IPCC Special Report on Global Warming of 1.5oC (2018)3 suggests that based on the current global emissions trajectories, without significant mitigating measures, a strong likelihood for a high-emission scenario and warming to over 1.5oC. To attempt to mitigate emissions and limit the likelihood of reaching the high-emission scenario Ireland produced both the National Mitigation Plan33 and the Climate Action Plan52 outlining a range of mitigation measures across multiple sectors. Ireland’s climate will not solely be influenced by measures undertaken in this jurisdiction but it is possible that the cumulative impact of global mitigation efforts will alter the current trajectory.
Table 3.1: Summary of the observed and projected impacts of climate variables for Ireland. (continued)

42
Transport Sector | Climate Change Sectoral Adaptation Plan
For the preparation of this plan, the climate impacts associated with the medium-low emission scenario (RCP4.5) has been tentatively identified as representative of the climate baseline in the coming years. Based on the IPCC findings, there is also merit in future sectoral adaptation measures allowing sufficient resilience to address impacts associated with the high-emission scenario (RCP8.5) and both scenarios are examined further in Chapter 4. The Climate Change Advisory Council noted in its Annual Review 2019 that investment decisions should consider a range of global warming scenarios, including those of potential higher warming53. Establishing a consensus for a national emission scenario, as has been performed in other jurisdictions such as the UK, would be beneficial in ensuring a cohesive, strategically aligned approach to adaptation planning, climate finance and State investment across sectors.
3.3 Identifying Climate Impacts and Sectoral Vulnerabilities The most immediate climate-change related risks in Ireland are those associated with weather extremes, such as floods, precipitation and storms. In particular, systemic risks due to weather events leading to the breakdown of infrastructure networks and critical services such as transport, energy, communications, water supply, health and emergency services are expected. Climate change is often associated with extreme events, but it also manifests in slow onset events, such as sea level rise, land degradation, increasing temperatures and ocean acidification. Slow onset events evolve gradually from incremental changes occurring over many years or from an increased frequency or intensity of recurring events, whereas a rapid onset event may be a single, discrete event that occurs in a matter of days or even hours. While the rate of impact of slow onset events is gradual and can appear less destructive than extreme events, their negative impacts still require risk management. Transport stakeholders are highly engaged with immediate vulnerabilities within their respective networks due to the impacts to operations and remedial action plans for extreme weather events have been implemented by major infrastructure operators and service providers to limit any associated budget risk. Equally, stakeholders tend to be aware of slow onset effects on their respective networks; annual work programmes must be prioritised to address climate risks – both rapid and slow onset events.
A qualitative climate impact screening and vulnerability assessment was undertaken in consultation with key transport stakeholders in the sectoral adaptation team, with support from Climate Ireland. This work has been summarised in an impact chain format in Appendix II. Projected changes in climate were applied to the impact chains to illustrate how impacts are expected to increase or decrease in line with a medium-low emission scenario to 2050 (RCP4.5 equivalent).
3.4 Prioritising Sectoral RisksThe transport sector must ensure that any adaptation measures put in place are appropriate and proportionate to the levels of anticipated climate risk. The identification and prioritisation of sectoral risks was undertaken using the methodology proposed in the UK Climate Change Risk Assessment (2017). This methodology considers the future likelihood and magnitude

43
Transport Sector | Climate Change Sectoral Adaptation Plan
of each projected climate impact (considered against identified vulnerability in transport infrastructure and services) to establish climate risk. Certain significant risks for the transport sector are not caused directly by the climate itself, but by the escalation of biophysical impacts of climate change, for example, coastal erosion and pluvial, fluvial and coastal flooding54.
Climate risk prioritisation was applied to sectoral impact chains to calculate future adaptation priorities; risk levels were determined based on the likelihood of the climatic impact occurring and the degree of vulnerability within the sector to that event (Likelihood of Climate Impact x Level of Sectoral Vulnerability = Climate Risk). A basic traffic light system was employed to illustrate the level of risk for each climate impact; whereby the green colour indicates low levels of projected climate risk; orange indicates moderate levels and red indicates high levels of projected climate risk.
Figure3.2:Processofdeterminingsectoralvulnerabilityinclimateimpactscreening.
EconomicActivityServiceProvisionEmergencyServices
Public Health & Safety
Environment
Infrastructure Modes
Passengers Staff
Road ActiveTravel
Rail Ports
Airports Bus
PrecipitationHigh Winds & Storm SurgeHeatWaves
Cold SnapsSeaLevelRise
Humidity Environment
SECTORAL CONSEQUENCES
COMPARATIVE VULNERABILITY
INDICATORS
OBSERVED & PROJECTED
CLIMATEIMPACTS
TRANSPORT SUBSECTOR

44
Transport Sector | Climate Change Sectoral Adaptation Plan
Table 3.2: Priority Impact Chains for the Transport Sector
Climate Impact
Likelihood of Climate Impact
Sectoral Vulnerability
ProjectedClimate Risk
Precipitation
Flooding
HighWinds(Storms)
Storm Surge
SeaLevelRise
Coastal Erosion
High Temperatures
Low Temperatures
Humidity
Phenology
Based on this analysis the key climate risks identified for the transport sector (all transport modes) were: 1) High Climate Risk: Projected increase in precipitation extremes, flooding, high winds,
increased storm intensity and projected rises in sea level;2) Moderate Climate Risk: Projected increase in coastal erosion and temperature extremes;
and3) Low Climate Risk: Projected changes to humidity levels or phenological factors (e.g. change
in bud burst dates, bird migration patterns) were deemed to be of low climate risk in the transport sector and so were not be considered further in the context of this Plan.
Vulnerabilities to climate change will vary depending on the specific service or infrastructure in question and may also vary depending on location, amongst other factors. Stakeholder engagement indicated that climate impacts were not experienced uniformly across transport modes. Land transport infrastructures (roads; rail; and active travel infrastructure) noted particular susceptibility to precipitation and associated risks such as flooding, landslides and subsidence. Land infrastructure located adjacent to coastlines is additionally sensitive to oceanic processes such as sea level rise and storm surge, causing coastal erosion. Aviation infrastructure and services noted a particular sensitivity to weather extremes such as storms and high winds. Equally, maritime infrastructure is vulnerable to high winds and storm surge, as well as slower onset changes to sea level and oceanic temperatures, which can exacerbate disintegration of physical infrastructures. Noting that this prioritisation methodology employs qualitative data only, DTTAS has undertaken a preliminary quantitative data collection exercise to commence identification of relative vulnerability to climate risks for different transport modes (see Chapter 4).

45
Transport Sector | Climate Change Sectoral Adaptation Plan
3.4.1 High Climate Risk
Precipitation Extremes and Flooding EventsAs average global temperatures rise, the hydrological cycle is expected to become more intense, resulting in more frequent, sustained rainfall events with low lying areas being more vulnerable to pluvial and fluvial flooding. Pluvial flooding occurs when the ground cannot absorb rainwater effectively or urban drainage and surface watercourses are overwhelmed by excessive water flow, especially in densely built towns and cities. Fluvial flooding occurs when excessive rainfall increases stream-flow and loads, particularly in the autumn and winter months, causing riverbanks to erode and exceed river capacity. Damage from fluvial flooding is often cumulative as overflow affects smaller watercourses downstream. This impact is exacerbated when heavy precipitation follows a period of extended dry weather and high-velocity flash floods can occur without notice.
With much of Ireland’s critical infrastructure located within dense urban developments or in close proximity to river floodplains, flood events pose a growing climate risk. During extreme weather events, key transport networks can be rendered inaccessible or unsafe for private and commercial travel and public transport services may be disrupted or suspended.
Gradual degeneration of transport infrastructure associated with extreme precipitation and subsequent flood events can severely impact multiple subsectors. Observed impacts include: the disintegration of road, pavement and cycle lane surfaces; increase in bridge scour events - where material from around bridge piers and abutments is removed by swiftly moving water causing structural instability and eventual bridge collapse; and heightened landslide risk as slopes become saturated by frequent precipitation events, blocking or damaging road, rail and active travel infrastructure.

46
Transport Sector | Climate Change Sectoral Adaptation Plan
CASE STUDY 1:
ExtremePrecipitation,PluvialFloodingandFluvialFlashFloods
Overview–Ex-HurricaneGert,August2017Hurricane Gert developed as a tropical depression in the Bahamas in mid-August 2017 and attained hurricane status on 15th August. It reached its maximum strength two days later, with sustained winds of up to 105mph. The Hurricane weakened as it moved into the North Atlantic, away from the United States, and was absorbed by another low pressure system travelling across the Atlantic. It hit the northwest of Ireland on 22nd August, bringing with it heavy, localised rain. Met Éireann issued a Status Yellow warning for nineteen counties, including all of Connacht, Cavan, Donegal, Monaghan and Longford. This heavy rain caused flash flooding in Co. Donegal and parts of Northern Ireland, severe damage to homes and infrastructure such as roads and bridges, and the temporary closure of City of Derry Airport.
MeteorologicalConditionsA frontal system (the remnants of Hurricane Gert) crossed the Atlantic during the third week of August 2017, before affecting Ireland on 21st August. This gave heavy thundery rain mainly over the north of the country, and resulted in severe localised flooding disruption on the 22nd. On that day, 77.2mm of rainfall occurred at Malin Head, Co. Donegal, which accounted for over one-third of its monthly total and its wettest August day since 1955. 63mm of that rainfall fell in one 6-hour period.
Key ImpactThe Inishowen Peninsula in Co. Donegal was the most severely affected area in the Republic of Ireland following this weather event. It is estimated that 1,500km of the road network in that area were damaged, including six bridges which were destroyed, and some roads remained impassable for weeks. One of the worst affected routes was the R328 road between Moville and Derry, including the typically heavy traffic corridor between Muff and Greencastle. More than 100 people were rescued from vehicles caught in flash floods throughout the affected counties of Donegal, Derry and Tyrone. Some 3,500 properties were left without electricity as a result of the floods and lightning strikes, with delays in recovery as access for repair crews was curtailed in places by local road closures.
AdaptiveMeasuresGovernment announced funding of c. €11 million for flood relief schemes in Donegal following the flooding. The Department of Public Expenditure and Reform agreed mechanisms for the progression of priority flood relief schemes for Lifford, Burnfoot, Castlefin, Carrowkeel, Downings and Glenties with Donegal County Council in line with BBB principles.

47
Transport Sector | Climate Change Sectoral Adaptation Plan
Figure3.3:DamagetotheR328DerrytoMovilleRoadinCo.Donegalcausedbypluvialfloodingduringex-HurricaneGert,August2017.Source:BrianHutton/PA.
Figure3.4:ArainfallradarimagefromMetÉireannfrom20August2017,showingabandofprecipitationtrackinginanorth-easterlydirectionacrossIrelandduringex-HurricaneGert.Source:MetÉireann,2017.
48
Transport Sector | Climate Change Sectoral Adaptation Plan
High Winds (storms), Storm Surge and Sea Level Rise
As an island, Ireland’s coastal zone is a critical environment. In 2016 over 2 million people lived within 5km of the sea (CSO, 2016). Coastal areas contain extensive environmental systems e.g. estuaries, rivers and wetlands, which are particularly sensitive to the impacts of climate warming. These systems are heavily integrated and, to some degree, dependent on one another for their sustainability. The National Marine Planning Framework baseline report55 published by the Department of Housing, Planning and Local Government in September 2018 is part of the process of developing Ireland’s first marine spatial plan.
Due to the location of multiple critical infrastructure networks and hubs in close proximity to the coast, projected increase in the intensity of high winds, storms and storm surges, coupled with ongoing and projected sea level rise (SLR), poses significant risks for the transport sector. Transport infrastructure vulnerable to coastal inundation and erosion will be at increased risk, particularly infrastructure located in low-lying coastal areas, on eroding coastlines and on estuaries; for instance, the Dublin to Rosslare rail line, which is particularly susceptible to coastal erosion due to the soft bedrock in the region.
National port infrastructure is especially sensitive to storm surge and SLR, with potential for severe impacts including damage to port infrastructure, damage to vessels, disruption to navigations and implications for passenger safety. Storm activity can also cause the channels leading into ports becoming blocked with large amounts of sand silt and other materials driven by storm activity. Changes in sea level will have impacts on dredging requirements at ports and their natural scouring capability, particularly at estuarial ports.

49
Transport Sector | Climate Change Sectoral Adaptation Plan
CASE STUDY 2:
Storms(HighWinds)andStormSurge
Overview–StormOpheliaStorm Ophelia made landfall over Ireland as an extra-tropical storm on 16th October 2017. Gusts of up to 156km/h were observed during Storm Ophelia at Roche’s Point station, Co. Cork. A Status Red Severe Weather Warning was issued by Met Éireann, which implies that people should take action to protect themselves and their properties. The storm caused major power outages, lifted roofs, felled trees and coastal flooding. Three lives were also tragically lost. Most schools and businesses took the decision to close for the day.
MeteorologicalConditionsOphelia originated as an upper-level trough in the Atlantic Ocean and initially had the characteristics of an extra-tropical low pressure system. It travelled north-eastwards and strengthened to become a tropical storm and subsequently a Category 3 Hurricane. It began to weaken by 15th October, and was classified as a post-tropical storm when it made landfall at Valentia Observatory, Co. Kerry, on the morning of 16th October. It tracked north-north-eastward across Ireland and steadily weakened throughout the day.
Shannon Airport experienced strong gale force winds with gusts of up to 122km/h, while Dublin Airport saw gale force winds with gusts of up to 104 km/h.
Key Impact All public transport services were suspended on 16th October, including Bus Éireann, Dublin Bus, Luas, DART and Irish Rail, following the issuing of Met Éireann’s Status Red weather warning. Ireland’s airports remained open throughout the Storm but experienced flight disruption including cancelled and delayed flight departures and arrivals, particularly in Cork Airport. Over 300,000 properties were left without power. All ferry sailings to the UK were cancelled on the 16th. Many roads were impacted due to felled trees and debris from the storm. Very strong winds with violent gusts made driving conditions hazardous, especially for the more vulnerable road users e.g. cyclists, pedestrians, motorcyclists and high sided vehicles.
AdaptiveMeasuresThe National Emergency Coordination Group issued statements on public safety advising citizens to avoid unnecessary travel and Met Éireann provided hourly updates on their website, social media platforms and traditional media sources. Contingency planning measures were activated by the ESB.

50
Transport Sector | Climate Change Sectoral Adaptation Plan
Figure3.6:FelledtreesblockCentreParkRoadinCorkCityafterStormOphelia,October2017.Source:Darragh McSweeney/Provision.
Figure3.5:Tropical-storm-forcewindspeedprobability(5dayforecast)providedbytheU.S.NationalHurricaneCentreon13October2017.Source:MetÉireann.

51
Transport Sector | Climate Change Sectoral Adaptation Plan
CASE STUDY 3:
StormSurge(CoastalFlooding)andSeaLevelRise(SLR)
Overview–StormCallum,October2018.Storm Callum hit Ireland on 12th October 2018 and brought the windiest weather of that month and widespread heavy rain. Due to coincidentally high tides on the west coast of Ireland and a regional trend towards sea level rise of c. 3.5 cm per decade (Desmond, 2017), Storm Callum caused flooding in many areas and around 60,000 households and businesses experienced disruption to their electricity supply. Of particular concern was the high tide in Galway City. The impact of Storm Callum occurring at the same time as high spring tides was minimised due to the actions of Galway City Council who constructed a temporary aquadam along the banks of the Corrib River.
MeteorologicalConditionsStorm Callum had the lowest early season pressure for an extratropical Atlantic storm since at least 1979. Mean wind speeds were storm force on 11th and 12th October at Sherkin Island, Co. Cork and Belmullet, Co. Mayo respectively. The highest gust reported during Storm Callum was 124km/h at Belmullet. The highest daily rainfall of October 2018, measuring 29.2 mm in Moore Park, Co. Cork, was also reported on the 12th.
Met Éireann issued a Status Orange wind warning for 13 counties during Storm Callum. Orange weather warnings indicate weather conditions which have the capacity to impact significantly on people in the affected areas, and that they should prepare themselves appropriately for anticipated conditions.
Key Impact Storm Callum coincided with high spring tides on Ireland’s west coast. The Salthill Promenade in Galway City had already been closed due to these high tides, and the strong winds of Storm Callum were predicted to exacerbate flooding in the area. The morning of 12th October saw high tides combine with a storm surge.
AdaptiveMeasuresTo minimise damage from the rising sea water, Galway City Council installed an 80m portable dam at Spanish Arch and flood gates in Salthill ahead of the arrival of Storm Callum. More than 5,000 sandbags were available to the residents of Galway City. While flooding was mostly minimised due to these efforts, a number of areas in Galway were flooded during the storm.

52
Transport Sector | Climate Change Sectoral Adaptation Plan
Figure3.8:Schooltransportservices impactedbystormsurge inGarretstown,Co.CorkduringStormCallum,October2018.Source:IrishExaminer/MichaelPrior.
Figure3.7:PedestrianininclementconditionsinSalthill,Co.Galway,duringStormCallum,October2018.Source:BrianLawles/PA Wire.

53
Transport Sector | Climate Change Sectoral Adaptation Plan
3.4.2 Moderate Climate Risk
Temperature ExtremesThe transport sector has demonstrated a high level of resilience to current temperature conditions, with limited adverse impacts observed in response to increasing average annual temperatures. Nonetheless, temperature extremes (both heat and cold) can impact more strongly resulting in damage to critical assets and significant travel disruption. In addition, temperature extremes can interact with other climate impacts such as precipitation extremes; the ice freeze-thaw process can cause surfaces to become saturated with excess melt water, increasing flood risk.
With increasing air temperatures, an increase in the intensity and duration of heatwaves is expected. Under the high-emission scenario it has been suggested that summer conditions as warm as those experienced in 1995 - the warmest summer on record for Ireland - could occur as frequently as once in seven years by the end of the century56. In 2018 the highest average annual temperature in 23 years was recorded in some locations, including Oak Park in Carlow where it averaged 16.8˚C, the highest at that station since 199557. A preliminary analysis of the heatwave across northern Europe by the World Weather Attribution (WWA) network found that human-caused climate change made it five times more likely to have occurred. The findings suggest that rising global temperatures have increased the likelihood of such hot temperatures by five times in Denmark, three times in the Netherlands and two times in Ireland58. High temperatures can cause severe degradation to infrastructure, in particular road surface deform and rail buckling incidents. In relation to public transport, over-heating of trains, trams and buses can greatly discommode passengers and increase the need for air-conditioning. Temperature control measures may also be required in transport hubs, particularly airports and public transport depots. Higher average temperatures may also to lead to a rise in active travel, with positive co-benefits for carbon mitigation; however, temperature extremes pose risks for public health and safety, as walkers and cyclists can be exposed to UVA/UVB, possible dehydration, and sunstroke.

54
Transport Sector | Climate Change Sectoral Adaptation Plan
CASE STUDY 4:
TemperatureExtremes:HeatwaveandDrought
Overview–IrishSummerHeatwave,June–August2018The summer of 2018 was one of the hottest and driest on record, with heat wave and drought conditions affecting many parts of the country. In Ireland, a heatwave is defined as five days with temperatures over 25°C and drought is defined as a period of 15 or more consecutive days on which no significant rain fell. 32°C, recorded at Shannon Airport, Co. Clare on 28 June 2018, is the highest temperature ever recorded at a synoptic station in Ireland. Official heatwave conditions were recorded at 15 stations at various times between 24 June and 4 July. Drought conditions were recorded across the country from late June onwards. While this period of good weather was welcomed in general by the Irish public, it also had some detrimental effects on transport infrastructure such as melting road surfaces and the spread of gorse fires near rail infrastructure on Bray Head.
MeteorologicalConditionsThe highest maximum temperature of 32°C was recorded at Shannon Airport, Co. Clare on 28th June 2018, which was the highest temperature ever recorded at a synoptic station in Ireland. The total summer rainfall for Cork Airport was 109.5mm, the driest summer since records began in 1962.
All bar one of the rainfall totals measured by Met Éireann fell below their Long-Term Average for June 2018, and all were below their average for July. The percentage of monthly rainfall for June 2018 was as low as 5% at Phoenix Park, Dublin which was its driest June since 1941. An absolute drought occurred at Belmullet the same month, and partial droughts were recorded during summer 2018 at Dublin Airport, Phoenix Park and Oak Park. The prolonged dry spell led to water restrictions and a fodder crisis. 15 synoptic stations recorded heatwave conditions and 21 synoptic stations recorded drought conditions during the summer.
Key Impact Local councils had to provide grit for roads during the heatwave, as the high temperatures meant the surfaces were melting during daytime hours. In addition, drought conditions facilitated the rapid spread of a gorse fire on Bray Head, causing damage to electricity and telecommunications infrastructure and the cancellation of DART services for almost two days. While no severe impacts to passenger health were reported by transport service operators, vulnerable persons (including pregnant women, infants and the elderly) were at risk of thermal discomfort as interior cabin temperatures rose and may have limited travel choices for these groups.
AdaptiveMeasuresReplacement bus services were provided to public transport passengers by Irish Rail while repair works were ongoing. Irish Rail provided free bottles of water at depots and stations to improve rail passenger comfort during the heatwave.

55
Transport Sector | Climate Change Sectoral Adaptation Plan
Figure3.10:ComplimentarybottlesofwaterprovidedtoIrishRailcustomersduringtheheatwave,July2018.Source:IrishRail.
Figure3.9:Gorsefiresinaperiodofhightemperatures,Wicklow,July2018.DARTserviceswerecancelledduetofiredamagesustainedtoelectricalandtelecommunicationsnetworks.Source:ÓglaighnahÉireann.
56
Transport Sector | Climate Change Sectoral Adaptation Plan
CASE STUDY 5:
TemperatureExtremes:ColdSnapsandBlizzardConditions
Overview–StormEmmaandthe“BeastfromtheEast”,February–March2018
Ireland experienced low temperatures, high winds and heavy snowfall in the first week of March 2018. Temperatures struggled to rise above freezing (with record low daily maxima in several locations) as bitterly cold easterly winds swept in over the country causing widespread disruptions to road, rail and air travel. Over 50cm of snow depths were reported at some locations, with drifts of several feet reported on higher ground and in isolated rural areas. Some rural villages were cut off for days.
MeteorologicalConditions
An exceptionally cold polar continental easterly airstream coupled with the development of ‘Storm Emma’ and its associated frontal systems brought strong winds, widespread snow, ice and low temperatures to Ireland in early March 2018. On 1st and 2nd March, temperatures did not rise above zero at a number of locations. These are known as ‘ice days’, and apart from 2018 there were no ice days recorded in Ireland in March at any Met Éireann stations since 1942. The lowest air temperature of -7°C was recorded on 1st March at Cork Airport. These dates also saw strong gale force 9 winds at Malin Head, Co. Donegal.
Snowfall was varied across the country, and the highest depths were recorded in the South, East and Midlands. Glenmacnass, Co. Wicklow recorded a snow depth of 69cm on 3rd March. Snow depths became immeasurable at times in some places due to significant drifting in the strong easterly winds.
Key Impact
Met Éireann issued a Status Red warning for snowfall, which led to extensive flight cancellations into and out of Ireland’s airports and stoppage of all public transport services during Storm Emma. Approximately 250 people were forced to sleep in Dublin Airport after road conditions prevented them leaving the airport. Motorists were advised not to drive unless absolutely necessary; road conditions were extremely hazardous for those who had to undertake a journey. Certain major roads were rendered impassable at times due to snowfall and treacherous road surfaces, including parts of the M1 motorway.
AdaptiveMeasures
The NECG (National Emergency Coordination Group) for Extreme Weather met in advance of forecasted snow to coordinate the national response and disseminate advice to the public. The public were advised to monitor transport operators web sites and social media for up-to-date information regarding their travel needs. The Defence Forces were placed on standby to assist with travel recovery operations, including rescue of citizens trapped in their cars by snowfall in Co. Dublin, and the National Ambulance Service prioritised emergency calls. No fatalities on transport networks were recorded. Irish Rail undertook inspections before rail services resumed and test runs of Luas and DART services took place to check the safety of electric lines.

57
Transport Sector | Climate Change Sectoral Adaptation Plan
Figure3.11:Heavysnowfall forcedactivities toceaseat thePortofCorkduringStormEmma,February-March2018.Source: Port of Cork.
Projected occurrences of cold snaps and ice days are expected to decrease, reducing dangers to traffic and passenger safety from frost on road and pavement surfaces and from black ice, less road degradation. The relative rarity of these extreme cold days may however result in greater disruption to service and safety practices in the event of their occurrence. Icy conditions and compacted snow on roads can cause severe congestion, slow speeds and an increase in traffic accidents, while public transport services can face delays. Salt and grit surface treatments surfaces on major roads require salt stocks to be steadily maintained and shortages can occur in successive periods of low temperatures. In instances of extreme snowfall, transport networks can become impassable leading to deployment of emergency planning measures and systemic shutdown, with far-reaching social and economic consequences. For example, in March 2019, a snow event caused disruption to some of the motorway network,

58
Transport Sector | Climate Change Sectoral Adaptation Plan
Figure3.12:SnowdepthsrecordedatMetÉireannclimateandsynopticstationsbetween28thFebruaryand3rdMarch2018. Source: Met Éireann.
particularly in County Kildare. Though the event was forecast and a yellow weather warning was in operation, it demonstrated difficulties that can arise when communicating with the public and for emergency responders and infrastructure providers in mobilising resources to address a rapidly evolving situation (in this instance it was reported that snow ploughs were caught in traffic)59.
59
Transport Sector | Climate Change Sectoral Adaptation Plan
Coastal Erosion
Ireland has a coastline of approximately 6000km, half of which is categorised as soft coastline (non-rocky), and it is estimated that up to 500km is actively eroding and considered to be at risk. One report estimated that c. 20% of Ireland’s coast is at risk of erosion60. It is however difficult to quantify overall erosion rates for Ireland due to deviations in shoreline change such as variations in longshore drift, external sediment supply, the effects of storm surges and human development and landforms61.
The topography of the Atlantic coastline is defined by a high relief (500 m) and rocky cliffs interspersed with bays. The coast is also characterised by high wave energy generated by Atlantic Ocean winds. As coastal erosion may weaken the structure of these rocky cliffs, which are particularly vulnerable due to their geological nature, parts of these structures may sometimes collapse53. The topography of the Irish Sea coastline is composed mainly of low-lying regions with non-consolidated sediments and soft fluvio-glacial tills. This coast typically receives c. 20% of the wave energy levels of the Atlantic coast; nevertheless, coasts most susceptible to erosion are those composed of unconsolidated (soft) sediment. This type of topography is most common on Ireland’s eastern and southern coastline and in estuaries where erosion rates can reach values of 1-2m annually53. A number of primary transport routes are located in these areas and are potentially susceptible to both gradual changes in rates of coastal erosion due to SLR and the impacts of increasing severe coastal storms.
CASE STUDY 6:
Coastal Erosion
Overview–ErosionoftheEasternRailCorridorThe main rail route between Dublin Connolly Station and Rosslare EuroPort is the Dublin to Rosslare railway. It is an important route as it connects with ferry services to the United Kingdom and mainland Europe. The Eastern coastline is made up of soft sedimentary rock (carboniferous limestone and old red sandstone) covered with sandy soil, which is exposed to long-term ongoing coastal erosion due to wind, rain and sea level rise. As sections of the rail infrastructure are directly adjacent to the shoreline it is subject to erosion and can be prone to inundation and wash out of the ballast area. To date the most comprehensive national erosion study has been undertaken by OPW as part of the Irish Coastal Protection Strategy Study. For the south east section of Ireland’s coastline the mean annualised erosion rate for sections where erosion hazards were identified was approximately 0.6m.

60
Transport Sector | Climate Change Sectoral Adaptation Plan
CASE STUDY 6:
Coastal Erosion (continued)
MeteorologicalandClimatologicalConditionsFor the period 1961-1990, average monthly wind speeds at Rosslare were 11.5 knots; average daily temperatures between 7.6 and 12.6 degrees and average monthly total precipitation was 877.2 mm (Met Éireann). Typical annual mean significant wave heights along this coastline vary from 1–2 m. The combination of high water levels along with high waves has a strong influence on coastal retreat in this area. The increase in frequency of storm cycles (12 separate incidents of storm force winds recorded in winter 2013-2014; 11 storms in winter 2015-2016 and 4 storm cycles in winter 2016-2017) has resulted in interrelated impacts on the physical environment such as accelerated levels of erosion, coastal flooding, fluvial flooding and mean wave height.
Key ImpactsThere was a 135m recession of the coastline between 1905 and 1990 at an average of 1.4m per year. This rate has accelerated in recent years to 2m annually. Notably, the sea cliff near Ballygerry at Rosslare Harbour suffers erosion of up to two metres annually which could mean that the rail corridor could be unable to be used by 2030. From data and modelling prepared by the OPW, it is estimated that the coastline will continue to recede and could impact the existing rail corridor before 2030.
AdaptiveMeasuresTwo studies were tendered in 2018 to assess coastal vulnerability along the east coast.
• Wexford County Council commissioned RPS Consulting Engineers to prepare a report highlighting the vulnerability of the Rosslare Strand area which includes 21 erosion zones. The firm identified that rock revetments would be the most effective barrier against coastal erosion, and these can be placed in a number of locations to mitigate the effects of erosion. Environmental and economic assessments will be carried out before funding is sought. It is envisaged that construction may begin in 2020/2021.
• In 2018 Irish Rail, together with Wicklow County Council, commissioned Arup Consulting Engineers to study coastal erosion along the Wicklow- Dún Laoghaire-Rathdown coastline, where the rail network runs along or near the coast for most the route between Dublin and Wicklow. The study will assess the long-term stability of significant sections of the track and other shore line locations, particularly with the effects of SLR exacerbated by climate change, and will include hydraulic modelling and assessments of coastal process; site investigations; topographical and bathometric surveys; as well as environmental and ecological assessments. The study is expected to conclude in 2020.

61
Transport Sector | Climate Change Sectoral Adaptation Plan
Figure3.13TidalsurgefloodingexacerbatedbySLRatSalthillandMonkstownDARTstationinDúnLaoghaire-Rathdown,Co. Dublin, February 2018. Source: Irish Rail.
Figure3.14:TheEasternraillineissubjecttoerosionasittraversestheBreachesRiveratKilcoole,Co.Wicklow.Source:ÍarnródÉireann LIDAR Study, 2011.

62
Transport Sector | Climate Change Sectoral Adaptation Plan
4 Priority Impact Assessment

63
Transport Sector | Climate Change Sectoral Adaptation Plan
4.1 Future-Proofing Transport: A Thresholds Analysis Approach Future sectoral consequences of high-priority and moderate-priority climate risks for the transport sector are further explored through a thresholds analysis approach, including a description of spatial and temporal factors contributing to exposure, sensitivity and associated uncertainties. Thresholds analysis involves identifying the critical levels that will cause a system to suffer an intolerable shift in performance; they can be used to prioritise actions in adaptation planning62. This process can also be deployed to determine a level of acceptable sectoral risk. The purpose of this priority impact assessment is to determine the thresholds beyond which Ireland’s future transport system, or key transport subsector within that system, can no longer support business-as-usual operation and subsequently fulfil its future economic, social and environmental objectives. These objectives include the high-level national strategic objectives as set out in Project Ireland 204033; namely, to support:
• Enhanced regional accessibility;• Sustainable mobility;• High-quality international connectivity; and• Transition to a low-carbon and climate-resilient society.
This understanding of systemic function for transport is in line with the international approach towards critical infrastructure set out by the European Council in Directive 2008/114/EC on the Identification and Designation of European Critical Infrastructures and the Assessment of the Need to Improve their Protection63. The Directive defines critical infrastructure as “critical
Figure4.1:Disruptionstoinfrastructureandtransportservicescancauseknock-onimpactstopublicandprivatetravelandcommercialactivity.Source:TII.

64
Transport Sector | Climate Change Sectoral Adaptation Plan
infrastructure’ means an asset, system or part thereof located in Member States which is essential for the maintenance of vital societal functions, health, safety, security, economic or social well-being of people, and the disruption or destruction of which would have a significant impact in a Member State as a result of the failure to maintain those functions.”
Most threshold assessments focus on mid-century climate change models due to the inherent uncertainty in climate projections beyond this point and reflecting the current availability of reliable climate information. High- and moderate-priority climate risks can also evolve (increasing or decreasing in severity) over time. In addition, investment in transport assets, which are generally designed for long service lives (for example, much of Ireland’s extant transport infrastructure in road and rail has been in place for c. 100+ years)64 should accordingly be considered over a long-term planning horizon.
The long-term uncertainty of the future climate system means that, in certain instances, establishing indicative adaptation pathways only is the most appropriate response. A watching brief of longer term climate modelling outputs will be observed; the RCM simulations for Ireland are presently being developed to cover the time period 1976-210065. This work is being conducted by the Irish Centre of High-End Computing (ICHEC) and Met Éireann, through an EPA, Met Éireann & Marine Institute funded project. Preliminary results are in line with previous work and suggest it is likely that Ireland will experience enhanced temperature rises by end-of-century, wetter winters with a clear north-west to south-east gradient and a general decrease in wind speeds during summer times. It can be expected that future sectoral adaptation planning will be able to identify long-term risks, and their associated costs, with greater certainty.
The EEA estimates that over the period 1980-2016, the total reported economic losses caused by weather and climate-related extremes in the EU amounted to approximately €436 billion (in 2016 Euro values)66. The Central Bank of Ireland has highlighted that financial stability is threatened if the systemic risks associated with climate change are ignored67, emphasising that “climate resilience is an integral component to the overall resilience of the financial system and the economy”. Nonetheless, noting the typically high investment associated with infrastructure assets, ‘worst-case scenario’ planning to address all potential climate outcomes may be cost-prohibitive. An appropriate adaptation approach may be to implement scalable climate responses in medium-term planning which may be expanded to protect against potential growth in climate impacts post-2050.
4.1.1 Thresholds Analysis for the Transport Sector
The first steps in thresholds analysis are to characterise the system and investigate the possible impact of climate change on that system. Chapter 2 of this plan described and characterised Ireland’s transport infrastructure networks; cross-sectoral interdependencies were also identified, such as the communications and energy networks, where loss of functionality in these systems may induce cascading failures in the transport network. Chapter 3 of this plan determined the climate ‘trends’ (slowly changing variables) and climate ‘shocks’ (extreme weather events) that are projected under climate change and sets out high-level qualitative risk analysis for the transport sector at a national level. Figures 4.2 and 4.3 outline the high-and moderate-priority climate risks identified in the sector to mid-century.

65
Transport Sector | Climate Change Sectoral Adaptation Plan
 Pluvial&Fluvial
Flooding
Landslides
BridgeScour
Coastal&EstuarineFlooding
FelledTrees&Debris
CoastalErosion
CoastalErosion
Coastal&EstuarineFlooding
High-Priority Climate Impacts
& Risks
PrecipitationHigh Winds/ Storm Surge
Sea Level Rise
Moderate-Priority Climate Impacts
& Risks
High Temperature
Extremes
Low Temperature
Extremes
Coastal Erosion
CombustionRisk
RailBuckling
 SurfaceDegradation
PassengerDiscomfort
Snow&BlackIce
BlizzardConditions
Freeze-thawMeltwaterFlooding
PassengerDiscomfort
Lossofinfrastructure
Figure4.2:Summaryofprojectedhigh-priorityclimateimpactsandassociatedrisksforthetransportsectortomid-century.
Figure 4.3: Summary of projectedmoderate-priority climate impacts and associated risks for the transport sector tomid-century.
4.2. Geospatial and Temporal Distribution of Transport RisksThe impact of climate change on transport networks varies depending on geographic location. Analysis is currently underway to help identity the geospatial distribution of climate change impacts in Ireland (see the forthcoming EPA research project Critical Infrastructure Vulnerability to Climate Change 2016-CCRP-MS.41 (CIViC)). To complement this research and to further the development of this plan, a suite of maps illustrating projected downscaled

66
Transport Sector | Climate Change Sectoral Adaptation Plan
regional distribution of changes to certain meteorological parameters was produced and overlaid with the transport networks highlighting areas of highest risk. This work was carried out in conjunction with ICHEC, TII and Met Éireann and based upon the projections outlined in EPA Report No. 159: Ensemble of regional climate model projections for Ireland43. A high spatial resolution (4 km) was employed providing an indication to transport stakeholders of infrastructure or sections of infrastructure networks that may be at greater risk in the coming years; presuming an indicative relationship between climate impact and climate risk. While in this plan only the existing transport infrastructure has been mapped it will be possible to also include future planned infrastructure under Project Ireland 2040 once route locations are finalised and to identify and prioritise likely future risks accordingly. Similarly, there is currently consideration to develop a national-scale map of active travel infrastructure which may then be incorporated. This exercise may be useful to inform recasting of appraisal guidelines for future infrastructure projects to assure appropriate levels of climate resilience.
The maps presented are indicative only due to the level of uncertainty surrounding climate change projections. Higher confidences in the regional projections of temperature exist compared to wind and rainfall projections. Undoubtedly, future improvements in climate modelling will alter the present climate change projections as uncertainties are gradually reduced. Cross-referencing with other resources, such as the Irish National Flood Hazard Mapping developed by the OPW, landslide susceptibility mapping developed by the Geological Survey of Ireland (GSI), and the outputs of the CIViC project, which could be employed to corroborate and future refine the presented geospatial indications. In addition, the maps could also benefit from future expansion to include co-located infrastructural assets in the communications and energy (gas and electricity) networks.
4.2.1 HighPriorityClimateImpact:Precipitation
The localised nature and temporal variability of precipitation makes it less amenable to statistical analyses and regional variations in precipitation between east and west depend on which combination of regional and global climate models is employed. Conservative results show significant projected decreases in mean precipitation during spring and summer and over the entire year by mid-century. The projected decreases are largest for summer, with “likely” values ranging from 0% to 13% and from 3% to 20% for the medium- to low-emission (RCP4.5) and high-emission scenarios (RCP8.5), respectively. The drying signal for autumn is less robust. A projected increase in mean precipitation for winter was noted over most of Ireland for the high-emission scenario. Heavy rainfall events are projected to increase substantially during the winter and autumn months. The number of extended dry periods is also projected to increase substantially during autumn and summer and over the entire year by mid-century. The projected increases in dry periods are largest for summer, with “likely” values up to 40% for both emission scenarios43. Assuming a relationship between flooding (pluvial and fluvial) and increased heavy precipitation events in autumn and winter, it can be inferred that infrastructure located within the north and west of Ireland may be at greater risk, with a possible impact on road and rail embankment and verge stability in these catchments or regions, as well as changing patterns of situation for ports42. However, the projections of mean precipitation for autumn and winter exhibited great uncertainty and analysis with reference to OPW flood mapping is recommended.
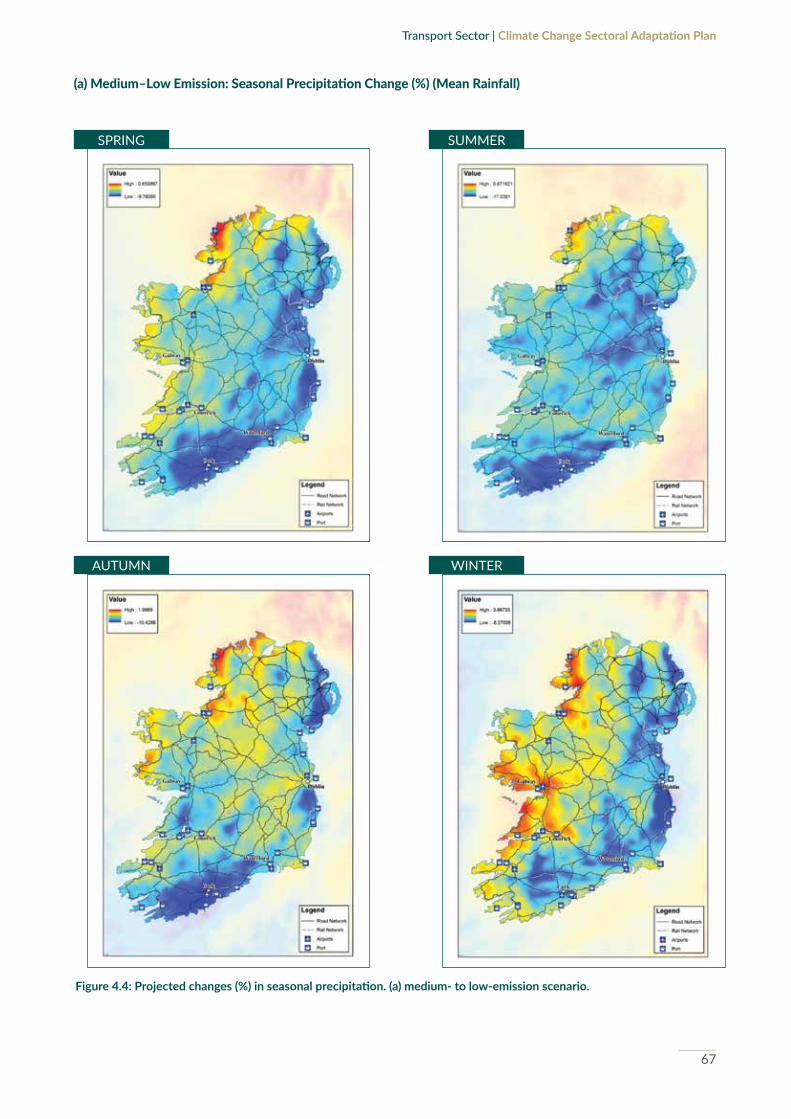
67
Transport Sector | Climate Change Sectoral Adaptation Plan
SPRING
AUTUMN
SUMMER
WINTER
Figure4.4:Projectedchanges(%)inseasonalprecipitation.(a)medium-tolow-emissionscenario.
(a) Medium–Low Emission: Seasonal Precipitation Change (%) (Mean Rainfall)
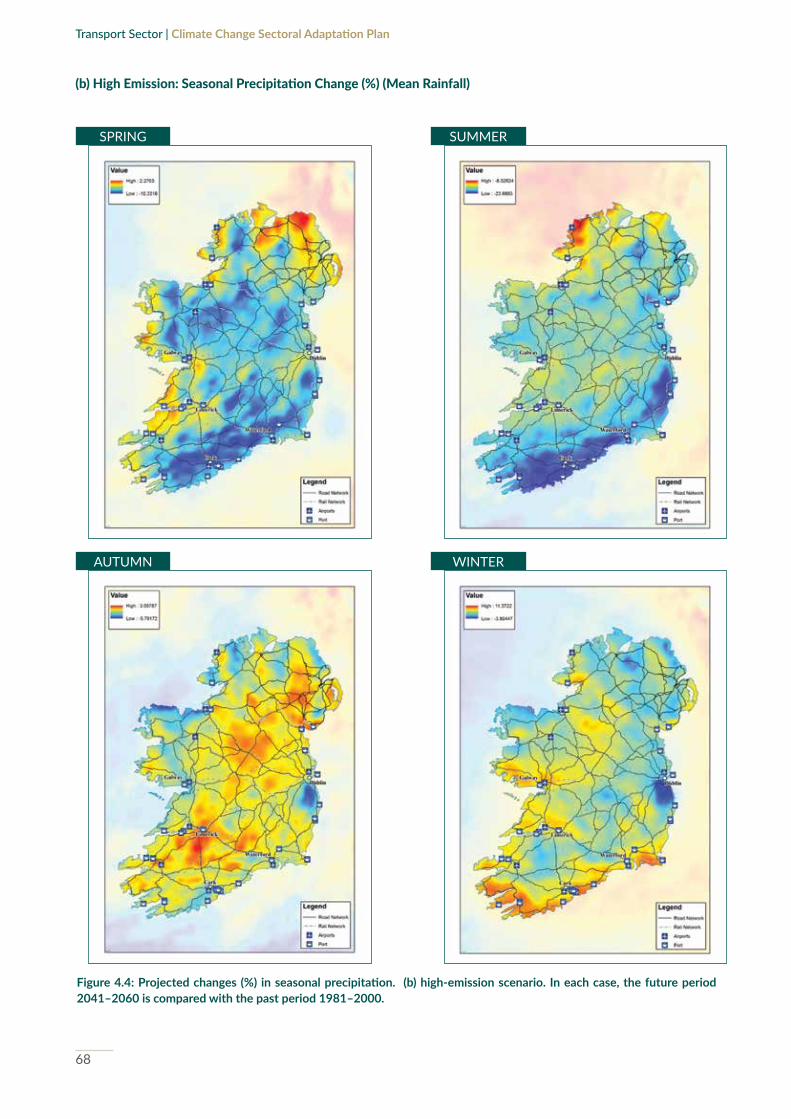
68
Transport Sector | Climate Change Sectoral Adaptation Plan
SPRING
AUTUMN
SUMMER
WINTER
Figure4.4:Projectedchanges(%) inseasonalprecipitation. (b)high-emissionscenario. Ineachcase,thefutureperiod2041–2060 is compared with the past period 1981–2000.
(b) High Emission: Seasonal Precipitation Change (%) (Mean Rainfall)

69
Transport Sector | Climate Change Sectoral Adaptation Plan
(a) Medium–Low Emission: Seasonal Projected Changes in Standard Deviation of Daily Precipitation (Min. & Max. Projected Change)
SPRING
AUTUMN
SUMMER
WINTER
Figure4.5:Seasonalprojectedchanges(%) inthestandarddeviationofdailyprecipitation.(a)mediumtolow-emissionensemble.

70
Transport Sector | Climate Change Sectoral Adaptation Plan
(b) High Emission: Seasonal Projected Changes in Standard Deviation of Daily Precipitation (Min. & Max. Projected Change)
Figure4.5:Seasonalprojectedchanges(%)inthestandarddeviationofdailyprecipitation.(b)high-emissionensemble.Ineach case, the future period 2041–2060 is compared with the past period 1981–2000.
SPRING
AUTUMN
SUMMER
WINTER

71
Transport Sector | Climate Change Sectoral Adaptation Plan
4.2.2 High Priority Climate Impact: High Winds
The number of very intense storms in the Atlantic is expected to increase in the coming years. Projections indicate that the winter tracks of these very intense storms may extend further south, meaning that more of these storms will reach Ireland43. It is important, however, to note that storms of this magnitude are rare events and analysis of wind projections on a regional level should be considered with caution. The projected increase in mean sea level pressure (MSLP) will probably lead to a decrease in mean wind speed (and wind power) during summer, spring and autumn, when intense storms are rare. Furthermore, the projected increase in very intense storms is likely to be partially responsible for the projected increase in extreme wind speeds during winter43. Downscaling to a regional level for wind speed shows variation between the medium-low emission and high emission scenarios and accuracy in identifying particularly vulnerable regions is therefore limited; but increase in extreme wind speeds over the south and east of Ireland may be conservatively inferred43 with corresponding impacts to infrastructure located in these regions.
Figure4.6:TracksofstormswithacoreMLSPoflessthan940hPa(hectopascals)andwithalifetimeofatleast12hours:(a)PastRCMsimulationsfor1981–2000;(b)climatepredictionsimulationsfor2041-2060,basedonRCP8.5scenario43.

72
Transport Sector | Climate Change Sectoral Adaptation Plan
Figure4.7: Seasonal projected changes (%) in the standarddeviationofdailymean60-mwind speed. (a)Medium- tolow-emission ensemble.
(a) Medium-Low Emission: Seasonal Change (%) in Standard Deviation of Daily Mean 60m Wind Speed
SPRING
AUTUMN
SUMMER
WINTER

73
Transport Sector | Climate Change Sectoral Adaptation Plan
Figure4.7:Seasonalprojectedchanges(%)inthestandarddeviationofdailymean60-mwindspeed.(b)high-emissionensemble. In each case, the future period 2041–2060 is compared with the past period 1981–2000.
SPRING
AUTUMN
SUMMER
WINTER
(b) High Emission: Seasonal Change (%) in Standard Deviation of Daily Mean 60m Wind Speed

74
Transport Sector | Climate Change Sectoral Adaptation Plan
4.2.3 HighPriorityClimateImpact:SeaLevelRise(SLR)
Downscaled (national-level) high-resolution models for projected SLR over the 21st century are not currently available; however, the rise in sea level relative to land along most European coasts is projected to be similar to the global average. It is expected that global mean SLR during the 21st century will very likely occur at a higher rate than during the period 1971–2010. Process-based models considered in the IPCC AR5 project a rise in sea level over the 21st century (2100 vs. 1986–2005 baseline) that is likely in the range of 0.28–0.61 m for an extremely low emissions scenario (RCP2.6) and 0.52–0.98 m for a high emissions scenario (RCP8.5), although substantially higher values of sea level rise cannot be ruled out68. Under the medium-low emissions scenario (RCP4.5), Ireland will likely experience SLR between 0.3 m and 0.5 m.
The vulnerability of Ireland’s coasts to SLR is related to physical characteristics of the coast and a range of variables known as coastal indicators, which include cliff type, coastline orientation, regional coastal slope, tidal range, significant wave height and long-term shoreline erosion and accretion rates69. The OPW’s Irish Coastal Protection Strategy Study (IPCSS)70 sets out a strategic level assessment of coastal flooding and coastal erosion hazard and risk on a local level which projected future scenarios for the year 2100 assuming an allowance for mean sea level rise of + 500 mm and + 1000 mm for a low and high scenario respectively. A separate coastal vulnerability mapping initiative which is currently being undertaken by GSI is expected to produce maps denoting the relative susceptibility of the Irish coast to adverse impacts of SLR; the first phase of CVI mapping (2019-2020) will map areas from Co. Louth to Co. Wexford.

75
Transport Sector | Climate Change Sectoral Adaptation Plan
4.2.4 Moderate Priority Climate Impact: High Temperatures
Projections indicate a rise of 1–1.6°C in mean annual temperatures, with the largest changes seen in the east of the country. The annual and seasonal projected increases are statistically significant for both emission scenarios, although warming is greater for the extremes (i.e. hot or cold days)43 and both daytime and night time temperatures are expected to rise. Transport infrastructure located in regions where seasonal temperature rise is more pronounced may experience changes in energy demand for depots and fixed infrastructure (ports and airports) in both winter and summer, as demand for heating and cooling needs may change. While infrastructure is likely to be more vulnerable to temperature extremes or breaching thresholds rather than increasing temperature averages, it is nonetheless possible that gradual thermal expansion of roads and rail lines (leading to degradation and disintegration) may have a higher rate of occurrence within the regions identified below42.
Figure4.8:Projectedchangeinrelativesealevelin2081-2100comparedto1986-2005forthemedium-lowemissionsce-narioRCP4.5basedonanensembleofglobalclimatemodels.Projectionsconsiderlandmovementduetoglacialisostaticadjustmentbutnotlandsubsidenceduetohumanactivities.Source:EEA,2017.

76
Transport Sector | Climate Change Sectoral Adaptation Plan
SPRING
AUTUMN
SUMMER
WINTER
(a) Medium–Low Emission: “Very Likely” Mean Seasonal Temperature Increase (oC)
Figure4.9:The“verylikely”seasonalincreaseintemperatureforthe(a)medium-tolow-emission.

77
Transport Sector | Climate Change Sectoral Adaptation Plan
Figure4.9:The“verylikely”seasonalincreaseintemperatureforthe(b)high-emissionscenarios.Ineachcase,thefutureperiod 2041–2060 is compared with the past period 1981–2000.
SPRING
AUTUMN
SUMMER
WINTER
(b) High Emission: “Very Likely” Mean Seasonal Temperature Increase (oC)
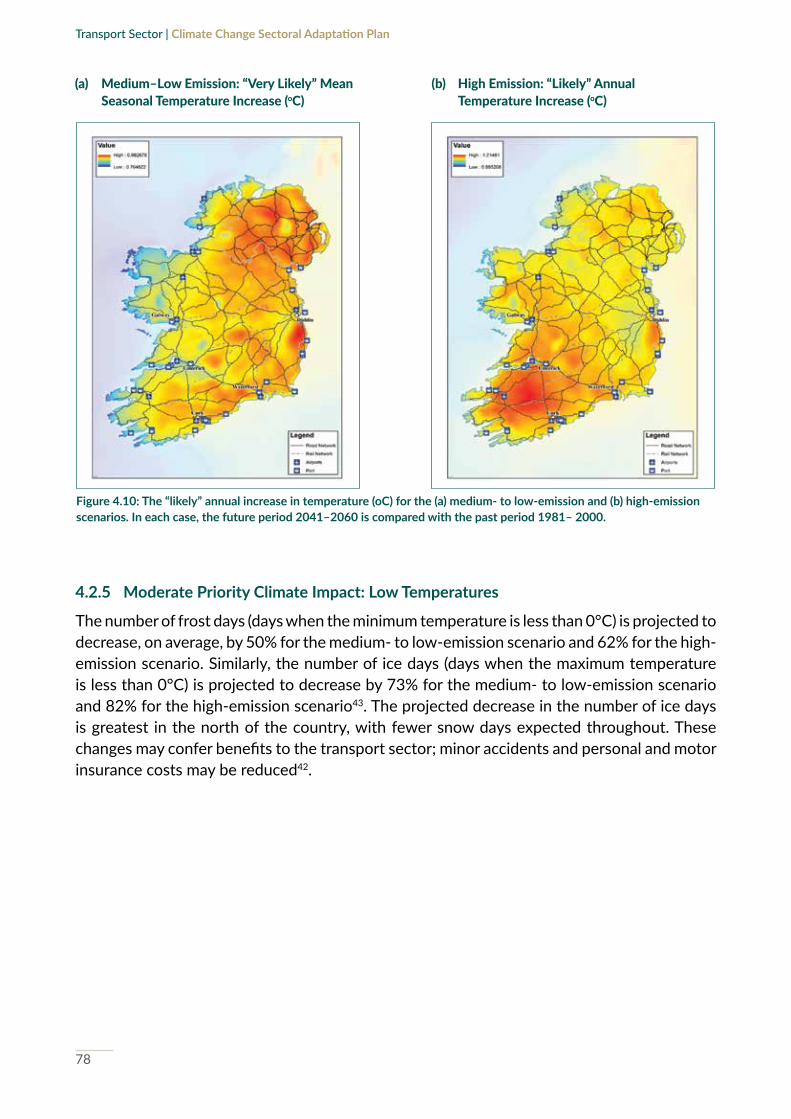
78
Transport Sector | Climate Change Sectoral Adaptation Plan
(a) Medium–Low Emission: “Very Likely” Mean Seasonal Temperature Increase (oC)
(b) High Emission: “Likely” Annual Temperature Increase (oC)
Figure4.10:The“likely”annualincreaseintemperature(oC)forthe(a)medium-tolow-emissionand(b)high-emissionscenarios. In each case, the future period 2041–2060 is compared with the past period 1981– 2000.
4.2.5 Moderate Priority Climate Impact: Low Temperatures
The number of frost days (days when the minimum temperature is less than 0°C) is projected to decrease, on average, by 50% for the medium- to low-emission scenario and 62% for the high-emission scenario. Similarly, the number of ice days (days when the maximum temperature is less than 0°C) is projected to decrease by 73% for the medium- to low-emission scenario and 82% for the high-emission scenario43. The projected decrease in the number of ice days is greatest in the north of the country, with fewer snow days expected throughout. These changes may confer benefits to the transport sector; minor accidents and personal and motor insurance costs may be reduced42.

79
Transport Sector | Climate Change Sectoral Adaptation Plan
(a) Medium–Low Emission: Annual Change (%) in Number of Ice Days (Max. <0oC)
(b) High Emission: Annual Change (%) in Number of Ice Days (Max. <0oC)
Figure 4.12: Projected percentage change in annual number of ice days for the (a) medium- to low-emission and (b)high-emissionscenarios.Ineachcase,thefutureperiod2041–2060iscomparedwiththepastperiod1981–2000.
(a) Medium–Low Emission: Annual Change (%) in Number of Frost Days (Min. <0oC)
(b) High Emission: Annual Change (%) in Number of Frost Days (Min. <0oC)
Figure 4.11: Projected percentage change in annual number of frost days for the (a) medium-to low-emission and (b)high-emissionscenarios.Ineachcase,thefutureperiod2041–2060iscomparedwiththepastperiod1981–2000.

80
Transport Sector | Climate Change Sectoral Adaptation Plan
4.3 Assessing Transport System ResilienceIn addition to identifying the transport assets situated in regions where the projected impacts of climate change may be more pronounced, it will also be helpful for transport stakeholders to determine the likelihood of these impacts to bring infrastructure and services towards their operational thresholds and assess resilience correspondingly. A lack of available quantitative data on the actual impacts of observed climate changes to the transport sector, including associated financial implications, was identified in the preparation of the precursory sectoral adaptation plan. The absence of a standardised framework to connect climate-specific or adaptation-specific actions with financial investments represents a significant knowledge gap which inhibits understanding of actual climate resilience within organisations and structures for all sectors across the State.
Figure 4.13: Train damaged by falling branches during Storm Ali, September 2018. Source: Irish Rail.

81
Transport Sector | Climate Change Sectoral Adaptation Plan
Together with transport stakeholders, a data collection exercise was designed in 2018 with the aim of outlining the impacts of observed climate change at a sectoral level. This exercise focused on costs incurred as a result of extreme weather events; the frequency and severity of such weather events, and their associated risks, is likely to intensify and increase in the mid-century period under both the medium-low emission and high-emission scenarios. As an example, Table 4.1 illustrates data gathered from five stakeholders in the land, aviation and maritime subsectors following Storm Ali (18-20 September 2018), a Status Orange storm with reported wind speeds up to 120km/h. As impacts were not felt uniformly by all transport stakeholders, this table provides an indicative insight into adaptive capacity within the transport sector but is not representative of overall systemic resilience to weather extremes.
Table4.1:Aggregatedandanonymiseddatacollectedfrom5serviceoperators/infrastructureprovidersfollowingStormAli, September 2018.
ExtremeWeatherEventType Storm; high winds up to 120km/h; average wind speeds nationwide of 65km/h to 80km/h. Met Éireann issued a Status Orange weather warning for 17 counties, with a Status Yellow warning in place for the rest of the country.
EventDate 18 & 19 September 2018
ObservedImpacts • Strong winds caused operational disruption across multiple services. • Some road blockages and closures caused diversions and traffic delays.• Storm surge observed at docks.• Facility/equipment damage and construction project delay x 2 days.• Displacement of wireless communications infrastructure at site.
Repair Works Undertaken • Reinstall electrical boxes & repair fencing.• Repair to antennas; signage; emergency gates; & car park barriers.• Multiple call-outs to clear trees brought down by high winds. Removal of trees &
debris from tracks & overhead line electrification.
Cost of Repair Works C. €26,500 recorded in repair works by service operators & infrastructure providers
Closure or Suspension of Services
• 1 operator recorded 1x flight diversion & 1x flight cancellation (inbound & outbound).
• 1 operator recorded pilot boat service off-station cancelled for c. 18 hours.• 1 operator recorded 9 services cancelled.
RevenueForgone:LostManhours
Where services were diverted or cancelled, administrative/salaried expenditure was still incurred.Some stakeholders included unrecovered employee costs in overall costs and were unable to disaggregate the data.
RevenueForgone:LostKm 1x service operator noted 1,360 lost km.
RevenueForgone:ServiceDelays 1x service operator recorded 169 service delays totalling 5,326 delay minutes.
Passenger/Customer Impacts • Flight disruptions• Loss of service in some areas• Delays incurred by vessels waiting to berth and commence operations• Rail service delays totalling 5,326 minutes while lines were cleared of debris
Total Financial Cost All stakeholders reported that they were unable to quantify total financial costs.

82
Transport Sector | Climate Change Sectoral Adaptation Plan
Key findings from the data collection exercise showed that delineation of direct expenditure is complex. There is currently no definition of climate-specific investment available which would allow sectors to easily categorise relevant climate-specific expenditure; maintenance, upgrade, and repair activities are typically captured as routine investment within business continuity management processes. Service providers were also unable to estimate indirect costs such as revenue forgone. In addition, metrics of loss of service provision were not uniform across the subsectors, making meaningful comparison of the effect of climatic impacts on different infrastructure and services difficult. Social and environmental costs arising from weather extremes are not easily monetised, limiting capacity to quantify current levels of resilience and proximity to transport system thresholds. The most significant limitation of the sectoral data collection process is that it is does not allow for cascading impacts to, and as a result of system failure in other sectors, be costed.
Development of a methodology to capture cross-cutting economic, social and environmental consequences at a national level would assist in the quantification of cross-sectoral interdependencies for a more accurate assessment of current levels of systemic resilience. In addition, an improved understanding of cascading impacts between sectors would allow for the identification of specific sectoral assets which are critical to the functioning of particular subsectors within the transport sector. There is a clear need for quantitative data to enable justification of immediate stakeholder costs from a risk reduction perspective. Criteria to identify, and subsequently prioritise investment in adaptive capacity are not currently available. Such criteria should consider the social, economic and environmental functions performed by each asset and its contribution to the functioning of the system overall. In the absence of this data, a full priority impact assessment, and identification of operational and systemic thresholds, is not yet possible.

83
Transport Sector | Climate Change Sectoral Adaptation Plan
5 Adaptation ActionPlan

84
Transport Sector | Climate Change Sectoral Adaptation Plan
5.1 Transport Adaptation Goals and Objectives Developing an adaptation strategy requires establishing goals, sequencing planning objectives and identifying and prioritising actions that can help in achieving these goals7. The goals and objectives presented in this plan are commensurate with the expected five-year term outlined in the NAF for statutory adaptation planning. While identified goals and objectives may change over time (due to new scientific findings, improved vulnerability assessment, observed climate impacts, changes in the socio-economic, political and technological spheres, and based on implementation successes and failures), the overall objectives outline the sector’s long-term strategic vision for building a level of systemic resilience to climate change.
Box 5.1: Adaptation GoalThe overarching goal of transport adaptation planning is to ensure that the sector can fulfil its continuing economic, social and environmental objectives by ensuring that transport infrastructure is safeguarded from the impacts of climate change.
The implementation objectives set out in this plan are:1. Improve understanding of the impacts of climate change on transport infrastructure,
including cross-sectoral cascading impacts, and close knowledge gaps; 2. Assist transport stakeholders in identifying and prioritising climate risks to existing and
planned infrastructural assets and enabling them to implement adaptation measures accordingly; and
3. Ensure that resilience to weather extremes and longer-term adaptation needs are considered in investment programmes for planned future transport infrastructure.
5.2 Developing Robust Adaptation PathwaysThe actions presented in this plan are divided into three distinct workstreams aligned with the overarching implementation objectives. The actions should be understood as part of an iterative adaptation planning pathway to transition towards a climate-resilient economy and society by 2050. Chapter 4 of this plan highlighted that much of the work towards developing resilience in the transport sector is undertaken by transport stakeholders (infrastructure providers and service operators) as part of standard operational and business planning processes and there are few levers at a central level to encourage implementation of additional adaptation measures.
It is important to note that cost-benefit analysis is required to ascertain whether adaptation measures are required and whether a soft, green or grey adaptation option is appropriate. Adaptation measures for critical infrastructure are typically associated with high costs. This is because measures required deal with valuable infrastructure assets and may be extensive in nature (depending on the scale of the network and the works required). In some instances, the best (or most cost-effective) option may be not to implement adaptation measures. However, DTTAS can take strong action through the implementation of ‘soft’ policy measures. It is notable that many of the adaptation options identified are cross-sectoral in nature. Where
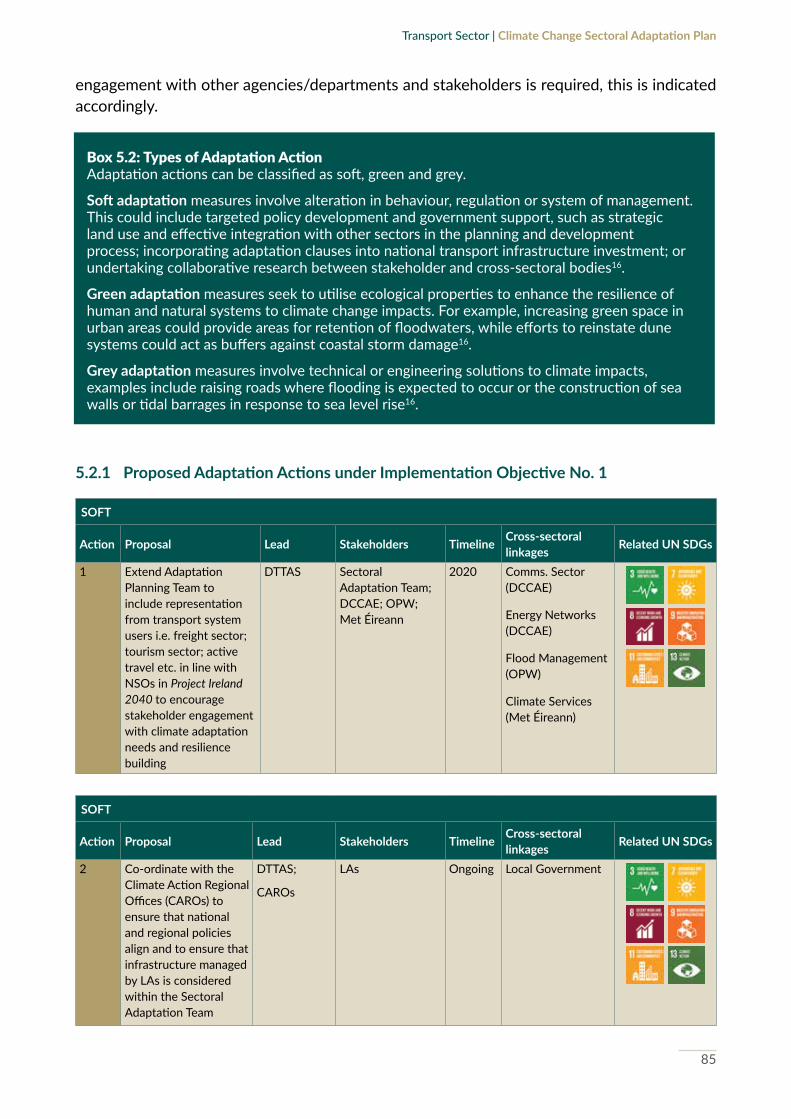
85
Transport Sector | Climate Change Sectoral Adaptation Plan
engagement with other agencies/departments and stakeholders is required, this is indicated accordingly.
Box 5.2: Types of Adaptation ActionAdaptation actions can be classified as soft, green and grey.
Softadaptation measures involve alteration in behaviour, regulation or system of management. This could include targeted policy development and government support, such as strategic land use and effective integration with other sectors in the planning and development process; incorporating adaptation clauses into national transport infrastructure investment; or undertaking collaborative research between stakeholder and cross-sectoral bodies16.
Greenadaptation measures seek to utilise ecological properties to enhance the resilience of human and natural systems to climate change impacts. For example, increasing green space in urban areas could provide areas for retention of floodwaters, while efforts to reinstate dune systems could act as buffers against coastal storm damage16.
Greyadaptation measures involve technical or engineering solutions to climate impacts, examples include raising roads where flooding is expected to occur or the construction of sea walls or tidal barrages in response to sea level rise16.
5.2.1 ProposedAdaptationActionsunderImplementationObjectiveNo.1
SOFT
Action Proposal Lead Stakeholders Timeline Cross-sectoral linkages RelatedUNSDGs
1 Extend Adaptation Planning Team to include representation from transport system users i.e. freight sector; tourism sector; active travel etc. in line with NSOs in Project Ireland 2040 to encourage stakeholder engagement with climate adaptation needs and resilience building
DTTAS Sectoral Adaptation Team; DCCAE; OPW; Met Éireann
2020 Comms. Sector (DCCAE)
Energy Networks (DCCAE)
Flood Management (OPW)
Climate Services (Met Éireann)
SOFT
Action Proposal Lead Stakeholders Timeline Cross-sectoral linkages RelatedUNSDGs
2 Co-ordinate with the Climate Action Regional Offices (CAROs) to ensure that national and regional policies align and to ensure that infrastructure managed by LAs is considered within the Sectoral Adaptation Team
DTTAS;
CAROs
LAs Ongoing Local Government

86
Transport Sector | Climate Change Sectoral Adaptation Plan
SOFT
Action Proposal Lead Stakeholders Timeline Cross-sectoral linkages RelatedUNSDGs
3 Establish cross-sectoral Critical Infrastructure Working Group to complement the work of the Sectoral Adaptation Team
DTTAS;DCCAE; CAROs
Sectoral Adaptation Teams
2019 Energy Networks Sector (DCCAE)
Comms. Sector (DCCAE)
Local Government
SOFT
Action Proposal Lead Stakeholders Timeline Cross-sectoral linkages RelatedUNSDGs
4 Disseminate Progress Report on the Implementation of Transport Adaptation Measures to representatives or advocates for accessibility, the health sector, cultural and natural heritage (biodiversity) sector as appropriate
DTTAS DoH
DCHG
Annual Health (DoH)
Biodiversity (DCHG)
Cultural Heritage (DCHG)
SOFT
Action Proposal Lead Stakeholders Timeline Cross-sectoral linkages RelatedUNSDGs
5 Commission a study to develop appropriate monitoring indicators to evaluate the efficacy of adaptation measures
DTTAS Sectoral Adaptation Team
2020 All Sectors
Climate Services (Met Éireann)
SOFT
Action Proposal Lead Stakeholders Timeline Cross-sectoral linkages RelatedUNSDGs
6 Commence a review of the effectiveness of current quantitative data collection procedures for the impacts of extreme weather events and longer-term climate change with a view to developing a cross-sectoral reporting mechanism
DTTAS; DCCAE
Sectoral Adaptation Teams; CAROs
2020 Energy Networks Sector (DCCAE)
Comms. Sector (DCCAE)
Local Government

87
Transport Sector | Climate Change Sectoral Adaptation Plan
SOFT
Action Proposal Lead Stakeholders Timeline Cross-sectoral linkages RelatedUNSDGs
7 Continue collaboration with the EPA, Climate Ireland and Met Éireann to ensure sectoral understanding of up to date climate information, including a watching brief of longer term climate modelling outputs to 2100
Met Éireann; EPA; Climate Ireland
DTTAS Ongoing Climate Services (Met Éireann)
SOFT
Action Proposal Lead Stakeholders Timeline Cross-sectoral linkages RelatedUNSDGs
8 Commission a study to identify common criteria to define critical assets within the transport; communications and energy sectors
DTTAS; DCCAE
Sectoral Adaptation Teams; Met Éireann; EPA; 3rd level institutions
2020 Comms. Sector (DCCAE)
Energy Networks Sector (DCCAE)
SOFT
Action Proposal Lead Stakeholders Timeline Cross-sectoral linkages RelatedUNSDGs
9 Commission concise comparative study between output of the EPA CIViC project and other resources such as CFRAMS and IPCSS maps; and the mapping exercise developed for this plan
DTTAS DCCAE;DHPLG;EPA;UCC;OPW;Met Éireann
2020 Comms. Sector (DCCAE)
Energy Networks Sector (DCCAE)
Water Services & Infrastructure Sector (DHPLG)
Flood Management (OPW)
SOFT
Action Proposal Lead Stakeholders Timeline Cross-sectoral linkages RelatedUNSDGs
10 Perform a midterm review of the statutory critical infrastructure adaptation plans with potential input from relevant actors such as local authorities and CCMA
DTTAS; DCCAE
CAROs; CCMA;Sectoral Adaptation Team
2022 Energy Networks Sector (DCCAE)
Comms. Sector Sector (DCCAE)

88
Transport Sector | Climate Change Sectoral Adaptation Plan
5.2.2 ProposedAdaptationActionsunderImplementationObjectiveNo.2
SOFT
Action Proposal Lead Stakeholders Timeline Cross-sectoral linkages RelatedUNSDGs
11 Disseminate geospatial distribution impact maps to transport stakeholders
DTTAS Sectoral Adaptation Team
2020 Climate Services (Met Éireann)
SOFT
Action Proposal Lead Stakeholders Timeline Cross-sectoral linkages RelatedUNSDGs
12 Develop online repository host transport adaptation resources on the departmental website www.dttas.gov.ie to to encourage stakeholders to review network vulnerabilities and conduct risk assessments
DTTAS Sectoral Adaptation TeamMet Eireann;Climate Ireland
2020 Climate Services (Met Éireann)
SOFT
Action Proposal Lead Stakeholders Timeline Cross-sectoral linkages RelatedUNSDGs
13 Support transport stakeholders to avail of adaptation funding opportunities by providing information on potential EU funding sources
DTTAS Sectoral Adaptation Team;
DCCAE;
DPER
2020 LIFE Programme (DCCAE)
Connecting Europe Facility (CEF)
SOFT
Action Proposal Lead Stakeholders Timeline Cross-sectoral linkages RelatedUNSDGs
14 Following from Action 7, develop guidance for sectoral stakeholders to inform identification of critical transport assets, taking account of cross-sectoral interdependencies
DTTAS DCCAE 2021 Comms. Sector (DCCAE)
Energy Networks Sector (DCCAE)
Climate Services (Met Éireann)

89
Transport Sector | Climate Change Sectoral Adaptation Plan
SOFT
Action Proposal Lead Stakeholders Timeline Cross-sectoral linkages RelatedUNSDGs
15 Under the NAF, consider the need to put in place arrangements at a national level to define critical infrastructure from a climate resilience perspective for the standardisation and prioritisation of resources
TBD All Sectors
National Adaptation Steering Committee (DCCAE)
TBD All Sectors
5.2.3 ProposedAdaptationActionsunderImplementationObjectiveNo.3
SOFT
Action Proposal Lead Stakeholders Timeline Cross-sectoral linkages RelatedUNSDGs
16 Continue engagement with disaster risk management for transport through active participation with the Office for Emergency Planning and the National Directorate for Fire and Emergency Management to ensure operational continuity and service delivery during acute weather events
DTTAS All Sectors Ongoing Emergency Planning
(All Sectors)
SOFT
Action Proposal Lead Stakeholders Timeline Cross-sectoral linkages RelatedUNSDGs
17 Strengthen sectoral adaptation responses by ensuring that climate resilience is considered in appraisal guidance, including in the update to the Common Appraisal Framework, for all future transport infrastructure projects over appropriate timescales
DTTAS Transport infrastructure agencies and public transport service providers, including NTA; CIÉ; TII; Dublin Bus; Bus Éireann; Go-Ahead Ireland
Ongoing DPER
DFIN

90
Transport Sector | Climate Change Sectoral Adaptation Plan
SOFT
Action Proposal Lead Stakeholders Timeline Cross-sectoral linkages RelatedUNSDGs
18 Consider adaptation needs in contracts; performance delivery agreements; and service level agreements between DTTAS, transport infrastructure agencies, public transport service agencies and constituent operators as relevant
DTTAS Transport infrastructure agencies and public transport service providers, including NTA; CIÉ; TII; Dublin Bus; Bus Éireann; Go-Ahead Ireland
Ongoing DPER
DFIN
SOFT
Action Proposal Lead Stakeholders Timeline Cross-sectoral linkages RelatedUNSDGs
19 Consider the inclusion of adaptation needs as a criterion in projects relating to future transport energy (recharging and refuelling) infrastructure networks, under any relevant further calls of the Climate Action Fund
DCCAE DTTAS Ongoing Energy Networks Sector (DCCAE)
SOFT
Action Proposal Lead Stakeholders Timeline Cross-sectoral linkages RelatedUNSDGs
20 Ensure that adaptation needs are considered in EU-funded projects relating to future transport and energy infrastructure networks where DTTAS has a role in project validation
DTTAS; DCCAE
Transport & Energy Sectors
Ongoing Energy Networks Sector (DCCAE)
SOFT
Action Proposal Lead Stakeholders Timeline Cross-sectoral linkages RelatedUNSDGs
21 Support implementation of remote working initiatives, including expansion of effective broadband connectivity, to facilitate remote working when travel is inhibited during extreme weather events
DCCAE Comms. Sector c. 2021-2027
Comms. Sector (DCCAE)
Transport (DTTAS)

91
Transport Sector | Climate Change Sectoral Adaptation Plan
5.2.4 MitigationCo-Benefits
It is important to note that the three implementation objectives set out in this plan are designed in consideration of the transport sector’s overarching ambition to achieve full decarbonisation and the various specific mitigation measures addressed through other governmental and departmental policies, including the Climate Action Plan (2019); Project Ireland 2040 (2018); recommendations of the Low Emission Vehicle Taskforce (2018; 2019); the National Policy Framework on Alternative Fuels Infrastructure in Ireland (2017); and the National Mitigation Plan (2017). While the actions under each objective deal with adaptation needs, they are designed to ensure that they neither negate nor supersede existing and planned climate mitigation measures. Several of the actions confer clear co-benefits for mitigation and others complement existing mitigation considerations in transport policy. The most pertinent of these co-benefits are described in Table 5.1.
Table5.1:MitigationCo-Benefits
Action MitigationCo-Benefit
2 The Climate Action Regional Offices also work with central government on behalf of local
government on climate change mitigation issues and can help to build strong collaborative
relationships and information sharing to facilitate a range of cross-sectoral sustainable development
objectives.
5;7;14 These actions may potentially help to inform the development of a coherent climate financing
approach at a sectoral and national level, inclusive of both climate adaptation and climate mitigation
needs.
7 Transport-adjacent energy networks, including refuelling and recharging infrastructures, fall within
the scope of this action. Consequently, this infrastructure may be appropriately future-proofed
against Ireland’s projected weather extremes to continue supporting fleet transition away from fossil
fuels.
16 Transport appraisals currently take account of contributions to greenhouse gas reductions, and in
particular carbon emissions. Economic appraisals are required to value the emissions impact over
the lifetime of any project or programme using the ‘shadow price of carbon’, which is set out in the
Public Spending Code. This shadow price increases over time, so that the shadow price of a tonne of
CO2 is €20.00 in 2019, rising to €100.00 in 2030 and €265.00 in 2050, as the need to decarbonise
accelerates. This action will therefore complement existing climate considerations by incorporating
adaptation needs into the process.
17 Climate mitigation and decarbonisation is currently considered as part of service level agreements,
notably in relation to public transport fleet decarbonisation.
18 The Climate Action Fund currently considers climate mitigation potential as part of its funding criteria.
19 EU-funded infrastructure projects currently consider climate mitigation potential as part of their
funding criteria.
20 Remote working has the potential to reduce the number of vehicles on the roads and consequently
positively impact the sector’s carbon emissions profile.

92
Transport Sector | Climate Change Sectoral Adaptation Plan
6 Implementationand Governancence
93
Transport Sector | Climate Change Sectoral Adaptation Plan
6.1 Implementation TimeframesReviewing, monitoring and evaluation are key elements of an iterative adaptation process to assess progress and performance, to share knowledge and inform future policy and practice. A monitoring and review process will allow for adjustments over time based on improvements in understanding, advances in climate science and experience of implementation. Under the NAF, a five year term is envisaged for the Framework and for associated statutory sectoral and local authority adaptation planning. Actions identified within this plan have been developed accordingly to be completed before the end of 2024.
6.2 Monitoring and ReportingImplementation of the actions outlined in Chapter 5 of this plan will be monitored by the sectoral adaptation team, which will be scheduled to meet biannually, with the first meeting in early-2020. In addition, an annual progress report will be prepared by DTTAS and disseminated to the members of the Sectoral Adaptation Team. The progress report will be published on the departmental website alongside adaptation resources for stakeholders within the transport sector before end-2020, and each year following under the lifetime of the plan as relevant.
Under the provisions of the NAF, the Minister for Transport, Tourism and Sport (MTTAS) will be obliged to present an annual sectoral adaptation statement to each House of the Oireachtas, with further presentation of statements as considered appropriate by the Minister for Communications, Climate Action and the Environment (MCCAE). DTTAS will provide quarterly updates to the National Adaptation Steering Committee as well as providing input into the Climate Action Delivery Board and the National Energy and Climate Plans (NECP).
6.2.1 Monitoring IndicatorsImplementation of measures outlined in the non-statutory adaptation plan Developing Resilience to Climate Change in the Irish Transport Sector (2017) has been ongoing since early 2018. The measures outlined were considered in the context of their effectiveness, using a range of monitoring indicators to demonstrate progress towards implementation. These indicators were:
• baseline monitoring;• recognition within sectoral work programmes (mainstreaming);• level of adaptation research; • launch of adaptation measures/level of spending collected;• co-operation with other sectors/sub-national levels; and• periodic reviews /evaluations.
A summary of implementation progress for these measures is presented in Appendix III. Measures which remain ongoing may be superseded by the targeted actions proposed in Chapter 5 of this plan and will be incorporated into the monitoring process as relevant. Preparation of cross-sectoral monitoring indicators may also be considered in tandem with the prioritisation of critical sectoral assets as our understanding of climate impacts and risks

94
Transport Sector | Climate Change Sectoral Adaptation Plan
continues to develop. Monitoring indicators will take into account the review of international best practice presented in EPA Report 263: Reflecting on Adaptation to Climate Change: International Best Practice Review and National MRE and Indicator Development Requirements32.
6.3 Evaluation and ReviewA collective midterm review of the statutory plans for the critical infrastructure sector (transport; communications; and gas and electricity networks) will be performed under the aegis of the Critical Infrastructure Working Group to evaluate opportunities to optimise cross-sectoral adaptation planning processes, with reference to monitoring indicators. This process may draw upon consultation with key stakeholders in the transport, energy and communications sectors, with input from other relevant actors such as local authorities and county and city management associations (CCMAs) as appropriate.
Table6.1:SummaryofGovernanceProcessesfortheStatutorySectoralAdaptationPlan
GovernanceAction Proposal Lead Stakeholders Timeline
OngoingMonitoring
Review of implementation of adaptation actions at biannual meetings
DTTAS Sectoral Adaptation Team
Biannual for the lifetime of the plan as relevant; first meeting to be held early-2020
OngoingMonitoring
Dissemination of a Progress Report on the Implementation of Transport Adaptation Measures
DTTAS Sectoral Adaptation Team
Annual for the lifetime of the plan as relevant
ReportingObligations
Publication of Progress Report on the Implementation of Transport Adaptation Measures on the Departmental website
DTTAS Sectoral Adaptation Team
Annual for the lifetime of the plan as relevant; first publication before end-2020
ReportingObligations
Provide quarterly updates on action implementation to National Adaptation Steering Committee
DTTAS DCCAE Quarterly for the lifetime of the plan as relevant
ReportingObligations
Presentation of Annual Transition Statement to the Houses of the Oireachtas
MTTAS Annual or as considered appropriate by the MCCAE
ReportingObligations
National–level reporting on the delivery of the sectoral adaptation plan under the all of Government Climate Action Plan
DCCAE DTTAS Quarterly
ReportingObligations
Sectoral input to international governance and monitoring reporting under the NECPs as relevant and appropriate
DTTAS DCCAE Annual
ReportingObligations
National-level reporting on the impolementation of the SDGs
MCCAE MTTAS Annual
Review&Evaluation
Perform a Midterm Review of the Statutory Adaptation Plans for the Critical Infrastructure (Energy & communications) sectors, with reference to performance indicators
DTTAS; DCCAE
Sectoral Adaptation Teams for the Energy & Comms. Sectors
Before end-2022

95
Transport Sector | Climate Change Sectoral Adaptation Plan
1 Desmond, M., O’Brien, P., & McGovern, F., 2017. Report No. 223: A Summary of the State of Knowledge on Climate Change Impacts for Ireland. EPA (Environmental Protection Agency), Johnstown Castle, Ireland.
2 IPCC (Intergovernmental Panel on Climate Change), 2014. “Climate Change 2014: Impacts, Adaptation, and Vulnerability”. Contribution of Working Group II to the Fifth Assessment Report of the Intergovernmental Panel on Climate Change. IPCC, Geneva.
3 IPCC, 2018. Special Report on Global Warming of 1.5oC (SR1.5), IPCC, Geneva.4 https://www.dccae.gov.ie/en-ie/climate-action/publications/Documents/5/National%20Climate%20Policy%20
Position.pdf 5 http://www.irishstatutebook.ie/eli/2015/act/46/enacted/en/html6 https://www.dccae.gov.ie/en-ie/climate-action/publications/Documents/7/National%20Mitigation%20Plan%202017.
pdf7 DCCAE (Department of Communications, Climate Action and the Environment), 2018. National Adaptation Framework:
Planning for a Climate Resilient Ireland. DCCAE, Dublin, Ireland.8 DTTAS (Department of Transport, Tourism and Sport), 2017. Developing Resilience to Climate Change in the Irish Transport
Sector. DTTAS, Dublin, Ireland9 https://www.dccae.gov.ie/en-ie/climate-action/publications/Documents/4/National%20Climate%20Change%20
Adaptation%20Framework.pdf10 UN (United Nations), 2015. Paris Agreement on Climate Change. Available online: <https://unfccc.int/files/meetings/
paris_nov_2015/application/pdf/paris_agreement_english_.pdf>11 Shine, T. 2018. Report No. 252: Climate Resilient Ireland. EPA, Johnstown Castle, Ireland.12 https://www.un.org/sustainabledevelopment/ UN, 2015. Transforming our world: The 2030 Agenda for Sustainable
Development (A/RES/70/1, 25 September 2015), United Nations, New York, NY.13 UN, 2015. Sendai Framework for Disaster Risk Reduction 2015–2030 (A/RES/69/282, General Assembly 69th Session),
United Nations, New York. NY.14 https://ec.europa.eu/clima/sites/clima/files/docs/eu_strategy_en.pdf15 European Commission (EC), 2018. Report from the Commission to the European Parliament and the Council on the
Implementation of the EU Strategy on Adaptation to Climate Change, COM (2018) 738 final, 12.11.2018. EC, Brussels, Belgium.
16 http://revisedacts.lawreform.ie/eli/2000/act/30/section/10/revised/en/html17 DCCAE, 2018. Sectoral Planning Guidelines for Climate Change Adaptation. DCCAE, Dublin, Ireland.18 https://dccae.gov.ie/en-ie/climate-action/publications/Documents/13/SPG%20Climate%20Change%20Adaptation.pdf19 www.dttas.gov.ie 20 EEA (European Environment Agency): Climate Adapt, 2019. Impacts, risks and vulnerabilities. Available online: <https://
climate-adapt.eea.europa.eu/knowledge/adaptation-information/vulnerabilities-and-risks> (accessed 14 May 2019).21 DTTAS, 2018. Transport Trends 2018. DTTAS, Dublin, Ireland. Available online: <http://www.dttas.ie/sites/default/files/
publications/corporate/english/transport-trends-2018/transport-trends-2018.pdf> (accessed 17 May 2019).22 DTTAS, National Driver and Vehicle File, May 2019. DTTAS, Dublin, Ireland.23 CSO (Central Statistics Office), 2016. National Travel Survey. Available online: <https://www.cso.ie/en/
releasesandpublications/ep/p-nts/nts2016/> (accessed 17 May 2019).24 Transport for Ireland, 2019. Further Growth in Passenger Journey Numbers on ‘Transport for Ireland’ Subsidised Services.
Available online: <https://www.transportforireland.ie/further-growth-in-passenger-journey-numbers-on-transport-for-ireland-subsidised-services/> (accessed 17 May 2019).
25 DTTAS, 2019. Transport Trends 2019. Unpublished Draft Document. DTTAS, Dublin, Ireland.26 NTA (National Transport Authority), 2018. “Commercial Bus Services in Ireland”, Statistical Bulletin 03/2018. Available
online: https://www.nationaltransport.ie/wp-content/uploads/2018/07/Commercial_Bus_Services_2018_V7.pdf (accessed 23 May 2019).
References

96
Transport Sector | Climate Change Sectoral Adaptation Plan
27 Joint Oireachtas Committee for Education and Skills, 2018. Report on the Operation of the School Transport Scheme. Available online: https://data.oireachtas.ie/ie/oireachtas/committee/dail/32/joint_committee_on_education_and_skills/reports/2018/2018-11-07_report-on-the-operation-of-the-school-transport-scheme_en.pdf (accessed 23 May 2019).
28 Irish Rail, 2018. Network Statement 2018. Available online: http://www.irishrail.ie/media/ie_2018_network_statement_(final_version).pdf (accessed 23 May 2019).
29 http://www.dttas.ie/sites/default/files/publications/aviation/english/national-aviation-policy-ireland/national-aviation-policy-ireland.pdf
30 http://www.dttas.ie/sites/default/files/node/add/content-publication/National%20Ports%20Policy%202013.PDF 31 DTTAS (Department of Transport, Tourism and Sport), 2017. Developing Resilience to Climate Change in the Irish Transport
Sector. DTTAS, Dublin, Ireland.32 https://www.gov.ie/en/campaigns/09022006-project-ireland-2040/?referrer=/en/project-ireland-2040 33 http://npf.ie/ 34 https://www.gov.ie/en/publication/83fec4-national-development-plan/
35 https://www.britishirishcouncil.org/sites/default/files/Climate%20Adaptation%20Paper.pdf 36 http://www.dttas.ie/sites/default/files/publications/public-transport/english/alternative-fuels-
framework/6186npfalternative-fuels300517.pdf 37 https://www.dccae.gov.ie/en-ie/climate-action/topics/climate-action-plan/Pages/climate-action.aspx 38 https://www.gasnetworks.ie/business/natural-gas-in-transport/the-causeway-project/ 39 GNI (Gas Networks Ireland), 2019. Presentation to the Low-Emission Vehicle Taskforce Stakeholder Consultation, May 2019. 40 https://www.wdc.ie/wp-content/uploads/WDC-CEDRA-S3-Chp-2-Rural-CommutingTowns-WDC-website.pdf41 https://www.wdc.ie/wp-content/uploads/DF-WDC-S3-Chp-4-Rural-to-Gateways-FDI-WDC-ePub.pdf42 https://assets.gov.ie/15979/04e0f52cee5f47ee9c01003cf559e98d.pdf 43 https://www.heritagecouncil.ie/content/files/climate_change_heritage_tourism_summary_2009_1mb.pdf
44 https://europeanclimate.org/wp-content/uploads/2014/06/Tourism_Briefing_Web_EN.pdf 45 https://static1.squarespace.com/static/58b40fe1be65940cc4889d33/t/5a79bac85345
0a7495861454/1517927115822/Game+Changer.pdf46 Sweeney, J., Bourke, D., Coll, J., Flood, S., Gormally, M., Hall, J., McGloughlin, J., Murphy, C., Salmon, N., Sheehy
Skeffington, M., & Smyth, D., 2013. Co-ordination, Communication and Adaptation for Climate Change in Ireland: an Integrated Approach (COCOADAPT): End of Project Report. EPA, Johnstown Castle, Ireland.
47 Nolan, P., O’Sullivan, J., & McGrath, R., 2017. “Impacts of climate change on mid-twenty-first-century rainfall in Ireland: a high-resolution regional climate model ensemble approach”. International Journal of Climatology. 37. 10.1002/joc.5091.
48 Nolan, P., 2015. Report No. 159: Ensemble of regional climate model projections for Ireland. EPA, Johnstown Castle, Ireland. Available online: <https://www.epa.ie/pubs/reports/research/climate/EPA%20159_Ensemble%20of%20regional%20climate%20model%20projections%20for%20Ireland.pdf> (accessed 4 June 2019).
49 Nolan, P., O’Sullivan, J., & McGrath, R., 2017. “Impacts of climate change on mid-twenty-first-century rainfall in Ireland: a high-resolution regional climate model ensemble approach”. International Journal of Climatology. 37. 10.1002/joc.5091.
50 Nolan, P., (2019) Relative Humidity projections for Ireland for the 30-year periods 2021-2050, 2041-2071 and 2071-2100. Unpublished Draft Report, Climate Ireland, Dublin.
51 O’Sullivan, J., Sweeney, C., Nolan, P., Gleeson, E., 2015. A high-resolution, multi-model analysis of Irish temperatures for the mid 21st-century. International Journal of Climatology.
52 https://www.dccae.gov.ie/en-ie/climate-action/Pages/default.aspx 53 http://www.climatecouncil.ie/media/Climate%20Change%20Advisory%20Council%20Annual%20Review%202019.pdf
54 Government of the United Kingdom of Great Britain and Northern Ireland, 2012. UK Climate Change Risk Assessment. Available online: <https://www.gov.uk/government/publications/uk-climate-change-risk-assessment-government-report> (accessed 6 June 2019).

97
Transport Sector | Climate Change Sectoral Adaptation Plan
55 https://www.housing.gov.ie/sites/default/files/publications/files/national_marine_planning_framework_baseline_report.pdf
56 Nolan, P., 2015. Report No. 159: Ensemble of regional climate model projections for Ireland. EPA, Johnstown Castle, Ireland. Available online: https://www.epa.ie/pubs/reports/research/climate/EPA%20159_Ensemble%20of%20regional%20climate%20model%20projections%20for%20Ireland.pdf (accessed 4 June 2019).
57 https://www.met.ie/cms/assets/uploads/2018/09/summerfinal3.
58 https://www.worldweatherattribution.org/attribution-of-the-2018-heat-in-northern-europe/
59 https://www.irishtimes.com/news/ireland/irish-news/motorway-signage-was-working-during-snowfall-says-tii-1.3813723
60 https://ec.europa.eu/maritimeaffairs/sites/maritimeaffairs/files/docs/body/ireland_climate_change_en.pdf61 Bambrick, E., 2017. The Application of a Coastal Railway Vulnerability Index to Ireland’s East Coast Railway Line: Bray Head
to Wicklow. Unpublished Master’s Thesis. UCD, Dublin.62 ISO (International Organisation for Standardisation), 2019. ISO 14090:2019: Adaptation to climate change -- Principles,
requirements and guidelines. Available online: https://www.iso.org/standard/68507.html (accessed 25 June 2019).
63 https://eur-lex.europa.eu/LexUriServ/LexUriServ.do?uri=OJ:L:2008:345:0075:0082:EN:PDF64 Hawchar L., Ryan P., Naughton O. and Nolan P, 2018. “High-level climate change vulnerability assessment of Irish
critical infrastructure”. Paper presented at Civil Engineering Research in Ireland conference (CERI), 28-29 August 2018, Dublin. Available online: https://www.researchgate.net/publication/327438044_High-level_Climate_Change_Vulnerability_Assessment_of_Irish_Critical_Infrastructure
65 Nolan, P., McKinstry, A., 2019. “Regional Climate Model Projections for Ireland”. Paper presented at International Association of Hydrologists (IAH) Irish Chapter conference. Tullamore, Co. Offaly, 30 April 2019. Available online: < http://www.iah-ireland.org/conference-proceedings/2019.pdf> (accessed 24 June 2019).
66 https://www.eea.europa.eu/data-and-maps/indicators/direct-losses-from-weather-disasters-3/assessment-1.67 Lane, P. 2019. Climate change and the Irish financial system. Central Bank of Ireland.68 EEA, 2017. Projected change in relative sea level, 2081–2100. Available online: <https://www.eea.europa.eu/data-and-
maps/figures/projected-change-in-sea-level-2> (accessed 7 June 2019). 69 https://www.gsi.ie/en-ie/programmes-and-projects/marine-and-coastal-unit/projects/Pages/Coastal-Vulnerability-
Index.aspx
70 https://www.opw.ie/en/flood-risk-management/floodanderosionmapping/icpss/71 Kopke, K., Lyons, E., MacMahon, E., O’Dwyer, B., Gault, J., 2018. EPA Report No. 263: Reflecting on Adaptation to
Climate Change: International Best Practice Review and National MRE and Indicator Development Requirements. EPA, Johnstown Castle, Ireland. Available online: <http://www.epa.ie/researchandeducation/research/researchpublications/researchreports/research263.html> (accessed 24 June 2019).
72 https://ec.europa.eu/transport/themes/infrastructure/about-ten-t_en73 Thomson, A.M., Calvin, K.V., Smith, S.J. et al., 2011. “RCP4.5: a pathway for stabilization of radiative forcing by 2100.”
Climatic Change 109: 77, Nov 2011. doi:10.1007/s10584-011-0151-4 74 Riahi, K., Rao, S., Krey, V. et al., 2011. “RCP8.5—A scenario of comparatively high greenhouse gas emissions.” Climatic
Change 109: 33, Nov 2011. doi:10.1007/s10584-011-0149-y
98
Transport Sector | Climate Change Sectoral Adaptation Plan
Appendices

99
Transport Sector | Climate Change Sectoral Adaptation Plan
Appendix I:
TransportInvestmentintheNationalDevelopmentPlan
The National Development Plan (NDP) sets out national investment priorities for the transport sector to 2027.
I.1: Rail and Buses
National Strategic Outcome 4: Sustainable Mobility
National Strategic Outcome 6:High-QualityInternationalConnectivity
National Strategic Outcome 8:TransitiontoaLow-CarbonandClimate-ResilientSociety
• Investment in train and bus fleets and infrastructure to maintain safety and service standards, including expansion where necessary
• Rail and bus station development including traffic management investment, passenger information programmes, public bicycle share schemes, accessibility enhancements etc.
• Investment in high-speed rail links between Dublin, Belfast and Cork
• North-West Multi-modal Mobility Hub
• C. €3 billion investment in Metro Link (Dublin) from Swords via Dublin Airport and Luas Green Line to Charlemont
• C. €2 billion investment in the DART Expansion Programme including electrification of services to Drogheda,
Celbridge/Hazelhatch, Maynooth and M3 Parkway, hybrid-electric fleet expansion and new interchange stations with bus, LUAS and Metro networks
• Park-and-Ride Programme serving Irish Rail, Luas and bus stations
• Complete construction of the National Train Control Centre
• C. 2.5 billion investment in BusConnects Programme for Dublin; Cork; and Galway, including:- Redesign of the bus network- Bus corridors including segregated
cycling facilities- New bus stops and shelters
• Transition to low-emission buses in the public urban fleets.
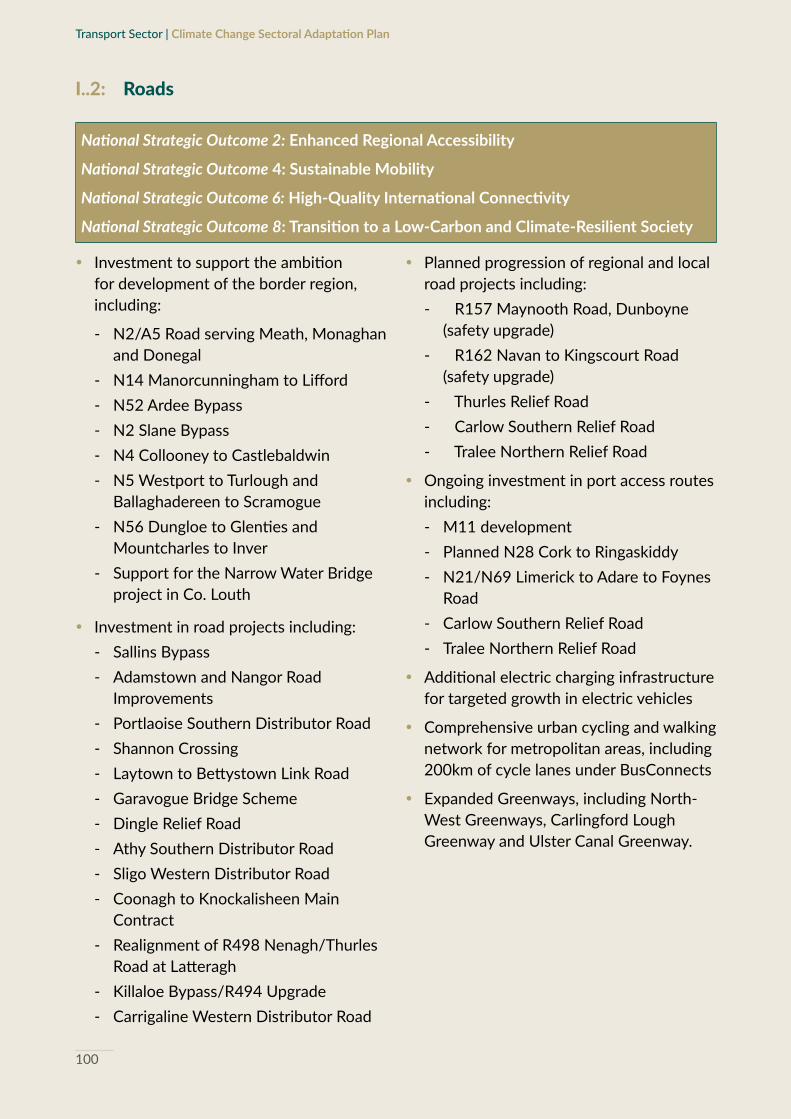
100
Transport Sector | Climate Change Sectoral Adaptation Plan
I..2: Roads
National Strategic Outcome 2: Enhanced Regional Accessibility
National Strategic Outcome 4: Sustainable Mobility
National Strategic Outcome 6:High-QualityInternationalConnectivity
National Strategic Outcome 8:TransitiontoaLow-CarbonandClimate-ResilientSociety
• Investment to support the ambition for development of the border region, including:
- N2/A5 Road serving Meath, Monaghan and Donegal
- N14 Manorcunningham to Lifford- N52 Ardee Bypass- N2 Slane Bypass- N4 Collooney to Castlebaldwin- N5 Westport to Turlough and
Ballaghadereen to Scramogue- N56 Dungloe to Glenties and
Mountcharles to Inver- Support for the Narrow Water Bridge
project in Co. Louth
• Investment in road projects including:- Sallins Bypass- Adamstown and Nangor Road
Improvements- Portlaoise Southern Distributor Road- Shannon Crossing- Laytown to Bettystown Link Road- Garavogue Bridge Scheme- Dingle Relief Road- Athy Southern Distributor Road- Sligo Western Distributor Road- Coonagh to Knockalisheen Main
Contract- Realignment of R498 Nenagh/Thurles
Road at Latteragh- Killaloe Bypass/R494 Upgrade- Carrigaline Western Distributor Road
• Planned progression of regional and local road projects including:- R157 Maynooth Road, Dunboyne
(safety upgrade)- R162 Navan to Kingscourt Road
(safety upgrade)- Thurles Relief Road- Carlow Southern Relief Road- Tralee Northern Relief Road
• Ongoing investment in port access routes including:- M11 development- Planned N28 Cork to Ringaskiddy- N21/N69 Limerick to Adare to Foynes
Road- Carlow Southern Relief Road- Tralee Northern Relief Road
• Additional electric charging infrastructure for targeted growth in electric vehicles
• Comprehensive urban cycling and walking network for metropolitan areas, including 200km of cycle lanes under BusConnects
• Expanded Greenways, including North-West Greenways, Carlingford Lough Greenway and Ulster Canal Greenway.

101
Transport Sector | Climate Change Sectoral Adaptation Plan
FigureI.1:NationalRoadsProgramme2018-2027undertheNDP. Source: TII.

102
Transport Sector | Climate Change Sectoral Adaptation Plan
II.3: Airports and Ports
Where planned investment does not include Exchequer funding, the relevant parties are noted in parentheses.
National Strategic Outcome 2: Enhanced Regional Accessibility
National Strategic Outcome 6:High-QualityInternationalConnectivity
• Second Parallel Runway for Dublin Airport (DAA)
• New Visual Control Tower at Dublin Airport (IAA)
• National Aviation Policy which provides support for Cork and Shannon Airports to develop as regional tourism and business gateways
• Regional Airports Programme which provides financial support towards safety and security projects at the smaller regional airports, including Ireland West Airport Knock, Waterford, Donegal and Kerry Airports
• C. €230 million infrastructural investment at Dublin Port to accommodate larger sea-going vessels; and increase capacity (Dublin Port Company)
• C. €90 million redevelopment of existing port facilities at Ringaskiddy to accommodate larger sea-going vessels and increase capacity (Port of Cork)
• €27 million towards capacity extension works at Shannon Foynes Port (Shannon Foynes Port Company)

103
Transport Sector | Climate Change Sectoral Adaptation Plan
Appendix II:
Climate Impact Chains
Transport Subsector Climate Impact ObservedRisks ProjectedRisks Consequences
Bus Increased Precipitation
• Disruption; overcrowding; heavy traffic; service delays etc.
• Heavy rain can cause flash flooding of depot buildings
• Disruption; overcrowding; heavy traffic; service delays etc.
• Increased risk of flash flooding
• Damage to bus depots
• Damage to buses caused by driving on flooded roads
• Impact on economy and education sectors if people cannot travel to work or school
• Health & safety of passengers - overcrowding, dangerous to embark/disembark vehicles during snow etc.
• Cancellation of services can leave passengers stranded
• Economic impact of repairing damaged vehicles/buildings following fallen trees/debris/flooding
• Increased risk of traffic/road accidents in extreme weather such as snow
Storms/High Wind/Storm Surges
• Diversion, curtailment or cancellation of routes
• Fallen trees and debris can cause disruption to services
Heat Waves • Passengers overheating on buses
• Issues with air quality
• Increased passenger overheating
Cold Spells • Passengers discomfort
• Heavy snow and ice can cause delays to buses leaving depots
• Increased risk of passengers falling due to snow/ice
• Inability of staff to travel to work
• Risk of black ice/poor road conditions require a reduction in vehicle speeds, which increases journey time
Sea Level Rise • Disruption of services due to coastal flooding

104
Transport Sector | Climate Change Sectoral Adaptation Plan
Climate Impact Chains - continuedTransport Subsector Climate Impact ObservedRisks ProjectedRisks Consequences
Road Increased Precipitation
• Heavy rain and subsequent flooding can cause damage to pavements, roads and underpasses; can strain or overwhelm drainage systems; can increase the risk of landslides
• Increased damage to paving and roads
• Increased danger to motorists due to damage to roads
• Higher risk of accident caused by debris on roads during storms
• Economic cost of necessary repairs to roads following extreme weather events
• Negative economic impact of restricted movement of passengers and goods
• Blocked roads can cause disruption to motorists, passengers, public transport and importantly emergency service vehicles
Storms/High Wind/Storm Surges
• Storm surges caused by high tides can lead to prolonged flooding, particularly on the west coast of Ireland. This can disintegrate road surfaces.
• Fallen trees and vegetation due to high winds can block roads
• Increased coastal flood risk of roads
Heat Waves • Higher possibility of melting tarmac and degradation of road surfaces
• Asphalt road surfaces can degrade quicker in heat
Cold Spells • Road degradation due to the freeze-thaw effect
• Freeze-thaw cycle during extremely low temperatures may cause damage to roads and asphalt surfaces
Sea Level Rise • Flooding and erosion along coastal routes may cause damage to pavements and roads
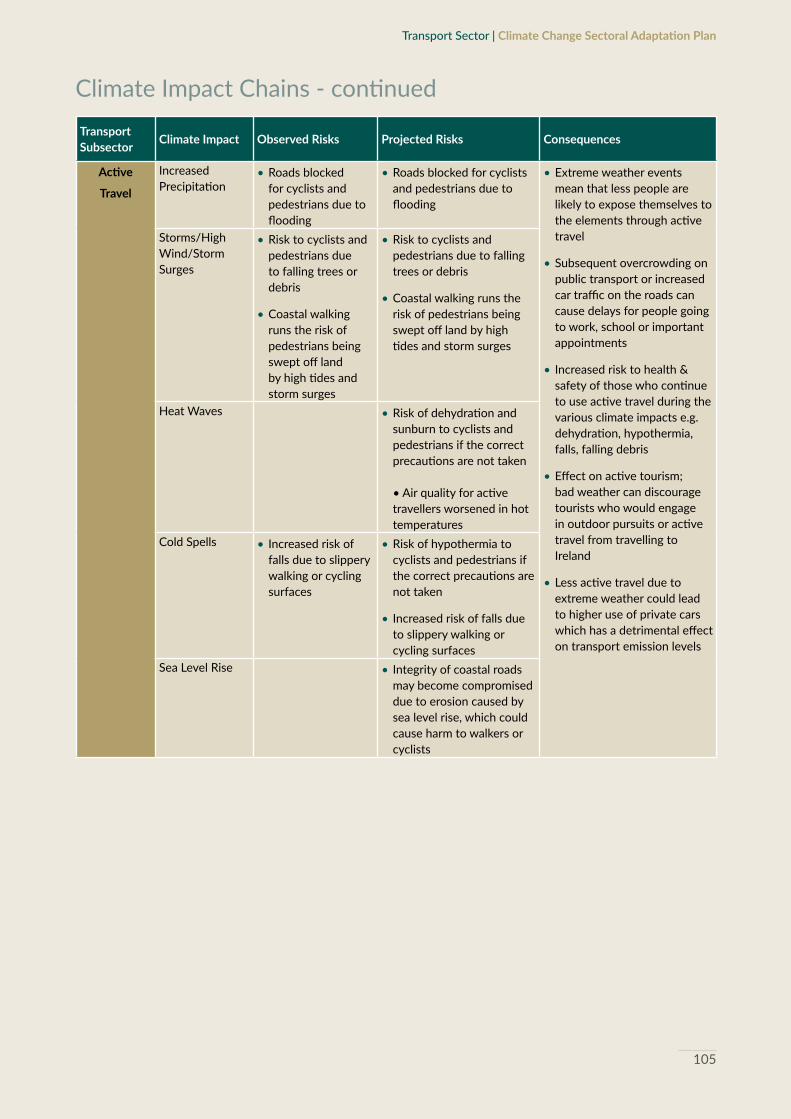
105
Transport Sector | Climate Change Sectoral Adaptation Plan
Climate Impact Chains - continuedTransport Subsector Climate Impact ObservedRisks ProjectedRisks Consequences
Active
Travel
Increased Precipitation
• Roads blocked for cyclists and pedestrians due to flooding
• Roads blocked for cyclists and pedestrians due to flooding
• Extreme weather events mean that less people are likely to expose themselves to the elements through active travel
• Subsequent overcrowding on public transport or increased car traffic on the roads can cause delays for people going to work, school or important appointments
• Increased risk to health & safety of those who continue to use active travel during the various climate impacts e.g. dehydration, hypothermia, falls, falling debris
• Effect on active tourism; bad weather can discourage tourists who would engage in outdoor pursuits or active travel from travelling to Ireland
• Less active travel due to extreme weather could lead to higher use of private cars which has a detrimental effect on transport emission levels
Storms/High Wind/Storm Surges
• Risk to cyclists and pedestrians due to falling trees or debris
• Coastal walking runs the risk of pedestrians being swept off land by high tides and storm surges
• Risk to cyclists and pedestrians due to falling trees or debris
• Coastal walking runs the risk of pedestrians being swept off land by high tides and storm surges
Heat Waves • Risk of dehydration and sunburn to cyclists and pedestrians if the correct precautions are not taken • Air quality for active travellers worsened in hot temperatures
Cold Spells • Increased risk of falls due to slippery walking or cycling surfaces
• Risk of hypothermia to cyclists and pedestrians if the correct precautions are not taken
• Increased risk of falls due to slippery walking or cycling surfaces
Sea Level Rise • Integrity of coastal roads may become compromised due to erosion caused by sea level rise, which could cause harm to walkers or cyclists

106
Transport Sector | Climate Change Sectoral Adaptation Plan
Climate Impact Chains - continuedTransport Subsector Climate Impact ObservedRisks ProjectedRisks Consequences
Heavy
Rail
Increased Precipitation
• Increase in landslides due to a reduction in slope stability
• Drainage systems overwhelmed
• Service cancellations due to line closures
• Passengers unable to undertake their journeys
• Bridge scour damage
• Flooded depots
• Disruption; overcrowding; service delays etc.
• Increased risk of flash flooding
• Increased risk of scour damage at bridges
• Impact on economy and education sectors if people cannot travel to work or school
• Health & safety of passengers - overcrowding, dangerous to embark/disembark vehicles during snow etc.
• Cancellation of or delays to services can leave passengers stranded
• Economic impact of repairing damaged trains/depots/tracks or other equipment following fallen trees/debris/flooding
Storms/High Wind/Storm Surges
• Damage to automatic level crossing barriers
• Damage to signalling, power equipment and tracks due to falling trees, debris etc.
• Trees and leaves on railway lines requires slower average speeds
• Structural damage to stations following storms
• Disruption, overcrowding, service delays etc.
Heat Waves • Increase risk of rail buckling and misalignment of tracks which would increase the need for network-wide speed restrictions
• Overheating of equipment could affect performance
• Disruption; overcrowding; delays etc.
Cold Spells • Overhead electrification systems failing to operate
• Decreased braking performance of trains
• Potential passenger falls on icy walking surfaces such as platforms, stations entrances and exits, pavements and roads
• Increased risk of damage to tracks and overhead catenary system due to extreme cold weather
• Disruption; overcrowding; service delays etc.
Sea Level Rise • Flooding and erosion can result in damage to or loss of coastal rail infrastructure
• Track damage
• Need for increased railway flood defences
• Increased risk of damage to tracks

107
Transport Sector | Climate Change Sectoral Adaptation Plan
Climate Impact Chains - continued
Transport Subsector Climate Impact ObservedRisks ProjectedRisks Consequences
Light
Rail
Increased Precipitation
• Disruption; overcrowding; service delays etc.
• Closure of depot due to flooding
• Disruption; overcrowding; service delays etc.
• Increase in flash flooding risk, particular for low-lying junctions and substations
• Impact on economy and education sectors if people cannot travel to work or school
• Health & safety of passengers - overcrowding, dangerous to embark/disembark vehicles during snow etc.
• Cancellation of or delays to services can leave passengers stranded
• Economic impact of repairing damaged trains/depots/tracks or overhead wires following fallen trees/debris/flooding
Storms/High Wind/Storm Surges
• Danger from overhead contact wires in high winds
• Necessary speed restrictions due to high winds
Heat Waves • Increase risk of rail buckling/misalignment of track which would increase the need for network-wide speed restrictions
• Overheating of equipment could affect performance
Cold Spells • Overhead electrification systems can fail in extreme cold
• Decreased braking performance of trains
• Increased risk of passenger falls on icy surfaces such as platforms, station entrances and exits, pavements and roads
• Ice and snow damage to overhead catenary systems and rail joints
Sea Level Rise

108
Transport Sector | Climate Change Sectoral Adaptation Plan
Climate Impact Chains - continuedTransport Subsector Climate Impact ObservedRisks ProjectedRisks Consequences
Aviation Increased Precipitation
• Pressure on airport run-off and drainage systems
• Runway drainage systems overwhelmed
• Pressure on flood defences, particular in Shannon Airport
• Potential damage to Shannon Airport due to proximity to river
• Challenges to storm-water management
• Danger of flooding from River Shannon
• Emergency planning requirements for staff/passengers from flooded areas
• High volume of international and domestic passenger disruption during airport closures
• Increased risks to health & safety during landing and take-off in stormy conditions
• Impact on economy when business travellers are disrupted, and tourism when leisure passengers are disrupted
• Economic cost of damage to aircraft, airport buildings and related infrastructure
• Health and safety of passengers in warm weather if air conditioning/water not available or operational on aircraft
Storms/High Wind/Storm Surges
• Damage to aircraft and airport buildings from high winds
• Increased safety risks during landing and take-off
• Damage to airport buildings and related facilities including flood defences
• Risks to aircraft on the ground
• Disruption of services
Heat Waves • Potential issues with aircraft climb
• Increased need for air-conditioning on aircraft and in airport buildings
Cold Spells • Operation disruption
• Quicker degradation of runways/tarmac from freezing temperatures
• Issues for aircraft landing on damaged surfaces
Sea Level Rise • Pressure on flood defences, particularly at Shannon Airport
• Operation disruption

109
Transport Sector | Climate Change Sectoral Adaptation Plan
Climate Impact Chains - continuedTransport Subsector Climate Impact ObservedRisks ProjectedRisks Consequences
Maritime Increased Precipitation
• Decreased ability of radar during heavy precipitation
• Challenges to storm-water management
• Risk of pollution if drainage services are overwhelmed
• Risk of flooding for storage facilities
• Positive or negative impacts on dredging requirements depending on the location
• Gradual impact on natural scouring capability of estuarial ports
• Impact on freight if services are cancelled
• Economic impact of damage to vessels, buildings and other port infrastructure
• Impact on tourism if ferry sailings are delayed or cancelled
• Health and safety of passengers, port workers and vessels operators during extreme weather
Storms/High Wind/Storm Surges
• Damage to port infrastructure and vessels in ports
• Ability of equipment to discharge at high water can be compromised
• Damage to port infrastructure, vessels in port, navigational aid and safety equipment
• Risk to safety of passengers while in transit/embarking/ disembarking
Heat Waves • Extreme heat can cause degradation to road surfaces and felt type roofing products
• High temperatures may cause glass boxes on cranes to become too hot to work in
• Drought may impact on natural scouring leading to increased siltation
Cold Spells • Increased damage to roads, walls, paving, water pipes and storage tanks
• Possibility that operational fuel may freeze in extremely low temperatures
Sea Level Rise • Impact on capabilities of existing infrastructure and equipment i.e. ability to discharge at the top of high water

110
Transport Sector | Climate Change Sectoral Adaptation Plan
Appendix III:
Summary of measures outlined in Developing Resilience to Climate Change in the Irish Transport Sector (2017)
Table III.1: Summary of measures outlined in Developing Resilience to Climate Change in the Irish Transport Sector(2017).Atrafficlightsystemwasemployedtoillustratetheprogressachieved in relation to eachmeasure outlined;whereby the green colour indicates thatthemeasurehasbeencompleted;orangeindicatesthatprogresstowardsimplementationremains ongoing; and red indicates that progress towards implementation has not beencommenced.
Objective Action Indicator Implemented
Policy Integration 1
Publish this Adaptation Plan under the provisions of the National Climate Change Adaptation Framework 2012
Recognition within sectoral work programmes (mainstreaming)
2Participate and engage with the cross-sectoral Adaptation Governance group
Co-operation with other sectors/sub-national levels
3
Continue to engage with the Climate Change Advisory Council and consider their findings and recommendations in relation to adaptation
Co-operation with other sectors/sub-national levels
4Participate in National Dialogue on Climate Change
Co-operation with other sectors/sub-national levels
5Contribute to the development of sectoral adaptation planning guidelines by the EPA
Co-operation with other sectors/sub-national levels
6
Consider potential opportunities and costs for adaptation mechanisms in the development of the national strategy on Intelligent Transport Systems
Recognition within sectoral work programmes (mainstreaming)
7TII to publish Strategy for Adapting to Climate Change on Irelands’ Light Rails and National Roads Network
Recognition within sectoral work programmes (mainstreaming)
8Support the RSA educational policy for freight drivers in extreme conditions.
Recognition within sectoral work programmes (mainstreaming)
9Ensure that climate change is mainstreamed in general policy and strategic objectives to 2050
Recognition within sectoral work programmes (mainstreaming)
10Ensure climate considerations are fully addressed in the NPF
Recognition within sectoral work programmes (mainstreaming)
11Support actions highlighted in the sectoral contribution to the NMP which carry co-benefits for adaptation
Recognition within sectoral work programmes (mainstreaming)
12Examine the potential for incorporating climate adaptation awareness in the general driver theory testing process
Recognition within sectoral work programmes (mainstreaming)

111
Transport Sector | Climate Change Sectoral Adaptation Plan
Objective Action Indicator Implemented
Research & Collaboration 13
Support collaborative and sector specific research among its stakeholders by engaging expert speakers, disseminating information on new technologies etc.
Level of adaptation research; Co-operation with other sectors/sub-national levels
14Through the cross-sectoral adaptation governance group, assist in the further development of Climate Ireland
Level of adaptation research; Co-operation with other sectors/sub-national levels
15Continue to keep informed of developments in other EU countries
Level of adaptation research
16
Identify likely vulnerabilities for the transport network through inter-alia, continued participation in the CIVIC steering group
Level of adaptation research
17Support the proposed establishment of regional offices to coordinate the local authority response to climate action
Co-operation with other sectors/sub-national levels
18
Support the use by Local Government of the forthcoming Local Authority Adaptation Support Wizard in the development of coordinated local and regional-level adaptation strategy
Co-operation with other sectors/sub-national levels
Objective Action Indicator Implemented
Investment&Development 19
Through the Adaptation Steering group investigate potential EU funding sources to advance adaptation projects
Co-operation with other sectors/sub-national levels
20
Future requests for funding for repair of infrastructure will also need to identify the cost of installing preventative measures
Recognition within sectoral work programmes (mainstreaming)
Objective Action Indicator Implemented
Risk Assessment
21
Establish a data collection system, in tandem with stakeholders, for periodically collating information in relation to climate incident impacts on transport stakeholders
Baseline monitoring
22TII to complete a detailed flood risk assessment of the national road and light rail network
Baseline monitoring
23
TII to implement and further develop a flood protocol to manage flood events and remediate identified vulnerable sections
Launch of adaptation measures/level of spending collected; Baseline monitoring
24Iarnród Éireann to develop a Coastal Vulnerability Index (CVI) model to pinpoint areas of extreme vulnerability
Baseline monitoring
25
Dublin Port to build higher quay walls and raise hinterlands to future-proof against long-term SLR as part of the Alexandra Basin Redevelopment project
Launch of adaptation measures/level of spending collected
26
Consider appropriate mechanisms to identify vulnerable areas and critical transport assets as part of a detailed risk assessment across the entire transport system; vis-à-vis CIViC and C-Risk projects
Level of adaptation research; Co-operation with other sectors/sub-national levels; Baseline monitoring

112
Transport Sector | Climate Change Sectoral Adaptation Plan
Appendix IV:
AcronymsandAbbreviations
AA Appropriate Assessment
BBB Build Back Better principles
CARO Climate Action Regional Offices
CCAC Climate Change Advisory Council
CCMA County and City Management Association
CIÉ Córas Iompair Éireann
CIViC Critical Infrastructure Vulnerability to Climate Change (EPA Research Report)
COP21 2015 United Nations Climate Change Conference
CNG Compressed Natural Gas
CSO Central Statistics Office
CVI Coastal Vulnerability Index
DAA Dublin Airport Authority
DAFM Department of Agriculture, Food and the Marine
DART Dublin Area Rapid Transit
DCCAE Department of Communications, Climate Action and the Environment
DHPLG Department of Housing, Planning and Local Government
DTTAS Department of Transport, Tourism and Sport
EEA European Environment Agency
EC European Commission
EIA Environmental Impact Assessment
EPA Environmental Protection Agency
ESB Electricity Supply Board
EU European Union
GDA Greater Dublin Area
GDP Gross Domestic Product
GHG Greenhouse Gas
GNI Gas Networks Ireland
GSI Geological Survey Ireland
IAA Irish Aviation Authority
ICHEC Irish Centre for High-End Computing
ICT Information and Communications Technology
IPCC Intergovernmental Panel on Climate Change
ISO International Organisation for Standardisation
JOC Joint Oireachtas Committee
LAs Local Authorities
MCCAE Minister for Communications, Climate Action and the Environment
MTTAS Minister for Transport, Tourism and Sport
NAF National Adaptation Framework (2018)
NCCAF National Climate Change Adaptation Framework (2012)
NDP Project Ireland 2040: National Development Plan (2018)
NECG National Emergency Coordination Group
NECP National Energy and Climate Plan
NI Northern Ireland
NPF Project Ireland 2040: National Planning Framework (2018)
NTA National Transport Authority
OPW Office of Public Works
PLUTO Planning Land Use and Transport Outlook (forthcoming)
PSO Public Service Obligation
RCM Regional Climate Model
RCP Representative Concentration Pathway
RH Relative Humidity
SAA Shannon Airport Authority
SAC Special Area of Conservation
SEA Strategic Environmental Assessment
SDG (United Nations) Sustainable Development Goals
SLR Sea Level Rise
SPSV Small Public Service Vehicle
TEN-T Trans-European Transport Networks
TfI Transport for Ireland
TII Transport Infrastructure Ireland
UNFCCC United Nations Framework Convention on Climate Change