Transparency and Liquidity in the Structured Product...
48
Transparency and Liquidity in the Structured Product Market Nils Friewald * Rainer Jankowitsch † Marti G. Subrahmanyam ‡ First Version: May 15, 2012 This Version: June 28, 2014 Abstract We use a unique data set from the Trade Reporting and Compliance Engine (TRACE) to study liquidity effects in the US structured product market. Our main contribution is the analysis of the relation between the accuracy in measuring liquidity and the poten- tial degree of disclosure. We provide evidence that transaction cost measures that use dealer-specific information can be efficiently proxied by measures that use less detailed information. In addition, we analyze liquidity, in general, and show that securities that are mainly institutionally traded, guaranteed by a federal authority, or have low credit risk, tend to be more liquid. JEL-Classification: G12, G14 Keywords: liquidity, structured products, OTC markets, transparency, TRACE. * WU Vienna University of Economics and Business, Department of Finance, Accounting and Statistics, Welthandelsplatz 1, 1020 Vienna, Austria; email: [email protected] † WU Vienna University of Economics and Business, Department of Finance, Accounting and Statistics, Welthandelsplatz 1, 1020 Vienna, Austria; email: [email protected] ‡ New York University, Stern School of Business, Department of Finance, 44 West Fourth Street, Room 9-68, New York, NY 10012; email: [email protected] This paper was previously distributed under the titles “Liquidity, Transparency and Disclosure in the Securitized Product Market” and “To Disclose or not to Disclose: Transparency and Liquidity in the Structured Product Market.” We thank Ali´ e Diagne and Ola Persson of the Financial Industry Regulatory Authority (FINRA) for providing us with privileged access to a proprietary data set, comprising of transactions in the fixed-income structured product market in the United States, from the pilot phase of a new transparency project that took place in 2011–2012. We are grateful to the Montreal Institute of Structured Products and Derivatives (IFSID) for their generous financial support. Further, we thank Yakov Amihud, Jack Bao, Jens Dick-Nielsen, Florian Nagler, Stijn van Nieuwerburgh, Christopher Hennessy, Stefan Nagel, Oliver Randall, David Simon, Bruce Tuckman, and James Vickery for helpful comments on earlier versions of our paper. We are grateful to participants at the 2013 Annual Conference of the Swiss Society for Financial Market Research, the 2014 Annual Meeting of the American Finance Association, the 2014 Annual Conference of the European Financial Management Association and seminar participants at the NYU Stern School of Business for useful suggestions.
Transcript of Transparency and Liquidity in the Structured Product...

Transparency and Liquidity in the Structured Product Market
Nils Friewald∗ Rainer Jankowitsch† Marti G. Subrahmanyam‡
First Version: May 15, 2012
This Version: June 28, 2014
Abstract
We use a unique data set from the Trade Reporting and Compliance Engine (TRACE)
to study liquidity effects in the US structured product market. Our main contribution is
the analysis of the relation between the accuracy in measuring liquidity and the poten-
tial degree of disclosure. We provide evidence that transaction cost measures that use
dealer-specific information can be efficiently proxied by measures that use less detailed
information. In addition, we analyze liquidity, in general, and show that securities that
are mainly institutionally traded, guaranteed by a federal authority, or have low credit
risk, tend to be more liquid.
JEL-Classification: G12, G14
Keywords: liquidity, structured products, OTC markets, transparency, TRACE.
∗WU Vienna University of Economics and Business, Department of Finance, Accounting and Statistics,Welthandelsplatz 1, 1020 Vienna, Austria; email: [email protected]†WU Vienna University of Economics and Business, Department of Finance, Accounting and Statistics,
Welthandelsplatz 1, 1020 Vienna, Austria; email: [email protected]‡New York University, Stern School of Business, Department of Finance, 44 West Fourth Street, Room 9-68, New
York, NY 10012; email: [email protected] paper was previously distributed under the titles “Liquidity, Transparency and Disclosure in the Securitized
Product Market” and “To Disclose or not to Disclose: Transparency and Liquidity in the Structured Product Market.”We thank Alie Diagne and Ola Persson of the Financial Industry Regulatory Authority (FINRA) for providing uswith privileged access to a proprietary data set, comprising of transactions in the fixed-income structured productmarket in the United States, from the pilot phase of a new transparency project that took place in 2011–2012. Weare grateful to the Montreal Institute of Structured Products and Derivatives (IFSID) for their generous financialsupport. Further, we thank Yakov Amihud, Jack Bao, Jens Dick-Nielsen, Florian Nagler, Stijn van Nieuwerburgh,Christopher Hennessy, Stefan Nagel, Oliver Randall, David Simon, Bruce Tuckman, and James Vickery for helpfulcomments on earlier versions of our paper. We are grateful to participants at the 2013 Annual Conference of theSwiss Society for Financial Market Research, the 2014 Annual Meeting of the American Finance Association, the2014 Annual Conference of the European Financial Management Association and seminar participants at the NYUStern School of Business for useful suggestions.

1 Introduction
The US fixed-income structured product market –also referred to as the securitized product market–
is an important financial market that has received much attention in the past few years, especially
since the financial crisis. With an average daily trading volume of more than $200 billion in 2011–
2012, it is the second largest fixed-income market in the US, after the Treasury bond market. Its
products are traded over-the-counter (OTC), with no central market place, or even a clearing house,
thus far. Following the financial crisis, in which structured financial products played an important
role, the opacity implied by this OTC architecture has been widely critized, since traded prices
and volumes are not readily observable. Thus, liquidity in the structured product market, with its
complex financial instruments, has only been measurable based on potentially unrepresentative or
biased information, such as quotations from individual dealers.
The Financial Industry Regulatory Authority (FINRA) has, therefore, recently launched a
project with the aim of improving transparency in the structured product market. Since May
16, 2011, virtually all trades in the fixed-income securitized product market have been required
to be reported to the Trade Reporting and Compliance Engine (TRACE) by the broker/dealers.1
However, FINRA has not yet released this information to the market.2 This unique data set allows
us to analyze liquidity effects based on a complete information set before the potential dissemination
of the data to the broader market, and thus, before the possible reaction of the market participants
to a new regime.
So far, there has been only a modest literature analyzing liquidity effects in the fixed-income
structured product market, mostly focusing on liquidity at the market-wide level. However, this
type of analysis, dictated by the constraints of data availability, provides only a very limited
view of the structured product market’s liquidity. Moreover, in contrast to other fixed-income
markets, an aggregate analysis of securitized products masks several issues of detail, since this
1This project follows the earlier FINRA project, which resulted in the establishment of the US corporate bondTRACE database.
2FINRA started to release information to the market for the To-Be-Announced (TBA) segment on November 12,2012 and MBS specified pool transactions on July 22, 2013. FINRA is continuing to study the other segments beforedeciding on its dissemination policy. However, during our observation period, no information had been released tothe market for any of the segments.
1

market consists of rather diverse instruments with potentially different liquidity characteristics.
Following FINRA’s definitions, these products are classified into four main segments: Asset-Backed
Securities (ABS), Collateralized Mortgage Obligations (CMO), Mortgage-Backed Securities (MBS)
and To-Be-Announced securities (TBA), essentially forward contracts on MBS. In particular, the
securitized products of these different segments allow investment in various pools of assets, often
consisting of loans to retail customers, which, in most cases, cannot be traded on an individual basis.
Thus, in contrast to corporate or Treasury bonds, the credit risk of an individual security stems
from the cashflows of the relevant pool and not from the creditworthiness of the particular issuer,
alone. A second important point is that securitized products have quite diverse cash-flow structures,
ranging from simple pass-through instruments to tranches with very complex risk structures. In
addition, government-sponsored enterprises (i.e., GSEs) provide implicit or explicit guarantees for a
significant number of instruments. Therefore, securitized products constitute a unique fixed-income
market with distinct features compared to other important markets. Thus, a comprehensive study
of liquidity for individual instruments in this securitized product market is of special interest for
all market participants, and has been missing, so far.
Our study fills this gap by exploring a broad range of liquidity proxies for the structured prod-
uct market, employing product characteristics (e.g., amount issued), trading activity variables (e.g.,
number of trades) and more conceptually sound liquidity measures (e.g., the Amihud measure) that
have been proposed in the academic literature in the context of OTC markets. Our main contri-
bution is the analysis of the relation between the measurement of liquidity and the level of detail
in the potential dissemination of trading data. As we have privileged access to all the relevant
trading information, we can examine whether the detailed dissemination of transaction data pro-
vides valuable information, beyond what simple product characteristics or aggregated information
would offer. This is important as the various liquidity measures presented in the academic lit-
erature require different information sets for their estimation, with varying levels of detail. For
example, measuring liquidity based on the round-trip cost uses the most detailed information, i.e.,
each transaction needs to be linked to a particular dealer, on each side of the trade. Other liquidity
metrics, such as the effective bid-ask spread, do not need such detailed trade information for their
2
computation; but, transactions need to be flagged as buy or sell trades. Many alternative liquidity
measures rely on trading data as well: However, they use only information regarding the price
and/or volume of each transaction. On the other hand, product characteristics or trading activity
variables represent simpler proxies, using either static or aggregated data.
Thus, the question arises as to the level of detail of data that ought to be released to the market
with the aim that market participants can reliably estimate measures of liquidity/transaction costs
but without compromising dealer identities and/or dealers’ trading strategies. For this analysis,
we compare various liquidity proxies with the round-trip cost measure. We use this measure as
our benchmark because it reflects actual transactions costs closest. Of course, the round-trip cost
measure itself relies on data that would certainly compromise trader confidentiality. Thus, it is of
importance to study whether other measures using less detailed data are still reliable proxies for
liquidity. This issue is relevant in improving market transparency and fostering our understanding of
the information contained in disseminated transaction data of OTC markets, in general. There is a
thin line between additional disclosure, which would risk revealing individual trading positions, and
providing greater transparency. To address this issue, we present a regression analysis discussing
the explanatory power of various liquidity measures based on different sets of information.
As an additional contribution, we explore the trading activity and transaction costs of the
various segments of the structured product market, in detail. In particular, we analyze liquidity
effects in the four main segments of the structured product market (i.e., ABS, CMO, MBS and
TBA), covering all the different products, and compare these results with those from other fixed-
income OTC markets, such as those for US corporate or Treasury bonds. Furthermore, we test
various hypotheses concerning liquidity effects of various sub-segments, e.g., based on credit rating
or seniority. This analysis allows us to explain, at least to some extent, the observed differences
between the market segments.
For our empirical analysis, we use all traded prices and volumes in the fixed-income structured
product market, along with security characteristics provided by FINRA, and credit ratings from
Standard & Poor’s (S&P). Our data set comprises of information for over 267,000 securitized
products in the US, for which about 6 million trades were conducted over the period from May 16,
3

2011 to October 31, 2012. Hence, our data cover the whole securitized product market during this
period, including even securities with very low trading activity.
Overall, we find a high level of trading activity in the structured product market, with an
average daily trading volume of around $227 billion, and an average transaction cost of around 66
bp for a round-trip trade. The TBA segment, which is a forward market, has the highest trading
volume, with $204 billion, whereas the CMO and MBS segments are basically of the same order
of magnitude as the US corporate bond market, which has a daily trade volume of around $15
billion. The ABS market is considerably smaller. In all segments, we find more dispersed trading
activity than in other important fixed-income markets, i.e., fewer trades per security, but with
higher volumes. Liquidity is quite diverse in the four segments. The ABS and MBS segments have
round-trip costs of around 50 bp, which is comparable to that of the US corporate bond market.
In contrast, the TBA segment (4 bp) is far more liquid, whereas the CMO segment (97 bp) is
considerably less liquid. Furthermore, in line with our hypotheses, we find that securities that are
mainly institutionally traded, guaranteed by a federal authority, or have low credit risk, tend to be
more liquid, thus explaining some of the differences between the market segments.
Exploring the various liquidity metrics and focusing on the predictive power of transaction
data, we show that simple product characteristics and trading activity variables, by themselves,
may not be sufficient statistics for measuring market liquidity. In particular, when regressing state-
of-the-art liquidity measures on product characteristics and trading activity variables, we find that
the various liquidity measures offer significant idiosyncratic information. Thus, dissemination of
detailed transaction data, necessary for the estimation of liquidity measures, is of importance in
the fixed-income structured product market. However, there is evidence that liquidity measures
based on price and volume information alone (e.g., the imputed round-trip cost measure) can
explain most of the variation observed in the benchmark measure, which uses significantly more
information and certainly runs the risk of compromising the confidentiality of trader identity. In
a second set of regressions, we explain the observed yield spreads using various combinations of
liquidity variables and find similar results: Liquidity measures provide higher explanatory power
than product characteristics and trading activity variables alone. However, this result is mostly
4

driven by price and volume information. Thus, details regarding the identities of the specific
dealers involved with a particular trade or the direction of the trade are not an absolute necessity
in terms of their informational value to market participants: Reasonable estimates of liquidity can
be calculated based on prices and volumes of individual trades, without divulging dealer-specific
information. This is an important result for all market participants, as it provides valuable insights
concerning the information content of reported transaction data.
The remainder of the paper is organized as follows: In Section 2, we discuss the importance
of transparency in fixed-income markets, particularly for structured products, in the context of
the literature and present our hypotheses and research questions. Section 3 describes the data
set as well as the matching and filtering procedures we apply. Section 4 defines and discusses the
liquidity proxies that we employ in our empirical analysis. Section 5 presents the empirical results
and Section 6 concludes.
2 Transparency in the Structured Product Market
In this section, we discuss the trading architecture of the structured product market and its deficien-
cies with regard to market transparency. Furthermore, we compare the new disclosure requirements
of FINRA with previous transparency projects in the US corporate and municipal bond markets.
We do so in the context of the relevant literature and motivate our research questions and hypothe-
ses.
Similar to most other fixed-income markets, the US securitized product market has an OTC
architecture. Thus, trading activity is opaque, since transactions take place through a one-to-one
contact between an investor and a broker/dealer, or between two broker/dealers. However, in con-
trast to other fixed-income markets (i.e., the Treasury, municipal and corporate bond markets), the
market segments and products are quite diverse, as securitized products are based on substantially
varying pools of underlying securities and have different cash-flow structures, ranging from simple
“pass-through” products to tranches with their complex risk structures (see Section 3). Given the
OTC structure of this market, traded (or even quoted) prices and volumes are generally not observ-
able. As a consequence of this lack of transparency, liquidity measures based on the trading costs
5

or market impact of trades can only be estimated using simple measures based on market-wide
statistics or quotation data, if available. In such an opaque market environment, the observation
of market activity is difficult, and severe disadvantages can arise for market participants, e.g., high
transaction costs for certain types of trades. This effect is exacerbated during periods of crisis, with
the liquidity and price disadvantage becoming more pronounced, particularly when selling pressure
intensifies. Thus, the deleterious consequences of the skewed effects of liquidity are of concern
to portfolio managers, traders and regulators. In response to such concerns about the opacity of
this market, especially during the financial crisis, FINRA recently started a transparency project
for structured fixed-income products, making the reporting of trading activity mandatory for bro-
kers/dealers. In the first phase of this project, which started on May 16, 2011, all trades have had
to be reported to the TRACE database for structured products, although the information collected
had not been released to the market during our sample period.
FINRA’s transparency project for structured products is comparable to its earlier introduction
of the TRACE database for the US corporate bond market, where reporting of all trades is also
mandatory for all brokers/dealers within 15 minutes of execution, but with the information being
promptly disseminated to the market. TRACE was introduced in this market through multiple
phases starting in July 2002, and set in place in its current form in October 2004. There was
much debate, to begin with, concerning the dissemination of the transaction data. In the end,
information about all trades was disseminated, but without revealing the identity of the dealer or
the precise volume (the volume being capped at one or five million, depending on the credit quality
of the bond).3 A similar transparency project was also conducted for the municipal bond market
by the Municipal Securities Rulemaking Board (MSRB). Initiatives to improve trade transparency
for this market started in 1998, and similar rules to those for the corporate bond market were
adopted in 2005, i.e., making trade reporting obligatory within 15 minutes, and disclosing similar
information. The TRACE and MSRB initiatives are milestone transparency projects in the context
of OTC markets, and have justifiably received a lot of attention in the academic literature. Many
studies have used these data sets to quantify and study liquidity effects in the various stages of
3More recently, the precise volume has been disclosed, with an 18-month delay.
6

their implementation.
Using data from the early stages of the MSRB project, Harris and Piwowar (2006) analyze the
transaction costs in the municipal bond market for a one-year sample period starting in November
1999. They find round-trip costs of around 100 bp for institutional trades, and show that small
retail trades turn out to be twice as expensive as this. Furthermore, they document that transaction
costs increase with credit risk, maturity and bond age. Green et al. (2007b) focus on the municipal
bond market as well, using the round-trip cost measure. They find similar transaction costs and
decompose these costs into dealers’ costs versus market power, showing that dealers have significant
market power in retail trading, and confirming that smaller trades are more expensive. Based on
TRACE data for US corporate bonds in various stages of the implementation of that project,
Bessembinder et al. (2006), Goldstein et al. (2007) and Edwards et al. (2007) use transaction cost
measures of liquidity to show that round-trip costs for intermediate trade volumes are in the range
of 30 bp to 60 bp. They also provide evidence that these costs are dependent on trade size, credit
risk and bond maturity.4
In contrast to the aforementioned papers, there have been only a few papers analyzing liquidity
effects in the fixed-income structured product market, given the discussed constraints of data
availability. Vickery and Wright (2013), for example, use aggregated trading volumes for the
whole market to analyze liquidity effects. Given the complexity and diversity of the fixed-income
structured product market, an aggregate analysis of this sort may yield only limited insights into
issues of liquidity and market microstructure.
The first focus of this paper is to close this gap by employing a wide range of liquidity measures
developed in the academic literature (see Section 4) and providing a detailed analysis of liquidity
in the structured product market, in general, and its four segments (ABS, CMO, MBS and TBA),
in particular. These segments constitute a diverse range of fixed-income securitized products. In
addition, we analyze different sub-segments that have turned out to be important in the other
fixed-income markets and quantify the effects for the securitized product market. Specifically,
4More recent papers quantifing liquidity in these markets provide, in general, similar evidence. However, theyrely on other sets of liquidity measures and study different sample periods. See, e.g., Mahanti et al. (2008), Ronenand Zhou (2009), Jankowitsch et al. (2011), Bao et al. (2011), Nashikkar et al. (2011), Lin et al. (2011), Feldhutter(2012), Friewald et al. (2012) and Dick-Nielsen et al. (2012).
7

we test the following hypotheses: (i) We compare institutional to retail traded products and test
the hypothesis of lower liquidity for retail trades, as retail investors are often confronted with
higher search frictions and have basically no market power. Such effects are discussed, e.g., in the
models for OTC markets of Duffie et al. (2007) and Green et al. (2007b) in which search time and
bargaining power determines the security price for individual investors. In addition, lower liquidity
for retail investors is well documented for other OTC markets, e.g., in Harris and Piwowar (2006)
for the municipal bond market. (ii) We analyze sub-segments based on different credit ratings and
expect to find an interaction between credit and liquidity risk, i.e., securities with low credit risk
are more liquid. For example, Acharya et al. (2013) argue that riskier assets have higher liquidity
premia, as these assets are more affected in crisis periods, whereas low risk assets react less in such
periods due to flight to quality effects. They provide empirical evidence for bond and stock markets.
Furthermore, we quantify and explore two aspects that are unique to the securitized product market.
First, many products are guaranteed by federal agencies (GSEs), which provide implicit or explicit
government guarantees (see Section 3). (iii) Thus, we compare such products to non-agency issues
and test the hypothesis that agency securities are more liquid, given the potentially lower credit
risk and higher degree of standardization, see Vickery and Wright (2013) for a discussion of agency
guarantees and their liquidity enhancing effects. Second, an important fraction of products such
as ABS and CMO have complex risk structures offering different tranches based on certain pools
of underlying securities (see Section 3). (iv) Therefore, we analyze these tranches expecting to
find that more senior claims tend to be more liquid, as senior tranches often constitute the largest
issue within a structure and have lower exposure to the credit risk of the underlying pool by
construction. Theoretical evidence for this effect is provided by Hennessy (2013), who analyzes the
optimal packaging of cashflows for structured products in a Kyle (1985)-style model and predicts
that more senior tranches are more liquid.
Note that the new TRACE data set has also been analyzed simultaneously by other authors
covering certain aspects of liquidity as well: Atanasov and Merrick (2013) focus on a specific market
segment and study the trading frictions for MBS securities issued by Fannie Mae. They find that
these frictions result in small trades occurring at substantial discounts relative to coincident large
8

trades. Hollifield et al. (2012), on the one hand, compare 144a with registered products and, on
the other hand, study the structure of intermediary networks. They find evidence that investor’s
transaction costs are smaller when trading with central and more interconnected dealers. The paper
which is perhaps closest to ours in spirit is by Bessembinder et al. (2013), who also analyze trading
activity and transactions costs in the structured product market.
However, our paper is different from Bessembinder et al. (2013) for at least five important
reasons, relating to various aspects of liquidity effects in the structure product market: First, while
their analysis is based only on one single estimate of liquidity, we, in contrast, rely on a much broader
set of liquidity proxies, which allows us to discuss the information contained in measures employing
reported data at different levels of detail. Second, while Bessembinder et al. (2013) use a regression-
based estimate of liquidity, our round-trip cost measure (which serves as our benchmark) reflects
the cost of trading more accurately, since it is based on detailed dealer-specific transaction costs,
which are straightforward to compute, and does not depend, in any way, on modeling assumptions.
Third, in their analysis, they focus solely on customer-to-dealer trades which constitute only a
rather small fraction of all trades in the structured product market, whereas our analysis is based
on all customer-to-dealer and dealer-to-dealer transactions. Fourth, unlike their study, we analyze
different sub-segments (e.g., tranche seniority, issuing authority, credit rating) of the overall market
in much more detail. These sub-segments have either turned out to be important in other fixed-
income markets, or are unique to the structured product market. Finally, a novel contribution
of our paper is that we also analyze which of the liquidity measures best serves to explain yield
spreads in the securitized product market.
As emphasized earlier, the main focus of our research is the relation between the level of detail
in the disclosure requirements and the accuracy of the liquidity measure(s) that can be computed
from the resulting data. For instance, during the implementation phases of the MSRB and TRACE
projects, there was some controversial discussion regarding whether an increase in transparency
(i.e., the dissemination of more detailed transaction data) would have a positive effect on market
liquidity. Some market observers argued that such transparency in rather illiquid OTC markets
would expose dealers’ inventory and trading strategies to other market participants, which could
9

lead dealers to reduce their trading activity in order to avoid the resulting disadvantages in the price
negotiation process. However, more recent research on price discovery and liquidity, using controlled
experiments, finds clear evidence of an increase in liquidity when transparency is improved. For
example, Bessembinder et al. (2006) compare transaction costs in the US corporate bond market
for a sample of insurance company trades before and after the implementation of the TRACE
transparency project in that market. They find that transaction costs decreased dramatically (by
50%); even for bonds not subject to the reporting requirements, trading costs reduced (by 20%).
Goldstein et al. (2007) find similar results in their study of a BBB-rated bond sample. They report
that medium to small trades benefit more from transparency. Furthermore, they show that trade
volume does not decrease following greater transparency of disclosure.5
Overall, these papers find that the chosen level of detail of disseminated data has a positive effect,
compared to the regime in which no transaction data were disseminated. However, the majority
of these papers focus solely on one individual liquidity measure, given the limitations of data
availability. Thus, these papers do not ask the broader question of how informative transaction data
are to market participants in terms of market liquidity conditions, as they do not comprehensively
compare liquidity measures based on different information sets.
In this paper, we remedy this lacuna by focusing particularly on the relation between the
measurement of liquidity and the potential disclosure of information, in addition to quantifying
liquidity. Thus, we ask how much information should be disseminated to allow for the accurate
measurement of liquidity, compared to our benchmark measure using the most detailed information,
in particular trader identity and trade direction, which certainly runs the risk of compromising the
identities of individual traders or their trading strategies. Therefore, we measure the efficacy of
liquidity metrics that require different levels of detail in terms of the information used to compute
them. We analyze two aspects of this question, using different sets of regressions: First, we explore
to what extent product characteristics, trading activity variables and liquidity measures using less
information can proxy for the benchmark measure which is based on all available information.
5For the primary municipal and corporate bond markets, Green (2007), Green et al. (2007a) and Goldstein andHotchkiss (2007) provide similar evidence. They show, both theoretically and empirically, that transparency reducesunderpricing, after the dissemination of trading data. In addition, Schultz (2012) documents that transparencyconsiderably reduces the dispersion of purchase prices while the effect on markups (due to commissions) is small.
10
Second, we study which liquidity measures can best explain the cross-sectional differences in yield
spreads for our sample.
3 Data Description
We use the new TRACE data set compiled by FINRA in the course of their recent transparency
project for the fixed-income structured product market. This proprietary data set comprises of all
reported transactions made by dealers and brokers in the US structured product market between
May 16, 2011 and October 31, 2012. The complete information will be distributed to market
participants in due course, although the level of detail and the time-table for its release are yet to
be decided.6 The data set contains, as basic attributes, the price, volume, trade date and time of
each individual transaction. Furthermore, it is possible in our data set to link individual trades to
dealers, as the data are comprised of specific broker/dealer information, although the identity of
the individual dealers is coded, and hence concealed to us. In addition, we can distinguish buy- and
sell-side trades in the data set, identifying the active customer in each transaction. The raw data set
comprises of 9,013,026 transactions in 277,272 products. We employ various cleaning and filtering
procedures before analyzing the data.7 First, we clean our data set by removing agency capacity
transactions.8 Second, we remove transactions that were reported more than once; this typically
occurs in inter-dealer trades when both parties are obliged to report to TRACE. Disregarding this
duplication would otherwise distort the calculation of trading activity variables as well as some
of our liquidity proxies. Note that most of the eliminated transactions are removed because of
this double reporting. Third, since the transaction data most likely contain erroneously reported
6The time period of our data sample is dictated by the fact that, during this period, no data were disseminatedto the market. Since then, data on selected market segments have begun to be disseminated in stages, starting withthe TBA market on November 12, 2012. Since our research focuses on the potential level of disclosure, we restrictour attention to the period when no data were disseminated. In subsequent research, we plan to explicitly examinethe effects of the (staged) disclosure of information.
7Our filtering procedures are similar to, but more detailed than those that are normally applied for the UScorporate bond TRACE database (see, e.g., Dick-Nielsen (2009)).
8In an agency-capacity transaction a broker or intermediary (i.e., the agent) is authorized by a principal partyto execute a trade on its behalf with a third party for which the agent charges a commission. However, commissionsare reported only for a tiny fraction of all agency transactions. Since FINRA requires the agent to file two reports,i.e., a buy and a sell-side transaction at the same price, the cost of a round-trip in such a transaction would mostlyappear to be zero and, thus, would bias our analysis.
11

trades, we apply two types of filter, a price median filter and a price reversal filter, similar to the
filters suggested for the US corporate bond market data (see e.g., Edwards et al. (2007)). While
the median filter identifies potential outliers in the reported prices within a certain time period,
the reversal filter identifies unusual price movements.9 After applying these cleaning and filtering
procedures, we end up with 5,820,428 reported transactions for 266,660 securitized products.
Structured products can be classified into four market segments according to FINRA’s defi-
nitions, i.e., ABS, CMO, MBS and TBA. The instruments traded in these individual segments
are rather diverse, as structured products can be based on substantially different cash-flow struc-
tures. Furthermore, the securities are issued/guaranteed by multiple federal agencies as well as
non-agencies. In the following, we provide a brief summary description of each of the four market
segments to place their distinguishing characteristics in perspective.
ABS are created by bundling loans, such as automobile loans or credit card debt, and issuing
securities backed by these assets, which are then sold to investors. In most cases, multiple securities
are offered on a given portfolio. Known as tranches, they are all based on a single pool of underlying
loans, but have differing levels of risk. In general, payments are first distributed in a “waterfall”
to the holders of the lowest-risk securities, and then sequentially to the holders of higher-risk
securities, in order of priority, and hence risk. In most cases, ABS are issued by private entities
(“non-agencies”) rather than federal agencies. CMO are instruments similar to ABS, but backed by
pools of mortgage loans. A substantial fraction of these securities offer investors multiple tranches
with differing risk characteristics. As is to be expected, the prices of CMO tranches are often
highly sensitive to property prices. Other products in this market segment are “pass-through”
securities, which entitle the investor to a pro-rata share of all payments made on an underlying
pool of mortgages. These securities are often guaranteed by one of the three GSEs, the Government
National Mortgage Association (Ginnie Mae), the Federal National Mortgage Association (Fannie
Mae) or the Federal Home Loan Mortgage Corporation (Freddie Mac).10 All three institutions
9The median filter eliminates any transaction where the price deviates by more than 10% from the daily medianor from a nine-trading-day median centered on the trading day. The reversal filter eliminates any transaction with anabsolute price change deviating from the lead, lag, and average lead/lag price change by at least 10%. These filtersare designed to remove most, if not all, errors arising from data entry.
10Fannie Mae and Freddie Mac actually take in mortgages from banks and then issue and guarantee CMO andMBS, while Ginnie Mae just provides guarantees. In a few cases, the guarantee is provided by the Small Business
12

are backed by explicit or implicit guarantees from the US government. MBS are similar to CMO
securities and represent claims on the cash flows from pools of mortgage loans. However, most
MBS are guaranteed by the three GSEs and are “pass-through” participation certificates entitling
the investor to a pro-rata share of future cash flows. TBA are conceptually different from the
three market segments described so far. TBA are essentially forward contracts on MBS where two
investors agree on the price and volume for delivering a particular agency’s MBS at a future date.
The precise composition of the pool is not known at the time of the TBA trade; rather, the broad
characteristics (issuer, maturity, coupon, price, amount, and settlement date) are agreed upon at
that time. Thus, this market segment is different from the other three, being a forward market
with less specificity in terms of the nature of the underlying cashflows.11
Based on information provided by FINRA, we can identify the market segment and the is-
suer/guarantor of each security, i.e., one of the three federal GSEs or a non-agency entity (private
labeller). This difference is particularly interesting for the CMO market segment, in which both
agencies and private labellers are active. Furthermore, we can determine whether a security is a
pass-through certificate or represents one of the tranches based on a specific pool of loans. Securities
that represent a tranche exist only in the ABS and CMO market segments. For these tranches, we
have data on its priority, defined by the following types: super-super senior (SSSR), super senior
(SSR), senior (SR), mezzanine (MEZ), and subordinated (SUB). Note, however, that we have no
information available concerning the underlying pool of loans, nor the attachment and detachment
points (i.e., the exact definitions of the sizes) of the tranches.
In addition, we have available to us basic data about the characteristics of the securities in our
database. In particular, we know the original amount issued, the coupon and the maturity. We
also obtain credit ratings from Standard & Poor’s. However, only a small fraction of the whole
universe of securities is rated, especially in the case of agency instruments, which typically do not
have ratings. Finally, to explore the liquidity of retail trading, we define transactions involving
securities with an average daily trading volume of less than $100,000 as retail trades, conforming
to the internal definitions used by FINRA. These variables and classifications of the overall sample
Administration.11See, e.g., Vickery and Wright (2013) for a detailed description of the institutional features of the TBA market.
13

allow us to analyze, in detail, the liquidity of the structured product market and its segments.
4 Liquidity Proxies
In this section, we introduce the liquidity proxies used in our empirical analysis. The proxies that
we present cover virtually all liquidity measures proposed in the related literature. We employ
both simple product characteristics and trading activity variables, using either static or aggregated
data. Furthermore, we present state-of-the-art liquidity measures that estimate transaction costs
or market impact using detailed trading data, allowing us to compare the performance of each
measure, in terms of its efficacy in estimating liquidity.12 In this section, we focus on the conceptual
underpinning of the liquidity proxies and their relation to the dissemination of data, and defer the
technical details of computing the liquidity measures to the appendix.
Product characteristics are rather crude proxies of liquidity that rely on the lowest level of
informational detail of all the categories.13 Thus, product characteristics are typically used as
liquidity metrics when there is a limitation on the level of detail in the transaction data. In
particular, we use the amount issued of a security measured in millions of US dollars. We presume
securities with a larger amount issued to be more liquid, in general. Another important product
characteristic is the time-to-maturity, which corresponds to the time, in years, between the trading
date and the maturity date of the security. We expect securities with longer maturities (over ten
years) to be generally less liquid, since they are often bought by “buy-and-hold” investors, who
trade infrequently. We also consider the instrument’s average coupon as a relevant proxy. Despite
the ambiguity of the relationship between the coupon and both liquidity and credit risk, we expect
that instruments with larger coupons are generally less liquid.14
12Our methodology is, thus, similar in spirit to Goyenko et al. (2009) who run horseraces of various liquiditymeasures against a liquidity benchmark, albeit for the equity market.
13Many early papers studying bond market liquidity rely on indirect proxies based on product characteristics suchas coupon, age, amount issued, industry, and covenants, and are forced to do so by the constraints of data availability,prior to the release of the TRACE data set for US corporate bonds (see, e.g., Elton et al. (2001), Collin-Dufresneet al. (2001), Perraudin and Taylor (2003), Eom et al. (2004), Houweling et al. (2005), and Longstaff et al. (2005)).Recent papers analyzing larger sets of variables include these proxies as well as more conceptually sound liquiditymeasures (see, e.g., Friewald et al. (2012) and Dick-Nielsen et al. (2012)).
14In some market segments (e.g., MBS and CMO), the coupon may also reflect prepayment risk. However, sincewe do not have detailed information available concerning the underlying pool of loans, we cannot properly disentangle
14
Trading activity variables such as the number of trades observed for a product on a given
day represent the aggregate market activity.15 Other similar variables that we calculate on a daily
basis, for each product, are the number of dealers involved in trading a specific product, and the
trading volume measured in millions of US dollars. We expect these variables to be larger, the
more liquid the product. On the contrary, the longer the trading interval, which refers to the time
elapsed between two consecutive trades in a particular product (measured in days), the less liquid
we would expect the product to be.
Liquidity measures are conceptually based, and hence, more direct proxies for measuring liq-
uidity, and require transaction information for their computation. However, the level of detail
concerning the required information set varies considerably across measures. The liquidity measure
that uses the most detailed information and, thus, serves as our benchmark measure, is the round-
trip cost measure, which can be computed only if the traded prices and volumes can be linked to
the individual dealer; see, e.g., Goldstein et al. (2007). It is defined as the price difference, for a
given dealer, between buying (selling) a certain amount of a security and selling (buying) the same
amount of this security, within a particular time period, e.g., one day. Thus, it is assumed that in
a “round-trip” trade, the price is not affected by changes in the fundamentals during this period.
Following the literature, the round-trip trade may either consist of a single trade or a sequence of
trades, which are of equal size in aggregate, on each side. The effective bid-ask spread, proposed
by Hong and Warga (2000), can be computed when there is information about trade direction
available. The effective bid-ask spread is then defined as the difference between the daily average
sell and buy prices (relative to the mid-price).
Many other liquidity measures use only the price and/or volume of each transaction, without
relying on dealer-specific or buy/sell-side information. A well-known metric proposed by Amihud
(2002), and conceptually based on Kyle (1985), is the Amihud measure. It was originally designed
for exchange-traded equity markets, but has also become popular for measuring liquidity in OTC
all these different types of risk.15Papers that use market-related proxies based on aggregated trading activity to study bond market liquidity
include, e.g., Perraudin and Taylor (2003), Houweling et al. (2005), De Jong and Driessen (2012), Friewald et al.(2012), and Dick-Nielsen et al. (2012).
15

markets. It measures the price impact of trades on a particular day, i.e., it is the ratio of the absolute
price change measured as a return, to the trade volume given in US dollars. A larger Amihud
measure implies that trading a financial instrument causes its price to move more in response to a
given volume of trading and, in turn, reflects lower liquidity. An alternative method for measuring
the bid-ask spread is the imputed round-trip cost, introduced by Feldhutter (2012). The idea here
is to identify round-trip trades, which are assumed to consist of two or three trades on a given day
with exactly the same traded volume. This likely represents the sale and purchase of an asset via
one or more dealers to others in smaller trades. Thus, the dealer identity is not employed in this
matching procedure; rather, differences between the prices paid for small trades, and those paid
for large trades, based on overall identical volumes, are used as the measure. The price dispersion
measure is a new liquidity metric recently introduced for the OTC market by Jankowitsch et al.
(2011). This measure is based on the dispersion of traded prices around the market-wide consensus
valuation, and is derived from a market microstructure model with inventory and search costs. A
low dispersion around this valuation indicates that the financial instrument can be bought for a
price close to its fair value and, therefore, represents low trading costs and high liquidity, whereas a
high dispersion implies high transaction costs and hence low liquidity. The price dispersion measure
is defined as the root mean squared difference between the traded prices and the average price, the
latter being a proxy for the respective market valuation.
The Roll measure, developed by Roll (1984) and applied by Bao et al. (2011) and Friewald
et al. (2012), for example, in the context of OTC markets, is a transaction cost measure that
is simply based on observed prices. Under certain assumptions, adjacent price movements can
be interpreted as a “bid-ask bounce”, resulting in transitory price movements that are serially
negatively correlated. The strength of this covariation is a proxy for the round-trip transaction
costs for a particular financial instrument, and hence, a measure of its liquidity. This measure
requires the lowest level of detail as only traded prices, and not trading volume or dealer-specific
information, are used in the computation.
16

5 Results
In this section, we present the results of our analysis. We first discuss, in Section 5.1, the descriptive
statistics of our liquidity proxies for the whole fixed-income structured product market in the US,
and its four market segments (ABS, CMO, MBS and TBA). We then compare our results with those
from other markets, primarily the US corporate bond market, allowing us to analyze the general
level of liquidity in the various segments, with respect to well-known benchmarks. We mainly
choose the US corporate bond market for this purpose, as its general institutional structure, i.e.,
the OTC market setup and reporting requirements to TRACE, is most directly comparable to
the fixed-income securitized product market. In Section 5.2, we provide more detailed empirical
results, by comparing liquidity for different sub-segments and product categories based on our
hypotheses presented in Section 2. First, we compare retail versus institutional trades. Second,
we compare different credit rating grades. Third, we analyze whether liquidity depends on the
issuing/guaranteeing authority, i.e., we compare the three GSEs with non-agency issues. Fourth,
we explore liquidity effects of different tranche types. In Section 5.3, we present our main analysis
of the relation between the measurement of liquidity and the level of detail used in the trading data.
Employing different sets of regressions, we explore whether liquidity measures using less detailed
information can accurately proxy for our benchmark measure using the most detailed data. We
elaborate more on this issue in Section 5.4, where we explore the effect of liquidity on the prices
of structured products. Specifically, we analyze which liquidity measures can explain differences in
yield spreads across securities.
5.1 Liquidity Effects in the Structured Product Market
First of all, we discuss the descriptive statistics of the trading activity of the structured products
at a market-wide level. Table 1 presents the average daily number of products traded, the number
of trades and the traded volume in the market as a whole. On average, per day, we observe
3,203 different traded securities, 14,479 trades and an aggregate trade volume of $227 billion. The
structured product market has a much higher daily trading volume than the US corporate debt
17

market or the US municipal bond market, each of which has an average daily trading volume
of around $15 billion (see, e.g., Vickery and Wright (2013)). However, the average daily trading
volume of the securitized market is lower than that of the US Treasury securities market, the latter
being around $500 billion (see, e.g., Bessembinder and Maxwell (2008)).
Trading in the structured market consists of three different spot market segments, i.e., ABS,
CMO and MBS, and the TBA market, which is basically a forward market. In this sense, the volume
in the TBA market cannot be directly compared with the other three (spot) markets. We find an
average daily traded volume in the TBA market of $204.1 billion. The average traded volumes in
the spot markets are $4.5 billion (ABS), $12.4 billion (CMO), and $18.2 billion (MBS).16 Roughly
speaking, the MBS segment trades slightly more, and the CMO segment somewhat less than the
entire US corporate bond market, on average, each day. The TBA segment is much larger than
each of these markets, while the ABS segment is much smaller.
The total number of structured issues that are traded during the entire sample period is 266,660,
which, again, is much larger than the total number of corporate bond issues traded during the same
period, at around 30,000 traded bonds.17 However, the daily average number of products traded
(3,203) in the structured product market is only about 50% of the number traded in the US
corporate bond market per day (see Friewald et al. (2012), for example). Approximately the same
fraction can be observed for the average daily number of trades. Thus, these comparisons indicate
that while, overall, more instruments exist in the securitized product market, they are traded less
often than corporate bonds, albeit with a higher volume per trade.
Focusing on the liquidity of the individual securities, we present summary statistics (mean,
standard deviation, and correlation) for the product characteristics, trading activity variables, and
liquidity measures for the whole structured product market as well as for the individual market
segments. Table 2 provides the means of the various variables, which are averaged, over time, and
over the cross-section of the respective sub-samples. In the ABS segment, we observe an average
amount issued of around $494 million, compared with $397 million in the MBS, and $88 million
16Note that related surveys may provide different numbers as not all reports use the classification provided byFINRA, e.g., in some cases the MBS and TBA markets are added up and simply referred to as the MBS segment.
17We calculated the number of traded bonds based on aggregate information from the US corporate bond TRACEdata set.
18

in the CMO segments, per issue. Trading activity and liquidity in the securitized market seem to
be rather dispersed across the four segments. Overall, the TBA market shows the highest trading
activity per security. On average, around four dealers are active each day per security, with eight
trades and a traded volume of $141 million per security. In the other segments, we observe a lower
number of active dealers (on average, between one and two dealers). Furthermore, the number
of trades (around two trades) and the traded volume (around $12 million) are far lower. Thus,
as already indicated, we find fewer trades, but with a higher average trade size, for securitized
products in the spot market, compared to other fixed-income markets.
As expected, the TBA market is the most liquid segment of the structured product market.
The round-trip cost is around 4 bp, compared to 45 bp in the ABS, 49 bp in the MBS, and 97 bp in
the CMO segments. Based on a two-sample t-test, these presented differences between TBA, ABS,
MBS and CMO segments are all statistically significant.18 This ranking and statistical significance
is basically preserved for all the liquidity measures that we consider. For example, for the price
dispersion measure, we find 10 bp for the TBA, 32 bp for the ABS, 45 bp for the MBS and 70
bp for the CMO segment. In comparison, Friewald et al. (2012) report for the US corporate bond
market a price dispersion of 42 bp, on average. Thus, according to this metric, the TBA and ABS
segments are more liquid than the corporate bond market, and the other two markets are less
liquid. We find a rather high Amihud measure for the structured product market (3.2% change in
price per $100,000 of traded volume). This result turns out to be caused by retail trades, where
some small trades lead to high returns, i.e., they are far above or below the average traded price.
Thus, retail trading appears to be expensive in this market, especially for products with dispersed
trading activity, which leads to high search costs (see Section 5.2).
Tables 3 and 4 present the standard deviations and correlations of the product character-
istics, trading activity variables and liquidity measures. The standard deviations indicate high
cross-sectional variations, with a particularly high standard deviation of the Amihud measure (as
emphasized above). Focusing on correlation, we find that the product characteristics show a low
18In particular, the transaction costs, based on the round-trip cost measure for the ABS market segment, aresignificantly higher compared to the TBA segment (with a t-statistic of 80.78) but significantly lower compared tothe MBS segment (t-statistic of 7.68). The round-trip cost measure for the CMO market is significantly highercompared to the MBS segment (t-statistic of 132.16).
19

level of correlation with each other as well as with the other variables. Interestingly, the trading
activity variables exhibit low levels of correlation with the liquidity measures as well (less than
0.20 in absolute terms), indicating that the sets of information provided by the different groups
of variables vary considerably from each other. However, within the groups of trading activity
variables and liquidity measures, correlation is at a rather high level (on average around 0.50).
5.2 Liquidity Effects in Different Sub-Segments of the Market
In this section, we study liquidity effects in four different sub-segments of the structured product
market based on the stated hypotheses. This analysis can shed light on the observed differences
presented in the previous section. We first compare liquidity effects between retail and institutional
trades. We define trades with an average daily trading volume of less than $100,000 as retail trades,
in accordance with the definition used by FINRA. Table 5 presents the liquidity proxies for the
ABS, CMO, and MBS market segments. In the TBA market segment, we observe (as expected)
an extremely low number of retail trades, as forward markets are primarily used by institutional
investors. Therefore, we do not report statistics for that particular market segment.
Around 12% (not reported in the table) of all observations are retail trades in the ABS market
segment, while the fractions of retail trades in the CMO and MBS markets are much larger at
approximately 60% and 31%, respectively. Retail traders in the CMO market segment apparently
focus on instruments with a much lower amount outstanding, approximately $36 million, than in the
institutional sub-segment, where the figure is $130 million. Our analysis of the liquidity measures
reveals that retail investors in the ABS market segment are confronted with a significantly lower
liquidity. Essentially, all our liquidity measures indicate that trading costs are about four times
higher for retail investors than their institutional counterparts. For example, the price dispersion
measure in the retail sub-segment amounts to 121 bp, whereas it is only about 27 bp in the
institutional sub-segment. For the CMO market segment, we find similar results, albeit with a
smaller difference in transaction costs: retail trades encounter around 50% higher trading costs
than institutional trades. The MBS market segment results fall in between the other two, retail
investors having to face approximately twice the transaction costs of institutional investors. All
20

these differences in liquidity are statistically significant based on a two sample t-test (see Table
5). Overall, we can confirm the hypothesis that the liquidity of retail trades is far lower than that
of institutional trades. As in the case of the introduction of TRACE for the US corporate bond
market (see, e.g., Edwards et al. (2007)), we would expect these transaction costs to decrease in
the securitized product market following the proposed timely dissemination of transaction data.
In the second item of analysis, we explore the liquidity effects for different rating grades, i.e.,
AAA, AA, . . ., CCC/C (see Table 6). We present results for the ABS market segment, where around
60% of all securities are rated. In the MBS and TBA segments, ratings play a minor role as securities
by GSEs are, in general, not rated. The same is true for the CMO market, where less than 30%
of the securities have credit ratings. We document that securities with better credit ratings have
larger outstanding amounts: around $575 million for investment grade compared to less than $200
million for speculative grade securities. As expected, we observe lower coupons for better rated
securities. Interestingly, we find a somewhat higher trading volume for high-risk securities ($16
million for CCC/C compared to $12 million for AAA), whereas the number of dealers and trades
are comparable in all rating classes. Analyzing the liquidity measures, we confirm the hypothesis
that better-rated securities are more liquid, i.e., have lower transaction costs. For example, the
round-trip costs are 22 bp for AAA rated securities, and increase to 117 bp for CCC/C-rated issues.
(Again, all these differences between the individual rating classes are statistically significant.) In
particular, the differences in terms of liquidity between investment and speculative grade securities
are pronounced and statistically significant for basically all these measures.
In the third piece of analysis, we compare securities guaranteed by the three federal GSEs, i.e.,
Freddie Mac (FH), Fannie Mae (FN) and Ginnie Mae (GN), with non-agency securities (Others).
We make this comparison for the CMO market segment only, where sufficient observations are
available for all groups. Table 7 provides the liquidity proxies for the securities issued by the
different agencies and their non-agency counterparts. We find that the non-agency trades have
larger outstanding amounts (around $126 million) than the agency trades (FN: $82, FH: $86 and
GN: $43 million), whereas the number of dealers and trades are of comparable size. In terms
of their liquidity measures, we find that securities guaranteed by agencies have lower transaction
21

costs than non-agency securities as we hypothesized. For example, the imputed round-trip cost is
about 81 bp for GN, and around 60 bp for FN and FH, whereas it is 87 bp for the non-agency
securities. (Again, all these differences are statistically significant.) Comparing the GSEs, we find
that securities guaranteed by Ginnie Mae are somewhat less liquid than the securities of the other
agencies, potentially because of their smaller issue sizes and trading volumes.
In our fourth element of analysis, we explore the liquidity effects of different types of tranches
in the ABS and CMO market segments (tranches are not relevant for the MBS and TBA markets,
where products typically have “pass-through” structures). In these segments, it is common to offer
multiple securities, with a hierarchy of credit risk levels, but based on one pool of underlying loans.
Payments are first distributed to the holders of low-risk securities, and then to higher-risk securities,
in order of priority. The tranche sizes can differ substantially from structure to structure, and the
rules for distributing the payments to the different tranches are often complicated. Table 8 shows
the values of various liquidity proxies for the different seniorities of tranches.
In the ABS market segment, we find that trading volume is higher for the SR tranches. We do
not observe any trading activity in the SSSR tranches, and nearly no activity in the SSR tranches,
indicating that these tranches are not commonly traded. Hence, we do not report the statistics
for the liquidity proxies for the SSSR and SSR tranches. The average amount outstanding of $578
million for the SR tranches is much larger than for the MEZ ($51 million) and SUB tranches ($112
million). Accordingly, we find that the trading volume is larger for the SR tranches. Our analysis
reveals an interesting pattern when we examine the liquidity measures: The most liquid tranches
are also the most senior. However, the least liquid tranches are the mezzanine tranches, presumably
because these have much lower amounts outstanding, and also exhibit less trading activity. For
example, the imputed round-trip costs are 28 bp, 65 bp and 42 bp for the SR, MEZ and SUB
tranches, respectively. For the CMO segment, we find trading activity in all tranche types (SSSR
to SUB), but trading volume is the highest for the more senior tranches, and the lowest for the
subordinated tranches. The largest tranches are the SSR tranches (with an average size of $226
million), and the smallest the SUB tranches (with an average size of $29 million). The level of
liquidity is somewhat lower in the CMO segment than in the ABS market segment, again with a
22
non-monotonic variation in liquidity across seniorities. Thus, in general, we cannot confirm that
tranches with higher seniority are necessarily more liquid.19
5.3 Liquidity and the Dissemination of Information
In this section, we discuss the relation between liquidity and the granularity of the dissemination
of information. Overall, this analysis allows us to examine whether the dissemination of transac-
tion data provides valuable information to market participants, beyond that provided by liquidity
measures based on more aggregate information. Furthermore, this analysis provides insights into
the informational value of liquidity measures at different levels of granularity.
We can assign the available liquidity proxies to three groups depending on the level of detail of
the information required to compute them. The first group comprises of product characteristics,
such as coupon and maturity, which use the most basic information that is available for almost every
fixed-income instrument. The second group consists of trading activity variables for the individual
products, such as the number of trades or volumes, with the available information aggregated on a
daily basis. The third and most important group is composed of liquidity measures at the product
level that require detailed trading information. Within this group, the liquidity measure using the
most detailed information, i.e., the round-trip cost, serves as our benchmark measure. Comparing
the product characteristics and trading activity variables to these liquidity measures allows us
to determine whether information about individual trades adds to the market’s understanding of
liquidity.
The descriptive statistics and correlations presented in Section 5.1 provide initial indications
of the informational value of the various liquidity measures. When analyzing the liquidity of the
different markets and their sub-segments, the liquidity measures offer additional insights compared
to the product characteristics and trading activity variables. For example, when comparing the
different market segments, higher trading activity is not always associated with lower transaction
19Note that, in this analysis, we compare tranches with different seniorities across products, i.e., across underlyingpools. Thus, for example, a senior tranche based on a pool with a large number of existing defaults could be consideredmore junior by the market, compared to a mezzanine or even a junior tranche of another product, where few defaultshave occurred. As we have no information regarding the contents of the underlying pool, we cannot consider thesegranular effects in our analysis. This could be a possible reason for finding mixed evidence concerning the liquidityof tranches with different seniorities.
23
costs. The correlation analysis hints in the same direction: There is low correlation between the
product characteristics and the liquidity measures (the highest correlation coefficient is 0.26 in
absolute terms) and between trading activity variables and liquidity measures (less than 0.20 in
absolute terms). Thus, it seems that liquidity measures that rely on more detailed transaction data
can provide important additional information, based on this perspective.
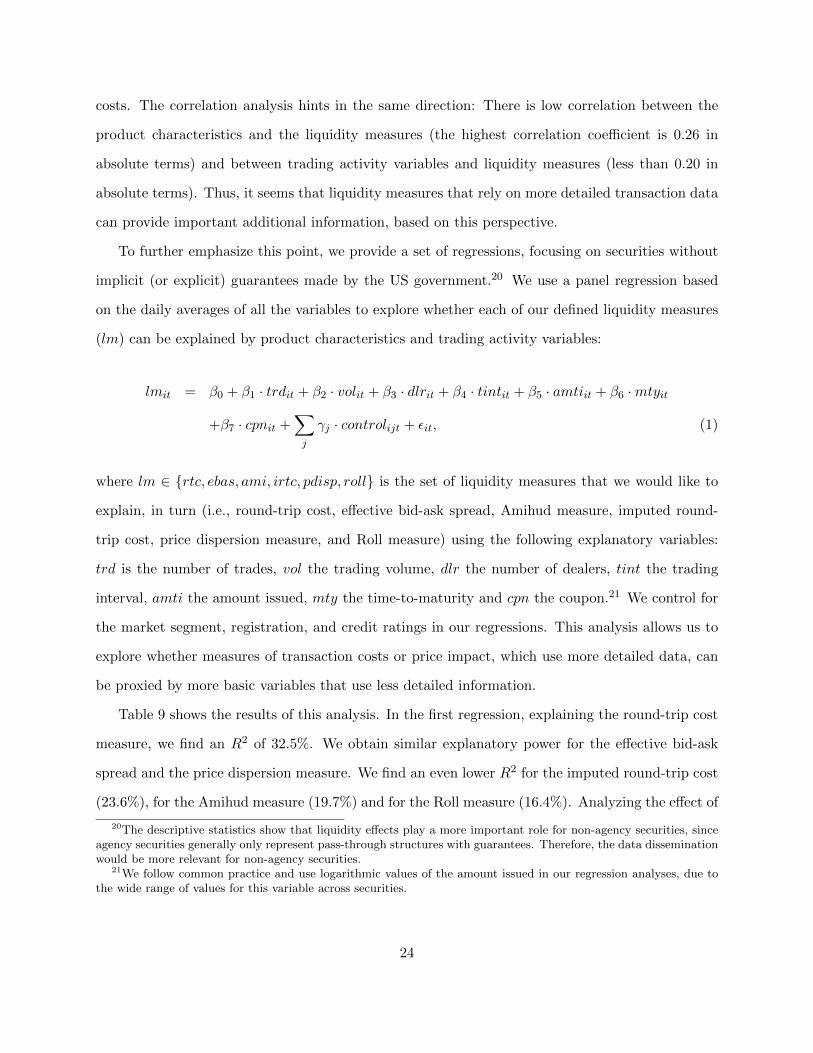
To further emphasize this point, we provide a set of regressions, focusing on securities without
implicit (or explicit) guarantees made by the US government.20 We use a panel regression based
on the daily averages of all the variables to explore whether each of our defined liquidity measures
(lm) can be explained by product characteristics and trading activity variables:
lmit = β0 + β1 · trdit + β2 · volit + β3 · dlrit + β4 · tintit + β5 · amtiit + β6 ·mtyit
+β7 · cpnit +∑j
γj · controlijt + εit, (1)
where lm ∈ {rtc, ebas, ami, irtc, pdisp, roll} is the set of liquidity measures that we would like to
explain, in turn (i.e., round-trip cost, effective bid-ask spread, Amihud measure, imputed round-
trip cost, price dispersion measure, and Roll measure) using the following explanatory variables:
trd is the number of trades, vol the trading volume, dlr the number of dealers, tint the trading
interval, amti the amount issued, mty the time-to-maturity and cpn the coupon.21 We control for
the market segment, registration, and credit ratings in our regressions. This analysis allows us to
explore whether measures of transaction costs or price impact, which use more detailed data, can
be proxied by more basic variables that use less detailed information.
Table 9 shows the results of this analysis. In the first regression, explaining the round-trip cost
measure, we find an R2 of 32.5%. We obtain similar explanatory power for the effective bid-ask
spread and the price dispersion measure. We find an even lower R2 for the imputed round-trip cost
(23.6%), for the Amihud measure (19.7%) and for the Roll measure (16.4%). Analyzing the effect of
20The descriptive statistics show that liquidity effects play a more important role for non-agency securities, sinceagency securities generally only represent pass-through structures with guarantees. Therefore, the data disseminationwould be more relevant for non-agency securities.
21We follow common practice and use logarithmic values of the amount issued in our regression analyses, due tothe wide range of values for this variable across securities.
24

the explanatory variables, we observe for the trading activity variables that products with a higher
trading volume are significantly more liquid, i.e., have lower transaction costs. In addition, a higher
number of dealers is often associated with lower transaction costs. For the product characteristics,
we find that larger issues are more liquid, and higher coupons indicate lower liquidity, as expected.
We find no significant relation between the maturity of the products and liquidity. Overall, however,
the liquidity measures contain significant idiosyncratic information that is not included in the other
variables.
Given these results, it seems evident that the liquidity measures provide additional insights
beyond those contained in the basic data on product characteristics and trading activity. Less
obvious is the question of whether liquidity measures using more detailed data provide more insights
into the liquidity effects than do those using less information. Analyzing the descriptive statistics,
we find that the different liquidity measures lead to the same results when comparing different
market segments and sub-segments at an aggregate level. Again, the correlation analysis hints in
the same direction, as the correlations between these measures are quite high (on average around
0.50, with a maximum of 0.81).
To further analyze these relationships, we present a second set of panel regressions where we
regress our benchmark measure, i.e., the round-trip cost, on product characteristics, trading activity
variables and all the other remaining liquidity measures, in a nested fashion. Thus, we explore
whether the liquidity measures based on less information can be a good proxy for the round-trip
costs. The regression equation is
rtcit = β0 + β1 · ebasit + β2 · amiit + β3 · irtcit + β4 · pdispit + β5 · rollit + β6 · trdit
+β7 · volit + β8 · dlrit + β9 · amtiit + β10 ·mtyit + β11 · cpnit +∑j
γj · controlijt + εit,(2)
where rtc is the round-trip cost, ebas the effective bid-ask spread, ami the Amihud measure, irtc
the imputed round-trip cost, pdisp the price dispersion measure, roll the Roll measure, trd the
number of trades, vol the traded volume, dlr the number of dealers, amti the amount issued, mty
the time-to-maturity and cpn the coupon. We use different specifications of the above equation,
25

i.e., the full model and other nested specifications, with only one liquidity measure being used as
the explanatory variable in each one.
Table 10 shows the results for this analysis, presenting the six specifications. In regressions
(1) to (5), we use each of the liquidity measures in turn, plus all trading activity variables and
product characteristics, to explain the round-trip costs. When we add just one individual proxy to
the regression analysis, we find that the imputed round-trip cost, the effective bid-ask spread and
the price dispersion measure are the best proxies, with R2 values of around 50% to 60%, whereas
the Amihud and Roll measures slightly increase the R2 to around 40% compared to regressions
without liquidity measures. When adding all the liquidity measures to the regression equation, in
regression (6), we obtain an R2 of 67%, i.e., the explanatory power increases considerably when we
include all these proxies. We consider this level of explanatory power quite high, given the rather
diverse instruments with potentially different liquidity characteristics and the low number of trades
per security and day, in general. We get similar results (not reported here) when explaining the
effective bid-ask spread with liquidity measures using less information. Thus, we find evidence that
liquidity measures using more detailed data can be proxied reasonably well by similar measures
using less data. We further discuss this issue in the next section and analyze the importance of the
disclosure in the context of pricing.
5.4 Liquidity Effects and Yield Spreads
In this section, we explore the relation between liquidity and the yield spreads in the structured
product market, focusing again on securities without implicit (or explicit) guarantees made by the
US government. We analyze whether the liquidity measures can explain a reasonable proportion
of the variation in the yield spreads, and further discuss the issue of the level of detail required in
the data to estimate these liquidity measures in the context of this explanatory power.
For this analysis, we compute for each individual transaction, the related yield of the structured
product, based on the trade price and expected coupon payments. Furthermore, we determine the
yield of a synthetic risk-free bond based on the swap rate curve at the same time.22 The dependent
22Feldhutter and Lando (2008) show that riskless rates based on swap rates are the best proxies to use as bench-marks.
26

variable in our analysis is the yield spread between the individual structured product’s yield and
the benchmark yield for the same duration. We use a panel regression on the daily averages of all
variables to explain the observed yield spreads, given the product characteristics, trading activity
variables and liquidity measures. In doing so, we use the following regression:
yldsprit = β0 + β1 · rtcit + β2 · ebasit + β3 · amiit + β4 · irtcit + β5 · pdispit + β6 · rollit
+β7 · trdit + β8 · volit + β9 · dlrit + β10 · tintit + β11 · amtiit + β12 ·mtyit
+β13 · cpnit +∑j
γj · controlijt + εit, (3)
where yldspr is the yield spread, rtc the round-trip cost, ebas the effective bid-ask spread, ami the
Amihud measure, irtc the imputed round-trip cost, pdisp the price dispersion measure, roll the
Roll measure, trd the number of trades, vol the traded volume, dlr the number of dealers, tint the
trading interval, amti the amount issued, mty the time-to-maturity, and cpn the coupon.
Table 11 presents the results of the above regressions for different specifications. Regression
(1) in the table includes only the control variables and has an adjusted R2 of 37.3%, i.e., the
control variables provide reasonable explanatory power. Regressions (2) to (7) focus on the liquidity
measures, including each of the six liquidity measures individually. Regression (8) includes all these
measures taken together. Starting with Regression (2), i.e., including the round-trip cost measure,
we find that the adjusted R2 increases to 40.1%, indicating that liquidity is an important factor in
the pricing of structured products. A one-standard-deviation increase in this benchmark measure
increases the yield spread by 46 bp (the standard deviation of the spread is 2.29%). As expected,
the round-trip cost measure, which uses the most detailed information, provides the highest R2. It
is noteworthy that when we use either the imputed round-trip cost or the price dispersion measure
as an explanatory variable, we obtain similar explanatory power (around 39%). When used as
independent variables, individually, all of the other measures provide explanatory power of slightly
above 38%. In Regression (8), where we include all the liquidity measures, the R2 increases to
40.7%. Since all the liquidity measures quantify similar aspects of liquidity, at least to some extent,
not all of them turn out to be statistically significant in this specification, due to the potential multi-
27

collinearity. We find similar explanatory power when we eliminate the round-trip cost measure from
the regression equation. Thus, trade-specific reporting of prices and volumes seems to be sufficient
for pricing purposes. Analyzing the incremental explanatory power of the liquidity measures alone,
we find that these variables cover around 10% of the explained variation in the yield spread. A
similar result is reported in Friewald et al. (2012) for the US corporate bond market. This result
strengthens the findings of the previous section.
Regressions (9) and (10) present the results using trading activity variables and product char-
acteristics, respectively, as the explanatory variables. Regression (11) is the full model, including
all the explanatory variables. In this model, the results for the liquidity measures are confirmed.
Analyzing the effect of the trading activity variables in the full model, we find economically sig-
nificant results only for the trading interval: An increase in the trading interval by one standard
deviation is associated with an increase in the yield spread of 15 bp. The information contained
in the other trading activity variables, e.g., traded volume, seems to be adequately represented by
the liquidity measures. However, more important are the results for the product characteristics.
The most relevant variable in the full model turns out to be the coupon. A one-standard-deviation
higher coupon results in an increase of 137 bp in the yield spread. Thus, the coupon rate has the
highest explanatory power of all the variables, indicating that a higher coupon is also associated
with higher credit risk for certain products, in particular when there is no credit rating available.
The amount issued shows important effects as well, where a one-standard-deviation increase leads
to an 19 bp decrease in the yield spread: Larger issues have lower yield spreads. The maturity of a
structured product is related to the yield spread as well, indicating that longer maturities are as-
sociated with somewhat lower spreads. However, compared with the other product characteristics,
the maturity is of minor importance. Overall, the full model has an R2 of 69.9% with significant
incremental explanatory power shown by the liquidity measures. Thus, liquidity is an important
driver of yield spreads in the structured product market; therefore, the dissemination of trading
activity information is important, given the size and complexity of this market.
Overall, we find that dealer-specific information and buy or sell-side flags are not absolutely
essential, in terms of incremental informativeness, in computing reliable liquidity metrics in the
28

context of OTC markets. Instead, reasonable estimates of the liquidity measures can be calculated
based on prices and volumes of individual trades. Thus, data dissemination comparable to that of
TRACE for US corporate bonds, where the focus is on the dissemination of the trading activity,
seems appropriate in this context, with little loss of informativeness.
6 Conclusion
The US market for structured financial products played an important role during the global financial
crisis. The opacity of its OTC trading architecture has been widely criticized, especially as this
market represents the second largest fixed-income market in the US, after the Treasury bond
market. To address this concern, FINRA recently introduced a transparency project to close the
information gap. Starting on May 16, 2011, virtually all trades in the structured product market
are required to be reported to the TRACE database, which we use in this study, including reported
transactions up to October 31, 2012. However, this information has not yet been released to the
general market.
We analyze the liquidity effects in the structured product market and in the four main mar-
ket segments (ABS, CMO, MBS, and TBA), which cover rather different products and compare
these results to the liquidity in other fixed-income markets. We employ a wide range of liquidity
proxies proposed in the academic literature, which were not used previously, mainly due to the
non-availability of transaction data. Our main contribution is the analysis of the relation between
the accuracy in measuring liquidity and the potential degree of disclosure. In particular, we ex-
plore whether liquidity measures based on less detailed information may still be reasonable proxies
of liquidity. This analysis fosters our understanding of the information content of disseminated
transaction data and is an important issue in improving market transparency.
In our empirical analysis, we find a high trading volume in the fixed-income structured product
market, with a daily average of around $227 billion and an average transaction cost of 66 bp for
a round-trip trade. The liquidity of the ABS and MBS markets is comparable to that of the US
corporate bond market. In contrast, the TBA segment is far more liquid, whereas the CMO market
is considerably less liquid. In all four segments, we find more dispersed trading activity than in
29
other fixed-income markets, i.e., fewer trades per security but with higher volumes. Furthermore,
in line with our hypotheses, we find that securities that are institutionally traded, guaranteed by a
federal authority, and those that have low credit risk, tend to be more liquid.
Exploring the relation between the various liquidity proxies and the depth of disseminated in-
formation, we find that product characteristics or variables based on aggregated trading activity,
by themselves, are not sufficient proxies for market liquidity. The dissemination of the price and
volume of each individual trade is important for the quantification of liquidity effects, particularly
for explaining yield spreads. However, we also provide evidence that liquidity measures that use
additional dealer-specific information (i.e., trader identity and sell/buy-side categorization) can be
efficiently proxied by measures using less information. In our regression analysis, we find that liq-
uidity effects cover around 10% of the explained variation in yield spreads. Thus, the dissemination
of trading activity is essential, given the trade volume and complexity of this market. These results
are important for all market participants in the context of OTC markets, as it allows establishing
an understanding of the information content contained in the disclosure of trading data.
30

A Appendix: Definitions and Computation of Liquidity Measures
This appendix contains the exact definitions of the liquidity measures that we apply in our empirical
analysis. We compute the liquidity measures for each financial instrument individually, using the
following notation. We denote the trade price and volume of a transaction observed at time ti,j
on trading day i for trade j by p(ti,j) and v(ti,j). We use n(ti) to refer to the observed number of
trades of a financial instrument on trading day ti.
Round-Trip Cost uses the most detailed information. Each transaction needs to be assigned to
a particular dealer d. The round-trip cost is then defined as the price difference for the same dealer
between buying (selling) a certain amount of a security and selling (buying) the same amount of
this security. More precisely, for a given trading day ti, we define a round-trip trade q of dealer d
as a sequence of consecutive buy transactions with trade prices pbd,q(ti,j), followed by a sequence
of sell transactions with prices psd,q(ti,j) (or vice versa) conducted by the same dealer d such that∑j v
bd,q(ti,j) =
∑j v
sd,q(ti,j), where vbd,q(ti,j) and vsd,q(ti,j) denote the trade volumes belonging to the
round-trip trade q of dealer d. Thus, the round-trip trade may either consist of a single trade on
each side or a sequence of trades, on trading day ti. We denote by pvsd,q(ti) =∑
j psd,q(ti,j)v
sd,q(ti,j)
and pvbd,q(ti) =∑
j pbd,q(ti,j)v
bd,q(ti,j) the dollar amount sold and bought, respectively, in a round-trip
q of dealer d on trading day ti. The round-trip cost is then given by
rtc(ti) =1
m(ti)
∑d,q
pvsd,q(ti)− pvbd,q(ti)1/2 · (pvsd,q(ti) + pvbd,q(ti))
, (4)
where m(ti) denotes the number of round-trip trades on trading day ti for a particular financial
instrument.
Effective Bid-Ask Spread is the difference between the daily average sell- and buy-prices rela-
tive to the average mid-price. Thus, transactions need to be flagged as buy or sell trades. Formally
it is defined as
31

ebas(ti) =ps(ti)− pb(ti)
1/2 ·(ps(ti) + pb(ti)
) , (5)
where ps(ti) = 1/ns(ti)∑ns(ti)
j=1 ps(ti,j) and pb(ti) = 1/nb(ti)∑nb(ti)
j=1 pb(ti,j) refer to the average sell
and buy prices on trading day ti.
Amihud Measure quantifies the average price impact of trades on a particular trading day ti.
It is defined as the ratio of the absolute price change given as a return r(ti,j) =p(ti,j)
p(ti,j−1)− 1 to the
trade volume v(ti,j), measured in US dollars:
ami(ti) =1
n(ti)
n(ti)∑j=1
|r(ti,j)|v(ti,j)
. (6)
Imputed Round-Trip Cost is an alternative way of measuring bid-ask spreads. The idea here
is to identify round-trip trades that are assumed to consist of two or three trades on a given day,
with exactly the same traded volume. This is likely to represent the sale and purchase of an asset
via one or more dealers to smaller traders. Formally, for a given trading day ti, we define an
imputed round-trip trade w as a sequence of two or three transactions with trade prices pw(ti,j)
and identical volumes vw(ti,j). The imputed round-trip cost is then defined as
irc(ti) =1
b(ti)
∑w
(1− minj pw(ti,j)
maxj pw(ti,j)
), (7)
where b(ti) refers to the total number of imputed round-trip trades on trading day ti for a financial
instrument.
Price Dispersion Measure is defined as the root mean squared difference between the traded
prices and the respective market valuation weighted by volume. Thus, for each day ti, it is defined
as
pdisp(ti) =
√√√√√ 1∑n(ti)j=1 v(ti,j)
n(ti)∑j=1
(p(ti,j)− u(ti))2 · v(ti,j), (8)
32

where u(ti) refers to the market valuation for trading day ti, which we assume to be the average
traded price on that day. We require at least four observations on a given day to calculate the price
dispersion measure, i.e. n(ti) ≥ 4.
Roll Measure is a proxy for the round-trip transaction costs and is defined as
roll(ti) = 2 ·√−Cov(∆p(tk),∆p(tk−1)), (9)
where ∆p(tk) is defined as the change in the consecutive prices p(tk,j) and p(tk,j−1) on trading day
tk with tk ≤ ti. We compute the Roll measure based on the available price changes within a time
frame of 60 days (i.e., ∀tk with i − k ≤ 60). Since we interpret the Roll measure as a transaction
cost metric, we bound the measure at zero whenever the covariance turns out to be positive.
33
References
Acharya, V. V., Amihud, Y., Bharath, S. T., 2013, “Liquidity Risk of Corporate Bond Returns:
Conditional Approach,” Journal of Financial Economics, 110, 358–386.
Amihud, Y., 2002, “Illiquidity and Stock Returns: Cross-Section and Time-Series Effects,” Journal
of Financial Markets, 5, 31–56.
Atanasov, V., Merrick, Jr., J. J., 2013, “The Effects of Market Frictions on Asset Prices: Evidence
from Agency MBS,” Working Paper, Mason School of Business.
Bao, J., Pan, J., Wang, J., 2011, “The Illiquidity of Corporate Bonds,” Journal of Finance, 66,
911–946.
Bessembinder, H., Maxwell, W., 2008, “Transparency and the Corporate Bond Market,” The Jour-
nal of Economic Perspectives, 22, 217–234.
Bessembinder, H., Maxwell, W. F., Venkataraman, K., 2006, “Market Transparency, Liquidity
Externalities, and Institutional Trading Costs in Corporate Bonds,” Journal of Financial Eco-
nomics, 82, 251–288.
Bessembinder, H., Maxwell, W. F., Venkataraman, K., 2013, “Trading Activity and Transaction
Costs in Structured Credit Products,” Financial Analysts Journal, 69, 55–67.
Collin-Dufresne, P., Goldstein, R. S., Martin, J. S., 2001, “The Determinants of Credit Spread
Changes,” Journal of Finance, 56, 2177–2207.
De Jong, F., Driessen, J., 2012, “Liquidity Risk Premia in Corporate Bond Markets,” Quarterly
Journal of Finance, 2.
Dick-Nielsen, J., 2009, “Liquidity Biases in TRACE,” Journal of Fixed Income, 19, 43–55.
Dick-Nielsen, J., Feldhutter, P., Lando, D., 2012, “Corporate Bond Liquidity Before and After the
Onset of the Subprime Crisis,” Journal of Financial Economics, 103, 471–492.
Duffie, D., Garleanu, N., Pedersen, L. H., 2007, “Valuation in Over-the-Counter Markets,” Review
of Financial Studies, 20, 1865–1900.
Edwards, A., Harris, L., Piwowar, M., 2007, “Corporate Bond Market Transaction Costs and
Transparency,” Journal of Finance, 62, 1421–1451.
Elton, E. J., Gruber, M., Agrawal, D., Mann, C., 2001, “Explaining the Rate Spread on Corporate
Bonds,” Journal of Finance, 56, 247–277.
34

Eom, Y., Helwege, H. J., Huang, J. Z., 2004, “Structural Models of Corporate Bond Pricing: An
Empirical Analysis,” Review of Financial Studies, 17, 499–544.
Feldhutter, P., 2012, “The Same Bond at Different Prices: Identifying Search Frictions and Selling
Pressures,” Review of Financial Studies, 25, 1155–1206.
Feldhutter, P., Lando, D., 2008, “Decomposing Swap Spreads,” Journal of Financial Economics,
88, 375–405.
Friewald, N., Jankowitsch, R., Subrahmanyam, M., 2012, “Illiquidity or Credit Deterioration: A
Study of Liquidity in the US Corporate Bond Market During Financial Crises,” Journal of
Financial Economics, 105, 18–36.
Goldstein, M. A., Hotchkiss, E. S., 2007, “Dealer Behavior and the Trading of Newly Issued Cor-
porate Bonds,” Working Paper, Babson College.
Goldstein, M. A., Hotchkiss, E. S., Sirri, E. R., 2007, “Transparency and Liquidity: A Controlled
Experiment on Corporate Bonds,” Review of Financial Studies, 20, 235–273.
Goyenko, R. Y., Holden, C. W., Trzcinka, C. A., 2009, “Do Liquidity Measure Measure Liquidity?,”
Journal of Financial Economics, 92, 153–181.
Green, R., Hollifield, B., Schurhoff, N., 2007a, “Dealer Intermediation and Price Behavior in the
Aftermarket for New Bond Issues,” Journal of Financial Economics, 86, 643–682.
Green, R., Hollifield, B., Schurhoff, N., 2007b, “Financial Intermediation and the Costs of Trading
in an Opaque Market,” Review of Financial Studies, 20, 274–314.
Green, R. C., 2007, “Presidential Address: Issuers, Underwriter Syndicates, and Aftermarket Trans-
parency,” Journal of Finance, 62, 1529–1550.
Harris, L., Piwowar, M., 2006, “Secondary Trading Costs in the Municipal Bond Market,” Journal
of Finance, 61, 1361–1397.
Hennessy, C. A., 2013, “A Theory of ABS Design Based on Rational Noise-Traders,” Working
Paper, London Business School.
Hollifield, B., Neklyudov, A., Spatt, C., 2012, “Bid-Ask Spreads and the Pricing of Securitizations:
144a vs. Registered Securitizations,” Working Paper, Carnegie Mellon University.
Hong, G., Warga, A., 2000, “An Empirical Study of Bond Market Transactions,” Financial Analysts
Journal, 56, 32–46.
Houweling, P., Mentink, A., Vorst, T., 2005, “Comparing Possible Proxies of Corporate Bond
Liquidity,” Journal of Banking and Finance, 29, 1331–1358.
35

Jankowitsch, R., Nashikkar, A., Subrahmanyam, M., 2011, “Price Dispersion in OTC Markets: A
New Measure of Liquidity,” Journal of Banking and Finance, 35, 343–357.
Kyle, A. S., 1985, “Continuous Auctions and Insider Trading,” Econometrica, 53, 1315–1335.
Lin, H., Wang, J., Wu, C., 2011, “Liquidity Risk and Expected Corporate Bond Returns,” Journal
of Financial Economics, 99, 628–650.
Longstaff, F., Mithal, S., Neis, E., 2005, “Corporate Yield Spreads: Default Risk or Liquidity?
New Evidence from the Credit Default Swap Market,” Journal of Finance, 60, 2213–2253.
Mahanti, S., Nashikkar, A., Subrahmanyam, M., Chacko, G., Mallik, G., 2008, “Latent Liquidity:
A New Measure of Liquidity, With an Application to Corporate Bonds,” Journal of Financial
Economics, 88, 272–298.
Nashikkar, A., Subrahmanyam, M., Mahanti, S., 2011, “Limited Arbitrage and Liquidity in the
Market for Credit Risk,” Journal of Financial and Quantitative Analysis, 46, 627–656.
Perraudin, W., Taylor, A., 2003, “Liquidity and Bond Market Spreads,” Working Paper, Bank of
England.
Roll, R., 1984, “A Simple Implicit Measure of the Effective Bid-Ask Spread in an Efficient Market,”
Journal of Finance, 39, 1127–1139.
Ronen, T., Zhou, X., 2009, “Where did all the Information Go? Trade in the Corporate Bond
Market,” Working Paper, Rutgers University.
Schultz, P. H., 2012, “The Market for New Issues of Municipal Bonds: The Roles of Transparency
and Limited Access to Retail Investors,” Journal of Financial Economics, 106, 492–512.
Vickery, J., Wright, J., 2013, “TBA Trading and Liquidity in the Agency MBS Market,” Economic
Policy Review (forthcoming).
36

Tables
Total ABS CMO MBS TBA
Traded Products 3203 328 1126 1787 145
Trades 14479 626 3048 3447 8175
Traded Volume [mln USD] 226567 4541 12395 18163 204056
Table 1: This table presents aggregate data on the average daily number of traded products, the numberof trades and traded volume for the whole structured product market, as well as for the market segmentsof Asset-Backed Securities (ABS), Collateralized Mortgage Obligations (CMO), Mortgage-Backed Securities(MBS), and To-Be-Announced securities (TBA) during the time period from May 16, 2011 to October 31,2012, based on data from the Trade Reporting and Compliance Engine (TRACE), provided by the FinancialIndustry Regulatory Authority (FINRA).
37
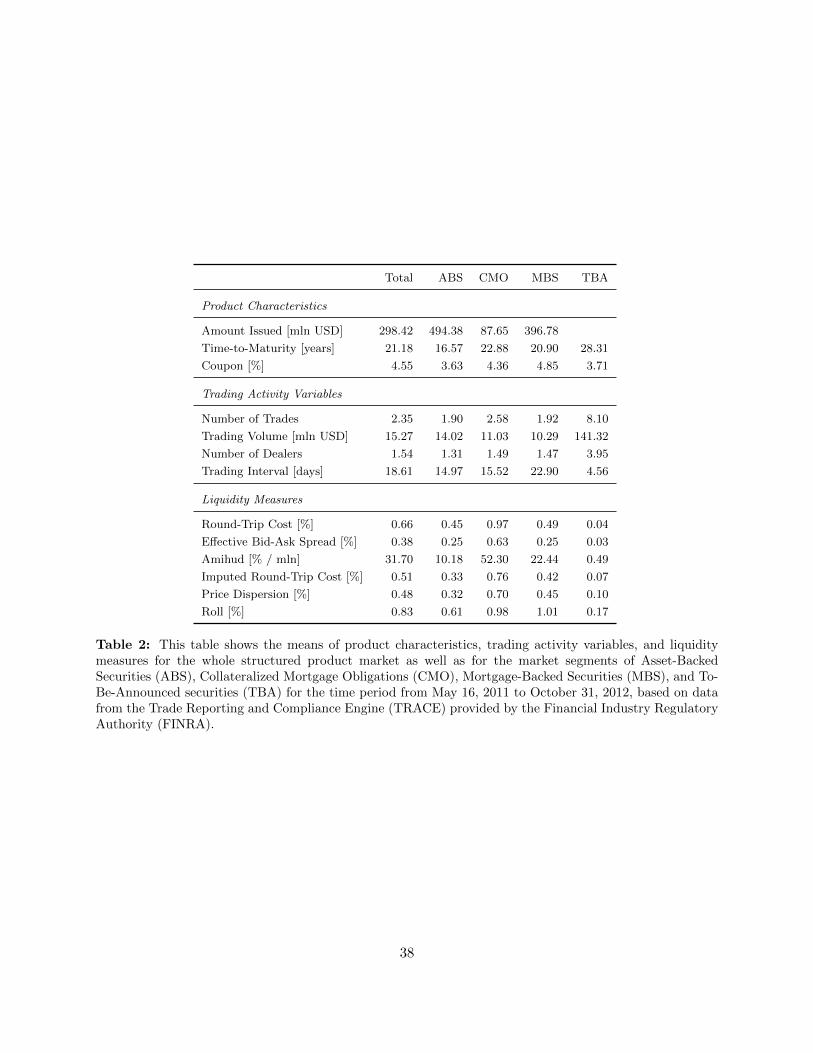
Total ABS CMO MBS TBA
Product Characteristics
Amount Issued [mln USD] 298.42 494.38 87.65 396.78
Time-to-Maturity [years] 21.18 16.57 22.88 20.90 28.31
Coupon [%] 4.55 3.63 4.36 4.85 3.71
Trading Activity Variables
Number of Trades 2.35 1.90 2.58 1.92 8.10
Trading Volume [mln USD] 15.27 14.02 11.03 10.29 141.32
Number of Dealers 1.54 1.31 1.49 1.47 3.95
Trading Interval [days] 18.61 14.97 15.52 22.90 4.56
Liquidity Measures
Round-Trip Cost [%] 0.66 0.45 0.97 0.49 0.04
Effective Bid-Ask Spread [%] 0.38 0.25 0.63 0.25 0.03
Amihud [% / mln] 31.70 10.18 52.30 22.44 0.49
Imputed Round-Trip Cost [%] 0.51 0.33 0.76 0.42 0.07
Price Dispersion [%] 0.48 0.32 0.70 0.45 0.10
Roll [%] 0.83 0.61 0.98 1.01 0.17
Table 2: This table shows the means of product characteristics, trading activity variables, and liquiditymeasures for the whole structured product market as well as for the market segments of Asset-BackedSecurities (ABS), Collateralized Mortgage Obligations (CMO), Mortgage-Backed Securities (MBS), and To-Be-Announced securities (TBA) for the time period from May 16, 2011 to October 31, 2012, based on datafrom the Trade Reporting and Compliance Engine (TRACE) provided by the Financial Industry RegulatoryAuthority (FINRA).
38

Total ABS CMO MBS TBA
Product Characteristics
Amount Issued [mln USD] 812.32 561.01 225.02 1026.33
Time-to-Maturity [years] 8.07 12.15 6.13 7.94 3.00
Coupon [%] 1.69 2.19 1.88 1.35 1.19
Trading Activity Variables
Number of Trades 3.28 2.02 3.12 1.84 10.96
Trading Volume [mln USD] 64.48 51.21 40.11 42.03 236.65
Number of Dealers 1.17 0.74 0.81 0.85 3.85
Trading Interval [days] 39.87 32.04 34.98 44.76 26.65
Liquidity Measures
Round-Trip Cost [%] 0.90 0.81 1.05 0.69 0.15
Effective Bid-Ask Spread [%] 0.70 0.59 0.84 0.57 0.21
Amihud [% / mln] 101.75 60.97 126.32 86.97 6.87
Imputed Round-Trip Cost [%] 0.69 0.53 0.79 0.60 0.16
Price Dispersion [%] 0.64 0.51 0.69 0.65 0.17
Roll [%] 1.16 1.00 1.15 1.34 0.29
Table 3: This table shows the standard deviations of product characteristics, trading activity variables,and liquidity measures for the whole structured product market as well as for the market segments of Asset-Backed Securities (ABS), Collateralized Mortgage Obligations (CMO), Mortgage-Backed Securities (MBS),and To-Be-Announced securities (TBA) for the time period from May 16, 2011 to October 31, 2012, basedon data from the Trade Reporting and Compliance Engine (TRACE) provided by the Financial IndustryRegulatory Authority (FINRA).
39
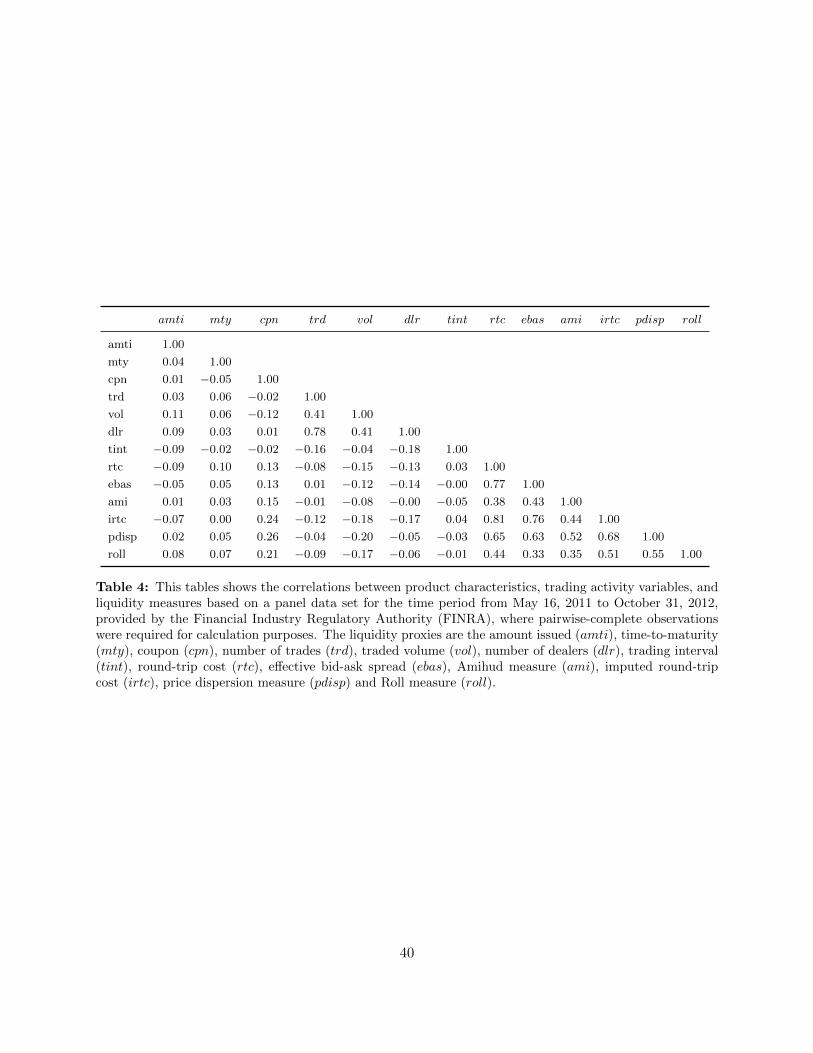
amti mty cpn trd vol dlr tint rtc ebas ami irtc pdisp roll
amti 1.00
mty 0.04 1.00
cpn 0.01 −0.05 1.00
trd 0.03 0.06 −0.02 1.00
vol 0.11 0.06 −0.12 0.41 1.00
dlr 0.09 0.03 0.01 0.78 0.41 1.00
tint −0.09 −0.02 −0.02 −0.16 −0.04 −0.18 1.00
rtc −0.09 0.10 0.13 −0.08 −0.15 −0.13 0.03 1.00
ebas −0.05 0.05 0.13 0.01 −0.12 −0.14 −0.00 0.77 1.00
ami 0.01 0.03 0.15 −0.01 −0.08 −0.00 −0.05 0.38 0.43 1.00
irtc −0.07 0.00 0.24 −0.12 −0.18 −0.17 0.04 0.81 0.76 0.44 1.00
pdisp 0.02 0.05 0.26 −0.04 −0.20 −0.05 −0.03 0.65 0.63 0.52 0.68 1.00
roll 0.08 0.07 0.21 −0.09 −0.17 −0.06 −0.01 0.44 0.33 0.35 0.51 0.55 1.00
Table 4: This tables shows the correlations between product characteristics, trading activity variables, andliquidity measures based on a panel data set for the time period from May 16, 2011 to October 31, 2012,provided by the Financial Industry Regulatory Authority (FINRA), where pairwise-complete observationswere required for calculation purposes. The liquidity proxies are the amount issued (amti), time-to-maturity(mty), coupon (cpn), number of trades (trd), traded volume (vol), number of dealers (dlr), trading interval(tint), round-trip cost (rtc), effective bid-ask spread (ebas), Amihud measure (ami), imputed round-tripcost (irtc), price dispersion measure (pdisp) and Roll measure (roll).
40
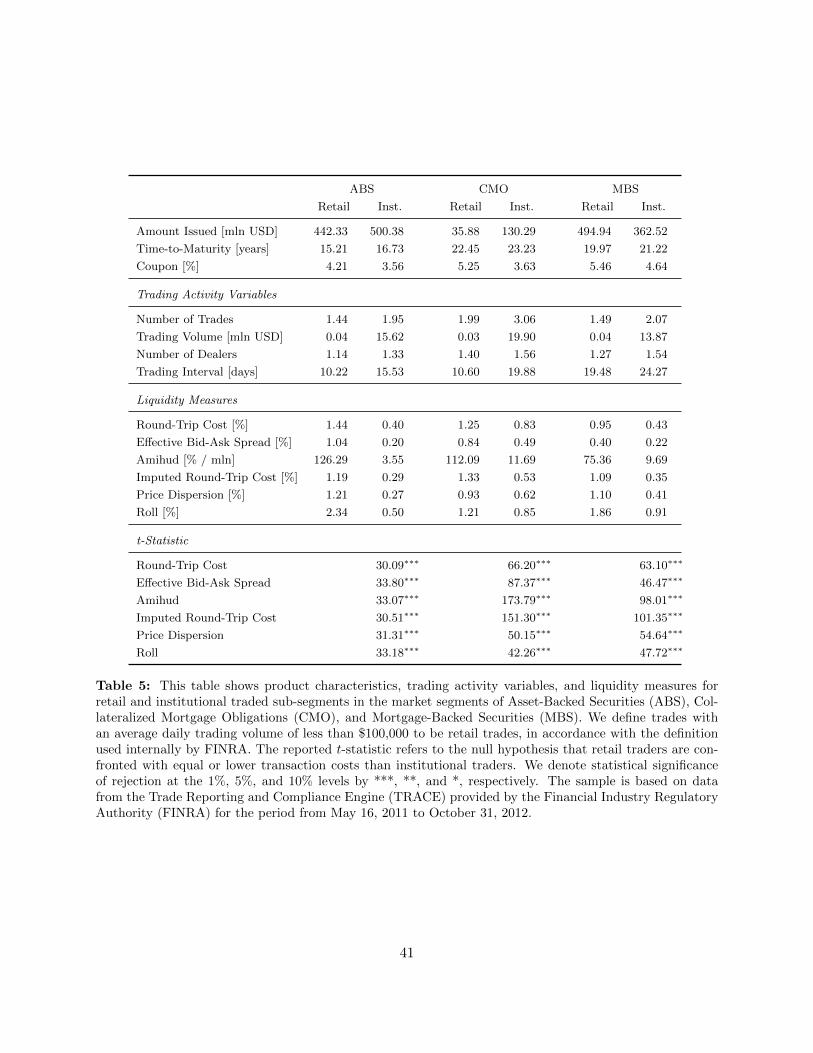
ABS CMO MBS
Retail Inst. Retail Inst. Retail Inst.
Amount Issued [mln USD] 442.33 500.38 35.88 130.29 494.94 362.52
Time-to-Maturity [years] 15.21 16.73 22.45 23.23 19.97 21.22
Coupon [%] 4.21 3.56 5.25 3.63 5.46 4.64
Trading Activity Variables
Number of Trades 1.44 1.95 1.99 3.06 1.49 2.07
Trading Volume [mln USD] 0.04 15.62 0.03 19.90 0.04 13.87
Number of Dealers 1.14 1.33 1.40 1.56 1.27 1.54
Trading Interval [days] 10.22 15.53 10.60 19.88 19.48 24.27
Liquidity Measures
Round-Trip Cost [%] 1.44 0.40 1.25 0.83 0.95 0.43
Effective Bid-Ask Spread [%] 1.04 0.20 0.84 0.49 0.40 0.22
Amihud [% / mln] 126.29 3.55 112.09 11.69 75.36 9.69
Imputed Round-Trip Cost [%] 1.19 0.29 1.33 0.53 1.09 0.35
Price Dispersion [%] 1.21 0.27 0.93 0.62 1.10 0.41
Roll [%] 2.34 0.50 1.21 0.85 1.86 0.91
t-Statistic
Round-Trip Cost 30.09∗∗∗ 66.20∗∗∗ 63.10∗∗∗
Effective Bid-Ask Spread 33.80∗∗∗ 87.37∗∗∗ 46.47∗∗∗
Amihud 33.07∗∗∗ 173.79∗∗∗ 98.01∗∗∗
Imputed Round-Trip Cost 30.51∗∗∗ 151.30∗∗∗ 101.35∗∗∗
Price Dispersion 31.31∗∗∗ 50.15∗∗∗ 54.64∗∗∗
Roll 33.18∗∗∗ 42.26∗∗∗ 47.72∗∗∗
Table 5: This table shows product characteristics, trading activity variables, and liquidity measures forretail and institutional traded sub-segments in the market segments of Asset-Backed Securities (ABS), Col-lateralized Mortgage Obligations (CMO), and Mortgage-Backed Securities (MBS). We define trades withan average daily trading volume of less than $100,000 to be retail trades, in accordance with the definitionused internally by FINRA. The reported t-statistic refers to the null hypothesis that retail traders are con-fronted with equal or lower transaction costs than institutional traders. We denote statistical significanceof rejection at the 1%, 5%, and 10% levels by ***, **, and *, respectively. The sample is based on datafrom the Trade Reporting and Compliance Engine (TRACE) provided by the Financial Industry RegulatoryAuthority (FINRA) for the period from May 16, 2011 to October 31, 2012.
41

AAA AA A BBB BB B CCC/C NR
Product Characteristics
Amount Issued [mln USD] 581.81 506.03 701.41 510.73 194.14 143.28 118.77 432.88
Time-to-Maturity [years] 14.96 13.94 20.92 17.96 18.41 18.20 19.88 17.06
Coupon [%] 3.40 2.67 4.60 4.89 4.92 4.99 3.32 3.78
Trading Activity Variables
Number of Trades 1.73 1.72 1.93 2.25 2.08 2.06 1.84 1.95
Trading Volume [mln USD] 12.33 12.98 11.25 13.62 10.70 11.98 15.51 15.52
Number of Dealers 1.27 1.26 1.37 1.50 1.39 1.34 1.25 1.30
Trading Interval [days] 10.46 16.32 10.79 12.16 14.30 17.47 23.28 12.25
Liquidity Measures
Round-Trip Cost [%] 0.22 0.33 0.45 0.56 0.72 0.87 1.17 0.41
Effective Bid-Ask Spread [%] 0.15 0.18 0.25 0.31 0.31 0.37 0.36 0.23
Amihud [% / mln] 8.59 4.40 3.98 14.00 7.74 5.94 4.41 3.76
Imputed Round-Trip Cost [%] 0.21 0.32 0.36 0.41 0.50 0.58 0.61 0.34
Price Dispersion [%] 0.26 0.26 0.31 0.37 0.48 0.54 0.46 0.28
Roll [%] 0.49 0.61 0.52 0.63 0.83 0.94 0.79 0.49
t-Statistic
Round-Trip Cost 5.47∗∗∗ 4.13∗∗∗ 3.70∗∗∗ 3.36∗∗∗ 2.40∗∗∗ 3.73∗∗∗
Effective Bid-Ask Spread 2.26∗∗ 3.89∗∗∗ 3.00∗∗∗ 0.27 1.67∗∗ −0.29
Amihud −3.83 −0.39 6.68∗∗∗ −3.44 −1.13 −0.86
Imputed Round-Trip Cost 6.27∗∗∗ 1.92∗∗ 2.43∗∗∗ 3.69∗∗∗ 2.12∗∗ 0.76
Price Dispersion −0.13 1.76∗∗ 2.51∗∗∗ 3.16∗∗∗ 0.98 −1.27
Roll 2.29∗∗ −1.60 2.61∗∗∗ 3.08∗∗∗ 1.11 −1.21
Table 6: This table shows product characteristics, trading activity variables, and liquidity measures forthe credit rating grades (AAA, AA, A, BBB, BB, B, CCC/C, NR) in the market segment of Asset-BackedSecurities (ABS). The reported t-statistic refers to the null hypothesis that lower rated securities have equalor lower transaction costs than securities from the respective adjacent higher rating grade. We denotestatistical significance of rejection at the 1%, 5%, and 10% levels by ***, **, and *, respectively. The sampleis based on data from the Trade Reporting and Compliance Engine (TRACE) provided by the FinancialIndustry Regulatory Authority (FINRA) for the period from May 16, 2011 to October 31, 2012.
42

Others FN FH GN
Product Characteristics
Amount Issued [mln USD] 126.07 82.28 85.74 42.71
Time-to-Maturity [years] 23.13 21.34 20.89 25.60
Coupon [%] 3.93 4.66 4.62 4.49
Trading Activity Variables
Number of Trades 2.49 2.59 2.61 2.67
Trading Volume [mln USD] 13.28 13.66 10.00 6.86
Number of Dealers 1.40 1.51 1.52 1.55
Trading Interval [days] 19.40 14.68 13.88 12.35
Liquidity Measures
Round-Trip Cost [%] 1.20 0.76 0.74 0.99
Effective Bid-Ask Spread [%] 0.69 0.52 0.54 0.69
Amihud [% / mln] 47.28 52.06 56.70 55.53
Imputed Round-Trip Cost [%] 0.87 0.61 0.62 0.81
Price Dispersion [%] 0.82 0.61 0.61 0.67
Roll [%] 1.19 0.82 0.85 0.94
t-Statistic
Round-Trip Cost 56.31∗∗∗ 60.56∗∗∗ 25.48∗∗∗
Effective Bid-Ask Spread 32.79∗∗∗ 31.69∗∗∗ 0.67
Amihud −6.26 −12.83 −12.92
Imputed Round-Trip Cost 41.92∗∗∗ 41.82∗∗∗ 9.55∗∗∗
Price Dispersion 27.54∗∗∗ 29.64∗∗∗ 23.51∗∗∗
Roll 33.36∗∗∗ 32.20∗∗∗ 23.39∗∗∗
Table 7: This table shows product characteristics, trading activity variables, and liquidity measures for theissuing authority sub-segments, which are either one of the three federal government-sponsored enterprises(GSEs), i.e. the Federal Home Loan Mortgage Corporation (FH), the Federal National Mortgage Association(FN), or the Government National Mortgage Association (GN), or other institutions (Others), in the marketsegment of Collateralized Mortgage Obligations (CMO). The reported t-statistic refers to the null hypothesisthat securities issued by other institutions have equal or lower transaction costs than securities issued byone of the three GSEs. We denote statistical significance of rejection at the 1%, 5%, and 10% levels by ***,**, and *, respectively. The sample is based on data from the Trade Reporting and Compliance Engine(TRACE) provided by the Financial Industry Regulatory Authority (FINRA) for the period from May 16,2011 to October 31, 2012.
43
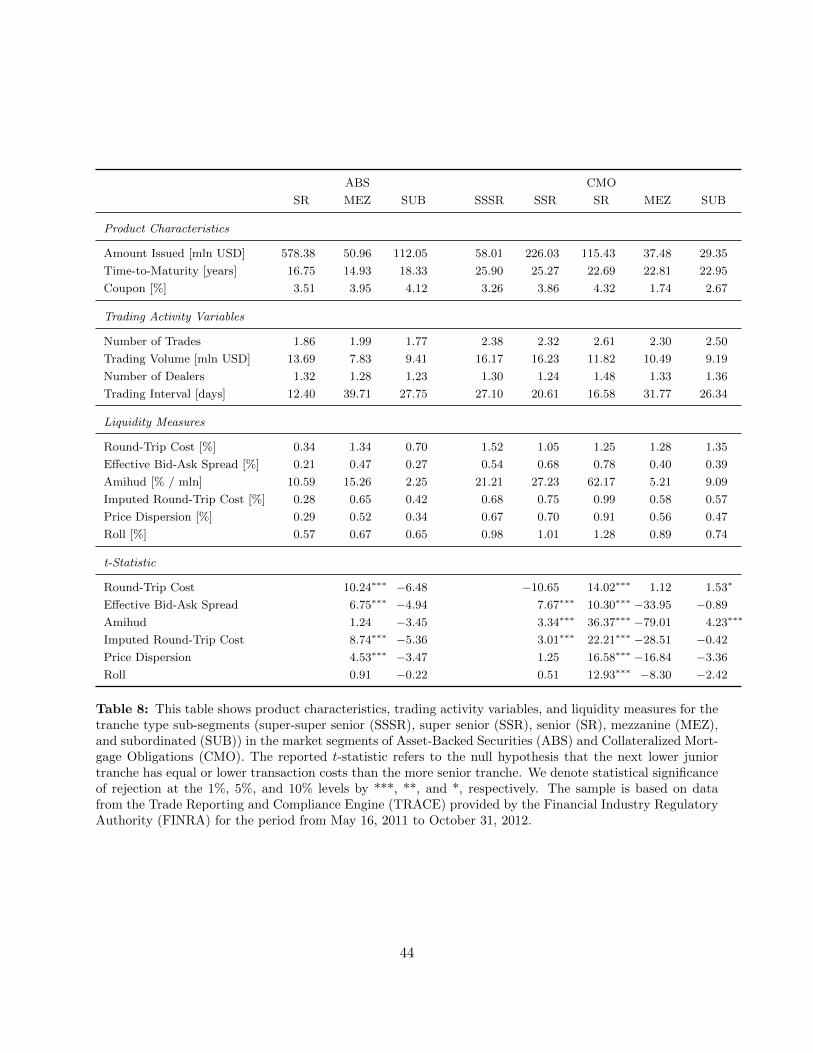
ABS CMO
SR MEZ SUB SSSR SSR SR MEZ SUB
Product Characteristics
Amount Issued [mln USD] 578.38 50.96 112.05 58.01 226.03 115.43 37.48 29.35
Time-to-Maturity [years] 16.75 14.93 18.33 25.90 25.27 22.69 22.81 22.95
Coupon [%] 3.51 3.95 4.12 3.26 3.86 4.32 1.74 2.67
Trading Activity Variables
Number of Trades 1.86 1.99 1.77 2.38 2.32 2.61 2.30 2.50
Trading Volume [mln USD] 13.69 7.83 9.41 16.17 16.23 11.82 10.49 9.19
Number of Dealers 1.32 1.28 1.23 1.30 1.24 1.48 1.33 1.36
Trading Interval [days] 12.40 39.71 27.75 27.10 20.61 16.58 31.77 26.34
Liquidity Measures
Round-Trip Cost [%] 0.34 1.34 0.70 1.52 1.05 1.25 1.28 1.35
Effective Bid-Ask Spread [%] 0.21 0.47 0.27 0.54 0.68 0.78 0.40 0.39
Amihud [% / mln] 10.59 15.26 2.25 21.21 27.23 62.17 5.21 9.09
Imputed Round-Trip Cost [%] 0.28 0.65 0.42 0.68 0.75 0.99 0.58 0.57
Price Dispersion [%] 0.29 0.52 0.34 0.67 0.70 0.91 0.56 0.47
Roll [%] 0.57 0.67 0.65 0.98 1.01 1.28 0.89 0.74
t-Statistic
Round-Trip Cost 10.24∗∗∗ −6.48 −10.65 14.02∗∗∗ 1.12 1.53∗
Effective Bid-Ask Spread 6.75∗∗∗ −4.94 7.67∗∗∗ 10.30∗∗∗ −33.95 −0.89
Amihud 1.24 −3.45 3.34∗∗∗ 36.37∗∗∗ −79.01 4.23∗∗∗
Imputed Round-Trip Cost 8.74∗∗∗ −5.36 3.01∗∗∗ 22.21∗∗∗ −28.51 −0.42
Price Dispersion 4.53∗∗∗ −3.47 1.25 16.58∗∗∗ −16.84 −3.36
Roll 0.91 −0.22 0.51 12.93∗∗∗ −8.30 −2.42
Table 8: This table shows product characteristics, trading activity variables, and liquidity measures for thetranche type sub-segments (super-super senior (SSSR), super senior (SSR), senior (SR), mezzanine (MEZ),and subordinated (SUB)) in the market segments of Asset-Backed Securities (ABS) and Collateralized Mort-gage Obligations (CMO). The reported t-statistic refers to the null hypothesis that the next lower juniortranche has equal or lower transaction costs than the more senior tranche. We denote statistical significanceof rejection at the 1%, 5%, and 10% levels by ***, **, and *, respectively. The sample is based on datafrom the Trade Reporting and Compliance Engine (TRACE) provided by the Financial Industry RegulatoryAuthority (FINRA) for the period from May 16, 2011 to October 31, 2012.
44
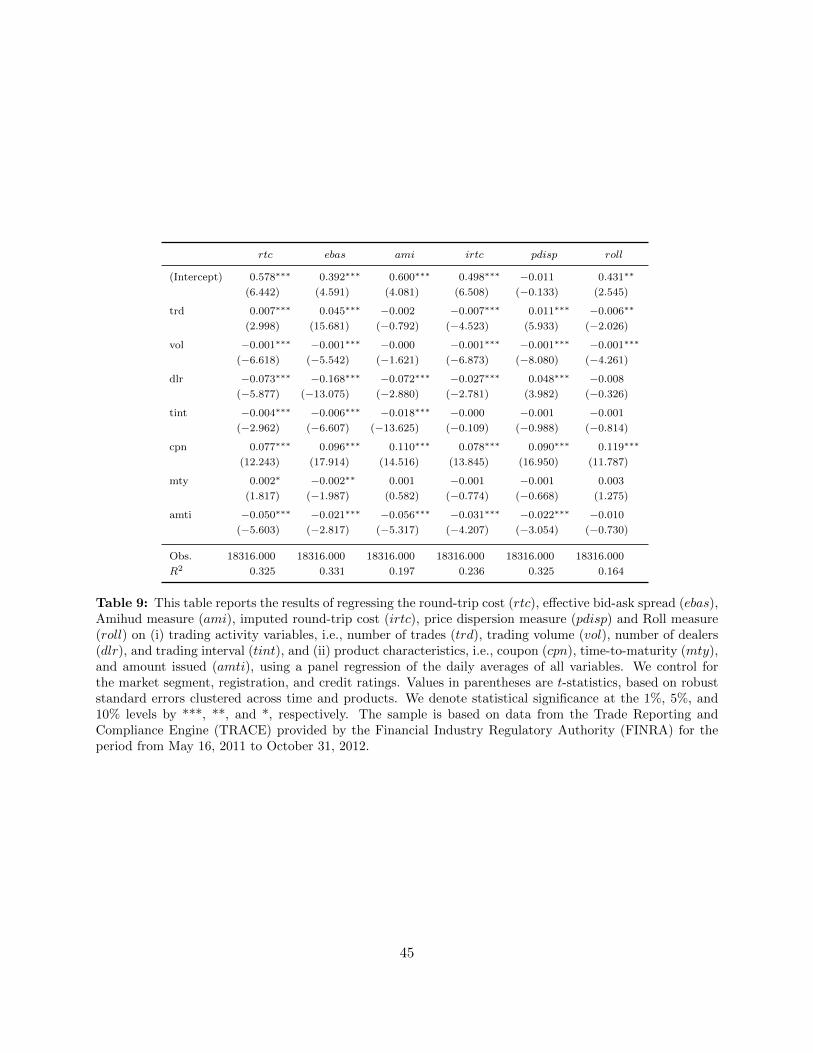
rtc ebas ami irtc pdisp roll
(Intercept) 0.578∗∗∗ 0.392∗∗∗ 0.600∗∗∗ 0.498∗∗∗ −0.011 0.431∗∗
(6.442) (4.591) (4.081) (6.508) (−0.133) (2.545)
trd 0.007∗∗∗ 0.045∗∗∗ −0.002 −0.007∗∗∗ 0.011∗∗∗ −0.006∗∗
(2.998) (15.681) (−0.792) (−4.523) (5.933) (−2.026)
vol −0.001∗∗∗ −0.001∗∗∗ −0.000 −0.001∗∗∗ −0.001∗∗∗ −0.001∗∗∗
(−6.618) (−5.542) (−1.621) (−6.873) (−8.080) (−4.261)
dlr −0.073∗∗∗ −0.168∗∗∗ −0.072∗∗∗ −0.027∗∗∗ 0.048∗∗∗ −0.008(−5.877) (−13.075) (−2.880) (−2.781) (3.982) (−0.326)
tint −0.004∗∗∗ −0.006∗∗∗ −0.018∗∗∗ −0.000 −0.001 −0.001(−2.962) (−6.607) (−13.625) (−0.109) (−0.988) (−0.814)
cpn 0.077∗∗∗ 0.096∗∗∗ 0.110∗∗∗ 0.078∗∗∗ 0.090∗∗∗ 0.119∗∗∗
(12.243) (17.914) (14.516) (13.845) (16.950) (11.787)
mty 0.002∗ −0.002∗∗ 0.001 −0.001 −0.001 0.003
(1.817) (−1.987) (0.582) (−0.774) (−0.668) (1.275)
amti −0.050∗∗∗ −0.021∗∗∗ −0.056∗∗∗ −0.031∗∗∗ −0.022∗∗∗ −0.010(−5.603) (−2.817) (−5.317) (−4.207) (−3.054) (−0.730)
Obs. 18316.000 18316.000 18316.000 18316.000 18316.000 18316.000
R2 0.325 0.331 0.197 0.236 0.325 0.164
Table 9: This table reports the results of regressing the round-trip cost (rtc), effective bid-ask spread (ebas),Amihud measure (ami), imputed round-trip cost (irtc), price dispersion measure (pdisp) and Roll measure(roll) on (i) trading activity variables, i.e., number of trades (trd), trading volume (vol), number of dealers(dlr), and trading interval (tint), and (ii) product characteristics, i.e., coupon (cpn), time-to-maturity (mty),and amount issued (amti), using a panel regression of the daily averages of all variables. We control forthe market segment, registration, and credit ratings. Values in parentheses are t-statistics, based on robuststandard errors clustered across time and products. We denote statistical significance at the 1%, 5%, and10% levels by ***, **, and *, respectively. The sample is based on data from the Trade Reporting andCompliance Engine (TRACE) provided by the Financial Industry Regulatory Authority (FINRA) for theperiod from May 16, 2011 to October 31, 2012.
45

(1) (2) (3) (4) (5) (6)
(Intercept) 0.340∗∗∗ 0.450∗∗∗ 0.208∗∗∗ 0.587∗∗∗ 0.458∗∗∗ 0.226∗∗∗
(7.065) (6.677) (4.715) (10.406) (7.632) (6.730)
ebas 0.606∗∗∗ 0.249∗∗∗
(37.124) (19.497)
ami 0.214∗∗∗ 0.010
(17.806) (1.605)
irtc 0.742∗∗∗ 0.468∗∗∗
(58.888) (32.447)
pdisp 0.795∗∗∗ 0.305∗∗∗
(41.047) (17.618)
roll 0.279∗∗∗ 0.042∗∗∗
(25.336) (6.094)
trd −0.020∗∗∗ 0.008∗∗∗ 0.013∗∗∗ −0.001 0.009∗∗∗ −0.003∗
(−9.012) (3.366) (6.363) (−0.379) (4.019) (−1.710)
vol −0.000∗∗∗ −0.001∗∗∗ −0.000∗∗∗ 0.000∗ −0.001∗∗∗ 0.000
(−5.648) (−7.281) (−4.439) (1.842) (−6.041) (1.540)
dlr 0.029∗∗∗ −0.058∗∗∗ −0.053∗∗∗ −0.111∗∗∗ −0.071∗∗∗ −0.032∗∗∗
(4.512) (−6.431) (−8.073) (−10.365) (−8.094) (−5.663)
tint −0.000 0.000 −0.003∗∗∗ −0.003∗∗∗ −0.003∗∗∗ −0.002∗
(−0.217) (0.323) (−3.770) (−3.054) (−3.059) (−1.958)
cpn 0.019∗∗∗ 0.053∗∗∗ 0.019∗∗∗ 0.005 0.043∗∗∗ −0.017∗∗∗
(3.838) (8.932) (4.335) (1.103) (8.356) (−4.341)
mty 0.003∗∗∗ 0.002∗ 0.003∗∗∗ 0.003∗∗∗ 0.001 0.003∗∗∗
(4.224) (1.872) (4.336) (3.904) (1.546) (5.971)
amti −0.037∗∗∗ −0.038∗∗∗ −0.027∗∗∗ −0.033∗∗∗ −0.047∗∗∗ −0.023∗∗∗
(−6.853) (−5.138) (−5.729) (−6.962) (−7.236) (−6.756)
Obs. 18316.000 18316.000 18316.000 18316.000 18316.000 18316.000
R2 0.513 0.384 0.584 0.549 0.418 0.669
Table 10: This table reports the results of regressing the round-trip cost (rtc) on (i) liquidity measures,i.e., effective bid-ask spread (ebas), Amihud measure (ami), imputed round-trip cost (irtc), price dispersionmeasure (pdisp), and Roll measure (roll), (ii) trading activity variables, i.e., number of trades (trd), tradingvolume (vol), number of dealers (dlr), and trading interval (tint), and (iii) product characteristics, i.e.,coupon (cpn), time-to-maturity (mty), and amount issued (amti), using a panel regression of the dailyaverages of all variables. We control for the market segment, registration, and credit ratings. Values inparentheses are t-statistics based on robust standard errors clustered across time and products. We denotestatistical significance at the 1%, 5%, and 10% levels by ***, **, and *, respectively. The sample is basedon data from the Trade Reporting and Compliance Engine (TRACE) provided by the Financial IndustryRegulatory Authority (FINRA) for the period from May 16, 2011 to October 31, 2012.
46
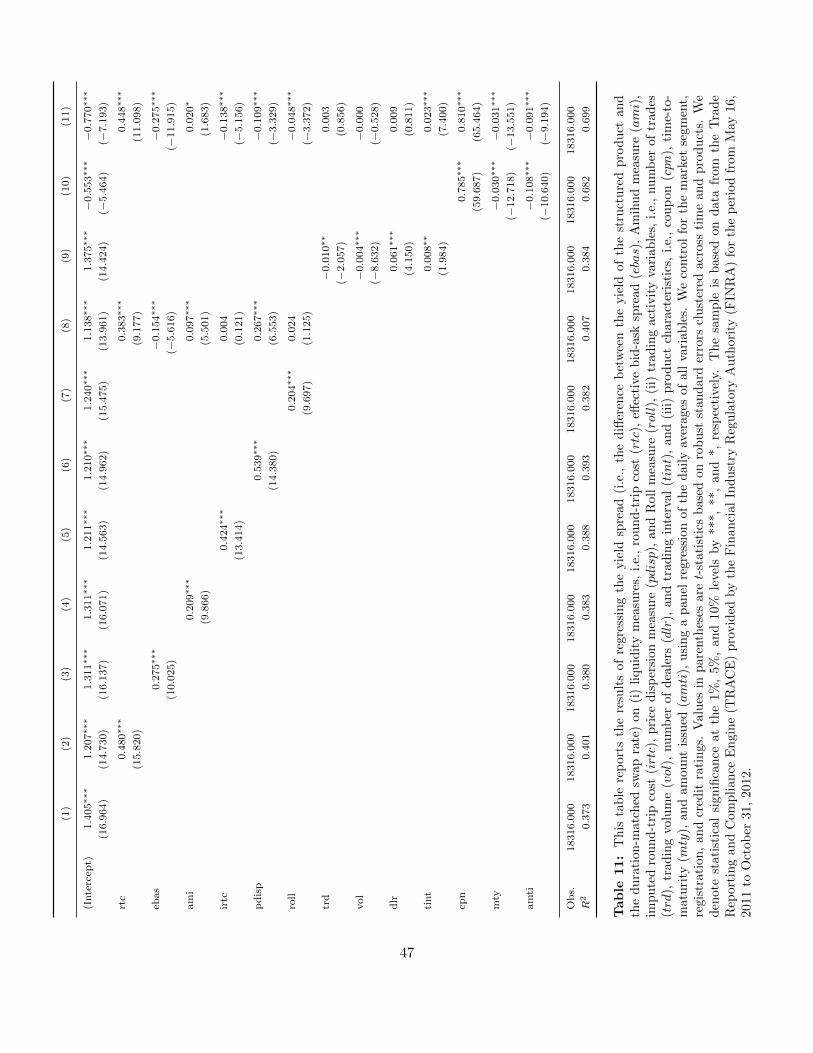
(1)
(2)
(3)
(4)
(5)
(6)
(7)
(8)
(9)
(10)
(11)
(Intercep
t)1.405∗∗∗
1.207∗∗∗
1.311∗∗∗
1.311∗∗∗
1.211∗∗∗
1.210∗∗∗
1.240∗∗∗
1.138∗∗∗
1.375∗∗∗
−0.553∗∗∗
−0.770∗∗∗
(16.964)
(14.730)
(16.137)
(16.071)
(14.563)
(14.962)
(15.475)
(13.961)
(14.424)
(−5.464)
(−7.193)
rtc
0.480∗∗∗
0.383∗∗∗
0.448∗∗∗
(15.820)
(9.177)
(11.098)
ebas
0.275∗∗∗
−0.154∗∗∗
−0.275∗∗∗
(10.025)
(−5.616)
(−11.915)
ami
0.209∗∗∗
0.097∗∗∗
0.020∗
(9.866)
(5.501)
(1.683)
irtc
0.424∗∗∗
0.004
−0.138∗∗∗
(13.414)
(0.121)
(−5.156)
pdisp
0.539∗∗∗
0.267∗∗∗
−0.109∗∗∗
(14.380)
(6.553)
(−3.329)
roll
0.204∗∗∗
0.024
−0.048∗∗∗
(9.697)
(1.125)
(−3.372)
trd
−0.010∗∗
0.003
(−2.057)
(0.856)
vol
−0.004∗∗∗
−0.000
(−8.632)
(−0.528)
dlr
0.061∗∗∗
0.009
(4.150)
(0.811)
tint
0.008∗∗
0.023∗∗∗
(1.984)
(7.400)
cpn
0.785∗∗∗
0.810∗∗∗
(59.687)
(65.464)
mty
−0.030∗∗∗
−0.031∗∗∗
(−12.718)
(−13.551)
amti
−0.108∗∗∗
−0.091∗∗∗
(−10.640)
(−9.194)
Obs.
18316.000
18316.000
18316.000
18316.000
18316.000
18316.000
18316.000
18316.000
18316.000
18316.000
18316.000
R2
0.373
0.401
0.380
0.383
0.388
0.393
0.382
0.407
0.384
0.682
0.699
Tab
le11:
Th
ista
ble
rep
orts
the
resu
lts
ofre
gres
sin
gth
eyie
ldsp
read
(i.e
.,th
ed
iffer
ence
bet
wee
nth
eyie
ldof
the
stru
cture
dp
rod
uct
an
dth
ed
ura
tion
-mat
ched
swap
rate
)on
(i)
liqu
idit
ym
easu
res,
i.e.
,ro
un
d-t
rip
cost
(rtc
),eff
ecti
veb
id-a
sksp
read
(ebas)
,A
mih
ud
mea
sure
(ami)
,im
pu
ted
rou
nd
-tri
pco
st(irtc)
,p
rice
dis
per
sion
mea
sure
(pdisp),
an
dR
oll
mea
sure
(roll)
,(i
i)tr
ad
ing
act
ivit
yva
riab
les,
i.e.
,nu
mb
erof
trad
es(trd
),tr
adin
gvo
lum
e(vol
),nu
mb
erof
dea
lers
(dlr
),an
dtr
ad
ing
inte
rval
(tint)
,an
d(i
ii)
pro
du
ctch
ara
cter
isti
cs,
i.e.
,co
up
on
(cpn
),ti
me-
to-
mat
uri
ty(mty
),an
dam
ount
issu
ed(amti
),u
sin
ga
pan
elre
gre
ssio
nof
the
dail
yav
erages
of
all
vari
ab
les.
We
contr
ol
for
the
mark
etse
gm
ent,
regi
stra
tion
,an
dcr
edit
rati
ngs
.V
alu
esin
par
enth
eses
aret-
stati
stic
sb
ase
don
rob
ust
stan
dard
erro
rscl
ust
ered
acr
oss
tim
ean
dpro
du
cts.
We
den
ote
stat
isti
cal
sign
ifica
nce
atth
e1%
,5%
,an
d10%
leve
lsby
***,
**,
an
d*,
resp
ecti
vely
.T
he
sam
ple
isb
ase
don
data
from
the
Tra
de
Rep
orti
ng
and
Com
pli
ance
En
gin
e(T
RA
CE
)p
rovid
edby
the
Fin
an
cial
Ind
ust
ryR
egu
lato
ryA
uth
ori
ty(F
INR
A)
for
the
per
iod
from
May
16,
2011
toO
ctob
er31
,20
12.
47