TRANSLINKS - Amazon S3s3.amazonaws.com/...Manual_LivelihoodSurveys_QSj.pdf · Household Surveys...
15
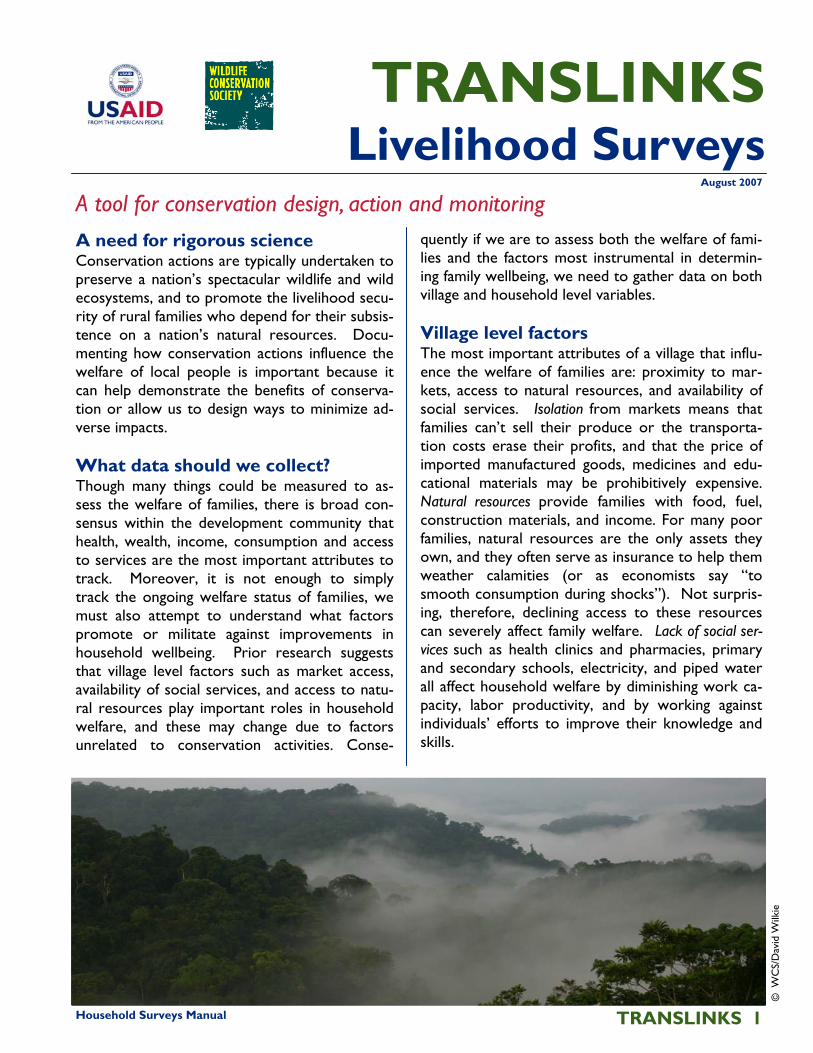
Household Surveys Manual TRANSLINKS 1 A tool for conservation design, action and monitoring TRANSLINKS Livelihood Surveys August 2007 A need for rigorous science Conservation actions are typically undertaken to preserve a nation’s spectacular wildlife and wild ecosystems, and to promote the livelihood secu- rity of rural families who depend for their subsis- tence on a nation’s natural resources. Docu- menting how conservation actions influence the welfare of local people is important because it can help demonstrate the benefits of conserva- tion or allow us to design ways to minimize ad- verse impacts. What data should we collect? Though many things could be measured to as- sess the welfare of families, there is broad con- sensus within the development community that health, wealth, income, consumption and access to services are the most important attributes to track. Moreover, it is not enough to simply track the ongoing welfare status of families, we must also attempt to understand what factors promote or militate against improvements in household wellbeing. Prior research suggests that village level factors such as market access, availability of social services, and access to natu- ral resources play important roles in household welfare, and these may change due to factors unrelated to conservation activities. Conse- quently if we are to assess both the welfare of fami- lies and the factors most instrumental in determin- ing family wellbeing, we need to gather data on both village and household level variables. Village level factors The most important attributes of a village that influ- ence the welfare of families are: proximity to mar- kets, access to natural resources, and availability of social services. Isolation from markets means that families can’t sell their produce or the transporta- tion costs erase their profits, and that the price of imported manufactured goods, medicines and edu- cational materials may be prohibitively expensive. Natural resources provide families with food, fuel, construction materials, and income. For many poor families, natural resources are the only assets they own, and they often serve as insurance to help them weather calamities (or as economists say “to smooth consumption during shocks”). Not surpris- ing, therefore, declining access to these resources can severely affect family welfare. Lack of social ser- vices such as health clinics and pharmacies, primary and secondary schools, electricity, and piped water all affect household welfare by diminishing work ca- pacity, labor productivity, and by working against individuals’ efforts to improve their knowledge and skills. © WCS/David Wilkie
Transcript of TRANSLINKS - Amazon S3s3.amazonaws.com/...Manual_LivelihoodSurveys_QSj.pdf · Household Surveys...
Household Surveys Manual= TRANSLINKS 1
A tool for conservation design, action and monitoring
TRANSLINKS Livelihood Surveys
August 2007
A need for rigorous science Conservation actions are typically undertaken to preserve a nation’s spectacular wildlife and wild ecosystems, and to promote the livelihood secu-rity of rural families who depend for their subsis-tence on a nation’s natural resources. Docu-menting how conservation actions influence the welfare of local people is important because it can help demonstrate the benefits of conserva-tion or allow us to design ways to minimize ad-verse impacts. What data should we collect? Though many things could be measured to as-sess the welfare of families, there is broad con-sensus within the development community that health, wealth, income, consumption and access to services are the most important attributes to track. Moreover, it is not enough to simply track the ongoing welfare status of families, we must also attempt to understand what factors promote or militate against improvements in household wellbeing. Prior research suggests that village level factors such as market access, availability of social services, and access to natu-ral resources play important roles in household welfare, and these may change due to factors unrelated to conservation activities. Conse-
quently if we are to assess both the welfare of fami-lies and the factors most instrumental in determin-ing family wellbeing, we need to gather data on both village and household level variables. Village level factors The most important attributes of a village that influ-ence the welfare of families are: proximity to mar-kets, access to natural resources, and availability of social services. Isolation from markets means that families can’t sell their produce or the transporta-tion costs erase their profits, and that the price of imported manufactured goods, medicines and edu-cational materials may be prohibitively expensive. Natural resources provide families with food, fuel, construction materials, and income. For many poor families, natural resources are the only assets they own, and they often serve as insurance to help them weather calamities (or as economists say “to smooth consumption during shocks”). Not surpris-ing, therefore, declining access to these resources can severely affect family welfare. Lack of social ser-vices such as health clinics and pharmacies, primary and secondary schools, electricity, and piped water all affect household welfare by diminishing work ca-pacity, labor productivity, and by working against individuals’ efforts to improve their knowledge and skills.
© W
CS/
Dav
id W
ilkie
TRANSLINKS 2 Household Surveys Manual=
[1] You can simply measure the travel distance in kilometers or travel time in hours from the vil-lage to the nearest town with a large permanent commercial market. This is effectively the cost that families incur to obtain or sell goods. Other similar measures include the travel time or travel distance to the nearest road, railway station, and bus or taxi service. In many countries, most settlements with a population larger than 5,000 people can be classed as market towns. [2] In villages with little market access we expect that manufactured goods such as soap, canned food and shoes would be unavailable or expen-sive. Given this, you can assess market access by calculating the village price of a standard basket of goods (i.e., a standard set of items that can be purchased somewhere within the country). A village price basket-of-goods might include: a 500g loaf of bread, a can of sardines, a packet of candles, a radio, a bottle of beer, etc. When compiling your basket-of-goods, it is important to ensure that items vary in price from cheap to expensive. It is also very important to standard-ize the size of each item and its brand (e.g., 1 kg of Pony brand salt; a Sony “D” cell Radio). To gather the information, you use the basket-of-goods as a checklist and determine whether each item is sold in the village and if so for what price. Remember, a researcher who speaks the local language is more likely to obtain legitimate prices than is an outsider who may only be quoted the “tourist” price, particularly in places where all prices are negotiated. If there are sev-eral shops, stalls or vendors in the village it is worth seeing if prices vary (though often they do not). With the data you can create two indices: 1) the percentage of the basket-of-goods sold in the village – the higher the percentage the greater the level of market access, and 2) the total price of the items in the basket-of-goods – the lower the total price the greater the level of market access. If an item is not sold in the vil-lage you should assign it a very high price – say $100. Gathering village price data repeatedly over time not only allows us to determine whether market access has changed, it allows us to calculate a consumer price index, which is a measure of in-flation and the changing cost of living.
Market access There are two simple ways to measure market ac-cess: 1) travel cost, and 2) village price of a basket of goods.
The Importance of Using Control Households
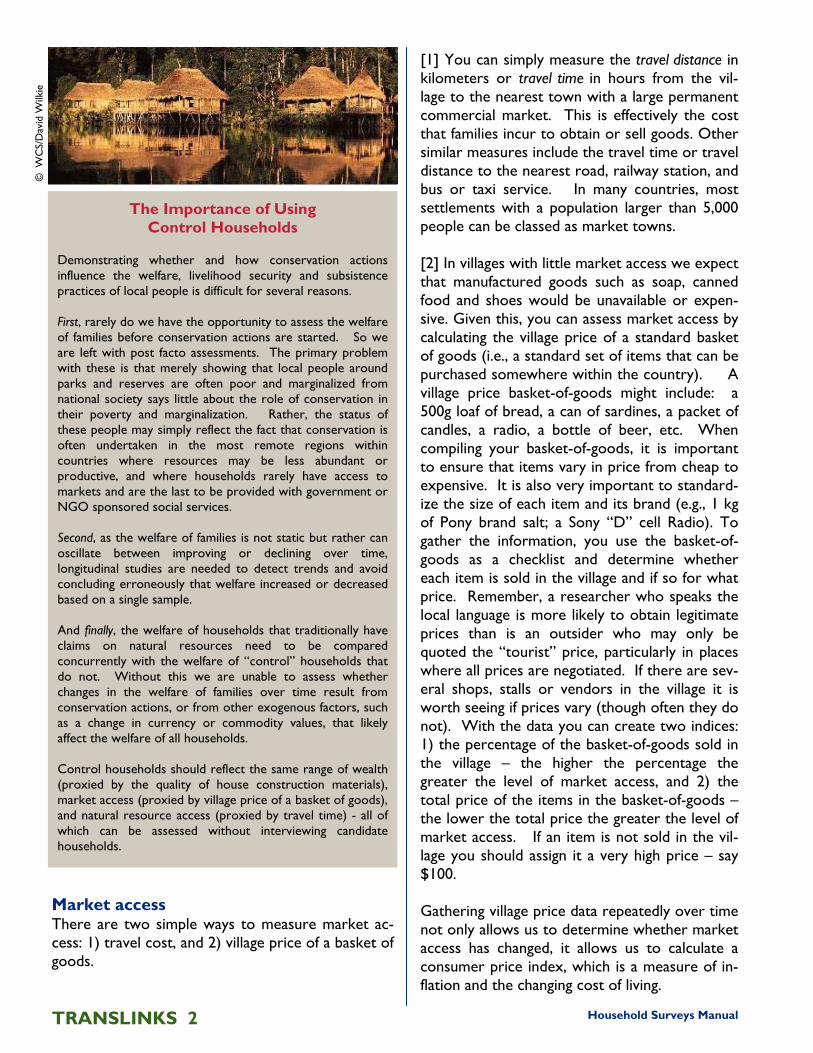
Demonstrating whether and how conservation actions influence the welfare, livelihood security and subsistence practices of local people is difficult for several reasons. First, rarely do we have the opportunity to assess the welfare of families before conservation actions are started. So we are left with post facto assessments. The primary problem with these is that merely showing that local people around parks and reserves are often poor and marginalized from national society says little about the role of conservation in their poverty and marginalization. Rather, the status of these people may simply reflect the fact that conservation is often undertaken in the most remote regions within countries where resources may be less abundant or productive, and where households rarely have access to markets and are the last to be provided with government or NGO sponsored social services. Second, as the welfare of families is not static but rather can oscillate between improving or declining over time, longitudinal studies are needed to detect trends and avoid concluding erroneously that welfare increased or decreased based on a single sample. And finally, the welfare of households that traditionally have claims on natural resources need to be compared concurrently with the welfare of “control” households that do not. Without this we are unable to assess whether changes in the welfare of families over time result from conservation actions, or from other exogenous factors, such as a change in currency or commodity values, that likely affect the welfare of all households. Control households should reflect the same range of wealth (proxied by the quality of house construction materials), market access (proxied by village price of a basket of goods), and natural resource access (proxied by travel time) - all of which can be assessed without interviewing candidate households.
© W
CS/
Dav
id W
ilkie
Household Surveys Manual= TRANSLINKS 3
time or distance signifies that the social service is available within the village. Please note that these measures provide a measure of availability, they do not tell us whether families use the service or can afford them if payment is required to use the ser-vices, nor whether the resource quality varies (e.g., is the water potable?). Village size The size of the village, in terms of the number of households and the total resident population, does not directly influence household welfare—but indi-rectly may influence the presence of functional social services. For example, there is evidence that villages smaller than 5,000 people do not generate enough demand to allow a private, non-subsidized pharmacy to cover its operating costs nor make a profit. Measuring village size is important, on its own, be-cause it allows us to decide whether we need to select a sample of households to survey, or can sur-vey all households. It is good practice to create a map of the village indi-cating the location of all buildings. With the village chief or some other respected and knowledgeable person, cluster the buildings into household group-ings. One definition of a household is a group of residents who share the same kitchen or cooking fire. As you map the village, make sure that you as-sign each family cluster a number and each building in that cluster a letter (e.g., 1a, 1b, 1c, 2a, 2b, 3a, 4a, 4b, etc.).
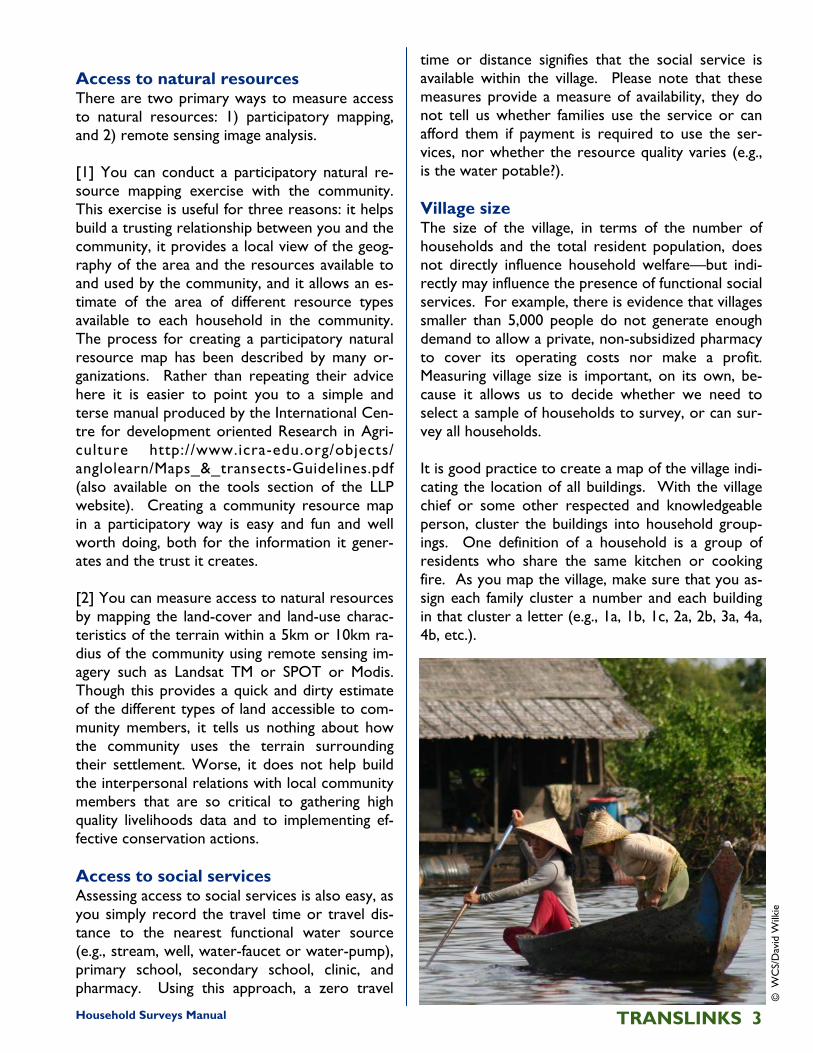
Access to natural resources There are two primary ways to measure access to natural resources: 1) participatory mapping, and 2) remote sensing image analysis. [1] You can conduct a participatory natural re-source mapping exercise with the community. This exercise is useful for three reasons: it helps build a trusting relationship between you and the community, it provides a local view of the geog-raphy of the area and the resources available to and used by the community, and it allows an es-timate of the area of different resource types available to each household in the community. The process for creating a participatory natural resource map has been described by many or-ganizations. Rather than repeating their advice here it is easier to point you to a simple and terse manual produced by the International Cen-tre for development oriented Research in Agri-culture http://www.icra-edu.org/objects/anglolearn/Maps_&_transects-Guidelines.pdf (also available on the tools section of the LLP website). Creating a community resource map in a participatory way is easy and fun and well worth doing, both for the information it gener-ates and the trust it creates. [2] You can measure access to natural resources by mapping the land-cover and land-use charac-teristics of the terrain within a 5km or 10km ra-dius of the community using remote sensing im-agery such as Landsat TM or SPOT or Modis. Though this provides a quick and dirty estimate of the different types of land accessible to com-munity members, it tells us nothing about how the community uses the terrain surrounding their settlement. Worse, it does not help build the interpersonal relations with local community members that are so critical to gathering high quality livelihoods data and to implementing ef-fective conservation actions. Access to social services Assessing access to social services is also easy, as you simply record the travel time or travel dis-tance to the nearest functional water source (e.g., stream, well, water-faucet or water-pump), primary school, secondary school, clinic, and pharmacy. Using this approach, a zero travel
© W
CS/
Dav
id W
ilkie
TRANSLINKS 4 Household Surveys Manual=
Demographics We are interested in determining the size, and age and gender composition of the household because these factors influence household pro-duction and consumption. We are particularly interested in the size and composition of the family around the time of the survey, because that is when we will be gathering data on pro-duction and consumption. Given this, we define family as all relatives who slept at home during the week previous to the survey. This accounts for all resident family members and those who may have been traveling for a day or two. This definition misses those “family members” who have been away from home longer, because they work or study outside the village or because they are being fostered by friends and relatives. However, this does not matter as they have not contributed to household consumption, and goods or cash provided by them to the family will still be captured in the income survey as gifts or remittances. Determining the gender of all family members is, of course, easy. If people are unsure of their age, you will need to develop an “event calen-dar” for the village that uses important local and national events to establish a 70-80 year time line. In this way a person can say “I was born after independence but before the collapse of the coffee market,” and using the event calendar you can estimate that she is between 55 and 65 years old. When gathering demographic data make sure that you give each person a unique identification number, which will ensure that the actual iden-tity of everyone can be kept secret. In some communities and political contexts, people will refuse to provide information that can poten-tially be used to identify them, or will refuse to participate altogether. Working through local language assistants and making several visits to the village prior to beginning data collection both help to build familiarity and a level of trust between families and the researchers, and can help ensure that families will participate in the study. Please remember that families should not be coerced to participate.
Household and individual level factors The most important factors that we use to assess household welfare are: ♦ Demographics: family size and age and gender
composition; ♦ Education level of family members; ♦ Short-term measures of health: body-mass-index
and mid-upper-arm-circumference; ♦ Wealth: the assets people own; ♦ Income: the revenue people generate from their
labor and investments; ♦ Consumption: the natural and manufactured
goods that people obtain or buy; and ♦ Self-reported assessments of social capital and
social cohesion. Clearly this is not an exhaustive list of all the factors you can measure. It is, however, a parsimonious set of factors that cover the key components that con-tribute to the welfare of families.
Human Subjects Safeguards
Like the Hippocratic Oath that urges doctors to, at a minimum, do no harm to their patients, it is important that researchers ensure that they do not directly or indirectly harm the families they are studying. The study should ensure that: • participation does not place subjects at risk of physical
or social harm • privacy and confidentiality of each subject is ensured • subjects are informed about the project in the local
language and formally asked whether they consent to participate
• subjects have the right to refuse to participate at any stage in the study
• subjects are not coerced to participate in the study and that any compensation be provided at the community, not the individual level
The importance of trust At the beginning of one study over half of the people refused to participate because they thought that the researchers were measuring their height so that they could be fitted for a coffin, and that participating in the study would hasten their deaths. Staying in the villages for longer periods prior to starting data collection and asking the local school teacher to talk about the study with families helped overcome people’s apprehension and increased participation in the study.
Household Surveys Manual= TRANSLINKS 5
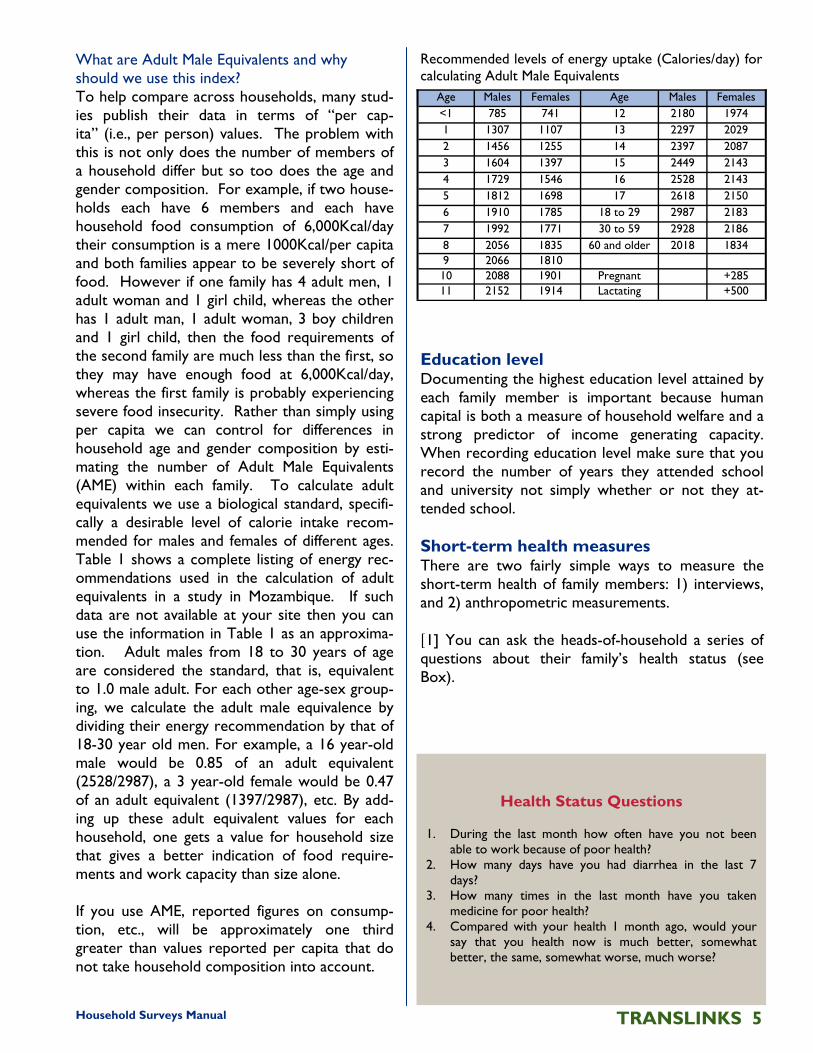
What are Adult Male Equivalents and why should we use this index? To help compare across households, many stud-ies publish their data in terms of “per cap-ita” (i.e., per person) values. The problem with this is not only does the number of members of a household differ but so too does the age and gender composition. For example, if two house-holds each have 6 members and each have household food consumption of 6,000Kcal/day their consumption is a mere 1000Kcal/per capita and both families appear to be severely short of food. However if one family has 4 adult men, 1 adult woman and 1 girl child, whereas the other has 1 adult man, 1 adult woman, 3 boy children and 1 girl child, then the food requirements of the second family are much less than the first, so they may have enough food at 6,000Kcal/day, whereas the first family is probably experiencing severe food insecurity. Rather than simply using per capita we can control for differences in household age and gender composition by esti-mating the number of Adult Male Equivalents (AME) within each family. To calculate adult equivalents we use a biological standard, specifi-cally a desirable level of calorie intake recom-mended for males and females of different ages. Table 1 shows a complete listing of energy rec-ommendations used in the calculation of adult equivalents in a study in Mozambique. If such data are not available at your site then you can use the information in Table 1 as an approxima-tion. Adult males from 18 to 30 years of age are considered the standard, that is, equivalent to 1.0 male adult. For each other age-sex group-ing, we calculate the adult male equivalence by dividing their energy recommendation by that of 18-30 year old men. For example, a 16 year-old male would be 0.85 of an adult equivalent (2528/2987), a 3 year-old female would be 0.47 of an adult equivalent (1397/2987), etc. By add-ing up these adult equivalent values for each household, one gets a value for household size that gives a better indication of food require-ments and work capacity than size alone. If you use AME, reported figures on consump-tion, etc., will be approximately one third greater than values reported per capita that do not take household composition into account.
Age Males Females Age Males Females <1 785 741 12 2180 1974 1 1307 1107 13 2297 2029 2 1456 1255 14 2397 2087 3 1604 1397 15 2449 2143 4 1729 1546 16 2528 2143 5 1812 1698 17 2618 2150 6 1910 1785 18 to 29 2987 2183 7 1992 1771 30 to 59 2928 2186 8 2056 1835 60 and older 2018 1834 9 2066 1810 10 2088 1901 Pregnant +285 11 2152 1914 Lactating +500
Recommended levels of energy uptake (Calories/day) for calculating Adult Male Equivalents
Education level Documenting the highest education level attained by each family member is important because human capital is both a measure of household welfare and a strong predictor of income generating capacity. When recording education level make sure that you record the number of years they attended school and university not simply whether or not they at-tended school. Short-term health measures There are two fairly simple ways to measure the short-term health of family members: 1) interviews, and 2) anthropometric measurements. =x1] You can ask the heads-of-household a series of questions about their family’s health status (see Box).
Health Status Questions 1. During the last month how often have you not been
able to work because of poor health? 2. How many days have you had diarrhea in the last 7
days? 3. How many times in the last month have you taken
medicine for poor health? 4. Compared with your health 1 month ago, would your
say that you health now is much better, somewhat better, the same, somewhat worse, much worse?

TRANSLINKS 6 Household Surveys Manual=
more wealth classes, be sure to ask them what characterizes households in each wealth class. In community terms, poor families may be identi-fied, for example, as those that are food inse-cure, or have few assets, or don’t send their children to school, or cannot afford to buy medicine at the clinic. Repeating this with one or two other local experts will allow you to confirm the wealth ranking. This method of household wealth ranking works well for small villages with less than 30 households. A quantitative measure of wealth- the value of a standard basket-of-assets Wealth (or in economic terms permanent in-come) is most often assessed by asking house-holds to list the number and value of items within a standard basket-of-assets that the household owns. The basket-of-assets has to be chosen to include items that span a broad range of values and thus are likely to be owned by households that differ widely in wealth. For example, the following items were included in the basket-of-assets used for a survey of 2,000 households in Gabon: cooking equipment (all types from simple charcoal stoves to modern ovens and microwaves), beds, mattresses, lamps (kerosene and gas), watches, clocks, refrigera-tors, freezers, music players (radios, walkman, CD players, etc.), televisions, mobile phones, electric fans, air conditioners, and vehicles. For many families, livestock and landholdings are im-portant assets that could be included in a stan-dard basket wealth assessment. People are usu-ally very willing to list and value their belongings. When the owner of the asset does not know its value, the researcher should note the make and model of the item and then find the current market price for that model or an equivalent. For livestock and land, the researcher should ask several people in the village how much they would pay for a parcel of land and for different types of livestock, to estimate a village price for each item. The values of all items belonging to all members of the household are then summed to give a single overall “wealth” figure for the household. All values should be recorded in lo-cal currency and later converted to purchasing power parity US dollars to allow comparison with studies from other countries (see Box).
[2] For each family member age 2 years and older, you can measure his/her height using a portable sta-diometer (SECA Model 214) and weight using elec-tronic scales (Tanita makes inexpensive but reliable scales), and use this information to calculate Body Mass Index (BMI—weight kg/height m2). An individ-ual’s BMI when compared against standard values can be used to assess whether he/she is over- or under-weight. Tracking changes in an individual’s BMI over time can be used to assess changing health status. A second robust way to assess short-term health status is by measuring an individual’s Mid-Upper-Arm-Circumference (MUAC i.e., the fat and muscle tissue of the upper arm) which tends not to change unless the subject is malnourished. MUAC is a particularly useful predictor of malnutrition in chil-dren as upper arm circumference in healthy children changes very little from age 1 to 5 years. Detailed instructions for measuring individuals height, weight and MUAC are provided in the on-line appendix and in an excellent manual produced by the USAID Food and Nutrition Technical Assistance Project (http://w w w . f a n t a p r o j e c t . o r g / d o w n l o a d s / p d f s /anthro_2003.pdf). Household wealth Two qualitative measures of wealth To provide a coarse, qualitative measure of wealth of all families in the village, you can record the mate-rials used in construction of the roof and walls of each building. For example, a household might score 1 for a thatch roof, 2 for a corrugated metal roof and 3 for a tile roof; and 1 for mud-brick walls, 2 for concrete block and 3 for brick walls. Using this scoring method you can easily and unobtrusively estimate the wealth of all households in a village or small town. You can also generate a local wealth measure by asking the village chief or other knowl-edgeable person to rank all families according to their wealth. Start by asking who is the wealthiest family and write the name on a card and place it on a table or on the floor. Then ask who is the poor-est family and place their card at the opposite side of the table or 3ft away on the floor. Then working through each family in the village, ask where their card should be placed between the cards of the wealthiest and poorest families. Local people all have a keen sense of the relative wealth of their neighbors, and this process works very well and is highly correlated with quantitative ranking of wealth. If village experts simply cluster households into 3 or
Household Surveys Manual= TRANSLINKS 7
one days holiday per week, all school age children attending school, walking distance to a health clinic, home visits by a doctor) that the participants may or may not believe are basic necessities. It is important that the list includes items almost everyone would agree with (e.g., enough food each day), and others where there may be disagreement (e.g., washing ma-chine, or the right to drive). The list should include between 20 and 25 items. Include some items that few people in the group think are necessities now, but many believe they may be in the future. Re-member, you are constructing a menu of possible basic necessities, not a final list of agreed basic ne-cessities. Do not include items that are difficult to record with a Yes or No answer (e.g., our family is healthy, or teachers are well trained), or that cannot be reliably observed by different people. 2] Surveys are designed to ask three basic sets of questions of the male or female head of household who is picked randomly for each household sur-veyed: 1) Characteristics of the household (Age and gender composition of the household, maximum education level of male and female heads of house-hold, and how long the family has lived at the pre-sent location); 2) Which items are considered basic necessities that everyone should have and no one should have to do without; and 3) Which of the items on the list the household has now. Items can be listed in a table (see datasheet exam-ples on the next pages) and read out to subjects or can be typed on cards that the subject sorts into two piles – necessity or not for question 2, and have or have not for question 3. 3] Analysis of these data is very simple: You will cal-culate the weighting for each item, determine which items are considered “basic necessities”, calculate poverty scores for each household, calculate the Maximum Possible Score for the whole set of basic necessities, and then calculate the Poverty Index for each household by dividing their total Poverty Score by the Maximum Possible Score (see box on next pages). The poverty index will range from 0%, where the family possess none of the basic necessities and is in extreme poverty, to 100%, where the family possess all basic necessities.
This standard basket-of-assets can also be used in a Basic Necessities Survey. A participatory, quantitative measure of poverty- The Basic Necessities Survey (BNS) If poverty can be defined broadly as "the lack of basic necessities," one approach to poverty as-sessment would be to poll people on whether or not they possessed this set of basic necessi-ties. Unlike income approaches to poverty as-sessment (i.e., living on less than US$1/day or US$2/day) there is no a priori definition of what are basic necessities. In addition the threshold for what is a basic necessity is most likely to vary by location and over time with the same loca-tion. Rick Davies (http://www.mande.co.uk), an inde-pendent monitoring and evaluation expert work-ing for ActionAid in 1998, has improved on methods first developed in the late 1980s in the UK by Mack and Lansley (1985) by developing a participatory approach to listing and ranking ba-sic necessities. His Basic Necessities Survey is a wonderfully quick and relatively inexpensive way (~US$3-4/household) to measure and analyze household level poverty and to track changes in poverty levels over time. The survey is completed in three parts: 1] con-ducting focus groups, 2] surveying local house-holds, and 3] analyzing the data collected. 1] A mixed age and gender focus group is used to generate a list of goods (e.g., TV, bicycle, ra-dio, wheelbarrow, machete) and services (e.g.,
Calculating Purchasing Power Parity Though it is possible to convert local currency values into US dollars or Euros to facilitate comparison across countries, seldom does the official exchange rate accurately value the purchasing power of the local currency. For example, in Cameroon though 500 FCFA equals US$1 at the official exchange rate, 500 FCFA will buy more bread in Cameroon than the equivalent US$1 will buy in the USA. Converting to local currency values to ppp$ values accounts for these differences in purchasing power. Purchasing power parity values of most currencies are available on the World Bank – International Comparison Program – website (http://siteresources.worldbank.org/ICPINT/Resources/Table5_7.pdf).

TRANSLINKS 8 Household Surveys Manual=
Basic Necessities Survey (BNS) – a participant approach to quantifying poverty
1] Conduct Focus Groups to generate a list of goods and services (between 20 and 25 items total) that the par-
ticipants may or may not believe are basic necessities. 2] Use Household Surveys to ask three basic sets of questions:
1. What are the characteristics of the household? (see Table 1) 2. Which items are considered basic necessities that everyone should have and no one should have to do without? 3. Which of the items on the list does the household have now?
Items can be listed in a table (see Table 2) and read out to subjects or typed on cards that the subject sorts into two piles.
Table 1. An example Household Attributes table from a BNS datasheet.
Items Are Necessities Yes=1, No=0
Have now Yes=1, No=0
1 sμo of land per person 1 0 Electric light 1 1 Bicycle 0 1 Concrete rice drying 0 1
Wooden rice chest 1 1 3 meals a day 1 1 Buffalo or cow 1 0 All children studying up 1 0
Well with well head 1 0 Stone built house 0 0 Thick cotton blanket 1 1 Doctor visiting the 1 1
Electric fan 0 0 A new set of clothes 1 1
Livestock vaccination 0 0 Meat once a week 1 0 Pesticide pump 0 0 Watch 0 0 Access to loans 1 0 Radio 0 0 Toilet - built of stone 1 0 Table and chairs made of 1 1
Two compartment 0 0
TV 0 0 Bathroom 0 0 Motorbike 0 0
Table 2. An example Items List.
3] Analyze the data to determine poverty index: 1. For each item, combine all the data from all households and calcu-
late the percentage of all households who believe the item is a basic necessity (see Table 3). This is the weighting for that item. The higher the percentage the greater the community consensus that the item is indeed a basic necessity.
2. Basic Necessities are deemed to be all those items where 50% or more of the households believe that the item is one which every-one should have and which no one should have to go without. Items with a weighting of <50% are not considered necessities and are excluded from the next three steps in the analysis.
3. Poverty Scores for individual households are then calculated by multiplying the “Have now” score (Y = 1 and N = 0) by the weighting for that item, and summing over all items.
4. The Maximum Possible Score is then calculated for the whole set of basic necessities (i.e., assume a person has all of the items and a Y=1 was checked for each).
5. A Poverty Index is now calculated for each household by dividing their total Poverty Score by the Maximum Possible Score (ranging from 0% where the family possess none of the basic necessities and is in extreme poverty, to 100% where the family possess all basic necessities).
If poverty scores are recalculated using all items (even those not con-sidered basic necessities) and the poverty index recalculated using the maximum score from only the basic necessity items, then a score of >=100% denotes households living at or above the poverty line (i.e., those that have all or more than the basic necessities).
Date of interview 7/24/2007 Household ID: 34
GPS N 42.387763 GPS E ‐71.2407 Gender Education (Years) Age Subject M 12 45 N
F 10 38 Y M 12 18 N
F 10 15 N F 7 12 N
F 4 9 N
Household Surveys Manual= TRANSLINKS 9
Items # who consider necessity
% who consider necessity
1 sμo of land per person 418 99.5% Electric light 418 99.5% Bicycle 418 99.5% Concrete rice drying yard 415 98.8% Wooden rice chest 414 98.6% 3 meals a day 413 98.3% Buffalo or cow 412 98.1% All children studying up to level 2 412 98.1%
Well with well head 411 97.9% Stone built house 410 97.6% Thick cotton blanket 408 97.1% Doctor visiting the house when sick 399 95.0%
Electric fan 391 93.1% A new set of clothes each year 388 92.4% Livestock vaccination 386 91.9% Meat once a week 350 83.3% Pesticide pump 336 80.0% Watch 325 77.4% Access to loans 322 76.7% Radio 312 74.3% Toilet - built of stone 188 44.8% Table and chairs made of good wood 175 41.7%
Two compartment wooden wardrobe 135 32.1%
TV 88 21.0% Bathroom 78 18.6% Motorbike 32 7.6%
Table 3. An example of a Basic Necessities Weighting table from a BNS dataset. Those items not considered to be a basic necessity by more than 50% of the 420 people surveyed are highlighted in red.
Items Have now Yes=1, No=0
Weighting Poverty score
1 sμo of land per person 0 0.995 0.000 Electric light 1 0.995 0.995 Bicycle 1 0.995 0.995 Concrete rice drying yard 1 0.988 0.988 Wooden rice chest 1 0.986 0.986 3 meals a day 1 0.983 0.983 Buffalo or cow 0 0.981 0.000 All children studying up to level 2 0 0.981 0.000
Well with well head 0 0.979 0.000 Stone built house 0 0.976 0.000 Thick cotton blanket 1 0.971 0.971 Doctor visiting the house when sick 1 0.950 0.950
Electric fan 0 0.931 0.000 A new set of clothes each year 1 0.924 0.924 Livestock vaccination 0 0.919 0.000 Meat once a week 0 0.833 0.000 Pesticide pump 0 0.800 0.000 Watch 0 0.774 0.000 Access to loans 0 0.767 0.000 Radio 0 0.743 0.000
Maximum score 20 Poverty score 7.793
Poverty index 38.96%
Table 4. An example of a Poverty Score table from the BNS dataset.
References Davies, R., and Smith, W. (1998) The Basic Necessities Survey: The experience of ActionAid Vietnam. ActionAid, Hanoi, Vietnam. The Pro Poor Center and Davies, R. (2007) The 2006 Basic Necessities Survey (BNS) in Can Loc District, Ha Tinh Province, Vietnam. Mack, J., and Lansley, S. (1985) Poor Britain Allen and Unwin. London. http://www.mande.co.uk/BNS.htm
Acknowledgements The Basic Necessities Survey methods description is licensed under the Creative Commons Attribution-Noncommercial-Share Alike 3.0 License. To view a copy of this license, visit: http://creativecommons.org/licenses/by-nc-sa/3.0/
TRANSLINKS 10 Household Surveys Manual=
Revenue There are two common ways to record house-hold revenue (or more correctly transitory in-come): 1) subject recall and 2) subject self-reporting. [1] Using recall during a survey to estimate reve-nue is more of a challenge than is measuring wealth, because income fluctuates more quickly than do assets. Although you can assess wealth by estimating the value of assets owned by a household at any given point in time, you need to estimate revenues over some specified time period. Unfortunately, different sources of reve-nue generate income at different frequencies across different time frames. For example, a salaried worker may get paid once a week, once a month or once every two months, whereas other workers may be paid daily. Similarly, a vegetable farmer may sell produce and thus gen-erate revenue every day, whereas a cotton farmer may sell his crop only once per year. To measure household income using a recall survey, it is important that you know something about when different sources of household revenue are generated so that you can ask about them over an appropriate time frame. For example, if you know that salaries, retire-ment benefits, rents, and gifts (or remittances) from family members are obtained each month, then asking a household to recall income from these revenue streams during the month prior to the survey makes sense. If, however, you know that sales of coffee only occur once per year and that sales of bananas occur almost every day, then in the income survey you would ask about revenue from coffee during the previ-ous year and revenue from bananas during the previous 3-7 days.
If poverty scores are recalculated using all items (even those not considered basic necessities) and the poverty index recalculated using the maximum score from only the basic necessity items, then a score of >=100% denotes households living at or above the poverty line (i.e., those that have all or more than the basic necessities). Standards of what are believed to be basic necessi-ties are likely to change over time if a society is un-dergoing some form of economic development or cultural change. When repeated basic necessities surveys are to be carried out with the same house-holds at some later date it is important to conduct a repeat focus group to determine if additional items need to be added to the goods and services list. Scores can be calculated for each household on the basis of the new extended list and then, after ex-cluding those new items, according to the old set. The same approach can be used to delete items that are now seen as redundant because 99.99% of all households now have those items (e.g., inside toilets in the USA).
Standard Sources of Revenue
1. Salaries, wages and bonuses 2. Rents 3. Remittances and gifts (i.e., money given to the family by
non-resident family members or others) 4. Social security and pensions 5. Commerce (i.e., the sale of any good or service)
Wealth and Income
As income and wealth are often highly correlated, and as income is often more difficult to measure accurately, many researchers opt to measure wealth only. The only problem is that wealth is less sensitive to economic changes within the family, as assets are not as dynamic as is income.
© W
CS/
Pete
r C
oppo
lillo
Household Surveys Manual= TRANSLINKS 11
attempt to measure the full range of items that a household consumes or a standard basket-of- goods. The latter is simpler and faster to do, but you need to decide what items will be included in the standard basket and why it is important to in-clude them and to exclude others. There are three ways, primarily, to measure con-sumption: 1) direct observation, 2) subject recall, and 3) subject self-reporting. The level of effort to gather sufficient data for analysis and the level of re-liability or confidence in the accuracy of the data tend to decrease from 1 to 3. [1] The approach used most commonly to directly observe consumption is called the “threshold sur-vey,” or more simply “weigh days,” because all you do is document all goods that enter the household (i.e., cross the threshold) over a 24 hour period, or from dawn to dusk. In this way you are able to re-cord all foods, building materials, raw materials, manufactured goods, etc., that are consumed by a household during a single day. For each good that crosses the threshold it is common to document: the type of good, the value of the good, the weight of the good, and the source or provenance of the good (i.e., was it harvested, purchased, received in exchange; and where was it obtained – from the field, the forest, the market, etc.). For wild har-vested items you might also want to record if they were obtained from private, state-owned, or com-munity lands. Salter (25kg x 0.02kg) electronic hang-ing scales and Pesola spring scales (5kg x 50g and 20kg x 200g) are reliable and robust. In a threshold survey the only items that are not weighed are wa-ter and non-edible manufactured goods. In reality not all goods cross the threshold. If a family buys a car or a dugout canoe they are unlikely to carry it into the kitchen. To capture this in a threshold study you need, at the end of the day, to ask “did you produce, purchase or receive as a gift any other items today?”
To ensure that you capture all meaningful sources of revenue, it is important to conduct a pilot study where you ask a sample of house-holds how they generate income. Information from the pilot study should allow you to supple-ment the generic list of revenue streams to re-flect those that matter to households in your area. Questions about salaries, bonuses, social secu-rity, pensions, and commerce should be directed individually to each person in the household who earned income; whereas rents and remittances can often be aggregated at the household level. Household members are sometimes reluctant to reveal their incomes in front of other members of the same household. In this case, rather than asking the individual to tell you their income, you can show them a list of income categories and ask them discretely to point out the cate-gory into which their income from a particular source falls. These income categories can then be converted into values by using the mid-point of each category. [2] Many researchers use informant diaries to record household income. This approach re-quires that a single family member or all family members that generate revenue are trained to record in a notebook their income and sources of income each day. This, of course, only works when the informant is literate. Researchers of-ten combine this technique with random recall surveys as checks on informant reliability. Consumption Consumption does not necessarily simply mean the food that people eat. Rather, in economic terms consumption refers to all goods and ser-vices used (or consumed) by members of the household. In other words, if I purchase a tele-vision, in economic terms I consume it. Simi-larly, if I harvest a head of bananas and bring it into the kitchen, in economic terms I have con-sumed it, even though my family may actually eat the bananas over several days. So when you conduct consumption surveys you need to make clear whether you are only going to measure food consumption or whether you are going to measure all goods and services consumed. You also need to decide whether you are going to
Gender Balance
As men and women typically play different economic roles within a family, it is important to interview both male and female heads-of-household. This helps ensure that all sources of income and all types of consumption are recorded.
TRANSLINKS 12 Household Surveys Manual=
the timing of the rains, and work patterns of men and women. Using the seasonal calendar you can decide when during the year you might need to repeat the recall surveys to ensure that you document a representative range of goods consumed by each household. Second, as people remember rare events better than common events, the recall period for differ-ent goods consumed and income generated may vary in length. For most staple foods 24hr recall is most accurate in terms of the types and quan-tities of goods consumed. Foods that are only rarely consumed may require a 1 week or 1 month recall period. To determine the appro-priate recall period for different goods, the easi-est approach is to create a list of 15-20 goods that range from staple foods likely to be con-sumed every day, to capital items like radios, phones and cars that are expensive and likely to be purchased only rarely, then ask several peo-ple when last they consumed each item on the list. This will allow you to develop 2 or more recall periods that you can use to gather infor-mation on regularly and seldom consumed goods. For food consumption, the longer the recall period the more data can be gathered at a single survey. However, the longer the recall period the more likely the subject will inaccu-rately recall consumption. One approach to evaluating the accuracy of food consumption re-call is to visit a household every day for 7 days. On day 1 to 6 the female head of household is asked to recall what types and quantities of food were consumed during the previous 24 hours. We pick the female head of household because she is often responsible for obtaining and pre-paring food for all family members. Remember that consumed does not only mean what was eaten. So for example, if a family member pur-chased a case of 24 cans of sardines during the previous 24 hour period, then that case of sar-dines was consumed by the family during that period even though they may not actually eat all the sardines during that period. On day 7 the female head of household is asked to recall what was consumed during the last day, 2 days, 3 days, 4 days, 5 days, 6 days, and 7 days. Com-paring the answers given for each 24hr recall with the 1-7 days recall allows you to determine when memory begins to blur and recall accuracy
To record a representative sample of all items con-sumed by a household, weigh days need to be re-peated during the year. This is particularly important to ensure that you record items that are only con-sumed seasonally or only very rarely. Some items that are only consumed once or twice a year, or items that are illegal to consume, may not cross the threshold during your study and will thus not appear in your data. As a general rule, if you are interested in consumption patterns of individual households, you may need to conduct two or three weigh days on each of 10-20 households every 2 to 3 months. If you are interested in overall consumption of a community, you might conduct one weigh day on 100 households, every 6 months. Threshold surveys are very time consuming for the researcher but do not require much time of family members as weighing, valuing and determining the provenance of goods is usually very quick. Thresh-old surveys very accurately measure consumption of tangible goods, but do not capture consumption of services such as payment for medical treatment, or payment to a carpenter to build a poultry cage. [2] You can record consumption by visiting house-holds and asking them what they consumed during some time period in the recent past (e.g., previous day, week, month or year). To ensure that recall surveys approximate true consumption and income, the researcher must take into account the three main issues addressed below. First, if the type and quantity of goods consumed, or the source and value of income generated varies seasonally during the year, then recall surveys may have to be repeated to capture this variability. Where household consumption is primarily com-posed of goods produced by household members, consumption typically changes with the seasonal availability of foraged and farmed goods. For exam-ple, in the Ituri forest of northeastern Democratic Republic of Congo people only eat honey during the brief few weeks in June and July when it is available in the forest, and the diets of farmer families shift as each crop matures in the fields. Households that primarily rely on purchased goods tend to show less variability in consumption during the year. If you suspect that consumption varies during the year you can create a seasonal calendar that documents the most important food eaten each month of the year,
Household Surveys Manual= TRANSLINKS 13
declines. In this way you can select the longest recall period that still accurately reports actual consumption. When conducting a recall survey it is useful to create a list of different goods that are likely consumed by households. This might include food, medicines, clothes, tools, kitchen items, educational materials, and durable items such as radios, cars and mobile phones. The list can be used to prompt the subject. However, it is important to first rely on the subject’s mem-ory (i.e., in the last 24 hours can you tell me what items you bought, produced yourself or received as gifts?), before prompting them about specific items on the list of goods. Third, people may not accurately recall or de-clare consumption of goods that are illegal to consume, or may not recall income generated from illegal activities. Though this may not be the case if the laws are considered inappropriate or unjust, and if risk of apprehension and prose-cution are low. Similarly it is quite common that a husband or wife may not be willing to recall consumption of certain goods and or report in-come generated if their spouse is present. Con-ducting separate interviews easily overcomes this constraint. [3] As with income, many researchers have used informant diaries to record individual and house-hold consumption. This approach requires that a single family member (often the female head of household) is trained to record in a notebook the type, source, value and weight of all items brought into the household each day. This, of course, only works when the informant is liter-ate. Researchers often combine this technique with random recall surveys as checks on infor-mant reliability. Consumption variables When gathering information on household con-sumption it is common to ask: ♦ the type of good consumed; ♦ the quantity consumed; ♦ the value of the good consumed; ♦ how the good was obtained (produced
themselves, purchased, or provided as a gift); ♦ where the good was obtained (family farm,
market, village land, or state land); and ♦ travel time to obtain the good in hours.
Converting the quantity of some items consumed into standard measures (litres, kilograms, etc.) is often a challenge. The only fool-proof solution to this is to conduct a series of weigh-days where you weigh all items coming into a household during day-light hours of a 24 hour period (see above). Estimating the value of non-priced goods If the good consumed does not have a price because it is not traded in the village, you will need to esti-mate its value. To do this you first generate a list of non-priced goods from the household surveys. At the end of the data collection period you organize a meeting of several men and women from the com-munity. To estimate the price of each non-priced good, you ask the men and women how much of a non-priced good would they be willing to trade for a standard quantity of a priced-good. For example, you might ask how many bars of soap (priced good) would you want in exchange for a 2kg catfish (non-priced good)? Or how many cans of sardines (priced good) would you want in exchange for a 1-day’s supply of firewood? By asking the group how much of a priced good they would exchange for a non-priced good you can estimate, fairly accurately, the value of the non-traded good. Social capital and social cohesion One measure of household welfare that is seldom assessed is the level of security and support house-hold members feel they get from the community within which they live. When household members do not trust their neighbors or do not expect to receive assistance from neighbors during a crisis, it is reasonable to assume that this has an adverse in-fluence on household perceptions of wellbeing. As qualitative measures of social cohesion, you can ask heads-of-households questions such as the following: ♦ If you left a machete outside in the village over-
night would it still be there in the morning? ♦ When you leave the village can you leave the
door of your house unlocked? ♦ In the village is there someone you could leave
your money with to guard? ♦ When the football field at the school needs cut-
ting, do most families help with the work? ♦ If one of your children becomes sick is there
someone in the village who would lend money to you for medicine?
TRANSLINKS 14 Household Surveys Manual=
that wealth is an important factor determining how households use natural resources, you may want to stratify your sample. To do this assign each house in the village to a wealth class (poor, average, and rich) based on the quality of the construction of their house. Then either select poor, average and rich households proportional to their representation in the village, or select an equal sample of each wealth class. Proportional sampling ensures that you obtain a precise esti-mate of household attributes in each wealth class, but may under-represent a scarce wealth class in the analysis of all households. Equal sam-pling may not result in a precise estimate of a very abundant class, but will ensure that the all classes are well represented in an overall analy-sis. If the number of households in the village or town is too large to count, do the following to select households for the survey. Using random numbers, randomly pick a GPS location that falls within the village or town. At that location, ran-domly pick a compass direction from 0-360 de-grees. Select the street or path closest to the random compass direction and walk until you have reached the 6th household. Toss a coin and if it turns up heads, record the GPS location of the house in a notebook to indicate that it has been selected for the survey. In the notebook you should also record whether the house con-struction suggests that the family is poor, aver-age or rich. If the coin turns up tails continue for the next 6 households and repeat the coin toss. Each time the street or path comes to a fork or crossroads toss a coin to decide which direction to follow. Continue selecting house-holds in this way until you have found 25% of the desired sample size, at which time select another random GPS starting point and repeat the pro-cedure. Once you have selected the desired number of households, if poor, average and rich households are not equally represented, and if wealth is an important factor, you can randomly delete over represented households by flipping a coin. Then return to each of the GPS starting points and repeat the selection process but this time ignoring all houses in the class or classes that have a full sample.
These types of questions are all designed to meas-ure the level of trust, security and assistance that exist within the community, and if scored as 1 for Yes and 0 for No can be used to create a composite self-assessed social cohesion score for each house-hold. Survey development and pilot testing All surveys require a period of development and testing to define and refine the items included in the survey, to knock out any kinks in the questions so that the intent of each question is clearly under-stood by interviewees, and to ensure that the sur-vey does not cause interviewee fatigue which is a major cause of low quality data. You usually only need 5-10 households for a pilot study, and these can often be drawn from the fami-lies or relatives of project staff. It is a good idea not to select pilot households for the actual household survey. During survey development and pilot testing you can make sure that you: ♦ understand how consumption and work patterns
change over the year; ♦ have documented a relatively comprehensive list
of goods and services consumed by households; ♦ are confident that the list of goods selected for
the basket-of-assets wealth measure is represen-tative of the range of assets owned by families across all wealth classes;
♦ have identified a list of goods appropriate for assessing village price differences; and
♦ make sure that the interview does not take more than 1 hour to complete, as more than this risks interviewee fatigue and reduced will-ingness to participate.
Selecting households If the number of households in the village exceeds the sample size that you want, you will need to pick a subset of all households. There are two relatively simple ways to do this. If the village is not too large you can create a map of the village and number all the households. Then simply place each number written on a separate piece of paper into a bag and without looking pick out house numbers until you have the sample size you need. You can also use a random number generator (see RandNumbers.xls in the tools section of the LLP website). If you believe
Household Surveys Manual= TRANSLINKS 15
In places without house numbers and street names record the geographic loca-tion of each house to be surveyed using a GPS. By recording the house address or its GPS location you will be able to find the house again in the future.
Repeated surveys By conducting a single (cross-sectional) survey of house-holds we are able document the welfare of different fami-lies, and assess how factors such as wealth, market access, education, and resource access influence consumption and health. If we want to track changes in welfare, we will need to repeat the survey over time. If we resurvey the same households (panel survey) rather than a different set of households, we not only can assess trends in family welfare, we can use lagged variables (data on a variable collected during the previous survey is used in an analysis of the most recent survey) to deal with problems of reverse cau-sality. For example, health and income are likely corre-lated but we may be unsure whether healthy households work more and thus generate more income, or whether high income households purchase medicines and thus stay healthy. By using the health of the household in the previ-ous survey with the income of the household in the cur-rent survey we can test whether or not health influences income.
Data Manual and Data Dictionary
To help make sure that data are collected and entered into a database correctly, and to ensure that the data are intelligible to others outside of the project and at some undefined time in the future, it is essential that you create a data manual and a data dictionary. A data manual makes explicit the questions your household surveys are designed to resolve. For clarity, each question should be phrased as a formal hypothesis, and the dependent and explanatory variables to be used in the analysis should be made explicit. For example, if you are interested in exploring how household wealth influences consump-tion of wildlife, you might include the following in your data manual. Hypothesis 1: As household wealth increases consumption of wildlife as food will decrease. Rationale: We believe that bushmeat is an inferior good in economic terms and thus when substitutes are available con-sumption will decline as household wealth increases. As household size, human capital capacity, and price of substitutes also influence consumption, these factors should be controlled for in the analysis. Variables for analysis: Dependent variable Household consumption of bushmeat per Adult Male Equivalent (qry_ConsumptionAnalysis) Chief explanatory variables EducationLevelMaleHeadHousehold (tbl_H_demography) HouseholdWealth per AME (qry_Wealth_AME) HouseholdSize (tbl_H_demography) AlternativeProteinPriceDifference (qry_PriceDifference) NB: the names in () indicate the Access database tables and queries that contain the relevant variables for analysis In addition to a data manual that describes the hypotheses, analysis variables and data collection protocols, it is important to maintain a data dictionary. This document describes in detail the name, content and format of all variables that are recorded as part of the household surveys. A data dictionary also describes any transformations that were undertaken on data stored in the database. For example, the database may include raw income values and purchasing power parity (ppp) income values. A data dictionary would document how the ppp values were calculated. An example of a data dictionary is included in the tools section on the following website:
http://www.wcslivinglandscapes.org
Sample Size
The simplest way to estimate the number of households that you need to interview is to use the 40:1 case to variable rule. This rule assumes that for every variable that you want to control for in your analysis (e.g., household size, education of head of household, wealth, access to market, access to health care, etc.) you need to have a sample size of at least 40 households. For example, if you are planning to assess four variables, you will need to sample at least 160 households.

TRANSLINKS 16 Household Surveys Manual=
Additional Reading Plumptre, A., A. Kayitare, H. Rainer, M. Gray, I. Munanura, N. Barakabuye, S. Asuma, M. Sivha, and A. Namara 2004. The socio-economic status of people living near protected areas in the Central Albertine Rift. WCS, IGCP, CARE, Kampala. [This excellent technical report provides many examples of other household level variables than can be gathered during a survey, but does not provide examples of the actual survey questionnaires that were used, nor details of the process used to elicit information about the household.] Swindale, A., and P. Ohri-Vachaspati 2004. Measuring household food consumption: a technical guide. Food and Nutrition Technical Assistance Project (FANTA), Academy for Educational Development and The US Agency for International Development, Washington, D.C. [An excellent manual for measuring household food consumption] Cogill, B. 2003. Anthropometric indicators measurement guide. Food and Nutrition Technical Assistance Project (FANTA), Academy for Educational Development and The US Agency for International Development, Washington, D.C. [An excellent manual for measuring height, weight and mid-upper-arm-circumference] James, W. P. T., and E. C. Schofield. 1990. Human energy requirements: a manual for planners and nutritionists. Page 172. Oxford University Press, Oxford, United Kingdom. [This book is the bible for estimating adult male equivalents] Schoonmaker Freudenberger, K. 1999. Rapid rural appraisal and participatory rural appraisal: a manual for CRS field workers and partners. Catholic Relief Services, Washington, D.C. http://www.catholicrelief.org/about_us/newsroom/publications/RRA_Manual.pdf [One of the best descriptions of how to do a rapid rural appraisal]
Initial Contacts and Informed Consent Before conducting household surveys it is vital that you and your team seek permission to undertake the survey from community leaders and heads-of-household, and try to develop some level of trust with village members. The best way to help community members to feel comfortable with you and your team is to live in the village and participate in village activities for several days prior to starting the surveys. You and your team should work hard to greet and chat with as many people in the community as possible, and always be open and honest about why you are in the village. Unless you spend sufficient time in communities prior to starting surveys you will often fail to get households to participate or to answer your questions honestly. Once you know which households you would like to survey, visit each one on the list and explain the purpose of the study to the heads of household and explain what their participation in the survey would involve. Be sure to say that participation is voluntary, that none of the information they provide will be shared with other people in the village, and that they will remain anonymous. If the family agrees to participate set a time when you can return to complete the survey. If both heads of household are at home and are willing to be interviewed, immediately undertake the survey at that time. If the family declines to participate, write the reason in your notebook and visit the nearest household and ask if they are willing to participate.
Translinks is a partnership of NGOs, Universities and USAID dedicated to finding and sharing practical ways to generate benefits from conserving natural resources that are of global importance, and that serve as the supermarkets, bank accounts and insurance policies of many of the poorest people on earth.
This publication is made possible by the generous support of the American people through the United States Agency for International Development (USAID), under the conditions of the Cooperative Agreement No. EPP-A-00-06-00014-00. The contents are the responsibility of the lead partner and do not necessarily reflect the views of USAID or the United States Government.


![SOA - ceit.aut.ac.irceit.aut.ac.ir/~sa_hashemi/My Research/0-Selected Papers/2... · - Scalability -Flexibility [-p] SOA ... XML-RPC SOAP SOAP SOAP SOAP SOAP XMLSOAP SOAP HTTP ...](https://static.fdocuments.us/doc/165x107/5aad6c0a7f8b9a2e088e2be0/soa-ceitautac-sahashemimy-research0-selected-papers2-scalability-flexibility.jpg)