(Translation from the Italian original which remains the ... · (Translation from the Italian...
155
(Translation from the Italian original which remains the definitive version) Interim financial report 30 June 2016 This document is available at: www.salini-impregilo.com Salini Impregilo S.p.A. Company managed and coordinated by Salini Costruttori S.p.A. Salini Impregilo S.p.A. Company managed and coordinated by Salini Costruttori S.p.A. Salini Impregilo S.p.A. Company managed and coordinated by Salini Costruttori S.p.A. Salini Impregilo S.p.A. Company managed and coordinated by Salini Costruttori S.p.A. Salini Impregilo S.p.A. Salini Impregilo S.p.A. Salini Impregilo S.p.A. Salini Impregilo S.p.A. Share capital €544,740,000 Registered office in Milan, Via dei Missaglia 97 Tax code and Milan Company Registration no. 00830660155 R.E.A. no. 525502 - VAT no. 02895590962
-
Upload
nguyenlien -
Category
Documents
-
view
231 -
download
0
Transcript of (Translation from the Italian original which remains the ... · (Translation from the Italian...
(Translation from the Italian original which remains the definitive version)
Interim financial report 30 June 2016
This document is available at:
www.salini-impregilo.com
Salini Impregilo S.p.A. Company managed and coordinated by Salini Costruttori S.p.A.Salini Impregilo S.p.A. Company managed and coordinated by Salini Costruttori S.p.A.Salini Impregilo S.p.A. Company managed and coordinated by Salini Costruttori S.p.A.Salini Impregilo S.p.A. Company managed and coordinated by Salini Costruttori S.p.A.
Salini Impregilo S.p.A.Salini Impregilo S.p.A.Salini Impregilo S.p.A.Salini Impregilo S.p.A. Share capital €544,740,000 Registered office in Milan, Via dei Missaglia 97 Tax code and Milan Company Registration no. 00830660155 R.E.A. no. 525502 - VAT no. 02895590962

1
Table of contents Table of contents Table of contents Table of contents
Company officers .............................................................................................................................................. 2
Key events of the period ................................................................................................................................... 3
Interim directors’ report - Part I ............................................................................................................................. 7
Financial highlights ............................................................................................................................................ 8
The Group’s performance in the first half of 2016 .......................................................................................... 10
Interim directors’ report - Part II .......................................................................................................................... 21
Performance by geographical segment .......................................................................................................... 22
Business risk management ............................................................................................................................. 40
Main risk factors and uncertainties ................................................................................................................. 44
Human resources and organisation ................................................................................................................ 66
Events after the reporting period ..................................................................................................................... 69
Outlook ............................................................................................................................................................ 70
Alternative performance indicators ................................................................................................................. 71
Other information ............................................................................................................................................ 72
Condensed interim consolidated financial statements as at and for the six months ended 30 June 2016 ........ 73
Notes to the condensed interim consolidated financial statements ................................................................ 81
Statement of financial position .................................................................................................................... 91
Income statement ...................................................................................................................................... 129
List of companies included in the consolidation scope ................................................................................. 142
Statement on the condensed interim consolidated financial statements ...................................................... 151
Independent Auditor’s Report ....................................................................................................................... 152

2
Company officersCompany officersCompany officersCompany officers
Board of directors (i) Chairperson Alberto Giovannini Chief executive officer Pietro Salini Directors Marco Bolgiani Marina Brogi Giuseppina Capaldo Mario Giuseppe Cattaneo Roberto Cera Nicola Greco Pietro Guindani Geert Linnebank Giacomo Marazzi Franco Passacantando Laudomia Pucci Alessandro Salini Grazia Volo Executive committee Chairperson Pietro Salini Alberto Giovannini Nicola Greco Giacomo Marazzi Risk and control committee Chairperson Mario Giuseppe Cattaneo Marco Bolgiani Giuseppina Capaldo Pietro Guindani Franco Passacantando Remuneration and appointment committee Chairperson Marina Brogi Nicola Greco Geert Linnebank Laudomia Pucci Related party transactions committee Chairperson Marco Bolgiani Marina Brogi Giuseppina Capaldo Geert Linnebank Board of statutory auditors (ii) Chairperson Alessandro Trotter Standing statutory auditors Teresa Cristiana Naddeo Gabriele Villa Substitute statutory auditors Roberta Battistin Marco Tabellini Independent auditors (iii) KPMG S.p.A.
(i) Appointed by the shareholders on 30 April 2015; in office until approval of the financial statements as at and for the year ending 31 December 2017.
(ii) Appointed by the shareholders on 30 April 2014; in office until approval of the financial statements as at and for the year ending 31 December 2016.
(iii) Engaged by the shareholders on 30 April 2015; term of engagement from 2015 to 2023

3
Key events of the period Key events of the period Key events of the period Key events of the period
January 2016January 2016January 2016January 2016
Lane Industries IncorporatedLane Industries IncorporatedLane Industries IncorporatedLane Industries Incorporated
On 4 January 2016, the acquisition of 100% of Lane Industries Incorporated (“Lane”) was finalised.
The consideration is roughly USD455 million. Salini Impregilo financed the acquisition with a bridge financing of €400 million, to be repaid in May 2017, obtained from a syndicate of five major international banks. It subsequently repaid the financing through a new bond issue redeemable in 2021.
Lane is one of the major highway contractor and top private asphalt producer in the United States. It is a family-owned business with more than 100 years of experience specialised in heavy civil construction and in the transportation infrastructure sector with 53 active projects in more than 20 states in the US and roughly 5,000 employees.
The company has three divisions: asphalt production, road projects and other infrastructure projects, in both domestic and international markets. Thanks to its strong track record, technical experience and the strategic
location of its materials plants, Lane is participating in some of the largest and most complex projects in the US, such as the construction of a highway in Florida, the I-4 Ultimate, an approximate USD2.3 billion contract, in which Lane has a 30% stake.
Lane’s acquisition represents another step in Salini Impregilo’s expansion into the US infrastructure market.
With Lane, Salini Impregilo will be able to access a much larger pool of projects. The US infrastructure and
transportation market is expected to grow at a faster rate than GDP on the back of a recovering economy, a positive demographic trend and the demand for significant upgrades and expansions of existing infrastructure (source: www.worldbank.org; PwC & Oxford Economics, “Future infrastructure spending in the US”, 2015). Lane’s entry into the Group will bring significant growth opportunities, while increasing the diversification of the portfolio and improving the balance of its exposure between developed and developing markets.
S7 Expressway S7 Expressway S7 Expressway S7 Expressway ---- PolandPolandPolandPoland
On 20 January 2016, the Group was awarded a €117 million contract to build a section of S7 Expressway
south of Krakow near the border with Slovakia.
The customer is the General Directorate of National Roads and Motorways (GDDKiA).
This contract increases the value of Salini Impregilo’s order backlog in the country and consolidates the Group’s leadership in the infrastructure sector in which the following roads are under construction: the S3 Nowa Sol - Legnica, the S8 Warsaw Bypass, the S7 Chęciny - Jędrzejów section and the A1 lot F, near Katowice.
4
High speed/capacity VeronaHigh speed/capacity VeronaHigh speed/capacity VeronaHigh speed/capacity Verona----Padua Railway ProjectPadua Railway ProjectPadua Railway ProjectPadua Railway Project
With its communication of 28 January 2016, Ansaldo STS S.p.A. informed its consortium partners of its
intention to transfer its entire investment in Consorzio Iricav Due to Salini Impregilo S.p.A. and Astaldi S.p.A..
The transaction, which will allow Salini Impregilo to increase its share by 8.12%, is subject to the approval of the consortium’s members and the issue of the required authorisation by the customer, R.F.I. S.p.A., without prejudice to the other consortium members’ right of first option at the same conditions and in line with their current investments in the consortium.
March 2016March 2016March 2016March 2016
Purple Line transit system in Maryland (USA) worth USD2 billionPurple Line transit system in Maryland (USA) worth USD2 billionPurple Line transit system in Maryland (USA) worth USD2 billionPurple Line transit system in Maryland (USA) worth USD2 billion
The Purple Line Transit Partners joint venture, which includes Lane Construction, was selected as the best
bidder for the design and construction of the Purple Line transit system worth USD2 billion. The contract includes the construction of 21 stations along a 16-mile alignment through Montgomery and Prince George’s counties in Maryland. The joint venture, in which Lane has a 30% share (for approximately USD600 million), includes Fluor Enterprises Inc. and Traylor Bros Inc. and will begin construction work before the end of 2016 for a slated completion date in 2022. In addition, Lane acquired a number of other contracts, including the South Carolina Port Access Road, as a joint venture with Fluor Enterprises Inc., worth approximately USD220
million during the period.
April 2016April 2016April 2016April 2016
SaleSaleSaleSale of Todini Costruzioni Generali S.p.A. of Todini Costruzioni Generali S.p.A. of Todini Costruzioni Generali S.p.A. of Todini Costruzioni Generali S.p.A.
On 4 April 2016, the parent sold its investment in Todini Costruzioni Generali to Prime System Kz Ltd. for roughly €51 million (see the subsequent section on the “Initial considerations on the comparability of data” for more information).
Perth rail contract worth AUD1,176 billionPerth rail contract worth AUD1,176 billionPerth rail contract worth AUD1,176 billionPerth rail contract worth AUD1,176 billion
On 28 April 2016, Salini Impregilo signed a 10-year contract worth approximately €790 million (AUD1.2 billion)
to design, construct and maintain an underground passenger rail line, which will connect the Forrestfield airport with central Perth (Australia). Salini Impregilo and NRW Pty Ltd, the two partners, signed the contract with the Government of Western Australia (WA).
The rail network’s total length will be 8.5 km, 8.0 km of which will be underground. Salini Impregilo and its
partner will build the three stations, twin tunnels for virtually the entire length of the line, car parks and service structures for the buses. The joint venture, in which Salini Impregilo is the lead contractor with an 80% stake, will complete the works in 2020.

5
May 2016May 2016May 2016May 2016
2016 2016 2016 2016 ---- 2019 business plan2019 business plan2019 business plan2019 business plan
On 20 May 2016, the parent’s board of directors approved the new business plan for the period from 2016 to 2019. Its aim is to consolidate Salini Impregilo’s leadership position in the complex large-scale infrastructures sector, confirming its number one place in the water cycle segment and continuing to develop its exceptional track record in the transport segment, specifically as regards metros, railways and roads. The plan focuses on cash generation. Growth is guaranteed by an order backlog that will provide roughly 70% of total revenue and
80% of the gross operating profit in the next four years. These forecasts are based on the medium to long-term macroeconomic situations in the various geographical areas in which the Group is present and the expected development of the infrastructure sector, estimated to show an average growth rate of above 3%, to be worth roughly USD8,000 billion. The book to bill ratio is forecast to be in the range of 1.1 or higher. The new contracts will mostly be carried out in developed areas with better risk profiles and returns. Profitability will
continue its excellent trend seen in the last two years, despite the rise in the costs necessary to benefit from the opportunities in the infrastructure market and the Group’s commitment to strengthen Lane’s organisational structure. The target gross operating profit margin for 2019 is above 10%. The new business plan’s success hinges on the Group maintaining a sound financial position, with the intention of improving the debt/EBITDA ratio, expected to be around 2/2.5x in 2019. Cash generation (cash flows before dividends) is essential for the successful achievement of the business plan’s objectives. Moreover, the Group’s acquisition of Lane at the
start of 2016 provides it with a new base for development in more stable areas, which will assist growth in less risky markets.
Koysha dam Koysha dam Koysha dam Koysha dam €€€€2.5 2.5 2.5 2.5 billion contract in Ethiopiabillion contract in Ethiopiabillion contract in Ethiopiabillion contract in Ethiopia
On 24 May 2016, Salini Impregilo won a new contract worth approximately €2.5 billion to build the Koysha dam awarded by Ethiopian Electric Power (EEP). This includes a hydroelectric plant with installed capacity of 2,200 MW and construction of a dam with a reservoir capacity of 6,000 million cubic metres and annual energy generation of 6,460 Gwh.
This important project, to be performed entirely by Salini Impregilo, together with GIBE III and GERD (the Grand Ethopian Renaissance Dam) on the Blue Nile, will enable Ethiopia to become Africa’s leader in terms of energy production.
June 2016June 2016June 2016June 2016
USD9USD9USD9USD955555555 million million million million contract in Kuwait contract in Kuwait contract in Kuwait contract in Kuwait
On 17 June 2016, Kuwait’s Public Authority for Housing Welfare assigned the contract for the construction of primary urbanisation works to build a new residential area in a 12 thousand hectares site located 40 km northwest of Kuwait City as part of the South Al Mutlaa Housing Project. The project, to be carried out by a
consortium led by Salini Impregilo with a 55% stake, includes, inter alia, the construction of 150 km of roads and related structures and numerous other works. The Kuwaiti parliament has approved a 2016-2020

6
development plan which includes investments totalling more than USD100 billion in infrastructure projects in the country, including the construction of thousands of homes, metro and railway networks and new refineries and industrial facilities.
Placement of new fivePlacement of new fivePlacement of new fivePlacement of new five----year bond issue year bond issue year bond issue year bond issue
On 24 June 2016, Salini Impregilo communicated its intention to issue bonds with a total nominal amount of approximately €428 million and a fixed rate coupon of 3.75% to institutional investors. It placed the bonds on the Irish Stock Exchange in Dublin on 24 June 2016. Some of the bonds (nominal amount of roughly €128 million) were assigned to the holders of the “€400.000.000 6.125% notes due 1 August 2018” that adhered to the parent’s exchange offer. The related exchange ratio for the existing bonds was 109.75%. After this exchange, the outstanding amount of the “€400.000.000 6.125% notes due 1 August 2018” was approximately
€283 million. The parent used the proceeds from the newly issued bonds (€300 million), to be redeemed on 24 June 2021 and not exchanged, to repay the bridge financing taken out to acquire Lane. This transaction extended the Group’s average debt repayment dates and increased the component of fixed rate debt.
The section on the “Events after the reporting period”, to which reference is made, describes the placement of another bond issue with a total nominal amount of approximately €172 million with institutional investors.
Salini Impregilo delivers the new Panama Canal Salini Impregilo delivers the new Panama Canal Salini Impregilo delivers the new Panama Canal Salini Impregilo delivers the new Panama Canal
The contract is one of the largest and most important civil engineering projects ever to take place. It involved the construction of two new series of locks, one on the Atlantic side and the other on the Pacific side, which
will allow an increase in commercial traffic through the Canal and better meet developments in the sea freight market with ships nearly three times bigger and with more tonnage than the ships that can currently use the existing locks (the Post Panamax ships).
During the period, all the civil and electromechanical works were finalised. On 31 May, the project was
functionally completed, as confirmed by the customer, and the new Canal was officially opened on 26 June.
The project carried out by the joint venture led by Salini Impregilo hinged on unique technical and design
solutions, such as, for example, a complex system of locks with sluice gates that allow the ships to rise 27
metres above sea level to enter Gatún Lake, one of the largest artificial lakes in the world. After crossing the
lake, the set of locks on the other side of the Canal brings the ships back down to sea level so that they can
exit the Canal.
7
Interim dInterim dInterim dInterim directorsirectorsirectorsirectors’’’’
report report report report ---- Part IPart IPart IPart I

8
Financial highlights Financial highlights Financial highlights Financial highlights
The acquisition of 100% of Lane was finalised on 4 January 2016.
The IFRS provide that a subsidiary shall be consolidated starting from the date when control is acquired. Therefore, the condensed interim consolidated financial statements at 30 June 2016 present the statement of
financial position figures at 31 December 2015 and the income statement figures as at and for the six months ended 30 June 2015 for comparative purposes that do not include Lane Group. It follows that the data for the first half of 2016 are not fully comparable.
In order to make these data more comparable with the corresponding period of 2015, this section sets out Salini Impregilo Group's key figures using the same consolidation scope.
The Group monitors the key figures of Lane Group for management purposes adjusting the IFRS figures to
present the results of the non-subsidiary joint ventures consolidated on a proportionate basis. These management accounts results (works under management), show the progress made on the contracts managed directly by Lane Industries or through its non-controlling investments in the joint ventures.
The subsequent section on “Initial considerations on the comparability of data - Lane Industries Incorporated”
provides more information on the following reconciliation of the adjusted key figures.
The paragraph “Alternative performance indicators” in the “Other information” section gives a definition of the financial statements indicators used to present the Group's highlights.
Consolidated income statementConsolidated income statementConsolidated income statementConsolidated income statement
1st half 20161st half 20161st half 20161st half 2016 1st half 20151st half 20151st half 20151st half 2015
(in millions of Euros(in millions of Euros(in millions of Euros(in millions of Euros)))) AdjustedAdjustedAdjustedAdjusted AdjustedAdjustedAdjustedAdjusted
Revenue 2,735.7 2,715.1
Gross operating profitGross operating profitGross operating profitGross operating profit 252252252252....8888 221221221221....3333
Gross operating profit margin (%) 9.2% 8.2%Operating profitOperating profitOperating profitOperating profit 129129129129....3333 112112112112....9999
R.o.S. 4.7% 4.2%
Net financing costs (44.6) (30.8)
Net gains (losses) on investments (3.3) 1.2
Profit before taxProfit before taxProfit before taxProfit before tax 81818181....4444 83838383....3333
Income tax expense (31.8) (35.5)
Profit from continuing operationsProfit from continuing operationsProfit from continuing operationsProfit from continuing operations 49494949....7777 47474747....8888
Loss from discontinued operations (20.4) (5.1)
Non-controlling interests (18.0) (9.9)
Profit attributable to the owners of the parentProfit attributable to the owners of the parentProfit attributable to the owners of the parentProfit attributable to the owners of the parent 11111111....2222 32323232....9999
9
Adjusted revenue for the period is €2,735.7 million compared to same-consolidation scope revenue of €2,715.1 million for the corresponding period of 2015. It includes revenue of the joint ventures not consolidated by Lane of €96.2 million and €98.7 million, respectively. The increase in the caption refers to some large contracts such as the GERD dam in Ethiopia, the Red Line North Underground in Qatar, the
Riyadh Metro Line 3 in Saudi Arabia, the Copenhagen Metro and Lane's ongoing projects.
The adjusted gross operating profit amounts to €252.8 million, up 14.2% on the corresponding period of 2015 while the adjusted operating profit of €129.3 million shows an improvement of about 14.5%.
The adjusted gross operating profit is equal to 9.2% of revenue and the adjusted R.o.S. is 4.7%.
Net financing costs approximately €44.6 million compared to €30.8 million for the corresponding period of 2015. The item comprises financial income of €21.9 million, net exchange rate gains of €2.1 million and
financial expense of €68.6 million.
The profit before tax amounts to €81.4 million, which is substantially in line with the balance for the first six months of 2015 (€83.3 million). The tax rate is roughly 39% compared to 42%.
The loss from discontinued operations is €20.4 million and mainly refers to the release of the transaction reserve (€13.9 million) after the sale of Todini Costruzioni Generali in April 2016.
Non-controlling interests amount to €18.0 million and principally comprises €8 million for the Al Bayt Stadium and the Red Line North Underground in Qatar, €3 million for Lane's projects, €2 million for the motorway contract in Colombia and €5 million for other projects.

10
The GroupThe GroupThe GroupThe Group’’’’s performance in the first half of 2016 s performance in the first half of 2016 s performance in the first half of 2016 s performance in the first half of 2016
Analysis of Salini Impregilo GroupAnalysis of Salini Impregilo GroupAnalysis of Salini Impregilo GroupAnalysis of Salini Impregilo Group’’’’s financial position and results of operations for the six s financial position and results of operations for the six s financial position and results of operations for the six s financial position and results of operations for the six monthsmonthsmonthsmonths
This section presents the Group’s reclassified income statement and statement of financial position and a
breakdown of its financial position at 30 June 2016. It also provides an overview of the main changes in the Group’s financial position and results of operations compared to the previous year. As shown later, the figures for the first half of 2016 are not fully comparable with those of the corresponding period of 2015 due to the acquisition of Lane on 4 January 2016.
Unless indicated otherwise, figures are provided in millions of Euros and those shown in brackets relate to the previous year.
The “Alternative performance indicators” paragraph in the “Other information” section gives a definition of the financial statements indicators used to present the Group’s financial position and results of operations for the six months.
Initial considerations on the comparability of dataInitial considerations on the comparability of dataInitial considerations on the comparability of dataInitial considerations on the comparability of data
Lane Industries IncorporatedLane Industries IncorporatedLane Industries IncorporatedLane Industries Incorporated
As described in the section on the key events of the period, the acquisition of 100% of Lane was finalised on 4 January 2016.
IFRS 10 – Consolidated financial statements provides that a subsidiary shall be consolidated starting from the date when control is acquired. Therefore, the condensed interim consolidated financial statements at 30 June 2016 present the statement of financial position figures at 31 December 2015 and the income statement
figures as at and for the six months ended 30 June 2015 for comparative purposes that do not include Lane Group. It follows that the data for the first half of 2016 are not fully comparable.
In order to make these data more comparable with the corresponding period of 2015, this section sets out Salini Impregilo Group's key figures using the same consolidation scope.
Composition of the combined data for the first half of 2015
The data have been obtained by combining the Group's key figures, restated compared to that shown in the
2015 interim financial report to consider the final disposal scope of Todini Costruzioni Generali, with the key figures of Lane Group, which are its consolidated figures at 30 June 2015 prepared in accordance with US GAAP.

11
Table ATable ATable ATable A
(€'000)
Salini ImpregiloSalini ImpregiloSalini ImpregiloSalini Impregilo
GroupGroupGroupGroup 1st1st1st1st half half half half
2015 (restated)2015 (restated)2015 (restated)2015 (restated)
LaneLaneLaneLane
GroupGroupGroupGroup
1st1st1st1st half 2015half 2015half 2015half 2015
Salini Impregilo Salini Impregilo Salini Impregilo Salini Impregilo
Group combined Group combined Group combined Group combined
with Lane with Lane with Lane with Lane
Industries GroupIndustries GroupIndustries GroupIndustries Group
1st half 20151st half 20151st half 20151st half 2015
Revenue 2,201,075 415,247 2,616,322
Gross operating profit (loss) 227,467 (22,497) 204,970
Gross operating profit (loss) margin % 10.3% -5.4%
Operating profit (loss) 126,443 (29,926) 96,517
R.o.S. % 5.7% -7.2%
Profit (loss) before non-controlling interests 60,298 (17,546) 42,752
Comparison of the 2016 and 2015 data using the same consolidation scope
The following table provides a comparison of Salini Impregilo Group's key figures for the reporting period with
the combined figures of the two groups for the first six months of 2015:
Table BTable BTable BTable B
(€'000)
Salini Impregilo Salini Impregilo Salini Impregilo Salini Impregilo
Group Group Group Group 1st1st1st1st half half half half
2016201620162016
Salini Impregilo Salini Impregilo Salini Impregilo Salini Impregilo
Group combined Group combined Group combined Group combined
with Lane with Lane with Lane with Lane
Industries GroupIndustries GroupIndustries GroupIndustries Group
1st1st1st1st half 2015half 2015half 2015half 2015 VariationVariationVariationVariation
Revenue 2,639,490 2,616,322 23,168
Gross operating profit 242,160 204,970 37,190
Gross operating profit margin % 9.2% 7.8%
Operating profit 118,635 96,517 22,118
R.o.S. % 4.5% 3.7%
Profit for the period before non-controlling interests 29,249 42,752 (13,503)
Management accounts presentation of the figures for the reporting period and the corresponding period of
2015 ("work under management")
The Group monitors the key figures of Lane Group for management purposes adjusting the IFRS figures to present the results of the non-subsidiary joint ventures consolidated on a proportionate basis. These management accounts results (works under management), show the progress made on the contracts managed directly by Lane Industries or through its non-controlling investments in the joint ventures.
12
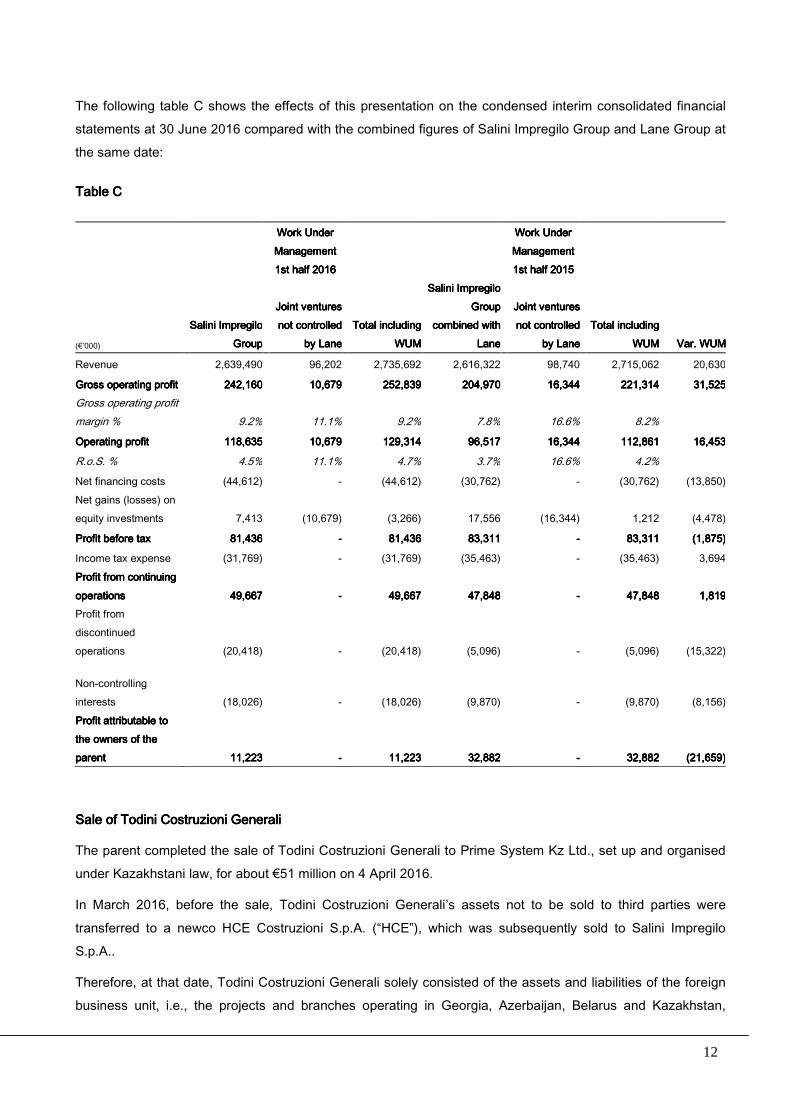
The following table C shows the effects of this presentation on the condensed interim consolidated financial statements at 30 June 2016 compared with the combined figures of Salini Impregilo Group and Lane Group at the same date:
Table CTable CTable CTable C
Work Under Work Under Work Under Work Under Management Management Management Management 1st half 1st half 1st half 1st half 2016201620162016
Work Under Work Under Work Under Work Under Management Management Management Management 1st half 20151st half 20151st half 20151st half 2015
(€’000) Salini ImpregilSalini ImpregilSalini ImpregilSalini Impregilo o o o
GroupGroupGroupGroup
Joint ventures Joint ventures Joint ventures Joint ventures not controlled not controlled not controlled not controlled
by Laneby Laneby Laneby LaneTotalTotalTotalTotal includingincludingincludingincluding
WUMWUMWUMWUM
Salini Impregilo Salini Impregilo Salini Impregilo Salini Impregilo Group Group Group Group
combined with combined with combined with combined with LaneLaneLaneLane
Joint ventures Joint ventures Joint ventures Joint ventures not controlled not controlled not controlled not controlled
by Laneby Laneby Laneby Lane TotalTotalTotalTotal includingincludingincludingincluding
WUMWUMWUMWUM Var. WUMVar. WUMVar. WUMVar. WUM
Revenue 2,639,490 96,202 2,735,692 2,616,322 98,740 2,715,062 20,630
Gross operating profitGross operating profitGross operating profitGross operating profit 242242242242,,,,160160160160 10101010,,,,679679679679 252252252252,,,,839839839839 204204204204,,,,970970970970 16161616,,,,344344344344 221221221221,,,,314314314314 31313131,,,,525525525525Gross operating profit margin % 9.2% 11.1% 9.2% 7.8% 16.6% 8.2%
Operating profitOperating profitOperating profitOperating profit 118118118118,,,,635635635635 10101010,,,,679679679679 129129129129,,,,314314314314 96969696,,,,517517517517 16161616,,,,344344344344 112112112112,,,,861861861861 16161616,,,,453453453453
R.o.S. % 4.5% 11.1% 4.7% 3.7% 16.6% 4.2%
Net financing costs (44,612) - (44,612) (30,762) - (30,762) (13,850)Net gains (losses) on equity investments 7,413 (10,679) (3,266) 17,556 (16,344) 1,212 (4,478)
Profit before taxProfit before taxProfit before taxProfit before tax 81818181,,,,436436436436 ---- 81818181,,,,436436436436 83838383,,,,311311311311 ---- 83838383,,,,311311311311 (1(1(1(1,,,,875)875)875)875)
Income tax expense (31,769) - (31,769) (35,463) - (35,463) 3,694Profit from continuing Profit from continuing Profit from continuing Profit from continuing operationsoperationsoperationsoperations 49494949,,,,667667667667 ---- 49494949,,,,667667667667 47474747,,,,848848848848 ---- 47474747,,,,848848848848 1111,,,,819819819819Profit from discontinued operations (20,418) - (20,418) (5,096) - (5,096) (15,322)
Non-controlling interests (18,026) - (18,026) (9,870) - (9,870) (8,156)Profit attributable to Profit attributable to Profit attributable to Profit attributable to the owners of the the owners of the the owners of the the owners of the parentparentparentparent 11111111,,,,223223223223 ---- 11111111,,,,223223223223 32323232,,,,882882882882 ---- 32323232,,,,882882882882 (21(21(21(21,,,,659)659)659)659)
Sale of Todini Costruzioni GeneraliSale of Todini Costruzioni GeneraliSale of Todini Costruzioni GeneraliSale of Todini Costruzioni Generali
The parent completed the sale of Todini Costruzioni Generali to Prime System Kz Ltd., set up and organised under Kazakhstani law, for about €51 million on 4 April 2016.
In March 2016, before the sale, Todini Costruzioni Generali’s assets not to be sold to third parties were
transferred to a newco HCE Costruzioni S.p.A. (“HCE”), which was subsequently sold to Salini Impregilo S.p.A..
Therefore, at that date, Todini Costruzioni Generali solely consisted of the assets and liabilities of the foreign business unit, i.e., the projects and branches operating in Georgia, Azerbaijan, Belarus and Kazakhstan,
13
including the carrying amount of the investments in the subsidiaries carrying out the relevant projects, JV Todini Takenaka and Todini Central Asia, as well as some operating assets either owned directly by the Group or leased.
The assets transferred to HCE included those belonging to Business unit A - Contracts in Italy, which include
the Metrocampania (Naples Alifana and Secondigliano) contracts, the Valico crossing and Naples Sarno River contracts and the plant and machinery at the Lungavilla depot. The Group has received an expression of interest in acquiring this business unit from third parties and the related negotiations are in place. Therefore, it has continued to recognise the assets as non-current assets held for sale.
The breakdown of the subgroup Todini Costruzioni Generali was different in the condensed interim consolidated financial statements at 30 June 2015 based on the expressions of interest received at that date.
It was necessary to restate the comparative figures for the first half of 2015 to be consistent with the approach used in the reporting period pursuant to IFRS 5.
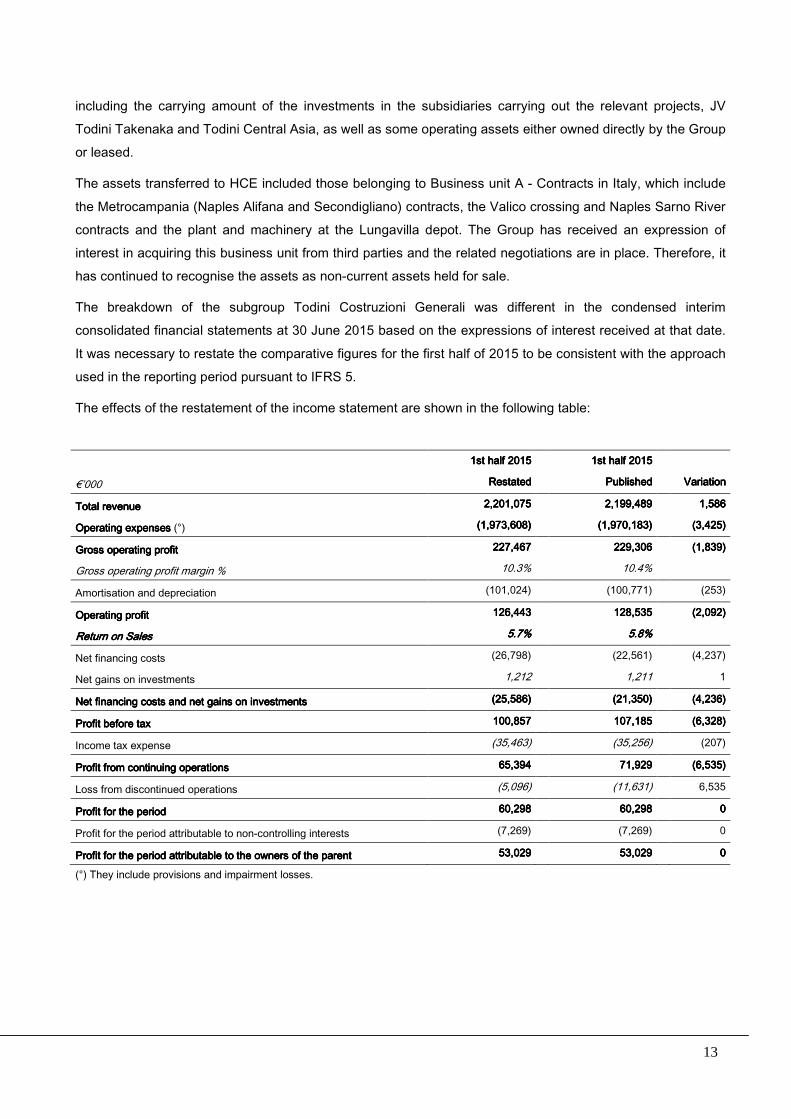
The effects of the restatement of the income statement are shown in the following table:
1st half 20151st half 20151st half 20151st half 2015 1st half 20151st half 20151st half 20151st half 2015
€’000 RestatedRestatedRestatedRestated PublishedPublishedPublishedPublished VariationVariationVariationVariation
Total revenueTotal revenueTotal revenueTotal revenue 2,201,0752,201,0752,201,0752,201,075 2,199,4892,199,4892,199,4892,199,489 1,5861,5861,5861,586
Operating expenses Operating expenses Operating expenses Operating expenses (°) (1,973,608(1,973,608(1,973,608(1,973,608)))) (1,970,183)(1,970,183)(1,970,183)(1,970,183) (3,425(3,425(3,425(3,425))))
Gross operating profit Gross operating profit Gross operating profit Gross operating profit 227,4227,4227,4227,466667777 229,306229,306229,306229,306 (1,8(1,8(1,8(1,839393939))))
Gross operating profit margin % 10.3% 10.4%
Amortisation and depreciation (101,024) (100,771) (253)
Operating profit Operating profit Operating profit Operating profit 126,443126,443126,443126,443 128,535128,535128,535128,535 (2,092(2,092(2,092(2,092))))
Return on SalesReturn on SalesReturn on SalesReturn on Sales 5.7%5.7%5.7%5.7% 5.8%5.8%5.8%5.8%
Net financing costs (26,798) (22,561) (4,237)
Net gains on investments 1,212 1,211 1
Net financing costs and net gains on investmentsNet financing costs and net gains on investmentsNet financing costs and net gains on investmentsNet financing costs and net gains on investments (25,586)(25,586)(25,586)(25,586) (21,350)(21,350)(21,350)(21,350) (4,236)(4,236)(4,236)(4,236)
Profit Profit Profit Profit before taxbefore taxbefore taxbefore tax 100,8100,8100,8100,855557777 107,185107,185107,185107,185 (6,32(6,32(6,32(6,328888))))
Income tax expense (35,463) (35,256) (207)
Profit from continuing operationsProfit from continuing operationsProfit from continuing operationsProfit from continuing operations 65,39465,39465,39465,394 71,92971,92971,92971,929 (6,535)(6,535)(6,535)(6,535)
Loss from discontinued operations (5,096) (11,631) 6,535
Profit for the periodProfit for the periodProfit for the periodProfit for the period 60,29860,29860,29860,298 60,29860,29860,29860,298 0000
Profit for the period attributable to non-controlling interests (7,269) (7,269) 0
Profit for the period attributable to the owners of the parentProfit for the period attributable to the owners of the parentProfit for the period attributable to the owners of the parentProfit for the period attributable to the owners of the parent 53,02953,02953,02953,029 53,02953,02953,02953,029 0000
(°) They include provisions and impairment losses.

14
Group performanceGroup performanceGroup performanceGroup performance Table 1 Table 1 Table 1 Table 1 ---- Reclassified consolidated income statementReclassified consolidated income statementReclassified consolidated income statementReclassified consolidated income statement
Note (*) 1st half 20161st half 20161st half 20161st half 2016 1st half 20151st half 20151st half 20151st half 2015 VariationVariationVariationVariation
(€’000) (§)
Revenue 2,568,597 2,137,187 431,410
Other income 70,893 63,888 7,005
Total revenueTotal revenueTotal revenueTotal revenue 31 2,639,4902,639,4902,639,4902,639,490 2,201,0752,201,0752,201,0752,201,075 438,415438,415438,415438,415
Operating expenses (°) 32 (2,397,330) (1,973,608) (423,722)
Gross operating profit Gross operating profit Gross operating profit Gross operating profit 242,160242,160242,160242,160 227,46227,46227,46227,467777 14,6914,6914,6914,693333
Gross operating profit margin % 9.2% 10.3%
Amortisation and depreciation 32 (123,525) (101,024) (22,501)
Operating profit Operating profit Operating profit Operating profit 118,635118,635118,635118,635 126,44126,44126,44126,443333 (7,80(7,80(7,80(7,808888))))
Return on Sales % 4.5% 5.7% Financing income (costs) and gains (losses) on Financing income (costs) and gains (losses) on Financing income (costs) and gains (losses) on Financing income (costs) and gains (losses) on investmentsinvestmentsinvestmentsinvestments
Net financing costs 33 (44,612) (26,798) (17,814)
Net gains on investments 34 7,413 1,212 6,201
Net financing costs and net gains on investmentsNet financing costs and net gains on investmentsNet financing costs and net gains on investmentsNet financing costs and net gains on investments (37,199)(37,199)(37,199)(37,199) (25,586)(25,586)(25,586)(25,586) (11,613)(11,613)(11,613)(11,613)
Profit before taxProfit before taxProfit before taxProfit before tax 81,43681,43681,43681,436 100,85100,85100,85100,857777 (19,42(19,42(19,42(19,421111))))
Income tax expense 35 (31.769) (35.463) 3,694
Profit from continuing Profit from continuing Profit from continuing Profit from continuing operationsoperationsoperationsoperations 49,66749,66749,66749,667 65,39465,39465,39465,394 (15,727)(15,727)(15,727)(15,727)
Loss from discontinued operations 18 (20.418) (5.096) (15.322)
Profit for the periodProfit for the periodProfit for the periodProfit for the period 29,24929,24929,24929,249 60,29860,29860,29860,298 (31,049)(31,049)(31,049)(31,049)
Non-controlling interests (18,026) (7,269) (10,757)
Profit for the period attributable Profit for the period attributable Profit for the period attributable Profit for the period attributable to the owners of the to the owners of the to the owners of the to the owners of the parentparentparentparent 11,22311,22311,22311,223 53,02953,02953,02953,029 (41,806)(41,806)(41,806)(41,806)
(*) The note numbers refer to the notes to the condensed interim consolidated financial statements where the items are analysed in detail.
(°) They include provisions and impairment losses of €3,090 thousand.
(§) The income statement for the first half of 2015 was restated to comply with IFRS 5 given the disposal scope of Todini Costruzioni Generali Group. The figures in this column do not include Lane acquired on 4 January 2016.
RevenueRevenueRevenueRevenue
Total revenue for the period is €2,639.5 million (€2,201.1 million), including €2,391.3 million earned abroad
(€1,816.9 million).
The 19.9% increase on the corresponding period of 2015 is mainly due to the inclusion of Lane in the consolidation scope.
“Other income” mostly refers to contract work in progress and specifically industrial activities and related works
not directly related to contracts with customers.
15
Operating profit Operating profit Operating profit Operating profit
The gross operating profit and the operating profit for the period amount to €242.2 million and €118.6 million, respectively, with a gross operating profit margin of 9.2% (10.3%) and a R.o.S. of 4.5% (5.7%). The reduction in the two margins is mainly due to seasonality factors related to Lane.
The central units’ costs and other general expenses for the period come to approximately €58.7 million (€ 61.0
million).
The operating profit generated by the foreign operations amounts to €170.5 million, while that recorded by the Italian operations, excluding the corporate costs, totals €6.8 million.
Financing income (costs) and gains (losses) on investmentsFinancing income (costs) and gains (losses) on investmentsFinancing income (costs) and gains (losses) on investmentsFinancing income (costs) and gains (losses) on investments
The Group recorded net financing costs of €44.6 million (€26.8 million) while net gains on investments amount to €7.4 million (€1.2 million).
Net financing costs include financial income of €21.9 million, financial expense of €68.6 million and net exchange rate gains of €2.1 million. The €17.8 million increase in the item is mainly due to the Group’s larger gross financial indebtedness as a result of its acquisition of Lane. Moreover, its results are affected by financial expense arising from the application of the amortised cost method during the period for €15.2 million
(€5.9 million), including €7.7 million for the financial debt restructuring that took place at the end of the period.
Net exchange rate gains amount to €2.1 million (€4.0 million).
Income tax expenseIncome tax expenseIncome tax expenseIncome tax expense
The income tax expense for the period is €31.8 million (€35.5 million), calculated using the effective rate of 39%.
Loss from discontinued operationsLoss from discontinued operationsLoss from discontinued operationsLoss from discontinued operations
The loss from discontinued operations amounts to €20.4 million (loss of €5.1 million) and includes:
- the release of the translation reserve of €13.9 million related to the foreign operations of Todini Costruzioni Generali sold on 4 April 2016;
- the gain on the disposal of assets of €1.4 million again belonging to Todini Costruzioni Generali;
- the loss of HCE’s Italian business unit of €7.2 million.
NonNonNonNon----controlling interestscontrolling interestscontrolling interestscontrolling interests
Non-controlling interests amount to €18.0 million (€7.3 million), mainly related to the subsidiaries working on the contracts for the Al Bayt Stadium in Qatar (€4.1 million), the Red Line North Underground in Qatar (€3.9 million) and some entities following acquisition of Lane (€3.0 million).
16
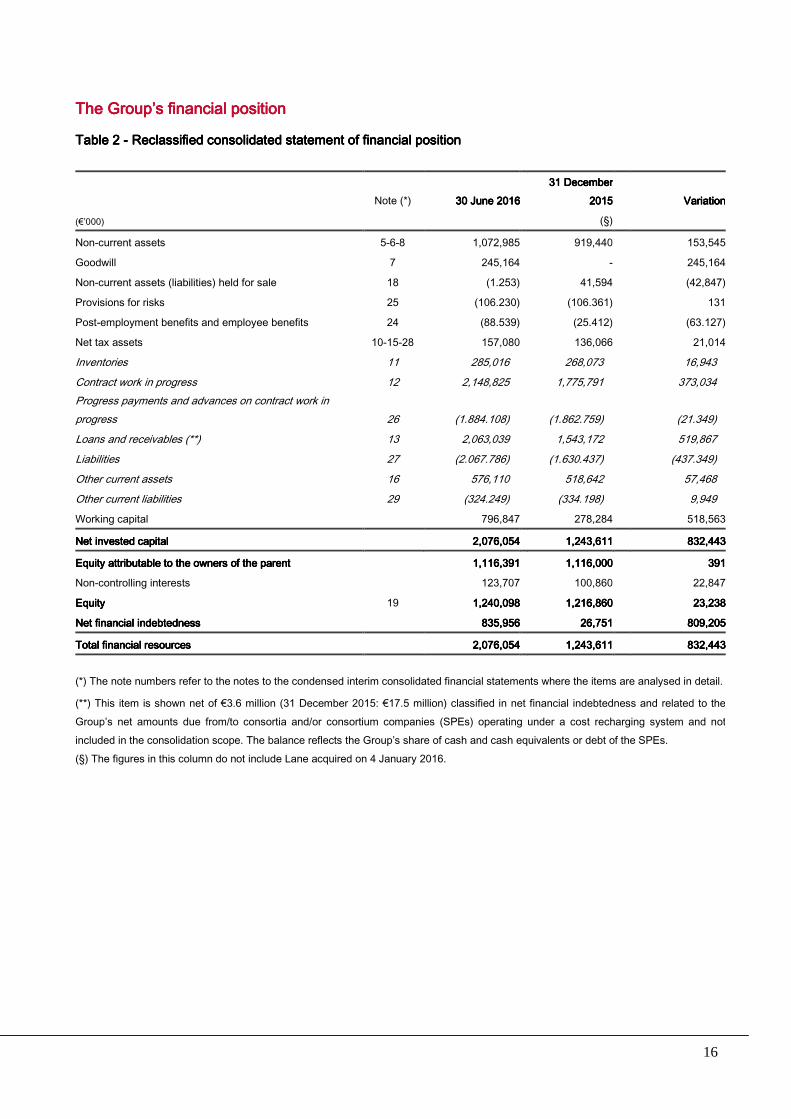
The The The The GGGGrouprouprouproup’’’’s financial positions financial positions financial positions financial position Table 2 Table 2 Table 2 Table 2 ---- Reclassified consolidated statement of financial positionReclassified consolidated statement of financial positionReclassified consolidated statement of financial positionReclassified consolidated statement of financial position
Note (*) 30 June 201630 June 201630 June 201630 June 201631 December 31 December 31 December 31 December
2015201520152015 Variation Variation Variation Variation
(€’000) (§)
Non-current assets 5-6-8 1,072,985 919,440 153,545
Goodwill 7 245,164 - 245,164
Non-current assets (liabilities) held for sale 18 (1.253) 41,594 (42,847)
Provisions for risks 25 (106.230) (106.361) 131
Post-employment benefits and employee benefits 24 (88.539) (25.412) (63.127)
Net tax assets 10-15-28 157,080 136,066 21,014
Inventories 11 285,016 268,073 16,943
Contract work in progress 12 2,148,825 1,775,791 373,034 Progress payments and advances on contract work in progress 26 (1.884.108) (1.862.759) (21.349)
Loans and receivables (**) 13 2,063,039 1,543,172 519,867
Liabilities 27 (2.067.786) (1.630.437) (437.349)
Other current assets 16 576,110 518,642 57,468
Other current liabilities 29 (324.249) (334.198) 9,949
Working capital 796,847 278,284 518,563
Net invested capitalNet invested capitalNet invested capitalNet invested capital 2,076,0542,076,0542,076,0542,076,054 1,243,6111,243,6111,243,6111,243,611 832,443832,443832,443832,443
Equity attributable to the owners of the parentEquity attributable to the owners of the parentEquity attributable to the owners of the parentEquity attributable to the owners of the parent 1,116,3911,116,3911,116,3911,116,391 1,116,0001,116,0001,116,0001,116,000 391391391391
Non-controlling interests 123,707 100,860 22,847
EquityEquityEquityEquity 19 1,240,0981,240,0981,240,0981,240,098 1,216,8601,216,8601,216,8601,216,860 23,23823,23823,23823,238
Net financial Net financial Net financial Net financial indebtednessindebtednessindebtednessindebtedness 835,956835,956835,956835,956 26,75126,75126,75126,751 809,205809,205809,205809,205
Total financial resourcesTotal financial resourcesTotal financial resourcesTotal financial resources 2,076,0542,076,0542,076,0542,076,054 1,243,6111,243,6111,243,6111,243,611 832,443832,443832,443832,443
(*) The note numbers refer to the notes to the condensed interim consolidated financial statements where the items are analysed in detail.
(**) This item is shown net of €3.6 million (31 December 2015: €17.5 million) classified in net financial indebtedness and related to the Group’s net amounts due from/to consortia and/or consortium companies (SPEs) operating under a cost recharging system and not included in the consolidation scope. The balance reflects the Group’s share of cash and cash equivalents or debt of the SPEs. (§) The figures in this column do not include Lane acquired on 4 January 2016.

17
Net invested Net invested Net invested Net invested capitalcapitalcapitalcapital
This item increased by €832.4 million on the previous year end to €2,076.1 million at 30 June 2016. The main changes are due to the factors listed below.
NonNonNonNon----current assetscurrent assetscurrent assetscurrent assets
Non-current assets increased by €153.5 million. They may be analysed as follows:
(€’000) 30 June 201630 June 201630 June 201630 June 2016 31 December 201531 December 201531 December 201531 December 2015 VariationVariationVariationVariation
Property, plant and equipment 709,866 594,365 115,501
Intangible assets 185,380 193,821 (8,441)
Equity investments 177,739 131,254 46,485
Total nonTotal nonTotal nonTotal non----current assetscurrent assetscurrent assetscurrent assets 1,1,1,1,072,985072,985072,985072,985 919,440919,440919,440919,440 153,545153,545153,545153,545
Property, plant and equipment increased by €115.5 million, mostly as a result of:
- the change in the consolidation scope of €115.1 million due to the acquisition of Lane and Lane Group’s acquisitions of assets for €11.2 million from Asphalt Roads and materials Company Inc.;
- investments mostly made to the high speed/capacity Milan - Genoa railway section in Italy and the Riyadh Metro Line 3 in Saudi Arabia, the Ruta del Sol contract in Colombia, the Nenskra hydroelectric project in Georgia and Lane Group’s investments (€137.3 million);
- depreciation for the period (€108.0 million).
Intangible assets show a net decrease of €8.4 million mainly due to:
- inclusion of Lane in the consolidation scope (€5.1 million);
- amortisation of the period (€15,5 million).
The increase in the equity investments is principally due to the investments in joint ventures acquired with Lane.
GoodwillGoodwillGoodwillGoodwill
This caption refers to the acquisition of Lane Group (€224.3 million) and assets from Asphalt Roads and
Materials Company Inc. (€20.9 million). The Group calculated these balances on a provisional basis at the acquisition date as it availed of the 12-month PPA period allowed by (revised) IFRS 3.
NonNonNonNon----current assets (liabilities) held for salecurrent assets (liabilities) held for salecurrent assets (liabilities) held for salecurrent assets (liabilities) held for sale
Net non-current liabilities held for sale at 30 June 2016 amount to €1.3 million and include the net assets
(liabilities) of the following units:

18
- HCE’s business unit A – Italian operating contracts with net liabilities of €6.9 million; and
- the USW Campania projects’ net assets of €5.7 million, unchanged from 31 December 2015.
At 31 December 2015, the caption also included Todini Costruzioni Generali’s net assets of €35.9 million (sold in the second quarter of 2016).
Provisions for risksProvisions for risksProvisions for risksProvisions for risks
These provisions of €106.2 million are substantially unchanged from the previous year end.
Net tax assets Net tax assets Net tax assets Net tax assets
The following table analyses the item:
€’000 30 June 201630 June 201630 June 201630 June 2016 31 31 31 31 December 2015December 2015December 2015December 2015 VariationVariationVariationVariation
Deferred tax assets 63,269 64,064 (795)Deferred tax liabilities (45,543) (55,857) 10,314Net deferred tax assetsNet deferred tax assetsNet deferred tax assetsNet deferred tax assets 17,72617,72617,72617,726 8,2078,2078,2078,207 9,5199,5199,5199,519Current tax assets 119,638 114,577 5,061Current tax liabilities (65,764) (68,273) 2,509Net current tax assetsNet current tax assetsNet current tax assetsNet current tax assets 53,87453,87453,87453,874 46,30446,30446,30446,304 7,5707,5707,5707,570Other current tax assets 140,931 142,652 (1,721)Other current tax liabilities (55,451) (61,097) 5,646
Net other current tax assetsNet other current tax assetsNet other current tax assetsNet other current tax assets 85,48085,48085,48085,480 81,55581,55581,55581,555 3,9253,9253,9253,925
Net tax assetsNet tax assetsNet tax assetsNet tax assets 157,080157,080157,080157,080 136,066136,066136,066136,066 21,01421,01421,01421,014
The increase in this caption is mainly due to the Group’s tax expense for the period, considering the foreign branches and the changes in the consolidation scope.
Working capitalWorking capitalWorking capitalWorking capital
Working capital increased by €518.6 million from €278.3 million to €796.8 million.
The main changes in the individual items making up net working capital are summarised below:
• inventories increased by €16.9 million to €285.0 million due to the combined effect of the consolidation of Lane, partly offset by the consumption of materials for the Group’s main contracts;
• contract work in progress increased to €2,148.8 million at the reporting date (€1,775.8 million) and includes foreign contracts (€1,731.4 million) and Italian contracts (€417.4 million). The €373.0 million
increase is the sum of €17.8 million for the Italian contracts and €355.3 million for the foreign contracts. It reflects production progress calculated using the most recent estimates of the ongoing projects’ profitability. The rise in contract work in progress is due to the high speed/capacity Milan - Genoa railway section in Italy and to the contracts in Qatar (€120.0 million), Australia (€54.2 million) and
19
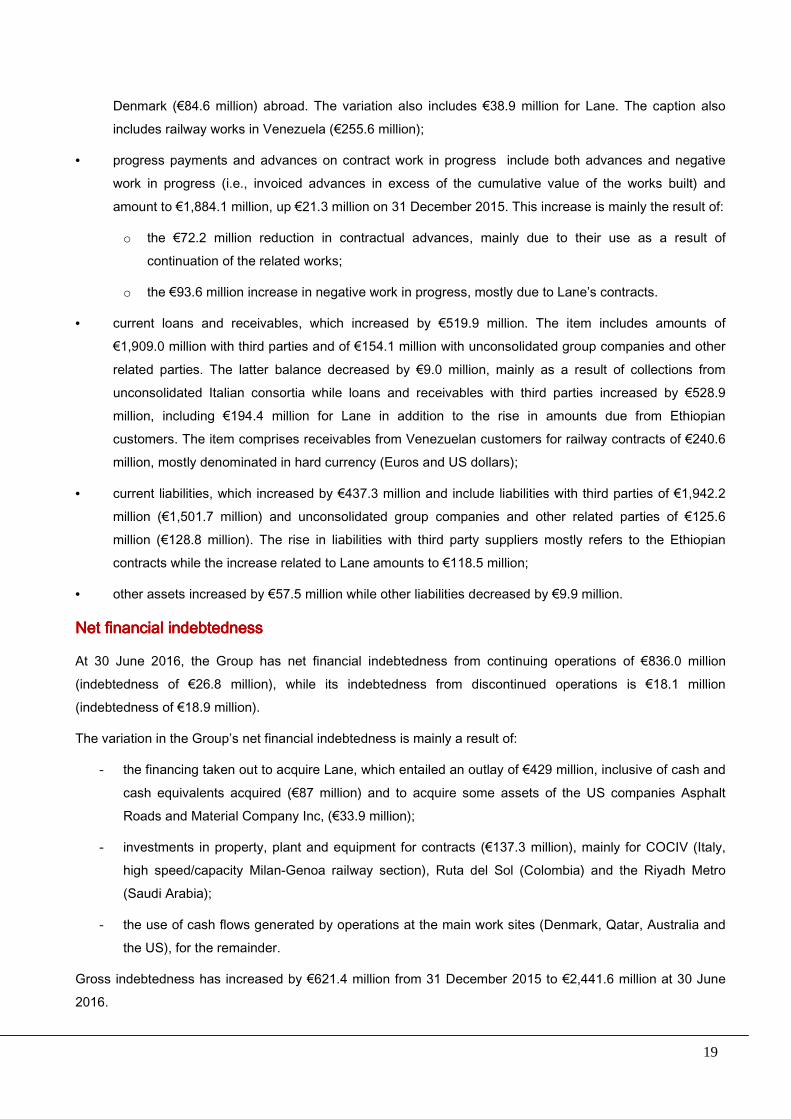
Denmark (€84.6 million) abroad. The variation also includes €38.9 million for Lane. The caption also includes railway works in Venezuela (€255.6 million);
• progress payments and advances on contract work in progress include both advances and negative work in progress (i.e., invoiced advances in excess of the cumulative value of the works built) and
amount to €1,884.1 million, up €21.3 million on 31 December 2015. This increase is mainly the result of:
o the €72.2 million reduction in contractual advances, mainly due to their use as a result of continuation of the related works;
o the €93.6 million increase in negative work in progress, mostly due to Lane’s contracts.
• current loans and receivables, which increased by €519.9 million. The item includes amounts of €1,909.0 million with third parties and of €154.1 million with unconsolidated group companies and other
related parties. The latter balance decreased by €9.0 million, mainly as a result of collections from unconsolidated Italian consortia while loans and receivables with third parties increased by €528.9 million, including €194.4 million for Lane in addition to the rise in amounts due from Ethiopian customers. The item comprises receivables from Venezuelan customers for railway contracts of €240.6 million, mostly denominated in hard currency (Euros and US dollars);
• current liabilities, which increased by €437.3 million and include liabilities with third parties of €1,942.2 million (€1,501.7 million) and unconsolidated group companies and other related parties of €125.6 million (€128.8 million). The rise in liabilities with third party suppliers mostly refers to the Ethiopian contracts while the increase related to Lane amounts to €118.5 million;
• other assets increased by €57.5 million while other liabilities decreased by €9.9 million.
Net financial Net financial Net financial Net financial indebtednessindebtednessindebtednessindebtedness
At 30 June 2016, the Group has net financial indebtedness from continuing operations of €836.0 million (indebtedness of €26.8 million), while its indebtedness from discontinued operations is €18.1 million (indebtedness of €18.9 million).
The variation in the Group’s net financial indebtedness is mainly a result of:
- the financing taken out to acquire Lane, which entailed an outlay of €429 million, inclusive of cash and
cash equivalents acquired (€87 million) and to acquire some assets of the US companies Asphalt Roads and Material Company Inc, (€33.9 million);
- investments in property, plant and equipment for contracts (€137.3 million), mainly for COCIV (Italy, high speed/capacity Milan-Genoa railway section), Ruta del Sol (Colombia) and the Riyadh Metro (Saudi Arabia);
- the use of cash flows generated by operations at the main work sites (Denmark, Qatar, Australia and the US), for the remainder.
Gross indebtedness has increased by €621.4 million from 31 December 2015 to €2,441.6 million at 30 June 2016.

20
The debt/equity ratio (based on the net financial indebtedness from continuing operations), at the reporting date, is 0.67 at group level.
The net financial indebtedness from discontinued operations relates to HCE’s business units.
Salini Impregilo has given guarantees of €339.6 million in favour of unconsolidated group companies securing
bank loans.
The Group’s net financial indebtedness at 30 June 2016 is summarised in the following table. Table 3 Table 3 Table 3 Table 3 ---- Net financial indebtedness of Salini Impregilo Net financial indebtedness of Salini Impregilo Net financial indebtedness of Salini Impregilo Net financial indebtedness of Salini Impregilo GroupGroupGroupGroup
(€’000) Note (*) 30 June 201630 June 201630 June 201630 June 2016 31 December 201531 December 201531 December 201531 December 2015 VariationVariationVariationVariation
(§)
Non-current financial assets 9 69,988 67,832 2,156
Current financial assets 14 363,417 312,104 51,313
Cash and cash equivalents 17 1,176,680 1,410,775 (234,095)
Total cash and cash equivalents and other financial assetsTotal cash and cash equivalents and other financial assetsTotal cash and cash equivalents and other financial assetsTotal cash and cash equivalents and other financial assets 1,610,0851,610,0851,610,0851,610,085 1,790,7111,790,7111,790,7111,790,711 (180,626)(180,626)(180,626)(180,626)
Bank and other loans and borrowings 20 (843,318) (745,554) (97,764)
Bonds 21 (692,296) (396,211) (296,085)
Finance lease liabilities 22 (102,226) (79,789) (22,437)
Total nonTotal nonTotal nonTotal non----current indebtednesscurrent indebtednesscurrent indebtednesscurrent indebtedness (1(1(1(1,,,,637637637637,,,,840)840)840)840) (1(1(1(1,,,,221221221221,,,,554)554)554)554) (416(416(416(416,,,,286)286)286)286)
Current portion of bank loans and borrowings and current account facilities
20. (733,418) (538,802) (194,616)
Current portion of bonds 21 (16,084) (10,203) (5,881)
Current portion of finance lease liabilities 22 (54,218) (49,617) (4,601)
Total current indebtednessTotal current indebtednessTotal current indebtednessTotal current indebtedness (803,720)(803,720)(803,720)(803,720) (598,622)(598,622)(598,622)(598,622) (205,098)(205,098)(205,098)(205,098)
Derivative liabilities 23 (8,104) (14,798) 6,694
Net financial position with unconsolidated SPEs (**) 3,623 17,512 (13,889)
Total other financial assets (liabilities)Total other financial assets (liabilities)Total other financial assets (liabilities)Total other financial assets (liabilities) (4,481)(4,481)(4,481)(4,481) 2,7142,7142,7142,714 (7,195)(7,195)(7,195)(7,195)
Net financial indebtedness Net financial indebtedness Net financial indebtedness Net financial indebtedness ---- continuing operationscontinuing operationscontinuing operationscontinuing operations (835,956)(835,956)(835,956)(835,956) (26,751)(26,751)(26,751)(26,751) (809,205)(809,205)(809,205)(809,205)
Net financial indebtedness - discontinued operations (18,082) (18,939) 857
Net financial indebtedness including discontinued Net financial indebtedness including discontinued Net financial indebtedness including discontinued Net financial indebtedness including discontinued operationsoperationsoperationsoperations (854(854(854(854,,,,038)038)038)038) (45(45(45(45,,,,690)690)690)690) (808(808(808(808,,,,348)348)348)348)
(*) The note numbers refer to the notes to the condensed interim consolidated financial statements where the items are analysed in detail. (**) This item shows the Group’s net amounts due from/to unconsolidated consortia and/or consortium companies operating under a cost recharging system. The balance reflects the Group’s share of cash and cash equivalents or debt of the SPEs. The balances are shown under trade receivables and payables in the condensed interim consolidated financial statements. (§)The figures in this column do not include Lane acquired on 4 January 2016.

21
Interim dInterim dInterim dInterim directorsirectorsirectorsirectors’’’’
report report report report ---- Part IIPart IIPart IIPart II

22
Performance by geographical segmentPerformance by geographical segmentPerformance by geographical segmentPerformance by geographical segment
ItalyItalyItalyItaly
The Group operates in the construction and concessions sectors in Italy.
Macroeconomic scenarioMacroeconomic scenarioMacroeconomic scenarioMacroeconomic scenario
Italy’s development prospects have become more positive and the country has resumed growth. The OECD ranked Italy as one of the Eurozone economies with the highest growth rates of the year, thanks to the improved labour market conditions and the related upturn in domestic consumption. The 2015 budget deficit
decreased to 2.6% of GDP and is expected to continue this trend, mainly as a result of the economy’s cyclical recovery and the lower interest rates.
GDP is forecast to grow by 1% in 2016 and 1.4% in 2017, driven mainly by household consumption. The rise in employment has temporarily slowed down while domestic spending is boosted by the increase in
consumption. Investments have picked up, thus also assisting internal demand despite the lending constraints put in place by banks hindering a faster recovery.
The government has reiterated its commitment to gradual tax consolidation and a structural reform
programme. In order to create the fiscal space needed to increase public investments and avoid increasing indirect taxes, as planned for 2017, the government intends to resort to the budget flexibility clause provided for by the EU while concurrently containing public spending.
The collapse in investments caused by the economic crisis, which triggered a long-term deceleration of the
economy, was followed by an upturn in the production of investment goods. Together with the low recorded by the construction sector, this could herald a possible reversal in the investments cycle, although the scarce bank funding available and uncertainty about future demand continue to hold back this positive trend.
The outlook for growth is improving and Italy has continued its exit from the second recession which started in the summer of 2011 and continued until autumn 2014, just after the shorter but more intense crisis of 2008/2009. The speed of its recovery is strongly influenced by the international economic climate. The structural reform programme’s positive status is assisting consolidation of long-term forecasts even though there is much ground to cover to improve the country’s productivity and efficiency. Any delays in implementing its ambitious public investment programme will slow down its recovery. In addition, Brexit and renewed
volatility in the Eurozone’s financial markets may propagate risks and increase the cost of borrowing, which would increase the tax burden.

23
ConstructionConstructionConstructionConstruction
The order backlog for the Italian construction segment is as follows:
Area
Residual backlog at 30 June 2016 Percentage of total
High speed/capacity 5,857.4 65.8%
Other projects 3,049.8 34.2%
TotalTotalTotalTotal 8,907.28,907.28,907.28,907.2 100.0%100.0%100.0%100.0%
The following chart provides a breakdown of the order backlog by type of business:
Breakdown of the Italian construction order backlogBreakdown of the Italian construction order backlogBreakdown of the Italian construction order backlogBreakdown of the Italian construction order backlog
(Share in millions of Euros)
Project Residual backlog Percentage of completion
Cociv Lot 1-6 3,743.9 17.4%
Iricav 2 2,110.2 -
Other 3.3
High speed/capacityHigh speed/capacityHigh speed/capacityHigh speed/capacity 5,857.45,857.45,857.45,857.4
Broni - Mortara 981.5 -
Metro B 946.3 0.1%
Milan Metro Line 4 402.8 21.2%
Jonica state highway 106 336.2 2.6%
Other 383.0
Other work in ItalyOther work in ItalyOther work in ItalyOther work in Italy 3,049.83,049.83,049.83,049.8
TotalTotalTotalTotal 8,907.8,907.8,907.8,907.2222
34.2%
65.8%
Other projects High speed/capacity
24
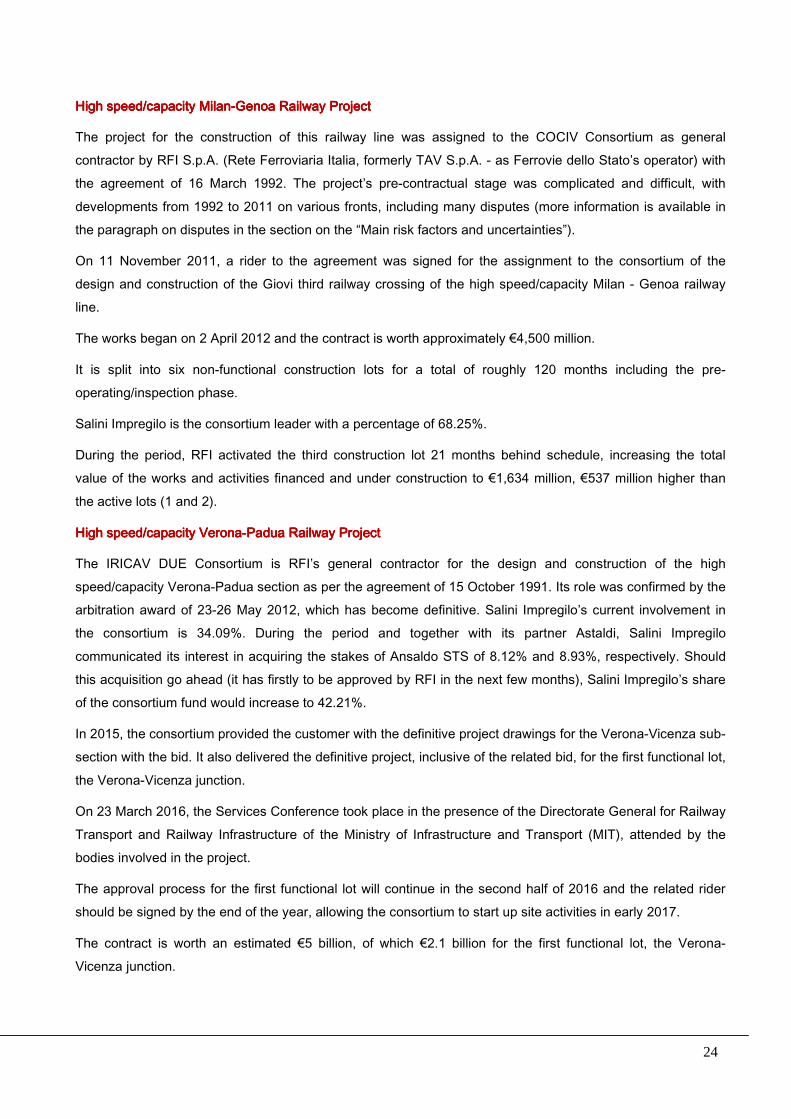
High speed/capacity MHigh speed/capacity MHigh speed/capacity MHigh speed/capacity Milanilanilanilan----Genoa Railway Project Genoa Railway Project Genoa Railway Project Genoa Railway Project
The project for the construction of this railway line was assigned to the COCIV Consortium as general contractor by RFI S.p.A. (Rete Ferroviaria Italia, formerly TAV S.p.A. - as Ferrovie dello Stato’s operator) with the agreement of 16 March 1992. The project’s pre-contractual stage was complicated and difficult, with
developments from 1992 to 2011 on various fronts, including many disputes (more information is available in the paragraph on disputes in the section on the “Main risk factors and uncertainties”).
On 11 November 2011, a rider to the agreement was signed for the assignment to the consortium of the design and construction of the Giovi third railway crossing of the high speed/capacity Milan - Genoa railway line.
The works began on 2 April 2012 and the contract is worth approximately €4,500 million.
It is split into six non-functional construction lots for a total of roughly 120 months including the pre-operating/inspection phase.
Salini Impregilo is the consortium leader with a percentage of 68.25%.
During the period, RFI activated the third construction lot 21 months behind schedule, increasing the total value of the works and activities financed and under construction to €1,634 million, €537 million higher than
the active lots (1 and 2).
High speed/capacity VeronaHigh speed/capacity VeronaHigh speed/capacity VeronaHigh speed/capacity Verona----Padua Railway ProjectPadua Railway ProjectPadua Railway ProjectPadua Railway Project
The IRICAV DUE Consortium is RFI’s general contractor for the design and construction of the high speed/capacity Verona-Padua section as per the agreement of 15 October 1991. Its role was confirmed by the arbitration award of 23-26 May 2012, which has become definitive. Salini Impregilo’s current involvement in the consortium is 34.09%. During the period and together with its partner Astaldi, Salini Impregilo
communicated its interest in acquiring the stakes of Ansaldo STS of 8.12% and 8.93%, respectively. Should this acquisition go ahead (it has firstly to be approved by RFI in the next few months), Salini Impregilo’s share of the consortium fund would increase to 42.21%.
In 2015, the consortium provided the customer with the definitive project drawings for the Verona-Vicenza sub-section with the bid. It also delivered the definitive project, inclusive of the related bid, for the first functional lot,
the Verona-Vicenza junction.
On 23 March 2016, the Services Conference took place in the presence of the Directorate General for Railway Transport and Railway Infrastructure of the Ministry of Infrastructure and Transport (MIT), attended by the bodies involved in the project.
The approval process for the first functional lot will continue in the second half of 2016 and the related rider should be signed by the end of the year, allowing the consortium to start up site activities in early 2017.
The contract is worth an estimated €5 billion, of which €2.1 billion for the first functional lot, the Verona-Vicenza junction.
25
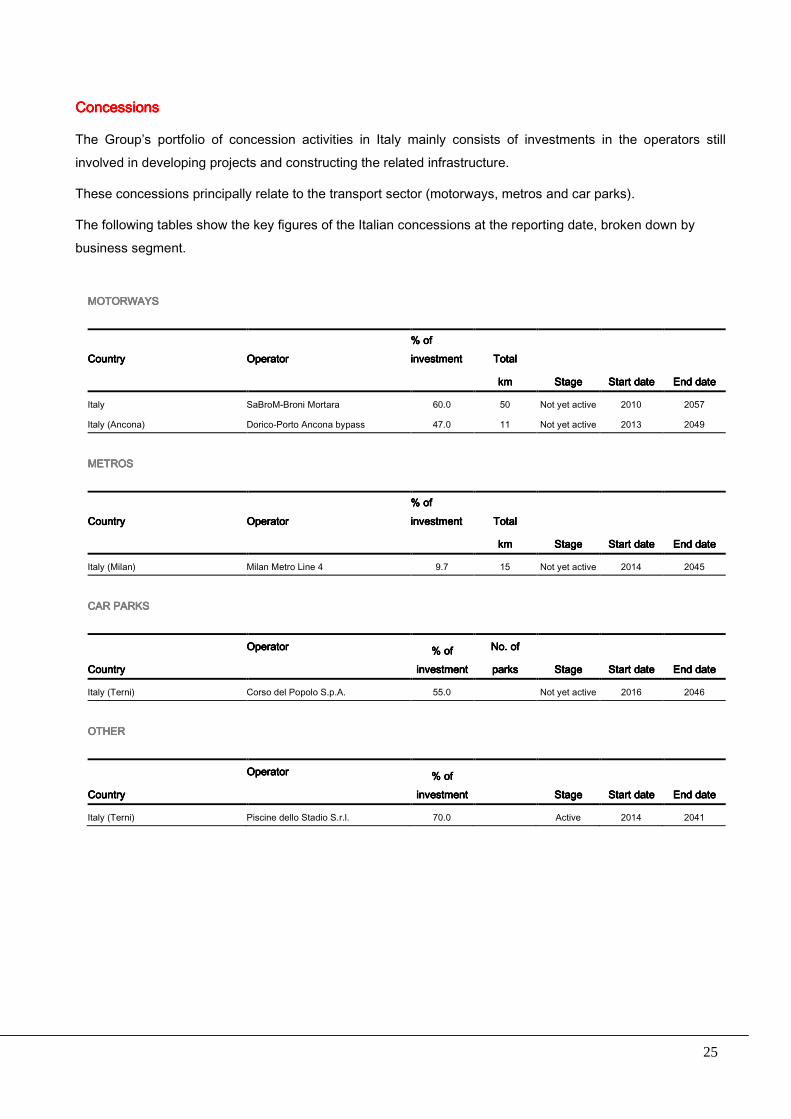
ConcessionsConcessionsConcessionsConcessions
The Group’s portfolio of concession activities in Italy mainly consists of investments in the operators still involved in developing projects and constructing the related infrastructure.
These concessions principally relate to the transport sector (motorways, metros and car parks).
The following tables show the key figures of the Italian concessions at the reporting date, broken down by business segment.
MOTORWAYSMOTORWAYSMOTORWAYSMOTORWAYS
]h
CountryCountryCountryCountry OperatorOperatorOperatorOperator % of % of % of % of investmentinvestmentinvestmentinvestment TotalTotalTotalTotal
StageStageStageStage Start dateStart dateStart dateStart date End dateEnd dateEnd dateEnd date ]h kmkmkmkm
Italy SaBroM-Broni Mortara 60.0 50 Not yet active 2010 2057
Italy (Ancona) Dorico-Porto Ancona bypass 47.0 11 Not yet active 2013 2049
METROSMETROSMETROSMETROS
]h
CountryCountryCountryCountry OperatorOperatorOperatorOperator % of % of % of % of investmentinvestmentinvestmentinvestment TotalTotalTotalTotal
StageStageStageStage Start dateStart dateStart dateStart date End dateEnd dateEnd dateEnd date ]h kmkmkmkm
Italy (Milan) Milan Metro Line 4 9.7 15 Not yet active 2014 2045
CAR PARKSCAR PARKSCAR PARKSCAR PARKS
]h
CountryCountryCountryCountry
OperatorOperatorOperatorOperator % of % of % of % of investmentinvestmentinvestmentinvestment
No. ofNo. ofNo. ofNo. of
StageStageStageStage Start dateStart dateStart dateStart date End dateEnd dateEnd dateEnd date ]h parksparksparksparks
Italy (Terni) Corso del Popolo S.p.A. 55.0 Not yet active 2016 2046
OTHEROTHEROTHEROTHER
]h
CountryCountryCountryCountry
OperatorOperatorOperatorOperator % of % of % of % of investmentinvestmentinvestmentinvestment
StageStageStageStage Start dateStart dateStart dateStart date End dateEnd dateEnd dateEnd date ]h
Italy (Terni) Piscine dello Stadio S.r.l. 70.0 Active 2014 2041

26
AbroadAbroadAbroadAbroad
The Group is active in the construction and concessions sectors abroad.
Macroeconomic scenarioMacroeconomic scenarioMacroeconomic scenarioMacroeconomic scenario
The global economy continued to recover during the period albeit at a slower and weaker pace than expected. Markets were still volatile and the advanced economies saw a slowdown in their growth early in the year. The performance of the low income countries varied while the entire geopolitical situation continues to be uncertain.
Despite this discouraging economic context, the general climate benefitted from positive factors such as better-than-expected economic figures, the partial stabilisation of oil prices, the smaller outflow of capital from China and the central banks’ expansionary policies. The IMF has forecast global growth of 3.2% in 2016 and
3.5% in 2017, which are slightly below the actual figures for January 2016 (by 0.2% and 0.1%, respectively). The advanced countries’ growth should be in the region of a modest 2%. A stable growth rate of 2.4% is expected for the US, with a slight improvement in 2017. The contraction in investments, high unemployment rates and weaker financial situations of businesses all heavily impacted development in the Eurozone, whose growth rate is forecast to be a moderate 1.5% for 2016 while it is expected to increase to 1.6% in 2017.
The emerging markets and developing countries will continue to make up the largest share of global growth in 2016, even through their growth patterns will be discontinuous and slower than those seen in the last 20 years.
The challenges facing the world will be similar to those seen in 2015, that is, falling raw materials prices, an increasingly strong dollar and a decelerating Chinese economy.
Another source of concern is the Brexit referendum held in Great Britain on 23 June. Its exit from the
European market may cause upheaval and a reduction in trade and cash flows, limiting the benefits of economic cooperation and integration. The rating agency Standard & Poor’s has estimated that the Brexit effect may lead to an 0.8% reduction in the Eurozone’s GDP between 2017 and 2018.
ConstructionConstructionConstructionConstruction
The order backlog for the foreign construction segment is as follows:
Country
Residual backlog at 30 June 2016 Percentage of total
Asia 6,498.7 29.1%
Africa 7,634.4 34.2%
Americas 5,524.3 24.7%
Europe (excluding Italy) 1,842.6 8.2%
Oceania 839.2 3.8%
TotalTotalTotalTotal 22,33922,33922,33922,339.2.2.2.2 100.0%100.0%100.0%100.0%

27
The following chart provides a breakdown of the order backlog by type of business:
Breakdown of the foreign construction order backlog Breakdown of the foreign construction order backlog Breakdown of the foreign construction order backlog Breakdown of the foreign construction order backlog
United StatesUnited StatesUnited StatesUnited States
MarketMarketMarketMarket
The United States’ GDP is expected to grow by more than 2% pa in the three years from 2016 to 2018.
Business should pick up in the infrastructure and transportation sector by about 9% in 2016 and this growth should already be visible in the first half of the year with the motorway works (+19%) and bridge constructions (+7%), thanks in part to the Fast Act (Fixing America’s Surface Transportation Act), recently approved by the US government. This Act provides for infrastructure investments of approximately USD305 billion to assist the construction of roads and motorways as well as other transport infrastructure over the next five years. The
most recent estimates for the water infrastructure sector indicate a rise in investments over the next few years for the better management of water resources, also given the rather obsolete state of the existing infrastructure networks (source: FMI Construction Overview 2016). The following table shows the amounts involved in the main contracts in portfolio:
(Share in millions of Euros) Residual backlog Percentage of completion
Lane 2,332.6
Gerald Desmond Bridge 103.6 49.3%
Dugway Storage Tunnel Cleveland 100.4 27.1%
Other 57.9
TotalTotalTotalTotal 2,594.62,594.62,594.62,594.6
29.1%
34.2%
24.7%
8.2%3.8%
Asia Africa Americas Europe (excluding Italy) Oceania

28
Lane Lane Lane Lane ---- Purple Line Purple Line Purple Line Purple Line ---- MarylandMarylandMarylandMaryland
The Purple Line Transit Partners joint venture, which includes Lane Construction, was selected as the best
bidder for the design and construction of the Purple Line transit system worth USD2 billion in March 2016. More information about the project is provided in the section on the key events of the period.
Lane Lane Lane Lane ---- IIII----4 Ultimate 4 Ultimate 4 Ultimate 4 Ultimate ---- FloridaFloridaFloridaFlorida
In September 2014, the I-4 Mobility Partners joint venture entered into a concession agreement with the Florida Department of Transportation (FDOT) to design, build, finance and operate the USD2.3 billion I-4 Ultimate project. Lane’s share of the consortium is 30%. The project includes the reconstruction of 21 miles of I-4 from west of Kirkman Road in Orange County to east
of SR 434 in Seminole County, including the addition of four lanes.
Gerald Desmond Bridge Gerald Desmond Bridge Gerald Desmond Bridge Gerald Desmond Bridge ---- LoLoLoLong Beach ng Beach ng Beach ng Beach
The contract, awarded in 2012, consists of the construction of a cable-stayed bridge with the main span of 300 metres and two 150 m-high towers in the harbour of the city of Long Beach (CA). At the reporting date, it was worth USD785 million, of which 30% for the Group.
Dugway Storage Tunnel Dugway Storage Tunnel Dugway Storage Tunnel Dugway Storage Tunnel ---- Cleveland Cleveland Cleveland Cleveland
This USD153 million contract awarded in November 2014 involves the construction of a 4.5 km-long and 8 m-wide tunnel and six shafts of varying diameter and depth. Salini Impregilo’s share is 100%.
Outlook for 2016 Outlook for 2016 Outlook for 2016 Outlook for 2016
The acquisition of Lane represents another step by Salini Impregilo to expand in the US infrastructure market. The US construction sector will become a core market for the company, contributing more than 20% of its total revenue. With Lane, Salini Impregilo will be able to access a much larger pool of projects, especially in the water, railway and tunnel sectors.
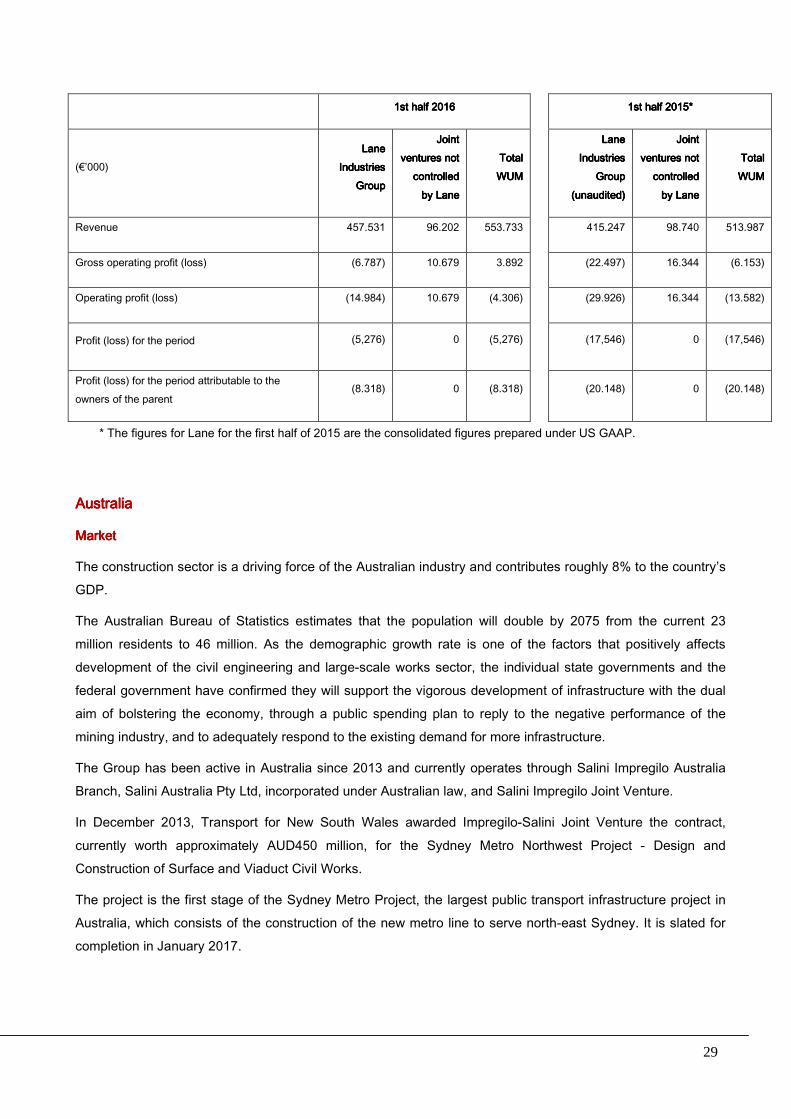
Management Management Management Management accounts accounts accounts accounts presentation of the figures for the first six months of 2016 and 2015 (“work under presentation of the figures for the first six months of 2016 and 2015 (“work under presentation of the figures for the first six months of 2016 and 2015 (“work under presentation of the figures for the first six months of 2016 and 2015 (“work under management”) management”) management”) management”)
For management purposes and in accordance with general practice in the US construction sector, the Group
monitors the main figures of Lane Group, adjusting the IFRS balances, prepared for consolidation purposes, to
consider the results of the unconsolidated joint ventures, which are consolidated using the proportionate
method. These management accounts results (works under management), show the progress made on the
contracts managed directly by Lane Industries or through its non-controlling investments in the joint ventures.
The following table shows the key figures for the period compared to the corresponding period of 2015:
29
1st half 20161st half 20161st half 20161st half 2016 1st half 20151st half 20151st half 20151st half 2015****
(€’000) Lane Lane Lane Lane
Industries Industries Industries Industries GroupGroupGroupGroup
Joint Joint Joint Joint ventures not ventures not ventures not ventures not
controlled controlled controlled controlled by Laneby Laneby Laneby Lane
Total Total Total Total WUMWUMWUMWUM
Lane Lane Lane Lane Industries Industries Industries Industries
Group Group Group Group (unaudited)(unaudited)(unaudited)(unaudited)
Joint Joint Joint Joint ventures ventures ventures ventures not not not not
controlled controlled controlled controlled by Laneby Laneby Laneby Lane
Total Total Total Total WUMWUMWUMWUM
Revenue 457.531 96.202 553.733 415.247 98.740 513.987
Gross operating profit (loss) (6.787) 10.679 3.892 (22.497) 16.344 (6.153)
Operating profit (loss) (14.984) 10.679 (4.306) (29.926) 16.344 (13.582)
Profit (loss) for the period (5,276) 0 (5,276) (17,546) 0 (17,546)
Profit (loss) for the period attributable to the owners of the parent
(8.318) 0 (8.318) (20.148) 0 (20.148)
* The figures for Lane for the first half of 2015 are the consolidated figures prepared under US GAAP.
AustraliaAustraliaAustraliaAustralia
MarketMarketMarketMarket
The construction sector is a driving force of the Australian industry and contributes roughly 8% to the country’s GDP.
The Australian Bureau of Statistics estimates that the population will double by 2075 from the current 23 million residents to 46 million. As the demographic growth rate is one of the factors that positively affects development of the civil engineering and large-scale works sector, the individual state governments and the
federal government have confirmed they will support the vigorous development of infrastructure with the dual aim of bolstering the economy, through a public spending plan to reply to the negative performance of the mining industry, and to adequately respond to the existing demand for more infrastructure.
The Group has been active in Australia since 2013 and currently operates through Salini Impregilo Australia Branch, Salini Australia Pty Ltd, incorporated under Australian law, and Salini Impregilo Joint Venture.
In December 2013, Transport for New South Wales awarded Impregilo-Salini Joint Venture the contract,
currently worth approximately AUD450 million, for the Sydney Metro Northwest Project - Design and Construction of Surface and Viaduct Civil Works.
The project is the first stage of the Sydney Metro Project, the largest public transport infrastructure project in Australia, which consists of the construction of the new metro line to serve north-east Sydney. It is slated for completion in January 2017.

30
(Share in millions of Euros) Project Residual backlog Percentage of completion
Forrestfield Airport Link 780.2 1.3%
NW Rail Link Project 59.0 82.7%
TotalTotalTotalTotal 839.2839.2839.2839.2
Forrestfield Airport Link Forrestfield Airport Link Forrestfield Airport Link Forrestfield Airport Link
On 28 April 2016, the joint venture of Salini Impregilo (80%) and NRW Pty Ltd (20%) was awarded the
contract to design, construct and maintain the Forrestfield Airport Link by the Public Transport Authority of Western Australia. More information is available in the section on the key events of the period.
Outlook for 2016Outlook for 2016Outlook for 2016Outlook for 2016
On 22 June 2016, the parent was informed that it has been shortlisted by the Victorian government for the
design and construction of a new project worth approximately €3.6 billion (AUD5.5 billion) in Melbourne. The
project is one of the most ambitious road infrastructure projects of this state and its objective is to reduce
traffic congestion on the existing bridge (West Gate Bridge) and commuting times. It will also create 5,600 new
jobs. The works are to be completed by 2022. The Group deems that the Australian market is fundamental for
its growth, as shown by the above developments.
Saudi ArabiaSaudi ArabiaSaudi ArabiaSaudi Arabia
MarketMarketMarketMarket
The Saudi market is stagnant due to the falling oil prices and the country’s expected deficit in 2016. The local currency’s depreciation against the US dollar planned for the start of 2016 no longer seems feasible until at least 2017.
The following table shows the amounts involved in the main contracts in place at the reporting date:
(Share in millions of Euros) Project Residual backlog Percentage of completion
Riyadh Metro Line 3 2,050.8 26.1%
Other 40.0
TotalTotalTotalTotal 2,090.82,090.82,090.82,090.8
Riyadh Metro Line 3Riyadh Metro Line 3Riyadh Metro Line 3Riyadh Metro Line 3
On 29 July 2013, Salini Impregilo, as leader of an international consortium, won a portion of the maxi contract awarded by ArRiyadh Development Authority to design and construct the new Riyadh metro line 3 (41.2 km),
the longest line of the challenging project for the metro system of Saudi Arabia’s capital.

31
The lot assigned to ArRiyadh New Mobility Consortium is an important part of the larger construction contract for Riyadh’s new metro system, worth approximately USD23.5 billion.
The value of the works to be carried out by the consortium, i.e., the design and construction of the entire Line 3, is roughly USD6.4 billion, including approximately USD5.3 billion for the civil works, of which Salini
Impregilo will carry out 66%.
Outlook for 2016Outlook for 2016Outlook for 2016Outlook for 2016
The Group will continue to pursue new business opportunities in 2016 in the country.
QatarQatarQatarQatar
MarketMarketMarketMarket
Given current oil prices, the country has held back development of new infrastructure projects and has only continued high priority projects (such as the Doha metro line) for the 2022 FIFA World Cup.
The following table shows the amounts involved in the main contracts in place at the reporting date:
(Share in millions of Euros) Project Residual backlog Percentage of completion
Red Line North 648.7 52.7%
Al Bayt Stadium 660.2 12.5%
Other 311.0
TotalTotalTotalTotal 1,619.1,619.1,619.1,619.9999
Red Line North Underground, DohaRed Line North Underground, DohaRed Line North Underground, DohaRed Line North Underground, Doha
In 2013, as leader of a joint venture with a 41.25% share, Impregilo won the tender called by Qatar Railways Company (Qrail) for the design and construction of the Red Line North Underground in Doha. The project, along with three other metro lines, is part of a programme promoted by Qatar to build a new infrastructure
mobility system included in the National Development Plan for 2030 (Qatar National Vision 2030), which provides for significant investments to ensure sustainable economic growth over time, both within the country and abroad. The contract’s value has decreased from the previous QAR8 billion (roughly €2 billion) to the current QAR5.7 billion (approximately €1.4 billion), due to the partial use of the contractually-provided for provisional sum.
Al Bayt StadiumAl Bayt StadiumAl Bayt StadiumAl Bayt Stadium
In July 2015, the Group was awarded the contract to build the Al Bayt Stadium in Al Khor, roughly 50 km north of the capital Doha. The contract is worth approximately €770 million and entails the design and construction of one of the sports complexes where the 2022 FIFA World Cup matches will take place. The contract was awarded by the Aspire Zone Foundation, which is responsible for the development of Qatar’s sports
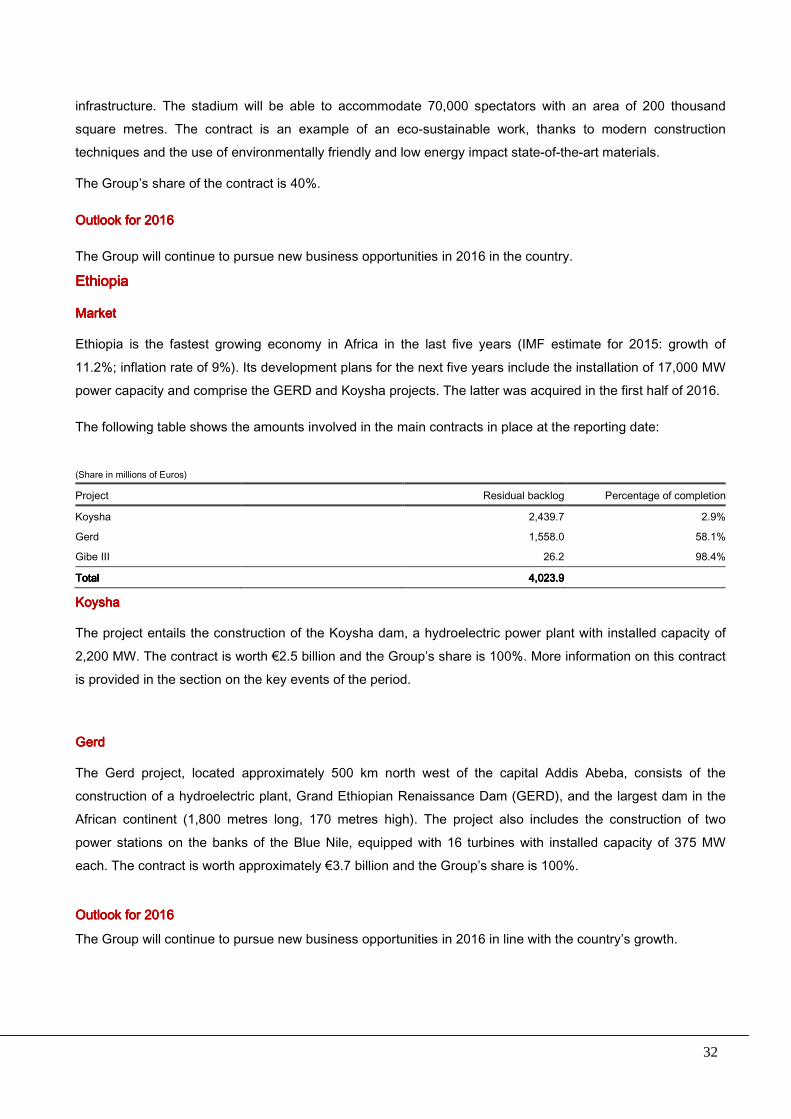
32
infrastructure. The stadium will be able to accommodate 70,000 spectators with an area of 200 thousand square metres. The contract is an example of an eco-sustainable work, thanks to modern construction techniques and the use of environmentally friendly and low energy impact state-of-the-art materials.
The Group’s share of the contract is 40%.
Outlook for 2016Outlook for 2016Outlook for 2016Outlook for 2016
The Group will continue to pursue new business opportunities in 2016 in the country.
EthiopiaEthiopiaEthiopiaEthiopia
MarketMarketMarketMarket
Ethiopia is the fastest growing economy in Africa in the last five years (IMF estimate for 2015: growth of
11.2%; inflation rate of 9%). Its development plans for the next five years include the installation of 17,000 MW power capacity and comprise the GERD and Koysha projects. The latter was acquired in the first half of 2016.
The following table shows the amounts involved in the main contracts in place at the reporting date:
(Share in millions of Euros) Project Residual backlog Percentage of completion
Koysha 2,439.7 2.9%
Gerd 1,558.0 58.1%
Gibe III 26.2 98.4%
TotalTotalTotalTotal 4,023.94,023.94,023.94,023.9
KoyshaKoyshaKoyshaKoysha
The project entails the construction of the Koysha dam, a hydroelectric power plant with installed capacity of
2,200 MW. The contract is worth €2.5 billion and the Group’s share is 100%. More information on this contract is provided in the section on the key events of the period.
GerdGerdGerdGerd
The Gerd project, located approximately 500 km north west of the capital Addis Abeba, consists of the construction of a hydroelectric plant, Grand Ethiopian Renaissance Dam (GERD), and the largest dam in the African continent (1,800 metres long, 170 metres high). The project also includes the construction of two
power stations on the banks of the Blue Nile, equipped with 16 turbines with installed capacity of 375 MW each. The contract is worth approximately €3.7 billion and the Group’s share is 100%.
OutlOutlOutlOutlook for 2016ook for 2016ook for 2016ook for 2016
The Group will continue to pursue new business opportunities in 2016 in line with the country’s growth.

33
NigeriaNigeriaNigeriaNigeria
MarketMarketMarketMarket
Nigeria is one of the largest producers of oil, a resource that accounts for almost the entire production capacity of the country. The drop in crude oil prices engendered a wide-scale economic crisis in the last two years, exasperated by internal strife between different political and tribal fractions, which has limited once again the country’s ability to meet its cash requirements and encourage development.
The following table shows the amounts involved in the main contracts in place at the reporting date:
(Share in millions of Euros) Project Residual backlog Percentage of completion
Cultural Center 252.4 38.3%
District 1 204.8 13.2%
Adiyan 137.1 42.5%
Suleja Minna 97.4 33.9%
Other 127.3
TotalTotalTotalTotal 818.8818.8818.8818.8
Nigeria Cultural Nigeria Cultural Nigeria Cultural Nigeria Cultural CentreCentreCentreCentre and and and and MillenniumMillenniumMillenniumMillennium TowerTowerTowerTower
The project for Nigeria’s capital, Abuja, includes construction of a 183 m-high tower, a cultural centre with an auditorium, museum and hotels, a square with an underground two-storey car park and a large arcade. The customer is the Ministry of Federal Capital Territory.
The contract is worth roughly €415 million and the Group’s share is 100%.
District 1District 1District 1District 1
The project consists of road works and floodwater and wastewater drainage works and the installation of an electricity grid and water network in Abuja’s residential area on behalf of the customer, Ministry of Federal Capital Territory.
The contract is worth roughly €236 million and the Group’s share is 100%.
Adiyan Waterworks Phase II (Adiyan)Adiyan Waterworks Phase II (Adiyan)Adiyan Waterworks Phase II (Adiyan)Adiyan Waterworks Phase II (Adiyan)
The project consists of the construction of a water treatment plant with a capacity of 320,000 cubic metres/day, intended to meet Lagos population’s water needs. The customer is Lagos State.
The contract is worth roughly €238 million and the Group’s share is 100%.
Suleja MinnaSuleja MinnaSuleja MinnaSuleja Minna
The project entails doubling the carriageway of the Suleja Minna road, one of the country’s main motor backbones which connects Abuja to the north west. The customer is the Federal Ministry of Works. The contract is worth approximately €147 million and the Group’s share is 100%.

34
Outlook for 2016Outlook for 2016Outlook for 2016Outlook for 2016
The projects on which the Group is working in Nigeria are an absolute priority for the country’s infrastructural development and range from road and water works to civil construction. Maintenance work is being carried out on components and parts of the various contracts completed to date, except for the Adiyan project, for which
the civil works are slated for completion by year end (more information is available in the paragraph on country risk in the section on the “Key risk factors and uncertainties”).
VenezuelaVenezuelaVenezuelaVenezuela
MarketMarketMarketMarket
Salini Impregilo Group has been active in Venezuela through its permanent organisation, which directly or in association with international partners, carries out railway and hydroelectric projects with a solid base constructed in the country over more than 30 years.
In recent years, relationships with customers, which are all government agencies, have been characterised by
delays in payments. This issue became more acute in 2015 due to the rapid fall in oil prices, which is Venezuela’s main source of hard currency, and social tensions that have intensified as a result of the lack of basic foodstuffs and medicines.
The following table shows the amounts involved in the main contracts in place at the reporting date:
(Share in millions of Euros) Project Residual backlog Percentage of completion
Puerto Cabello - Contuy Ferrocarriles stations
434.8 17.3%
Porto Cabello Sistema Integral 313.4 -
San Juan de Los Morros railway 278.2 48.0%
Puerto Cabello - Contuy Ferrocarriles 201.4 85.2%
Chaguaramas railway 88.6 63.9%
OIV Tocoma 35.4 97.6%
TotalTotalTotalTotal 1,351.81,351.81,351.81,351.8
Railway projectsRailway projectsRailway projectsRailway projects
The project on which most progress has been made is the P. Cabello project, while the two sites in Guarico (Chaguaramas and San Juan de Los Moros railways) will continue the maintenance phase until work is rescheduled with the customer.
With respect to especially the P. Cabello - La Encrucijada project, the last considerations collected were in January 2015 for hard currency, whereas local currency collections took place in line with the contractual schedule. Moreover, approximately 70% of the progress billings in local currency was collected in 2015, demonstrating the customer’s interest in continuing the works. The Group’s share of the project is roughly 33%.

35
Outlook for 2016Outlook for 2016Outlook for 2016Outlook for 2016
The projects that are being developed by Salini Impregilo Group are priority infrastructures of the utmost importance, both in economic-industrial and social terms. Accordingly, and based on the constant and careful monitoring of the country’s situation, no specific issues are apparent at this stage with regard to the
recoverability of the Group’s net assets.
However, in view of the delicate and complex uncertain situation that has developed at political level, the possibility that events not foreseeable at the date of this report may arise in the future that may require changes to the assessments made to date cannot be excluded (more information is available in the paragraph on country risk in the section on the “Main risk factors and uncertainties”).
PeruPeruPeruPeru
MarketMarketMarketMarket
The country is engaged in strengthening its democratic institutions to encourage private initiative in the
economy. In fact, the current government has communicated its intention to stimulate investment in large infrastructural works to modernise Peru. The following table shows the amounts involved in the contracts in place at the reporting date:
(Share in millions of Euros) Project Residual backlog Percentage of completion
Lima Metro 674.7 4.1%
TotalTotalTotalTotal 674.7674.7674.7674.7
MMMM2 Lima 2 Lima 2 Lima 2 Lima ---- PeruPeruPeruPeru
On 28 March 2014, the consortium comprising Salini Impregilo Group and other international groups won the contract for the construction and operation of the extension to Lima’s metro network under concession from P-Agencia de Promociòn de la Inversiòn Privada. The project includes the construction of the works and operation of the infrastructure over the 35-year concession.
The Group’s share of the construction work is 25.5% of the civil works. The five-year project includes the development of a 35 km-long underground line. The contract is worth approximately USD3,019 million (inclusive of variations).
Outlook for 2016Outlook for 2016Outlook for 2016Outlook for 2016
The Group will continue to pursue new business opportunities in 2016 in line with the country’s growth.
DenmarkDenmarkDenmarkDenmark
MarketMarketMarketMarket
Denmark is experiencing a phase of moderate growth. The country’s infrastructure development plan entails public and private investment. The Group operates through its subsidiary Copenhagen Metro Team I/S, a
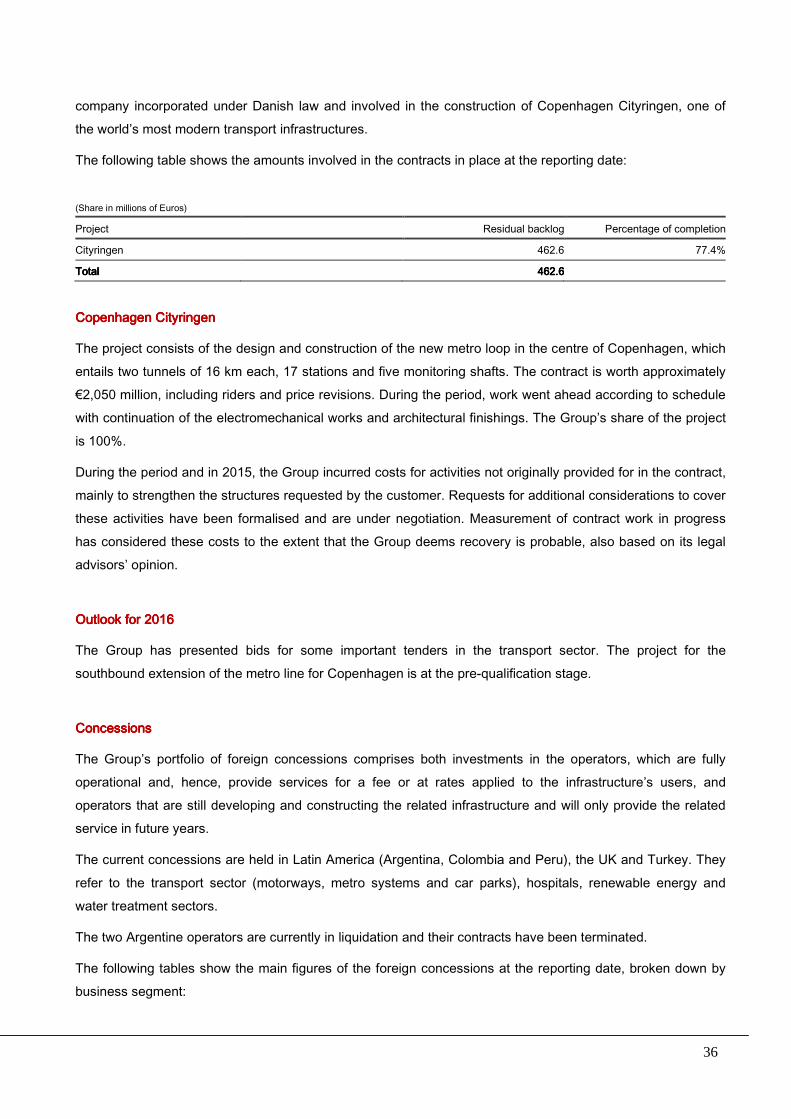
36
company incorporated under Danish law and involved in the construction of Copenhagen Cityringen, one of the world’s most modern transport infrastructures.
The following table shows the amounts involved in the contracts in place at the reporting date:
(Share in millions of Euros) Project Residual backlog Percentage of completion
Cityringen 462.6 77.4%
TotalTotalTotalTotal 462.6462.6462.6462.6
CopenhagenCopenhagenCopenhagenCopenhagen CityringenCityringenCityringenCityringen
The project consists of the design and construction of the new metro loop in the centre of Copenhagen, which entails two tunnels of 16 km each, 17 stations and five monitoring shafts. The contract is worth approximately €2,050 million, including riders and price revisions. During the period, work went ahead according to schedule with continuation of the electromechanical works and architectural finishings. The Group’s share of the project
is 100%.
During the period and in 2015, the Group incurred costs for activities not originally provided for in the contract, mainly to strengthen the structures requested by the customer. Requests for additional considerations to cover these activities have been formalised and are under negotiation. Measurement of contract work in progress has considered these costs to the extent that the Group deems recovery is probable, also based on its legal advisors’ opinion.
Outlook for 2016Outlook for 2016Outlook for 2016Outlook for 2016
The Group has presented bids for some important tenders in the transport sector. The project for the southbound extension of the metro line for Copenhagen is at the pre-qualification stage.
ConcessionsConcessionsConcessionsConcessions
The Group’s portfolio of foreign concessions comprises both investments in the operators, which are fully operational and, hence, provide services for a fee or at rates applied to the infrastructure’s users, and operators that are still developing and constructing the related infrastructure and will only provide the related service in future years.
The current concessions are held in Latin America (Argentina, Colombia and Peru), the UK and Turkey. They
refer to the transport sector (motorways, metro systems and car parks), hospitals, renewable energy and water treatment sectors.
The two Argentine operators are currently in liquidation and their contracts have been terminated.
The following tables show the main figures of the foreign concessions at the reporting date, broken down by business segment:

37
MOTORWAYSMOTORWAYSMOTORWAYSMOTORWAYS
CountryCountryCountryCountry OperatorOperatorOperatorOperator % % % % of of of of investmentinvestmentinvestmentinvestment TotalTotalTotalTotal
StageStageStageStage Start dateStart dateStart dateStart date End dateEnd dateEnd dateEnd date ]h kmkmkmkm
Argentina Iglys S.A. 98.0 holding
Argentina Autopistas Del Sol 19.8 120 active 1993 2020
Argentina Puentes del Litoral S.A. 26.0 59.6 in liquidation 1998
Argentina Mercovia S.A. 60.0 18 active 1996 2021
Colombia Yuma Concessionaria S.A.(Ruta del Sol) 48.3 465 active 2011 2036
METROSMETROSMETROSMETROS
CountryCountryCountryCountry OperatorOperatorOperatorOperator % of % of % of % of investmentinvestmentinvestmentinvestment TotalTotalTotalTotal
StageStageStageStage Start dateStart dateStart dateStart date End dateEnd dateEnd dateEnd date ]h kmkmkmkm
Peru Metro de Lima Linea 2 S.A. 18.3 35 Not yet active 2014 2049
ENERGY FROM RENEWABLE ENERGY FROM RENEWABLE ENERGY FROM RENEWABLE ENERGY FROM RENEWABLE SOURCESSOURCESSOURCESSOURCES
CountryCountryCountryCountry
OperatorOperatorOperatorOperator % of % of % of % of investmentinvestmentinvestmentinvestment
InstalledInstalledInstalledInstalled
Stage Stage Stage Stage Start dateStart dateStart dateStart date End dateEnd dateEnd dateEnd date ]h
voltagevoltagevoltagevoltage
Argentina Yacylec S.A. 18.7 T line active 1992 2091
Argentina Enecor S.A. 30.0 T line active 1995 2094
INTEGRATED WATER CYCLEINTEGRATED WATER CYCLEINTEGRATED WATER CYCLEINTEGRATED WATER CYCLE
CountryCountryCountryCountry
OperatorOperatorOperatorOperator % of % of % of % of investmentinvestmentinvestmentinvestment
Pop. Pop. Pop. Pop.
StageStageStageStage Start dateStart dateStart dateStart date End dateEnd dateEnd dateEnd date ]h
servedservedservedserved
Argentina Aguas del G. Buenos Aires S.A. 42.6 210 k in liquidation 2000
Peru Consorcio Agua Azul S.A. 25.5 740 k active 2000 2027
HOSPITALSHOSPITALSHOSPITALSHOSPITALS
CountryCountryCountryCountry
OperatorOperatorOperatorOperator % of % of % of % of investmentinvestmentinvestmentinvestment
No. No. No. No. ofofofof
StageStageStageStage Start dateStart dateStart dateStart date End dateEnd dateEnd dateEnd date ]h
bedsbedsbedsbeds
GB Impregilo Wolverhampton Ltd. 20.0 150 k medical
visits active 2002 2032
GB Ochre Solutions Ltd – Oxford Hospital 40.0 220 active 2005 2038
GB Impregilo New Cross Ltd. 100.0 holding
Turkey Gaziantep Hospital 35.5 1,875 Not yet active 2016 2044
CAR PARKSCAR PARKSCAR PARKSCAR PARKS
CountryCountryCountryCountry
OperatorOperatorOperatorOperator % of % of % of % of investmentinvestmentinvestmentinvestment
No. No. No. No. ofofofof
StageStageStageStage Start dateStart dateStart dateStart date End dateEnd dateEnd dateEnd date ]h
parksparksparksparks
GB Impregilo Parking Glasgow Ltd. 100.0 1,400 active 2004 2034
Order backlogOrder backlogOrder backlogOrder backlog
The order backlog shows the amount of the long-term construction contracts awarded to the Group, net of revenue recognised at the reporting date. The Group records the current and outstanding contract outcome in

38
its order backlog. Projects are included when the Group receives official notification that it has been awarded the project by the customer, which may take place before the definitive binding signing of the related contract.
The Group includes projects in its order backlog when it deems that the contract counterparties will comply with their obligations. Moreover, its contracts usually provide for the activation of specific procedures (usually arbitrations) to be followed in the case of either party’s contractual default.
The order backlog includes the amount of the projects, including when they are suspended or deferred,
pursuant to the contractual conditions, even if their resumption date is unknown.
The Group decreases the amount of the order backlog:
- when a contract is cancelled or decreased as agreed with the customer;
- in line with the recognition of contract revenue in profit or loss.
The Group updates the order backlog to reflect amendments to contracts and agreements signed with customers. In the case of contracts that do not have a fixed consideration, the related order backlog reflects any contractual variations agreed with the customer or when the customer requests an extension of the execution times or amendments to the project that had not been provided for in the contract, as long as these variations are agreed with the customer and the related revenue is reasonably certain.
The order backlog is not a measurement parameter provided for by the IFRS and is not calculated using financial information prepared in accordance with such standards. Therefore, the calculation method used by the Group may differ from that used by other sector operators. Accordingly, it cannot be considered as an alternative indicator to the revenue calculated under the IFRS or other IFRS measurements.
Moreover, although the Group’s accounting systems update the related data on a consolidated basis once a month, the order backlog does not necessarily reflect the Group’s future results, as its data may be subject to significant variations.
Order backlogOrder backlogOrder backlogOrder backlog
The order backlog for the foreign construction segment is as follows: ]h (Share in millions of Euros)
]h Area/CountryArea/CountryArea/CountryArea/Country
Residual backlog at 30 Residual backlog at 30 Residual backlog at 30 Residual backlog at 30 June 2016June 2016June 2016June 2016
Percentage of totalPercentage of totalPercentage of totalPercentage of total
Italy 8,907 28.5%
Asia 6,499 20.8%
Africa 7,634 24.4%
Americas 5,524 17.7%
Europe 1,843 5.9%
Oceania 839 2.7%
TotalTotalTotalTotal 31,231,231,231,246464646 100%100%100%100%
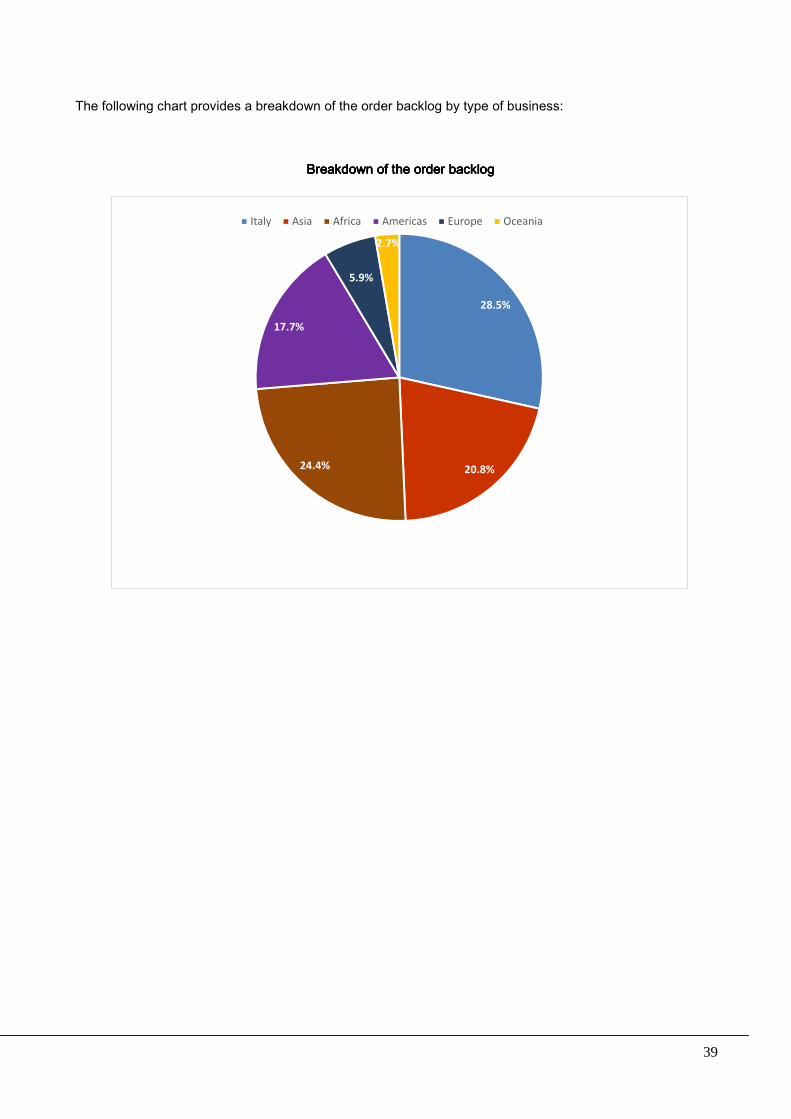
39
The following chart provides a breakdown of the order backlog by type of business:
Breakdown of the order backlogBreakdown of the order backlogBreakdown of the order backlogBreakdown of the order backlog
28.5%
20.8%24.4%
17.7%
5.9%
2.7%
Italy Asia Africa Americas Europe Oceania

40
Business rBusiness rBusiness rBusiness risk management isk management isk management isk management
The context in which the Group currently operates, characterised by rapid macroeconomic changes, financial markets instability and progressive developments of legal and regulatory compliance regulations, requires clear strategies and effective management processes aimed at preserving and maximising value.
To strengthen the internal controls and risk management system, in 2015, the Group introduced a risk management framework, which it keeps up-to-date, extended to all group operating companies to identify, assess, manage and monitor risks in accordance with industry best practices.
The Group Risk Officer, heading up the risk management unit, is in charge of developing, implementing and circulating the risk management framework and assists senior management with strategic and commercial planning and operations as well as the comprehensive, in-depth analysis of relevant factors for the business
and the local contexts in which the Group operates, identifying and monitoring related risks.
As part of the risk management system, the Group defined the universe of risk events that have a potential impact on operations (so-called “Risk Universe”), ranked into five main risk categories and analysed along three risk dimensions that are considered relevant for the group business’s features and characteristics, as well as the context in which it operates.
Business context related risksBusiness context related risksBusiness context related risksBusiness context related risks
External risks that may compromise the Group’s achievement of its objectives, i.e. all events whose occurrence are not influenced by corporate decisions. This category includes all risks arising from a country’s macroeconomic and socio-political dynamics, sector trends and competitive scenario, as well as from industry specific technological innovation and regulatory developments.
Because of the nature of such risks, the Group must rely on its forecasting and managing abilities. Specifically,
Salini Impregilo integrated risk vision in its strategic and business planning processes through the definition of commercial and risk guidelines and the development of a process for the prioritisation and selection of initiatives to be pursued, also and most of all based on the assessment of relevant risks linked to the country and/or sector in which operations are planned, rather than to the counterparty. Risk control is also ensured by monitoring the progress of strategic objectives also in terms of composition and diversification of the portfolio
and its development over time in terms of risk profile.
StrateStrateStrateStrategic risksgic risksgic risksgic risks
These risks arise from strategic, business and organisational risks that may adversely impact the Group’s performance and ultimately result in the non-achievement of strategic objectives. They include risks resulting from the choice of business or organisational models through which the Group intends to operate, those arising from M&A transactions, or the ineffective management of the order portfolio or the relationships with
key counterparties (customers, partners, suppliers, sub-contractors, etc.).

41
Salini Impregilo considers risk as a key element for the preliminary assessment of decisions and strategic choices, so much so that it has envisaged integrating the strategy definition and development process with that for the identification, measurement and management of risks. The choices pertaining to the adoption of a business or organisational model, the assessment about the opportunity of proceeding with an extraordinary
transaction or establishing a partnership are subject to preliminary analysis and evaluation of the related risks and opportunities, with the concurrent identification of risk management methods and strategies to be promptly activated should such risks arise.
Financial risksFinancial risksFinancial risksFinancial risks
All risks linked to the availability of Group resources, depending on the management of receivables and cash and cash equivalents and/or the volatility of market variables such as interest and exchange rates.
Specifically, liquidity management has the objective of ensuring the financial autonomy of contracts in progress, taking into account the structure of consortia and special purpose entities, which can tie the availability of financial resources to the performance of the relevant projects. Moreover, liquidity management takes into account restrictions to currency transfers imposed by the legislation of some countries.
Salini Impregilo also considers specific risk areas such as the counterparty’s credit rating and raw materials
price volatility, equipping itself with effective financial planning tools.
Legal and compliance risksLegal and compliance risksLegal and compliance risksLegal and compliance risks
This risk class includes risks for the management of legal issues and/or risks related to compliance with laws and regulations (e.g. taxation, local legislation, etc.) required in order to operate in the sector and/or specific countries. Salini Impregilo deems that monitoring contractual issues linked to contract management and, particularly, the relationship with relevant counterparties, is fundamental. This also includes any internal and
external fraud risks, and, more generally, the compliance with procedures and policies established by the Group to govern its operations.
With respect to the aforementioned factors, Salini Impregilo implements a regulatory risk monitoring and management policy in order to minimise the impact of such risk, through a multi-level control system that entails collaborative and ongoing liaison with relevant counterparties and business units affected by regulatory
developments and the comprehensive assessment of any potential impacts.
OperationaOperationaOperationaOperational risksl risksl risksl risks
These are risks that could jeopardize value creation and are due to an inefficient and/or ineffective management of the Group’s core business, particularly those linked to bid management and actual execution of contracts. The various risk areas that fall into this class include bid design and planning, effective supply chain, logistics and inventory management, as well as those linked to the management of IT systems,
personnel and planning and reporting.
These risks arise during the performance of contracts, should Group policies and procedures not be adequate for the management of risk factors linked to the level of complexity of the project or unforeseeable events.
42
To this end, the Group intends to monitor such risks starting at the bidding stage of each contract with a risk/benefit analysis of the project in the event of its award and its impact on the portfolio structure, both in terms of risk concentration and overall risk profile. At this time, Salini Impregilo, as part of a wider process, prepares a pre-bid risk assessment aimed at identifying potential risks and impacts linked to the project, as
well as the necessary mitigation and/or contingency measures to counter them. The risk surveillance activity is then performed again at tender stage and monitored and updated during contract execution in order to promptly detect the risk exposure development and promptly implement adequate mitigation measures.
***
Within the framework of the afore-mentioned framework for the identification and classification of risks applicable to group operations, Salini Impregilo has adopted a cross-functional approach for the analysis of
risk dimensions that are considered more relevant due to the specific features of its business. These dimensions include various risk areas identified and belonging to different risk classes.
Country riskCountry riskCountry riskCountry risk
The Group pursues its objectives by operating almost everywhere in the world, leveraging business opportunities in different countries and, hence, exposing itself to the risks resulting from the characteristics and
conditions dictated by them, such as the political, economic and social scenario, local regulations, taxation and operational complexity and, last but not least, safety conditions.
Being aware of and constantly monitoring country risk through specific indicators enables the Group first and foremost to define informed commercial strategies, as well as to gain an optimal understanding of the operating scenario and, therefore, adopt precautions and/or implement actions aimed at removing barriers and mitigate potential threats.
Counterparty riskCounterparty riskCounterparty riskCounterparty risk
The counterparty dimension identifies potential criticalities linked to relationships with the Group’s customers, shareholders, subcontractors and suppliers, so as to create a comprehensive overview of the features of the partners with which Salini Impregilo may start or continue to collaborate. For each of the above counterparty types, risk factors linked to financial and operational reliability apply to a different extent, as does the potential
strategic role of a partnership for a specific business initiative, as well as all aspects linked to legal and other compliance that safeguard the lawfulness of the relationship.
Contract riskContract riskContract riskContract risk
The contract dimension is key for an effective analysis of all risks linked to the Group’s core business, since it is considered to define tools capable of identifying and monitoring so-called contract risks starting from the bidding stage in a risk prevention perspective, as part of an in-depth analysis of the risks and opportunities
linked to the pursuit of a specific activity. Another fundamental aspect is the ongoing tracking of risks once they have been consciously taken on by management, managing the resulting risk exposure in a proactive, dynamic way, as well as its ongoing development over time.
**

43
The analysis of key risk dimensions and the relevant risk areas has the aim of providing management with a two-sided overview: a detailed one (i.e. at individual country, counterparty, contract level) and a portfolio one (for assessment of the overall exposure to such dimension), in order to assess the Group’s risk profile as well as its compliance with the exposure limits imposed by its risk management capacity. Moreover, the portfolio
overview enables the performance of systematic assessments about the potential development of the risk profile upon occurrence of certain events and/or specific choices that may result in any changes to it, through the use of dedicated risk management tools.
The risk management framework, as outlined above and subject to further and future developments, has been designed to support decision-making and operational processes at every stage of the management of projects, in order to reduce the possibility that certain events may compromise the Group’s normal business
operations or its strategic objectives: to this end, it is integrated in strategic and business planning processes, which, therefore, cannot be separated from the Group’s risk profile, as well as from its choices in terms of risk appetite.

44
Main risk factors and uncertaintiesMain risk factors and uncertaintiesMain risk factors and uncertaintiesMain risk factors and uncertainties
In addition to the areas outlined in the “Business risk management” section above, the following specific situations linked to major outstanding claims and country risk exposure at 30 June 2016, characterised by risk and/or uncertainty profiles, should be added to the universe of risk events that may potentially impact on
operations.
LitigationLitigationLitigationLitigation
USW Campania projectsUSW Campania projectsUSW Campania projectsUSW Campania projects
The Group became involved in the urban solid waste disposal projects in the Province of Naples and other provinces in Campania at the end of the 1990’s through its subsidiaries FIBE and FIBE Campania (the “companies”).
The main phases of the USW Campania projects were as follows:
(i) the “Contractual” phase, which started in the 2000-2001 period with the signing, by the two SPEs FIBE and FIBE Campania of the service contracts for the disposal of urban solid waste in the provinces of
Campania and ended on 15 December 2005 with the “ope legis” termination of these contracts pursuant to Decree law no. 245/2005 (converted into Law no. 21 of 27 January 2006);
(ii) the “Transitional” phase which started upon conclusion of the Contractual phase and lasted until the enactment of Decree law no. 90 of 23 May 2008 and Decree law no. 107 of 17 June 2008, both converted into Law no. 123 of July 14, 2008. The latter measure officially marked, among other things, the Group’s exit from
the waste disposal business, by transferring title to the RDF and storage facilities to the provincial administrations;
(iii) the “Current” phase launched at the end of the “Transition “phase, which is still underway.
The major issues that have characterised the Group’s activities in service contracts since 1999-2000, which have been discussed in detail and reviewed in all of the reports published by the Group starting from that time, have evolved and became more complex over the years, giving rise to a large range of disputes, some of
which are major and in part still ongoing. Even given the positive developments, the general situation in terms of pending disputes is still very complex. A brief overview is provided below, especially in relation to existing risk positions.
Since FIBE Campania S.p.A. was merged into FIBE S.p.A. in 2009, unless otherwise stated, reference is made exclusively to FIBE in the rest of this section, even with regard to positions and events that affected the
merged company.

45
AdministrAdministrAdministrAdministrative litigationative litigationative litigationative litigation
Recovery of the amounts owed to FIBE by local administrations for waste disposal fees up to the contractsRecovery of the amounts owed to FIBE by local administrations for waste disposal fees up to the contractsRecovery of the amounts owed to FIBE by local administrations for waste disposal fees up to the contractsRecovery of the amounts owed to FIBE by local administrations for waste disposal fees up to the contracts’’’’ termination datetermination datetermination datetermination date
The special commissioner tasked by the Regional Administrative Court to collect receivables of former
operators of the waste disposal service performed until 15 December 2005 submitted their report in November 2014, in which they stated that, despite an outstanding amount payable to FIBE as a fee for its service rendered until 15 December 2005, the administration had already collected directly €46,363,800, without forwarding it to FIBE, and that total outstanding receivables totalled €74,317,550.
The administration, apart from raising some objections, which were rejected by the Regional Administrative Court and related to calculation criteria and the offsetting of receivables (which, incidentally, were the subject
of other rulings), lodged a motion, requesting that the appeal should be rejected on the grounds of expiry of the regulation - starting from 31 December 2009 - allowing performance of the activities that should have been carried out by the special commissioner. On 13 February 2015, the Regional Administrative Court and, subsequently, on 1 September 2015, the Council of State, rejected the appeal confirming that the Administration and, on its behalf, the commissioner appointed to replace it were still responsible for collecting
receivables due to FIBE.
Following the resignation of the special commissioner and the subsequent appointment of the General Commander of the Italian Financial Police by the Regional Administrative Court as their replacement and as a result of the anticipated incompatibility raised by the latter, on 13 July 2015, the Regional Administrative Court appointed the Ministry of economy and finance’s (MEF) Chief of Staff, who, on 10 September 2015, appointed a manager of the aforementioned MEF as attorney. With notice of 16 November 2015, the new commissioner
asked the Regional Administrative Court whether the duties assigned entailed, apart from collection, also the payment to FIBE of the amounts already collected by the Administration. The Regional Administrative Court held that the commissioner’s activities would satisfy FIBE’s requests only after their work was completed and, hence, excluding the possibility that amounts collected from the Administration could be paid to it. FIBE intends to challenge this ruling.
Request that FIBE take Request that FIBE take Request that FIBE take Request that FIBE take back ownership of certain areas and storage sites by the parties appointed by the back ownership of certain areas and storage sites by the parties appointed by the back ownership of certain areas and storage sites by the parties appointed by the back ownership of certain areas and storage sites by the parties appointed by the government commissioner to handle technical and operating activitiesgovernment commissioner to handle technical and operating activitiesgovernment commissioner to handle technical and operating activitiesgovernment commissioner to handle technical and operating activities
Starting in 2008, FIBE had to deal with a number of repeated events where the parties appointed by the government commissioner to handle technical and operating activities demanded that FIBE take back ownership of certain areas and storage sites already handed over to the appointed parties in August 2008, since they were deemed not to be suitable for the management of the service. The Lazio Regional
Administrative Court and the Council of State, following appeal of the relevant measures by FIBE, confirmed the suitability of the aforementioned sites for the integrated waste cycle. The civil proceedings before the Naples Court initiated by S.A.P.NA. S.p.A., a local company set up by the Naples provincial authorities, are part of this situation. S.A.P.NA. S.p.A. challenged its takeover of title to certain temporary and definitive areas and storage sites in roughly 40 proceedings. It also requested to be indemnified and held harmless by FIBE
S.p.A. and/or the government commissioner from the operating costs incurred in the meantime and yet to be
46
incurred, including for possible site reclamation. Following the rulings of the Ordinary Court of Naples, which found that jurisdiction rested with the Administrative Court, the majority of the afore-mentioned dispute was resumed by S.A.P. NA. S.p.A. before the Campania Regional Administrative Court. With the rulings filed for the first appeals discussed, the Campania Regional Administrative Court fully rejected all claims brought by
S.A.P. NA. S.p.A..
Administrative procedures for the recording and recognition of the costs for activities carried out and the work Administrative procedures for the recording and recognition of the costs for activities carried out and the work Administrative procedures for the recording and recognition of the costs for activities carried out and the work Administrative procedures for the recording and recognition of the costs for activities carried out and the work ordered bordered bordered bordered by the Administration during the transitional management periody the Administration during the transitional management periody the Administration during the transitional management periody the Administration during the transitional management period
As early as 2009, FIBE filed a claim with the Lazio Regional Administrative Court the administrative procedures for the reporting and recognition of the costs incurred by the former service contractors for activities carried out pursuant to law and the work ordered by the Administration and performed by the
companies during the transitional management period.
As part of the aforementioned ruling, the Regional Administrative Court appointed an inspector who, on 31 March 2014, submitted a final report that compared the amounts stated by FIBE in its appeal and the supporting documentation, finding the figures to be substantially consistent. Allowing the inspection request submitted by FIBE, the Regional Administrative Court ordered an extension to the inspection performed,
asking for the identification of the existence and extent of the amounts requested and documented by the applicants upon reporting, whose investigation was omitted or not fulfilled by the Administration. To this end, it set 28 October 2016 as the deadline for filing the report and 11 January 2017 as the date of the hearing for the discussions.
Delivery of waste to the Acerra wasteDelivery of waste to the Acerra wasteDelivery of waste to the Acerra wasteDelivery of waste to the Acerra waste----totototo----energy plantenergy plantenergy plantenergy plant
With their appeal notified on 18 May 2009 (RG no. 4189/09), the companies challenged the Prime Minister’s
Order no. 3748/09 before the Lazio Regional Administrative Court whereby it illegaly stated that only waste produced and stored after the date of termination of the service contracts with the companies (15 December 2005) was to be transferred to the Acerra waste-to-energy plant. The related merits hearing was held on 18 May 2016 and the ruling has still to be handed down
Payment of the RDF plantsPayment of the RDF plantsPayment of the RDF plantsPayment of the RDF plants
With ruling no. 3886 of 5 May 2011, the Lazio Regional Administrative Court upheld FIBE’s claim and ordered the Administration to pay the undepreciated costs at the termination date for the RDF plants to FIBE, for a total amount of €205 million, plus legal and default interest from 15 December 2005 until settlement.
Following the enforcement procedure filed by FIBE and opposed by the Office of the Prime Minister, FIBE obtained the allocation of €241 million as a final payment for the receivables for principal and legal interest and suspended the enforcement procedure for the further amount of default interest claimed. Both parties initiated
proceedings about the merits of the case. Following the adjournment of proceedings with the order of 17 July 2015, the dispute was discussed during the hearing of 21 October 2015. The judge rejected the petition for default interest submitted by FIBE in the ruling of 12 February 2016, which FIBE intends to challenge.
Again with respect to the costs not depreciated at 15 December 2005 for the Campania RDF plants, measures are being taken to recover the VAT paid on the principal amount collected of €205 million ordered to be paid

47
by the judge. A separate legal action was therefore commenced for the recovery of the VAT which, on 28 January 2015, led to obtaining a payment order against the Office of the Prime Minister, which it opposed on 13 March 2015. At the hearing of 29 October 2015, the proceedings were adjourned for conclusions to 12 January 2016 when the relevant decision was taken.
Environmental disputes Environmental disputes Environmental disputes Environmental disputes
During the various stages of the USW Campania projects, the Group had to deal with a large number of administrative measures regarding reclamation and the implementation of safety measures at some of the landfills, storage areas and RDF plants. The unsuccessfully resolved proceedings are on hold pending the merit hearings. For the proceedings regarding the characterisation and emergency safety measures at the Pontericcio site, the RDF plants in Giugliano, the temporary storage area at Cava Giuliani, the Lazio Regional
Administrative Court rejected the appeals filed by FIBE with ruling no. 6033 of 2012. An appeal against this ruling, based also on contamination found at a site different to those subject of the proceedings, was filed with the Council of State. It denied FIBE’s precautionary motion to stay the enforcement of the decision. A date for the merits hearing has not been set yet. With respect to the Cava Giuliani landfill, the Lazio Regional Administrative Court, with ruling no. 5831/2012, found that it lacked jurisdiction in favour of the Superior Court
of Public Waters, before which the appeal was summed up. Meanwhile, FIBE is continuing with the characterisation operations for the above sites, but this does not constitute any admission of liability whatsoever.
The civil litigationThe civil litigationThe civil litigationThe civil litigation
In May 2005, the government commissioner filed a motion requesting compensation from FIBE, FIBE Campania and FISIA Italimpianti for alleged damage of about €43 million. During the hearing, the
commissioner increased its claims to over €700 million, further to the additional claim for damage to its reputation, calculated to be €1 billion.
The companies appeared before the court and, in addition to disputing the claims made by the government commissioner, filed a counterclaim requesting compensation for damage and sundry expenses for over €650 million, plus a further claim for reputation damage quantified at €1.5 billion. In the same proceeding, the banks
that issued FIBE and FIBE Campania’s performance bonds to the government commissioner also requested the commissioner’s claim be dismissed and, in any case, to be held harmless by Salini Impregilo (at the time, Impregilo), which appeared before the court and disputed the bank’s requests.
The public prosecutor appealed against the ruling of 11 April 2011, which found that jurisdiction rested with the administrative court and not with the ordinary court, setting the hearing date for the file’s reconstruction to 2 February 2017.
On 1 August 2012, the Ministry of Justice and the Cassa delle Ammende summarised the ruling for enforcement of the sureties for €13 million before the Milan Court. These sureties had been given by major banks to guarantee execution of the measures imposed by the Naples public prosecutor as part of the seizure of the RDF plants.

48
With decision no. 6907/14, the Milan Court denied the requests made by Cassa delle Ammende and by the Ministry of Justice against the banks, UniCredit and ABC International Bank PLC, accordingly declaring the claims for recourse filed by the banks against Impregilo and FIBE and the latter against the Office of the Prime Minister absorbed.
The Ministry of Justice and the Cassa delle Ammende appealed against this decision before the Milan Appeal Court and the related proceedings were postponed to 13 December 2016 for clarification of the conclusions.
On 30 November 2015, the Office of the Prime Minister received a new claim form served by FIBE and other group companies involved in various ways in the activities performed in Campania for the waste disposal service, containing claims for the damage suffered as a result of termination of the agreements in 2005.
The total amount claimed is €1,741 million, plus corporate damages, yet to be quantified, caused to the Group
for loss of the reference market. Considering that some requests are already included in other proceedings, the net amount is €1,570 million for quantified items. The Office of the Prime Minister filed a counterclaim for €845 million for reasons already included in other proceedings.
Finally, the public administration has recently commenced proceedings challenging FIBE’s operations with respect to the complex situation of receivables and payables arising from the “contractual phase”. Although
these are separate from the other proceedings described above, they refer to the same claims filed by FIBE in the administrative courts that the special commissioner is still working on. Accordingly and comforted by the advice of the legal advisors which support it in this complicated situation, the Group believes that FIBE’s fully compliant conduct during the “contractual” period can reasonably be confirmed and that the risk of a negative outcome of these proceedings is a mere possibility. Specifically, the Group’s legal advisors believe that the public administration’s claims can reasonably be countered considering the counterclaims and, moreover, the
admissibility in these proceedings of a court-ordered offsetting process.
Lastly, pending proceedings include a lawsuit in opposition to a payment order obtained by FS Logistica (formerly Ecolog) against the Office of the Prime Minister for the payment of consideration owed for assignments it received from 2001 to 2008 by the then government commissioner for shipment of waste outside Italy. The claim made through a summary procedure was brought against the Office of the Prime
Minister, which, in turn, summoned FIBE as a guarantee, who, in turn, filed a counterclaim for the payment of a greater expense incurred during the concession. The judge allowed a court-ordered technical expert’s report only with regard to the claims of FS Logistica toward the Office of the Prime Minister and subject of the order, adjourning the hearing to 31 March 2016. The parties then filed a settlement agreement and requested an extension to complete the procedure. The hearing was deferred to 22 September 2016 to acknowledge the settlement agreement and define the relationship between FS Logistica and the Office of the Prime Minister,
while actions to hear the claims of FIBE and the Office of the Prime Minister will be continued.
Tax litigationTax litigationTax litigationTax litigation
The outstanding claim on local property tax (ICI) on Acerra’s waste-to-energy plant should be mentioned in this respect.

49
In January 2013, the company received tax assessment notices from the Acerra municipality with respect to the waste-to-energy plant, which requested payment of local property tax and relevant penalties for approximately €14.3 million for the years 2009-2011. The amount requested by the Municipality and challenged by the company was confirmed as far as its applicability but reduced in terms of its amount and
penalties by Naples’ Regional Tax Committee, so that the original tax bills issued were cancelled.
Even if it believes that it will be able to reverse the ruling through an appeal to the Supreme Court, in 2015, the company - comforted by its legal advisors - set aside a provision for an amount equal to just the tax plus any accrued interest as a precautionary measure.
Criminal litigationCriminal litigationCriminal litigationCriminal litigation
In September 2006, the public prosecutor at the Naples Court served Impregilo S.p.A. (now Salini Impregilo),
Impregilo International Infrastructures N.V., FIBE S.p.A., FIBE Campania S.p.A., FISIA Italimpiant S.p.A. (now Fisia Ambiente S.p.A.) and Gestione Napoli in liquidation with a “Notice of the conclusion of the preliminary investigations about the administrative liability of companies” related to the alleged administrative offence pursuant to article 24 of Legislative decree no. 231/2001, as part of criminal proceedings against some former directors and employees of the above-mentioned companies, who were being investigated for the crimes
covered by article 640.1/2.1, of the Italian Criminal Code in connection with the contracts for management of the urban solid waste disposal cycle in Campania. Following the preliminary hearing of 29 February 2008, the Preliminary Investigation Judge at the Naples Court allowed the motions for indictment presented by the public prosecutor, rejecting all the civil parties’ claims against the companies finding them to be unacceptable.
As part of these proceedings, in its ruling of 26 June 2007, the Preliminary Investigation Judge ordered the precautionary seizure of the profit from the alleged crime, estimated to approximate €750 million.
The precautionary proceedings continued for nearly five years and finally ended in May 2012, without any action taken against the Group. On 4 November 2013, the Naples Court handed down a decision finding all defendants not guilty on all charges. In March 2014, the public prosecutor office of Naples challenged the decision and the first hearing was set for 29 June and then 28 September 2016 while the members of the jury are being elected.
***
In 2008, as part of a new investigation into waste disposal in the Campania region carried out after the ope legis termination of the contracts (on 15 December 2005), the Preliminary Investigations Judge, upon a request by the public prosecutor, issued personal precautionary seizure measures against some managers and employees of FIBE, FIBE Campania and FISIA Ambiente and managers of the commissioner’s office. As part of this investigation, which in the record is described both as a continuation of an earlier investigation and
as separate proceedings based on new charges, the former service providers and FISIA Ambiente are again charged with the administrative liability attributable to companies pursuant to Legislative decree no. 231/01.
In the hearing of 21 March 2013, the Preliminary Hearing Judge ordered that all the defendants and legal entities involved pursuant to Legislative decree no. 231/2001 be committed for trial for all charges, transferring

50
the proceedings to the Rome Court as a result of an acting judge being listed by the Naples public prosecutor as being under investigation.
At the hearing of 1 April 2014, the Rome Court acquired the ruling delivered by the Fifth Criminal Chamber of the Naples Court in the aforementioned “parent” proceedings (RGNR 15940/03). On 16 June 2016, the Court
accepted the public prosecutor’s request and found all the individuals involved in the proceedings not guilty. The hearing will continue for the companies involved pursuant to Legislative decree no. 231/2001.The next hearing is set for 29 November 2016.
On 23 December 2011, as the party involved pursuant to Legislative decree no. 231/01, FIBE was notified of the completion of the preliminary investigations related to another investigation by the Naples public prosecutor. The allegation relates to the charging of article 24 of Legislative decree no. 231/01 relating to the
committing of the crime covered and punished by article 81 and articles 110 and 640.I/II of the Italian Criminal Code committed jointly and with the prior agreement of the defendants (individuals) and other parties to be identified with respect to management of the urban waste water purification service using purification systems.
FIBE is accused as it has allegedly presented documents reporting among the other items related to the elimination of USW the cost of transferring leachate, while not mentioning why the leachate had been
transferred to plants that did not have the necessary legal authorisation, technical qualifications and residual purification capacity.
The public prosecutor filed a motion requesting that the Preliminary Investigations Judge of the Naples Court hear the case filed and the latter, upholding the objection presented by the defence of the public bodies, ruled that it lacked jurisdiction and ordered that the record of the proceedings be forwarded to the Rome public prosecutor.
On 13 April 2015, the Rome public prosecutor requested the closure of proceedings for all defendants (both individuals and companies) and all claims. The decision of the Preliminary Investigations Judge is pending.
As it relates to events challenged in the period after the contracts were terminated, when the companies’ activities were not solely specifically covered by Law no. 21/2006 but also carried out on behalf of the commissioner, the group companies involved are fully convinced that they acted in accordance with the law.
The directorsThe directorsThe directorsThe directors’’’’ considerations about the USW Campania projects at 30 June 2016considerations about the USW Campania projects at 30 June 2016considerations about the USW Campania projects at 30 June 2016considerations about the USW Campania projects at 30 June 2016
The general situation of the Salini Impregilo Group with respect to the USW Campania projects at 30 June 2016 still continues to be extremely complex and uncertain (as can be seen from the complexity of the above information).
The decisions of the administrative courts regarding the claims made for the costs of the RDF plants that had not been depreciated when the service contracts were terminated (15 December 2005) and the decisions
recently handed down for proceedings initiated by S.A.P. NA. S.p.A., as discussed earlier in this report, are positive and extremely important factors because they support the Group’s arguments regarding the correctness of its conduct and the resulting assessments made to date.

51
Taking also into account the decisions handed down by the administrative judges regarding the aforementioned environmental issues (which are still pending with regard to the merit) and for which the directors, with the support of the legal advisors assisting FIBE in the various disputes, deem the risk of an unfavourable outcome to be in the realm of mere possibility, at this time, an accurate timeframe for the end of
the various pending proceedings cannot be reasonably determined.
Given the complexity and range of the different disputes disclosed in the previous sections, the Group cannot exclude that events may arise in the future that cannot currently be foreseen which might require changes to these assessments.
Panama Canal extension projectPanama Canal extension projectPanama Canal extension projectPanama Canal extension project
With regard to this project, certain critical issues arose during the first stage of full-scale production which, due
to their specific characteristics and the materiality of the work to which they relate, made it necessary to significantly revise downwards the estimates on which the early phases of the project had been based. The most critical issues related, inter alia, to the geological characteristics of the excavation areas, specifically with respect to the raw materials required to produce concrete and the processing of such raw materials during normal production activities. Additional problems arose due to the adoption by the customer of operational and
management procedures substantially different from those contractually agreed, specifically with regard to the processes for the approval of technical and design solutions suggested by the contractor. These facts, which were the subject of specific disclosures in previous reports published by the Group, continued in 2013 and 2014. Faced with the customer’s persistent unwillingness to reasonably implement appropriate, contractually provided for measures to manage such disputes, the contractor - and thus the original contractor partners - was forced to acknowledge the resulting impossibility to continue the construction activities needed to
complete the project at its full and exclusive risk by undertaking the relevant full financial burden without any guarantee of the commencement of objective negotiations with the counterparty. In this context, at the end of 2013, formal notice was sent to the customer to inform it of the intention to immediately suspend work if the customer refused once again to address this dispute in accordance with a contractual approach based on good faith and the willingness of all parties to reach a reasonable agreement.
Negotiations between the parties, supported by the respective consultants and legal/contract experts, were carried out through February 2014 and, on 13 March 2014, an agreement was signed. The essential elements of the agreement provided that the contractor would resume works and functionally complete them by 31 December 2015, while the customer and contracting companies agreed to provide financial support for the works to be finished up to a maximum of about USD1.4 billion. The customer met its obligation by granting a moratorium on the refunding of already disbursed contractual advances totalling about USD800 million and
disbursing additional advances amounting to USD100 million. The group of contractor companies met their obligation by directly disbursing USD100 million and additional financial resources, through the conversion into cash of existing contractual guarantees totalling USD400 million. The reimbursement of the amounts granted to finance the work to be performed was postponed, so as to make it compatible with the expected outcome of the arbitration proceedings, already commenced to establish the responsibilities of the parties for the extra
costs already incurred and to be incurred due to the aforementioned situation.
52
At the end of 2014, the DAB (Dispute Adjudication Board), established by the parties pursuant to the contract, granted Grupo Unidos por el Canal (GUPC, the winning consortium) an extension of time of 176 days and an amount of USD244 million, of which USD233 million paid in early 2015 and a further USD10 million in the last quarter of the year. In December 2015 and January 2016, the DAB accepted the claims made by GUPC on
three separate occasions of USD6.2 million, USD24.7 million and USD11.2 million. In addition, on 20 June 2016, the DAB approved another USD2.7 million. Additional compensation is expected to be awarded for other claims currently being prepared by the DAB. These awards should be published by the end of the year.
Two separate arbitration hearings are ongoing before the International Chamber of Commerce between GUPC (with its European partners Sacyr, Salini Impregilo and Jan De Nul) and the Panama Canal Authority.
The first relates to the Cofferdam dispute and is at an advanced stage: the merit hearings were held in Miami
in July 2016 to be followed by the concluding briefs and the award, expected to be issued in the first quarter of 2017.
The second hearing covers DAB’s decisions about the claims about the inadequate quality of the basalt compared to the quality guaranteed by ACP and the lengthy delays caused by ACP to approve the design formula for the concrete mix. This proceeding is still at an initial stage.
Already in previous years, the Group applied a valuation approach to the project on the basis of which significant losses to complete the contract were recognised, offset in part by the corresponding recognition of the additional consideration claimed from the customer and determined based on the expectation that recognition of such consideration could be deemed to be reasonably certain based on the opinions expressed by its legal advisors and in light of the damages awarded by the DAB.
In 2016, the estimate for the additional costs to complete the project was updated, as well as the additional
consideration claimed from the customer (again with the support of the company’s technical and legal experts).
The Group cannot exclude that currently unforeseeable events may arise in the future which could require changes to the assessments made to date.
The work to extend the Panama Canal has been substantially completed to the customer’s satisfaction and
the Canal’s re-opening took place in June 2016.
CAVTOMI Consortium (TurinCAVTOMI Consortium (TurinCAVTOMI Consortium (TurinCAVTOMI Consortium (Turin----Milan high speed/capacity line)Milan high speed/capacity line)Milan high speed/capacity line)Milan high speed/capacity line)
With respect to the contract for the Turin-Milan high speed/capacity railway line - Novara - Milan sub-section, the general contractor Fiat (now FCA N.V.) is required to follow the contractual claims recorded by the general contractor CAVTOMI Consortium (the “consortium”), in which Salini Impregilo has a share of 74.69%, against the customer Rete Ferroviaria Italiana (“RFI”). The consortium carried out all design and execution activities
for the project.
Accordingly, on 18 April 2008, Fiat initiated contractual arbitration proceedings against RFI for the award, in particular, of damages incurred for delays in the works ascribable to the customer, non-achievement of early completion bonus also due to the customer and higher consideration. On 9 July 2013, the arbitration court
53
handed down an award in favour of Fiat, ordering RFI to pay approximately €187 million (of which about €185 million pertaining to the consortium).
RFI appealed against the award before the Rome Appeal Court on 30 September 2013 and paid the amount due to Fiat in October 2013, which, in turn, forwarded the relevant share to the consortium in December 2013.
The ruling of 23 September 2015 of the Rome Appeal Court cancelled a large part of the aforementioned arbitration award. FCA appealed to the Supreme Court and issued a claims form for the revision of the Appeal Court’s ruling.
Since the Appeal Court’s ruling is enforceable and following the notification by RFI to FCA of a writ of enforcement of approximately €175 million, FCA and RFI reached an agreement whereby FCA provided RFI with the following guarantees in order to prevent enforcement of the aforementioned ruling, without prejudice
to the parties’ substantive rights, which are subject to final judgement: (i) payment of an amount of approximately €66 million (€49 million for Salini Impregilo); and (ii) issue to RFI of a bank surety of €100 million (€75 million for Salini Impregilo).
The legal advisors representing FCA in this dispute deem that the appeal of the Appeal Court’s ruling has good and substantial chances of success; therefore, the consortium is confident that its arguments will be
accepted at the end of the dispute and that it will recover the amounts recognised as loans and receivables at the reporting date.
The Group cannot exclude that currently unforeseeable events may arise in the future which could require changes to the assessments made to date.
COCIV COCIV COCIV COCIV
With the claim form notified to the COCIV Consortium on 18 September 2014, the customer RFI S.p.A.
challenged the validity of the inter partes arbitration award of 20-21 June 2013 and also requested the return of about €108 million (approximately €74 million for Salini Impregilo) collected by COCIV as a result of the award.
The COCIV Consortium appeared in court and the case was adjourned to 17 March 2017 for clarification of the conclusions. The consortium, represented by its legal advisors, is confident that the arbitration award will
be confirmed by the ruling.
The Group cannot exclude that currently unforeseeable events may arise in the future which could require changes to the assessments made to date.
Santiago Metro Santiago Metro Santiago Metro Santiago Metro ---- ChileChileChileChile
The project for the construction of two sections of line 6 of the Santiago Metro was won in 2013 by Salini Impregilo Group, through its subsidiary Empresa Constructora Metro 6 Limitada and is worth CLP3.3 million
(Unidad de Fomento - equivalent to €122 million). A series of events interfered with the work, such as unexpected geological conditions that were very different from those reported by the customer, project engineering changes, archaeological finds and the customer’s prohibition to working at night despite the fact that it would not exceed the maximum permitted noise levels.

54
These factors led to delays that were partially recognised by the works management, but never formalised by the customer. The customer, at its own initiative and on the basis of a schedule different from that agreed, started imposing fines in November 2013. These fines were all challenged.
In addition to the above, relations with the customer were characterised by complex situations, resulting in five
requests to extend the delivery date of the work and, in 2014, to the revision of its scope.
With respect to this situation, Empresa Constructora Metro 6 Limitada submitted various claims to the customer in July 2014, and requested an Extension of Time, asking that they be assessed by the relevant contractually-provided for body.
In August 2014, the customer rejected the requests and submitted Salini Impregilo’s claim directly for arbitration before the Santiago Chamber of Commerce, failing to respect the contractual provisions requiring
prior consultation between the parties for the selection of the single arbitrator.
The first hearing was scheduled for 25 September 2014, but the customer asked it be postponed to 6 October 2014. In the meantime, on 3 October 2014, the customer informed Empresa Constructora Metro 6 Limitada of the early termination of the contract based on grounds that have been challenged in full and are currently the subject of the aforementioned arbitration. The customer has the contractual right to terminate the contract with
Empresa Constructora Metro 6 Limitada at any time, regardless of any breaches denied by it.
On the same date, the customer presented a request to the Chilean banks for the enforcement of the contract sureties (local contract guarantees secured by European banks) for a total of CLP912,174 (the equivalent of €29.9 million). These amounts also include the full enforcement of the guarantee for advance payment, even though CLP156,323 (the equivalent of €5.1 million) had already been repaid to the customer through the monthly certifications (a criminal report was filed in Chile).
The subsidiary responded to the customer’s initiatives by requesting that the surety enforcement order be suspended and that the operational and contractual conditions be reinstated to those existing on 2 October 2014.
The arbitrator did not find grounds for an urgent order to suspend enforcement of the sureties and reserved final judgment, prolonging the suspension of the works.
Therefore, the amounts corresponding to the guarantees referred to above were paid.
Negotiations with the customer are in place to settle the dispute.
The directors (supported by the legal advisors) believe that the Group has acted correctly and the amounts recognised as loans and receivables and work in progress at 30 June 2016 can be recovered.
Considering the complexity of the existing situation and the uncertainties linked to the arbitration procedure underway with respect to both the legal assessment and the relationship with the customer, however, it cannot
be ruled out that events may occur in the future which could require changes to the assessments made to date.

55
Strait of MeStrait of MeStrait of MeStrait of Messina bridge ssina bridge ssina bridge ssina bridge ---- EurolinkEurolinkEurolinkEurolink
In March 2006, as lead contractor of the joint venture created for this project (interest of 45%) (subsequently merged into Eurolink Consortium), Impregilo S.p.A. (now Salini Impregilo S.p.A.) signed a contract with Stretto di Messina S.p.A. for its engagement as general contractor for the final and executive designs and
construction of the Messina Strait Bridge and related roadway and railway connectors.
A bank syndicate also signed the financial documentation required in the General Specifications after the joint venture won the tender, for the concession of credit lines of €250 million earmarked for this project. The customer was also given performance bonds of €239 million, as provided for in the contract. Reduction of the credit line to €20 million was approved in 2010.
Stretto di Messina S.p.A. and the general contractor Eurolink S.c.p.A. signed a rider in September 2009 which
covered, inter alia, suspension of the project works carried out since the contract was signed and until that date. As provided for by the rider, the final designs were delivered to the customer and its board of directors approved them on 29 July 2011.
Decree law no. 187 was issued on 2 November 2012 providing for “Urgent measures for the renegotiation of the contracts with Stretto di Messina S.p.A. (the customer) and for local public transport”. Following enactment
of this decree and given the potential implications for its position as general contractor, Eurolink, led by Salini Impregilo, notified the customer of its intention to withdraw from the contract under the contractual terms, also to protect the positions of all the Italian and foreign co-venturers. However, given the immense interest in constructing the works, the general contractor also communicated its willingness to review its position should the customer demonstrate its real intention to carry out the project. To date, the ongoing negotiations have not been successful despite the efforts made. Eurolink has commenced various legal proceedings in Italy and the
EU, arguing that the provisions of the above decree are contrary to the Constitution and EU laws and that they damage Eurolink’s legally acquired rights under the contract. It has also requested that Stretto di Messina be ordered to pay the amounts requested by the general contractor due to the termination of the contract for reasons not attributable to it. With regard to the actions filed at EU level, in November 2013, the European Commission communicated its decision not to follow up the proceedings, as no treaties were violated, and
confirmed this on 7 January 2014, with a communication dismissing the case. As regards the civil action in Italy, Salini Impregilo S.p.A. and all the members of Eurolink have jointly and severally asked that Stretto di Messina be ordered to pay the amounts claimed, for various reasons, due to the termination of the contract for reasons not attributable to them.
Considering the complex nature of the various legal proceedings and although the legal advisors assisting Salini Impregilo and the general contractor are reasonably confident about the outcome of the proceedings
and the recoverability of the remaining assets recognised for this contract, it cannot be excluded that events not currently foreseeable may arise in the future which would require the current assessments to be revised.
Romania Romania Romania Romania ---- OrastieOrastieOrastieOrastie----Sibiu highwaySibiu highwaySibiu highwaySibiu highway
Salini Impregilo has been operating in Romania since July 2011 following the start of the works for the Orastie-Sibiu highway section contract (Lot 3).

56
In July 2013, it was awarded a second tender for the development of Lot 2 of another highway section between the cities of Lugoj and Deva.
The two contracts are part of a wider road project called Pan-European Corridor IV, which cuts through Romania from Nãdlac (on the border with Hungary) via Pitesti and reaches Costanza, on the Black Sea. Both
contracts were entered into with the Romanian National Road & Highways Company (CNADNR) and 85% financed with EU structural funds and 15% by the Romanian government.
The Orastie-Sibiu contract provided for the construction of 22.1 km of two-lane highway (plus the relevant emergency lanes). In September 2015, Salini Impregilo presented an application for arbitration to the customer for claims about the extension of the original contractual delivery times and payment of an additional consideration due to unforeseeable events and the customer’s negligent conduct. On 13 January 2016, with
works completion at 99.9%, following a number of disputes between the parties, the customer terminated the contract and enforced the contractual guarantees of approximately €13 million, motivating such unilateral decision as being due to the alleged non-resolution of non-compliances notified by works management. The aforementioned contract termination, which the parent deemed fully unfounded, was formally contested as a result. The dispute between the parties will be submitted to arbitration procedures.
The directors (also based on the advice of their legal and technical experts), believe that the parent’s operations were correct and that the amounts recognised as contract work in progress at 30 June 2016, inclusive of requests for additional consideration also part of the claim, can be collected.
Considering the uncertainties linked to the dispute’s stage, the Group cannot exclude that currently unforeseeable events may arise in the future which could require changes to the assessments made to date.
Rome Metro Rome Metro Rome Metro Rome Metro
As part of the contract for the design and construction of the works for the B1 line of the Rome Metro, Salini Impregilo commenced legal proceedings in its name and as lead contractor of the joint venture, against Roma Metropolitane S.r.l. and Roma Capitale requesting they be ordered to pay the disputed claims recorded during works execution, for which a technical appraisal by a court-appointed expert was provided.
The directors (also supported by their legal and technical experts) deem that the amounts recognised in
contract work in progress at 30 June 2016, inclusive of the additional consideration claimed from the customer and calculated based on the expectation that recognition of such consideration could be deemed to be reasonably certain also on the basis of the aforementioned expert opinions, are collectible.
Considering the uncertainties linked to the dispute stage, the Group cannot exclude that currently unforeseeable events may arise in the future which could require changes to the assessments made to date.
Naples Naples Naples Naples ---- construction of a railway section for an urban railway system, Piscinolaconstruction of a railway section for an urban railway system, Piscinolaconstruction of a railway section for an urban railway system, Piscinolaconstruction of a railway section for an urban railway system, Piscinola----Secondigliano segmentSecondigliano segmentSecondigliano segmentSecondigliano segment
Construction of the civil engineering structures for the Piscinola-Secondigliano railway section, part of a project to modernise and upgrade the Naples - Alifana railway, was suspended in the second half of 2011 due to the failure of the customer Metrocampania Nordest S.r.l. (now Ente Autonomo Volturno) to pay the consideration

57
owed for the work. As a result, the only activities carried out concerned ensuring the safety of the construction sites.
While aware of the strategic significance of the project for the purpose of completing the Naples ring railway system, the customer was unable to honour its commitments due to the financial difficulties that characterised
the budget of the Campania region, which, ultimately, created a shortage of financial resources at its subsidiary Metrocampania Nordest S.r.l., making disbursement of the consideration owed extremely difficult.
In light of this situation, the Ministry of Infrastructures and Transportation, in accordance with the provisions of Decree law no. 83 of 22 June 2012 (converted into Law no. 134 of 7 August 2012), appointed a special commissioner tasked with determining the amounts of the payables and receivables of the companies that operate the regional railway services, with the aim of developing a plan to cover the assessed deficit.
At this point, the appointed commissioner has apparently completed their task regarding the investigative and planning phase and are now expected to announce their subsequent decisions.
Considering that, in order to allow the commissioner to carry out their activities, the above-mentioned Decree law specified that no payment enforcement actions may be activated or pursued against the companies owned by the regional administration that operate railway transportation services for 12 months from the effective
date of the above-mentioned Decree law no. 83 (a deadline that has been extended several times and recently confirmed until 31 December 2016 by article 41.5 of Decree law no. 133/2014), Todini Costruzioni Generali S.p.A., subsequently replaced by HCE Costruzioni S.p.A., has nevertheless taken all actions that it deemed necessary to obtain satisfaction of its rights, while maintaining a non-confrontational relationship with its customer, which still considers completion of the railway segment in question a priority for the effective operation of the metro railway loop.
Finally, with its document of 30 June 2014 notified to the customer, Todini Costruzioni Generali S.p.A. transferred all the receivables arising from the unpaid invoices issued to Ente Autonomo Volturno to Salini Impregilo S.p.A..
During 2014, and before formalisation of the transfer deed, the customer paid approximately €8.5 million to Todini Costruzioni Generali S.p.A.. Negotiations are in place with the customer, which has also requested the
dispute concerning implementation of the lot adjacent to the Naples-Alifana railway (Secondigliano-Di Vittorio), contracted to a joint venture of which Todini Costruzioni Generali S.p.A. is the lead contractor, be included in the settlement.
In relation to the Secondigliano - Di Vittorio section (whose works were never started), the joint venture commenced legal proceedings to have the contract declared terminated, claiming compensation for all damages.
The directors (also supported by their legal and technical experts) deem that the Group acted correctly and that the amounts recognised in contract work in progress at 30 June 2016 are recoverable, inclusive of the additional consideration claimed as part of the dispute, determined based on the expectation that recognition of such consideration could be deemed to be reasonably certain, also on the basis of the aforementioned expert opinions.
58
Considering the uncertainties linked to the dispute’s stage, the Group cannot exclude that currently unforeseeable events may arise in the future which could require changes to the assessments made to date.
A1 MilanA1 MilanA1 MilanA1 Milan----Naples motorway, work to upgrade the Apennine Mountains Naples motorway, work to upgrade the Apennine Mountains Naples motorway, work to upgrade the Apennine Mountains Naples motorway, work to upgrade the Apennine Mountains section between Sasso Marconi and section between Sasso Marconi and section between Sasso Marconi and section between Sasso Marconi and Barberino di Mugello, La QuerciaBarberino di Mugello, La QuerciaBarberino di Mugello, La QuerciaBarberino di Mugello, La Quercia----Aglio segment Aglio segment Aglio segment Aglio segment
The works were substantially finished and the segment was opened to traffic in December 2015.
In June 2011, the Florence public prosecutor, at the end of an investigation launched in 2005, charged some employees/senior managers of Todini Costruzioni Generali S.p.A. with environmental crimes allegedly related to the construction of the new route across the Apennines.
On 5 November 2012, the Preliminary Hearing Judge ruled for all the accused parties that the statute of limitations had run out on the alleged crimes regarding water control and effluent management and committed
for trial the above-mentioned defendants for the alleged crimes concerning the management of excavated soil and rocks and environmental damage.
In the hearing of 26 March 2013, before the Florence Court, the Ministry of the Environment joined the proceeding seeking damages from the parties liable under civil law, that is Todini Costruzioni Generali, Autostrade per l’Italia S.p.A., and the other contractors involved (in addition to said defendants) by claiming
damages “for equivalent assets” of not less than €810 million or such amount as the Court considers just and appropriate.
In support of its claim, the Ministry of the Environment filed a report by the I.S.P.R.A. (an institute established within the Ministry), which was struck from the record of the proceedings at a hearing on 9 December 2013, as the judge ruled that the introduction of this document could not be allowed because it had not been developed in the presence of both parties and lacked the name of the party who wrote it.
Since the civil claimant failed to produce documents or consultants, at this point, the damage claim is not supported by any evidence as to its amount.
The investigation phase began in January 2014 and is still ongoing. At the hearing of 9 May 2016, HCE Costruzioni S.p.A. appeared in court as the transferee of Todini Costruzioni Generali S.p.A.’s Italia business unit, which includes the contested contract and related proceedings.
The Group denies having any responsibility for the disputed issues, emphasising that its conduct was completely lawful and that the charges levied against it are groundless. It also objects to the outrageous amount of the damage claim filed by the Ministry of the Environment, which, in addition to being presented without first requesting the adoption of any environmental remediation measures that might have been necessary, does not appear to be compliant with Italian law and European Directive no. 2004/35/EC. In this respect, the European Commission activated an infringement procedure against Italy in 2007 (no. 2007/4679),
confirmed on 27 January 2012 with a complementary reasoned opinion, which recently resulted in the adoption, with Italian Law no. 97 of 6 August 2013, of amendments to the Single Environmental Code enacted with Legislative decree no. 152 of 3 April 2006, which include the elimination from the text of article 311 of the above-mentioned Legislative decree no. 152/2006 of the reference to the damage claim “for equivalent

59
assets”, due to the fact that compensation for environmental damages can firstly be achieved with specific remediation measures.
Comforted by the opinion of its legal advisors, the Group believes that the above-mentioned damage claim is groundless and, consequently, that the risk of the claim being granted is remote. Consequently, the directors
did not find it necessary to recognise a provision in the condensed interim consolidated financial statements.
Considering the uncertainties linked to the dispute’s stage, the Group cannot exclude that currently unforeseeable events may arise in the future which could require changes to the assessments made to date.
Sesto San Giovanni buildingSesto San Giovanni buildingSesto San Giovanni buildingSesto San Giovanni building
The parent became involved in a dispute with the lessor of its previously leased registered office in 2009 following the relocation of its registered office from Sesto San Giovanni (Milan) to its current premises in Milan.
The dispute was settled with the arbitration award of December 2012, which accepted the claim made by the lessor and ordered the parent to pay the outstanding lease payments for the remaining term of the lease which expired in July 2012. The parent promptly challenged the award with the relevant Milan Appeal Court which has yet to hand down its ruling. Moreover, the parent had already provided for the outcome of the arbitration in its 2012 financial statements pending the terms for challenging it. While awaiting the Appeal Court ruling, the
parent has been obliged to pay the amount awarded to the lessor, although it reserves the right to recover it.
Pursuant to the contract signed with Immobiliare Lombarda S.p.A., which is the original lessor of the current registered office, Salini Impregilo has the right to be held harmless from claims made by its previous lessor that exceed €8 million. It exercised this right by requesting a court order, which was issued by the Milan Court and challenged by Immobiliare Lombarda. While awaiting the merit ruling, the counterparty paid the full amount of the claim, as the court refused to stay the enforcement of the payment order.
Ente Acque Umbre Toscane (Imprepar)Ente Acque Umbre Toscane (Imprepar)Ente Acque Umbre Toscane (Imprepar)Ente Acque Umbre Toscane (Imprepar)
The Group was informed that part of the sill above the surface discharge of the Montedoglio dam in the Arezzo province had been damaged on 29 December 2010. The Irrigation Body, Ente Irriguo Umbro-Toscano (now Ente Acque Umbre Toscane) notified Imprepar in January 2011 that “investigations and checks are being carried out to ascertain the reasons and responsibilities for the damage”. As the transferee of the “sundry
activities” business unit, which includes the “Montedoglio dam” contract, Imprepar informed the body that the activities related to the damaged works were carried out by another company in 1979 and 1980, from which Impregilo (then COGEFAR) only took over the contract in 1984. The works had been tested and inspected with positive results. Imprepar specifically explained its non-liability for any damage caused by the event in its communication to Ente Acque Umbre Toscane and does not believe that there are reasons to modify its related assessments, supported by the opinion of its legal advisors.
During 2012, the managers of Ente Acque Umbre Toscane and the works manager signed a service order requesting the contractor to immediately prepare executive designs and commence the related works at its own expense and under its own responsibility. Imprepar challenged these acts in full even though the amounts involved are not deemed significant.

60
As part of a prior technical assessment resulting from a third-party complaint claiming damages of a minor amount (around €80,000), the judge ordered a technical appraisal by a court-appointed expert to determine the causes of the dam’s subsidence. The court expert’s report filed in June 2015 ascribes the cause of subsidence to various concurrent factors with different negligence percentages, and, specifically: design
deficiencies 20%, execution deficiencies 60%, control deficiencies 20%. Imprepar challenged this report.
Imprepar, with the aid of its legal advisors, is defending the correctness of its conduct in all the competent forums.
C.A.V.E.T. Consortium C.A.V.E.T. Consortium C.A.V.E.T. Consortium C.A.V.E.T. Consortium ---- Florence CourtFlorence CourtFlorence CourtFlorence Court
With regard to the criminal proceedings commenced against the C.A.V.E.T. Consortium and certain individuals, including some former managers of the consortium, the appellate proceedings ended with a
decision handed down on 27 June 2011, which reversed in full the lower court’s decision, thus reversing the convictions handed down by the lower court and finding both the consortium and the indicted individuals not guilty of any of the charges. The public prosecutor of the Florence Court appealed this decision before the Supreme Court, which, on 18 March 2013, set aside in part the decision of the Florence Appeal Court ordering that the case be returned to such Appeal Court. The reinstated proceedings before the Court got underway on
30 January 2014 and, on 21 March 2014, the Appeal Court handed down a decision by which it rejected most of the charges levied by the public prosecutor, but upheld them in some important cases. The decision of the Florence Appeal Court was appealed by all defendants and by C.A.V.E.T, in its capacity as a party liable under civil law, and the relevant appeals were filed before the Supreme Court in September 2014.
On 21 April 2016, the fourth criminal section of the Supreme Court handed down its ruling cancelling without remand the 21 March 2014 ruling of the Florence Appeal Court for all the criminal charges and most of the civil
charges. It provided that only certain of the civil charges are to be heard by the competent civil law judge in an appeals hearing. The reasoning behind the Supreme Court’s ruling has yet to be filed.
Judicial investigations Judicial investigations Judicial investigations Judicial investigations ---- Milan Court (proceedings commenced at the Monza CoMilan Court (proceedings commenced at the Monza CoMilan Court (proceedings commenced at the Monza CoMilan Court (proceedings commenced at the Monza Court)urt)urt)urt)
Following the proceedings initiated by the public prosecutor before the Monza Court, in which the chairman of the board of directors and the chief executive officer of Impregilo in office at the time of the events in question
are being investigated, Impregilo S.p.A. was the target of a preliminary investigation. The alleged charge against Impregilo is to have “prepared and implemented an organisational model unsuitable to prevent the crimes” allegedly attributed to the directors involved in the investigation, from which the company is alleged to have benefited.
After structured and complex procedural phases, described in previous reports, to which we refer, on 21 March 2012, the Milan Appeal Court (as part of the appeal proceedings initiated by the public prosecutor
against the lower court’s decision that had found Impregilo not guilty of the charge of violating Legislative decree no. 231/01) rejected the public prosecutor’s arguments and fully confirmed the aforementioned decision which had found, inter alia, that the organisational model adopted by the company was adequate. The public prosecutor appealed this decision before the Supreme Court, which, on 18 December 2013, handed down decision no. 4677/14 cancelling the Milan Appeal Court’s decision, returning the proceedings to
61
a different section of the same Court for a new merit review. The ruling was resumed before the Milan Appeal Court, which, in the hearing of 19 November 2014, acquitted the company and confirmed the rest of the acquittal of the Preliminary Investigation Judge of the Milan Court of 17 November 2009.
Country riskCountry riskCountry riskCountry risk
Impregilo Lidco Lybia General Contracting Company (Libya)Impregilo Lidco Lybia General Contracting Company (Libya)Impregilo Lidco Lybia General Contracting Company (Libya)Impregilo Lidco Lybia General Contracting Company (Libya)
Salini Impregilo S.p.A. operates in Libya through a permanent establishment and a subsidiary, Impregilo Lidco Libya General Contracting Company (Impregilo Lidco), which has been active in Libya since 2009 and is 60%
owned by Salini Impregilo with the other 40% held by a local partner.
The directors do not deem that significant risks exist with respect to the permanent establishment’s contracts as work thereon has not started, except for the Koufra airport project. However, the Group’s exposure is not material as it has collected the contractual advance. The Group is also involved in the Libyan Coastal Highway project, which had not yet been started at the reporting date.
Impregilo Lidco won important contracts for the construction of:
• infrastructural works in Tripoli and Misuratah;
• university campuses in Misuratah, Tarhunah and Zliten;
• a new Conference Hall in Tripoli.
With respect to the political upheaval in Libya from the end of February 2011 and the steadily deteriorating situation up to the date of this Report, the subsidiary has always acted in accordance with the contractual
terms. The investments made up until the deterioration of the country’s political situation are fully covered by the contractually provided for advances.
It is clear that there is considerable doubt about the subsidiary’s effective ability to carry out the contracts and, accordingly, the parent does not expect to see new large developments in the subsidiary’s production in the foreseeable future.
Impairment losses on net assets and costs incurred starting from the 2012 financial statements until the reporting date approximate €71 million, which was fully included in the contract work in progress since, as described in detail below, the subsidiary expects to recover the amounts as due to force majeure.
Impregilo Lidco collected contractual advances in previous years, amounting to €179.7 million at the reporting date.
Moreover, any additional expense that may arise in this regard, consistent with the contractual terms, would
be covered by the customers under the force majeure clause. The subsidiary’s legal advisors agree with this approach. Accordingly, no new significant risks are deemed to exist for the recovery of the net assets attributable to the subsidiary, thanks in part to actions and claims filed against the customers contractually or otherwise.
To date and given the new unrest in various areas of the country in the reporting period, the country’s social
and political situation continues to be extremely complex and marked by significant critical conditions.

62
Salini Impregilo is monitoring the situation closely and it may not be excluded that events which cannot currently be foreseen may take place after the date of preparation of this report that require changes to the assessments made to date.
VenezuelaVenezuelaVenezuelaVenezuela
Salini Impregilo Group has been active in Venezuela through its permanent organisation, which directly or in association with international partners, carries out railway and hydroelectric projects with a solid base constructed in the country over more than 30 years.
In recent years, relationships with customers, which are all government agencies, have been characterised by delays in payments. This issue became more acute in 2015 due to the rapid fall in oil prices, which is Venezuela’s main source of hard currency, and social tensions that have intensified as a result of the lack of
basic foodstuffs and medicines.
With respect to the railway works and especially the P. Cabello - La Encrucijada project, the last considerations collected were in January 2015 for hard currency, whereas local currency collections took place in line with the contractual schedule. Moreover, approximately 70% of the progress billings in local currency was collected in 2015, demonstrating the customer’s interest in continuing the works.
Despite the collection difficulties and the existence of many other issues, such as the lack of raw materials, linked to the country’s complicated political-economic situation, works continued in line with budget forecasts during the period.
Given that the country’s situation continues to deteriorate, despite the efforts and costs incurred to maintain the desired production speed, there is a risk that the latter may be negatively impacted by the events of future months, such as the early end of the government’s mandate.
With respect to the hydroelectric works carried out through the OIV Tocoma Consortium, the customer requested that they be rescheduled, with the expected commissioning of the first turbine by the end of 2016. This proposal was agreed by the customer that, also in light of legitimate requests for payment of the certified debt and the definition of the future financial resources needed to ensure normal performance of the remaining work, recommenced making payments in favour of the consortium and signed a new addendum to the
contract under which the work to be completed and the related outlays have been rescheduled. In 2015, Corpoelec made payments of over USD242 million as well as approximately VEF2.8 billion.
Despite the commitments taken on by the parties with the afore-mentioned addendum, works slowed down starting from the end of 2015 as a result of delays in the latest payments (about USD80 million and VEF1.2 billion scheduled for the last quarter of the 2015). However, in October 2015, the important milestone of the filling of the dam’s reservoir to the planned level was reached in line with the works schedule.
In addition, Venezuela’s Central Bank abolished the official exchange rate and the SIMADI on 10 March 2016 and introduced two new rates:
o DIPRO (fixed), only to be used for imports of basic necessities (i.e., medicines, food staples, etc.);

63
o DICOM (floating), applicable to all other commercial transactions. This rate has depreciated by more than 300% since its introduction.
There has been a concurrent explosion in inflation with forecasts hovering around an annual 700%, leading to a drop in consumption and a large loss in purchasing power. The continued social-economic-political
uncertainty and oil price levels are having a dramatic influence on the country’s entire production system.
The projects that are being developed by Salini Impregilo Group are priority infrastructures of the utmost importance, both in economic-industrial and social terms. Accordingly, and based on the constant and careful monitoring of the country’s situation, carried out together with the Group’s partners and through discussions with customers and local government authorities to monitor and protect the Group’s positions, the assumptions about the recoverability of the Group’s net assets can be confirmed.
However, in view of the delicate and complex uncertain situation that has developed at political level, the possibility that events not foreseeable at the date of this report may arise in the future that may require changes to the assessments made to date cannot be excluded.
NigeriaNigeriaNigeriaNigeria
This country has found itself in the grips of an economic crisis for the last two years. In addition to the drop in
oil prices, which Nigeria bases its profit-earning capacity on, there is internal strife between different political and tribal fractions which has limited once again the country’s ability to meet its cash requirements and encourage development.
The current government is in extreme distress and has limited interlocutory capacity and is unable to respond
to emergencies with decisive measures. It has continued to request foreign aid, mainly from China, increasing its debt without adding value to the country’s internal growth. In addition, in June, the country’s central bank announced a new monetary policy, replacing its long-term strategy of maintaining a fixed rate to convert the local currency, the Naira, with the US dollar. It authorised the Nigerian currency’s depreciation which lost about 40% against the Euro in just a few days. The effects of this depreciation are reflected in the condensed
interim consolidated financial statements at 30 June 2016.
The construction segment is practically stagnant and most of the general contractors have suspended production activities, especially after approval of the government’s 2016 budget, which includes inadequate funds for the ongoing projects, not to mind new opportunities.
The Group’s current projects are also penalised by the limited funds made available by the customers, thus making it difficult to foresee a rapid recovery in production, apart from the Adiyan contract, which consists of the construction of a water treatment plant for Lagos. This is an undisputed priority and is being funded by the local administration rather than Nigeria’s federal government.
In view of the present critical political and economic situation, it cannot be excluded that events not
foreseeable at the date of this report may arise in the future requiring changes to the assessments made to date.

64
Turkey Turkey Turkey Turkey
Despite internal political tension and the serious public order situations in certain areas which culminated with the coup d’état foiled in July 2016, Turkey showed its considerable ability to deal with the critical external and internal issues during the period. Moreover, with its letter dated 15 March 2016, the customer Statkraft
communicated the termination of the contract for alleged non-compliance of the contractor (Salini Impregilo - Salini Insaat - NTF joint venture), without disclosing that this represents, in the joint venture’s opinion, comforted by its legal advisors, a unilateral decision by Statkraft to withdraw from the contract as a result of the serious public order situation that had emerged in the location where the works are expected to be executed, which is obviously completely unrelated to the contractor. The joint venture, therefore, opposed the customers’ decision and initiated the contractual procedure for dispute resolution. At the end of May 2016, the
site personnel had all been transferred.
Negotiations with the customer are in place to settle the dispute. Specifically, the customer requested the bank guarantees of approximately €34 million given on Salini Impregilo’s behalf be enforced. The Milan Court ordered the enforcement be blocked with its ex-parte ruling of 13 June 2016 and set the date of 14 July 2016 for the related hearing. Subsequently, the measure was confirmed with the order of 23 July 2016, whereby the
Judge recognised the contractor’s fumus boni iuris, holding that both enforcement of the guarantees and termination of the contract are not due to the joint venture’s default but to the customer’s unilateral decision, due to the very serious public order issues at the work site.
It cannot be excluded that events not currently foreseeable may take place after the date of this report which would make it necessary to modify the assessments made to date.
With respect to the other contract, Gaziantep, located in a “critical” area, the province and city of Gaziantep,
which is an important busy industrial hub for the country, are protected by a large Turkish security force assisted by NATO. There is a heightened risk of possible isolated terrorist actions, especially against government sites.
UkraineUkraineUkraineUkraine
This country’s political and economic situation is still extremely difficult. The continued instability has led to a
serious economic recession and steady worsening in Ukraine’s public finances.
Given the location of the Group’s construction sites near the cities of Poltava, for the Capital Repair M03 Kiyv-Kharkiv-Dovzhanskiy contract, and Zhytomyr, for the M06 Kiev-Chop Road Rehabilitation contract, which are far away from the areas most affected by the ongoing armed conflict in the south east, the safety of production activities has not been significantly affected. The Group is not exposed to currency depreciation risk since the contractual amounts are expressed in Euros and US dollars.
The burden of the conflict and the economic slowdown have also negatively impacted the country’s public debt, but the Group deems it reasonable to assume that the contracts awarded in Ukraine are profitable and will be able to be continued, while constantly and continuously monitoring the internal developments in the country.
65
The unstable institutional and governmental situation has affected the customer’s organisation (the Ukraine State Agency of Automobile Roads - Ukravtodor), which has recently seen the introduction of new senior managers.
These changes and the parent’s recent sale of Todini Costruzioni Generali (which had been awarded both
contracts in this country) made intensive communication with the customer necessary to avoid possible misunderstandings. Specifically, Ukravtodor is currently investigating the sale of Todini, although this transaction has not affected the works in Ukraine as they will be carried out entirely by Salini Impregilo.
Progress on the Capital Repair M03 Kiyv-Kharkiv-Dovzhanskiy was severely affected by the local situation during the period. The delayed certification of the works has made relationships with some suppliers increasingly difficult as they are affected by the above-mentioned financial difficulties.
Moreover, it cannot be excluded that currently unforeseeable events may arise in the future which would require changes be made to these assessments.
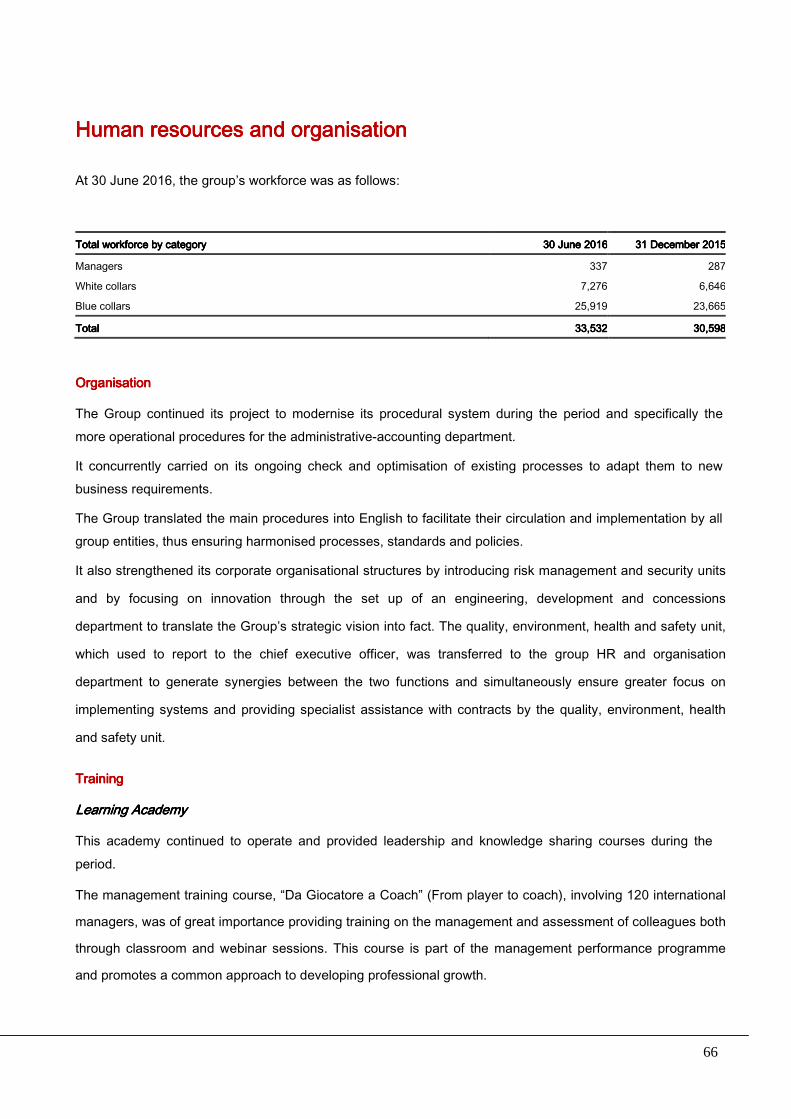
66
Human Human Human Human resources and organisationresources and organisationresources and organisationresources and organisation
At 30 June 2016, the group’s workforce was as follows:
Total workforce by categoryTotal workforce by categoryTotal workforce by categoryTotal workforce by category 30 June 201630 June 201630 June 201630 June 2016 31 December 201531 December 201531 December 201531 December 2015
Managers 337 287
White collars 7,276 6,646
Blue collars 25,919 23,665
TotalTotalTotalTotal 33,53233,53233,53233,532 30,59830,59830,59830,598
OrganisationOrganisationOrganisationOrganisation
The Group continued its project to modernise its procedural system during the period and specifically the more operational procedures for the administrative-accounting department.
It concurrently carried on its ongoing check and optimisation of existing processes to adapt them to new business requirements.
The Group translated the main procedures into English to facilitate their circulation and implementation by all group entities, thus ensuring harmonised processes, standards and policies.
It also strengthened its corporate organisational structures by introducing risk management and security units
and by focusing on innovation through the set up of an engineering, development and concessions
department to translate the Group’s strategic vision into fact. The quality, environment, health and safety unit,
which used to report to the chief executive officer, was transferred to the group HR and organisation
department to generate synergies between the two functions and simultaneously ensure greater focus on
implementing systems and providing specialist assistance with contracts by the quality, environment, health
and safety unit.
TrainingTrainingTrainingTraining
Learning AcademyLearning AcademyLearning AcademyLearning Academy
This academy continued to operate and provided leadership and knowledge sharing courses during the period.
The management training course, “Da Giocatore a Coach” (From player to coach), involving 120 international
managers, was of great importance providing training on the management and assessment of colleagues both
through classroom and webinar sessions. This course is part of the management performance programme
and promotes a common approach to developing professional growth.
67
The “Train the Trainer” course was attended by various staff levels (managers and professionals) and is designed to build up the skills of internal trainers and mentors and their ability to share their key knowledge of the Group’s business. The course focused on “Presenting to International Audiences” methods. The participants, who are all internal members, were involved as lecturers in the International Construction
Management masters course for new graduates at the Milan Polytechnic University.
During the period, the Group designed and prepared the new innovative e-learning platform to be rolled out in
the second half of the year to become the Group’s main international training hub. It will provide group
employees with access to courses they are interested in, regardless of their location. The new on-line training
programme has different courses, including a section for newly hired employees who can use innovative
methods such as tutorial videos and training pills.
Attraction and development of talentAttraction and development of talentAttraction and development of talentAttraction and development of talent
The Employer Branding plan and recruiting and The Employer Branding plan and recruiting and The Employer Branding plan and recruiting and The Employer Branding plan and recruiting and university career counselling activitiesuniversity career counselling activitiesuniversity career counselling activitiesuniversity career counselling activities
The employer branding and talent attraction plan in the most important Italian and international universities was continued during the period. The Group successfully organised and carried out 14 different projects involving university students and the business world, designed to select talented graduates, provide professional counselling and tutoring about construction sector career opportunities. They are organised
through strategic agreements with the major Italian and international universities and by leveraging engagement initiatives such as career days, recruiting days, themed workshops in university facilities, presentations and visits to construction sites as well as communications via digital and social media, university websites and the main on-line job boards, which facilitate direct, ongoing dialogue with potential candidates.
Thanks to these activities, promoted by the HR and communication units, the Group obtained two important
accolades as part of the OTAC (On Line Talent Communication) survey carried by the Swedish research
company, Potential Park. Salini Impregilo is included in the 2016 classification as one of the top Italian
companies in the “Social Media” and “Mobile” Talent Interaction categories, ranking 20th and 25th
respectively.
Master in International Construction Master in International Construction Master in International Construction Master in International Construction ManagementManagementManagementManagement
The parent successfully continued its work with Milan Polytechnic, a leading university partner, on dedicated training and internship activities for young talented graduates with level I and level II master degrees in “International Construction Management”.
The Master course, for the first time held entirely in English, is attended by 15 Italian (67%) and international
(33%) new graduates with degrees in civil engineering, construction systems, building architecture, providing unique theoretical and practical training. The course has two sections: the first of which includes classroom lessons, workshops, project works and site visits, with more than 300 hours of lessons provided by Salini

68
Impregilo professionals. The second section consists of on-the-job training where the students perform internships under the guidance of company tutors after which they are required to write their master theses.
The young engineers are thus given a view of the Group’s business and on-hands experience of what it means to participate in the construction of large works, developing innovative construction solutions and
acquiring the necessary technical skills thanks to the guidance provided by the best sector experts.
Salini Impregilo Best New Entry amongst Best EmplSalini Impregilo Best New Entry amongst Best EmplSalini Impregilo Best New Entry amongst Best EmplSalini Impregilo Best New Entry amongst Best Employers of Choice 2016oyers of Choice 2016oyers of Choice 2016oyers of Choice 2016
Salini Impregilo entered the “Top 20” of the “Best Employer of Choice” list (the list of the most desirable employers in Italy that Cesop Communication has compiled since 2002) and won the “Best New Entry 2016” award, with an overall ranking of 11 and as the only construction sector company.
Remuneration policies and Performance managementRemuneration policies and Performance managementRemuneration policies and Performance managementRemuneration policies and Performance management
““““Performance ManagementPerformance ManagementPerformance ManagementPerformance Management”””” Programme Programme Programme Programme
The performance assessment stage carried out during the period completed the 2015 performance management programme, which involved a small group of the Group’s key employees. The programme will be repeated in 2016.
ShortShortShortShort----term incentive plan for key management personnelterm incentive plan for key management personnelterm incentive plan for key management personnelterm incentive plan for key management personnel
Like in previous years, the group has continued its short-term incentive plan for key management personnel in 2016. As set out in the 2016 remuneration report, the plan provides for a bonus if annual objectives set at group, business unit and individual level are met.
Principal lPrincipal lPrincipal lPrincipal labour relationsabour relationsabour relationsabour relations
Office integration projectOffice integration projectOffice integration projectOffice integration project
As part of the integration process of the Milan and Rome offices, and with the aim of pursuing process and
corporate procedure efficiency objectives, cost optimisation for the Group as a whole and a suitable, targeted remix of the professional profiles, available internally, the parent continued to implement the decisions agreed with the trade unions and company union representatives to achieve corporate objectives and entailing some of the accompanying measures for the aforementioned company activities.

69
EEEEvents after the reporting periodvents after the reporting periodvents after the reporting periodvents after the reporting period
This section sets out the main events that have taken place since the reporting date and not commented on earlier in this report.
Framework agreement and first lot contract in TajikistanFramework agreement and first lot contract in TajikistanFramework agreement and first lot contract in TajikistanFramework agreement and first lot contract in Tajikistan
On 1 July 2016, Salini Impregilo signed a framework agreement with the Tajikistan government worth approximately USD3.9 billion to build a hydroelectric power plant. The Group, share 100%, has also been assigned the first lot of roughly USD1.9 billion to build a 335 metre-high rockfill dam with a clay core, the tallest in the world, on the Vakhsh River in Pamir, one of Central Asia’s main mountain ranges.
The agreement between Salini Impregilo and OJSC “Rogun Hydropower Project” (the state-run company that is coordinating the project) covers the exploitation of the Pamir’s huge hydroelectric potential and includes four lots. The three remaining lots will be assigned to the Group by 30 September 2016. Once completed, the plant will have six turbines of 600 MW each with a total installed capacity of 3,600 MW (the equivalent of three nuclear power plants).
Placing of additional unsecured bonds with institutional investorsPlacing of additional unsecured bonds with institutional investorsPlacing of additional unsecured bonds with institutional investorsPlacing of additional unsecured bonds with institutional investors
On 11 July 2016, the parent successfully completed the placement of additional bonds with a total nominal amount of approximately €172 million reserved to institutional investors. The new bonds form part of a single series with the previous bonds of €428 million issued on 24 June 2016 with a redemption date of 24 June 2021 (as described in the section on the key events of the period) for a total of €600 million. The new bonds will also be listed on the Irish Stock Exchange in Dublin.
70
OutloOutloOutloOutlookokokok
The ongoing growth trend was consolidated during the period even though the Group’s markets are affected by numerous macroeconomic and political uncertainties, as described in this Report.
The Group has an excellent order backlog in both quantitative and qualitative terms, its leadership position in
the water treatment segment is confirmed and it is well capable of successfully completing very complicated infrastructural works.
Moreover, its acquisition of Lane at the start of 2016 has strengthened the Group’s business model, providing it with a new base for development in a more stable area, which will allow growth in less risky markets.
71
Alternative performance indicatorsAlternative performance indicatorsAlternative performance indicatorsAlternative performance indicators
As required by Consob communication no. 6064293 of 28 July 2006, details of the performance indicators used in this Report and in the Group’s institutional communications are given below.
Financial ratios:Financial ratios:Financial ratios:Financial ratios:
Debt/equity ratioDebt/equity ratioDebt/equity ratioDebt/equity ratio: this ratio shows net financial position (shown with a minus sign when negative, i.e., net financial indebtedness) as the numerator and equity as the denominator. The items making up the financial position are presented in a specific table in the notes to the condensed interim consolidated financial
statements. The equity items are those included in the relevant section of the statement of financial position. For consolidation purposes, equity used for this ratio also includes that attributable to non-controlling interests.
Performance indicators:Performance indicators:Performance indicators:Performance indicators:
1.1.1.1. Gross operating profitGross operating profitGross operating profitGross operating profit: this ratio shows the sum of the following items included in the income statement: a. Total revenue b. Total costs, less amortisation and depreciation
This can also be shown as the ratio of gross operating profit to total revenue.
2.2.2.2. Operating profitOperating profitOperating profitOperating profit: the operating profit given in the income statement, being the sum of total revenue and total costs.
3.3.3.3. Return on sales or R.o.S.Return on sales or R.o.S.Return on sales or R.o.S.Return on sales or R.o.S.: given as a percentage, shows the ratio of operating profit (as calculated
above) to total revenue.
Adjusted income statementAdjusted income statementAdjusted income statementAdjusted income statement
The Group monitors the key figures of Lane Group for management purposes adjusting the IFRS figures prepared for consolidation purposes to present the results of the non-subsidiary joint ventures consolidated on a proportionate basis. These figures show the status of contracts managed directly by Lane or through non-
controlling investments in joint ventures ("work under management", WUM).
With respect to the acquisition of Lane Industries Incorporated, the adjusted comparative figures for the first half of 2015 have been prepared using the same consolidation scope, combining Salini Impregilo Group’s key figures, restated compared to those shown in the 2015 interim financial report to consider the final disposal scope of Todini Group, with the key figures of Lane Group, which are its consolidated figures at 30 June 2015
prepared in accordance with US GAAP.
72
Other informationOther informationOther informationOther information
Compliance with the conditions of article 36 of the Stock Exchange RegulationCompliance with the conditions of article 36 of the Stock Exchange RegulationCompliance with the conditions of article 36 of the Stock Exchange RegulationCompliance with the conditions of article 36 of the Stock Exchange Regulation
Salini Impregilo confirms that it complies with the conditions of article 36 of Consob regulation no. 16191 (“Regulation on markets”), based on the procedures adopted before article 36 was effective and the availability of the related information.
Research and developmentResearch and developmentResearch and developmentResearch and development
Pursuant to article 2428 of the Italian Civil Code, we note that the Group did not undertake any research and development activities during the period.
Repurchase of treasury sharesRepurchase of treasury sharesRepurchase of treasury sharesRepurchase of treasury shares
The repurchase programme approved by the parent’s shareholders in their ordinary meeting of 19 September 2014 started on 6 October 2014. At the reporting date, the parent had repurchased 3,104,377 treasury shares for €7,676,914.46.
Related partiesRelated partiesRelated partiesRelated parties
Reference should be made to the note 36 to the condensed interim consolidated financial statements at 30
June 2016 for a description of related party transactions.
On behalf of the board of directors
Chairman
(signed on the original)

73
Condensed interim Condensed interim Condensed interim Condensed interim
consolidated consolidated consolidated consolidated
financial financial financial financial
statements as at statements as at statements as at statements as at
and for the six and for the six and for the six and for the six
months ended 30 months ended 30 months ended 30 months ended 30
June 2016June 2016June 2016June 2016
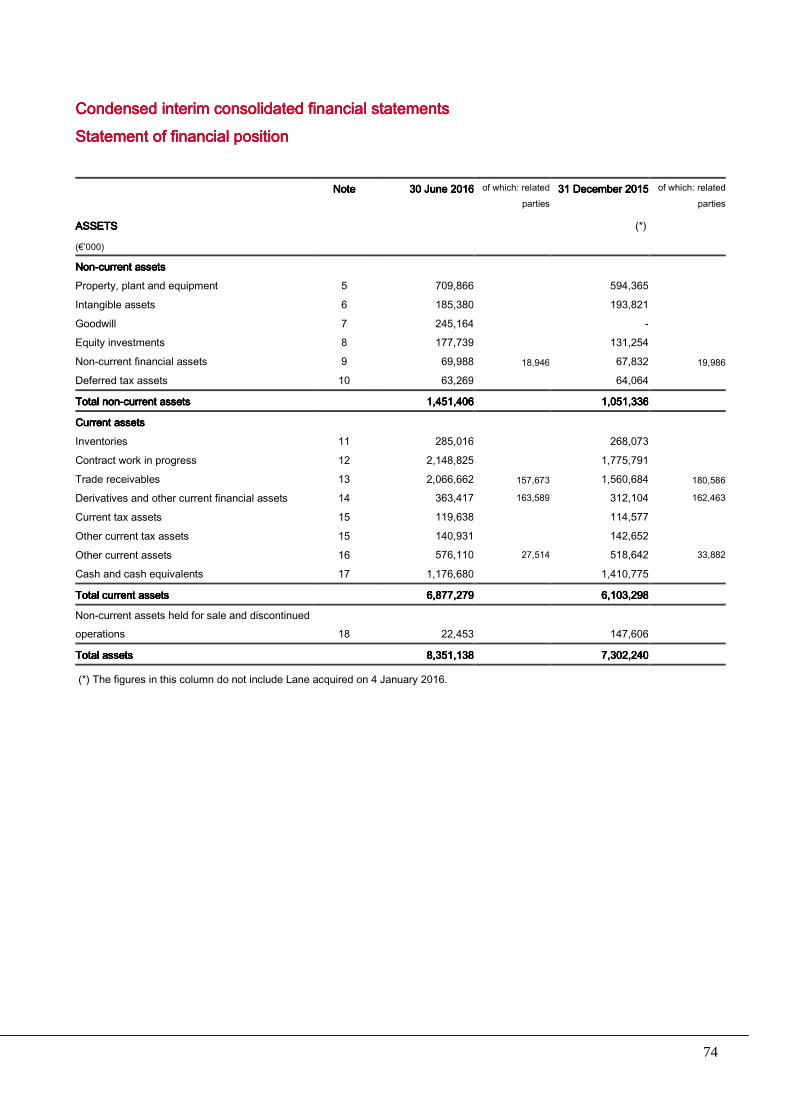
74
Condensed interim consolidated financial statementsCondensed interim consolidated financial statementsCondensed interim consolidated financial statementsCondensed interim consolidated financial statements
Statement of financial positionStatement of financial positionStatement of financial positionStatement of financial position
ASSETSASSETSASSETSASSETS
NoteNoteNoteNote 30 June 201630 June 201630 June 201630 June 2016 of which: related parties
31 December 201531 December 201531 December 201531 December 2015
(*)
of which: related parties
(€’000)
NonNonNonNon----current assetscurrent assetscurrent assetscurrent assets
Property, plant and equipment 5 709,866 594,365
Intangible assets 6 185,380 193,821
Goodwill 7 245,164 - Equity investments 8 177,739 131,254
Non-current financial assets 9 69,988 18,946 67,832 19,986
Deferred tax assets 10 63,269 64,064
Total nonTotal nonTotal nonTotal non----current assetscurrent assetscurrent assetscurrent assets 1,451,4061,451,4061,451,4061,451,406 1,051,3361,051,3361,051,3361,051,336
Current assetsCurrent assetsCurrent assetsCurrent assets
Inventories 11 285,016 268,073
Contract work in progress 12 2,148,825 1,775,791
Trade receivables 13 2,066,662 157,673 1,560,684 180,586
Derivatives and other current financial assets 14 363,417 163,589 312,104 162,463
Current tax assets 15 119,638 114,577
Other current tax assets 15 140,931 142,652
Other current assets 16 576,110 27,514 518,642 33,882
Cash and cash equivalents 17 1,176,680 1,410,775
Total current assetsTotal current assetsTotal current assetsTotal current assets 6,877,2796,877,2796,877,2796,877,279 6,103,2986,103,2986,103,2986,103,298
Non-current assets held for sale and discontinued operations 18 22,453 147,606
Total assetsTotal assetsTotal assetsTotal assets 8,351,1388,351,1388,351,1388,351,138 7,302,2407,302,2407,302,2407,302,240
(*) The figures in this column do not include Lane acquired on 4 January 2016.
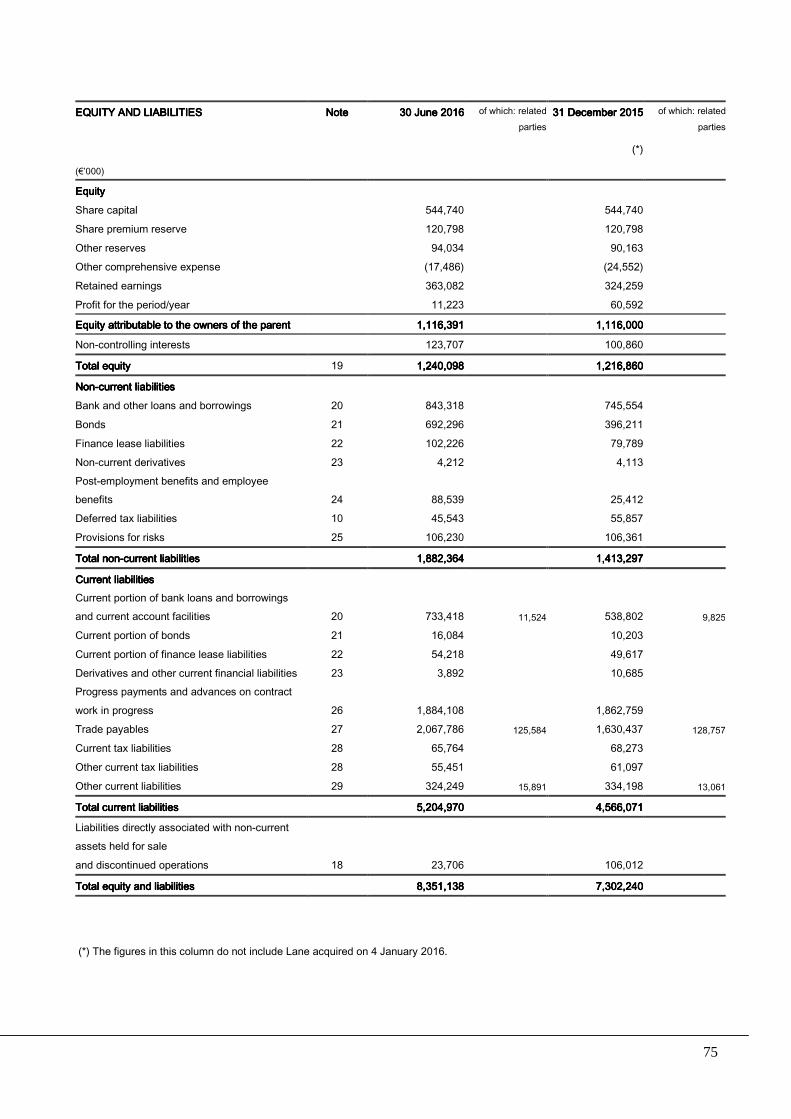
75
EQUITY AND LIABILITIESEQUITY AND LIABILITIESEQUITY AND LIABILITIESEQUITY AND LIABILITIES NoteNoteNoteNote 30 June 201630 June 201630 June 201630 June 2016 of which: related
parties31 December 201531 December 201531 December 201531 December 2015
(*)
of which: related parties
(€’000)
EquityEquityEquityEquity
Share capital 544,740 544,740
Share premium reserve 120,798 120,798
Other reserves 94,034 90,163
Other comprehensive expense (17,486) (24,552)
Retained earnings 363,082 324,259
Profit for the period/year 11,223 60,592
Equity attributable to the owners of the parentEquity attributable to the owners of the parentEquity attributable to the owners of the parentEquity attributable to the owners of the parent 1,116,3911,116,3911,116,3911,116,391 1,116,0001,116,0001,116,0001,116,000
Non-controlling interests 123,707 100,860
Total equity Total equity Total equity Total equity 19 1,240,0981,240,0981,240,0981,240,098 1,216,8601,216,8601,216,8601,216,860
NonNonNonNon----current liabilitiescurrent liabilitiescurrent liabilitiescurrent liabilities
Bank and other loans and borrowings 20 843,318 745,554
Bonds 21 692,296 396,211
Finance lease liabilities 22 102,226 79,789
Non-current derivatives 23 4,212 4,113Post-employment benefits and employee benefits 24 88,539 25,412
Deferred tax liabilities 10 45,543 55,857
Provisions for risks 25 106,230 106,361
Total nonTotal nonTotal nonTotal non----current liabilitiescurrent liabilitiescurrent liabilitiescurrent liabilities 1,882,3641,882,3641,882,3641,882,364 1,413,2971,413,2971,413,2971,413,297
Current liabilitiesCurrent liabilitiesCurrent liabilitiesCurrent liabilities
Current portion of bank loans and borrowings and current account facilities 20 733,418 11,524 538,802 9,825
Current portion of bonds 21 16,084 10,203
Current portion of finance lease liabilities 22 54,218 49,617
Derivatives and other current financial liabilities 23 3,892 10,685Progress payments and advances on contract work in progress 26 1,884,108 1,862,759
Trade payables 27 2,067,786 125,584 1,630,437 128,757
Current tax liabilities 28 65,764 68,273
Other current tax liabilities 28 55,451 61,097
Other current liabilities 29 324,249 15,891 334,198 13,061
Total current liabilitiesTotal current liabilitiesTotal current liabilitiesTotal current liabilities 5,204,9705,204,9705,204,9705,204,970 4,566,0714,566,0714,566,0714,566,071
Liabilities directly associated with non-current assets held for sale
and discontinued operations 18 23,706 106,012
Total equity and liabilitiesTotal equity and liabilitiesTotal equity and liabilitiesTotal equity and liabilities 8,351,1388,351,1388,351,1388,351,138 7,302,2407,302,2407,302,2407,302,240
(*) The figures in this column do not include Lane acquired on 4 January 2016.
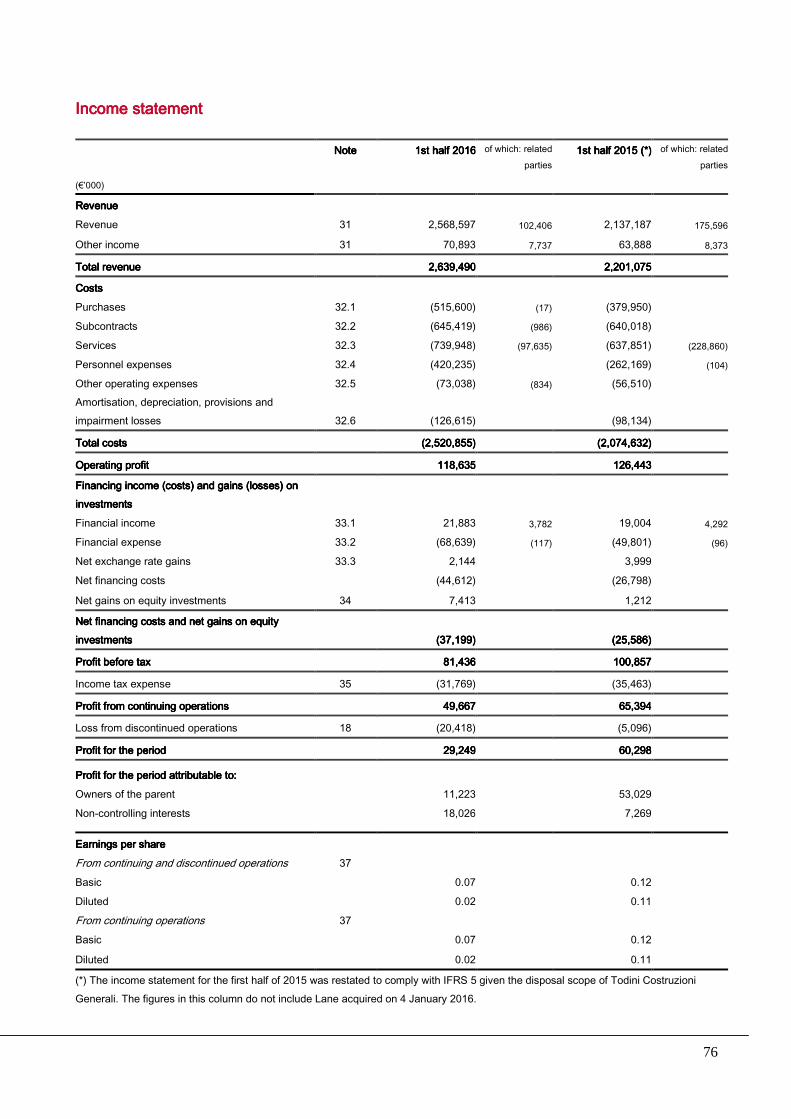
76
Income statementIncome statementIncome statementIncome statement
NoteNoteNoteNote 1st half 20161st half 20161st half 20161st half 2016 of which: related
parties1st half 20151st half 20151st half 20151st half 2015 (*)(*)(*)(*) of which: related
parties
(€’000)
Revenue Revenue Revenue Revenue Revenue 31 2,568,597 102,406 2,137,187 175,596
Other income 31 70,893 7,737 63,888 8,373
Total revenue Total revenue Total revenue Total revenue 2,639,4902,639,4902,639,4902,639,490 2,201,0752,201,0752,201,0752,201,075
CostsCostsCostsCosts
Purchases 32.1 (515,600) (17) (379,950) Subcontracts 32.2 (645,419) (986) (640,018) Services 32.3 (739,948) (97,635) (637,851) (228,860)
Personnel expenses 32.4 (420,235) (262,169) (104)
Other operating expenses 32.5 (73,038) (834) (56,510) Amortisation, depreciation, provisions and impairment losses 32.6 (126,615) (98,134)
Total costs Total costs Total costs Total costs (2,520,855)(2,520,855)(2,520,855)(2,520,855) (2,074,632)(2,074,632)(2,074,632)(2,074,632)
Operating profit Operating profit Operating profit Operating profit 118,635118,635118,635118,635 126,443126,443126,443126,443
Financing income (costs) and gains (losses) on Financing income (costs) and gains (losses) on Financing income (costs) and gains (losses) on Financing income (costs) and gains (losses) on investmentsinvestmentsinvestmentsinvestments
Financial income 33.1 21,883 3,782 19,004 4,292
Financial expense 33.2 (68,639) (117) (49,801) (96)
Net exchange rate gains 33.3 2,144 3,999 Net financing costs (44,612) (26,798)
Net gains on equity investments 34 7,413 1,212
Net financing costs and net gains on equity Net financing costs and net gains on equity Net financing costs and net gains on equity Net financing costs and net gains on equity investmentsinvestmentsinvestmentsinvestments (37,199)(37,199)(37,199)(37,199) (25,586)(25,586)(25,586)(25,586)
Profit before taxProfit before taxProfit before taxProfit before tax 81,43681,43681,43681,436 100,857100,857100,857100,857
Income tax expense 35 (31,769) (35,463)
Profit from continuing operationsProfit from continuing operationsProfit from continuing operationsProfit from continuing operations 49,66749,66749,66749,667 65,39465,39465,39465,394
Loss from discontinued operations 18 (20,418) (5,096)
Profit for the period Profit for the period Profit for the period Profit for the period 29,24929,24929,24929,249 60,29860,29860,29860,298
Profit for the period Profit for the period Profit for the period Profit for the period attributable to:attributable to:attributable to:attributable to:
Owners of the parent 11,223 53,029 Non-controlling interests 18,026 7,269
Earnings per shareEarnings per shareEarnings per shareEarnings per share
From continuing and discontinued operations 37
Basic 0.07 0.12 Diluted 0.02 0.11 From continuing operations 37
Basic 0.07 0.12
Diluted 0.02 0.11
(*) The income statement for the first half of 2015 was restated to comply with IFRS 5 given the disposal scope of Todini Costruzioni Generali. The figures in this column do not include Lane acquired on 4 January 2016.
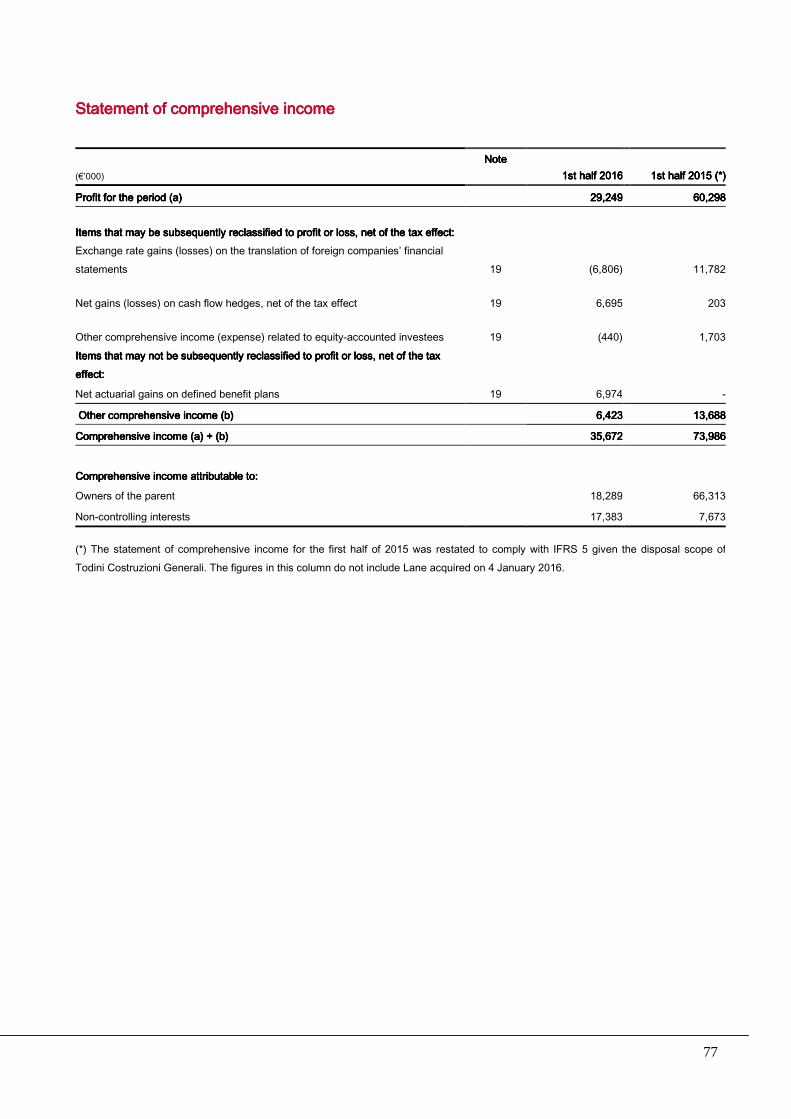
77
Statement of comprehensive incomeStatement of comprehensive incomeStatement of comprehensive incomeStatement of comprehensive income
(€’000)
NoteNoteNoteNote 1st half 20161st half 20161st half 20161st half 2016 1st half 20151st half 20151st half 20151st half 2015 (*)(*)(*)(*)
Profit for the period (a)Profit for the period (a)Profit for the period (a)Profit for the period (a) 29,24929,24929,24929,249 60,29860,29860,29860,298
Items that may be Items that may be Items that may be Items that may be subsequently reclassified to profit or loss, net of the tax effect:subsequently reclassified to profit or loss, net of the tax effect:subsequently reclassified to profit or loss, net of the tax effect:subsequently reclassified to profit or loss, net of the tax effect: Exchange rate gains (losses) on the translation of foreign companies’ financial statements 19 (6,806) 11,782
Net gains (losses) on cash flow hedges, net of the tax effect 19 6,695 203
Other comprehensive income (expense) related to equity-accounted investees 19 (440) 1,703Items that may not be subsequently reclassified to profit or loss, net of the tax Items that may not be subsequently reclassified to profit or loss, net of the tax Items that may not be subsequently reclassified to profit or loss, net of the tax Items that may not be subsequently reclassified to profit or loss, net of the tax effect:effect:effect:effect:
Net actuarial gains on defined benefit plans 19 6,974 -
Other comprehensive income (b)Other comprehensive income (b)Other comprehensive income (b)Other comprehensive income (b) 6,46,46,46,422223333 13,68813,68813,68813,688
Comprehensive income (a) + (b)Comprehensive income (a) + (b)Comprehensive income (a) + (b)Comprehensive income (a) + (b) 35,35,35,35,666672727272 73,98673,98673,98673,986
Comprehensive income attributable to:Comprehensive income attributable to:Comprehensive income attributable to:Comprehensive income attributable to:
Owners of the parent 18,289 66,313
Non-controlling interests 17,383 7,673
(*) The statement of comprehensive income for the first half of 2015 was restated to comply with IFRS 5 given the disposal scope of Todini Costruzioni Generali. The figures in this column do not include Lane acquired on 4 January 2016.

78
StatementStatementStatementStatement of cash flowsof cash flowsof cash flowsof cash flows ]h
]h NoteNoteNoteNote 1st half 20161st half 20161st half 20161st half 2016 1st half 20151st half 20151st half 20151st half 2015
]h (€’000) (*)(*)(*)(*)
Cash and cash equivalents 17 1,410,775 1,030,925
Current account facilities 20 (115,615) (27,711)
Total opening cash and cash equivalentsTotal opening cash and cash equivalentsTotal opening cash and cash equivalentsTotal opening cash and cash equivalents 1111,,,,295295295295,,,,111160606060 1111,,,,003003003003,,,,214214214214
Operating activitiesOperating activitiesOperating activitiesOperating activities
Profit from continuing operations 49,667 65,394
Amortisation of intangible assets 32 15,524 9,112
Depreciation of property, plant and equipment 32 108,001 91,912
Net impairment losses and provisions 32 3,090 (2,890)
Accrual for post-employment benefits and employee benefits 32 7,203 7,435
Net gains (losses) on the sale of assets (6,318) (4,580)
Deferred taxes 35 (1,192) 5,253
Share of profit (loss) of equity-accounted investees 34 (7,208) (649)
Income taxes 32,961 30,210
Impairment losses on available-for-sale financial assets 37,797 36,167
Other non-monetary items 15,239 205
Cash flows generated by operating activitiesCash flows generated by operating activitiesCash flows generated by operating activitiesCash flows generated by operating activities 254254254254,,,,767676764444 237237237237,,,,565656569999
Increase in inventories and work in progress (342,997) (322,650)
Increase in trade receivables (352,907) (15,044)
Decrease in progress payments and advances from customers (54,978) (83,978)
(Decrease) increase in trade payables 320,857 (19,642)
Increase in other assets/liabilities (62,141) (18,145)
Total changes in working capitalTotal changes in working capitalTotal changes in working capitalTotal changes in working capital ((((492,492,492,492,166166166166)))) (459(459(459(459,,,,459)459)459)459)
Increase in other items not included in working capital (55,526) (70,704)
Interest expense paid (28,256) (15,751)
Income taxes (27,671) (10,109)
Cash flows used in operating activitiesCash flows used in operating activitiesCash flows used in operating activitiesCash flows used in operating activities (348(348(348(348,,,,858585855555)))) (318(318(318(318,,,,454545454444))))
Investing activitiesInvesting activitiesInvesting activitiesInvesting activities
Net investments in intangible assets 6 (3,405) (770)
Investments in property, plant and equipment 5 (137,278) (102,149)
Proceeds from the sale or reimbursement value of property, plant and equipment 39,818 10,868
Investments in non-current financial assets and capital transactions 8 (17,354) (16,217)
Dividends and capital repayments from equity-accounted investees 8 15,926 796
Proceeds from the sale or reimbursement value of non-current financial assets 4,462 (270)
Cash flows used in investing activitiesCash flows used in investing activitiesCash flows used in investing activitiesCash flows used in investing activities (97(97(97(97,,,,831)831)831)831) (107(107(107(107,,,,742)742)742)742)

79
]h NoteNoteNoteNote 1st half 20161st half 20161st half 20161st half 2016 1st half 20151st half 20151st half 20151st half 2015
]h (€’000) (*)(*)(*)(*)
Financing activitiesFinancing activitiesFinancing activitiesFinancing activities
Dividends distributed to the shareholders of Salini Impregilo and non-controlling interests (24,119) (19,983)
Capital injection by non-controlling interests in subsidiaries 56 11,311
Increase in bank and other loans 2,043,938 521,766
Decrease in bank and other loans (1,384,848) (380,670)
Change in other financial assets/liabilities (27,389) (13,972)
Change in consolidation scope 3 (374,782) 169,971
Cash flows Cash flows Cash flows Cash flows generated bygenerated bygenerated bygenerated by financing activitiesfinancing activitiesfinancing activitiesfinancing activities 18181818 232,856232,856232,856232,856 288288288288,,,,423423423423
Net cash flows from discontinued operationsNet cash flows from discontinued operationsNet cash flows from discontinued operationsNet cash flows from discontinued operations 3,3523,3523,3523,352 32323232,,,,057057057057
Net exchange rate gains Net exchange rate gains Net exchange rate gains Net exchange rate gains on cash and cash equivalentson cash and cash equivalentson cash and cash equivalentson cash and cash equivalents 1111,,,,227227227227 37373737,,,,213213213213
DecreaseDecreaseDecreaseDecrease in cash and cash equivalentsin cash and cash equivalentsin cash and cash equivalentsin cash and cash equivalents (209,2(209,2(209,2(209,251515151)))) (68(68(68(68,,,,505050503333))))
Cash and cash equivalents 17 1,176,680 983,451
Current account facilities 20 (90,711) (48,740)
Total closing cash and cash equivalentsTotal closing cash and cash equivalentsTotal closing cash and cash equivalentsTotal closing cash and cash equivalents 1,085,9091,085,9091,085,9091,085,909 934,711934,711934,711934,711
(*) The statement of cash flows for the first half of 2015 was restated to comply with IFRS 5 given the disposal scope of Todini Costruzioni Generali. The figures in this column do not include Lane acquired on 4 January 2016.

80
Statement of changes in equity
Other reserves Other comprehensive income
(€’000) Share capital
Share premium
reserve Legal reserve
Share capital
increase
related
charges
Extraordinary
and other
reserves
Reserve for
treasury shares LTI reserve
Total other
reserves
Translation
reserve
Hedging
reserve
Actuarial
reserve
Total other
comprehensive
income
Retained
earnings
Profit for the
period
Equity
attributable to
the owners of
the parent
Non-controlling
interests Total
As at 1 January 2015 19 544,740 120,798 100,000 (3,970) 136 (7,677) - 88,489 15,575 1,987 (5,447) 12,115 249,988 93,773 1,109,903 76,513 1,186,416
Allocation of profit and reserves 19 1,535 1,535 - 92,238 (93,773) - -
Dividend distribution 19 - - (19,983) (19,983) (19,983)
Change in consolidation scope 19 - - 2,368 2,368 (4,601) (2,233)
Capital increase 19 - - - 11,311 11,311
Profit for the period 19 - - 53,029 53,029 7,269 60,298
Other comprehensive income 19 - 13,441 (157) 13,284 13,284 404 13,688
Comprehensive income 19 - -- - - - - - 13,441 (157) - 13,284 - 53,029 66,313 7,673 73,986
As at 30 June 2015 19 544,740 120,798 101,535 (3,970) 136 (7,677) - 90,024 29,016 1,830 (5,447) 25,399 324,611 53,029 1,158,601 90,896 1,249,497
As at 1 January 2016 19 544,740 120,798 101,535 (3,970) 136 (7,677) 139 90,163 (11,194) (8,085) (5,273) (24,552) 324,259 60,592 1,116,000 100,860 1,216,860
Allocation of profit and reserves 19 1,787 1,787 - 58,805 (60,592) - -
Dividend distribution 19 - - (19,982) (19,982) (19,982)
Change in consolidation scope 19 - - - 9,544 9,544
LTI reserve increase 19 2,084 2,084 - 2,084 2,084
Capital increase 19 - - - 56 56
Dividend distribution to non-controlling
interests 19 - - - (4,136) (4,136)
Profit for the period 19 - - 11,223 11,223 18,026 29,249
Other comprehensive income 19 - (6,525) 6,618 6,973 7,066 7,066 (643) 6,423
Comprehensive income 19 - -- -- -- - - - - (6,525) 6,618 6,973 7,066 - 11,223 18,289 17,383 35,672
As at 30 June 2016 19 544,740 120,798 103,322 (3,970) 136 (7,677) 2,223 94,034 (17,719) (1,467) 1,700 (17,486) 363,082 11,223 1,116,391 123,707 1,240,098
81
Notes to the condensed interim consolidated Notes to the condensed interim consolidated Notes to the condensed interim consolidated Notes to the condensed interim consolidated financial statementsfinancial statementsfinancial statementsfinancial statements
1. 1. 1. 1. Basis of preparationBasis of preparationBasis of preparationBasis of preparation
Salini Impregilo S.p.A. (the “parent” or “Salini Impregilo”) has its registered office in Italy. These condensed interim consolidated financial statements at 30 June 2016 include the financial statements of the parent and its
subsidiaries (the “Group”). The Group, created by the merger of the Salini and Impregilo Groups, is a global player in the large-scale infrastructure sector.
Salini Impregilo Group has prepared its condensed interim consolidated financial statements at 30 June 2016 on a going concern basis and in accordance with the International Financial Reporting Standards (IFRS) issued by the International Accounting Standards Board (IASB), endorsed by the European Union as required by Regulation 1606/2002 issued by the European Parliament and Council, implemented in Italy by Legislative
decree no. 38/2005. Specifically, these condensed interim consolidated financial statements have been drawn up pursuant to IAS 34 - Interim financial reporting and should be read in conjunction with the 2015 Annual Report. They do not include all the information required for a full set of IFRS-compliant financial statements although they comprise certain disclosures to present significant events and transactions useful to understand variations in the Group’s financial position and performance of the period.
The format and content of these condensed interim consolidated financial statements comply with the disclosure requirements of article 154-ter of the Consolidated Finance Act.
The accounting policies adopted to draw up these condensed interim consolidated financial statements at 30 June 2016 are consistent with those used to prepare the 2015 annual consolidated financial statements, to which reference should be made, except for the changes summarised in note 2.
Significant accounting estimatesSignificant accounting estimatesSignificant accounting estimatesSignificant accounting estimates
Preparation of financial statements and the related notes in accordance with the IFRS requires management
to make judgments and estimates that affect the carrying amount of assets and liabilities and financial statements disclosures. The actual results may differ from those estimated due to uncertainties underlying the assumptions and the conditions on which the estimates are based.
The significant judgements made to apply the Group’s accounting policies and the main sources of uncertainty in the estimates are the same as those applied to prepare the consolidated financial statements at 31
December 2015.
SeasonalitySeasonalitySeasonalitySeasonality
On 4 January 2016, the parent finalised the acquisition of 100% of Lane Industries Incorporated (“Lane”).
The results for the period are affected by the seasonality of Lane’s activities. It belongs to the Plant & Paving sector, which contributes roughly 40.3% of revenue. Its activities are limited during the winter and it is the most

82
active in the second half of the year. Accordingly, the Plant & Paving sector’s revenue and results for the period cannot be held to be representative of the entire year.
Translation of the assets and liabilities in foreign currency related to Venezuela Translation of the assets and liabilities in foreign currency related to Venezuela Translation of the assets and liabilities in foreign currency related to Venezuela Translation of the assets and liabilities in foreign currency related to Venezuela
At the end of the first half of 2014, the Group had to update the estimates for its industrial operations in Venezuela. In line with the previous reports, made available to the public as required by the current legal
provisions, the deterioration of the country’s economic conditions, seen since early 2014 were such that it became necessary to review the time and financial parameters according to which the Group’s net assets can be realised in this area. Moreover, in light of the current general framework of the local currency/financial market situation, stemming from the conditions of the above-mentioned local economic system, and consistently with the changes to the currency regulations of the country during 2014, the Group considered it reasonable, inter alia, to adopt, with effect from 30 June 2014, a new reference exchange rate for the
translation of both the present values of working capital denominated in the Venezuelan currency and the prospective assets/liabilities over the entire estimated life of the railway contract work in progress. Since then, the Venezuelan monetary authorities have amended the local currency conversion systems on several occasions up until the most recent change approved on 10 March 2016, introducing two new exchange rates:
• DIPRO (fixed), only to be used for imports of basic necessities (i.e., medicines, food, etc.);
• DICOM (floating), to be applied to all commercial transactions.
Given the nature of its business, the Group has decided that the DICOM is the exchange rate to be used to translate Bolivar balances as it best represents the rate at which future cash flows, expressed in the local currency, may be settled assuming that they are still valid at the measurement date, also considering the possibility to access the local currency market and the Group’s need to obtain a currency other than its functional currency.
As a result of adoption of the DICOM rate in the first half of 2016, the Group recorded a decrease of approximately €3.5 million in the carrying amount of its net assets in local currency. Moreover, the DICOM rate has depreciated by more than 300% since its introduction.
2. Changes in standards2. Changes in standards2. Changes in standards2. Changes in standards
The following standards, amendments and interpretations have been applied since 1 January 2016.
Amendment to IAS 1 - Presentation of financial statements - the amendment encourages entities to apply professional judgement in determining what information to disclose in their financial statements and provides additional guidance about how to provide and present such information. It also explicitly requires that the entity’s share of other comprehensive income of associates and joint ventures accounted for using the equity method be indicated, including the related amounts that will be or will not be subsequently reclassified to profit
or loss.

83
It also provides new guidance about the general disclosures such as, for example, the systematic presentation of the notes, the accounting policies, etc.
Amendment to IFRS 11 “Accounting for acquisitions of interests in joint operations” - the amendment requires an entity to adopt the principles of IFRS 3 to account for the acquisition of an interest in a joint operation that is
a business. This is applicable both to the acquisition of an initial interest and the subsequent acquisitions of additional interests. An entity does not remeasure a previously held interest when the acquisition of an additional interest is made to maintain joint control (i.e., the additional acquisition does not lead to control).
IFRS 7 - Financial instruments on servicing agreements - the amendment clarifies that if an entity transfers a financial asset to third parties and the derecognition conditions of IAS 39 are met, the entity shall disclose its continuing involvement in the transferred asset and explain what is meant by “continuing involvement”.
IAS 19 - Employee benefits - the amendment requires that the rate used to discount post-employment benefit obligations be determined by reference to market yields on high quality corporate bonds and, in countries where there is no deep market for HQCB, the market yields for government bonds shall be used.
Adoption of the above amendments did not significantly affect the Group’s condensed interim consolidated
financial statements.
The standards, amendments and interpretations published by the IASB but not yet endorsed by the competent EU bodies at the reporting date are set out below:
Standard, amendment or interpretationStandard, amendment or interpretationStandard, amendment or interpretationStandard, amendment or interpretation StatusStatusStatusStatus
IFRS 15 – Revenue from contracts with customers Endorsement expected by the third quarter of 2016
IFRS 9 – Financial instruments Endorsement expected by the end of 2016
IFRS 16 - Leases Endorsement scheduled for 2017
Amendments to IFRS 10, IFRS 12 and IAS 28: Investment entities - applying the consolidation exception
Endorsement expected by the third quarter of 2016
Amendment to IAS 12: Recognition of deferred tax assets for unrealised losses
Endorsement expected by the end of 2016
Amendment to IAS 7: Disclosure initiative Endorsement expected by the end of 2016
Amendment to IFRS 2: Classification and measurement of share-based payment transactions
Endorsement expected by the second quarter of 2017
Clarifications to IFRS 15: Revenue from contracts with customers
Endorsement expected by the first quarter of 2017
The Group is currently assessing the effects of adopting IFRS 15 and IFRS 16 on its consolidated financial statements and, hence, is closely monitoring their adoption.
Adoption of the above amendments will not significantly affect the Group’s consolidated financial statements.

84
3. Business combinations3. Business combinations3. Business combinations3. Business combinations
Acquisition of Lane Industries IncorporatedAcquisition of Lane Industries IncorporatedAcquisition of Lane Industries IncorporatedAcquisition of Lane Industries Incorporated
On 4 January 2016, the parent finalised the acquisition of 100% of Lane Industries Incorporated (“Lane”).
Lane Group is the top highway contractor and top private asphalt producer in the United States. It is a family-
owned business with more than 100 years of experience specialized in heavy civil construction and in the transportation infrastructure sector. The company has three divisions: asphalt production, road projects and other infrastructure projects in both domestic and international markets.
The agreed consideration was approximately USD 455 million.
The following table summarises Salini Impregilo’s share of the assets and liabilities of Lane Group at the
acquisition date and their fair value measured before such date for the Purchase Price Allocation (PPA) procedure, using the 12-month period provided for by (revised) IFRS 3.
(€’000) Carrying amount Fair value
Non-current assets 162,242 391,198
of which:
- Property, plant and equipment 115,088 115,088
- Intangible assets 5,094 5,094
- Goodwill 228,956
- Equity investments 42,060 42,060
Inventories 22,147 22,147
Trade receivables 176,078 176,078
Cash and cash equivalents 87,898 87,898
Contract work in progress 22,615 22,615
Other current assets 24,811 61,981
Total assets 495,791 761,917
Post-employment benefits and employee benefits 83,397 113,418
Non-current bank loans and borrowings 95,119 330
Other non-current liabilities 6,363 6,363
Trade payables 106,013 106,013
Other current liabilities 14,908 14,908
Current bank loans and borrowings 2,294 2,294
Progress payments and advances on contract work in progress 76,327 76,327
Total liabilities 384,421 319,653
Net assets acquired 111,370 442,264
Less non-controlling interests (13,489) (13,489)
Net assets acquired (net of non-controlling interests) 97,881 428,775

85
The cash used for the acquisition, net of cash acquired, is set out below:
(€’000)
Cash and cash equivalents 87,898
Non-current assets 391,198
Other current assets 282,821
Non-current liabilities (120,111)
Current liabilities (199,542)
Total net assets acquired 442,264
Less non-controlling interests (13,489)
Total net assets acquired attributable to the owners of the parent 428,775
Less cash acquired (87,898)
Cash and cash equivalents net of cash acquired used for the acquisition 340,877
Lane has been included in the consolidation scope since 4 January 2016 and its contribution is presented in
the Group’s condensed interim consolidated financial statements.
Acquisition of assets of Acquisition of assets of Acquisition of assets of Acquisition of assets of Asphalt Roads and Materials Company Inc. (Asphalt Roads and Materials Company Inc. (Asphalt Roads and Materials Company Inc. (Asphalt Roads and Materials Company Inc. (Virginia BeachVirginia BeachVirginia BeachVirginia Beach))))
On 21 March 2016, The Lane Construction Corporation signed an agreement for the acquisition of some assets of Asphalt Roads and Materials Company Inc, active in the road construction and asphalt production in
Virginia Beach (Virginia, USA). These assets include machinery, equipment, buildings, land, inventories, rights and commitments to complete existing contracts. The acquisition was closed on 4 April 2016 for USD38.3 million. The assets’ carrying amount is USD4.8 million.
The following table shows the assets acquired by Lane at the transaction date and their provisional fair value
after the PPA procedure. The exchange rate used on 4 April 2015 was 1.138.
(€’000) Carrying amount Fair value
Non-current assets 4,107 31,687
of which:
- Intangible assets/goodwill 20,468
Current assets 2,015
Other current assets 175 203
Net assets acquired 4,282 33,905
The following table shows the cash and cash equivalents used to acquire the assets:
(€’000)
Inventories 203
Contract work in progress 2,015
Property, plant and equipment 11,219
Goodwill 20,468
Cash and cash equivalents used in the acquisition 33,905
As allowed by IFRS 3, Lane used the 12-month period to complete the PPA procedure.

86
Other business combinationsOther business combinationsOther business combinationsOther business combinations
The 12-month period allowed by the (revised) IFRS 3 to define the PPA procedure expired during the period for the acquisitions of Co.Ge.Fin S.r.l., acquired from the related party Todini Finanziaria, and Seli Tunneling Denmark ApS, acquired from third parties. These acquisitions are described in the 2015 Annual Report.
Completion of the above procedure did not identify fair values different to those calculated provisionally and published in the 2015 Annual Report.
Other changes in the consolidation scopeOther changes in the consolidation scopeOther changes in the consolidation scopeOther changes in the consolidation scope
In addition to completion of the sale of Todini Costruzioni Generali S.p.A. and acquisition of Lane Group, the other changes in the consolidation scope of the period are described below:
• Acquisition of Salini Saudi Arabia Co. Ltd
On 23 April 2016, the Group finalised its acquisition of 51% of Salini Saudi Arabia Co. Ltd for
SAR421,066 (equivalent to €99,687 using the transaction date exchange rate) from the related parties
Salini Costruttori S.p.A. and Compagna Gestione macchinari – CO.GE.MA S.p.A.. Salini Saudi Arabia
will be used to coordinate the Group’s activities in Saudi Arabia. The acquisition has not had significant
effects on the Group’s consolidated financial statements.
• Acquisiton of 30% of Consorcio OHL
In May 2016, the Group finalised its acquisition of 30% of this Colombian consortium from third parties,
obtaining full control thereover. It is engaged in the El Quimbo project.
• Sale of 25% of the Riachuelo contract (Argentina)
On 3 February 2016, the Group completed its sale of 25% of Salini Impregilo S.p.A. - S.A. Healy
Company Jose J Chediack S.A. UTE, a SPE set up to construct an underwater effluent diffuser in
Buenos Aires, Argentina. Pursuant to IFRS 10, the effects of this sale have been recognised directly in
equity.

87
4. Seg4. Seg4. Seg4. Segment reportingment reportingment reportingment reporting
Impregilo Group’s combination with Salini Group has meant, inter alia, both the concentration of the Group’s industrial operations in its core business of the construction of complex large-scale infrastructure and the gradual disposal of assets no longer deemed strategic as well as a comprehensive review of the Group’s
organisation and business management processes.
As a result, segment reporting is presented according to macro geographical regions, based on the management review principles adopted by senior management, for the two primary geographical segments: ‘“Italy” and “Abroad”.
Costs relating to activities which are carried out centrally at the parent, Salini Impregilo S.p.A., called
“Corporate” costs, are attributed to the Italy segment and relate to:
• coordination, control and strategic planning of the Group’s activities;
• centralised planning and management of human and financial resources;
• management of administrative, tax, legal/corporate and institutional communications requirements;
• administrative, tax and management support to group companies.
These costs amounted to €58.7 million in the period compared to €61.0 million for the corresponding period
of the previous year.
Management measures the segments’ results by considering their operating profit, which is consistent with the accounting policies applied to the Group’s condensed interim consolidated financial statements.
The geographical segments are measured based on net invested capital.
Disclosures on the Group’s performance by business segment are set out in the Directors’ report. The
condensed interim consolidated financial statements figures are summarised below by geographical segment.
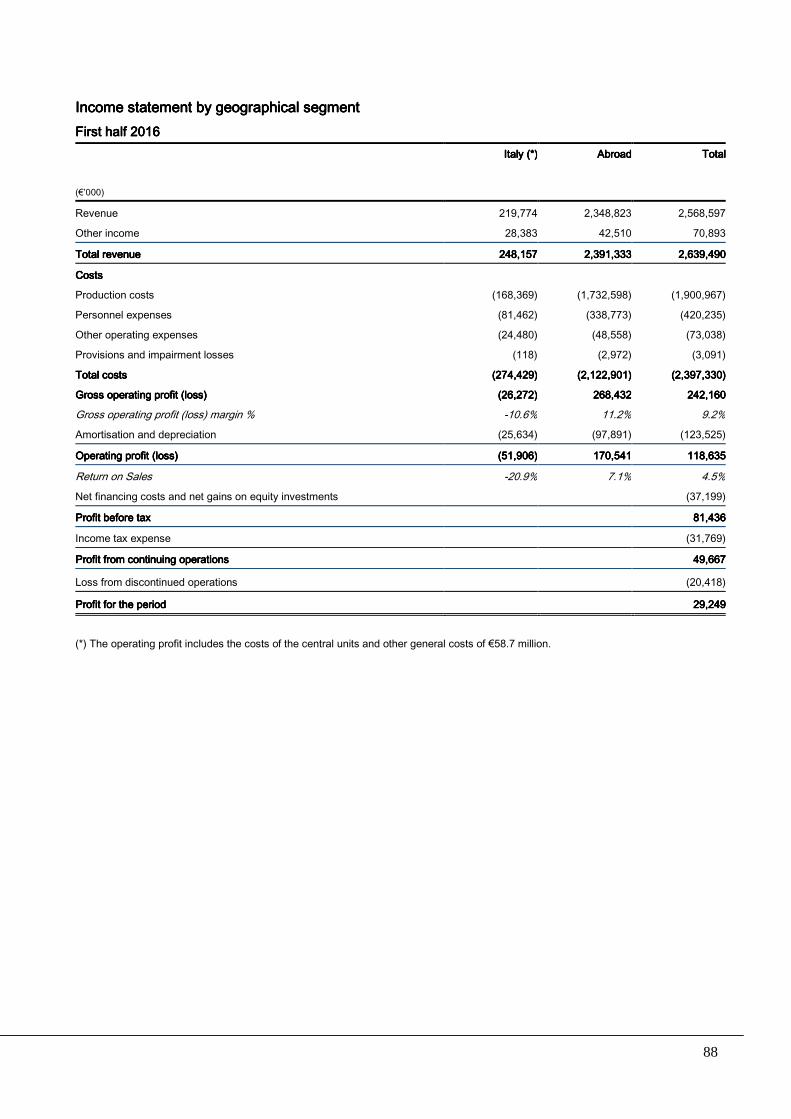
88
Income statement by geographical segmentIncome statement by geographical segmentIncome statement by geographical segmentIncome statement by geographical segment First half 2016First half 2016First half 2016First half 2016
(€’000)
ItalyItalyItalyItaly (*)(*)(*)(*) AbroadAbroadAbroadAbroad TotalTotalTotalTotal
Revenue 219,774 2,348,823 2,568,597
Other income 28,383 42,510 70,893
Total revenueTotal revenueTotal revenueTotal revenue 248248248248,,,,157157157157 2222,,,,391391391391,,,,333333333333 2222,,,,639639639639,,,,490490490490
CostsCostsCostsCosts
Production costs (168,369) (1,732,598) (1,900,967)
Personnel expenses (81,462) (338,773) (420,235)
Other operating expenses (24,480) (48,558) (73,038)
Provisions and impairment losses (118) (2,972) (3,091)
Total costsTotal costsTotal costsTotal costs (274(274(274(274,,,,429)429)429)429) (2(2(2(2,,,,122122122122,,,,909090901111)))) (2(2(2(2,,,,397397397397,,,,330)330)330)330)
Gross operating profit (loss)Gross operating profit (loss)Gross operating profit (loss)Gross operating profit (loss) (26(26(26(26,,,,272)272)272)272) 268268268268,,,,434343432222 242242242242,,,,160160160160
Gross operating profit (loss) margin % -10.6% 11.2% 9.2%
Amortisation and depreciation (25,634) (97,891) (123,525)
Operating profit (loss)Operating profit (loss)Operating profit (loss)Operating profit (loss) (51(51(51(51,,,,906)906)906)906) 170170170170,,,,545454541111 118118118118,,,,635635635635
Return on Sales -20.9% 7.1% 4.5%
Net financing costs and net gains on equity investments (37,199)
Profit before taxProfit before taxProfit before taxProfit before tax 81818181,,,,436436436436
Income tax expense (31,769)
Profit from continuing operationsProfit from continuing operationsProfit from continuing operationsProfit from continuing operations 49494949,,,,667667667667
Loss from discontinued operations (20,418)
Profit for the periodProfit for the periodProfit for the periodProfit for the period 29292929,,,,249249249249
(*) The operating profit includes the costs of the central units and other general costs of €58.7 million.
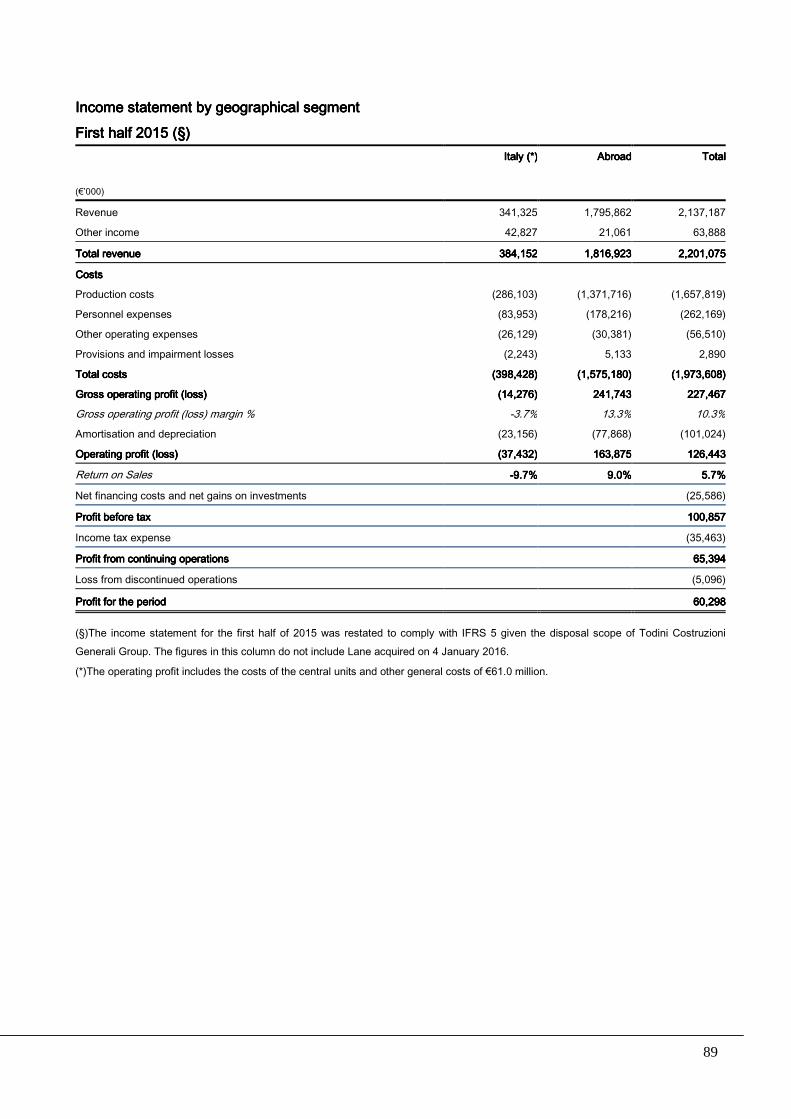
89
Income statement by geographical segment Income statement by geographical segment Income statement by geographical segment Income statement by geographical segment First half 2015 (§)First half 2015 (§)First half 2015 (§)First half 2015 (§)
(€’000)
Italy (*)Italy (*)Italy (*)Italy (*) AbroadAbroadAbroadAbroad TotalTotalTotalTotal
Revenue 341,325 1,795,862 2,137,187
Other income 42,827 21,061 63,888
Total revenueTotal revenueTotal revenueTotal revenue 384,152384,152384,152384,152 1,816,9231,816,9231,816,9231,816,923 2,201,0752,201,0752,201,0752,201,075
CostsCostsCostsCosts
Production costs (286,103) (1,371,716) (1,657,819)
Personnel expenses (83,953) (178,216) (262,169)
Other operating expenses (26,129) (30,381) (56,510)
Provisions and impairment losses (2,243) 5,133 2,890
Total costsTotal costsTotal costsTotal costs (398,428)(398,428)(398,428)(398,428) (1,575,18(1,575,18(1,575,18(1,575,180000)))) (1,973,60(1,973,60(1,973,60(1,973,608888))))
Gross operating profit (loss) Gross operating profit (loss) Gross operating profit (loss) Gross operating profit (loss) (14,276)(14,276)(14,276)(14,276) 241,74241,74241,74241,743333 227,46227,46227,46227,467777
Gross operating profit (loss) margin % -3.7% 13.3% 10.3%
Amortisation and depreciation (23,156) (77,868) (101,024)
Operating profit (loss)Operating profit (loss)Operating profit (loss)Operating profit (loss) (37,432)(37,432)(37,432)(37,432) 163,875163,875163,875163,875 126,443126,443126,443126,443
Return on Sales ----9.7%9.7%9.7%9.7% 9.0%9.0%9.0%9.0% 5.7%5.7%5.7%5.7%
Net financing costs and net gains on investments (4.748) (25,586)
Profit before taxProfit before taxProfit before taxProfit before tax 100,85100,85100,85100,857777
Income tax expense 17.236 (60.264) (35,463)
Profit from continuing operationsProfit from continuing operationsProfit from continuing operationsProfit from continuing operations 65,39465,39465,39465,394
Loss from discontinued operations (15.361) 59.412 (5,096)
Profit for the periodProfit for the periodProfit for the periodProfit for the period 60,29860,29860,29860,298
(§)The income statement for the first half of 2015 was restated to comply with IFRS 5 given the disposal scope of Todini Costruzioni Generali Group. The figures in this column do not include Lane acquired on 4 January 2016.
(*)The operating profit includes the costs of the central units and other general costs of €61.0 million.

90
Statement of financial position as at 30 June 2016 by geographical segmentStatement of financial position as at 30 June 2016 by geographical segmentStatement of financial position as at 30 June 2016 by geographical segmentStatement of financial position as at 30 June 2016 by geographical segment
(€’000)
ItalyItalyItalyItaly AbroadAbroadAbroadAbroad TotalTotalTotalTotal
Non-current assets 372,199 700,786 1,072,981,072,981,072,981,072,985555
Goodwill - 245,164 245,16245,16245,16245,164444
Assets (liabilities) held for sale, net 15,606 (16,859) (1,25(1,25(1,25(1,253333))))
Provisions for risks (92,796) (13,434) (106,23(106,23(106,23(106,230000))))
Post-employment benefits and employee benefits (14,270) (74,269) (88,539)(88,539)(88,539)(88,539)
Net tax assets 91,372 65,708 157,08157,08157,08157,080000
Working capital 457,029 339,818 796,847796,847796,847796,847
Net invested capitalNet invested capitalNet invested capitalNet invested capital 829,140829,140829,140829,140 1,1,1,1,246,914246,914246,914246,914 2,076,0542,076,0542,076,0542,076,054
Equity 1,240,0981,240,0981,240,0981,240,098
Net financial indebtedness 835,956835,956835,956835,956
Total financial resourcesTotal financial resourcesTotal financial resourcesTotal financial resources 2,076,0542,076,0542,076,0542,076,054
Statement of financial position as at 31 December 2015 by geographical segmentStatement of financial position as at 31 December 2015 by geographical segmentStatement of financial position as at 31 December 2015 by geographical segmentStatement of financial position as at 31 December 2015 by geographical segment (*)(*)(*)(*)
(€’000)
ItalyItalyItalyItaly AbroadAbroadAbroadAbroad TotalTotalTotalTotal
Non-current assets 253,050 666,390 919,440919,440919,440919,440
Assets (liabilities) held for sale, net 62,169 (20,575) 41,59441,59441,59441,594
Provisions for risks (97,091) (9,270) (106,361)(106,361)(106,361)(106,361)
Post-employment benefits and employee benefits (14,195) (11,217) (25,412)(25,412)(25,412)(25,412)
Net tax assets 83,561 52,505 136,066136,066136,066136,066
Working capital 355,518 (77,234) 278,284278,284278,284278,284
Net invested capitalNet invested capitalNet invested capitalNet invested capital 643,012643,012643,012643,012 600,599600,599600,599600,599 1,243,6111,243,6111,243,6111,243,611
Equity 1,216,8601,216,8601,216,8601,216,860
Net financial indebtedness 26,75126,75126,75126,751
Total financial resourcesTotal financial resourcesTotal financial resourcesTotal financial resources 1,243,6111,243,6111,243,6111,243,611
(*)The figures in this column do not include Lane acquired on 4 January 2016.

91
Statement of financial position Statement of financial position Statement of financial position Statement of financial position
5. Property, plant and equipment5. Property, plant and equipment5. Property, plant and equipment5. Property, plant and equipment
Property, plant and equipment amount to €709.9 million, up from the 31 December 2015 figure by €115.5
million. The historical cost and carrying amount are given in the following table:
30 June 201630 June 201630 June 201630 June 2016 31 December 2015 31 December 2015 31 December 2015 31 December 2015
(€’000) CostCostCostCost Acc. Acc. Acc. Acc.
depreciation depreciation depreciation depreciation Carrying amountCarrying amountCarrying amountCarrying amount CostCostCostCost Acc. Acc. Acc. Acc.
depreciation depreciation depreciation depreciation Carrying Carrying Carrying Carrying amountamountamountamount
Land 32,035 32,035 5,354 - 5,354
Buildings 181,865 (86,762) 95,103 152,726 (74,056) 78,670Plant and machinery 1,320,592 (799,477) 521,115 1,084,534 (634,156) 450,378
Industrial and commercial equipment 108,983 (93,345) 15,638 112,781 (93,979) 18,802
Other assets 59,819 (47,308) 12,511 57,771 (44,812) 12,959Assets under const. and payments on account 33,464 33,464 28,202 - 28,202
TotalTotalTotalTotal 1,736,7581,736,7581,736,7581,736,758 (1,026,892)(1,026,892)(1,026,892)(1,026,892) 709,866709,866709,866709,866 1,441,3681,441,3681,441,3681,441,368 (847,003)(847,003)(847,003)(847,003) 594,365594,365594,365594,365
Changes during the period are summarised below:
31 31 31 31 December December December December
2015 2015 2015 2015 IncreasesIncreasesIncreasesIncreases Depreciation Depreciation Depreciation Depreciation
(Imp. (Imp. (Imp. (Imp. losses)/losses)/losses)/losses)/
Reversals Reversals Reversals Reversals of imp. of imp. of imp. of imp. losseslosseslosseslosses
ReclassificReclassificReclassificReclassific----ationsationsationsations
DisposalsDisposalsDisposalsDisposals
Exchange Exchange Exchange Exchange rate gains rate gains rate gains rate gains
(losses) and (losses) and (losses) and (losses) and other other other other
changeschangeschangeschanges
Change in Change in Change in Change in consolidation consolidation consolidation consolidation
scope / scope / scope / scope / AcquisitionsAcquisitionsAcquisitionsAcquisitions
30 June 30 June 30 June 30 June 2016201620162016
(€’000)
Land 5,354 54 - - (758) (661) 28,046 32,035
Buildings 78,670 14,889 (8,876) 1,195 (463) (1,851) 11,539 95,103
Plant and machinery 450,378 114,347 (91,041) (8,797) (26,863) (3,382) 86,473 521,115
Industrial and commercial equipment 18,802 6,471 (5,896) (502) (2,789) (245) (203) 15,638
Other assets 12,959 1,517 (2,188) 162 (312) (218) 591 12,511
Assets under const. and payments on account
28,202 - - 7,683 (2,315) (183) 77 33,464
TotalTotalTotalTotal 594,365594,365594,365594,365 137,278137,278137,278137,278 (108,001)(108,001)(108,001)(108,001) ---- (259)(259)(259)(259) (33,500)(33,500)(33,500)(33,500) (6,54(6,54(6,54(6,540000)))) 126,523126,523126,523126,523 709,86709,86709,86709,866666
The most significant changes include:
• increases of €137.3 million, mainly related to the projects in Italy (the high speed/capacity Milan-Genoa railway section) and abroad (Line 3 of the Riyadh Metro in Saudi Arabia, the Ruta del Sola project in Colombia and the Nenskra hydroelectric project in Georgia) as well as investments for Lane Group’s foreign contracts;

92
• depreciation for the period of €108.0 million;
• disposals of €33.5 million, principally related to plant and machinery. These disposals mostly refer to contracts nearing completion;
• the change in the consolidation scope of €126.5 million, mainly due to the Group’s acquisition of Lane
on 4 January 2016 (€115.1 million) and Lane Group’s acquisition of assets of Asphalt Roads and Materials Company Inc. on 21 March 2016 (€11.2 million). Note 3 - Business combinations provides information about these acquisitions.
The closing balance at 30 June 2016 includes leased assets of €190.5 million recognised under “Buildings” (€0.7 million), “Plant and machinery” (€187.3 million), “Industrial and commercial equipment” (€1.8 million) and “Other assets (€0.8 million).
6. Intangible assets6. Intangible assets6. Intangible assets6. Intangible assets
Intangible assets amount to €185.4 million, down from the 31 December 2015 figure by €8.5 million. The historical cost and carrying amount are given in the following table:
30 30 30 30 June 2016June 2016June 2016June 2016 31 December 201531 December 201531 December 201531 December 2015
(€’000) CostCostCostCost Acc. Acc. Acc. Acc.
amortisation amortisation amortisation amortisation Carrying amountCarrying amountCarrying amountCarrying amount CostCostCostCostAcc. Acc. Acc. Acc.
amortisation amortisation amortisation amortisation Carrying Carrying Carrying Carrying amountamountamountamount
Rights to infrastructure under concession 72,442 (8,961) 63,481 73,984 (9,098) 64,886Contract acquisition costs 193,923 (80,293) 113,630 193,923 (66,209) 127,714Other 15,315 (7,046) 8,269 3,331 (2,110) 1,221
TotalTotalTotalTotal 281,680281,680281,680281,680 (96,(96,(96,(96,300300300300)))) 185,380185,380185,380185,380 271,238271,238271,238271,238 (77,417)(77,417)(77,417)(77,417) 193,821193,821193,821193,821
The rights to infrastructure under concession of €63.5 million are in line with the previous year-end balance. Changes of the period are detailed in the following table:
(€’000)
31 December 31 December 31 December 31 December 2015201520152015
IncreasesIncreasesIncreasesIncreases Amortisation Amortisation Amortisation Amortisation Exchange Exchange Exchange Exchange rate gains rate gains rate gains rate gains
(losses)(losses)(losses)(losses)
Change in Change in Change in Change in consolidation consolidation consolidation consolidation
scopescopescopescope
30 June 201630 June 201630 June 201630 June 2016
SA.BRO.M. 43,491 316 43,807Parking Glasgow 19,452 (492) (1,002) 17,958Mercovia 1,943 232 (174) (285) 1,716
TotalTotalTotalTotal 64,88664,88664,88664,886 545454548888 (666)(666)(666)(666) (1,287)(1,287)(1,287)(1,287) ---- 63,4863,4863,4863,481111
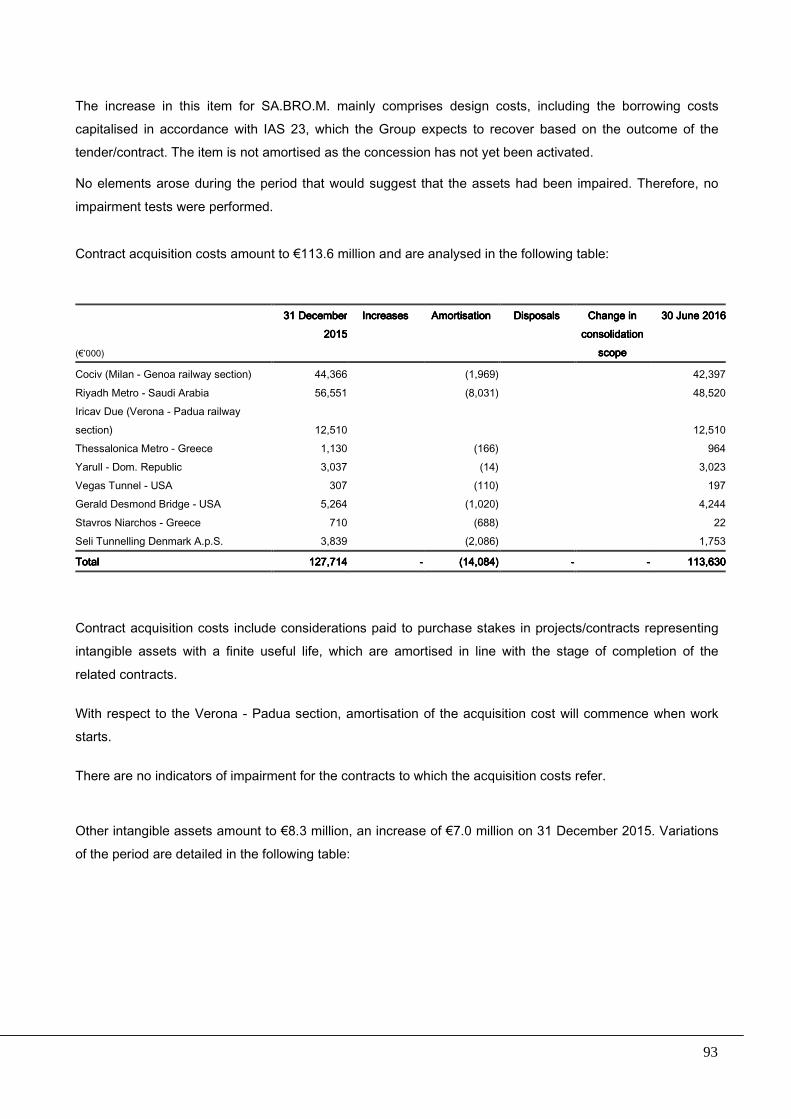
93
The increase in this item for SA.BRO.M. mainly comprises design costs, including the borrowing costs capitalised in accordance with IAS 23, which the Group expects to recover based on the outcome of the tender/contract. The item is not amortised as the concession has not yet been activated.
No elements arose during the period that would suggest that the assets had been impaired. Therefore, no
impairment tests were performed.
Contract acquisition costs amount to €113.6 million and are analysed in the following table:
(€’000)
31 December 31 December 31 December 31 December 2015201520152015
IncreasesIncreasesIncreasesIncreases AmortisationAmortisationAmortisationAmortisation DisposalsDisposalsDisposalsDisposals Change in Change in Change in Change in consolidation consolidation consolidation consolidation
scopescopescopescope
30 June 201630 June 201630 June 201630 June 2016
Cociv (Milan - Genoa railway section) 44,366 (1,969) 42,397Riyadh Metro - Saudi Arabia 56,551 (8,031) 48,520Iricav Due (Verona - Padua railway section) 12,510 12,510Thessalonica Metro - Greece 1,130 (166) 964Yarull - Dom. Republic 3,037 (14) 3,023Vegas Tunnel - USA 307 (110) 197Gerald Desmond Bridge - USA 5,264 (1,020) 4,244Stavros Niarchos - Greece 710 (688) 22Seli Tunnelling Denmark A.p.S. 3,839 (2,086) 1,753
TotalTotalTotalTotal 127,714127,714127,714127,714 ---- (14,08(14,08(14,08(14,084444)))) ---- ---- 113,63113,63113,63113,630000
Contract acquisition costs include considerations paid to purchase stakes in projects/contracts representing intangible assets with a finite useful life, which are amortised in line with the stage of completion of the
related contracts.
With respect to the Verona - Padua section, amortisation of the acquisition cost will commence when work starts.
There are no indicators of impairment for the contracts to which the acquisition costs refer.
Other intangible assets amount to €8.3 million, an increase of €7.0 million on 31 December 2015. Variations of the period are detailed in the following table:

94
(€’000)
31 31 31 31 December December December December
2015201520152015
IncreasesIncreasesIncreasesIncreases AmortisationAmortisationAmortisationAmortisation ReclassificReclassificReclassificReclassific----ationsationsationsations
DisposalsDisposalsDisposalsDisposals Exchange Exchange Exchange Exchange rate gains rate gains rate gains rate gains
(losses)(losses)(losses)(losses)
Change in Change in Change in Change in consolidation consolidation consolidation consolidation
scopescopescopescope
30 June 30 June 30 June 30 June 2016201620162016
Industrial patents 13 (12) 1
Concessions 2 (125) (60) 3,036 2,853
Software 960 799 (578) (69) 2,040 3,152
Other 246 2,058 (59) 18 2,263
Total Total Total Total 1,2211,2211,2211,221 2,852,852,852,857777 (774)(774)(774)(774) ---- ---- (12(12(12(129999)))) 5,0945,0945,0945,094 8,2698,2698,2698,269
The change in the consolidation scope refers to Lane, acquired on 4 January 2016. More information is available in note 3 - Business combinations.
7. Goodwill7. Goodwill7. Goodwill7. Goodwill
This item of €245.2 million relates to the acquisition of Lane (€224.3 million) and the assets of Asphalt Roads and Materials Company Inc. (€20.9 million), described in note 3 - Business combinations.
The following table shows the variations of the period:
(€’000)
31 31 31 31 DecemberDecemberDecemberDecember 2015201520152015 4 4 4 4 JanuaryJanuaryJanuaryJanuary 2016 2016 2016 2016 LaneLaneLaneLane acquisitionacquisitionacquisitionacquisition
4 4 4 4 AprilAprilAprilApril 2016 Virginia 2016 Virginia 2016 Virginia 2016 Virginia BeachBeachBeachBeach acquisitionacquisitionacquisitionacquisition
Exchange rate gains Exchange rate gains Exchange rate gains Exchange rate gains (losses)(losses)(losses)(losses)
30 30 30 30 JuneJuneJuneJune 2016201620162016
Lane Group - 228,956 (4,670) 224,286
Asphalt Roads and Materials Co. assets - 20,468 410 20,878
TotalTotalTotalTotal ---- 228,956228,956228,956228,956 20,46820,46820,46820,468 (4,260)(4,260)(4,260)(4,260) 245,164245,164245,164245,164
8. Equity investments8. Equity investments8. Equity investments8. Equity investments
Equity investments increased by €46.5 million to €177.7 million.
The main changes that led to differences in the carrying amounts of the equity investments are summarised below:
(€’000) 1st half 20161st half 20161st half 20161st half 2016
Change in consolidation method Capital transactions 17,354 Change in consolidation scope 42,007 Acquisitions, capital injections and disinvestments (4,684) Share of profit of equity-accounted investees 6,990 Dividends from equity-accounted investees (15,926) Other changes including change in the translation reserve 744
TotalTotalTotalTotal 46,446,446,446,485858585

95
Changes in the consolidation scope relate to Lane’s interests in joint ventures.
The Group’s share of profit of equity-accounted investees totals €7 million, considering also the figures shown in note 25, detailing the changes in the provision for risks on equity investments. The effect on profit or loss is analysed in note 34.
The key figures of the equity-accounted investees are set out below:
(in €’000) IFRSIFRSIFRSIFRS
]h
EntityEntityEntityEntity CountryCountryCountryCountry BusinessBusinessBusinessBusiness %%%% Carrying amountCarrying amountCarrying amountCarrying amount Equity under Equity under Equity under Equity under local GAAPlocal GAAPlocal GAAPlocal GAAP
Total assetsTotal assetsTotal assetsTotal assets Net financial Net financial Net financial Net financial position position position position
(indebtedness)(indebtedness)(indebtedness)(indebtedness)
EquityEquityEquityEquity RevenueRevenueRevenueRevenue Profit (loss) Profit (loss) Profit (loss) Profit (loss) for the periodfor the periodfor the periodfor the period
Cons. Agua Azul S.A. Peru
Operator-water cycle
25.50% 6,734 6,734 7,333 582 6,734 1,593 558
Ochre Solutions Ltd. GB –Operator hospital sector
40.00% 5,215 (2,110) 79,137 (53,804) (2,110) 3,095 (281)
Grupo Unido por el Canal Panama
Construction work-Panama Canal extension project
38.40% 34,204 (187,181) 558,273 (77,695) (187,181) 86,943 (4,993)
AGL Constructor JV US Construction work
20.00% 6,514 6,371 21,450 3,232 6,371 29,241 1,425
Skanka Granite JV US Motorway construction
30.00% 8,009 7,802 70,380 50,741 7,802 46,576 5,223
SGL I4 Leasing US Lease services 30.00% 17,732 17,763 17,826 3,438 17,763 798 92
Fluor-Lane US
Motorway construction
35.00% (79) (79) 499 499 (79) - -
Fluor-Lane 95 LLC US Motorway construction
35.00% 1,384 1,384 7,571 7,351 1,384 1,902 627
Flatiron- Lane US Motorway construction
45.00% 32 32 169 169 32 - -
GLLP Gemma Liberty US Civil work construction
25.00% (447) (239) 3,793 859 (239) 4,671 904
GLPP Gemma Patriot US Civil work construction
25.00% (1,218) (1,208) 8,555 2,560 (1,208) 10,588 2,149
Gaziantep Hastane Sanglik Turkey Operator hospital sector
35.50% 3,929 3,929 4,361 186 3,929 - (28)
Yuma Colombia Motorway construction
48.33% 13,222 13,222 104,042 (84,481) 13,222 9,931 1,149

96
9. No9. No9. No9. Nonnnn----current financial assetscurrent financial assetscurrent financial assetscurrent financial assets
Non-current financial assets of €70.0 million are analysed in the following table:
(€’000) 30 June 201630 June 201630 June 201630 June 2016 31 December 201531 December 201531 December 201531 December 2015 VariationVariationVariationVariation
Other financial assets 19,331 19,638 (307)
Loans and receivables - unconsolidated group companies and other related parties
18,946 19,986 (1,040)
Loans and receivables - third parties 31,711 28,208 3,503
Total Total Total Total 69,98869,98869,98869,988 67,83267,83267,83267,832 2,1562,1562,1562,156
The other financial assets include unlisted guaranteed-return securities which mature after one year. They
amount to €19.3 million at period end (31 December 2015: €19.6 million) and mainly comprise units in the fund financing Yuma.
Loans and receivables - unconsolidated group companies and other related parties decreased by €1.0 million to €18.9 million. They include receivables from the English associate Ochre Holding (€11.2 million), the English associate Impregilo Wolverhamption (€0.7 million) and HCE Group companies (€7.0 million).
Loans and receivables - third parties amount to €31.7 million, showing a €3.5 million increase on 31
December 2015. They include:
• receivables arising on the sale of the investment in the Argentine operator Caminos de Las Sierras to the Cordoba provincial authorities (Argentina) in 2010 by the subsidiary Impregilo International Infrastructures N.V., which accrue interest at a fixed rate of 9.50% as follows:
− the amount due from Caminos de Las Sierras, related to the loan granted by Impregilo International
Infrastructures to the Argentine operator in the past, which was restructured as part of the sales agreements. The outstanding balance of €9.9 million at the reporting date includes €2.1 million due after one year and €7.8 million due within one year;
− the receivable from the Cordoba provincial authorities, which also refers to the sale of the investment in Caminos de Las Sierras and amounts to €3.2 million due within one year.
These loans and receivables are repaid regularly according to the schedule set in the agreements with
the counterparties;
• loans and receivables of €21.8 million related to the concessions of the indirect subsidiaries Corso del Popolo S.p.A. and Piscine dello Stadio S.r.l.;
• loans and receivables of €7.5 million with Prime System Kz Ltd being the non-currrent portion of the receivables for the sale of Todini Costruzioni Generali;
• other of €0.3 million.

97
The decrease in loans and receivables - third parties is mainly due to the reclassification of amounts due before 30 June 2017 to current, specifically, those related to Caminos de Las Sierras described above and the receivable from Prime System Kz which arose during the period.
10. Deferred tax assets and liabilities10. Deferred tax assets and liabilities10. Deferred tax assets and liabilities10. Deferred tax assets and liabilities
Deferred tax assets and liabilities amount to €63.3 million and €45.5 million at 30 June 2016, respectively. Changes of the period, shown in the following table, reflect adjustments made on the basis of the information available at the reporting date:
(€’000) 30 June 201630 June 201630 June 201630 June 2016 31 December 201531 December 201531 December 201531 December 2015 VariationVariationVariationVariation
Deferred tax assets 63,269 64,064 (795)
Deferred tax liabilities (45,543) (55,857) 10,314
11. Inventories11. Inventories11. Inventories11. Inventories
Inventories total €285.0 million at the reporting date, as shown in the following table:
30 June 201630 June 201630 June 201630 June 2016 31 December 201531 December 201531 December 201531 December 2015
(€’000)
Gross Gross Gross Gross carrying carrying carrying carrying amountamountamountamount AllowanceAllowanceAllowanceAllowance
Carrying Carrying Carrying Carrying amountamountamountamount
Gross Gross Gross Gross carrying carrying carrying carrying amountamountamountamount AllowanceAllowanceAllowanceAllowance
Carrying Carrying Carrying Carrying amountamountamountamount VariationVariationVariationVariation
Real estate projects 22,085 (8,597) 13,488 22,085 (8,597) 13,488 -
Finished products and goods 2,945 2,945 3,448 3,448 (503)
Raw materials, consumables and supplies
272,437 (3,854) 268,583 252,666 (1,529) 251,137 17,446
TotalTotalTotalTotal 297,467297,467297,467297,467 (12,451)(12,451)(12,451)(12,451) 285,016285,016285,016285,016 278,199278,199278,199278,199 (10,126)(10,126)(10,126)(10,126) 268,073268,073268,073268,073 16,94316,94316,94316,943
Real estate projectsReal estate projectsReal estate projectsReal estate projects
Real estate projects amount to €13.5 million, substantially unchanged from the previous year end. They mainly relate to the real estate project of €11.6 million (net of the related allowance of €7.8 million) for the construction of a trade point in Lombardy for which a dispute is pending about the zoning provisions of the area on which the property stands. Based also on its legal advisors’ opinion, the Group deems that the
carrying amount can be recovered through the real estate project or, alternatively, through recognition of the damage incurred due to non-authorisation of the zoning of the area by the competent authorities.

98
Finished products and goods and Raw materials, consumables and suppliesFinished products and goods and Raw materials, consumables and suppliesFinished products and goods and Raw materials, consumables and suppliesFinished products and goods and Raw materials, consumables and supplies
The carrying amount of these items totals €2.9 million and €268.6 million, respectively, and mainly relates to materials and goods to be used for foreign contracts, including those in Ethiopia (€138.9 million), Venezuela (€17.6 million), Nigeria (€7.7 million), Saudi Arabia (€12.8 million) and the US (€27.2 million).
The carrying amount of raw materials, consumables and supplies is net of an allowance of €3.9 million, analysed below:
31 December 31 December 31 December 31 December 2015201520152015
WriteWriteWriteWrite----downs downs downs downs UtilisationsUtilisationsUtilisationsUtilisations ReversalsReversalsReversalsReversals Change in Change in Change in Change in consolidation consolidation consolidation consolidation
scopescopescopescope
ExchangeExchangeExchangeExchange rate rate rate rate gains gains gains gains
(losses)/Other (losses)/Other (losses)/Other (losses)/Other changeschangeschangeschanges
30 June 201630 June 201630 June 201630 June 2016
(€’000)
Allowance - raw materials (1,529) (351) 1,722 (1,170) (2,526) (3,854)
TotalTotalTotalTotal (1,529)(1,529)(1,529)(1,529) (351)(351)(351)(351) 1,7221,7221,7221,722 ---- (1,170)(1,170)(1,170)(1,170) (2,526)(2,526)(2,526)(2,526) (3,854)(3,854)(3,854)(3,854)
12. 12. 12. 12. Contract work in progressContract work in progressContract work in progressContract work in progress
Contract work in progress totals €2,148.8 million at the reporting date, up €373.0 million on the previous year-end figure. The increase includes ongoing production calculated using the most recent estimates of the current contracts’ profitability.
The following table shows contract work in progress calculated using the stage of completion method, net of losses realised or estimated at the reporting date and progress billings:
(€’000) 30 June 201630 June 201630 June 201630 June 2016 31 December 31 December 31 December 31 December 2015201520152015 VariationVariationVariationVariation
Contract work in progress 29,700,763 27,960,191 1,740,572
Progress payments and advances received (on approved work) (27,551,938) (26,184,400) (1,367,538)
TotalTotalTotalTotal 2,148,822,148,822,148,822,148,825555 1,775,7911,775,7911,775,7911,775,791 373,03373,03373,03373,034444
The most significant work in progress relates to railway work in Venezuela (€255.6 million), the hydroelectric plants in Ethopia (€126.6 million), the high speed/capacity railway work in Italy (€156.9 million), the hydroelectric, road and civil building works in Nigeria (€65.3 million), the Copenhagen Cityringen Metro in Denmark (€229.6 million), the Doha Metro and the Al Bayt Stadium in Al Khor, Qatar (€190.1 million), the design and construction of motorways in Romania (€87.5 million) and work in progress in Libya (€144.6
million). With respect to the works in Libya, the subsidiary Lidco collected contractual advances in previous years amounting to €179.7 million at the reporting date, recognised as “Advances for contract work in progress” under liabilities in the statement of financial position.

99
The item shows an increase over 31 December 2015 mainly due to continuation of production on the contracts in Denmark (€84.6 million, due to the Copenhagen Cityringen Metro contract), in Qatar (€120.0 million, mainly referred to construction of the Al Bayt Stadium in Al Khor and the Red Line North Underground), in Australia (€54.2 million, to build the Sydney Metro Northwest Project - Design and
Construction of Surface and Viaduct Civil Works) and the in US (€38.9 million, as a result of the work carried out by Lane).
A breakdown of contract work in progress by geographical segment is as follows:
(€’000) 30 June 201630 June 201630 June 201630 June 2016 31 December 201531 December 201531 December 201531 December 2015 VariationVariationVariationVariation
Italy 417,387 399,625 17,762
EU (excluding Italy) 367,426 247,378 120,048
Non-EU 135,038 106,464 28,574
Asia 34,315 16,310 18,005
Middle East 210,266 115,991 94,275
Africa 508,910 546,857 (37,947)
North America 38,855 613 38,242
Latin America 368,079 328,251 39,828
Oceania 68,549 14,302 54,247
TotalTotalTotalTotal 2,148,822,148,822,148,822,148,825555 1,775,7911,775,7911,775,7911,775,791 373,03373,03373,03373,034444
The section on the “Main risk factors and uncertainties” in the Directors’ report provides information on pending disputes and assets exposed to country risk.
The section on the “Performance by geographical segment” in the Directors’ report provides more details about the contracts and the progress made on the main contracts.
13. Trade receivables 13. Trade receivables 13. Trade receivables 13. Trade receivables
At 30 June 2016, trade receivables amount to €2,066.7 million, a net increase of €506.0 million compared to 31 December 2015. The item includes receivables of €157.7 million from unconsolidated group companies and other related parties.
It is analysed in the following table:
(€’000) 30 June 201630 June 201630 June 201630 June 2016
31 December 31 December 31 December 31 December 2015201520152015
VariationVariationVariationVariation
Third parties 1,908,989 1,380,098 528,891Unconsolidated group companies and other related parties 157,673 180,586 (22,913)
TotalTotalTotalTotal 2,066,6622,066,6622,066,6622,066,662 1,560,6841,560,6841,560,6841,560,684 505,97505,97505,97505,978888

100
“Third parties” may be broken down as follows:
(€’000) 30 June 201630 June 201630 June 201630 June 2016 31 December 31 December 31 December 31 December
2015201520152015VariationVariationVariationVariation
Trade receivables 2,010,892 1,479,741 531,151Allowance for impairment (101,903) (99,643) (2,260)
TotalTotalTotalTotal 1,908,9891,908,9891,908,9891,908,989 1,380,0981,380,0981,380,0981,380,098 528,891528,891528,891528,891
The balance relates to amounts due from customers for invoices issued and for work performed and approved by customers but still to be invoiced. The net increase is a result of the change in the consolidation
scope following Lane’s acquisition (€194.4 million) and the rise in the Ethiopian branch’s trade receivables for work performed by subcontractors (€255.5 million) as well as advances to be collected (€42.5 million). The Ethiopian branch recorded a related increase in trade payables for works performed (€250 million) and payables from customers for advances. Settlement of the trade receivables and trade payables takes place on the basis of the agreements between the parties.
The item also includes €229.2 million due to FIBE by the Campania municipalities for its management services provided under contract until 15 December 2005 and the subsequent transition period (reference should be made to the “Main risk factors and uncertainties” section in the Directors’ report for more information about this complicated situation and the directors’ related assessments).
Retentions amount to €140.3 million at the reporting date compared to €87.3 million at 31 December 2015.
The allowance for impairment increased by €2.3 million to €101.9 million at the reporting date and includes
impairment losses on trade receivables of €47.1 million (mostly for the Venezuelan, Sierra Leone and Kazakhstani branches) and on default interest of €54.8 million (mainly related to FIBE, Fisia Ambiente and the Nepalese branch). Accruals of approximately €4.5 million for the period principally refer to the Kazakhstani branch.
Changes in the provision for bad debts and default interest are analysed below:
31 December 31 December 31 December 31 December
2015201520152015 Accruals Accruals Accruals Accruals UtilisationsUtilisationsUtilisationsUtilisations ReversalsReversalsReversalsReversals
Change in Change in Change in Change in consolidation consolidation consolidation consolidation
scopescopescopescope
Exchange rate Exchange rate Exchange rate Exchange rate gains (losses)gains (losses)gains (losses)gains (losses)
30 June 201630 June 201630 June 201630 June 2016
(€’000)
Trade receivables 43,817 4,470 (258) (3,563) 2,696 (22) 47,140
Default interest 55,826 (1,073) 10 54,763
TotalTotalTotalTotal 99,64399,64399,64399,643 4,4704,4704,4704,470 (258)(258)(258)(258) (4,636)(4,636)(4,636)(4,636) 2,6962,6962,6962,696 (12)(12)(12)(12) 101,903101,903101,903101,903

101
Trade receivables from unconsolidated group companies and other related parties decreased by €22.9 million to €157.7 million at 30 June 2016.
The item mainly comprises trade receivables from unconsolidated SPEs for work carried out by them under contracts with Italian and foreign public administrations.
The balance includes €3.6 million equal to the Group’s share of the SPEs’ cash and cash equivalents. It is shown in the item “Net financial position with unconsolidated SPEs” in the schedule of the Group’s net financial indebtedness.
The decrease is mainly due to the collection of receivables due from Pedelombarda S.c.p.A., the consortium company which built the motorway stretch with the same name.
14. Derivatives and other current financial assets14. Derivatives and other current financial assets14. Derivatives and other current financial assets14. Derivatives and other current financial assets
At 30 June 2016, this item of €363.4 million (31 December 2015: €312.1 million) includes the following:
(€’000) 30 June 201630 June 201630 June 201630 June 2016 31 December 201531 December 201531 December 201531 December 2015 VariationVariationVariationVariation
Government bonds and insurance shares 1,667 2,815 (1,148)
Loans and receivables - third parties 198,161 146,826 51,335
Loans and receivables - unconsolidated group companies and related parties
163,589 162,463 1,126
TotalTotalTotalTotal 363,417363,417363,417363,417 312,104312,104312,104312,104 51,31351,31351,31351,313
The government bonds and insurance shares amount to €1.7 million compared to €2.8 million at 31 December 2015. The item includes unlisted guaranteed-return securities with maturities of less than one year. The decrease in the period is due to the sale of securities by the Argentine subsidiary Impregilo Healy Ute, which was awarded the Riachuelo contract in Argentina.
Loans and receivables - third parties mainly consist of:
• €65.9 million due from the CAV.TO.MI Consortium related to the amounts paid as a result of the
Appeal Court ruling of 23 September 2015. The Group deems this receivable to be recoverable, also based on its legal advisors’ opinion. The section on the “Main risk factors and uncertainties” in the Directors’ report provides more information;
• €24.9 million for the current portion of the receivables due from Prime System Kz Ltd for the sale of Todini Costruzioni Generali;
• €29.9 million related to the surety enforced in 2014 for the delay in the Metro 6 works (Chile). The Group is confident that it will recover this amount, based also on the opinion of its legal advisors assisting it with the dispute. The section on the “Main risk factors and uncertainties” in the Directors’ report provides more information;

102
• €18.4 million which arose after the sale of TEEM S.p.A. and is due in 2016;
• €13.6 million due from the Romanian Ministry for Infrastructure and Transportation related to the surety enforced during the period as a result of the disputes with the customer about the Orastie-Sibiu motorway contract. The Group is confident that it will recover this amount, based also on the opinion of
its legal advisors assisting it with the disputes. The section on the “Main risks and uncertainties” in the Directors’ report provides more information;
• €11.2 million related to the subsidiary Impregilo International Infrastructures N.V. for the current portion of the receivables that arose after the sale of its investment in the Argentine operator Caminos de las Sierras to the Cordoba provincial authorities (Argentina) (see note 9). To date, these receivables have been collected in line with the contractual terms;
• €28.6 million for the loans granted to the partners of Salerno - Reggio Calabria S.c.p.A. and COCIV Consortium. These interest-bearing loans were repaid in July 2016.
Loans and receivables - unconsolidated group companies and other related parties mainly consist of:
• the amount of €122.5 million due from Consorzio OIV Tocoma, the SPE in charge of a hydroelectric project in Venezuela. The section on the “Main risk factors and uncertainties” in the Directors’ report
provides more information;
• receivables of €7.4 million due from Salini Costruttori S.p.A., principally relating to its participation in the VAT consolidation scheme. At 31 December 2015, this item amounted to €14.5 million;
• the amount of €4.2 million due from the SPE Linea M4 S.p.A. for the financing granted to it in January 2016; this SPE was set up to design, build, maintain and operate the M4 line of the Milan metro under concession from the Milan municipality and to provide the related public service.
15. Current tax assets and ot15. Current tax assets and ot15. Current tax assets and ot15. Current tax assets and other current tax assetsher current tax assetsher current tax assetsher current tax assets
Current tax assets amount to €119.6 million as follows:
(€’000) 30 June 201630 June 201630 June 201630 June 2016 31 December 201531 December 201531 December 201531 December 2015 VariationVariationVariationVariation
Direct taxes 55,306 56,387 (1,081)
IRAP 8,811 863 7,948
Foreign direct taxes 55,521 57,327 (1,806)
TotalTotalTotalTotal 119,638119,638119,638119,638 114,577114,577114,577114,577 5,0615,0615,0615,061
The 30 June 2016 balance mainly consists of:
• direct tax assets for excess taxes paid in previous years, which the Group has correctly claimed for reimbursement and which bear interest;

103
• foreign direct tax assets for excess taxes paid abroad by the foreign group companies which will be recovered as per the relevant legislation.
Other current tax assets decreased by €1.7 million to €140.9 million at the reporting date as follows:
(€’000) 30 June 201630 June 201630 June 201630 June 2016 31 December 201531 December 201531 December 201531 December 2015 VariationVariationVariationVariation
VAT 114,891 107,035 7,856
Other indirect taxes 26,040 35,617 (9,577)
Total Total Total Total 140,931140,931140,931140,931 142,652142,652142,652142,652 (1,721)(1,721)(1,721)(1,721)
VAT assets include €75.9 million due from the Italian taxation authorities and €39.0 million from foreign taxation authorities. Other indirect taxes comprise withholdings of €7.9 million paid by the Icelandic branch for its temporary foreign workers. More information is available in note 30.
16. Other current assets 16. Other current assets 16. Other current assets 16. Other current assets
Other current assets of €576.1 million show an increase of €57.5 million on the previous year end and may be analysed as follows:
(€’000) 30 June 201630 June 201630 June 201630 June 2016 31 December 201531 December 201531 December 201531 December 2015 VariationVariationVariationVariation
Other receivables 253,373 217,636 35,737
Advances to suppliers 209,003 179,268 29,735
Other - unconsolidated group companies and other related parties 27,514 33,882 (6,368)
Prepayments and accrued income 86,220 87,856 (1,636)
TotalTotalTotalTotal 576,110576,110576,110576,110 518,642518,642518,642518,642 57,46857,46857,46857,468
Other receivables increased by €35.7 million, mainly due to the different consolidation scope following acquisition of Lane and the larger receivables from the Group’s partners.
Specifically, they include:
• €71.2 million (substantially unchanged from 31 December 2015) due from the public bodies involved in managing the waste emergency in Campania to FIBE. The section on the “USW Campania projects” and related assessments in the section of the Directors’ report on the “Main risk factors and uncertainties” provides more information about these projects;
• €34.3 million due from the Argentine Republic as compensation for damage following the favourable award issued on 21 June 2011 and confirmed by the Buenos Aires Arbitration Tribunal on 24 January 2014. This award settled the proceedings commenced by the shareholders of the investee Aguas del Buenos Aires S.A. in liquidation (operator) against the Argentine Republic;
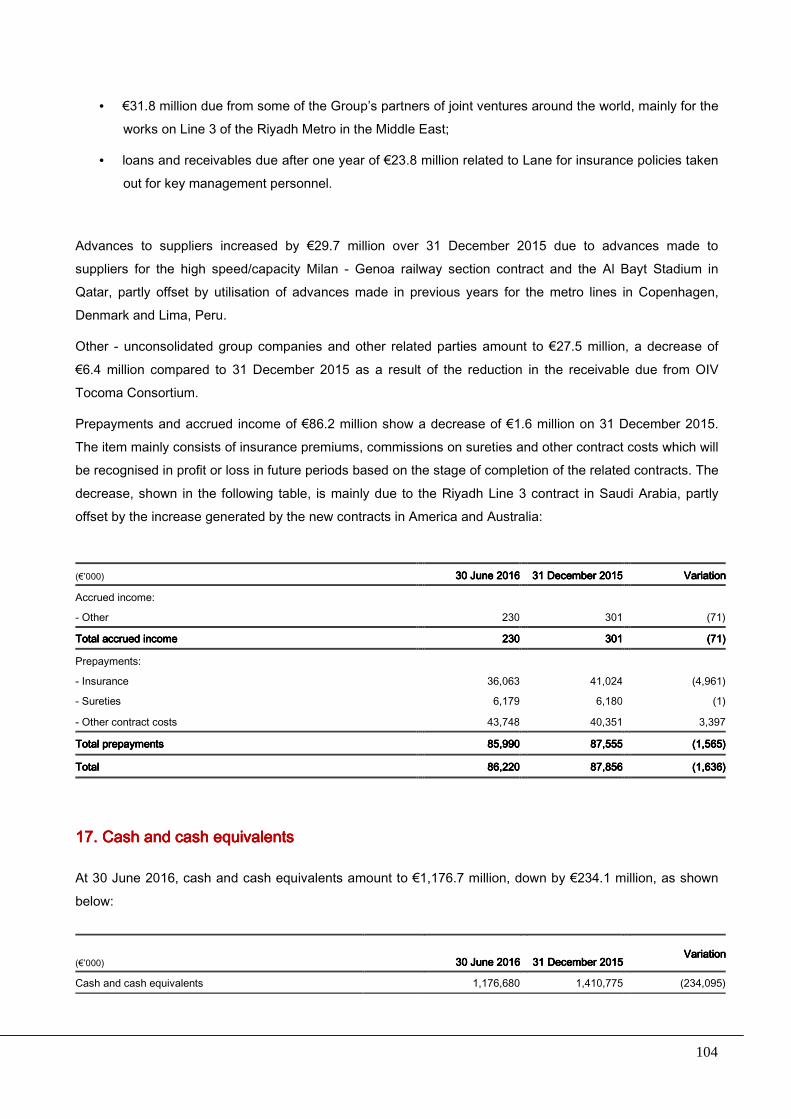
104
• €31.8 million due from some of the Group’s partners of joint ventures around the world, mainly for the works on Line 3 of the Riyadh Metro in the Middle East;
• loans and receivables due after one year of €23.8 million related to Lane for insurance policies taken out for key management personnel.
Advances to suppliers increased by €29.7 million over 31 December 2015 due to advances made to suppliers for the high speed/capacity Milan - Genoa railway section contract and the Al Bayt Stadium in Qatar, partly offset by utilisation of advances made in previous years for the metro lines in Copenhagen, Denmark and Lima, Peru.
Other - unconsolidated group companies and other related parties amount to €27.5 million, a decrease of
€6.4 million compared to 31 December 2015 as a result of the reduction in the receivable due from OIV Tocoma Consortium.
Prepayments and accrued income of €86.2 million show a decrease of €1.6 million on 31 December 2015. The item mainly consists of insurance premiums, commissions on sureties and other contract costs which will be recognised in profit or loss in future periods based on the stage of completion of the related contracts. The
decrease, shown in the following table, is mainly due to the Riyadh Line 3 contract in Saudi Arabia, partly offset by the increase generated by the new contracts in America and Australia:
(€’000) 30 June 201630 June 201630 June 201630 June 2016 31 December 201531 December 201531 December 201531 December 2015 VariationVariationVariationVariation
Accrued income:
- Other 230 301 (71)
Total accrued Total accrued Total accrued Total accrued incomeincomeincomeincome 230230230230 301301301301 ((((71717171))))
Prepayments:
- Insurance 36,063 41,024 (4,961)
- Sureties 6,179 6,180 (1)
- Other contract costs 43,748 40,351 3,397
Total prepaymentsTotal prepaymentsTotal prepaymentsTotal prepayments 85,99085,99085,99085,990 87,55587,55587,55587,555 (1,565)(1,565)(1,565)(1,565)
TotalTotalTotalTotal 86,86,86,86,220220220220 87,85687,85687,85687,856 (1,(1,(1,(1,636636636636))))
17. Cash and cash equivalents17. Cash and cash equivalents17. Cash and cash equivalents17. Cash and cash equivalents
At 30 June 2016, cash and cash equivalents amount to €1,176.7 million, down by €234.1 million, as shown
below:
(€’000) 30 June 201630 June 201630 June 201630 June 2016 31 December 201531 December 201531 December 201531 December 2015
VariationVariationVariationVariation
Cash and cash equivalents 1,176,680 1,410,775 (234,095)

105
A breakdown by geographical segment is as follows:
(€’000) 30 June 201630 June 201630 June 201630 June 2016 31 December 201531 December 201531 December 201531 December 2015
VariationVariationVariationVariation
Italy 140,275 253,922 (113,647)
EU (excluding Italy) 83,587 138,975 (55,388)
Non-EU 30,166 26,715 3,451
Asia 28,031 33,388 (5,357)
Middle East 631,968 771,495 (139,527)
Africa 35,861 65,808 (29,947)
North America 133,520 45,044 88,476
Latin America 54,003 47,051 6,952
Oceania 39,269 28,377 10,892
TotalTotalTotalTotal 1,176,6801,176,6801,176,6801,176,680 1,410,7751,410,7751,410,7751,410,775 (234,095)(234,095)(234,095)(234,095)
The balance includes credit bank account balances at the end of the period and the amounts of cash,
cheques and valuables at the registered offices, work sites and foreign subsidiaries. Liquidity management is designed to ensure the financial independence of ongoing contracts, considering the structure of the consortia and SPEs, which may limit the availability of financial resources to achievement of the related projects. Liquidity management also considers the existence of constraints to the transfer of currency imposed by certain countries.
The statement of cash flows shows the reason for the decrease in the item and changes in current account facilities (note 20).
Imprepar’s deposits include €4.9 million collected by it on behalf of third parties.
Parking Glasgow’s cash and cash equivalents are tied to specific claims for €0.5 million, while cash and cash equivalents of €8.5 million of CAVTOMI are tied up in a fiduciary deposit to guarantee the positive outcome of a pending dispute (the section on the “Main risk factors and uncertainties” in the Directors’ report provides
more information about this).
At the reporting date, the cash and cash equivalents attributable to non-controlling interests of the consolidated SPEs amount to €122.2 million and mainly refer to the Red Line North Underground and the Al Bayt Stadium in Al Khor, Qatar.

106
18. Non18. Non18. Non18. Non----current assets (liabilities) held for current assets (liabilities) held for current assets (liabilities) held for current assets (liabilities) held for sale and discontinued operations and loss from sale and discontinued operations and loss from sale and discontinued operations and loss from sale and discontinued operations and loss from discontinued operationsdiscontinued operationsdiscontinued operationsdiscontinued operations
Non-current assets held for sale are shown in the following table with the associated liabilities:
(€’000) 30 June 201630 June 201630 June 201630 June 2016 31 December 201531 December 201531 December 201531 December 2015 VariationVariationVariationVariation
Non-current assets held for sale 22,453 147,606 (125,153)
Liabilities directly associated with non-current assets held for sale (23,706) (106,012) 82,306
Total Total Total Total (1,253)(1,253)(1,253)(1,253) 41,5941,5941,5941,594444 (42,84(42,84(42,84(42,847777))))
The €42.8 million reduction in this caption is due to the sale of Todini Costruzioni Generali to Prime System Kz
Ltd on 4 April 2016.
A breakdown of this item is as follows:
30 June 201630 June 201630 June 201630 June 2016
(€’000) Business unit A Business unit A Business unit A Business unit A ----former Todini (*)former Todini (*)former Todini (*)former Todini (*)
USW USW USW USW CampaniaCampaniaCampaniaCampania TotalTotalTotalTotal
Non-current assets 733 5,683 6,416
Current assets 16,037 - 16,037
NonNonNonNon----current assets held for salecurrent assets held for salecurrent assets held for salecurrent assets held for sale 16,77016,77016,77016,770 5,6835,6835,6835,683 22,45322,45322,45322,453
Current liabilities (23,706) - (23,706)
Liabilities directly associated with nonLiabilities directly associated with nonLiabilities directly associated with nonLiabilities directly associated with non----current assets held for salecurrent assets held for salecurrent assets held for salecurrent assets held for sale (23,706)(23,706)(23,706)(23,706) ---- (23,706)(23,706)(23,706)(23,706)
Total Total Total Total (6,936)(6,936)(6,936)(6,936) 5,6835,6835,6835,683 (1,253)(1,253)(1,253)(1,253)
- including net financial indebtedness (18,082) (18,082)
31 December 201531 December 201531 December 201531 December 2015
(€’000) Business unit B Business unit B Business unit B Business unit B ----
TodiniTodiniTodiniTodini Business unit A Business unit A Business unit A Business unit A ----former Todini (*)former Todini (*)former Todini (*)former Todini (*)
USW USW USW USW CampaniaCampaniaCampaniaCampania TotalTotalTotalTotal
Non-current assets 31,746 545 5,683 37,974
Current assets 80,330 29,302 109,632
NonNonNonNon----current assets held for salecurrent assets held for salecurrent assets held for salecurrent assets held for sale 112,07112,07112,07112,076666 29,8429,8429,8429,847777 5,6835,6835,6835,683 147,60147,60147,60147,606666
Non-current liabilities (30,485) (30,485)
Current liabilities (45,679) (29,848) (75,527)
Liabilities directly associated with nonLiabilities directly associated with nonLiabilities directly associated with nonLiabilities directly associated with non----current assets held for salecurrent assets held for salecurrent assets held for salecurrent assets held for sale (76,164)(76,164)(76,164)(76,164) (29,84(29,84(29,84(29,848888)))) ---- (106,01(106,01(106,01(106,012222))))
Total Total Total Total 35,9135,9135,9135,912222 ((((1111)))) 5,6835,6835,6835,683 41,5941,5941,5941,594444
- including net financial indebtedness (7,274) (11,665) (18,939)
(*) Assets belonging to the Todini Costruzioni Generali business unit identified as Business unit A - Italian operating contracts. These assets were contributed by Todini Costruzioni Generali to HCE Costruzioni S.p.A. in the first quarter of 2016. HCE was subsequently sold to Salini Impregilo S.p.A..
The loss from discontinued operations for the first six months of 2016 and 2015 is analysed in the following tables:
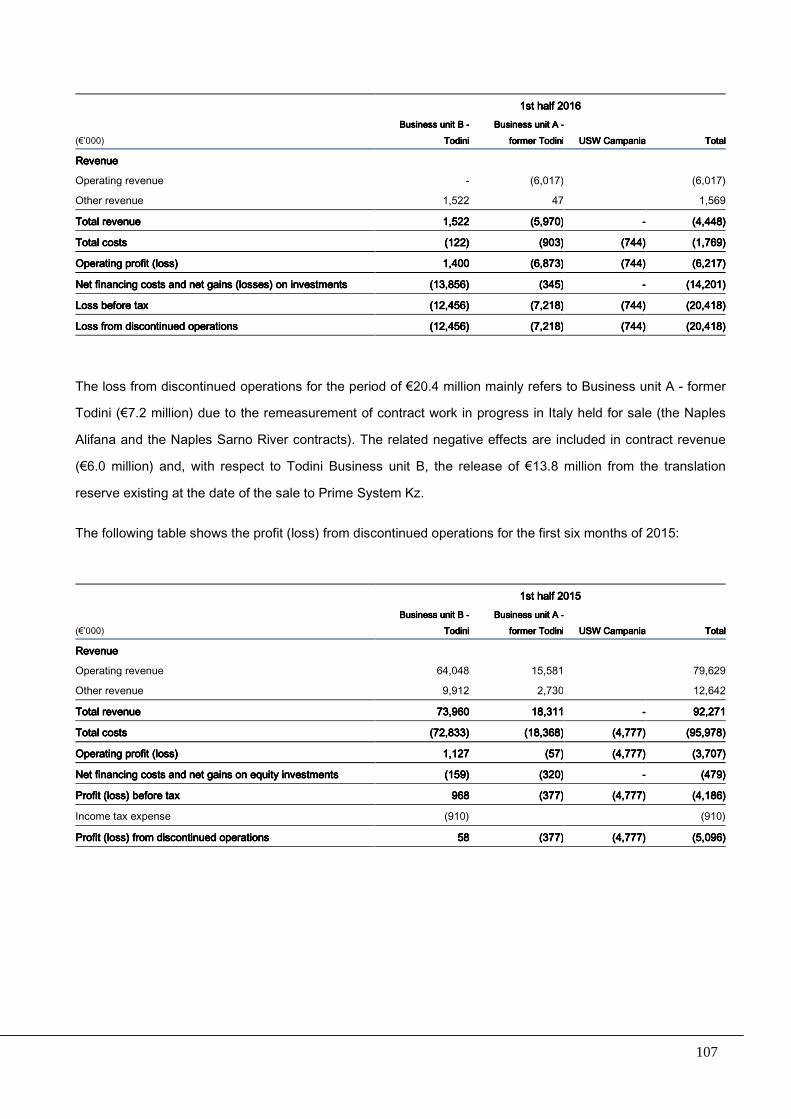
107
1st half 20161st half 20161st half 20161st half 2016
(€’000) Business unit B Business unit B Business unit B Business unit B ----
TodiniTodiniTodiniTodiniBusiness unit A Business unit A Business unit A Business unit A ----
former Todiniformer Todiniformer Todiniformer Todini USW CampaniaUSW CampaniaUSW CampaniaUSW Campania TotalTotalTotalTotal
Revenue Revenue Revenue Revenue
Operating revenue - (6,017) (6,017)
Other revenue 1,522 47 1,569
Total revenueTotal revenueTotal revenueTotal revenue 1,521,521,521,522222 (5,970)(5,970)(5,970)(5,970) ---- (4,(4,(4,(4,444448484848))))
Total costs Total costs Total costs Total costs (122)(122)(122)(122) (903)(903)(903)(903) (744)(744)(744)(744) (1,76(1,76(1,76(1,769999))))
Operating profit (loss)Operating profit (loss)Operating profit (loss)Operating profit (loss) 1,1,1,1,400400400400 (6,873)(6,873)(6,873)(6,873) (744)(744)(744)(744) (6,(6,(6,(6,212121217777))))
Net financing costs and net Net financing costs and net Net financing costs and net Net financing costs and net gains (losses) on investmentsgains (losses) on investmentsgains (losses) on investmentsgains (losses) on investments (13,85(13,85(13,85(13,856666)))) (345)(345)(345)(345) ---- (14,(14,(14,(14,201201201201))))
Loss before taxLoss before taxLoss before taxLoss before tax (12,45(12,45(12,45(12,456666)))) (7,218)(7,218)(7,218)(7,218) (744)(744)(744)(744) (20,4(20,4(20,4(20,418181818))))
Loss from discontinued operationsLoss from discontinued operationsLoss from discontinued operationsLoss from discontinued operations (12,45(12,45(12,45(12,456666)))) (7,218)(7,218)(7,218)(7,218) (744)(744)(744)(744) (20,4(20,4(20,4(20,418181818))))
The loss from discontinued operations for the period of €20.4 million mainly refers to Business unit A - former
Todini (€7.2 million) due to the remeasurement of contract work in progress in Italy held for sale (the Naples
Alifana and the Naples Sarno River contracts). The related negative effects are included in contract revenue
(€6.0 million) and, with respect to Todini Business unit B, the release of €13.8 million from the translation
reserve existing at the date of the sale to Prime System Kz.
The following table shows the profit (loss) from discontinued operations for the first six months of 2015:
1st half 20151st half 20151st half 20151st half 2015
(€’000) Business unit B Business unit B Business unit B Business unit B ----
TodiniTodiniTodiniTodiniBusiness unit A Business unit A Business unit A Business unit A ----
former Todiniformer Todiniformer Todiniformer Todini USW CampaniaUSW CampaniaUSW CampaniaUSW Campania TotalTotalTotalTotal
Revenue Revenue Revenue Revenue
Operating revenue 64,048 15,581 79,629
Other revenue 9,912 2,730 12,642
Total revenueTotal revenueTotal revenueTotal revenue 73,96073,96073,96073,960 18,31118,31118,31118,311 ---- 92,27192,27192,27192,271
Total costs Total costs Total costs Total costs (72,833)(72,833)(72,833)(72,833) (18,368)(18,368)(18,368)(18,368) (4,777)(4,777)(4,777)(4,777) (95,978)(95,978)(95,978)(95,978)
Operating profit (loss)Operating profit (loss)Operating profit (loss)Operating profit (loss) 1,1271,1271,1271,127 (57)(57)(57)(57) (4,777)(4,777)(4,777)(4,777) (3,707)(3,707)(3,707)(3,707)
Net financing costs and net gains on equity investmentsNet financing costs and net gains on equity investmentsNet financing costs and net gains on equity investmentsNet financing costs and net gains on equity investments (159)(159)(159)(159) (320)(320)(320)(320) ---- (479)(479)(479)(479)
Profit (loss) before taxProfit (loss) before taxProfit (loss) before taxProfit (loss) before tax 968968968968 (377)(377)(377)(377) (4,777)(4,777)(4,777)(4,777) (4,186)(4,186)(4,186)(4,186)
Income tax expense (910) (910)
Profit (loss) from discontinued operationsProfit (loss) from discontinued operationsProfit (loss) from discontinued operationsProfit (loss) from discontinued operations 58585858 (377)(377)(377)(377) (4,777)(4,777)(4,777)(4,777) (5,096)(5,096)(5,096)(5,096)

108
19. Equity19. Equity19. Equity19. Equity
Equity increased to €1,240.1 million at 30 June 2016 from €1,216.9 million at the end of 2015 as follows:
(€’000) 30 June 201630 June 201630 June 201630 June 2016 31 December 201531 December 201531 December 201531 December 2015 VariationVariationVariationVariation
Equity attributable to the owners of the parent
Share capital 544,740 544,740 -
Share premium reserve 120,798 120,798 -
- Legal reserve 103,322 101,535 1,787
- Reserve for share capital increase related charges (3,970) (3,970) -
- Reserve for treasury shares (7,677) (7,677) -
- LTI reserve 2,223 139 2,084
- Extraordinary and other reserves 136 136 -
Total other reserves 94,034 90,163 3,871
Other comprehensive income (expense)
- Translation reserve (17,719) (11,194) (6,525)
- Hedging reserve (1,467) (8,085) 6,618
- Actuarial reserve 1,700 (5,273) 6,973
Total other comprehensive expense (17,486) (24,552) 7,066
Retained earnings 363,082 324,259 38,823
Profit for the period/year 11,223 60,592 (49,369)
Equity attributable to the owners of the parentEquity attributable to the owners of the parentEquity attributable to the owners of the parentEquity attributable to the owners of the parent 1,116,391,116,391,116,391,116,391111 1,116,0001,116,0001,116,0001,116,000 393939391111
Share capital and reserves attributable to non-controlling interests 105,681 79,221 26,460Profit for the period/year attributable to non-controlling interests 18,026 21,639 (3,613)
Share capital and reserves attributable to non-controlling interests 123,707 100,860 22,847
Total equityTotal equityTotal equityTotal equity 1,240,091,240,091,240,091,240,098888 1,216,8601,216,8601,216,8601,216,860 23,2323,2323,2323,238888
Changes of the period in the different equity items are summarised in the relevant schedule of the condensed
interim consolidated financial statements. Specifically, in their meeting held on 28 April 2016, the parent’s shareholders resolved to allocate the profit for 2015 as follows:
• €1,786,530.08, equal to 5% of the profit for the year, to the legal reserve;
• €19,562,732.56 as a dividend to the holders of ordinary shares, equal to €0.04 per share;
• €420,027.66 as a dividend to the holders of savings shares, equal to €0.26 per share;
• €13,961,311.27 to retained earnings.
The LTI (long term incentive plan) reserve shows the fair value of €2.2 million of this plan introduced in 2015. The section on the accounting policies in the 2015 Annual Report describes how the reserve is treated.

109
The main variation in other comprehensive income items relates to the effect of fluctuations in exchange rates as shown below:
(€’000) 1st half 20161st half 20161st half 20161st half 2016 1st half 20151st half 20151st half 20151st half 2015
Opening balance (11,194) 15,575Reclassification to profit or loss 13,857 -Equity-accounted investees 228 2,063Increase (decrease) (20,610) 11,378Total changes (6,525) 13,441
Closing balanceClosing balanceClosing balanceClosing balance (17,(17,(17,(17,777719191919)))) 29,01629,01629,01629,016
The effect of changes in the hedging reserve due to fair value gains (losses) on financial instruments is detailed below:
(€’000) 1st half 20161st half 20161st half 20161st half 2016 1st half 20151st half 20151st half 20151st half 2015
Opening balance (8,085) 1,987Reclassification of fair value gains/losses on settled transactions to profit or loss 335 293Reclassification from comprehensive income 9,920 - Net fair value gains (losses) (4,056) 370Net exchange rate gains (losses) and other changes 494 (459)Net losses for equity-accounted investees (75) (361)Total changes 6,618 (157)
Closing balanceClosing balanceClosing balanceClosing balance (1,467(1,467(1,467(1,467)))) 1,81,81,81,830303030
The actuarial reserve underwent the following changes:
(€’000) 1st half 20161st half 20161st half 20161st half 2016 1st half 20151st half 20151st half 20151st half 2015
Opening balance (5,273) (5,447)
Net actuarial gains recognised in OCI 6,973 -
Closing balanceClosing balanceClosing balanceClosing balance 1,701,701,701,700000 (5,447)(5,447)(5,447)(5,447)
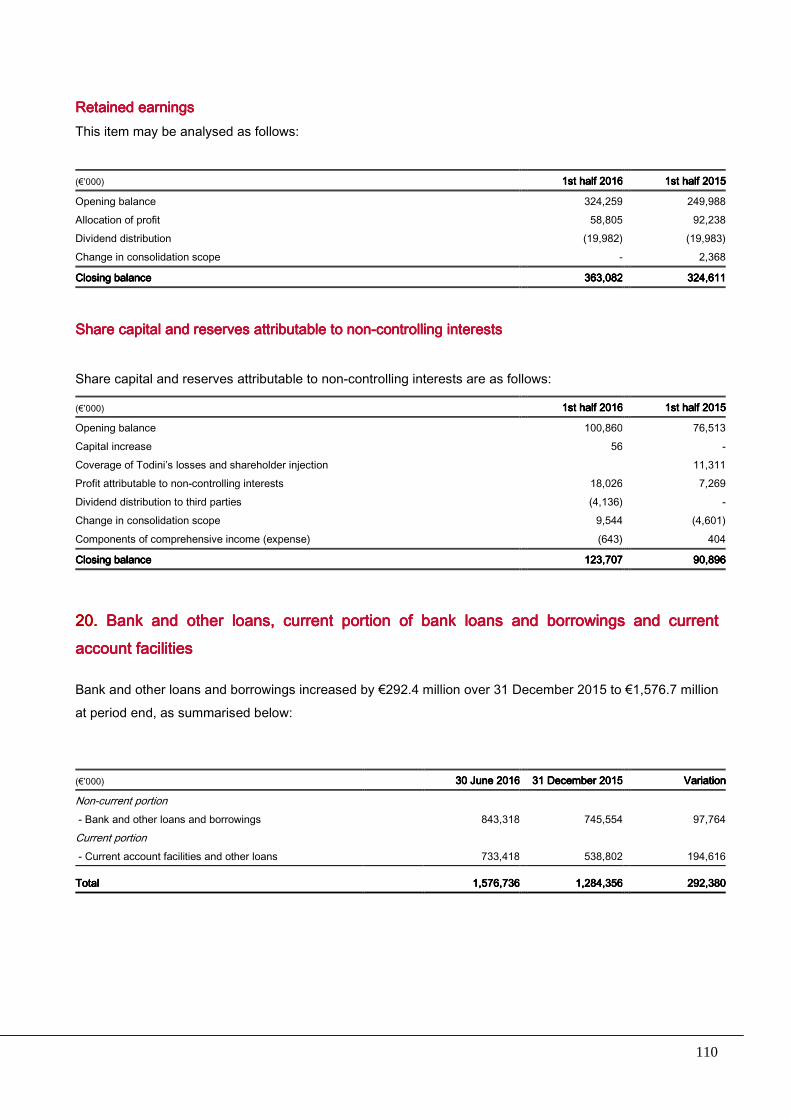
110
Retained earningsRetained earningsRetained earningsRetained earnings
This item may be analysed as follows:
(€’000) 1st half 20161st half 20161st half 20161st half 2016 1st half 20151st half 20151st half 20151st half 2015
Opening balance 324,259 249,988Allocation of profit 58,805 92,238Dividend distribution (19,982) (19,983)Change in consolidation scope - 2,368
Closing balanceClosing balanceClosing balanceClosing balance 363,082363,082363,082363,082 324,611324,611324,611324,611
Share capital and reserves attributable to nonShare capital and reserves attributable to nonShare capital and reserves attributable to nonShare capital and reserves attributable to non----controlling interestscontrolling interestscontrolling interestscontrolling interests Share capital and reserves attributable to non-controlling interests are as follows: (€’000) 1st half 20161st half 20161st half 20161st half 2016 1st half 20151st half 20151st half 20151st half 2015
Opening balance 100,860 76,513Capital increase 56 -Coverage of Todini’s losses and shareholder injection 11,311Profit attributable to non-controlling interests 18,026 7,269Dividend distribution to third parties (4,136) -Change in consolidation scope 9,544 (4,601)Components of comprehensive income (expense) (643) 404
Closing balanceClosing balanceClosing balanceClosing balance 123,70123,70123,70123,707777 90,89690,89690,89690,896
20.20.20.20. Bank and other loans, current portion of bank loans and borrowings and current Bank and other loans, current portion of bank loans and borrowings and current Bank and other loans, current portion of bank loans and borrowings and current Bank and other loans, current portion of bank loans and borrowings and current account facilitiesaccount facilitiesaccount facilitiesaccount facilities
Bank and other loans and borrowings increased by €292.4 million over 31 December 2015 to €1,576.7 million at period end, as summarised below:
(€’000) 30 June 201630 June 201630 June 201630 June 2016 31 December 201531 December 201531 December 201531 December 2015 VariationVariationVariationVariation
Non-current portion - Bank and other loans and borrowings 843,318 745,554 97,764Current portion - Current account facilities and other loans 733,418 538,802 194,616
TotalTotalTotalTotal 1,576,7361,576,7361,576,7361,576,736 1,284,3561,284,3561,284,3561,284,356 292,380292,380292,380292,380
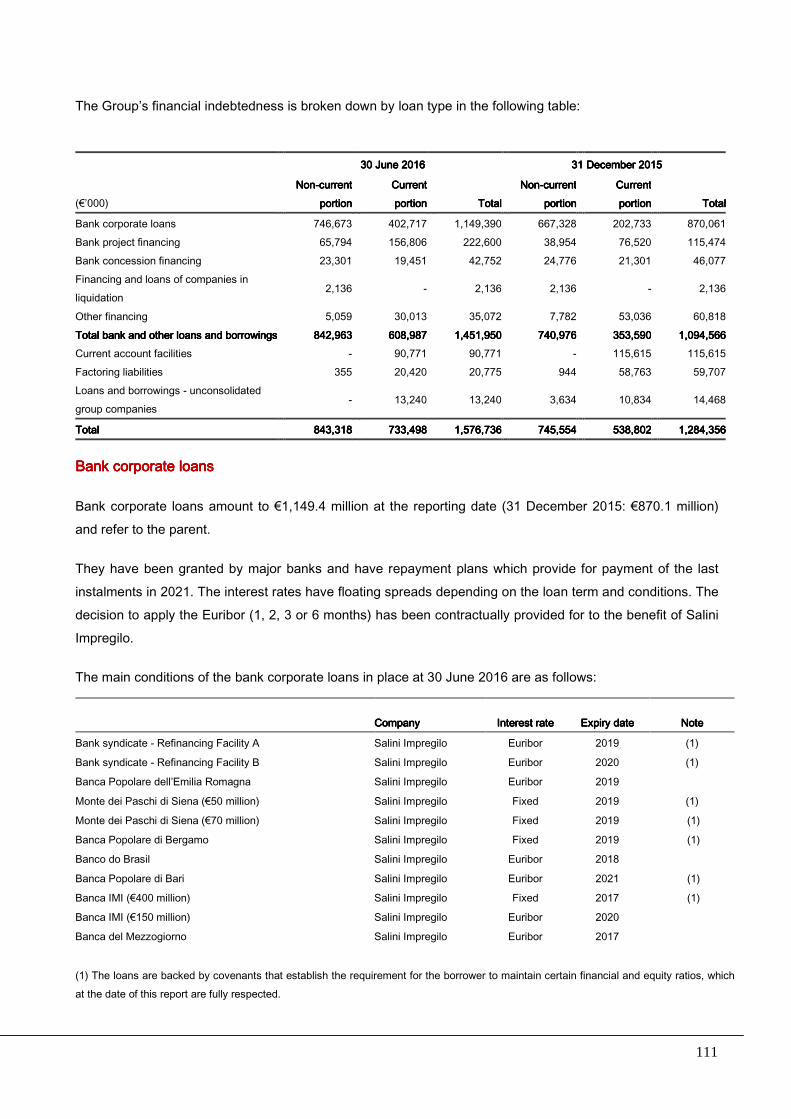
111
The Group’s financial indebtedness is broken down by loan type in the following table:
30 June 201630 June 201630 June 201630 June 2016 31 December 201531 December 201531 December 201531 December 2015
(€’000) NonNonNonNon----current current current current
portionportionportionportion Current Current Current Current portionportionportionportion TotalTotalTotalTotal
NonNonNonNon----current current current current portionportionportionportion
Current Current Current Current portionportionportionportion TotalTotalTotalTotal
Bank corporate loans 746,673 402,717 1,149,390 667,328 202,733 870,061Bank project financing 65,794 156,806 222,600 38,954 76,520 115,474Bank concession financing 23,301 19,451 42,752 24,776 21,301 46,077Financing and loans of companies in liquidation
2,136 - 2,136 2,136 - 2,136
Other financing 5,059 30,013 35,072 7,782 53,036 60,818Total bank and other loans and borrowingsTotal bank and other loans and borrowingsTotal bank and other loans and borrowingsTotal bank and other loans and borrowings 842,96842,96842,96842,963333 608,987608,987608,987608,987 1,451,951,451,951,451,951,451,950000 740,976740,976740,976740,976 353,590353,590353,590353,590 1,094,5661,094,5661,094,5661,094,566Current account facilities - 90,771 90,771 - 115,615 115,615Factoring liabilities 355 20,420 20,775 944 58,763 59,707Loans and borrowings - unconsolidated group companies
- 13,240 13,240 3,634 10,834 14,468
TotalTotalTotalTotal 843,31843,31843,31843,318888 733,4733,4733,4733,499998888 1,576,731,576,731,576,731,576,736666 745,554745,554745,554745,554 538,802538,802538,802538,802 1,284,3561,284,3561,284,3561,284,356
Bank corporate loansBank corporate loansBank corporate loansBank corporate loans
Bank corporate loans amount to €1,149.4 million at the reporting date (31 December 2015: €870.1 million) and refer to the parent.
They have been granted by major banks and have repayment plans which provide for payment of the last instalments in 2021. The interest rates have floating spreads depending on the loan term and conditions. The decision to apply the Euribor (1, 2, 3 or 6 months) has been contractually provided for to the benefit of Salini Impregilo.
The main conditions of the bank corporate loans in place at 30 June 2016 are as follows:
Company Company Company Company Interest rateInterest rateInterest rateInterest rate Expiry dateExpiry dateExpiry dateExpiry date NoteNoteNoteNote
Bank syndicate - Refinancing Facility A Salini Impregilo Euribor 2019 (1)
Bank syndicate - Refinancing Facility B Salini Impregilo Euribor 2020 (1)
Banca Popolare dell’Emilia Romagna Salini Impregilo Euribor 2019
Monte dei Paschi di Siena (€50 million) Salini Impregilo Fixed 2019 (1)
Monte dei Paschi di Siena (€70 million) Salini Impregilo Fixed 2019 (1)
Banca Popolare di Bergamo Salini Impregilo Fixed 2019 (1)
Banco do Brasil Salini Impregilo Euribor 2018
Banca Popolare di Bari Salini Impregilo Euribor 2021 (1)
Banca IMI (€400 million) Salini Impregilo Fixed 2017 (1)
Banca IMI (€150 million) Salini Impregilo Euribor 2020
Banca del Mezzogiorno Salini Impregilo Euribor 2017
(1) The loans are backed by covenants that establish the requirement for the borrower to maintain certain financial and equity ratios, which at the date of this report are fully respected.

112
During the period, the Group negotiated financing with Monte dei Paschi di Siena (€70.0 million), Banca
Popolare di Bergamo (€40.0 million), Banca Popolare di Milano (€50 million) and Banca IMI (€400.0 million). It was taken out to acquire Lane Group and the Group repaid €300 million after the bond issue described in note 21. In July, the Group repaid the remainder of the financing following the additional bond issue described in note 38.
Bank project financingBank project financingBank project financingBank project financing
Project financing of €222.6 million at 30 June 2016 mainly relates to the contracts in Colombia (€45.8 million), Romania (€22.5 million) and Australia (€23.7 million), the Metro B1 contract (€20.2 million), the contracts in Nigeria (€7.2 million), North America (€43.5 million) and Morocco (€6.0 million). The variation is mostly due to
the increase recorded for the Romanian branch’s contracts (€22.5 million), those of the Australian branch (€23.7 million) and of Lane, acquired in January 2016 (€43.5 million) and in Colombia (€21.2 million).
The main conditions of the bank project financing in place at 30 June 2016 are as follows:
Company Company Company Company CountryCountryCountryCountry Interest rateInterest rateInterest rateInterest rate Expiry dateExpiry dateExpiry dateExpiry date
Banco de Bogotà ICT II Colombia DTF 2016Banco de Bogotà Consorzio OHL Colombia DTF 2016Banco Stato del Ticino CSC Switzerland Fixed 2016Intesa San Paolo Romania Romanian branch Romania Robor 2016Garanti Bank S.A. Romanian branch Romania Robor 2016Unicredit Lane Industries USA Prime 2020Doha Bank Qatar Lane Industries Qatar Fixed 2017Santander Bank Australian branch Australia Fixed 2016Skye Bank Salini Nigeria Nigeria Fixed 2016Various Venezuelan branch Venezuela Fixed n.a.BMCE Moroccan branch Morocco Fixed (1)Banca del Mezzogiorno Metro B1 Italy Euribor 2017 (1) Project financing agreements have contractual maturities in line with the performance of the relevant contract.
The interest rates shown in the table have floating spreads depending on the term and conditions of the financing.

113
Bank concession financingBank concession financingBank concession financingBank concession financing
At the reporting date, concession financing amounts to €42.8 million and refers to the Piscine dello Stadio, Corso del Popolo and Parking Glasgow concessions and the Broni-Mortara (SA.BRO.M.) motorway concession.
€’000 30 June 201630 June 201630 June 201630 June 2016 31 December 201531 December 201531 December 201531 December 2015
Company Company Company Company CurrencyCurrencyCurrencyCurrency CountryCountryCountryCountry Total Total Total Total concession concession concession concession financingfinancingfinancingfinancing
Current Current Current Current portionportionportionportion
NonNonNonNon----current current current current portionportionportionportion
Total Total Total Total concession concession concession concession financingfinancingfinancingfinancing
Current Current Current Current portionportionportionportion
NonNonNonNon----current current current current portionportionportionportion
Monte dei Paschi di Siena Corso del Popolo S.p.A. Euro Italy 8,828 750 8,078 8,828 491 8,337
Credito Sportivo Piscine dello Stadio S.r.l. Euro Italy 6,707 290 6,417 6,809 285 6,524
Royal Bank of Scotland Impregilo Parking Glasgow Sterling UK 9,218 412 8,806 10,280 364 9,916
Unicredit S.A.BRO.M Euro Italy 18,000 18,000 - 20,160 20,160 -
TotalTotalTotalTotal 42,75342,75342,75342,753 19,45219,45219,45219,452 23,30123,30123,30123,301 46,07746,07746,07746,077 21,30021,30021,30021,300 24,77724,77724,77724,777
The outstanding financing from Royal Bank of Scotland is included in the project financing category and is secured by the revenue flows arising from the activities carried out under the related concessions. An interest rate hedge has been agreed for this financing (see note 23). The financing agreement includes a number of covenants, all of which the operator had complied with at the reporting date.
The main conditions of the bank concession financing in place at 30 June 2016 are as follows:
Company Company Company Company CountryCountryCountryCountry Interest rateInterest rateInterest rateInterest rate Expiry dateExpiry dateExpiry dateExpiry date
Royal Bank of Scotland Impregilo Parking Glasgow GB Libor 2029Monte dei Paschi di Siena Corso del Popolo S.p.A. Italy Euribor 2028Credito Sportivo Piscine dello Stadio Italy IRS 2035Unicredit SA.BRO.M. Italy Euribor 2016
The interest rates shown in the table have floating spreads depending on the term and conditions of the financing. Financing and loans of companies in liquidationFinancing and loans of companies in liquidationFinancing and loans of companies in liquidationFinancing and loans of companies in liquidation
This item of €2.1 million is substantially unchanged from 31 December 2015. The related repayment plans are linked to the liquidation procedures of the companies to which the financing and loans refer.

114
Other financingOther financingOther financingOther financing This item may be analysed as follows:
€’000 30 June 201630 June 201630 June 201630 June 2016 31 December 201531 December 201531 December 201531 December 2015
Company Company Company Company CountryCountryCountryCountry Total other Total other Total other Total other financingfinancingfinancingfinancing
Current Current Current Current portionportionportionportion
NonNonNonNon----current current current current portionportionportionportion
Total other Total other Total other Total other financingfinancingfinancingfinancing
Current Current Current Current portionportionportionportion
NonNonNonNon----current current current current portionportionportionportion
Cat Finance Salini Impregilo Italy 9,518 5,174 4,344 11,996 5,057 6,938
Nesma Riyadh Salini Impregilo Italy - - - 25,076 25,076 -
Bethar Al Amal Salini Impregilo Italy 15,006 15,006 - 15,303 15,303 -
Contuy Salini Impregilo Brazil 47 47 - - - -
Various Salini Impregilo - Healy Parsons
USA 3,405 3,405 - - - -
Various Healy Parsons USA 1,513 1,513 - - - -
Various Salini Impregilo Saudi Arabia
6 6 - - - -
Various Salini Impregilo Argentina 15 15 - - - -
Various Healy UTE Argentina 18 18 - - - -
Various HCE Italy 526 291 235 667 193 475
Various ANM Riyadh 730 730 - 948 948 -
Various Lec Consortium Libya 113 113 - 150 150 -
Various Pietrarossa Italy 343 - 343 343 - 343
Various Nepalese branch Nepal - - - 15 15 -
Various Ariguani Colombia 2,862 2,862 - 869 869 -
Various Imprepar Italy 413 413 - 413 413 -
Sace Salini Namibia Namibia - - - 4,112 4,112 -
Various Lane Industries USA 226 88 138 - - -
AFCO Salini Impregilo - Healy JV Cleveland 277 277 841 841 -
Cat Finance Co.Ge.Ma. Italy 55 55 84 59 25
TotalTotalTotalTotal 35,07335,07335,07335,073 30,01330,01330,01330,013 5,0605,0605,0605,060 60,81860,81860,81860,818 53,03653,03653,03653,036 7,7827,7827,7827,782
Current account facilitiesCurrent account facilitiesCurrent account facilitiesCurrent account facilities
Current account facilities decreased by €24.8 million to €90.8 million at the reporting date. The decrease
mainly refers to the smaller bank overdrafts of the parent (€30.4 million), the subsidiaries Salini Nigeria (€12.2 million), Corso del Popolo S.p.A. (€4.5 million) and Piscine dello Stadio S.c.a.r.l (€1.9 million) and the larger bank overdrafts of the subsidiary CMT I/S Copenhagen (€25.0 million).
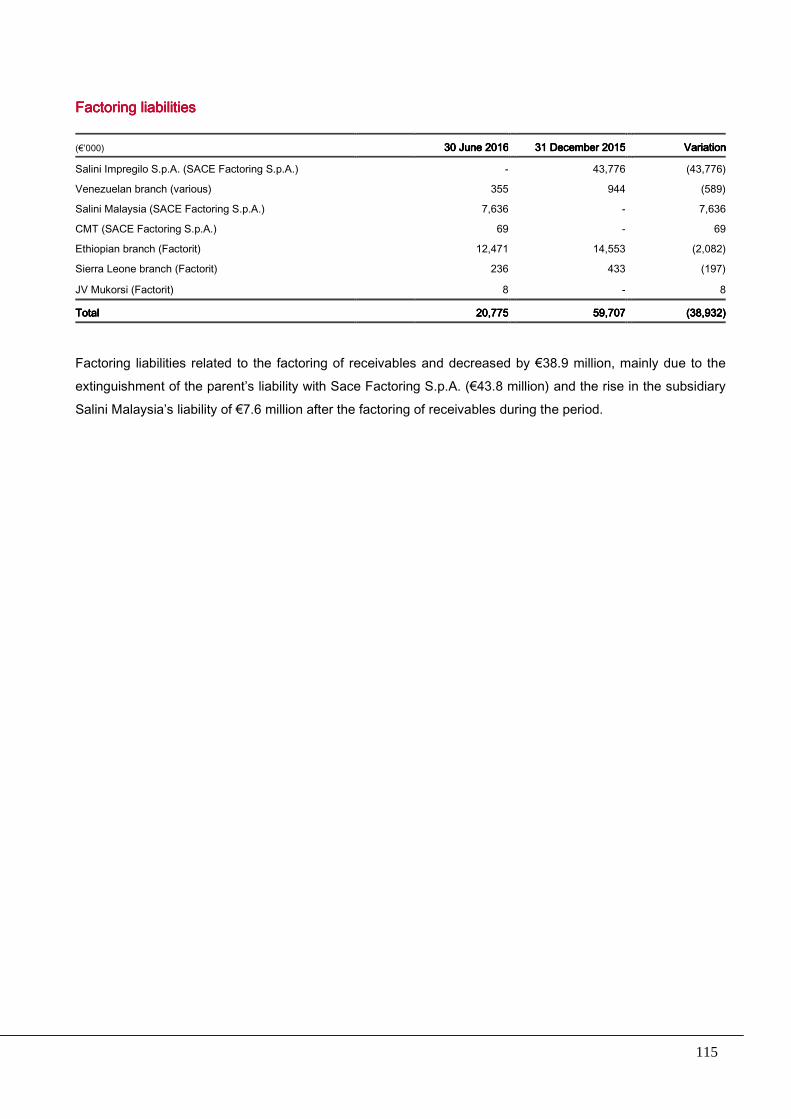
115
Factoring liabilitiesFactoring liabilitiesFactoring liabilitiesFactoring liabilities (€’000) 30 June 201630 June 201630 June 201630 June 2016 31 December 201531 December 201531 December 201531 December 2015 VariationVariationVariationVariation
Salini Impregilo S.p.A. (SACE Factoring S.p.A.) - 43,776 (43,776)
Venezuelan branch (various) 355 944 (589)
Salini Malaysia (SACE Factoring S.p.A.) 7,636 - 7,636
CMT (SACE Factoring S.p.A.) 69 - 69
Ethiopian branch (Factorit) 12,471 14,553 (2,082)
Sierra Leone branch (Factorit) 236 433 (197)
JV Mukorsi (Factorit) 8 - 8
TotalTotalTotalTotal 20,77520,77520,77520,775 59,70759,70759,70759,707 (38,932)(38,932)(38,932)(38,932)
Factoring liabilities related to the factoring of receivables and decreased by €38.9 million, mainly due to the extinguishment of the parent’s liability with Sace Factoring S.p.A. (€43.8 million) and the rise in the subsidiary Salini Malaysia’s liability of €7.6 million after the factoring of receivables during the period.
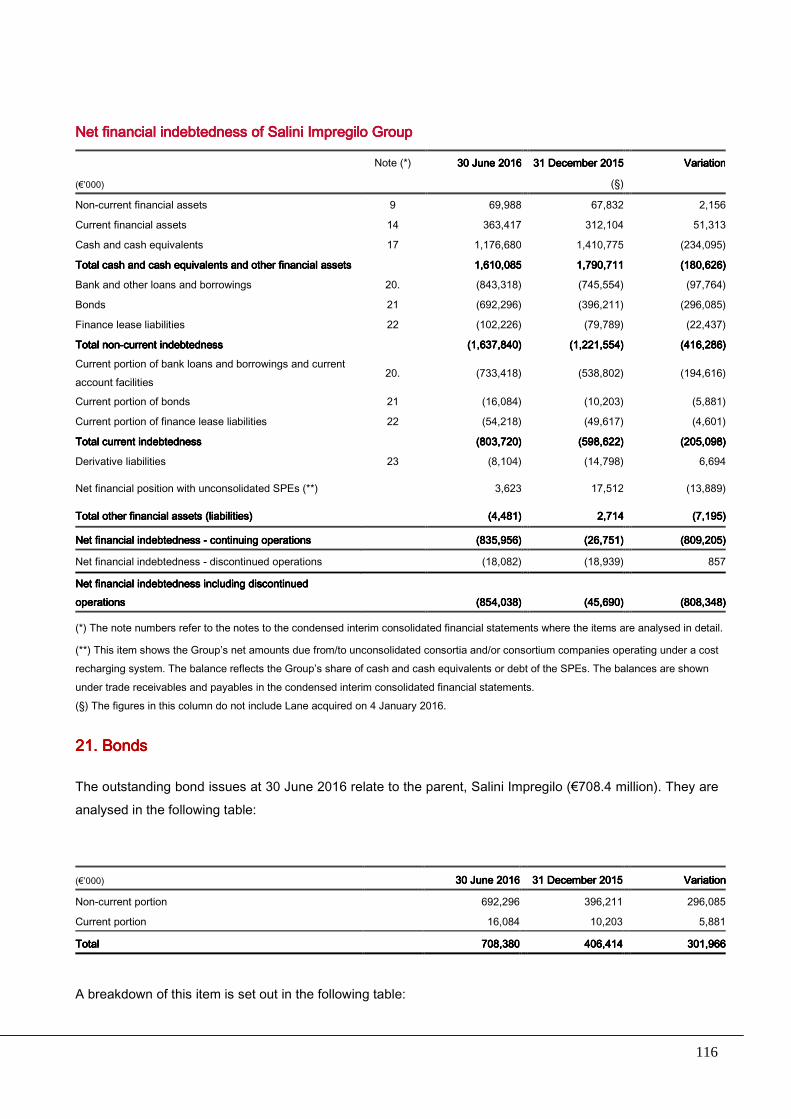
116
Net financial indebtedness of Salini Impregilo GroupNet financial indebtedness of Salini Impregilo GroupNet financial indebtedness of Salini Impregilo GroupNet financial indebtedness of Salini Impregilo Group Note (*) 30 June 201630 June 201630 June 201630 June 2016 31 December 201531 December 201531 December 201531 December 2015 VariationVariationVariationVariation
(€’000) (§)
Non-current financial assets 9 69,988 67,832 2,156
Current financial assets 14 363,417 312,104 51,313
Cash and cash equivalents 17 1,176,680 1,410,775 (234,095)
Total cash and cash equivalents and other financial assetsTotal cash and cash equivalents and other financial assetsTotal cash and cash equivalents and other financial assetsTotal cash and cash equivalents and other financial assets 1,610,0851,610,0851,610,0851,610,085 1,790,7111,790,7111,790,7111,790,711 (180,626)(180,626)(180,626)(180,626)
Bank and other loans and borrowings 20. (843,318) (745,554) (97,764)
Bonds 21 (692,296) (396,211) (296,085)
Finance lease liabilities 22 (102,226) (79,789) (22,437)
Total nonTotal nonTotal nonTotal non----current indebtednesscurrent indebtednesscurrent indebtednesscurrent indebtedness (1,637,840)(1,637,840)(1,637,840)(1,637,840) (1,221,554)(1,221,554)(1,221,554)(1,221,554) (416,286)(416,286)(416,286)(416,286)
Current portion of bank loans and borrowings and current account facilities
20. (733,418) (538,802) (194,616)
Current portion of bonds 21 (16,084) (10,203) (5,881)
Current portion of finance lease liabilities 22 (54,218) (49,617) (4,601)
Total current Total current Total current Total current indebtednessindebtednessindebtednessindebtedness (803,720)(803,720)(803,720)(803,720) (598,622)(598,622)(598,622)(598,622) (205,098)(205,098)(205,098)(205,098)
Derivative liabilities 23 (8,104) (14,798) 6,694
Net financial position with unconsolidated SPEs (**) 3,623 17,512 (13,889)
Total other financial assets (liabilities)Total other financial assets (liabilities)Total other financial assets (liabilities)Total other financial assets (liabilities) (4,481)(4,481)(4,481)(4,481) 2,7142,7142,7142,714 (7,195)(7,195)(7,195)(7,195)
Net financial indebtedness Net financial indebtedness Net financial indebtedness Net financial indebtedness ---- continuing operationscontinuing operationscontinuing operationscontinuing operations (835,956)(835,956)(835,956)(835,956) (26,751)(26,751)(26,751)(26,751) (809,205)(809,205)(809,205)(809,205)
Net financial indebtedness - discontinued operations (18,082) (18,939) 857
Net financial indebtedness including discontinued Net financial indebtedness including discontinued Net financial indebtedness including discontinued Net financial indebtedness including discontinued operationsoperationsoperationsoperations (854,038)(854,038)(854,038)(854,038) (45,690)(45,690)(45,690)(45,690) (808,348)(808,348)(808,348)(808,348)
(*) The note numbers refer to the notes to the condensed interim consolidated financial statements where the items are analysed in detail.
(**) This item shows the Group’s net amounts due from/to unconsolidated consortia and/or consortium companies operating under a cost recharging system. The balance reflects the Group’s share of cash and cash equivalents or debt of the SPEs. The balances are shown under trade receivables and payables in the condensed interim consolidated financial statements. (§) The figures in this column do not include Lane acquired on 4 January 2016.
21. Bonds21. Bonds21. Bonds21. Bonds
The outstanding bond issues at 30 June 2016 relate to the parent, Salini Impregilo (€708.4 million). They are analysed in the following table:
(€’000) 30 June 201630 June 201630 June 201630 June 2016 31 December 201531 December 201531 December 201531 December 2015 VariationVariationVariationVariation
Non-current portion 692,296 396,211 296,085
Current portion 16,084 10,203 5,881
TotalTotalTotalTotal 708,380708,380708,380708,380 406,414406,414406,414406,414 301,966301,966301,966301,966
A breakdown of this item is set out in the following table:
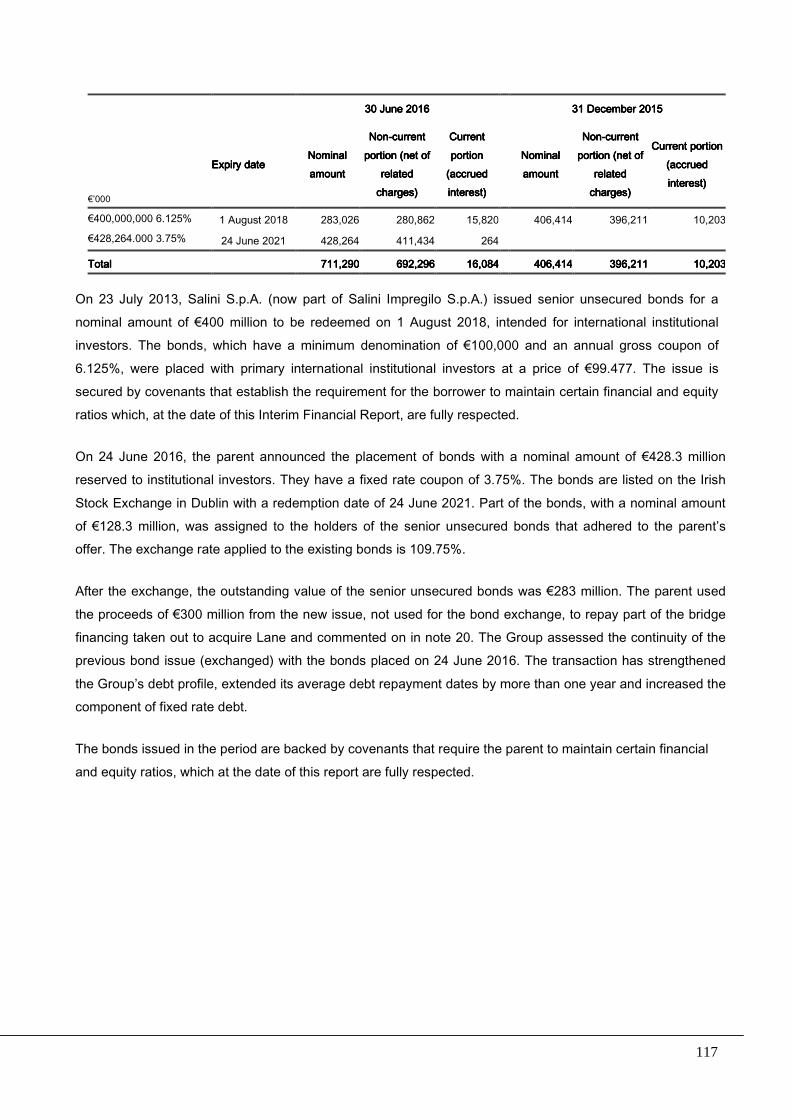
117
]h 30 30 30 30 JuneJuneJuneJune 2016201620162016 31 31 31 31 DecemberDecemberDecemberDecember 2015201520152015
]h €’000
Expiry dateExpiry dateExpiry dateExpiry date Nominal Nominal Nominal Nominal amountamountamountamount
NonNonNonNon----current current current current portion (net of portion (net of portion (net of portion (net of
related related related related charges)charges)charges)charges)
Current Current Current Current portion portion portion portion
(accrued (accrued (accrued (accrued interest)interest)interest)interest)
Nominal Nominal Nominal Nominal amountamountamountamount
NonNonNonNon----current current current current portion (net of portion (net of portion (net of portion (net of
related related related related charges)charges)charges)charges)
Current portion Current portion Current portion Current portion (accrued (accrued (accrued (accrued interest)interest)interest)interest)
€400,000,000 6.125% 1 August 2018 283,026 280,862 15,820 406,414 396,211 10,203
€428,264.000 3.75% 24 June 2021 428,264 411,434 264
TotalTotalTotalTotal 711711711711,,,,290290290290 692692692692,,,,296296296296 16161616,,,,084084084084 406406406406,,,,414414414414 396396396396,,,,211211211211 10101010,,,,203203203203
On 23 July 2013, Salini S.p.A. (now part of Salini Impregilo S.p.A.) issued senior unsecured bonds for a nominal amount of €400 million to be redeemed on 1 August 2018, intended for international institutional investors. The bonds, which have a minimum denomination of €100,000 and an annual gross coupon of 6.125%, were placed with primary international institutional investors at a price of €99.477. The issue is secured by covenants that establish the requirement for the borrower to maintain certain financial and equity ratios which, at the date of this Interim Financial Report, are fully respected.
On 24 June 2016, the parent announced the placement of bonds with a nominal amount of €428.3 million reserved to institutional investors. They have a fixed rate coupon of 3.75%. The bonds are listed on the Irish
Stock Exchange in Dublin with a redemption date of 24 June 2021. Part of the bonds, with a nominal amount of €128.3 million, was assigned to the holders of the senior unsecured bonds that adhered to the parent’s offer. The exchange rate applied to the existing bonds is 109.75%.
After the exchange, the outstanding value of the senior unsecured bonds was €283 million. The parent used the proceeds of €300 million from the new issue, not used for the bond exchange, to repay part of the bridge financing taken out to acquire Lane and commented on in note 20. The Group assessed the continuity of the previous bond issue (exchanged) with the bonds placed on 24 June 2016. The transaction has strengthened
the Group’s debt profile, extended its average debt repayment dates by more than one year and increased the component of fixed rate debt.
The bonds issued in the period are backed by covenants that require the parent to maintain certain financial and equity ratios, which at the date of this report are fully respected.

118
22. Finance lease liabilities22. Finance lease liabilities22. Finance lease liabilities22. Finance lease liabilities
Finance lease liabilities may be broken down as follows at 30 June 2016:
(€’000) 30 June 201630 June 201630 June 201630 June 2016 31 December 201531 December 201531 December 201531 December 2015 VariationVariationVariationVariation
Non-current portion 102,226 79,789 22,437
Current portion 54,218 49,617 4,601
This item includes the principal of future lease payments at the reporting date for the purchase of plant, machinery and equipment with an average life of between 3 to 8 years.
At 30 June 2016, the effective average rate ranged between 2% to 5% for the Italian companies.
Liabilities for these leases are guaranteed to the lessor via rights to the leased assets.
The present value of the minimum future lease payments is €156.4 million (31 December 2015: €129.4
million) as follows:
(€’000) 30 June 201630 June 201630 June 201630 June 2016 31 December 201531 December 201531 December 201531 December 2015
Minimum lease payments:Minimum lease payments:Minimum lease payments:Minimum lease payments:
Due within one year 60,031 43,553
Due between one and five years 105,661 92,134
Due after five years 3,020 4,780
TotalTotalTotalTotal 168,71168,71168,71168,712222 140,467140,467140,467140,467
Future interest expense (12,268) (11,061)
Net present valueNet present valueNet present valueNet present value 156,44156,44156,44156,444444 129,40129,40129,40129,406666
The net present value is as follows:The net present value is as follows:The net present value is as follows:The net present value is as follows:
Due within one year 54,218 49,617
Due between one and five years 99,340 75,417
Due after five years 2,886 4,372
TotalTotalTotalTotal 156,44156,44156,44156,444444 129,407129,407129,407129,407
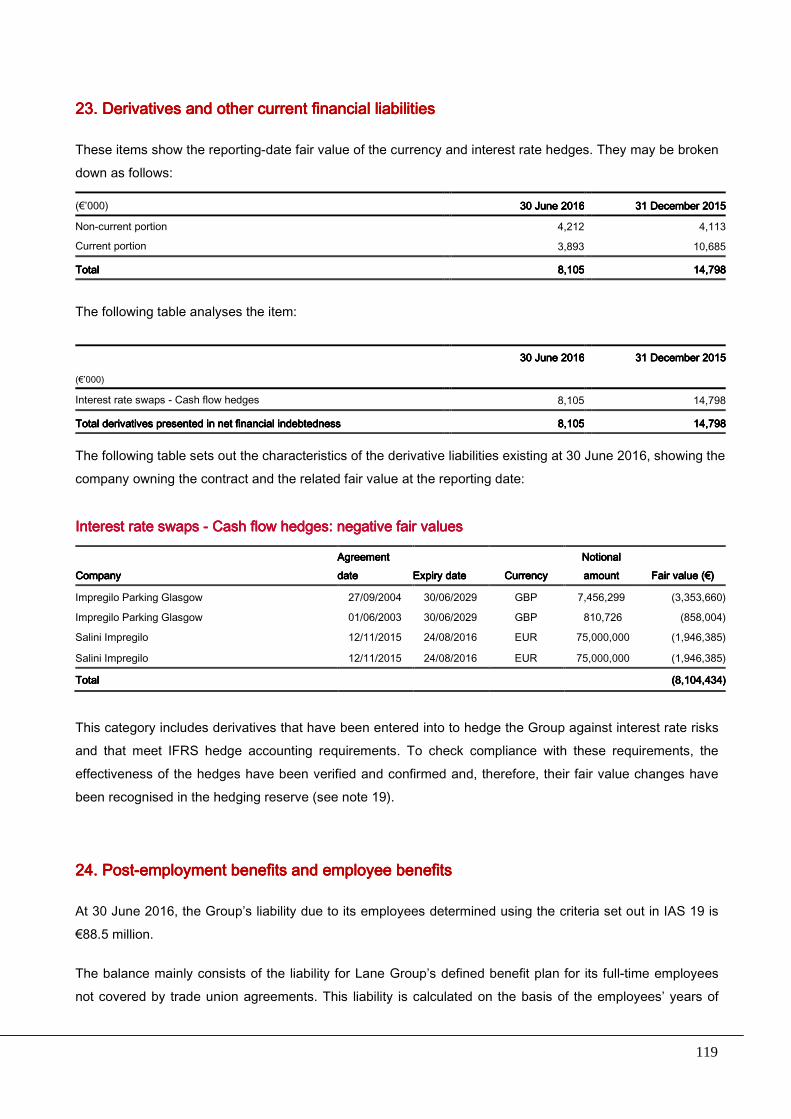
119
23. Derivatives and other current financial liabilities23. Derivatives and other current financial liabilities23. Derivatives and other current financial liabilities23. Derivatives and other current financial liabilities
These items show the reporting-date fair value of the currency and interest rate hedges. They may be broken down as follows:
(€’000) 30 June 201630 June 201630 June 201630 June 2016 31 December 201531 December 201531 December 201531 December 2015
Non-current portion 4,212 4,113
Current portion 3,893 10,685
TotalTotalTotalTotal 8,1058,1058,1058,105 14,79814,79814,79814,798
The following table analyses the item:
30 June 201630 June 201630 June 201630 June 2016 31 December 201531 December 201531 December 201531 December 2015
(€’000)
Interest rate swaps - Cash flow hedges 8,105 14,798
Total derivatives presented in net financial indebtednessTotal derivatives presented in net financial indebtednessTotal derivatives presented in net financial indebtednessTotal derivatives presented in net financial indebtedness 8,1058,1058,1058,105 14,79814,79814,79814,798
The following table sets out the characteristics of the derivative liabilities existing at 30 June 2016, showing the company owning the contract and the related fair value at the reporting date:
Interest rate swaps Interest rate swaps Interest rate swaps Interest rate swaps ---- Cash flow hedges:Cash flow hedges:Cash flow hedges:Cash flow hedges: negative fair valuesnegative fair valuesnegative fair valuesnegative fair values
CompanyCompanyCompanyCompany Agreement Agreement Agreement Agreement datedatedatedate Expiry dateExpiry dateExpiry dateExpiry date CurrencyCurrencyCurrencyCurrency
Notional Notional Notional Notional amountamountamountamount Fair value (Fair value (Fair value (Fair value (€)€)€)€)
Impregilo Parking Glasgow 27/09/2004 30/06/2029 GBP 7,456,299 (3,353,660)
Impregilo Parking Glasgow 01/06/2003 30/06/2029 GBP 810,726 (858,004)
Salini Impregilo 12/11/2015 24/08/2016 EUR 75,000,000 (1,946,385)
Salini Impregilo 12/11/2015 24/08/2016 EUR 75,000,000 (1,946,385)
Total Total Total Total (8,104,434)(8,104,434)(8,104,434)(8,104,434)
This category includes derivatives that have been entered into to hedge the Group against interest rate risks and that meet IFRS hedge accounting requirements. To check compliance with these requirements, the effectiveness of the hedges have been verified and confirmed and, therefore, their fair value changes have been recognised in the hedging reserve (see note 19).
24. Post24. Post24. Post24. Post----employment benefits and employee benefitsemployment benefits and employee benefitsemployment benefits and employee benefitsemployment benefits and employee benefits
At 30 June 2016, the Group’s liability due to its employees determined using the criteria set out in IAS 19 is €88.5 million.
The balance mainly consists of the liability for Lane Group’s defined benefit plan for its full-time employees not covered by trade union agreements. This liability is calculated on the basis of the employees’ years of

120
service and remuneration and is subjected to an actuarial valuation. Lane Group also provides healthcare cover to retired employees, hired before 31 December 1992 with at least 20 years of service.
The caption also includes the Italian post-employment benefits (TFR) related to Salini Impregilo S.p.A. and its Italian subsidiaries. The liability is the outstanding amount at the reform effective date, net of benefits paid up
to the reporting dates. The liability is considered part of a defined benefit plan under IAS 19 and has, therefore, been subjected to actuarial valuation. The valuation was performed with the assistance of an independent expert.
Changes in the item are as follows:
(€’000)
31 December 31 December 31 December 31 December 2015201520152015
AccrualsAccrualsAccrualsAccruals PaymentsPaymentsPaymentsPayments Net Net Net Net actuarial actuarial actuarial actuarial losseslosseslosseslosses
Other Other Other Other changeschangeschangeschanges
Contributions Contributions Contributions Contributions paid to INPS paid to INPS paid to INPS paid to INPS treasury and treasury and treasury and treasury and other fundsother fundsother fundsother funds
30 June 201630 June 201630 June 201630 June 2016
PostPostPostPost----employment employment employment employment benefits and employee benefits and employee benefits and employee benefits and employee benefitsbenefitsbenefitsbenefits
25,41225,41225,41225,412 7,207,207,207,204444 (22,446)(22,446)(22,446)(22,446) ((((6,9726,9726,9726,972)))) 85,3485,3485,3485,342222 ---- 88,53988,53988,53988,539
“Net actuarial losses” include the actuarial gains and losses recognised in the actuarial reserve as per the revised IAS 19 while “Other changes” include the effects of the acquisition of Lane Industries on 4 January
2016 as well as exchange rate gains and losses.
25. Provisions for risks25. Provisions for risks25. Provisions for risks25. Provisions for risks
These provisions amount to €106.2 million at the reporting date, as follows:
(€’000) 30 June 201630 June 201630 June 201630 June 2016 31 December 201531 December 201531 December 201531 December 2015 VariationVariationVariationVariation
Provisions for risks on equity investments 1,747 2,189 (442)
Other provisions 104,483 104,172 311
Total Total Total Total 106,230106,230106,230106,230 106,361106,361106,361106,361 (131)(131)(131)(131)
The provision for risks on equity investments relates to expected impairment losses on the carrying amount of the Group’s investments in associates for the part that exceeds their carrying amounts.
Changes in this provision are detailed below:

121
(€’000) 1st half 20161st half 20161st half 20161st half 2016
Acquisitions/disinvestments (222)
Share of loss of equity-accounted investees (218)
Other changes including change in the translation reserve (2)
TotalTotalTotalTotal (442)(442)(442)(442)
Other provisions comprise:
(€’000) 30 June 201630 June 201630 June 201630 June 2016 31 December 201531 December 201531 December 201531 December 2015
VariationVariationVariationVariation
USW Campania projects 32,760 32,760 -
Provisions set up by Imprepar and its subsidiaries 35,507 36,452 (945)
Ongoing litigation 9,790 9,877 (87)
Building segment litigation 795 795 -
Tax and social security litigation 3,353 3,304 49
Other 22,278 20,984 1,294
TotalTotalTotalTotal 104,483104,483104,483104,483 104,17104,17104,17104,172222 313131311111
The provision for the USW Campania projects mainly consists of the estimated potential costs for the
environmental clean-up. The section on the “Main risk factors and uncertainties” in the Directors’ report includes a description of the litigation and risks related to the USW Campania projects.
The provisions set up by Imprepar and its subsidiaries include accruals made for probable future charges related to the closing of contracts and potential developments in ongoing litigation.
The provision for ongoing litigation refers to disputes involving Salini Impregilo and certain of its subsidiaries.
“Other” mainly comprises amounts accrued in 2015 for certain foreign contracts completed in previous years for which disputes are ongoing with the customers. Relationships with these customers are difficult and, therefore, the Group is unable to estimate exactly when the related receivables will be collected.
Changes in the item in the period are summarised below:
(€’000)
31 December 31 December 31 December 31 December 2015201520152015
Accruals Accruals Accruals Accruals UtilisationsUtilisationsUtilisationsUtilisations Change in Change in Change in Change in consolidation consolidation consolidation consolidation
scopescopescopescope
ReclassificationsReclassificationsReclassificationsReclassifications Exchange Exchange Exchange Exchange rate gains rate gains rate gains rate gains
(losses)(losses)(losses)(losses)
30 June 201630 June 201630 June 201630 June 2016
Total Total Total Total 104,17104,17104,17104,172222 1,2001,2001,2001,200 (6,745)(6,745)(6,745)(6,745) 6,366,366,366,362222 (59)(59)(59)(59) (447)(447)(447)(447) 104,483104,483104,483104,483
Changes of the period comprise:
• accruals of €1.2 million, mainly related to the subsidiaries Imprepar (€0.7 million) and Impregilo-Terna
SNFCC JV (€0.4 million);

122
• utilisations of €6.7 million, related to the subsidiaries Imprepar and Consorcio Acueducto Oriental due
to the occurrence of the events for which the provision had been set up;
• changes in the consolidation scope of €6.4 million refer to the acquisition of Lane Industries
Incorporated while the reclassifications of €59 thousand relate to the assets and liabilities held for sale
of the HCE business unit.
Reference should be made to the section on the “Main risk factors and uncertainties” of the Directors’ report for more information on litigation.
26. Progress payments and advances on contract work in progress26. Progress payments and advances on contract work in progress26. Progress payments and advances on contract work in progress26. Progress payments and advances on contract work in progress
This item, included in “Current liabilities”, amounts to €1,884.1 million, up €21.3 million on the figure at 31 December 2015. It comprises:
(€’000) 30 June 201630 June 201630 June 201630 June 2016 31 December 201531 December 201531 December 201531 December 2015 VariationVariationVariationVariation
Contract work in progress (4,695,342) (4,099,585) (595,757)
Progress payments and advances received (on approved work) 4,901,335 4,211,995 689,340
Negative workNegative workNegative workNegative work in progressin progressin progressin progress 205,993205,993205,993205,993 112,410112,410112,410112,410 93,58393,58393,58393,583
Contractual advances 1,678,115 1,750,349 (72,234)
Total Total Total Total 1,884,1081,884,1081,884,1081,884,108 1,862,7591,862,7591,862,7591,862,759 21,34921,34921,34921,349
Work in progress recognised under liabilities (negative WIP) of €206.0 million is the negative net balance, for each contract, of work performed to date and progress billings and advances.
The following table shows the contribution by geographical segment of negative WIP and contractual advances:
30 June 30 June 30 June 30 June
2016201620162016
31 31 31 31 December December December December
2015201520152015
(€’000) Negative Negative Negative Negative
WIPWIPWIPWIP AdvancesAdvancesAdvancesAdvances TotalTotalTotalTotalNegative Negative Negative Negative
WIPWIPWIPWIP AdvancesAdvancesAdvancesAdvances TotalTotalTotalTotal VariationVariationVariationVariation
Italy 6,019 135,065 141,084 13,862 100,576 114,438 26,646EU (excluding Italy) 39,108 153,942 193,050 48,426 147,413 195,839 (2,789)Non-EU 5,774 50,146 55,920 2,523 42,509 45,032 10,888Asia 470 25,329 25,799 - 23,768 23,768 2,031Middle East 17,856 509,244 527,100 10,839 594,991 605,830 (78,730)Africa 2,097 661,024 663,121 9,900 725,901 735,801 (72,680)North America 96,609 - 96,609 17,870 - 17,870 78,739Latin America 23,118 112,518 135,636 8,990 112,640 121,630 14,006Oceania 14,942 30,847 45,789 - 2,551 2,551 43,238
TotalTotalTotalTotal 205,993205,993205,993205,993 1,678,1151,678,1151,678,1151,678,115 1,884,1081,884,1081,884,1081,884,108 112,410112,410112,410112,410 1,750,3491,750,3491,750,3491,750,349 1,862,7591,862,7591,862,7591,862,759 21,34921,34921,34921,349
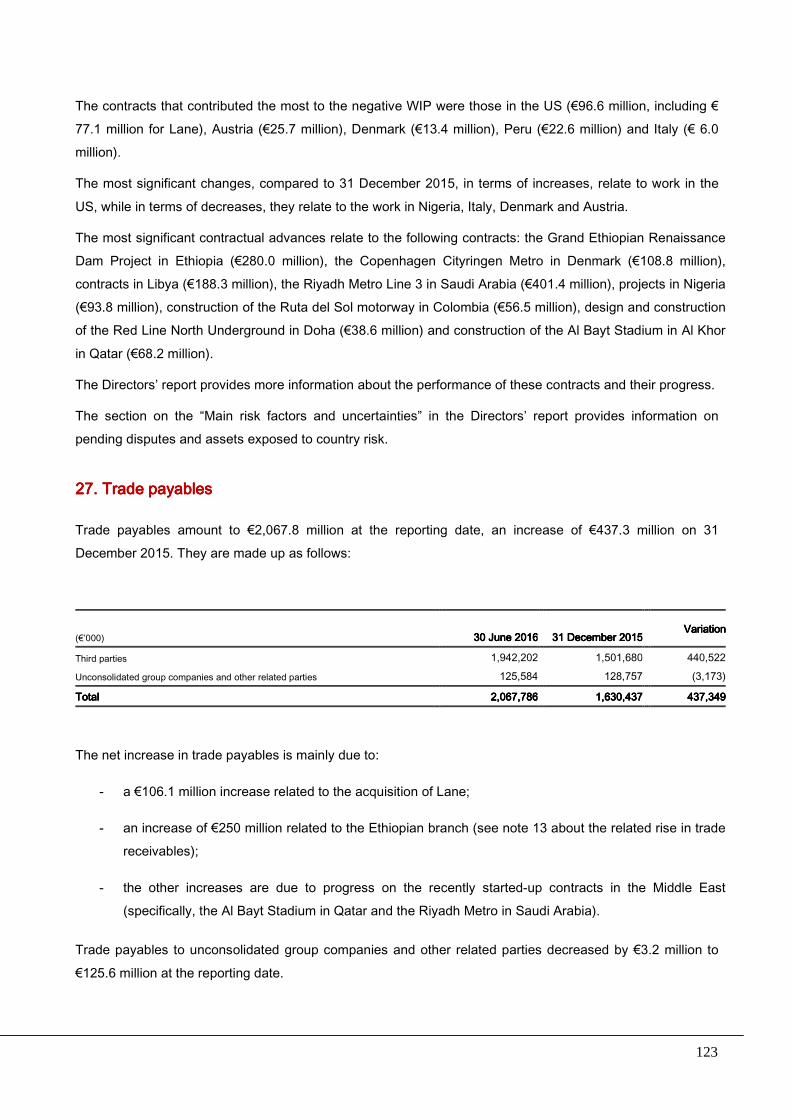
123
The contracts that contributed the most to the negative WIP were those in the US (€96.6 million, including €77.1 million for Lane), Austria (€25.7 million), Denmark (€13.4 million), Peru (€22.6 million) and Italy (€ 6.0 million).
The most significant changes, compared to 31 December 2015, in terms of increases, relate to work in the
US, while in terms of decreases, they relate to the work in Nigeria, Italy, Denmark and Austria.
The most significant contractual advances relate to the following contracts: the Grand Ethiopian Renaissance Dam Project in Ethiopia (€280.0 million), the Copenhagen Cityringen Metro in Denmark (€108.8 million), contracts in Libya (€188.3 million), the Riyadh Metro Line 3 in Saudi Arabia (€401.4 million), projects in Nigeria (€93.8 million), construction of the Ruta del Sol motorway in Colombia (€56.5 million), design and construction of the Red Line North Underground in Doha (€38.6 million) and construction of the Al Bayt Stadium in Al Khor
in Qatar (€68.2 million).
The Directors’ report provides more information about the performance of these contracts and their progress.
The section on the “Main risk factors and uncertainties” in the Directors’ report provides information on pending disputes and assets exposed to country risk.
27. Trade payables 27. Trade payables 27. Trade payables 27. Trade payables
Trade payables amount to €2,067.8 million at the reporting date, an increase of €437.3 million on 31 December 2015. They are made up as follows:
(€’000) 30 June 201630 June 201630 June 201630 June 2016 31 December 201531 December 201531 December 201531 December 2015
VariationVariationVariationVariation
Third parties 1,942,202 1,501,680 440,522
Unconsolidated group companies and other related parties 125,584 128,757 (3,173)
TotalTotalTotalTotal 2,067,7862,067,7862,067,7862,067,786 1,630,4371,630,4371,630,4371,630,437 437,349437,349437,349437,349
The net increase in trade payables is mainly due to:
- a €106.1 million increase related to the acquisition of Lane;
- an increase of €250 million related to the Ethiopian branch (see note 13 about the related rise in trade receivables);
- the other increases are due to progress on the recently started-up contracts in the Middle East (specifically, the Al Bayt Stadium in Qatar and the Riyadh Metro in Saudi Arabia).
Trade payables to unconsolidated group companies and other related parties decreased by €3.2 million to
€125.6 million at the reporting date.

124
This reduction is principally attributable to the increase in the payable from the consortium company Metro Blu
S.c.r.l., involved in constructing Line 4 of the Milan Metro and the decrease in the payable from the consortium
company Pedelombarda S.c.p.a. The item mostly consists of payables from unconsolidated SPEs accrued on
work performed by these entities for contracts with Italian and foreign public administrations.
28. Current tax liabilities and other current tax liabilities28. Current tax liabilities and other current tax liabilities28. Current tax liabilities and other current tax liabilities28. Current tax liabilities and other current tax liabilities
Current tax liabilities amount to €65.8 million as follows:
(€’000) 30 June 201630 June 201630 June 201630 June 2016 31 December 201531 December 201531 December 201531 December 2015 VariationVariationVariationVariation
IRES 10,716 9,835 881
IRAP 8,906 687 8,219
Foreign taxes 46,142 57,751 (11,609)
TotalTotalTotalTotal 65,76465,76465,76465,764 68,27368,27368,27368,273 (2,509)(2,509)(2,509)(2,509)
Other current tax liabilities of €55.5 million decreased by €5.6 million over 31 December 2015. They may be analysed as follows:
(€’000) 30 June 201630 June 201630 June 201630 June 2016 31 December 201531 December 201531 December 201531 December 2015 VariationVariationVariationVariation
Witholdings 2 284 (282)
VAT 32,429 39,311 (6,882)
Other indirect taxes 23,020 21,502 1,518
TotalTotalTotalTotal 55,45155,45155,45155,451 61,09761,09761,09761,097 (5,646)(5,646)(5,646)(5,646)
29. Other current liabilities29. Other current liabilities29. Other current liabilities29. Other current liabilities
Other current liabilities of €324.2 million (31 December 2015: €334.2 million) comprise:
(€’000) 30 June 201630 June 201630 June 201630 June 2016 31 December 201531 December 201531 December 201531 December 2015 VariationVariationVariationVariation
Social security institutions 23,087 16,233 6,854
Employees 63,095 52,225 10,870
Compensation and compulsory purchases 6,657 7,331 (674)
State bodies 115,588 115,588 -
Guarantee deposits 216 198 18
Other 83,212 108,163 (24,951)
Unconsolidated group companies and other related parties 15,891 13,060 2,831
Accrued expenses and deferred income 16,503 21,400 (4,897)
TotalTotalTotalTotal 324,249324,249324,249324,249 334,198334,198334,198334,198 (9,949)(9,949)(9,949)(9,949)

125
“Employees” relate to accrued unpaid remuneration. The large increase in this item during the period, like for “Social security institutions”, is mainly due to the inclusion of Lane in the consolidation scope.
“Compensation and compulsory purchases” relate to the high speed/capacity railway contracts; the decrease of €0.6 million refers to the Milan - Genoa section.
“State bodies” (€115.6 million) entirely relate to the transactions with the commissioner, the provincial authorities and municipalities of Campania in connection with the USW Campania projects. Reference should be made to the “Main risk factors and uncertainties” section in the Directors’ report for more information about the complicated situation surrounding the USW Campania projects.
“Other” of € 83.2 million (31 December 2015: €108.2 million) decreased by roughly €25 million. Such reduction is mainly attributable to the decrease in the parent’s liabilities (€5.2 million), those of the Slovakian
branch (€3.6 million) and the investee IGL-SK-GALFAR (€5.5 million) as a result of the regular settlement of liabilities during normal business activities. In addition, liabilities for contracts completed or nearing completion, such as the El Quimbo hydroelectric project in Colombia and the Ingula hydroelectric project in South Africa, also decreased by €8.8 million.
“Unconsolidated group companies and other related parties” of €15.9 million increased by €2.8 million on 31
December 2015, mainly related to liabilities with Tessaloniki Metro CW in Greece.
Accrued expenses and deferred income of €16.5 million include the ten-year post-contract guarantee of €5.0 million. The €4.9 million decrease mostly relates to the Venezuelan branch and CAVTOMI Consortium for the works on the high speed Milan-Turin section.
(€’000) 30 June 201630 June 201630 June 201630 June 2016 31 December 201531 December 201531 December 201531 December 2015 VariationVariationVariationVariation
Accrued expenses:
- Commissions on sureties 973 3,594 (2,621)
- Other 10,781 12,485 (1,704)
Total accrued expensesTotal accrued expensesTotal accrued expensesTotal accrued expenses 11,7511,7511,7511,754444 16,07916,07916,07916,079 (4,32(4,32(4,32(4,325555))))
Deferred income:
- Provision of services 4,749 5,321 (572)
Total deferred incomeTotal deferred incomeTotal deferred incomeTotal deferred income 4,7494,7494,7494,749 5,3215,3215,3215,321 (572)(572)(572)(572)
TotalTotalTotalTotal 16,5016,5016,5016,503333 21,40021,40021,40021,400 (4,89(4,89(4,89(4,897777))))

126
30. Guarantees, commitments, risks and contingent liabilities30. Guarantees, commitments, risks and contingent liabilities30. Guarantees, commitments, risks and contingent liabilities30. Guarantees, commitments, risks and contingent liabilities
Guarantees and commitmentsGuarantees and commitmentsGuarantees and commitmentsGuarantees and commitments
The key guarantees given by the Group are set out below:
- contractual sureties: these total € 7,488.3 million and are given to customers as performance bonds, to guarantee advances, withholdings and involvement in tenders for all ongoing contracts. In turn, the group companies have guarantees given by their subcontractors;
- sureties for credit of €339.6 million;
- sureties granted for export credit of €160.0 million;
- other guarantees of €853.2 million consisting of guarantees related to customs and tax obligations (€65.9 million) and for other commitments (such as environmental clean-ups and export credit) (€787.3 million);
- collateral related to:
−−−− lien on the remaining shares of Tangenziale Esterna S.p.A. given to guarantee a loan (€17.4 million);
−−−− lien on the shares of the SPE M4 (€1.9 million).
Litigation and contingent liabilitiesLitigation and contingent liabilitiesLitigation and contingent liabilitiesLitigation and contingent liabilities
The Group is involved in civil and administrative proceedings that are not expected to have a significant negative effect on its condensed interim consolidated financial statements, based on the information currently available and the existing provisions for risks. The section on the “Main risk factors and uncertainties” in the Directors’ report provides information about the main disputes.
Tax disputesTax disputesTax disputesTax disputes
Salini Impregilo S.p.A.Salini Impregilo S.p.A.Salini Impregilo S.p.A.Salini Impregilo S.p.A.
With respect to the principal dispute with the tax authorities:
• the dispute about the assessment notice challenging the tax treatment of impairment losses and losses on the sale of assets recognised by the parent in 2003 is currently before the Supreme Court, following the tax authorities’ appeal. As noted in previous reports, the main issue about the sale by Impregilo S.p.A. of its investment in the Chilean operator Costanera Norte SA to Impregilo International Infrastructures NV was cancelled by the Milan Regional Tax Commission on 11 September 2009
(higher assessed tax base of €70 million);
• the parent’s appeal about reimbursement of tax assets with a nominal amount of €12.3 million acquired from third parties as part of previous non-recurring transactions is still pending before the Supreme Court;
127
• a dispute about the technique used to “realign” the carrying amount of equity investments as per article 128 of Presidential decree no. 917/86 (greater assessed tax base of €4.2 million) is still pending before the first level court;
• with respect to another dispute again related to 2005 and the costs of a joint venture set up in
Venezuela for which the greater assessed tax base is €6.6 million, the Regional Tax Commission filed its ruling entirely in the parent’s favour on 19 May 2015; the tax authorities appealed to the Supreme Court on 28 December 2015 challenging the procedure while stating that the findings do not relate to the appeal. The parent has filed its defence brief;
• the parent was notified of: (i) a payment order from the tax authorities for Islandic taxes of €4.6 million, which was cancelled after the parent’s appeal with the ruling filed on 30 November 2015; and (ii) a
payment bill for the same taxes which the parent appealed. It won both at first and second level. On 18 January 2016, the tax authorities presented their appeal to the Supreme Court and the parent filed its defence brief;
With respect to the above pending disputes, after consulting its legal advisors, the parent believes that it has acted correctly and deems that the risk of an adverse ruling is not probable.
Finally, the Milan unit of the tax police is currently performing a tax audit of the IRES, IRAP and VAT paid in 2011 and 2012.
IcelandicIcelandicIcelandicIcelandic branchbranchbranchbranch
With respect to the completed contract for the construction of a hydroelectric plant in Karanjukar (Iceland), a dispute arose with the Icelandic tax authorities in 2004 about the party required to act as the withholding agent for the remuneration of foreign temporary workers at the building site. Salini Impregilo was firstly wrongly held
responsible for the payment of the withholdings on this remuneration, which it therefore paid. Following the definitive ruling of the first level court, the parent’s claims were fully satisfied. Nevertheless, the local authorities subsequently commenced a new proceeding for exactly the same issue. The Supreme Court rejected the parent’s claims in its ruling handed down in February 2010, which is blatantly contrary to the previous ruling issued in 2007 on the same matter by the same judiciary authority. The parent had expected to
be refunded the unduly paid withholdings of €6.9 million (at the original exchange rate). After the last ruing, the parent took legal action at international level (appeal presented to the EFTA Surveillance Authority on 22 June 2010) and, as far as possible, again at local level as it deems that the last ruling issued by the Icelandic Supreme Court is unlawful both in respect of local legislative and international agreements regulating trade relations between the EFTA countries and international conventions which do not allow application of discriminatory treatments to foreign parties (individuals and companies) working in other EFTA countries. On 8
February 2012, the EFTA Surveillance Authority sent the Icelandic government a communication notifying the infraction of the free exchange of services and requested the government to provide its observations about this. In April 2013, the EFTA Surveillance Authority issued its documented opinion finding the Icelandic legislation to be inconsistent with the regulations covering trade relations between the member countries with respect to the regulations for the above dispute. It asked that Iceland take steps to comply with these
regulations. Accordingly, the parent requested the case be re-examined and is assessing whether to take

128
additional action at international level. Based on the above, Salini Impregilo does not believe objective reasons currently exist to change the valuations made about this dispute.
ImpreparImpreparImpreparImprepar
The Milan Regional Tax Commission filed a ruling on the IRES assessment notices for 2006/2007/2008
received by the subsidiary Imprepar at the end of March 2015 cancelling all the main findings notified by the tax authorities on the assessment notices for 2006 and 2007 for €12 million. In November 2015, the tax authorities appealed against the Milan Regional Tax Commission before the Supreme Court and the company filed its defence brief in December. After consulting its legal advisors, the subsidiary did not set up a provision for this tax dispute as it deems that the risk of an adverse ruling is not probable.
Impregilo InternationalImpregilo InternationalImpregilo InternationalImpregilo International Infrastructures NVInfrastructures NVInfrastructures NVInfrastructures NV
The Milan unit of the tax police has completed a tax audit of this subsidiary, based in Amsterdam and active in the Netherlands since 1999. Its preliminary assessment report, notified to the subsidiary on 12 May 2016, found that it is an Italian resident for tax purposes. Accordingly, the inspectors reported higher assessed IRES and IRAP taxes of approximately €22 million and higher assessed withholdings of €15 million on interest paid on the bonds listed on the Luxembourg stock exchange. Impregilo International Infrastructures NV holds that
the inspectors’ findings are groundless. Assisted by its legal advisors, it has presented a communication to the relevant tax office pursuant to article 12 of Law no. 212/00 (Charter of the Taxpayers’ Rights) setting out its detailed defensive reasonings and requesting that the inspectors’ findings be filed.
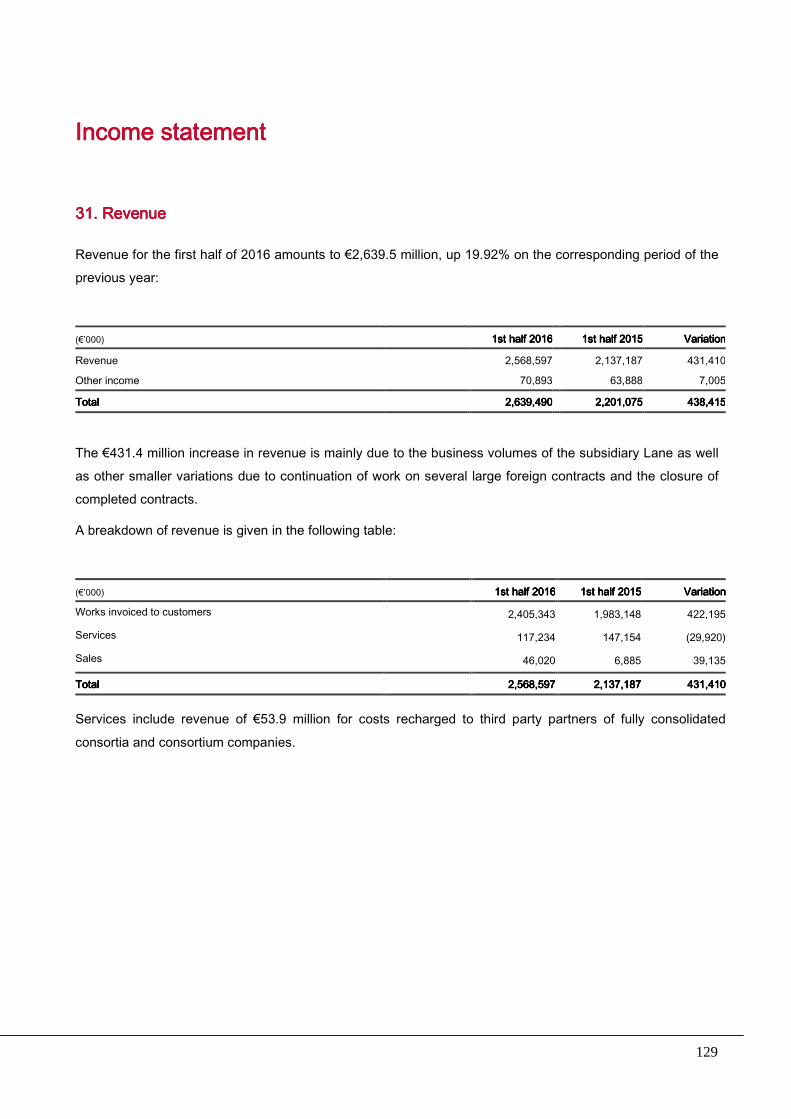
129
Income statementIncome statementIncome statementIncome statement
31. Revenue31. Revenue31. Revenue31. Revenue
Revenue for the first half of 2016 amounts to €2,639.5 million, up 19.92% on the corresponding period of the previous year:
(€’000) 1st half 20161st half 20161st half 20161st half 2016 1st half 20151st half 20151st half 20151st half 2015 VariationVariationVariationVariation
Revenue 2,568,597 2,137,187 431,410
Other income 70,893 63,888 7,005
TotalTotalTotalTotal 2,639,4902,639,4902,639,4902,639,490 2,201,0752,201,0752,201,0752,201,075 438,415438,415438,415438,415
The €431.4 million increase in revenue is mainly due to the business volumes of the subsidiary Lane as well as other smaller variations due to continuation of work on several large foreign contracts and the closure of completed contracts.
A breakdown of revenue is given in the following table:
(€’000) 1st half 20161st half 20161st half 20161st half 2016 1st half 20151st half 20151st half 20151st half 2015 VariationVariationVariationVariation
Works invoiced to customers 2,405,343 1,983,148 422,195
Services 117,234 147,154 (29,920)
Sales 46,020 6,885 39,135
Total Total Total Total 2,568,5972,568,5972,568,5972,568,597 2,137,1872,137,1872,137,1872,137,187 431,410431,410431,410431,410
Services include revenue of €53.9 million for costs recharged to third party partners of fully consolidated
consortia and consortium companies.
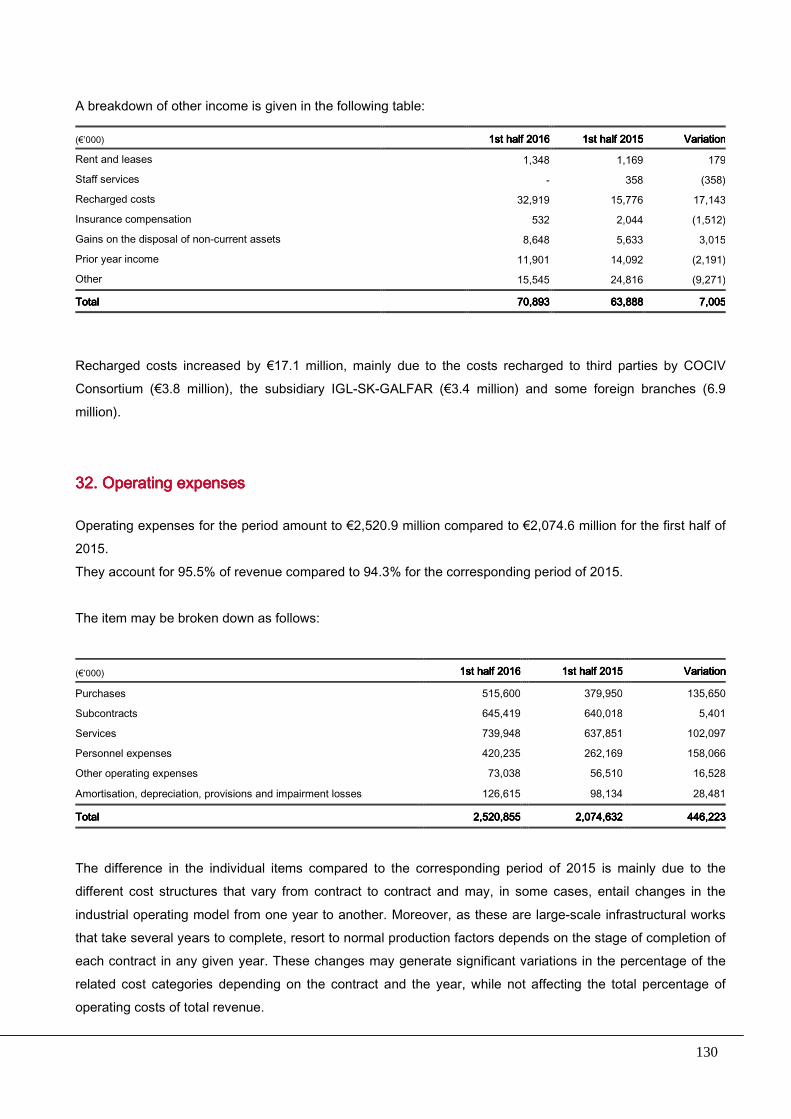
130
A breakdown of other income is given in the following table:
(€’000) 1st half 20161st half 20161st half 20161st half 2016 1st half 20151st half 20151st half 20151st half 2015 VariationVariationVariationVariation
Rent and leases 1,348 1,169 179
Staff services - 358 (358)
Recharged costs 32,919 15,776 17,143
Insurance compensation 532 2,044 (1,512)
Gains on the disposal of non-current assets 8,648 5,633 3,015
Prior year income 11,901 14,092 (2,191)
Other 15,545 24,816 (9,271)
TotalTotalTotalTotal 70,89370,89370,89370,893 63,88863,88863,88863,888 7,0057,0057,0057,005
Recharged costs increased by €17.1 million, mainly due to the costs recharged to third parties by COCIV Consortium (€3.8 million), the subsidiary IGL-SK-GALFAR (€3.4 million) and some foreign branches (6.9 million).
32. Operating expenses32. Operating expenses32. Operating expenses32. Operating expenses
Operating expenses for the period amount to €2,520.9 million compared to €2,074.6 million for the first half of 2015. They account for 95.5% of revenue compared to 94.3% for the corresponding period of 2015. The item may be broken down as follows:
(€’000) 1st half 20161st half 20161st half 20161st half 2016 1st half 20151st half 20151st half 20151st half 2015 VariationVariationVariationVariation
Purchases 515,600 379,950 135,650
Subcontracts 645,419 640,018 5,401
Services 739,948 637,851 102,097
Personnel expenses 420,235 262,169 158,066
Other operating expenses 73,038 56,510 16,528
Amortisation, depreciation, provisions and impairment losses 126,615 98,134 28,481
TotalTotalTotalTotal 2,520,852,520,852,520,852,520,855555 2,074,6322,074,6322,074,6322,074,632 446,22446,22446,22446,223333
The difference in the individual items compared to the corresponding period of 2015 is mainly due to the different cost structures that vary from contract to contract and may, in some cases, entail changes in the
industrial operating model from one year to another. Moreover, as these are large-scale infrastructural works that take several years to complete, resort to normal production factors depends on the stage of completion of each contract in any given year. These changes may generate significant variations in the percentage of the related cost categories depending on the contract and the year, while not affecting the total percentage of operating costs of total revenue.

131
32.1 Purchases32.1 Purchases32.1 Purchases32.1 Purchases
The cost of raw materials and consumables incurred in the first six months of 2016 increased by €135.7 million to €515.6 million compared to the corresponding period of 2015:
1st half 20161st half 20161st half 20161st half 2016 1st half 20151st half 20151st half 20151st half 2015 VariationVariationVariationVariation
(€’000)
Purchases of raw materials and consumables 508,856 375,860 132,995
Change in raw materials and consumables 6,745 4,090 2,655
TotalTotalTotalTotal 515,600515,600515,600515,600 379,950379,950379,950379,950 135,650135,650135,650135,650
The rise in the cost of purchasing raw materials and consumables is in line with the increase in revenue
thanks to the acquisition of Lane Group.
32.2 Subcontracts32.2 Subcontracts32.2 Subcontracts32.2 Subcontracts
Costs of subcontracts increased to €645.4 million, up €5.4 million on the corresponding period of 2015 as shown in the following table:
1st half 20161st half 20161st half 20161st half 2016 1st half 20151st half 20151st half 20151st half 2015 VariationVariationVariationVariation
(€’000)
Subcontracts 645,419 640,018 5,401
TotalTotalTotalTotal 645,419645,419645,419645,419 640,018640,018640,018640,018 5,4015,4015,4015,401
The €5.4 million increase is the sum of the increase for the IS JV’s Australian contracts (€20.5 million) partly offset by the reduction in the subcontract costs of the Colombian contracts of Constructora Ariguani, the Cityringen project of CMT I/S in Denmark and the Italian Salerno Reggio Calabria contract (nearing completion).

132
32.3 Services32.3 Services32.3 Services32.3 Services
This item increased to €740.0 million, up €102.1 million on the corresponding period of the previous year, as shown in the following table:
1st half 20161st half 20161st half 20161st half 2016 1st half 20151st half 20151st half 20151st half 2015 VariationVariationVariationVariation
(€’000)
Consultancy and technical services
283,590 191,239 92,351
Fees to directors, statutory auditors and independent auditors
6,251 6,430 (179)
Employee travel costs 2,267 3,466 (1,199)
Maintenance and testing 18,986 7,473 11,513
Transport and customs 61,606 86,681 (25,075)
Insurance 27,877 33,011 (5,134)
Recharging of costs by consortia 92,346 189,506 (97,160)
Rent and leases 125,988 66,269 59,719
Charge backs 34 176 (142)
Other 121,003 53,600 67,403
TotalTotalTotalTotal 739,948739,948739,948739,948 637,851637,851637,851637,851 102,097102,097102,097102,097
“Other” increased by €67.4 million over the first six months of 2015 and includes the cost of temporary workers on CMT IS’ Danish contract (Cityringen project) of approximately €68.8 million and costs allocated by joint operations of €4.7 million, while the remainder mostly relates to utilities, seconded personnel, security and board costs.
“Consultancy and technical services” increased by €92.4 million and mainly consist of the design and construction costs incurred by the SPEs and legal and administrative consultancy fees. A breakdown of this
item is as follows:
(€’000) 1st half 20161st half 20161st half 20161st half 2016 1st half 20151st half 20151st half 20151st half 2015 VariationVariationVariationVariation
Design and engineering services 201,765 151,329 50,436
Legal, administrative and other services 33,523 29,757 3,766
Testing 378 495 (117)
Construction 47,924 9,658 38,266
TotalTotalTotalTotal 283,590283,590283,590283,590 191,191,191,191,222239393939 92,3592,3592,3592,351111
The increase is mainly due to design and engineering services and the construction work performed on the Riyadh Metro in Saudi Arabia.

133
32.4 Personnel expenses32.4 Personnel expenses32.4 Personnel expenses32.4 Personnel expenses
Personnel expenses for the year amount to €420.2 million, up by €158.1 million on the corresponding period of 2015. The item is made up as follows:
(€’000)
1st half 20161st half 20161st half 20161st half 2016 1st half 20151st half 20151st half 20151st half 2015 VariationVariationVariationVariation
Wages and salaries 335,465 217,367 118,098
Social security and pension contributions 69,938 37,287 32,651
Post-employment benefits and employee benefits
7,203 7,435 (232)
Other 7,629 80 7,549
TotalTotalTotalTotal 420,235420,235420,235420,235 262,169262,169262,169262,169 158,066158,066158,066158,066
“Other” mainly relates to termination benefits and reimbursements of travel expenses.
32.5 Other operating expenses32.5 Other operating expenses32.5 Other operating expenses32.5 Other operating expenses
Other operating expenses amount to €73.0 million, up €16.5 million on the corresponding period of 2015.
This item is made up as follows:
1st half 20161st half 20161st half 20161st half 2016 1st half 20151st half 20151st half 20151st half 2015 VariationVariationVariationVariation
(€’000)
Other operating costs 38,462 20,288 18,174
Commissions on sureties 21,105 24,175 (3,070)
Bank charges 5,449 3,115 2,334
Losses on the disposal of property, plant and equipment
2,331 1,053
1,278
Other prior year expense 5,691 7,879 (2,188)
TotalTotalTotalTotal 73,0373,0373,0373,038888 56,51056,51056,51056,510 16,5216,5216,5216,528888
The increase in other operating costs is mainly due to the Ethiopian branch (€11.2 million), Salini Nigeria (€1.7 million) and the Cetin contract of the Salini - Insaat - NTF JV in Turkey (€0.9 million).

134
33332.6 Amortisation, depreciation, provisions and impairment losses2.6 Amortisation, depreciation, provisions and impairment losses2.6 Amortisation, depreciation, provisions and impairment losses2.6 Amortisation, depreciation, provisions and impairment losses
This item of €126.6 million shows an increase of €28.5 million on the balance for the corresponding period of the previous year. It may be analysed as follows:
1st half 20161st half 20161st half 20161st half 2016 1st half 20151st half 20151st half 20151st half 2015 VariationVariationVariationVariation
(€’000)
Impairment losses 4,206 (6,382) 10,588
Provisions (Utilisations) (1,116) 3,492 (4,608)
Total provisions and impairment losses, net of the Total provisions and impairment losses, net of the Total provisions and impairment losses, net of the Total provisions and impairment losses, net of the utilisationsutilisationsutilisationsutilisations
3,0903,0903,0903,090 (2,(2,(2,(2,888890909090)))) 5,5,5,5,999980808080
Amortisation of intangible assets 774 186 588
Depreciation of property, plant and equipment 108,001 91,912 16,089
Amortisation of rights to infrastructure under concession
666 752 (86)
Amortisation of contract acquisition costs 14,084 8,174 5,910
Total amortisation and depreciationTotal amortisation and depreciationTotal amortisation and depreciationTotal amortisation and depreciation 123,525123,525123,525123,525 101,02101,02101,02101,024444 22,5022,5022,5022,501111
TotalTotalTotalTotal 126,615126,615126,615126,615 98,13498,13498,13498,134 28,48128,48128,48128,481
Provisions and impairment losses increased by €6.0 million in the period.
Specifically, impairment losses recognised in the related allowance mainly refer to the Kazakhstani branch, recognised to adjust the carrying amount of receivables from Todini Costruzioni Generali S.p.A. as per the
agreement for the sale of the Todini branches.
“Provisions (Utilisations)” includes the release of accruals made in previous years following the updated risk forecasts for the consortium active in the Dominican Republic as well as accruals made by the subsidiary Imprepar for three pending disputes.
33. Net financing costs33. Net financing costs33. Net financing costs33. Net financing costs
Net financing costs amount to €44.6 million compared to €26.8 million for the first half of 2015.
The item may be broken down as follows:
(€’000) 1st half 20161st half 20161st half 20161st half 2016 1st half 20151st half 20151st half 20151st half 2015 VariationVariationVariationVariation
Financial income 21,883 19,004 2,879
Financial expense (68,639) (49,801) (18,838)
Net exchange rate gains 2,144 3,999 (1,855)
Net Net Net Net financing costsfinancing costsfinancing costsfinancing costs (44,612)(44,612)(44,612)(44,612) (26,798)(26,798)(26,798)(26,798) (17,814)(17,814)(17,814)(17,814)

135
33.1 Financial income33.1 Financial income33.1 Financial income33.1 Financial income
Financial income totals €21.9 million (first half of 2015: €19.0 million) and is made up as follows:
(€’000) 1st half 20161st half 20161st half 20161st half 2016 1st half1st half1st half1st half 2015201520152015 VariationVariationVariationVariation
Interest income on loans and receivables Interest income on loans and receivables Interest income on loans and receivables Interest income on loans and receivables - 1,145 (1,145)
Gains on securitiesGains on securitiesGains on securitiesGains on securities 6,256 78 6,178
Interest and other income from unconsolidated group companies and Interest and other income from unconsolidated group companies and Interest and other income from unconsolidated group companies and Interest and other income from unconsolidated group companies and other related partiesother related partiesother related partiesother related parties
5,105 4,270 835
Interest and other Interest and other Interest and other Interest and other financial incomefinancial incomefinancial incomefinancial income 10,522 13,511 (2,989)
- Interest income on correspondence accounts 308 9 299
- Interest on financing 1,260 275 985
- Bank interest 2,753 1,974 779
- Default interest 3,560 7,100 (3,540)
- Financial discounts and allowances 229 381 (152)
- Other 2,412 3,772 (1,360)
TotalTotalTotalTotal 21,88321,88321,88321,883 19,00419,00419,00419,004 2,8792,8792,8792,879
The €2.9 million increase is due to the recognition of the gain on the sale of foreign currency securities on the US market and the reduction in default interest due from customers during the period.
Other financial income includes interest income of €1.0 million on loans and receivables of the Argentine
operator Caminos de las Sierras.
33.2 Financial expense33.2 Financial expense33.2 Financial expense33.2 Financial expense
Financial expense totals €68.6 million compared to €49.8 million for the corresponding period of 2015 and is made up as follows:
(€’000) 1st half 20161st half 20161st half 20161st half 2016 1st half 20151st half 20151st half 20151st half 2015 VariationVariationVariationVariation
Intragroup interest and other expenseIntragroup interest and other expenseIntragroup interest and other expenseIntragroup interest and other expense (52)(52)(52)(52) (102)(102)(102)(102) 50505050
Interest and other financial expenseInterest and other financial expenseInterest and other financial expenseInterest and other financial expense (68,587)(68,587)(68,587)(68,587) (49,699)(49,699)(49,699)(49,699) (18,888)(18,888)(18,888)(18,888)
- Bank interest on accounts and financing (41,059) (25,129) (15,930)
- Interest on bonds (14,104) (15,364) 1,260
- Interest on tax liabilities (712) (625) (87)
- Default interest (631) (9) (622)
- Discounting (182) (141) (41)
- Bank fees (1,400) (1,154) (246)
- Charges on sureties (984) (518) (466)
- Other loans and borrowings (1,383) (999) (384)
- Factoring and leases (3,056) (5,026) 1,970
- Other (5,076) (734) (4,342)
TotalTotalTotalTotal (68,639)(68,639)(68,639)(68,639) (49,801)(49,801)(49,801)(49,801) (18,838)(18,838)(18,838)(18,838)
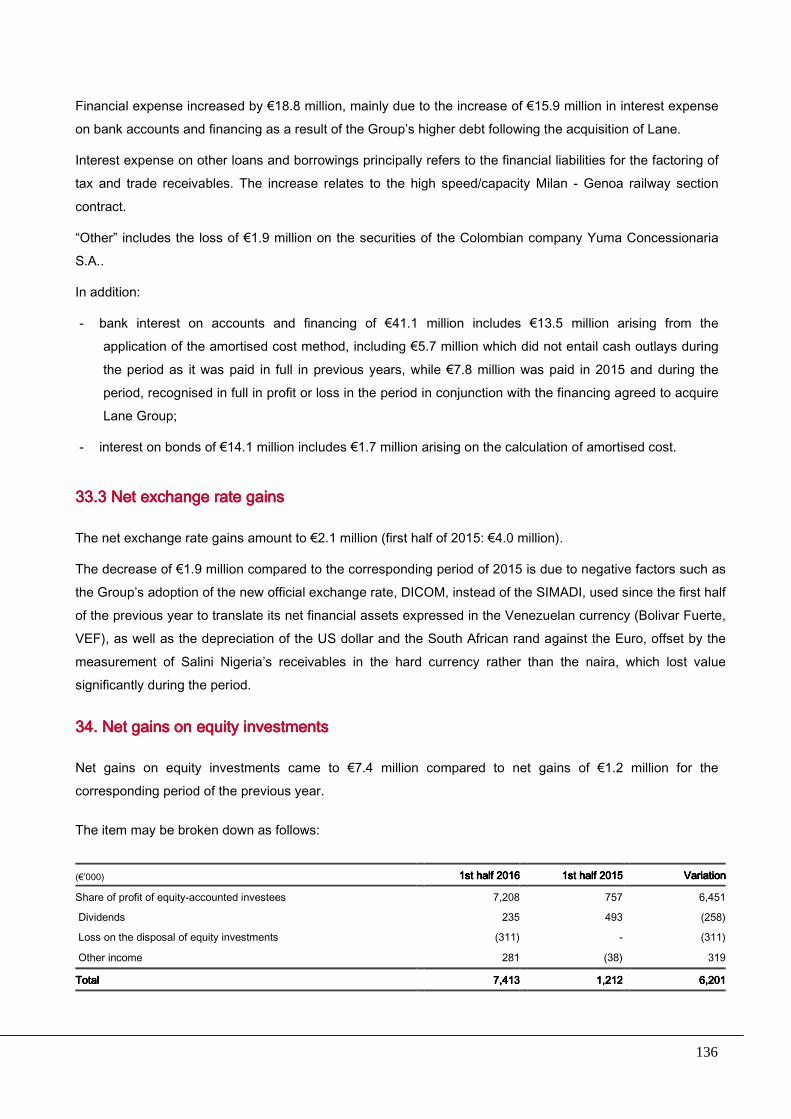
136
Financial expense increased by €18.8 million, mainly due to the increase of €15.9 million in interest expense on bank accounts and financing as a result of the Group’s higher debt following the acquisition of Lane.
Interest expense on other loans and borrowings principally refers to the financial liabilities for the factoring of tax and trade receivables. The increase relates to the high speed/capacity Milan - Genoa railway section
contract.
“Other” includes the loss of €1.9 million on the securities of the Colombian company Yuma Concessionaria S.A..
In addition:
- bank interest on accounts and financing of €41.1 million includes €13.5 million arising from the application of the amortised cost method, including €5.7 million which did not entail cash outlays during
the period as it was paid in full in previous years, while €7.8 million was paid in 2015 and during the period, recognised in full in profit or loss in the period in conjunction with the financing agreed to acquire Lane Group;
- interest on bonds of €14.1 million includes €1.7 million arising on the calculation of amortised cost.
33.3 Net exchange rate gains33.3 Net exchange rate gains33.3 Net exchange rate gains33.3 Net exchange rate gains
The net exchange rate gains amount to €2.1 million (first half of 2015: €4.0 million).
The decrease of €1.9 million compared to the corresponding period of 2015 is due to negative factors such as the Group’s adoption of the new official exchange rate, DICOM, instead of the SIMADI, used since the first half of the previous year to translate its net financial assets expressed in the Venezuelan currency (Bolivar Fuerte, VEF), as well as the depreciation of the US dollar and the South African rand against the Euro, offset by the
measurement of Salini Nigeria’s receivables in the hard currency rather than the naira, which lost value significantly during the period.
34. Net gains on equity investments34. Net gains on equity investments34. Net gains on equity investments34. Net gains on equity investments
Net gains on equity investments came to €7.4 million compared to net gains of €1.2 million for the corresponding period of the previous year.
The item may be broken down as follows:
(€’000) 1st half 20161st half 20161st half 20161st half 2016 1st half 20151st half 20151st half 20151st half 2015 VariationVariationVariationVariation
Share of profit of equity-accounted investees 7,208 757 6,451
Dividends 235 493 (258)
Loss on the disposal of equity investments (311) - (311)
Other income 281 (38) 319
TotalTotalTotalTotal 7,4137,4137,4137,413 1,211,211,211,212222 6,206,206,206,201111

137
The share of profit of equity-accounted investees is €7.4 million, an increase on the first half of 2015 mainly due to the change in the consolidation scope following the acquisition of the US group Lane.
The following table provides a breakdown of this item:
(€’000) 1st half 20161st half 20161st half 20161st half 2016 1st half 20151st half 20151st half 20151st half 2015 VariationVariationVariationVariation
Share of profit (loss) of equityShare of profit (loss) of equityShare of profit (loss) of equityShare of profit (loss) of equity----accounted investeesaccounted investeesaccounted investeesaccounted investees
Yuma Concessionaria 1,149 2,375 (1,226)
Agua Azul 558 558 -
Impregilo Arabia (173) (2,148) 1,975
Gupc (4,993) 893 (5,886)
Ochre Holding Solution (365) (1,024) 659
Metro de Lima Linea 2 S.A. 319 - 319
Other 34 103 (69)
SubSubSubSub----totaltotaltotaltotal (3,471)(3,471)(3,471)(3,471) 757757757757 (4,228)(4,228)(4,228)(4,228)
Lane Group companies:
Agl Constructor JV (Lane I.I.) 1,425 - 1,425
Gemma Lane Liberty 904 - 904
Gemma Lane Patriot 2,149 - 2,149
Hot Lanes 2 627 - 627
Purple Line 259 - 259
Skanka Granite Lane Jv 5,223 - 5,223
SGL I4 Leasing (Lane I.I.) 92 - 92
Total Lane Group joint ventures 10,679 - 10,679
TotalTotalTotalTotal 7,2087,2087,2087,208 757757757757 12,90212,90212,90212,902
35. Income 35. Income 35. Income 35. Income tax expensetax expensetax expensetax expense
The Group’s income tax expense for the period is €31.8 million. It is calculated using the tax rate expected to be applied to the forecast annual profit based on updated estimates at the reporting date. The tax rate used
for this reporting period was 39%.
36. Related party transactions36. Related party transactions36. Related party transactions36. Related party transactions
Transactions with related parties, as defined by IAS 24, were of an ordinary nature and were carried out with the following counterparties in the period:
• directors, statutory auditors and key management personnel, solely related to the contracts regulating
their positions within the Group;
• associates and joint arrangements; these transactions mainly relate to:
- commercial assistance with purchases and procurement of services necessary to carry out work on contracts, contracting and subcontracting;

138
- services (technical, organisational, legal and administrative), carried out at centralised level;
- financial transactions, namely loans and joint current accounts as part of cash pooling transactions and guarantees given on behalf of group companies.
Transactions are carried out with associates in the interests of Salini Impregilo, aimed at building on
existing synergies in the Group in terms of production and sales integration, efficient use of existing skills, streamlining of centralised structures and financial resources. These transactions are regulated by specific contracts and are carried out on an arm’s length basis;
• other related parties: the main transactions with other related parties, identified pursuant to IAS 24, including companies managed and coordinated by Salini Costruttori S.p.A., are summarised below:
NameNameNameName Loans and Loans and Loans and Loans and
receivablesreceivablesreceivablesreceivablesFinancial Financial Financial Financial
assetsassetsassetsassetsOther assetsOther assetsOther assetsOther assets Trade Trade Trade Trade
payablespayablespayablespayablesFinancial Financial Financial Financial liabilitiesliabilitiesliabilitiesliabilities
Total Total Total Total revenuerevenuerevenuerevenue
Total costsTotal costsTotal costsTotal costs Financing Financing Financing Financing income income income income (costs)(costs)(costs)(costs)
€’000
C.Tiburtino 15 9
Casada S.r.l. 25 157 9 128
CEDIV S.p.A. 1,687 3,241 9
Dirlan 88 12
G.A.B.I.RE S.r.l. 1,148 18,001 10
Galla Placida 11 9 Imm. Agricola San Vittorino 55 9
Infernetto 9 3 Iniziative Immobiliari Italiane S.p.A. 17 253 529
Madonna dei Monti S.r.l 3 19 6 71 1
Nores 26 3
Plus 167 15
Salini Costruttori S.p.A. 137 7,256 11,956 7,957 58 2 (100)Salini Simonpietro & C S.A.P.A. 29 7
Todini Finanziaria 1,506
Zeis 20 756 51 126 78 12
TotalTotalTotalTotal 4,4,4,4,999943434343 29,25429,25429,25429,254 11,95611,95611,95611,956 480480480480 7,9577,9577,9577,957 285285285285 808808808808 (87)(87)(87)(87)
Most of the Group’s production is carried out through SPEs, set up with other partners that have participated with Salini Impregilo in tenders. The SPEs carry out the related contracts on behalf of its partners.
The other transactions refer to costs for design and similar activities, incurred when presenting bids and for recently started contracts. They are also governed by specific agreements and carried out on an arm’s length basis and, where applicable, in line with the contract terms.
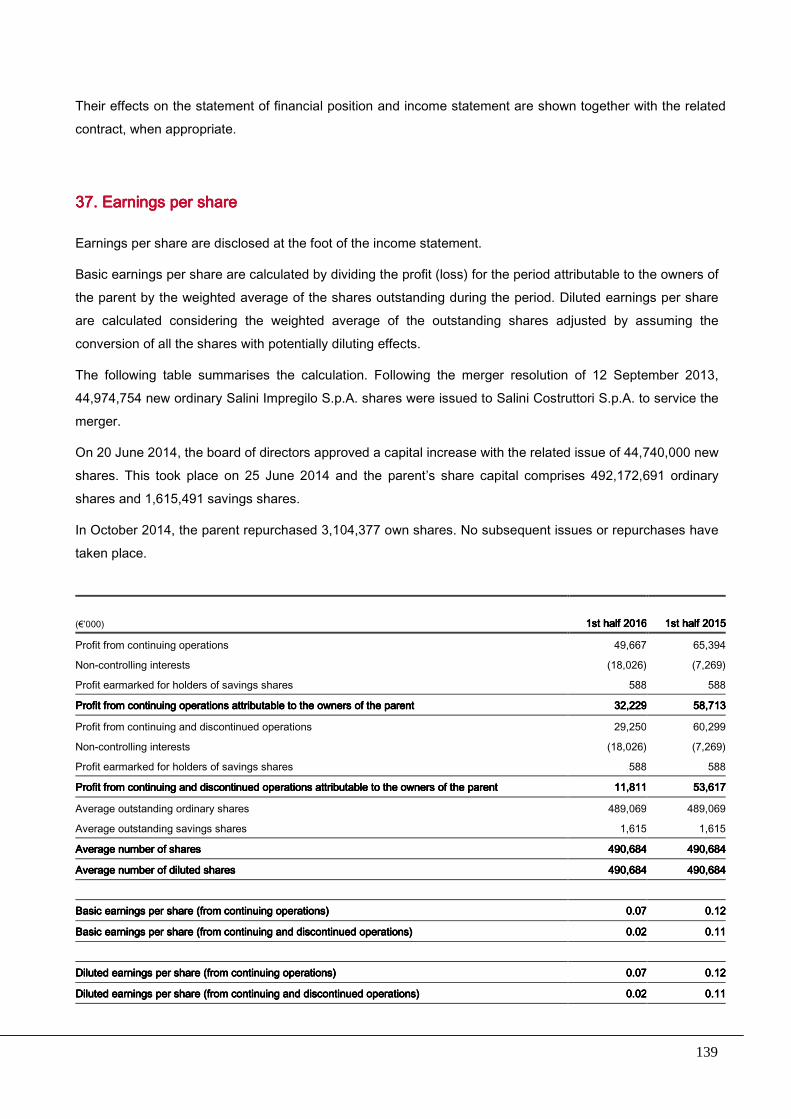
139
Their effects on the statement of financial position and income statement are shown together with the related contract, when appropriate.
37. Earnings per share37. Earnings per share37. Earnings per share37. Earnings per share
Earnings per share are disclosed at the foot of the income statement.
Basic earnings per share are calculated by dividing the profit (loss) for the period attributable to the owners of the parent by the weighted average of the shares outstanding during the period. Diluted earnings per share are calculated considering the weighted average of the outstanding shares adjusted by assuming the conversion of all the shares with potentially diluting effects.
The following table summarises the calculation. Following the merger resolution of 12 September 2013, 44,974,754 new ordinary Salini Impregilo S.p.A. shares were issued to Salini Costruttori S.p.A. to service the merger.
On 20 June 2014, the board of directors approved a capital increase with the related issue of 44,740,000 new shares. This took place on 25 June 2014 and the parent’s share capital comprises 492,172,691 ordinary shares and 1,615,491 savings shares.
In October 2014, the parent repurchased 3,104,377 own shares. No subsequent issues or repurchases have taken place.
(€’000) 1st half 20161st half 20161st half 20161st half 2016 1st half 20151st half 20151st half 20151st half 2015
Profit from continuing operations 49,667 65,394
Non-controlling interests (18,026) (7,269)
Profit earmarked for holders of savings shares 588 588
Profit from continuing operations attributable to the owners of the parentProfit from continuing operations attributable to the owners of the parentProfit from continuing operations attributable to the owners of the parentProfit from continuing operations attributable to the owners of the parent 32,232,232,232,229292929 58,7158,7158,7158,713333
Profit from continuing and discontinued operations 29,250 60,299
Non-controlling interests (18,026) (7,269)
Profit earmarked for holders of savings shares 588 588
Profit from continuing and discontinued operations attributable to the owners of the parentProfit from continuing and discontinued operations attributable to the owners of the parentProfit from continuing and discontinued operations attributable to the owners of the parentProfit from continuing and discontinued operations attributable to the owners of the parent 11,8111,8111,8111,811111 53,6153,6153,6153,617777
Average outstanding ordinary shares 489,069 489,069
Average outstanding savings shares 1,615 1,615
Average number of shares Average number of shares Average number of shares Average number of shares 490,684490,684490,684490,684 490,684490,684490,684490,684
Average number of diluted sharesAverage number of diluted sharesAverage number of diluted sharesAverage number of diluted shares 490,684490,684490,684490,684 490,684490,684490,684490,684
Basic earnings per share (from continuing operations)Basic earnings per share (from continuing operations)Basic earnings per share (from continuing operations)Basic earnings per share (from continuing operations) 0.070.070.070.07 0.120.120.120.12
Basic earnings per share (from continuing and discontinued operations)Basic earnings per share (from continuing and discontinued operations)Basic earnings per share (from continuing and discontinued operations)Basic earnings per share (from continuing and discontinued operations) 0.020.020.020.02 0.110.110.110.11
Diluted earnings per share (from continuing operations)Diluted earnings per share (from continuing operations)Diluted earnings per share (from continuing operations)Diluted earnings per share (from continuing operations) 0.070.070.070.07 0.120.120.120.12
Diluted earnings per share (from continuing and discontinued operations)Diluted earnings per share (from continuing and discontinued operations)Diluted earnings per share (from continuing and discontinued operations)Diluted earnings per share (from continuing and discontinued operations) 0.020.020.020.02 0.110.110.110.11

140
38. Events after the reporting period38. Events after the reporting period38. Events after the reporting period38. Events after the reporting period
On 1 July 2016, Salini Impregilo signed a framework agreement with the Tajikistan government worth approximately USD3.9 billion to build a hydroelectric power plant. The Group, share 100%, has also been assigned the first lot of roughly USD1.9 billion to build a 335 metre-high rockfill dam with a clay core, the tallest
in the world, on the Vakhsh River in Pamir, one of Central Asia’s main mountain ranges. The agreement between Salini Impregilo and OJSC “Rogun Hydropower Project” (the state-run company that is coordinating the project) covers the exploitation of the Pamir’s huge hydroelectric potential and includes four lots. The three remaining lots will be assigned to the Group by 30 September 2016. Once completed, the plant will have six turbines of 600 MW each with a total installed capacity of 3,600 MW
(the equivalent of three nuclear power plants).
On 11 July 2016, the parent successfully completed the placement of additional bonds with a total nominal amount of €171,736,000, reserved to institutional investors. The new bonds form part of a single series with the previous bonds of €428,264,000 issued on 24 June 2016 with a redemption date of 24 June 2021 for a total of €600 million. The new bonds will be quoted on the Irish Stock Exchange in Dublin starting from 20 July
2016.
39. Significant non39. Significant non39. Significant non39. Significant non----recurring events and transactionsrecurring events and transactionsrecurring events and transactionsrecurring events and transactions
Except for the acquisition of Lane and completion of the sale of Todini Costruzioni Generali (described earlier), the Group’s financial position, performance and cash flows were not affected by significant non-recurring
events and transactions, as defined by Consob communication no. DEM/60642931.
1 Significant non-recurring events and transactions are those that do not frequently occur in the normal course of business.

141
40. Balances or transactions arising from 40. Balances or transactions arising from 40. Balances or transactions arising from 40. Balances or transactions arising from atypical and/or unusual transactionsatypical and/or unusual transactionsatypical and/or unusual transactionsatypical and/or unusual transactions
During the period, Salini Impregilo Group did not carry out any atypical and/or unusual transactions, as defined in the above Consob communication no. DEM/60642932.
On behalf of the board of directors
Chairman
(signed on the original)
2 Atypical and/or unusual transactions are those that, due to their significance and relevance, the counterparty, the object of the transaction, exchange pricing and timing, may cast doubts as to the accuracy and completeness of disclosures, conflicts of interest, protection of the company’s assets and non-controlling interests.
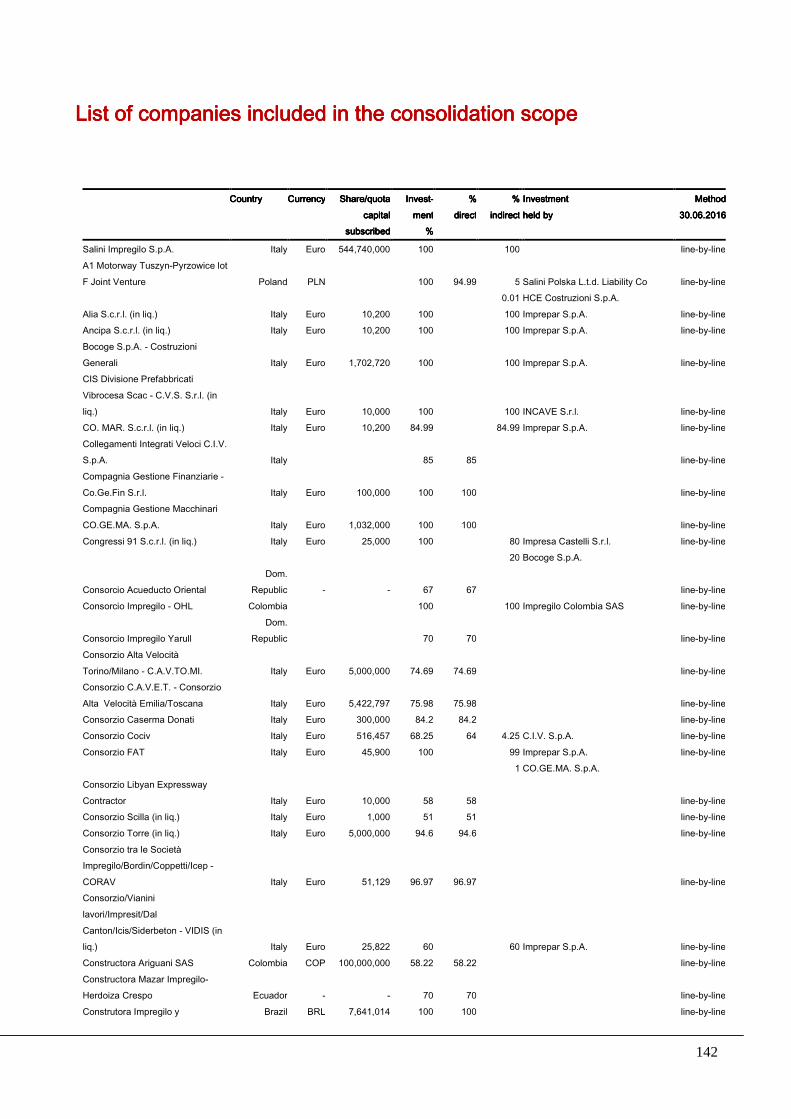
142
List of companies included in the consolidation scopeList of companies included in the consolidation scopeList of companies included in the consolidation scopeList of companies included in the consolidation scope
]x NameNameNameName CountryCountryCountryCountry CurrencyCurrencyCurrencyCurrency Share/quotaShare/quotaShare/quotaShare/quota InvestInvestInvestInvest---- %%%% %%%% InvestmentInvestmentInvestmentInvestment MethodMethodMethodMethod]x capitalcapitalcapitalcapital mentmentmentment directdirectdirectdirect indirectindirectindirectindirect held byheld byheld byheld by 30.06.201630.06.201630.06.201630.06.2016]x subscribedsubscribedsubscribedsubscribed %%%%
Salini Impregilo S.p.A. Italy Euro 544,740,000 100 100 line-by-line
A1 Motorway Tuszyn-Pyrzowice lot F Joint Venture Poland PLN 100 94.99 5 Salini Polska L.t.d. Liability Co line-by-line
0.01 HCE Costruzioni S.p.A. Alia S.c.r.l. (in liq.) Italy Euro 10,200 100 100 Imprepar S.p.A. line-by-line Ancipa S.c.r.l. (in liq.) Italy Euro 10,200 100 100 Imprepar S.p.A. line-by-line
Bocoge S.p.A. - Costruzioni Generali Italy Euro 1,702,720 100 100 Imprepar S.p.A. line-by-line
CIS Divisione Prefabbricati Vibrocesa Scac - C.V.S. S.r.l. (in liq.) Italy Euro 10,000 100 100 INCAVE S.r.l. line-by-line
CO. MAR. S.c.r.l. (in liq.) Italy Euro 10,200 84.99 84.99 Imprepar S.p.A. line-by-line
Collegamenti Integrati Veloci C.I.V. S.p.A. Italy 85 85 line-by-line
Compagnia Gestione Finanziarie - Co.Ge.Fin S.r.l. Italy Euro 100,000 100 100 line-by-line
Compagnia Gestione Macchinari CO.GE.MA. S.p.A. Italy Euro 1,032,000 100 100 line-by-line
Congressi 91 S.c.r.l. (in liq.) Italy Euro 25,000 100 80 Impresa Castelli S.r.l. line-by-line 20 Bocoge S.p.A.
Consorcio Acueducto Oriental Dom.
Republic - - 67 67 line-by-line Consorcio Impregilo - OHL Colombia 100 100 Impregilo Colombia SAS line-by-line
Consorcio Impregilo Yarull Dom.
Republic 70 70 line-by-line
Consorzio Alta Velocità Torino/Milano - C.A.V.TO.MI. Italy Euro 5,000,000 74.69 74.69 line-by-line
Consorzio C.A.V.E.T. - Consorzio Alta Velocità Emilia/Toscana Italy Euro 5,422,797 75.98 75.98 line-by-line
Consorzio Caserma Donati Italy Euro 300,000 84.2 84.2 line-by-line Consorzio Cociv Italy Euro 516,457 68.25 64 4.25 C.I.V. S.p.A. line-by-line Consorzio FAT Italy Euro 45,900 100 99 Imprepar S.p.A. line-by-line 1 CO.GE.MA. S.p.A.
Consorzio Libyan Expressway Contractor Italy Euro 10,000 58 58 line-by-line
Consorzio Scilla (in liq.) Italy Euro 1,000 51 51 line-by-line Consorzio Torre (in liq.) Italy Euro 5,000,000 94.6 94.6 line-by-line
Consorzio tra le Società Impregilo/Bordin/Coppetti/Icep - CORAV Italy Euro 51,129 96.97 96.97 line-by-line
Consorzio/Vianini lavori/Impresit/Dal Canton/Icis/Siderbeton - VIDIS (in liq.) Italy Euro 25,822 60 60 Imprepar S.p.A. line-by-line
Constructora Ariguani SAS Colombia COP 100,000,000 58.22 58.22 line-by-line
Constructora Mazar Impregilo-Herdoiza Crespo Ecuador - - 70 70 line-by-line
Construtora Impregilo y Brazil BRL 7,641,014 100 100 line-by-line
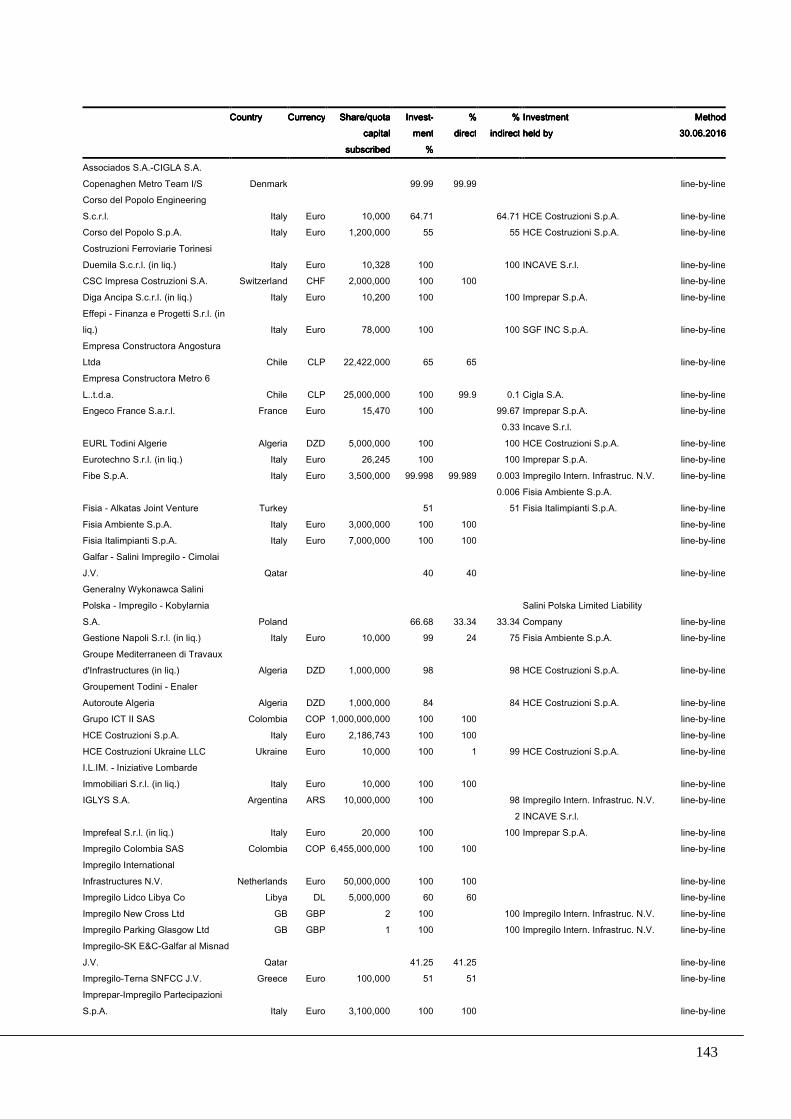
143
]x NameNameNameName CountryCountryCountryCountry CurrencyCurrencyCurrencyCurrency Share/quotaShare/quotaShare/quotaShare/quota InvestInvestInvestInvest---- %%%% %%%% InvestmentInvestmentInvestmentInvestment MethodMethodMethodMethod]x capitalcapitalcapitalcapital mentmentmentment directdirectdirectdirect indirectindirectindirectindirect held byheld byheld byheld by 30.06.201630.06.201630.06.201630.06.2016]x subscribedsubscribedsubscribedsubscribed %%%%
Associados S.A.-CIGLA S.A. Copenaghen Metro Team I/S Denmark 99.99 99.99 line-by-line
Corso del Popolo Engineering S.c.r.l. Italy Euro 10,000 64.71 64.71 HCE Costruzioni S.p.A. line-by-line
Corso del Popolo S.p.A. Italy Euro 1,200,000 55 55 HCE Costruzioni S.p.A. line-by-line
Costruzioni Ferroviarie Torinesi Duemila S.c.r.l. (in liq.) Italy Euro 10,328 100 100 INCAVE S.r.l. line-by-line
CSC Impresa Costruzioni S.A. Switzerland CHF 2,000,000 100 100 line-by-line Diga Ancipa S.c.r.l. (in liq.) Italy Euro 10,200 100 100 Imprepar S.p.A. line-by-line
Effepi - Finanza e Progetti S.r.l. (in liq.) Italy Euro 78,000 100 100 SGF INC S.p.A. line-by-line
Empresa Constructora Angostura Ltda Chile CLP 22,422,000 65 65 line-by-line
Empresa Constructora Metro 6 L..t.d.a. Chile CLP 25,000,000 100 99.9 0.1 Cigla S.A. line-by-line
Engeco France S.a.r.l. France Euro 15,470 100 99.67 Imprepar S.p.A. line-by-line 0.33 Incave S.r.l. EURL Todini Algerie Algeria DZD 5,000,000 100 100 HCE Costruzioni S.p.A. line-by-line Eurotechno S.r.l. (in liq.) Italy Euro 26,245 100 100 Imprepar S.p.A. line-by-line Fibe S.p.A. Italy Euro 3,500,000 99.998 99.989 0.003 Impregilo Intern. Infrastruc. N.V. line-by-line 0.006 Fisia Ambiente S.p.A. Fisia - Alkatas Joint Venture Turkey 51 51 Fisia Italimpianti S.p.A. line-by-line Fisia Ambiente S.p.A. Italy Euro 3,000,000 100 100 line-by-line Fisia Italimpianti S.p.A. Italy Euro 7,000,000 100 100 line-by-line
Galfar - Salini Impregilo - Cimolai J.V. Qatar 40 40 line-by-line
Generalny Wykonawca Salini Polska - Impregilo - Kobylarnia S.A. Poland 66.68 33.34 33.34
Salini Polska Limited Liability Company line-by-line
Gestione Napoli S.r.l. (in liq.) Italy Euro 10,000 99 24 75 Fisia Ambiente S.p.A. line-by-line
Groupe Mediterraneen di Travaux d'Infrastructures (in liq.) Algeria DZD 1,000,000 98 98 HCE Costruzioni S.p.A. line-by-line
Groupement Todini - Enaler Autoroute Algeria Algeria DZD 1,000,000 84 84 HCE Costruzioni S.p.A. line-by-line
Grupo ICT II SAS Colombia COP 1,000,000,000 100 100 line-by-line HCE Costruzioni S.p.A. Italy Euro 2,186,743 100 100 line-by-line HCE Costruzioni Ukraine LLC Ukraine Euro 10,000 100 1 99 HCE Costruzioni S.p.A. line-by-line
I.L.IM. - Iniziative Lombarde Immobiliari S.r.l. (in liq.) Italy Euro 10,000 100 100 line-by-line
IGLYS S.A. Argentina ARS 10,000,000 100 98 Impregilo Intern. Infrastruc. N.V. line-by-line 2 INCAVE S.r.l. Imprefeal S.r.l. (in liq.) Italy Euro 20,000 100 100 Imprepar S.p.A. line-by-line Impregilo Colombia SAS Colombia COP 6,455,000,000 100 100 line-by-line
Impregilo International Infrastructures N.V. Netherlands Euro 50,000,000 100 100 line-by-line
Impregilo Lidco Libya Co Libya DL 5,000,000 60 60 line-by-line Impregilo New Cross Ltd GB GBP 2 100 100 Impregilo Intern. Infrastruc. N.V. line-by-line Impregilo Parking Glasgow Ltd GB GBP 1 100 100 Impregilo Intern. Infrastruc. N.V. line-by-line
Impregilo-SK E&C-Galfar al Misnad J.V. Qatar 41.25 41.25 line-by-line
Impregilo-Terna SNFCC J.V. Greece Euro 100,000 51 51 line-by-line
Imprepar-Impregilo Partecipazioni S.p.A. Italy Euro 3,100,000 100 100 line-by-line

144
]x NameNameNameName CountryCountryCountryCountry CurrencyCurrencyCurrencyCurrency Share/quotaShare/quotaShare/quotaShare/quota InvestInvestInvestInvest---- %%%% %%%% InvestmentInvestmentInvestmentInvestment MethodMethodMethodMethod]x capitalcapitalcapitalcapital mentmentmentment directdirectdirectdirect indirectindirectindirectindirect held byheld byheld byheld by 30.06.201630.06.201630.06.201630.06.2016]x subscribedsubscribedsubscribedsubscribed %%%%
Impresa Castelli S.r.l. (in liq.) Italy Euro 10,000 100 100 Imprepar S.p.A. line-by-line Impresit del Pacifico S.A. Peru PEN 35,000 100 100 Imprepar S.p.A. line-by-line INC - Algerie S.a.r.l. Algeria DZD 301,172,000 99.98 99.98 SGF INC S.p.A. line-by-line INCAVE S.r.l. (in liq.) Italy Euro 90,000 100 100 Imprepar S.p.A. line-by-line IS Joint Ventures Australia 100 50 50 Salini Australia PTY L.t.d. line-by-line
Joint Venture Impregilo S.p.A. - S.G.F. INC S.p.A. Greece - - 100 99 1 SGF INC S.p.A. line-by-line
Lane Abrams Joint Venture USA 51 81 Lane Construction Corporation line-by-line Lane Construction Corporation USA USD 991,600 100 100 Lane Industries Incorporated line-by-line Lane Corman Joint Venture USA 60 60 Lane Construction Corporation line-by-line
Lane DS - NC Consortium United Arab
Emirates 24.5 24.5 Lane Mideast Contracting LLC line-by-line Lane Industries Incorporated USA USD 1 100 100 Salini Impregilo - US Holdings Inc. line-by-line Lane Infrastructure Inc. USA USD 10 100 100 Lane Industries Incorporated line-by-line Lane International B.V. USA USD 18,000 100 100 Lane Worldwide line-by-line
Lane Mideast Contracting LLC United Arab
Emirates AED 300,000 49 49 Lane International B.V. line-by-line Lane Mideast Qatar LLC Qatar QAR 5,000,000 49 49 Lane International B.V. line-by-line
Lane National Contracting Joint Venures
United Arab Emirates 24.99 24.99 Lane Mideast Contracting LLC line-by-line
Lane Solid - Tadmur Joint Venture Qatar 24.5 24.5 Lane Mideast Qatar LLC line-by-line Lane Worldwide Infrastructure Inc.. USA USD 10 100 100 Lane Industries Incorporated line-by-line Lanecon Corporation USA 100 100 Lane Construction Corporation line-by-line Librino S.c.r.l. (in liq.) Italy Euro 45,900 66 66 Imprepar S.p.A. line-by-line Melito S.c.r.l. (in liq.) Italy Euro 77,400 66.67 66.67 Imprepar S.p.A. line-by-line Mercovia S.A. Argentina ARS 10,000,000 60 60 Impregilo Intern. Infrastruc. N.V. line-by-line Metro B S.r.l. Italy Euro 20,000,000 52.52 52.52 line-by-line Metro B1 S.c.a.r.l. Italy Euro 100,000 80.7 80.7 line-by-line Perugia 219 S.c.r.l. Italy Euro 10,000 55 55 Imprepar S.p.A. line-by-line PGH Ltd Nigeria NGN 52,000,000 100 100 line-by-line Pietrarossa S.c.r.l. (in liq.) Italy Euro 10,200 100 100 Imprepar S.p.A. line-by-line Piscine dello Stadio S.r.l. Italy Euro 1,100,000 70 70 HCE Costruzioni S.p.A. line-by-line Piscine S.c.r.l. Italy Euro 10,000 70 70 HCE Costruzioni S.p.A. line-by-line Reggio Calabria - Scilla S.c.p.a. Italy Euro 35,000,000 51 51 line-by-line RI.MA.TI. S.c.a.r.l. Italy Euro 100,000 83.42 83.42 line-by-line Rivigo J.V. (Nigeria) Ltd Nigeria NGN 100,000,000 70 70 PGH Ltd line-by-line S. Leonardo Due S.c.r.l. (in liq.) Italy Euro 40,800 60 60 Imprepar S.p.A. line-by-line S. Leonardo S.c.r.l. (in liq.) Italy Euro 25,500 99.99 99.99 Imprepar S.p.A. line-by-line S.A. Healy Company USA USD 11,320,863 100 100 Lane Construction Corporation line-by-line S.G.F. - I.N.C. S.p.A. Italy Euro 3,859,680 100 100 line-by-line SA.CO.LAV. S.c.r.l. (in liq.) Italy Euro 10,200 100 100 line-by-line SA.MA. S.c.a.r.l. (in liq.) Italy Euro 40,800 99 99 line-by-line Salerno-Reggio Calabria S.c.p.a. Italy Euro 50,000,000 51 51 line-by-line
Salini - Impregilo Joint Venture for Mukorsi Zimbabwe - 100 99.9 0.1 Imprepar S.p.A. line-by-line
Salini Rus L.t.d. Liability Company. Russia RUB 3,000,000 99 99 line-by-line Salini Australia PTY L.t.d. Australia 100 100 line-by-line Salini Bulgaria A.D. Bulgaria BGN 100 100 line-by-line Salini Hydro L.t.d. Ireland Euro 20,000 100 100 line-by-line
Salini Impregilo - Duha Joint Venture Slovakia 75 75 line-by-line
Salini Impregilo - Healy J.V. (Cleveland) USA 100 60 40 S.A. Healy Company line-by-line

145
]x NameNameNameName CountryCountryCountryCountry CurrencyCurrencyCurrencyCurrency Share/quotaShare/quotaShare/quotaShare/quota InvestInvestInvestInvest---- %%%% %%%% InvestmentInvestmentInvestmentInvestment MethodMethodMethodMethod]x capitalcapitalcapitalcapital mentmentmentment directdirectdirectdirect indirectindirectindirectindirect held byheld byheld byheld by 30.06.201630.06.201630.06.201630.06.2016]x subscribedsubscribedsubscribedsubscribed %%%%
Salini Impregilo - NRW Joint Venture Australia 80 80 line-by-line
Salini Impregilo - Salini Insaat - NTF J.V. Turkey 85 55 30 Salini Insaat T.S.V.T.A.S. line-by-line
Salini Impregilo - US Holdings Inc. USA USD 1,000 100 100 line-by-line
Salini Impregilo S.p.A. - S.A. Healy Company Jose J Chediack S.A. UTE Argentina ARS 10,000 75 73 2 S.A. Healy Company line-by-line
Salini India Private L.t.d. India INR 93,500,000 100 95 5 CO.GE.MA. S.p.A. line-by-line
Salini Insaat Taahhut Sanayi Ve Ticaret Anonim Sirketi Turkey TRY 50,000 100 100 line-by-line
Salini Malaysia SDN BHD Malaysia MYR 1,100,000 100 90 10 CO.GE.MA. S.p.A. line-by-line Salini Namibia Proprietary L.t.d. Namibia NAD 100 100 100 line-by-line Salini Nigeria L.t.d. Nigeria NGN 10,000,000 100 99 1 CO.GE.MA. S.p.A. line-by-line
Salini Polska - Todini - Salini Impregilo - S7 JV Poland PLN 100 74.99 25 Salini Polska L.t.d. Liability Co line-by-line
0.01 HCE Costruzioni S.p.A.
Salini Polska - Todini - Salini Impregilo - Pribex - S3 JV Poland PLN 95 71.24 23.75 Salini Polska L.t.d. Liability Co. line-by-line
0.01 HCE Costruzioni S.p.A
Salini Polska - Todini - Salini Impregilo - Pribex - S8 JV Poland PLN 95 71.24 23.75 Salini Polska L.t.d. Liability Co line-by-line
0.01 HCE Costruzioni S.p.A. Salini Polska L.t.d. Liability Co Poland PLN 393,000 100 100 line-by-line Salini Saudi Arabia Company L.t.d. Saudi Arabia 51 51 line-by-line Salini-Kolin-GCF Joint Venture Turkey Euro 4,000 38 38 line-by-line
San Martino Prefabbricati S.p.A. (in liq.) Italy Euro 10,000 100 100 Impresa Castelli S.r.l. line-by-line
Savico S.c.r.l. (in liq.) Italy Euro 10,200 100 81 Imprepar S.p.A. line-by-line 19 Sapin S.r.l. Seli Tunneling Denmark A.p.s. Denmark DKK 130,000 100 100 Impregilo Intern. Infrastruc. N.V. line-by-line
Società Autostrada Broni - Mortara S.p.A. Italy Euro 28,902,600 60 60 line-by-line
Società Industriale Prefabbricazione Edilizia del Mediterraneo - S.I.P.E.M. S.p.A. (in liq.) Italy Euro 10,000 100 100 line-by-line
Sti Abwicklungs Gmbh Germany Euro 25,000 100 100 Impregilo Intern. Infrastruc. N.V. line-by-line
Suramericana de Obras Publicas C.A.- Suropca C.A. Venezuela VEB 2,874,118,000 100 99 1 CSC S.A. line-by-line
Sviluppo Applicazioni Industriali - SAPIN S.r.l. (in liq.) Italy Euro 51,480 100 100 Imprepar S.p.A. line-by-line
TB Metro S.r.l. (in liq.) Italy Euro 100,000 51 51 line-by-line Todini - Hamila Tunisia 100 100 HCE Costruzioni S.p.A. line-by-line Todini Akkord Salini Ukraine 100 25 75 HCE Costruzioni S.p.A. line-by-line
Trincerone Ferroviario S.c.r.l. (in liq.) Italy Euro 45,900 60 60 Imprepar S.p.A. line-by-line
Vegas Tunnel Constructors USA 100 40 60 S.A. Healy Company line-by-line Vittoria S.c.r.l. (in liq.) Italy Euro 20,400 58 58 Imprepar S.p.A. line-by-line Western Station J.V, Saudi Arabia 51 51 line-by-line Arge Tulfes Pfons Austria Euro 1,000 49 49 joint oper. Arriyad New Mobility Consortium Saudi Arabia 33.48 33.48 joint oper. Civil Works Joint Ventures Saudi Arabia 66 66 joint oper.

146
]x NameNameNameName CountryCountryCountryCountry CurrencyCurrencyCurrencyCurrency Share/quotaShare/quotaShare/quotaShare/quota InvestInvestInvestInvest---- %%%% %%%% InvestmentInvestmentInvestmentInvestment MethodMethodMethodMethod]x capitalcapitalcapitalcapital mentmentmentment directdirectdirectdirect indirectindirectindirectindirect held byheld byheld byheld by 30.06.201630.06.201630.06.201630.06.2016]x subscribedsubscribedsubscribedsubscribed %%%%
CMC - Mavundla - Impregilo J.V. South Africa 39.2 39.2 joint oper.
Consorcio Contuy Medio Grupo A C.I. S.p.A. Ghella Sogene C.A., Otaola C.A. Venezuela - - 36.4 36.4 joint oper.
Consorzio Constructor M2 Lima Peru 25.5 25.5 joint oper. Ghazi-Barotha Contractors J.V. Switzerland - - 57.8 57.8 joint oper. Impregilo-Healy-Parsons J.V. USA USD 65 45 20 S.A. Healy Company joint oper.
Kayi Salini Samsung Joint Venture Turkey Euro 33 33 Salini Insaat Taahhut Sanayi Ve Ticaret Anonim Sirketi joint oper.
Nathpa Jhakri J.V. India USD 1,000,000 60 60 joint oper. Riyadh Metro Line 3 Saudi Arabia SAD 10,000,000 66 66 joint oper.
Tristar Salini Joint Venture United Arab
Emirates 40 40 joint oper. Aegek-Impregilo-Aslom J.V. Greece 45.8 45.8 equity
Aguas del Gran Buenos Aires S.A. (in liq.) Argentina ARS 45,000,000 42.58 16.5 23.72 Impregilo Intern. Infrastruc. N.V. equity
2.36 Iglys. S.A. Aguas del Oeste S.A. Argentina ARS 170,000 33.33 33.33 Iglys S.A. equity ANBAFER S.c.r.l. (in liq.) Italy Euro 25,500 50 50 Imprepar S.p.A. equity Arge Haupttunnel Eyholz Switzerland 36 36 CSC S.A. equity Arge Sisto N8 Switzerland 50 50 CSC S.A. equity Autopistas del Sol S.A. Argentina ARS 175,396,394 19.82 19.82 Impregilo Intern. Infrastruc. N.V. equity Barnard Impregilo Healy J.V. USA 45 25 20 S.A. Healy Company equity C.P.R.2 Italy Euro 2,066 35.97 35.97 Imprepar S.p.A. equity C.P.R.3 Italy Euro 2,066 35.97 35.97 Imprepar S.p.A. equity
C.U.S. Consorzio Umbria Sanità (in liq.) Italy Euro 10,000 31 31 Imprepar S.p.A. equity
Cagliari 89 S.c.r.l. (in liq.) Italy Euro 10,200 49 49 Sapin S.r.l. equity CE.S.I.F. S.c.p.a. (in liq.) Italy Euro 250,000 24.18 24.18 equity CGR Consorzio Galliera Roveredo Switzerland 37.5 37.5 CSC S.A. equity Churchill Construction Consortium GB 30 30 Impregilo New Cross Ltd equity Churchill Hospital J.V. GB 50 50 Impregilo New Cross Ltd equity
CMC - Consorzio Monte Ceneri lotto 851 Switzerland 40 40 CSC S.A. equity
Coincar S.A. Argentina ARS 40,465,122 35 26.25 8.75 Iglys S.A. equity Con. Sal S.c.n.c. (in liq.) Italy Euro 15,494 30 30 equity Consorcio Agua Azul S.A. Peru PEN 69,001,000 25.5 25.5 Impregilo Intern. Infrastruc. N.V. equity Consorcio Carvalho Pinto Brazil 40 20 20 Cigla S.A. equity Consorcio Cigla-Sade Brazil - - 50 50 Cigla S.A. equity Consorcio Contuy Medio Venezuela - - 29.04 29.04 equity
Consorcio Federici/Impresit/Ice Cochabamba Bolivia USD 100,000 25 25 Imprepar S.p.A. equity
Consorcio Grupo Contuy-Proyectos y Obras de Ferrocarriles Venezuela - - 33.33 33.33 equity
Consorcio Normetro Portugal 13.18 13.18 equity Consorcio OIV-TOCOMA Venezuela 40 40 equity Consorcio Serra do Mar Brazil 40 20 20 Cigla S.A. equity Consorcio V.I.T. - Tocoma Venezuela - - 35 35 equity Consorcio V.I.T. Caroni - Tocoma Venezuela 35 35 equity Consorcio V.S.T. Venezuela - - 35 35 Suropca C.A. equity Consorcio V.S.T. Tocoma Venezuela - - 30 30 equity Consorzio 201 Quintai Switzerland 60 60 CSC S.A. equity Consorzio 202 Quintai Switzerland 30 30 CSC S.A. equity
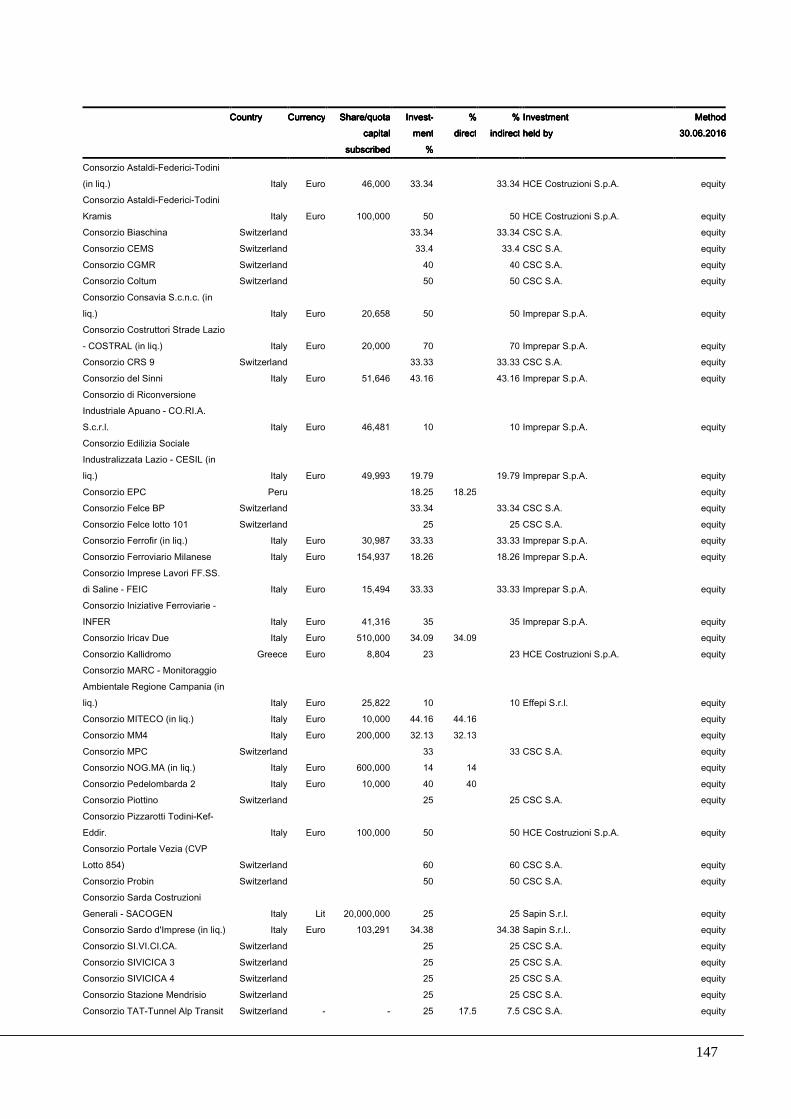
147
]x NameNameNameName CountryCountryCountryCountry CurrencyCurrencyCurrencyCurrency Share/quotaShare/quotaShare/quotaShare/quota InvestInvestInvestInvest---- %%%% %%%% InvestmentInvestmentInvestmentInvestment MethodMethodMethodMethod]x capitalcapitalcapitalcapital mentmentmentment directdirectdirectdirect indirectindirectindirectindirect held byheld byheld byheld by 30.06.201630.06.201630.06.201630.06.2016]x subscribedsubscribedsubscribedsubscribed %%%%
Consorzio Astaldi-Federici-Todini (in liq.) Italy Euro 46,000 33.34 33.34 HCE Costruzioni S.p.A. equity
Consorzio Astaldi-Federici-Todini Kramis Italy Euro 100,000 50 50 HCE Costruzioni S.p.A. equity
Consorzio Biaschina Switzerland 33.34 33.34 CSC S.A. equity Consorzio CEMS Switzerland 33.4 33.4 CSC S.A. equity Consorzio CGMR Switzerland 40 40 CSC S.A. equity Consorzio Coltum Switzerland 50 50 CSC S.A. equity
Consorzio Consavia S.c.n.c. (in liq.) Italy Euro 20,658 50 50 Imprepar S.p.A. equity
Consorzio Costruttori Strade Lazio - COSTRAL (in liq.) Italy Euro 20,000 70 70 Imprepar S.p.A. equity
Consorzio CRS 9 Switzerland 33.33 33.33 CSC S.A. equity Consorzio del Sinni Italy Euro 51,646 43.16 43.16 Imprepar S.p.A. equity
Consorzio di Riconversione Industriale Apuano - CO.RI.A. S.c.r.l. Italy Euro 46,481 10 10 Imprepar S.p.A. equity
Consorzio Edilizia Sociale Industralizzata Lazio - CESIL (in liq.) Italy Euro 49,993 19.79 19.79 Imprepar S.p.A. equity
Consorzio EPC Peru 18.25 18.25 equity Consorzio Felce BP Switzerland 33.34 33.34 CSC S.A. equity Consorzio Felce lotto 101 Switzerland 25 25 CSC S.A. equity Consorzio Ferrofir (in liq.) Italy Euro 30,987 33.33 33.33 Imprepar S.p.A. equity Consorzio Ferroviario Milanese Italy Euro 154,937 18.26 18.26 Imprepar S.p.A. equity
Consorzio Imprese Lavori FF.SS. di Saline - FEIC Italy Euro 15,494 33.33 33.33 Imprepar S.p.A. equity
Consorzio Iniziative Ferroviarie - INFER Italy Euro 41,316 35 35 Imprepar S.p.A. equity
Consorzio Iricav Due Italy Euro 510,000 34.09 34.09 equity Consorzio Kallidromo Greece Euro 8,804 23 23 HCE Costruzioni S.p.A. equity
Consorzio MARC - Monitoraggio Ambientale Regione Campania (in liq.) Italy Euro 25,822 10 10 Effepi S.r.l. equity
Consorzio MITECO (in liq.) Italy Euro 10,000 44.16 44.16 equity Consorzio MM4 Italy Euro 200,000 32.13 32.13 equity Consorzio MPC Switzerland 33 33 CSC S.A. equity Consorzio NOG.MA (in liq.) Italy Euro 600,000 14 14 equity Consorzio Pedelombarda 2 Italy Euro 10,000 40 40 equity Consorzio Piottino Switzerland 25 25 CSC S.A. equity
Consorzio Pizzarotti Todini-Kef-Eddir. Italy Euro 100,000 50 50 HCE Costruzioni S.p.A. equity
Consorzio Portale Vezia (CVP Lotto 854) Switzerland 60 60 CSC S.A. equity
Consorzio Probin Switzerland 50 50 CSC S.A. equity
Consorzio Sarda Costruzioni Generali - SACOGEN Italy Lit 20,000,000 25 25 Sapin S.r.l. equity
Consorzio Sardo d'Imprese (in liq.) Italy Euro 103,291 34.38 34.38 Sapin S.r.l.. equity Consorzio SI.VI.CI.CA. Switzerland 25 25 CSC S.A. equity Consorzio SIVICICA 3 Switzerland 25 25 CSC S.A. equity Consorzio SIVICICA 4 Switzerland 25 25 CSC S.A. equity Consorzio Stazione Mendrisio Switzerland 25 25 CSC S.A. equity Consorzio TAT-Tunnel Alp Transit Switzerland - - 25 17.5 7.5 CSC S.A. equity

148
]x NameNameNameName CountryCountryCountryCountry CurrencyCurrencyCurrencyCurrency Share/quotaShare/quotaShare/quotaShare/quota InvestInvestInvestInvest---- %%%% %%%% InvestmentInvestmentInvestmentInvestment MethodMethodMethodMethod]x capitalcapitalcapitalcapital mentmentmentment directdirectdirectdirect indirectindirectindirectindirect held byheld byheld byheld by 30.06.201630.06.201630.06.201630.06.2016]x subscribedsubscribedsubscribedsubscribed %%%%
Ticino, Arge
Consorzio Trevi - S.G.F. INC per Napoli Italy Euro 10,000 45 45 SGF INC S.p.A. equity
Constuctora Embalse Casa de Piedra S.A. (in liq.) Argentina ARS 821 72.93 72.93 Imprepar S.p.A. equity
Depurazione Palermo S.c.r.l. (in liq.) Italy Euro 10,200 50 50 Imprepar S.p.A. equity
E.R. Impregilo/Dumez y Asociados para Yaciretê - ERIDAY Argentina USD 539,400 20.75 18.75 2 Iglys S.A. equity
EDIL.CRO S.c.r.l. (in liq.) Italy Euro 10,200 16.65 16.65 Bocoge S.p.A. equity Edil.Gi. S.c.r.l. (in liq.) Italy Lit 20,000,000 50 50 Imprepar S.p.A. equity
Empresa Constructora Lo Saldes L..t.d.a. Chile CLP 10,000,000 35 35 equity
Enecor S.A. Argentina ARS 8,000,000 30 30 Impregilo Intern. Infrastruc. N.V. equity Eurolink S.c.p.a. Italy Euro 150,000,000 45 45 equity
Executive J.V. Impregilo S.p.A. Terna S.A. - Alte S.A. (in liq.) Greece - - 33.33 33.33 equity
FE.LO.VI. S.c.n.c. (in liq.) Italy Euro 25,822 32.5 32.5 Imprepar S.p.A. equity Forum S.c.r.l. (in liq.) Italy Euro 51,000 20 20 equity Galileo S.c.r.l. (in liq.) Italy Euro 10,000 40 40 Imprepar S.p.A. equity
Gaziantep Hastane Sanglik Hizmetleri Isletme Yatrim Joint Stock Company Turkey TRY 45,000,000 35.5 35.5 equity
Gaziantep Hastanesi Isletme Ve Bakim Hizmetleri Turkey 50 50 equity
Grupo Empresas Italianas - GEI Venezuela VEB 10,000,000 33.33 33.33 equity Grupo Unidos Por El Canal S.A. Panama USD 1,000,000 48 48 equity Healy-Yonkers-Atlas-Gest J.V. USA - - 45 45 S.A. Healy Company equity Impregilo - Rizzani de Eccher J.V. Switzerland 67 67 equity Impregilo Arabia Ltd Saudi Arabia SAD 40,000,000 50 50 equity Impregilo Wolverhampton Ltd GB GBP 1,000 20 20 Impregilo Intern. Infrastruc. N.V. equity
Imprese Riunite Genova Irg S.c.r.l. (in liq.) Italy Euro 25,500 26.3 26.3 Imprepar S.p.A. equity
Imprese Riunite Genova Seconda S.c.r.l. (in liq.) Italy Euro 25,000 26.3 26.3 Imprepar S.p.A. equity
Impresit Bakolori Plc Nigeria NGN 100,800,000 50.71 50.71 equity Interstate Healy Equipment J.V. USA 45 45 S.A. Healy Company equity IRINA S.r.l. (in liq.) Italy Euro 103,000 36 36 Imprepar S.p.A. equity Isarco S.c.r.l. Italy Euro 10,000 41 41 equity Isibari S.c.r.l. Italy Euro 15,300 55 55 Bocoge S.p.A. equity
Joint Venture Aegek-Impregilo-Ansaldo-Seli-Ansaldobreda Greece 26.71 26.71 equity
Joint Venture Aktor Ate - Impregilo S.p.A. (Constantinos) Greece - - 40 40 equity
Joint Venture Impregilo S.p.A. - Empedos S.A. - Aktor A.T.E. Greece - - 66 66 equity
Joint Venture Terna - Impregilo Greece - - 45 45 equity JV Salini - Secol Romania 80 80 equity Kallidromo Joint Venture Greece Euro 29,347 23 20.7 HCE Costruzioni S.p.A. equity 2.3 Consorzio Kallidromo La Quado S.c.a.r.l. Italy Euro 10,000 35 35 equity Line 3 Metro Stations Greece 50 50 equity Metro Blu S.c.r.l. Italy Euro 10,000 50 50 equity

149
]x NameNameNameName CountryCountryCountryCountry CurrencyCurrencyCurrencyCurrency Share/quotaShare/quotaShare/quotaShare/quota InvestInvestInvestInvest---- %%%% %%%% InvestmentInvestmentInvestmentInvestment MethodMethodMethodMethod]x capitalcapitalcapitalcapital mentmentmentment directdirectdirectdirect indirectindirectindirectindirect held byheld byheld byheld by 30.06.201630.06.201630.06.201630.06.2016]x subscribedsubscribedsubscribedsubscribed %%%%
Metro de Lima Linea 2 S.A. Peru PEN 368,808,060 18.25 18.25 equity Metrogenova S.c.r.l. Italy Euro 25,500 35.63 35.63 equity Ochre Solutions Holdings Ltd GB GBP 20,000 40 40 Impregilo Intern. Infrastruc. N.V. equity Olbia 90 S.c.r.l. (in liq.) Italy Euro 10,200 24.5 24.5 Sapin S.r.l. equity Pantano S.c.r.l. (in liq.) Italy Euro 40,800 10.5 10.5 equity Passante di Mestre S.c.p.A. Italy Euro 10,000,000 42 42 equity Passante Dorico S.p.A. Italy Euro 24,000,000 47 47 equity Pedelombarda S.c.p.a. Italy Euro 80,000,000 47 47 equity
Pedemontana Veneta S.p.A. (in liq.) Italy Euro 6,000,000 20.23 20.23 equity
Puentes del Litoral S.A. (in liq.) Argentina ARS 43,650,000 26 22 4 Iglys S.A. equity
RCCF Nodo di Torino S.c.p.a. (in liq.) Italy Euro 102,000 26 26 INCAVE S.r.l. equity
Risalto S.r.l. (in liq.) Italy Euro 89,000 100 66.67 33.33 Imprepar S.p.A. equity Riviera S.c.r.l. Italy Euro 50,000 12.94 12.94 equity S. Anna Palermo S.c.r.l. (in liq.) Italy Euro 40,800 71.6 71.6 equity S. Ruffillo S.c.r.l. Italy Euro 60,000 35 35 equity Saces S.r.l. (in liq.) Italy Euro 26,000 37 37 Imprepar S.p.A. equity Salini Acciona Joint Venture Ethiopia Euro 20,000 50 50 equity Salini Strabag Joint Ventures Guinea Euro 10,000 50 50 equity Salini USA Inc USA USD 20,000 100 100 equity San Benedetto S.c.r.l. (in liq.) Italy Euro 25,823 57 57 Imprepar S.p.A. equity
San Giorgio Caltagirone S.c.r.l. (in liq.) Italy Euro 25,500 33 33 Imprepar S.p.A. equity
SCAT 5 S.c.r.l. (in liq.) Italy Euro 25,500 25 25 Imprepar S.p.A. equity Sclafani S.c.r.l. (in liq.) Italy Euro 10,400 41 41 Imprepar S.p.A. equity SEDI S.c.r.l. Italy Euro 10,000 34 34 HCE Costruzioni S.p.A. equity SFI Leasing Company USA 30 30 equity
Shimmick CO. INC. - FCC CO S.A. - Impregilo S.p.A -J.V. USA 30 30 equity
SI.VI.CI.CA. 2 Switzerland 25 25 CSC S.A. equity Sibar Arge Switzerland - - 60 60 CSC S.A. equity Sirjo S.c.p.A. Italy Euro 30,000,000 40 40 equity Sistranyac S.A. Argentina ARS 3,000,000 20.1 20.1 Impregilo Intern. Infrastruc. N.V. equity
Società di Progetto Consortile per Azioni M4 Italy Euro 360,000 29 29 equity
Soingit S.c.r.l. (in liq.) Italy Lit 80,000,000 29.49 29.49 Imprepar S.p.A. equity SPV Linea M4 S.p.A. Italy Euro 26,700,000 9.63 9.63 equity Stazione Tribunale S.c.r.l. Italy Euro 20,000 43 43 equity
Strade e Depuratori Palermo S.c.r.l. (in liq.) Italy Euro 10,200 16 16 Imprepar S.p.A. equity
Techint S.A.C.I.- Hochtief A.G.- Impregilo S.p.A.-Iglys S.A. UTE Argentina - - 35 26.25 8.75 Iglys S.A. equity
Thessaloniki Metro CW J.V. Greece 42.5 42.5 equity TM-Salini Consortium Malaysia - - 90 90 equity Todedil S.c.r.l. (in liq.) Italy Euro 10,200 85 85 Imprepar S.p.A. equity Trasimeno S.c.r.l. (in liq.) Italy Euro 10,000 30 30 Imprepar S.p.A. equity Variante di Valico S.c.r.l. (in liq.) Italy Euro 90,000 100 66.67 33.33 Imprepar S.p.A. equity VE.CO. S.c.r.l. Italy Euro 10,200 25 25 equity Yacylec S.A. Argentina ARS 20,000,000 18.67 18.67 Impregilo Intern. Infrastruc. N.V. equity Yuma Concessionaria S.A. Colombia COP26,000,100,000 48.33 40 8.33 Impregilo Intern. Infrastruc. N.V. equity

150
Entered the consolidation scope in the first six months of 2016Entered the consolidation scope in the first six months of 2016Entered the consolidation scope in the first six months of 2016Entered the consolidation scope in the first six months of 2016
]x NameNameNameName CountryCountryCountryCountryCurrencyCurrencyCurrencyCurrency Share/quotaShare/quotaShare/quotaShare/quota InvestInvestInvestInvest---- %%%% %%%% InvestmentInvestmentInvestmentInvestment MethodMethodMethodMethod]x capitalcapitalcapitalcapital mentmentmentment directdirectdirectdirect indirectindirectindirectindirect held byheld byheld byheld by ]x subscribedsubscribedsubscribedsubscribed %%%%
LineLineLineLine----bybybyby----line line line line –––– firstfirstfirstfirst----time (Salini Impregilotime (Salini Impregilotime (Salini Impregilotime (Salini Impregilo GroupGroupGroupGroup)))) Fisia - Alkatas Joint Venture Turkey 51 51 Fisia Italimpianti S.p.A. line-by-line HCE Costruzioni S.p.A. Italy Euro 2,186,743 100 100 . line-by-line Lane Industries Incorporated (*) USA USD 1 100 100 US Holdings Inc line-by-line
Salini Impregilo - NRW Joint Venture Australia 80 80 line-by-line
Salini Impregilo - US Holdings Inc. USA USD 1,000 100 100 line-by-line Salini Impregilo US Holdings Inc USA USD 1,000100 100 line-by-line Salini Saudi Arabia Company L.t.d. Saudi Arabia 51 51 line-by-line
LineLineLineLine----bybybyby----line line line line –––– firstfirstfirstfirst----time (HCE time (HCE time (HCE time (HCE GroupGroupGroupGroup)))) HCE Costruzioni Ukraine LLC Ukraine Euro 10,000 100 1 99 HCE Costruzioni S.p.A. line-by-line
LineLineLineLine----bybybyby----line line line line –––– consolidation percentage changed (Salini Impregilo Group)consolidation percentage changed (Salini Impregilo Group)consolidation percentage changed (Salini Impregilo Group)consolidation percentage changed (Salini Impregilo Group) Consorcio Impregilo - OHL Colombia 100 100 Impregilo Colombia SAS line-by-line
Salini Impregilo S.p.A. - S.A. Healy Company Jose J Chediack S.A. UTE Argentina ARS 10,000 75 73 2 S.A. Healy Company line-by-line
LineLineLineLine----bybybyby----line line line line –––– consolidation percentage changed (HCE consolidation percentage changed (HCE consolidation percentage changed (HCE consolidation percentage changed (HCE GroupGroupGroupGroup))))
Groupe Mediterraneen di Travaux d'Infrastructures (in liq.) Algeria DZD 1,000,000 98 98 HCE Costruzioni S.p.A. line-by-line
Excluded from the consolidation scope in the first six months of 2016Excluded from the consolidation scope in the first six months of 2016Excluded from the consolidation scope in the first six months of 2016Excluded from the consolidation scope in the first six months of 2016
CountryCountryCountryCountry CurrencyCurrencyCurrencyCurrency Share/quotaShare/quotaShare/quotaShare/quota InvestInvestInvestInvest---- %%%% %%%% InvestmentInvestmentInvestmentInvestment MethodMethodMethodMethod capitalcapitalcapitalcapital mentmentmentment directdirectdirectdirect indirectindirectindirectindirect held byheld byheld byheld by subscribedsubscribedsubscribedsubscribed %%%%
LineLineLineLine----bybybyby----line line line line –––– excluded (Salini Impregiloexcluded (Salini Impregiloexcluded (Salini Impregiloexcluded (Salini Impregilo GroupGroupGroupGroup)))) CCTE Italy Euro 100 60 40 ILIM S.r.l. line-by-line Montenero S.c.r.l. (in liq.) Italy Euro 10,400 61.11 61.11 Imprepar S.p.A. line-by-line Salini USA Inc USA USD 20,000 100 100 line-by-line Todini Costruzioni Generali S.p.A. Italy Euro 56,907,000 100 100 line-by-line
LineLineLineLine----bybybyby----line excluded (HCE line excluded (HCE line excluded (HCE line excluded (HCE GroupGroupGroupGroup)))) Todini - Takenaka Joint Venture Azerbaijan 60 60 HCE Costruzioni S.p.A. line-by-line Todini Central Asia Kazakhstan 100 100 HCE Costruzioni S.p.A. line-by-line
(*) It includes (i) the subsidiaries: Lane Construction Corporation, Lane Abrams Joint Venture, Lane Corman Joint Venture, Lane DS-NC Consortium, Lane Infrastructure Inc., Lane International BV, Lane Midwest BV, Lane Mideast Contracting LLC, Lane Mideast Qatar LLC, Lane National Contracting Joint Ventures, Lane Solid-Tadmur Joint Venture, Lane Worldwide Infrastructure Inc., Lanecon Corporation and; (ii) the joint ventures measured according to the equity method: AGL Constructor JV, Skanka Granite JV, SGL i4 Leasing, Fluor Lane, Fluor Lane 95, Flat Iron, GLLP Gemma Liberty, GLLP Gemma Patriot, Purple Line.

151
Statement on the condensed interim Statement on the condensed interim Statement on the condensed interim Statement on the condensed interim consolidatedconsolidatedconsolidatedconsolidated financial financial financial financial
statementsstatementsstatementsstatements
pursuant to article 81-ter of Consob regulation no. 11971 of 14 May 1999 and subsequent amendments and integrations 1.1.1.1. Pietro Salini, as chief executive officer, and Massimo Ferrari, as manager in charge of financial
reporting, of Salini Impregilo S.p.A., considering the provisions of article 154-bis.3/4 of Legislative decree no. 58 of 24 February 1998: - that the administrative and accounting procedures are adequate given the Group’s
characteristics; and - that they were actually applied during the first half of 2016 to prepare the condensed interim
consolidated financial statements. 2.2.2.2. No significant issues arose. 3.3.3.3. Moreover, they state that:
3.13.13.13.1 the condensed interim consolidated financial statements:
a) have been prepared in accordance with the applicable International Financial Reporting Standards endorsed by the European Union pursuant to EC Regulation 1606/2002 of the European Parliament and Council of 19 July 2002;
b) are consistent with the accounting records and entries; c) are suitable to give a true and fair view of the financial position at 30 June 2016 and the
results of operations and cash flows for the six months then ended of the Issuer and its consolidated companies;
3.23.23.23.2 the directors’ report includes a reliable analysis of the key events that took place during the period and their impact on the condensed interim consolidated financial statements, together with information about the main risks and uncertainties to which the Group is exposed for the second half of the year. It also sets out a reliable analysis of relevant related party transactions.
Milan, 27 July 2016
Chief executive officer Manager in charge of financial reporting
Pietro Salini
(signed on the original) Massimo Ferrari
(signed on the original)
152
Independent Auditor’s ReportIndependent Auditor’s ReportIndependent Auditor’s ReportIndependent Auditor’s Report

153
154