Transitional Jobs for Ex-Prisoners - mdrc.org · Transitional Jobs for Ex-Prisoners Early Impacts...
50
An MDRC Working Paper Transitional Jobs for Ex-Prisoners Early Impacts from a Random Assignment Evaluation of the Center for Employment Opportunities (CEO) Prisoner Reentry Program Dan Bloom Cindy Redcross Janine Zweig (Urban Institute) Gilda Azurdia November 2007
Transcript of Transitional Jobs for Ex-Prisoners - mdrc.org · Transitional Jobs for Ex-Prisoners Early Impacts...

An MDRC Working Paper
Transitional Jobs for Ex-Prisoners Early Impacts
from a Random Assignment Evaluation of the Center for Employment Opportunities (CEO)
Prisoner Reentry Program
Dan Bloom Cindy Redcross
Janine Zweig (Urban Institute) Gilda Azurdia
November 2007

MDRC is conducting the Enhanced Services for the Hard-to-Employ Demonstration and Evaluation under a contract with the Administration for Children and Families (ACF) and the Office of the As-sistant Secretary for Planning and Evaluation (ASPE) in the U.S. Department of Health and Human Services (HHS), funded by HHS under a competitive award, Contract No. HHS-233-01-0012. HHS Project Officers: Girley Wright Office of Planning, Research, and Evaluation Administration for Children and Families Department of Health and Human Services 370 L’Enfant Promenade, SW, 7th Floor, Washington, DC 20447 Peggy Halpern and Nicole Gardner-Neblett Office of the Assistant Secretary for Planning and Evaluation Department of Health and Human Services Hubert H. Humphrey Building 200 Independence Avenue, SW Washington, DC 20201 Additional funding has been provided by the U.S. Department of Labor. The Lewin Group, Urban Institute, and Group Health Cooperative, as partner organizations, assisted with site development and implementation research. DataStat and HumRRO, as subcontractors, are fielding the client sur-veys. Dissemination of MDRC publications is supported by the following funders that help finance MDRC’s public policy outreach and expanding efforts to communicate the results and implications of our work to policymakers, practitioners, and others: Alcoa Foundation, The Ambrose Monell Foundation, Bristol-Myers Squibb Foundation, and The Starr Foundation. In addition, earnings from the MDRC Endowment help sustain our dissemination efforts. Contributors to the MDRC Endow-ment include Alcoa Foundation, The Ambrose Monell Foundation, Anheuser-Busch Foundation, Bristol-Myers Squibb Foundation, Charles Stewart Mott Foundation, Ford Foundation, The George Gund Foundation, The Grable Foundation, The Lizabeth and Frank Newman Charitable Foundation, The New York Times Company Foundation, Jan Nicholson, Paul H. O’Neill Charitable Foundation, John S. Reed, The Sandler Family Supporting Foundation, and The Stupski Family Fund, as well as other individual contributors. The findings and conclusions in this report do not necessarily represent the official positions or poli-cies of the funders. For information about MDRC and copies of our publications, see our Web site: www.mdrc.org. Copyright © 2007 by MDRC. All rights reserved.
Overview
This paper presents early results from an evaluation of the Center for Employment Opportunities (CEO) in New York City, a highly regarded employment program for former prisoners. The evalu-ation is part of the Enhanced Services for the Hard-to-Employ Demonstration and Evaluation pro-ject, sponsored by the U.S. Department of Health and Human Services, with funding from the U.S. Department of Labor. The project is led by MDRC, a nonprofit, nonpartisan education and social policy research firm, along with the Urban Institute and other partners.
More than 650,000 people are released from prison each year. These ex-prisoners, many of them parents of children receiving welfare, face serious obstacles to successful reentry, and rates of re-cidivism are high. Most experts agree that finding steady work is one of the central challenges they face. CEO uses a distinctive transitional employment model. After a four-day job readiness class, participants are placed in temporary, minimum-wage jobs with crews that work under contract to city and state agencies. Within weeks, they receive help finding permanent jobs and, later, services to promote employment retention.
The evaluation targets a key subset of CEO’s population — ex-prisoners who showed up at the program after being referred by a parole officer. It uses a random assignment design: in 2004 and 2005, nearly 1,000 people were assigned, at random, to the regular CEO program or to re-ceive basic job search assistance (this is called the control group). The research team is follow-ing both groups for several years, using surveys and administrative data to measure the pro-gram’s impact on employment, recidivism, and other outcomes. At this point, data on employ-ment covered by unemployment insurance (UI) and several measures of recidivism are avail-able for one year.
For the full research sample, CEO generated a large, but short-lived increase in UI-covered em-ployment. By the end of the first year of follow-up, the program and control groups were equal-ly likely to be employed. There were also small but statistically significant decreases in two key measures of recidivism — felony convictions and incarceration for new crimes — during Year 1, but no effects on other measures.
Most CEO participants enroll just after release from incarceration. However, a large fraction of the study sample came to CEO many months after release. Because the program was designed to serve recently released ex-prisoners, results were examined separately for those who came to CEO within three months after release (about 40 percent of the sample) and those who came later. These results are less certain because the sample sizes are relatively small, but they show a potentially important pattern: Among those who came to CEO within three months after release, program group members were significantly less likely to have their parole revoked, to be con-victed of a felony, and to be reincarcerated. Effects on these measures are rarely seen in rigorous evaluations. In contrast, there were no significant impacts on any recidivism measures for those who came to CEO more than three months after release.
The CEO evaluation is still at an early stage. The study will eventually include three years of follow-up and will incorporate several additional data sources, including records of New York City jail stays and a survey of more than 500 sample members. A full report is planned for 2008.
iii

v
Table of Contents
Overview..................................................................................................................................... iii
List of Tables ............................................................................................................................. vii
Acknowledgments ...................................................................................................................... ix
Introduction.................................................................................................................................. 1
Research Design and Data Sources............................................................................................. 4
Characteristics of the Study Participants..................................................................................... 6
Participation in CEO Activities................................................................................................. 11
Impacts on Employment and Recidivism for the Full Sample ................................................ 14
Results for Groups Defined by Time Since Release ................................................................ 21
Next Steps.................................................................................................................................. 27
Appendix: Supplementary Tables............................................................................................. 29
References.................................................................................................................................. 39

vii
List of Tables
Table 1 Baseline Characteristics by Research Group 7
2 Criminal History Characteristics by Research Group 10
3 Participation in CEO Activities for the Program Group 12
4 Year 1 Impacts on Employment 15
5 Year 1 Impacts on Recidivism 18
6 Year 1 Impacts on Recidivism and Employment 20
7 Year 1 Impacts on Employment: Sample Members Randomly Assigned Less Than 3 Months After Release 22
8 Year 1 Impacts on Recidivism: Sample Members Randomly Assigned Less Than 3 Months After Release 24
9 Year 1 Impacts on Recidivism and Employment: Sample Members Randomly Assigned Less Than 3 Months After Release 26
A.1 Baseline Characteristics by Number of Months Between Prison Release and Random Assignment 31
A.2 Participation in CEO Activities for the Program Group by Number of Months Between Prison Release and Random Assignment 33
A.3 Year 1 Impacts on Employment: Sample Members Randomly Assigned More Than 3 Months After Release 35
A.4 Year 1 Impacts on Recidivism: Sample Members Randomly Assigned More Than 3 Months After Release 36
A.5 Year 1 Impacts on Recidivism and Employment: Sample Members Randomly Assigned More Than 3 Months After Release 38


ix
Acknowledgments
The Center for Employment Opportunities (CEO) site in the Enhanced Services for the Hard-to-Employ Demonstration and Evaluation Project has received strong support from CEO administrators and staff and from officials in several New York State agencies. While many people have worked hard to support the study, we owe special thanks to the following individuals.
At CEO, Executive Director Mindy Tarlow, Chief Operating Officer Brad Dudding, and Chief Program Officer Tani Mills have steadfastly supported the study and have given generously of their time. Special thanks to Nigel Pieters for providing program participation data and for helping to set up the complex random assignment database. Thanks also to Mary Bedeau, Minerva Ortiz, Wanda Andujar, Eddie Bryant, Hilma Dilone, and Nathaniel Parham for their contributions. Suzanne Neusteter, formerly of CEO, played a key role in the study’s early stages.
We greatly appreciate the assistance and support of the following current and former staff from New York State agencies: Mary Ellen Flynn, Mike Buckman, Renee Konicki, Grant Valentine, and Robert Baultwright from the Division of Parole; Donna Hall, Dave Van Alstyne, and Steve Greenstein from the Division of Criminal Justice Services; and David Moses from the Department of Labor.
We thank David Butler, Charles Michalopoulos, Gordon Berlin, and Fred Doolittle of MDRC and Christy Visher and Shelli Rossman of the Urban Institute, who reviewed the pa-per and provided helpful suggestions. Other MDRC staff who played key roles include Sally Dai and Ihno Lee, who were the lead programmers; Joel Gordon and Galina Farberova, who managed the random assignment process; and Diane Singer, who provided administrative support. John Hutchins edited the paper, and David Sobel and Stephanie Cowell prepared it for publication.

Introduction The Center for Employment Opportunities (CEO) is one of four sites in the Enhanced
Services for the Hard-to-Employ Demonstration and Evaluation Project, sponsored by the Ad-ministration for Children and Families and the Office of the Assistant Secretary for Planning and Evaluation in the U.S. Department of Health and Human Services (HHS), with additional funding from the U.S. Department of Labor. The overall project is evaluating diverse strategies designed to improve employment and other outcomes for several hard-to-employ populations. MDRC, a nonprofit, nonpartisan social and education policy research organization, is leading the evaluation, in collaboration with the Urban Institute and other partners.
Based in New York City, CEO was included in the Hard-to-Employ study because it is a comprehensive employment program for former prisoners — a population confronting many obstacles to finding and maintaining work — and because it has a special focus on parenting and child support issues for participants who have children. The other three sites in the Hard-to-Employ Project are targeting Medicaid recipients with serious depression, Early Head Start par-ents and children, and long-term welfare recipients.
The Prisoner Reentry Crisis
There has been a tremendous increase in incarceration over the past three decades. Con-sequently, unprecedented numbers of prisoners are being released each year: four times as many prisoners were released in 2004 as in 1980. Ex-prisoners face a range of challenges to success-ful reentry into the community, and rates of recidivism are high. Within three years of release, two-thirds are arrested and more than half return to prison or jail.1 Many individuals are in and out of prison or jail multiple times for the same original offense, meaning they were reincarcer-ated for a violation of parole. Over one-third of prison admissions each year are for parole viola-tions.2 The large number of former prisoners who fail to reintegrate and who end up back in prison costs taxpayers billions of dollars each year. Expenditures on corrections by state gov-ernments were estimated to be more than $40 billion in 2005.3
Prisoner reentry also has direct effects on families and children. More than half of reen-tering adults have children under 18 years old, and more than ten million children in the U.S. have a parent who was in prison at some point in their children’s lives.4 Not surprisingly, long periods of incarceration can be detrimental to family ties and can alienate the recently released parent from his or her children. Aside from the prolonged effects on children’s well-being, di-
1Langan and Levin (2002). 2Petersilia (2003). 3National Association of State Budget Officers (2006). 4Hirsch et al. (2002).
1

minished bonds with family can seriously hinder the likelihood of successful reentry.5 There are also increased financial burdens on families, many of whom were relying on public assis-tance prior to a parent being incarcerated. Research has shown that as many as 44 percent of the caregivers of children with an incarcerated parent report receiving public assistance.6 Fur-thermore, upon release nearly one-third of former prisoners expect their families to depend on public assistance.7
Work seems to be a key ingredient in determining the success or failure of former pris-oners’ transition back to society. Studies have shown a correlation between higher employment and lower recidivism, particularly for older former prisoners.8 Positive employment outcomes can help pave the way to better housing conditions and improved relations within the family and community. Moreover, employment may help ex-prisoners feel more connected to mainstream society and help move them away from criminal activity.
Unfortunately, finding a steady job upon release is a major challenge for this popula-tion. Many employers are reluctant to hire someone with a prison record.9 In a survey of 3,000 employers, two-thirds reported that they would not knowingly hire a former prisoner.10 Most recently released people also have other attributes, such as low educational attainment and lim-ited work history, that make them less appealing to potential employers, and they may have competing demands from drug treatment programs and curfews or other restrictions on mobility that can further exacerbate the problem of finding and keeping full-time employment.
Well-rounded employment services for former prisoners may be critical to ensuring bet-ter post-release outcomes. While there are many community programs that aim to provide these needed supports, few operate on a large scale and little is known about how effective they are. CEO in New York City is one of the nation’s largest and most highly regarded employment programs for formerly incarcerated people.
The Center for Employment Opportunities
Developed by the Vera Institute of Justice in the 1970s, CEO has operated as an inde-pendent nonprofit corporation since 1996. Each year, CEO serves an average of 2,000 parolees who are returning to the community from prison.
5Visher et al. (2004). 6Travis and Waul (2004). 7Reentry Policy Council (2005). 8Harer (1994); Uggen (2000). 9Pager (2003). 10Holzer, Raphael, and Stoll (2004).
2
Participants start the program with a four-day Life Skills class focusing on job readiness issues, such as workplace behavior, job search skills, and decision-making. CEO makes sure that each participant has all of the official identification and documents necessary for employ-ment. Participants are then placed in transitional jobs at one of 30 to 40 worksites around the city through CEO’s Neighborhood Work Project (NWP). The worksites are public agencies that have secured CEO’s services through the New York State Division of Parole to perform work for their agencies. Participants work four days per week at the state minimum wage, and they are paid at the end of each day. CEO uses the transitional period to identify issues that are likely to hinder the participants’ performance in an unsubsidized, permanent job; staff work with par-ticipants to address these issues.
Participants spend the fifth day of each week in the main CEO office meeting with job coaches to discuss work performance and to prepare for interviewing, as well as meeting with job developers to discuss permanent employment opportunities:
• Job coaching. The role of the CEO job coach is to assess and promote “job readiness” for each NWP participant. Job coaches teach the Life Skills classes, track participants’ attendance and performance at NWP worksites, communicate with parole officers, and, where appropriate, issue warnings and suspensions to participants. An important aspect of a job coach’s respon-sibilities is to identify and address any issues needed to make an individual ready for permanent employment. Job coaches do this through weekly meet-ings with participants and through communications with worksite supervi-sors. Ultimately, it is the job coach who decides when a participant is deemed “job ready” and prepared to work with a job developer to seek a permanent job. For most of the study period, job coaches were also responsible for fol-lowing up with participants after they had been placed in permanent jobs to try to promote employment retention.
• Job development. Once a program participant is deemed “job ready,” job developers conduct an initial assessment of the participant and begin the process of matching the participant with a permanent job. Job developers build relationships with employers in order to identify openings and match participants with those jobs. Job developers typically prepare participants for a specific interview and, in some cases, will accompany the participant to an interview. Job development is a particularly valuable service because CEO has identified dozens of employers who are willing to hire individuals with criminal records.
3
Participants can also spend this fifth day participating in other activities, such as an ex-tensive fatherhood program that works on child support issues (such as helping to reduce their current child support orders) and improving family relationships (at least half the study partici-pants are parents and their children may be receiving welfare benefits).
CEO made several enhancements to its program during the study period, such as creat-ing special worksites for new enrollees, developing a system of non-cash incentives to reward retention in unsubsidized employment, and deploying specialized job retention workers. These enhancements are still operating today. The study results reported here may not fully reflect any effects generated by these programmatic changes, however, because they were not in place when the study began.
Research Design and Data Sources The evaluation rigorously tests whether the core components of CEO’s program pro-
duce impacts on employment, recidivism, and other outcomes.
Research Design for the Evaluation
The impacts of CEO’s program are being assessed using a random assignment research design. Between January 2004 and October 2005, 977 ex-prisoners who were referred by their parole officer, reported to CEO, and met the study eligibility criteria,11 were randomly assigned to one of two groups:12
• Neighborhood Work Project Group (the Program Group; N=568). Indi-viduals who were assigned to this group were eligible to receive all of CEO’s program services, including the four-day Life Skills class, placement in a transitional job, job coaching, additional services (such as the fatherhood program), job development services, and all post-placement services.
• Resource Room Group (the Control Group; N=409). The Resource Room program was designed to provide a basic level of service to individuals as-signed to the control group and to provide a benchmark against which to
11For both ethical and methodological reasons, individuals who had participated in the Neighborhood Work
Project (NWP) program in the past year (“recycles”) were excluded from the study and assigned to the NWP pro-gram. Also, only individuals who signed an Informed Consent form were included in the study sample.
12The MDRC team worked with CEO and the New York State Division of Parole to design a random as-signment process that ensured that the study did not decrease the number of people who received NWP services and that ensured that CEO had enough participants to fill its contractual obligations to NWP worksite sponsors. Random assignment was only conducted during weeks when the number of new enrollees exceeded the number of available NWP worksite slots.
4
compare CEO’s core program. Individuals assigned to this group participated in a revised version of the Life Skills class that lasted 1.5 days, rather than 4 days. Participants were then given access to a resource room that includes computers (with job search software), phones, voice mail, a printer, a fax machine, and other job search tools, including publications. When clients came into the Resource Room a staff person was available, if needed, to as-sist them with many aspects of job search, including use of the equipment, help developing a resume, and assistance with setting up a voice mail ac-count so that potential employers could leave messages for participants.13
The research team is tracking both groups using a variety of data sources (see below). Any statistically significant differences that emerge between the groups over time — for exam-ple, differences in employment or incarceration rates — can be attributed to CEO’s core pro-gram with some confidence.14 These differences are referred to as “impacts” or “effects.”
It is important to note that the individuals who were targeted for the study — parolees who were referred to CEO by their parole officer — represent a subset of the parolees that CEO serves. For example, everyone who graduates from New York State’s Shock Incarceration (boot camp) program and returns to New York City is required to participate in CEO’s program. For contractual reasons, boot camp graduates and participants in some other special programs were not included in the study. CEO provides very similar services to all of these groups of parolees.
Data Sources Used in This Analysis
Data from several sources are used in the analysis presented in this paper:
• Baseline data. Participants completed a short baseline information sheet when they entered the study. Some additional baseline data were also ob-tained from CEO’s internal database.
13If a control group member worked diligently in the Resource Room for three months but was unable to find
employment on his own, he was offered CEO’s job development services (but not a transitional job), but this very rarely happened. Of course, control group members may have sought assistance from other employment pro-grams. A 15-month follow-up survey will gather information about program participation for both groups.
14Since the proportion of people randomly assigned to the program group varied from week to week, weights were used so that the impact results were not dominated by a disproportionate assignment to one group or the other in any given week. In particular, each program group member received a smaller weight in the impact calcu-lation if they entered the study in a week when a higher proportion of individuals were assigned to the program group, and vice versa. The same was true for control group members. In addition, following standard practice in studies such as this, the estimates were regression-adjusted using ordinary least squares, controlling for pre-random assignment characteristics of sample members.
5
• Criminal justice administrative data. These data were provided by the New York State (NYS) Division of Criminal Justice Services (DCJS), which compiles data from many city and state agencies. These data provide infor-mation on a range of outcomes, including arrests, parole violations, convic-tions, and incarceration in state prison, for each member of the study sample, both before and after study entry.15
• Employment data. Data from the NYS Department of Labor show em-ployment in jobs covered by the state unemployment insurance (UI) program (including CEO transitional jobs). These data cover the period from three years prior to study entry to one year after study entry for all sample mem-bers.
• Program MIS data. These data, from CEO’s management information sys-tem (MIS), provide information on each individual’s participation in the CEO components for which he was eligible, including data on NWP work and on job coach and job developer appointments.
At this point, data from all of these sources are available for at least one year after study entry for all sample members. The study will eventually follow sample members for three years and, as discussed further below, will incorporate data from a number of other sources.
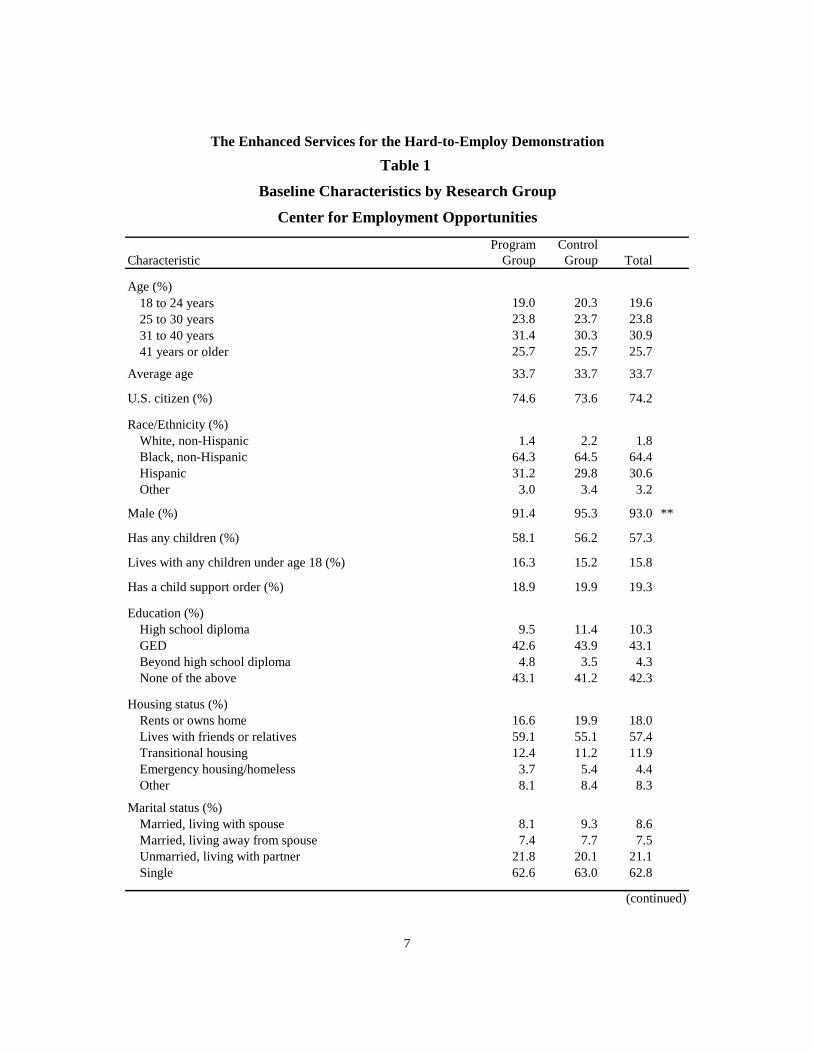
Characteristics of the Study Participants Table 1 presents baseline characteristics for the program group, the control group, and
both groups combined. As expected in a random assignment design, there are very few significant differences in background characteristics between the two research groups. In addition, the char-acteristics of the CEO study sample are similar to the national population of former prisoners.
15DCJS provided MDRC with three SPSS portable files matched to a sample request file using New York
State Identification (NYSID) Numbers: an arrest, a parole, and a corrections file. Each file includes information about unsealed events only. The arrest file includes data from the DCJS rap sheet system, including arrests, con-victions, and sentencing. The corrections file contains information furnished to DCJS from the New York State (NYS) Department of Corrections, including state prison admissions and releases (with a small number of records on jail stays). The parole file contains information furnished to DCJS from the NYS Division of Parole, including parole term start and end dates, abscond dates, and parole revocation information. The arrest and corrections files contain data reported to DCJS from January 1970 to present, and the parole file contains data reported to DCJS from January 1960 to present. DCJS takes no responsibility for the methods of statistical analysis or for the con-clusions derived from the analysis.
6
The Enhanced Services for the Hard-to-Employ Demonstration
Table 1
Baseline Characteristics by Research Group
Center for Employment Opportunities
Program ControlCharacteristic Group Group Total
Age (%)18 to 24 years 19.0 20.3 19.625 to 30 years 23.8 23.7 23.831 to 40 years 31.4 30.3 30.941 years or older 25.7 25.7 25.7
Average age 33.7 33.7 33.7
U.S. citizen (%) 74.6 73.6 74.2
Race/Ethnicity (%)White, non-Hispanic 1.4 2.2 1.8Black, non-Hispanic 64.3 64.5 64.4Hispanic 31.2 29.8 30.6Other 3.0 3.4 3.2
Male (%) 91.4 95.3 93.0 **
Has any children (%) 58.1 56.2 57.3
Lives with any children under age 18 (%) 16.3 15.2 15.8
Has a child support order (%) 18.9 19.9 19.3
Education (%)High school diploma 9.5 11.4 10.3GED 42.6 43.9 43.1Beyond high school diploma 4.8 3.5 4.3None of the above 43.1 41.2 42.3
Housing status (%)Rents or owns home 16.6 19.9 18.0Lives with friends or relatives 59.1 55.1 57.4Transitional housing 12.4 11.2 11.9Emergency housing/homeless 3.7 5.4 4.4Other 8.1 8.4 8.3
Marital status (%)Married, living with spouse 8.1 9.3 8.6Married, living away from spouse 7.4 7.7 7.5Unmarried, living with partner 21.8 20.1 21.1Single 62.6 63.0 62.8
(continued)
7
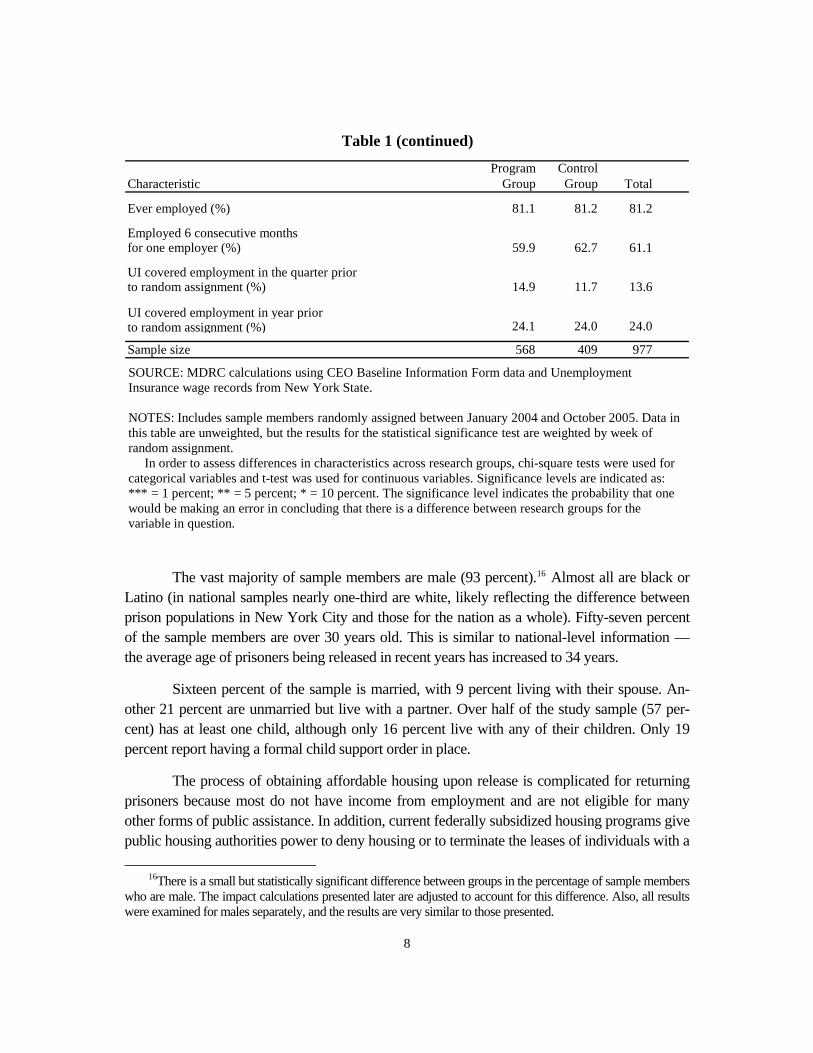
Table 1 (continued)
Program ControlCharacteristic Group Group Total
Ever employed (%) 81.1 81.2 81.2
Employed 6 consecutive months for one employer (%) 59.9 62.7 61.1
UI covered employment in the quarter priorto random assignment (%) 14.9 11.7 13.6
UI covered employment in year prior to random assignment (%) 24.1 24.0 24.0
Sample size 568 409 977
SOURCE: MDRC calculations using CEO Baseline Information Form data and Unemployment Insurance wage records from New York State.
NOTES: Includes sample members randomly assigned between January 2004 and October 2005. Data in this table are unweighted, but the results for the statistical significance test are weighted by week of random assignment.
In order to assess differences in characteristics across research groups, chi-square tests were used for categorical variables and t-test was used for continuous variables. Significance levels are indicated as: *** = 1 percent; ** = 5 percent; * = 10 percent. The significance level indicates the probability that one would be making an error in concluding that there is a difference between research groups for the variable in question.
The vast majority of sample members are male (93 percent).16 Almost all are black or Latino (in national samples nearly one-third are white, likely reflecting the difference between prison populations in New York City and those for the nation as a whole). Fifty-seven percent of the sample members are over 30 years old. This is similar to national-level information — the average age of prisoners being released in recent years has increased to 34 years.
Sixteen percent of the sample is married, with 9 percent living with their spouse. An-other 21 percent are unmarried but live with a partner. Over half of the study sample (57 per-cent) has at least one child, although only 16 percent live with any of their children. Only 19 percent report having a formal child support order in place.
The process of obtaining affordable housing upon release is complicated for returning prisoners because most do not have income from employment and are not eligible for many other forms of public assistance. In addition, current federally subsidized housing programs give public housing authorities power to deny housing or to terminate the leases of individuals with a
8
16There is a small but statistically significant difference between groups in the percentage of sample members
who are male. The impact calculations presented later are adjusted to account for this difference. Also, all results were examined for males separately, and the results are very similar to those presented.
history of drug use or criminal behavior. Thus, many sample members live with friends or rela-tives (57 percent) or in some type of transitional housing (12 percent). Four percent report living in emergency housing or are homeless.
Just over half the sample has completed a high school diploma or a GED, and a very small proportion has a postsecondary degree (4 percent). Most have at least some employment history. More than 80 percent report that they have worked, and about 61 percent report that they have worked for a single employer for six consecutive months.
It is notable that 24 percent of the sample was employed in a UI-covered job in the year before study entry. This means that at least some study participants did not come to CEO im-mediately after release from prison, an issue that will be discussed further below.
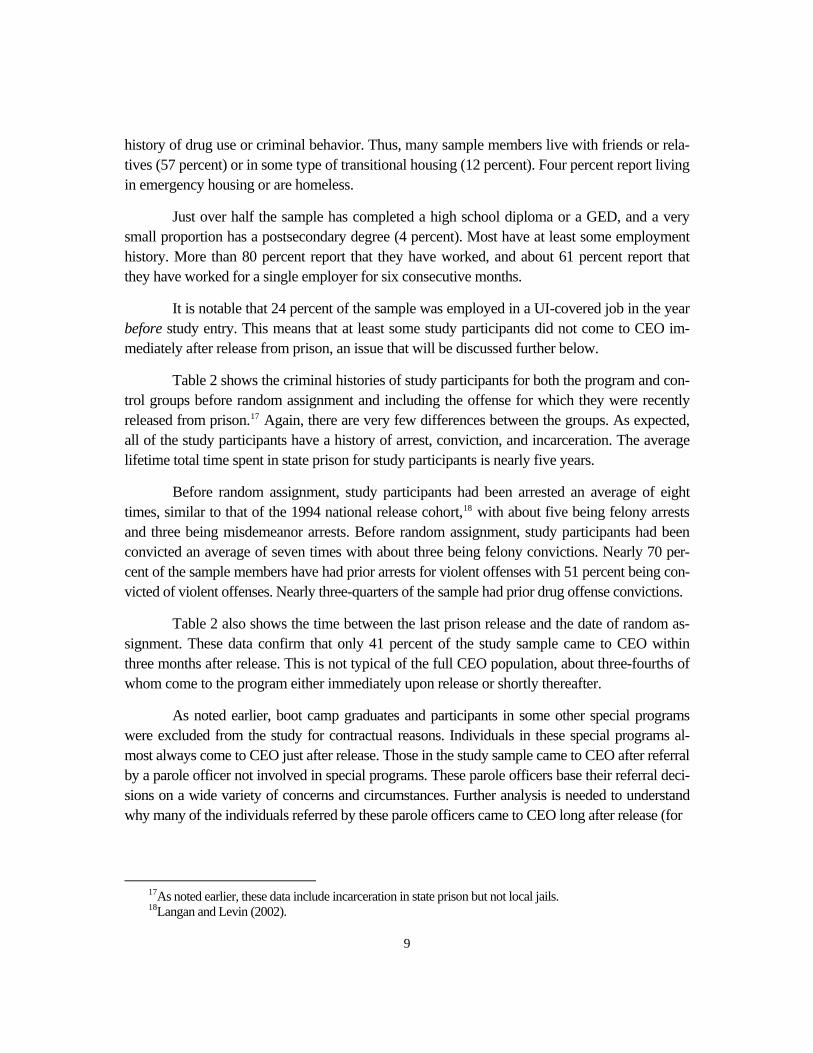
Table 2 shows the criminal histories of study participants for both the program and con-trol groups before random assignment and including the offense for which they were recently released from prison.17 Again, there are very few differences between the groups. As expected, all of the study participants have a history of arrest, conviction, and incarceration. The average lifetime total time spent in state prison for study participants is nearly five years.
Before random assignment, study participants had been arrested an average of eight times, similar to that of the 1994 national release cohort,18 with about five being felony arrests and three being misdemeanor arrests. Before random assignment, study participants had been convicted an average of seven times with about three being felony convictions. Nearly 70 per-cent of the sample members have had prior arrests for violent offenses with 51 percent being con-victed of violent offenses. Nearly three-quarters of the sample had prior drug offense convictions.
Table 2 also shows the time between the last prison release and the date of random as-signment. These data confirm that only 41 percent of the study sample came to CEO within three months after release. This is not typical of the full CEO population, about three-fourths of whom come to the program either immediately upon release or shortly thereafter.
As noted earlier, boot camp graduates and participants in some other special programs were excluded from the study for contractual reasons. Individuals in these special programs al-most always come to CEO just after release. Those in the study sample came to CEO after referral by a parole officer not involved in special programs. These parole officers base their referral deci-sions on a wide variety of concerns and circumstances. Further analysis is needed to understand why many of the individuals referred by these parole officers came to CEO long after release (for
17As noted earlier, these data include incarceration in state prison but not local jails. 18Langan and Levin (2002).
9
The Enhanced Services for the Hard-to-Employ Demonstration
Table 2
Criminal History Characteristics by Research Group
Center for Employment Opportunities
Program ControlCharacteristic Group Group Total
Arrest history
Any prior arrests (%) 100 100 100
Average number of arrestsa 7.4 7.7 7.5Number of prior felony arrests 4.5 4.6 4.6Number of prior misdemeanor arrests 2.8 3.1 2.9
Ever arrested for a violent crime (%)b 67.4 67.5 67.4
Number of prior arrests for a violent crime 1.4 1.4 1.4
Conviction history
Any prior conviction (%)c 100 100 100
Average number of prior convictionsd 6.6 6.9 6.7Number of prior felony convictions 2.7 2.5 2.6 ***Number of prior misdemeanor convictions 3.6 4.1 3.8
Convicted of a violent crime (%) 51.6 50.6 51.2
Convicted of a drug-related crime (%) 73.1 74.2 73.6
State prison history
Lifetime number of months in state prisone 59.2 57.5 58.5
Months between latest state prison releaseand random assignment (%) f
1–3 months 41.4 39.5 40.64–6 months 14.7 13.5 14.27–9 months 10.8 11.7 11.2More than 9 months 33.0 35.2 33.9
Sample size 568 409 977(continued)
10

Table 2 (continued)
SOURCE: MDRC calculations using data from the New York State (NYS) Division of Criminal Justice Services.
NOTES: Includes sample members randomly assigned between January 2004 and October 2005. Data in this table are unweighted, but the results for the statistical significance test are weighted by week of random assignment. Significance levels are indicated as: *** = 1 precent; ** = 5 percent; * = 10 percent.
Due to missing data, seven sample members are missing prior criminal history data.Prior criminal history includes the arrest, conviction, and incarceration related to the offense they
were on parole for at the time of random assignment (the current offense).aEach arrest date is only counted as a single event. If there are multiple crimes or charges on the
same date, only one event per date is recorded in the analysis. A total of 19 sample members are missing arrest charges information.
bViolent crime indicator as defined by Penal Law 70.02; also includes underlying offenses.cConviction outcome excludes convictions where a final disposition was not found. A total of 24
sample members are missing a final disposition.dEach conviction date is only counted as a single event. If there are multiple convictions on the
same date, only one event per date is recorded in the analysis. e"Lifetime" includes historical data as early as 1970.
fully one-third of the sample, more than nine months after release). For example, some parole of-ficers may have referred parolees to CEO after they had worked for a time and then lost a job. Al-ternatively, data from the New York City jail system (which will be analyzed later) may show that some sample members spent time in jail between their release from prison and their date of ran-dom assignment. Others may have spent time in residential drug treatment programs.
Because the CEO model was designed to serve ex-prisoners just after release, and be-cause most of CEO’s broader population fits this profile, the results presented later in this paper are examined separately for people who came to CEO soon after release and those who came later.
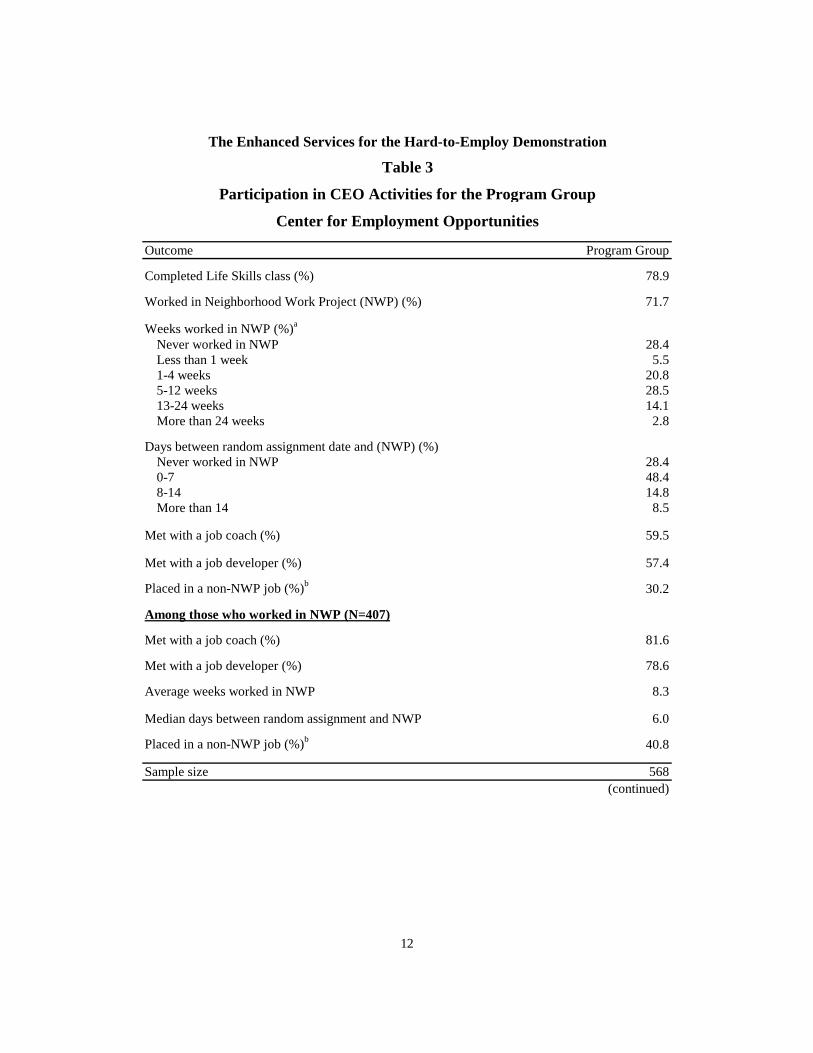
Participation in CEO Activities Table 3 shows participation in CEO’s core program activities for the program group
during the first year of the follow-up period. These data are drawn from CEO’s management information system. (In later reports, data from a follow-up survey of program and control group members will be used to present a fuller picture of service receipt for both groups, includ-ing services not provided by CEO.)
• Life Skills class. The first step in the CEO program is completing the four-day Life Skills class. More than three-fourths of the program group (79 per-cent) completed the Life Skills class. About 38 percent of the control group completed the shorter version of this class that was specifically designed for
11
The Enhanced Services for the Hard-to-Employ Demonstration
Table 3
Participation in CEO Activities for the Program Group
Center for Employment Opportunities
Outcome Program Group
Completed Life Skills class (%) 78.9
Worked in Neighborhood Work Project (NWP) (%) 71.7
Weeks worked in NWP (%)a
Never worked in NWP 28.4Less than 1 week 5.51-4 weeks 20.85-12 weeks 28.513-24 weeks 14.1More than 24 weeks 2.8
Days between random assignment date and (NWP) (%)Never worked in NWP 28.40-7 48.48-14 14.8More than 14 8.5
Met with a job coach (%) 59.5
Met with a job developer (%) 57.4
Placed in a non-NWP job (%)b 30.2
Among those who worked in NWP (N=407)
Met with a job coach (%) 81.6
Met with a job developer (%) 78.6
Average weeks worked in NWP 8.3
Median days between random assignment and NWP 6.0
Placed in a non-NWP job (%)b 40.8
Sample size 568(continued)
12
them (not shown). It may be that, without the promise of transitional em-
• ment. Upon completing the Life Skills class, the program
•
• job coach at least once, but a large majority of the participants who worked at an NWP worksite — 82 percent — had such a meeting. Among those who worked in
Table 3 (continued)
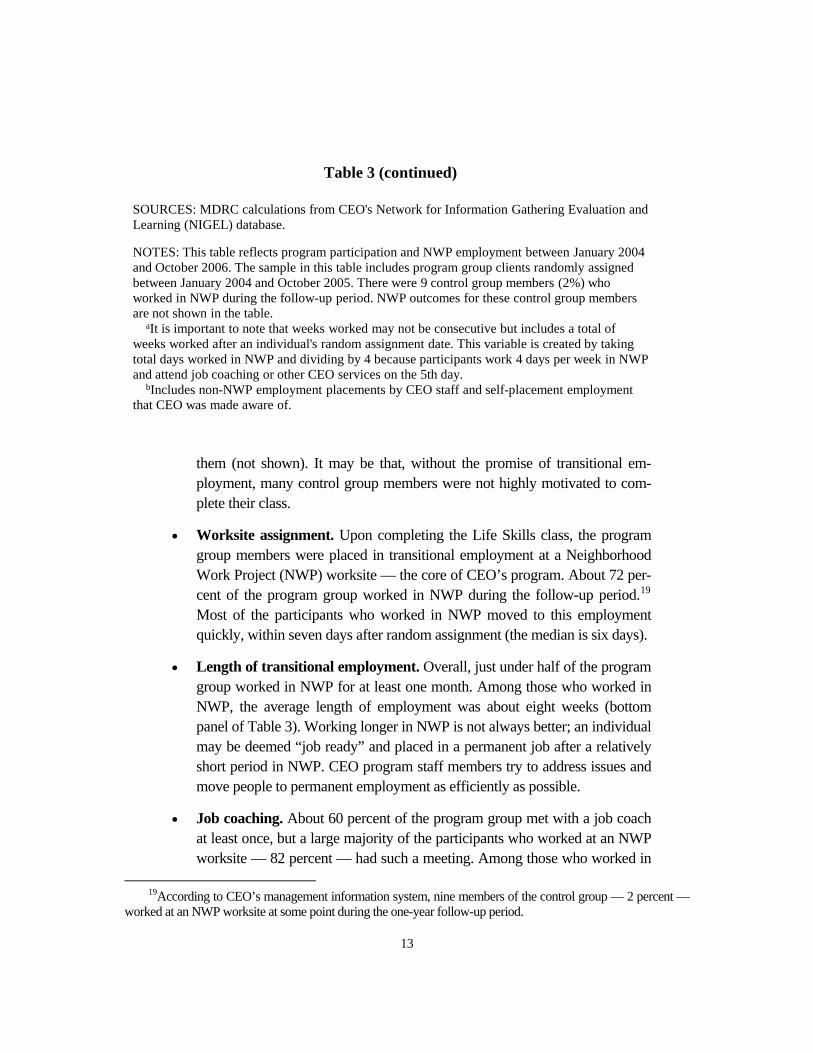
SOURCES: MDRC calculations from CEO's Network for Information Gathering Evaluation and Learning (NIGEL) database.
NOTES: This table reflects program participation and NWP employment between January 2004 and October 2006. The sample in this table includes program group clients randomly assigned between January 2004 and October 2005. There were 9 control group members (2%) who worked in NWP during the follow-up period. NWP outcomes for these control group members are not shown in the table.
aIt is important to note that weeks worked may not be consecutive but includes a total of weeks worked after an individual's random assignment date. This variable is created by taking total days worked in NWP and dividing by 4 because participants work 4 days per week in NWP and attend job coaching or other CEO services on the 5th day.
bIncludes non-NWP employment placements by CEO staff and self-placement employment that CEO was made aware of.
ployment, many control group members were not highly motivated to com-plete their class.
Worksite assigngroup members were placed in transitional employment at a Neighborhood Work Project (NWP) worksite — the core of CEO’s program. About 72 per-cent of the program group worked in NWP during the follow-up period.19 Most of the participants who worked in NWP moved to this employment quickly, within seven days after random assignment (the median is six days).
Length of transitional employment. Overall, just under half of the program group worked in NWP for at least one month. Among those who worked in NWP, the average length of employment was about eight weeks (bottom panel of Table 3). Working longer in NWP is not always better; an individual may be deemed “job ready” and placed in a permanent job after a relatively short period in NWP. CEO program staff members try to address issues and move people to permanent employment as efficiently as possible.
Job coaching. About 60 percent of the program group met with a
19According to CEO’s management information system, nine members of the control group — 2 percent —
worked at an NWP worksite at some point during the one-year follow-up period.
13

NWP for at least two weeks (8 days), almost 90 percent met with a job coach (not shown).
Job development. About 57 percent of program group participants met with a CEO job developer during the one-year follow-up period; the figure is 79 percent for th
•
ose who worked at an NWP worksite, and 87 percent for those
•
.
ImpactsThis section discusses CEO’s impacts on selected measures of employment and re-
e pro- study
(referre
EO’s impact on employment during Year 1. Employment rates are shown for t d by quarter, with Quarter 1 defined as the quarter in which each sam-ple mem ly assigned.20
ost no one in the control group worked in NWP. The pre-vious section noted that about 70 percent of the program group worked in an NWP transitional
who worked in NWP for at least two weeks (the latter figure is not shown).
Job placement. CEO keeps records of job placements that are made by its job developers (called direct placements), as well as “self placements” — in-stances in which participants find jobs on their own and report this to CEOJust over 30 percent of the full program group had one of these types of job placement recorded in CEO’s database (most of these were direct place-ments). The placement rate is 41 percent among those who worked in NWP, and 45 percent among those who worked in NWP for at least two weeks, the point at which participants typically begin working with a job developer. Of course, these placement statistics are not a comprehensive measure of em-ployment because some participants may have found jobs and not reported this to CEO. The UI records (and, eventually, the survey) will provide a more complete picture of employment.
on Employment and Recidivism for the Full Sample
cidivism. As discussed earlier, the impacts are assessed by comparing outcomes for thgram and control groups during a one-year period after sample members entered the
d to as Year 1).
Employment
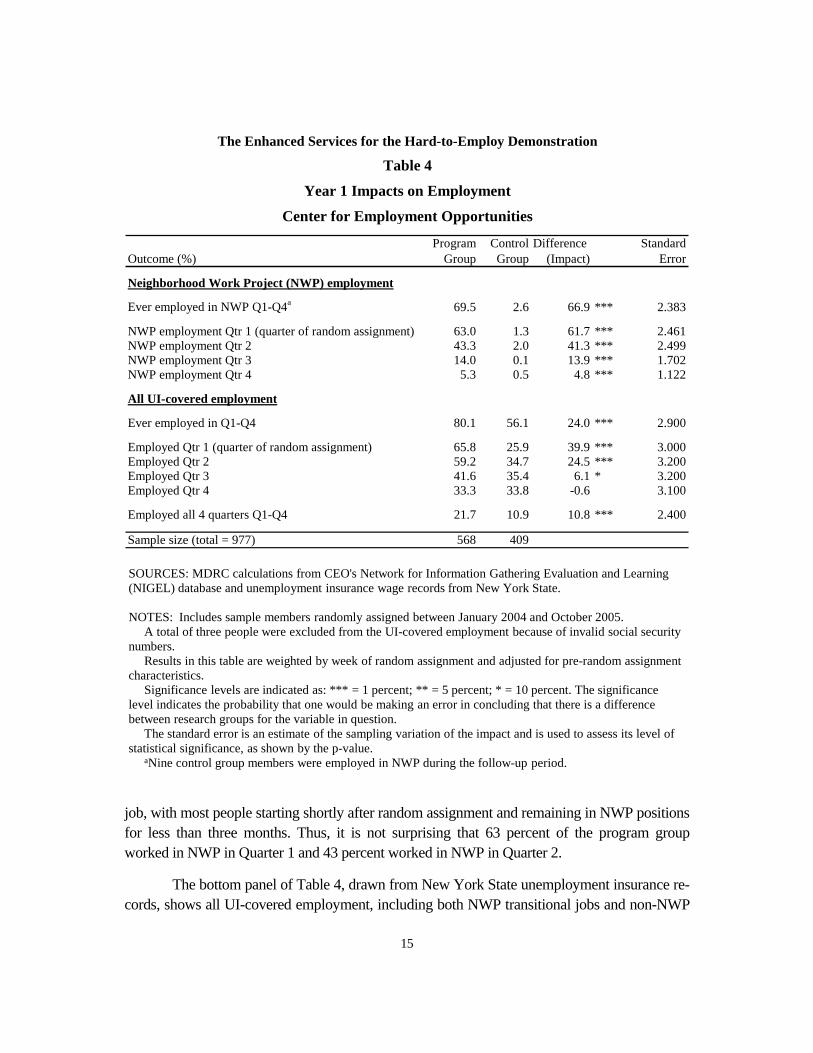
Table 4 shows Che full year an
ber was random
The top panel of the table, based on data from CEO’s management information system, only includes employment in CEO’s Neighborhood Work Project (NWP) transitional jobs. Consistent with the study design, alm
20For example, for a sample member randomly assigned in February 2004, Quarter 1 is the first calendar
quarter of 2004. For someone randomly assigned in May 2005, Quarter 1 is the second calendar quarter of 2005.
14
The Enhanced Services for the Hard-to-Employ Demonstration
Table 4
Year 1 Impacts on Employment
Center for Employment Opportunities
Program Control Difference StandardOutcome (%) Group Group (Impact) Error
Neighborhood Work Project (NWP) employmentaEver employed in NWP Q1-Q4 69.5 2.6 66.9 *** 2.383
NWP employment Qtr 1 (quarter of random assignment) 63.0 1.3 61.7 *** 2.461NWP employment Qtr 2 43.3 2.0 41.3 *** 2.499NWP employment Qtr 3 14.0 0.1 13.9 *** 1.702NWP employment Qtr 4 5.3 0.5 4.8 *** 1.122
All UI-covered employment
Ever employed in Q1-Q4 80.1 56.1 24.0 *** 2.900
Employed Qtr 1 (quarter of random assignment) 65.8 25.9 39.9 *** 3.000Employed Qtr 2 59.2 34.7 24.5 *** 3.200Employed Qtr 3 41.6 35.4 6.1 * 3.200Employed Qtr 4 33.3 33.8 -0.6 3.100
Employed all 4 quarters Q1-Q4 21.7 10.9 10.8 *** 2.400
Sample size (total = 977) 568 409
SOURCES: MDRC calculations from CEO's Network for Information Gathering Evaluation and Learning (NIGEL) database and unemployment insurance wage records from New York State.
NOTES: Includes sample members randomly assigned between January 2004 and October 2005. A total of three people were excluded from the UI-covered employment because of invalid social security
numbers.Results in this table are weighted by week of random assignment and adjusted for pre-random assignment
characteristics. Significance levels are indicated as: *** = 1 percent; ** = 5 percent; * = 10 percent. The significance
level indicates the probability that one would be making an error in concluding that there is a difference between research groups for the variable in question.
The standard error is an estimate of the sampling variation of the impact and is used to assess its level of statistical significance, as shown by the p-value.
aNine control group members were employed in NWP during the follow-up period.
job, with most people starting shortly after random assignment and remaining in NWP positions for less than three months. Thus, it is not surprising that 63 percent of the program group worked in NWP in Quarter 1 and 43 percent worked in NWP in Quarter 2.
The bottom panel of Table 4, drawn from New York State unemployment insurance re-cords, shows all UI-covered employment, including both NWP transitional jobs and non-NWP
15
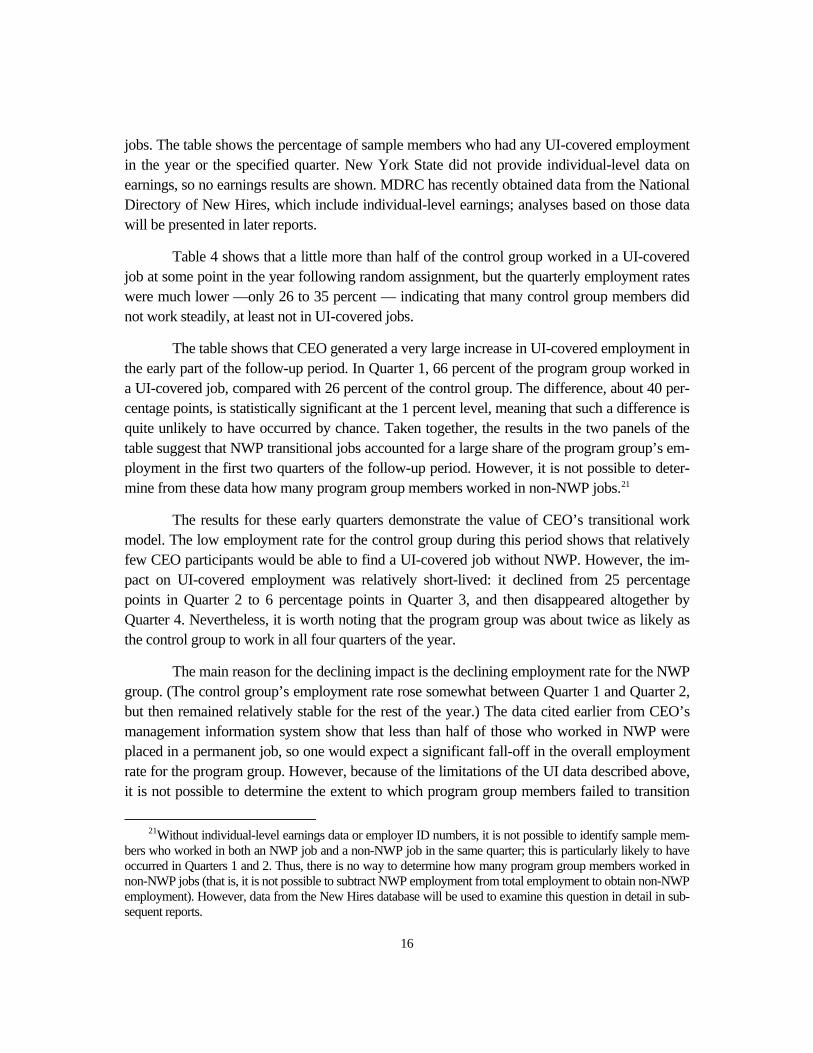
jobs. The table shows the percentage of sample members who had any UI-covered employment in the year or the specified quarter. New York State did not provide individual-level data on earnings, so no earnings results are shown. MDRC has recently obtained data from the National Directory
generated a very large increase in UI-covered employment in the earl
together, the results in the two panels of the table sugge
gether by Quarter
ant fall-off in the overall employment rate for the program group. However, because of the limitations of the UI data described above, it is not possible to determine the extent to which program group members failed to transition
of New Hires, which include individual-level earnings; analyses based on those datawill be presented in later reports.
Table 4 shows that a little more than half of the control group worked in a UI-covered job at some point in the year following random assignment, but the quarterly employment rates were much lower —only 26 to 35 percent — indicating that many control group members did not work steadily, at least not in UI-covered jobs.
The table shows that CEO y part of the follow-up period. In Quarter 1, 66 percent of the program group worked in
a UI-covered job, compared with 26 percent of the control group. The difference, about 40 per-centage points, is statistically significant at the 1 percent level, meaning that such a difference is quite unlikely to have occurred by chance. Taken
st that NWP transitional jobs accounted for a large share of the program group’s em-ployment in the first two quarters of the follow-up period. However, it is not possible to deter-mine from these data how many program group members worked in non-NWP jobs.21
The results for these early quarters demonstrate the value of CEO’s transitional work model. The low employment rate for the control group during this period shows that relatively few CEO participants would be able to find a UI-covered job without NWP. However, the im-pact on UI-covered employment was relatively short-lived: it declined from 25 percentage points in Quarter 2 to 6 percentage points in Quarter 3, and then disappeared alto
4. Nevertheless, it is worth noting that the program group was about twice as likely as the control group to work in all four quarters of the year.
The main reason for the declining impact is the declining employment rate for the NWP group. (The control group’s employment rate rose somewhat between Quarter 1 and Quarter 2, but then remained relatively stable for the rest of the year.) The data cited earlier from CEO’s management information system show that less than half of those who worked in NWP were placed in a permanent job, so one would expect a signific
21Without individual-level earnings data or employer ID numbers, it is not possible to identify sample mem-
bers who worked in both an NWP job and a non-NWP job in the same quarter; this is particularly likely to have occurred in Quarters 1 and 2. Thus, there is no way to determine how many program group members worked in non-NWP jobs (that is, it is not possible to subtract NWP employment from total employment to obtain non-NWP employment). However, data from the New Hires database will be used to examine this question in detail in sub-sequent reports.
16

from N
The first panel of the table shows data on arrests and convictions during Year 1, while the seco s one parole status measure — the percent of each group whose parole status w
tatistics on recidivism for released prisoners, it may seem surprising that onl
cer, perhaps a relatively motivated group. F
ore
WP into regular jobs, transitioned and then quickly lost their jobs, or transitioned to jobs not covered by unemployment insurance. Data from the New Hires database and the follow-up survey should allow a more complete analysis of this issue in later reports.
Recidivism
Table 5 shows CEO’s impacts on several measures of recidivism. The data provide a relatively complete picture of arrests, convictions, and prison stays in New York State, but they do not include information on admissions to New York City jails; these data will be incorpo-rated into later analyses.
nd panel showas ever classified as “absconded” or “revoked.” The third panel shows data on admis-
sions to state prisons during the year, and the bottom panel shows the status of sample members at the end of Year 1 with respect to parole and state prison.
Given national sy 24 percent of the control group was arrested in Year 1 of the follow-up period.22 How-
ever, it is important to recall that many sample members had already been out of prison for a substantial amount of time before coming to CEO, so Year 1 of the study period often does not correspond to the first year out of prison. Thus, these data are not directly comparable to studies of cohorts of recently released prisoners. Moreover, the sample only includes people who showed up at CEO’s offices after a referral from a parole offi
inally, it is worth noting that 37 percent of the control group was either arrested or ab-sconded from parole or had their parole revoked during Year 1 (not shown in the tables).
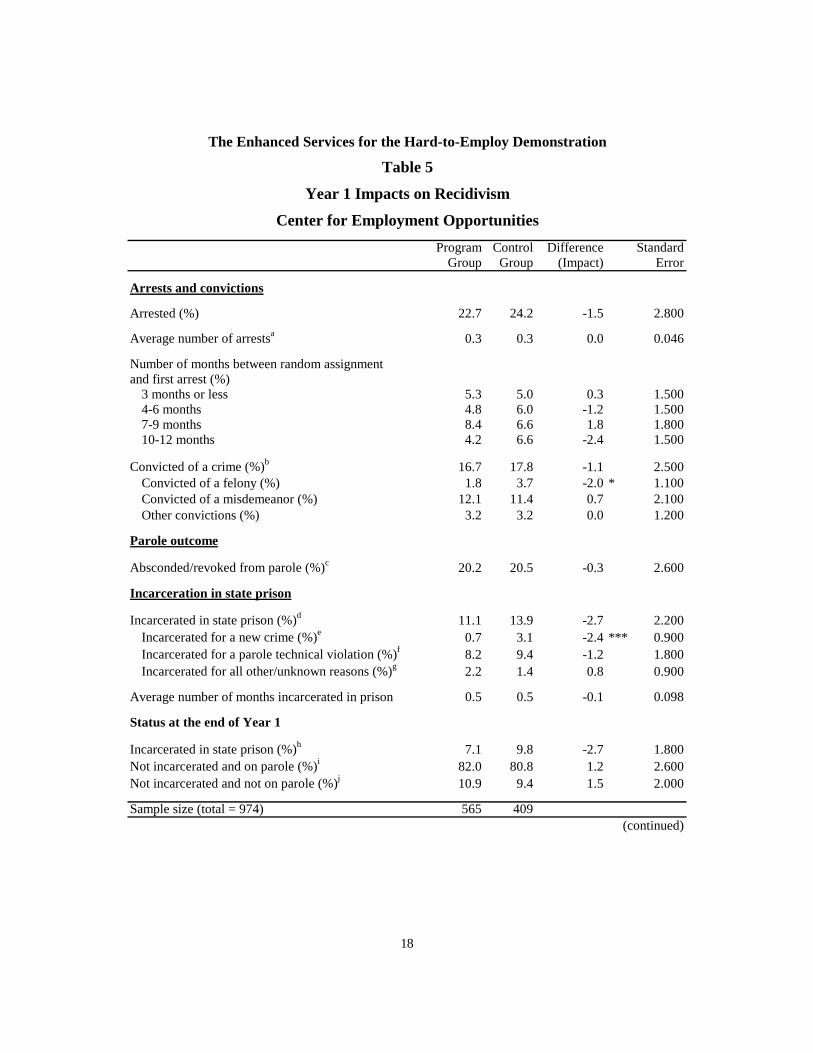
Table 5 shows that, overall, CEO generated few statistically significant impacts on re-cidivism measures. However, there are small but statistically significant decreases in the percent convicted of a felony during Year 1 and in the percent incarcerated in state prison for a new crime during that period — the two measures that have the most direct implications for public safety. There are no statistically significant impacts on arrests, parole measures, or overall in-carceration.23 It is notable that there is no statistically significant impact on arrests during the first three months after random assignment, a period when the program group was much m
22National data show that 44 percent of released prisoners are arrested within one year of release. 23A small number of the convictions in Year 1 were associated with arrests that occurred prior to random as-
signment. This should not affect the program impacts, but the outcome levels would be slightly lower for both groups if the measure counted only convictions associated with arrests after random assignment.
17
The Enhanced Services for the Hard-to-Employ Demonstration
Table 5
Year 1 Impacts on Recidivism
Center for Employment Opportunities
Program Control Difference StandardGroup Group (Impact) Error
Arrests and convictions
Arrested (%) 22.7 24.2 -1.5 2.800
Average number of arrestsa 0.3 0.3 0.0 0.046
Number of months between random assignment and first arrest (%)
3 months or less 5.3 5.0 0.3 1.5004-6 months 4.8 6.0 -1.2 1.5007-9 months 8.4 6.6 1.8 1.80010-12 months 4.2 6.6 -2.4 1.500
Convicted of a crime (%)b 16.7 17.8 -1.1 2.500Convicted of a felony (%) 1.8 3.7 -2.0 * 1.100Convicted of a misdemeanor (%) 12.1 11.4 0.7 2.100Other convictions (%) 3.2 3.2 0.0 1.200
Parole outcome
Absconded/revoked from parole (%)c 20.2 20.5 -0.3 2.600
Incarceration in state prison
Incarcerated in state prison (%)d 11.1 13.9 -2.7 2.200Incarcerated for a new crime (%)e 0.7 3.1 -2.4 *** 0.900Incarcerated for a parole technical violation (%)f 8.2 9.4 -1.2 1.800Incarcerated for all other/unknown reasons (%)g 2.2 1.4 0.8 0.900
Average number of months incarcerated in prison 0.5 0.5 -0.1 0.098
Status at the end of Year 1
Incarcerated in state prison (%)h 7.1 9.8 -2.7 1.800Not incarcerated and on parole (%)i 82.0 80.8 1.2 2.600Not incarcerated and not on parole (%)j 10.9 9.4 1.5 2.000
Sample size (total = 974) 565 409(continued)
18
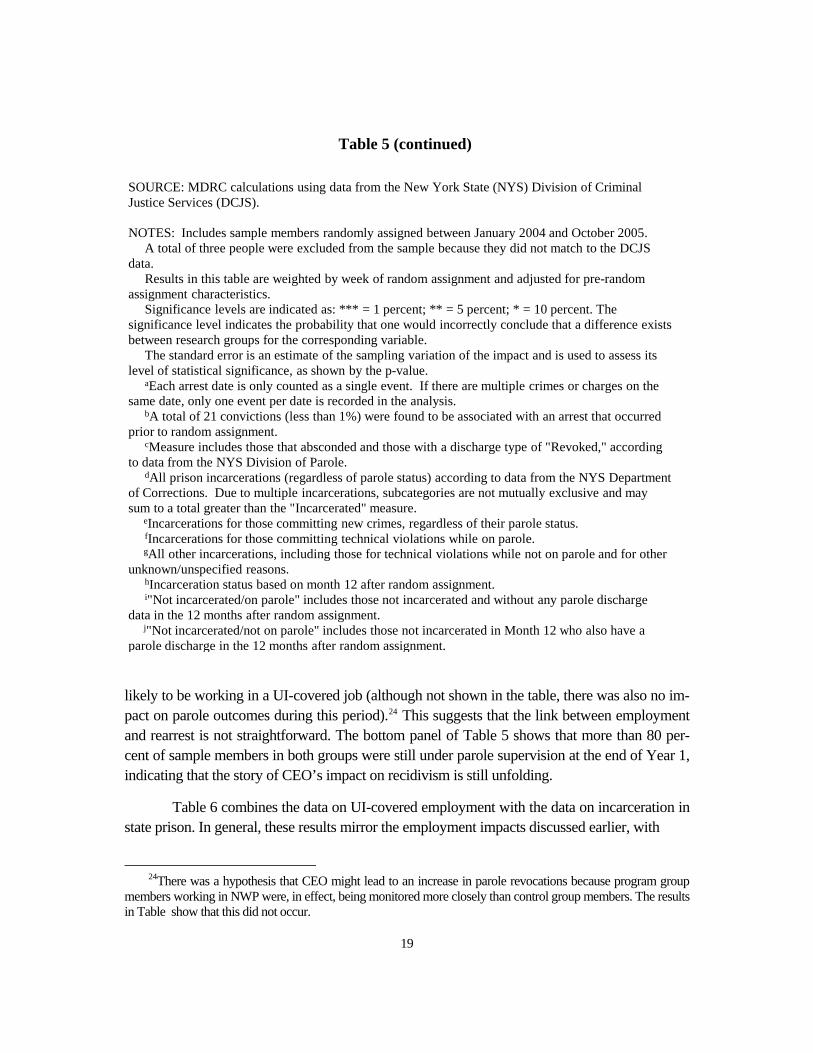
likely to be working in a UI-covered job (although not shown in the table, there was also no im-pact on parole outcomes during this period).24 This suggests that the link between employment and rearrest is not straightforward. The bottom panel of Table 5 shows that more than 80 per-cent of sample members in both groups were still under parole supervision at the end of Year 1, indicating that the story of CEO’s impact on recidivism is still unfolding.
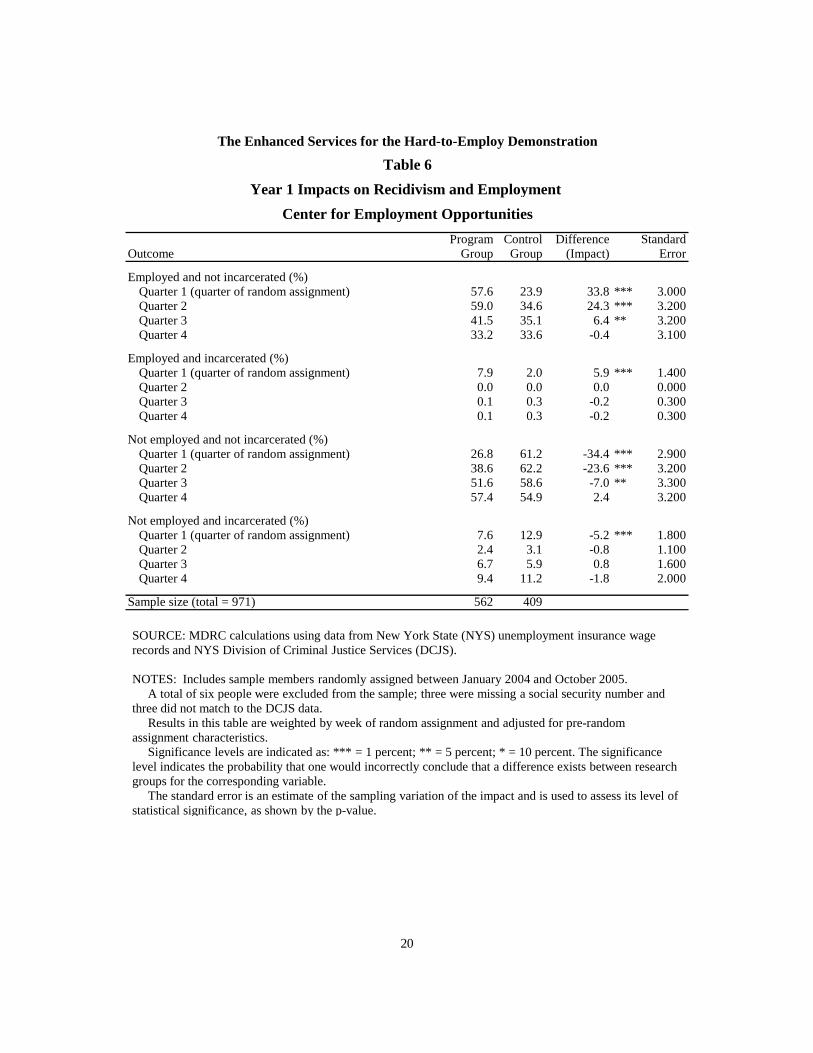
Table 6 combines the data on UI-covered employment with the data on incarceration in state prison. In general, these results mirror the employment impacts discussed earlier, with
24There was a hypothesis that CEO might lead to an increase in parole revocations because program group
members working in NWP were, in effect, being monitored more closely than control group members. The results in Table show that this did not occur.
Table 5 (continued)
SOURCE: MDRC calculations using data from the New York State (NYS) Division of Criminal Justice Services (DCJS).
NOTES: Includes sample members randomly assigned between January 2004 and October 2005.A total of three people were excluded from the sample because they did not match to the DCJS
data. Results in this table are weighted by week of random assignment and adjusted for pre-random
assignment characteristics.Significance levels are indicated as: *** = 1 percent; ** = 5 percent; * = 10 percent. The
significance level indicates the probability that one would incorrectly conclude that a difference exists between research groups for the corresponding variable.
The standard error is an estimate of the sampling variation of the impact and is used to assess its level of statistical significance, as shown by the p-value.
aEach arrest date is only counted as a single event. If there are multiple crimes or charges on the same date, only one event per date is recorded in the analysis.
bA total of 21 convictions (less than 1%) were found to be associated with an arrest that occurred prior to random assignment.
cMeasure includes those that absconded and those with a discharge type of "Revoked," according to data from the NYS Division of Parole.
dAll prison incarcerations (regardless of parole status) according to data from the NYS Department of Corrections. Due to multiple incarcerations, subcategories are not mutually exclusive and may sum to a total greater than the "Incarcerated" measure.
eIncarcerations for those committing new crimes, regardless of their parole status.fIncarcerations for those committing technical violations while on parole. gAll other incarcerations, including those for technical violations while not on parole and for other
unknown/unspecified reasons.hIncarceration status based on month 12 after random assignment. i"Not incarcerated/on parole" includes those not incarcerated and without any parole discharge
data in the 12 months after random assignment.j"Not incarcerated/not on parole" includes those not incarcerated in Month 12 who also have a
parole discharge in the 12 months after random assignment.
19
The Enhanced Services for the Hard-to-Employ Demonstration
Table 6Year 1 Impacts on Recidivism and Employment
Center for Employment OpportunitiesProgram Control Difference Standard
Outcome Group Group (Impact) Error
Employed and not incarcerated (%)Quarter 1 (quarter of random assignment) 57.6 23.9 33.8 *** 3.000Quarter 2 59.0 34.6 24.3 *** 3.200Quarter 3 41.5 35.1 6.4 ** 3.200Quarter 4 33.2 33.6 -0.4 3.100
Employed and incarcerated (%)Quarter 1 (quarter of random assignment) 7.9 2.0 5.9 *** 1.400Quarter 2 0.0 0.0 0.0 0.000Quarter 3 0.1 0.3 -0.2 0.300Quarter 4 0.1 0.3 -0.2 0.300
Not employed and not incarcerated (%)Quarter 1 (quarter of random assignment) 26.8 61.2 -34.4 *** 2.900Quarter 2 38.6 62.2 -23.6 *** 3.200Quarter 3 51.6 58.6 -7.0 ** 3.300Quarter 4 57.4 54.9 2.4 3.200
Not employed and incarcerated (%)Quarter 1 (quarter of random assignment) 7.6 12.9 -5.2 *** 1.800Quarter 2 2.4 3.1 -0.8 1.100Quarter 3 6.7 5.9 0.8 1.600Quarter 4 9.4 11.2 -1.8 2.000
Sample size (total = 971) 562 409
SOURCE: MDRC calculations using data from New York State (NYS) unemployment insurance wage records and NYS Division of Criminal Justice Services (DCJS).
NOTES: Includes sample members randomly assigned between January 2004 and October 2005.
The statistic
A total of six people were excluded from the sample; three were missing a social security number and three did not match to the DCJS data.
Results in this table are weighted by week of random assignment and adjusted for pre-random assignment characteristics.
Significance levels are indicated as: *** = 1 percent; ** = 5 percent; * = 10 percent. The significance level indicates the probability that one would incorrectly conclude that a difference exists between research groups for the corresponding variable.
standard error is an estimate of the sampling variation of the impact and is used to assess its level of al significance, as shown by the p-value.
20
large initial positive effects that diminished over time.1 It is striking that, in the last quarter of Year 1, well over half of the sample in both the program and control groups was neither employed in a UI-covered job nor in state prison. The follow-up survey and data from the New York City jail system may help to describe the circumstances of these individuals.
Results for Groups Defined by Time Since Release CEO’s program model is designed to provide immediate employment and income to ex-
prisoners in the critical weeks following release. A large majority of CEO’s overall client population comes to the program either immediately upon release or shortly thereafter.
As discussed earlier, however, a large proportion of the study sample members had been out of prison for a long time before coming to CEO. Once this became clear to the research team, there was great interest in looking at results separately for the 377 sample members who came to CEO within three months after release from state prison.2 This “recently released” group is closer to the population for whom the program was designed, and results for this group may provide better evidence about CEO’s impacts for its overall service population. More broadly, the “recently released” group better fits the usual definition of a “reentry” population, and the results for that group may help to test the widely held assumption that reentry programs are more effective if they begin working with ex-prisoners immediately after release.3
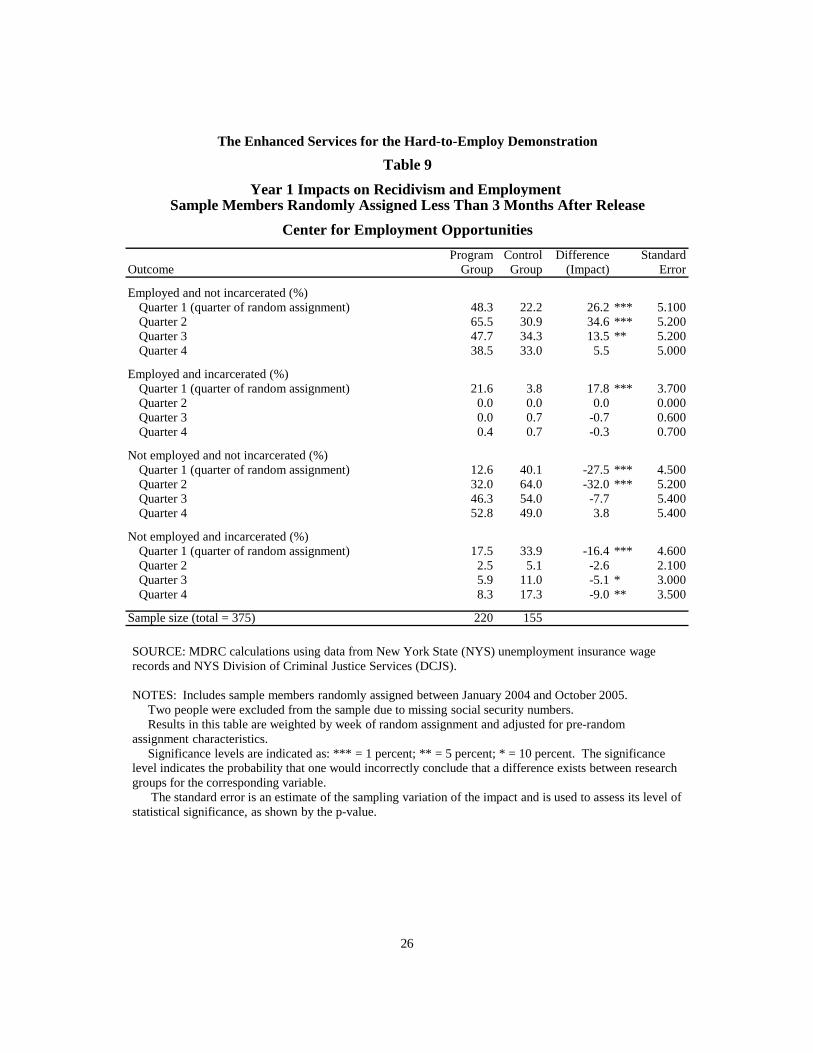
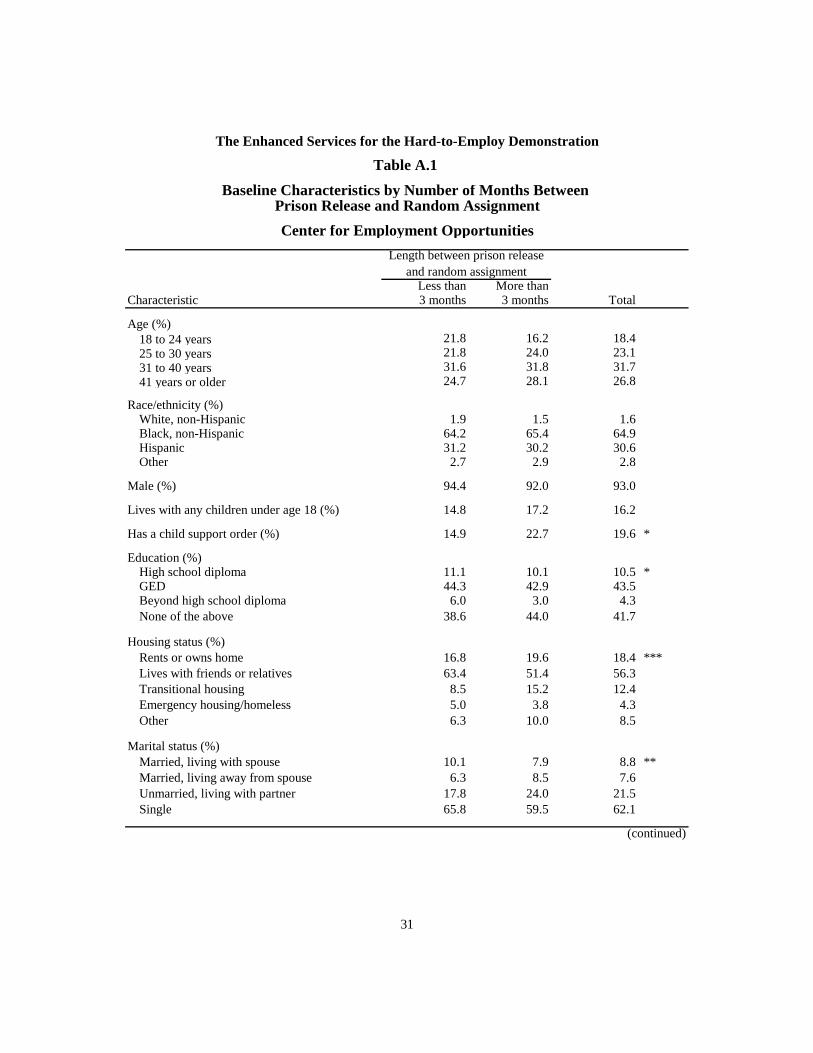
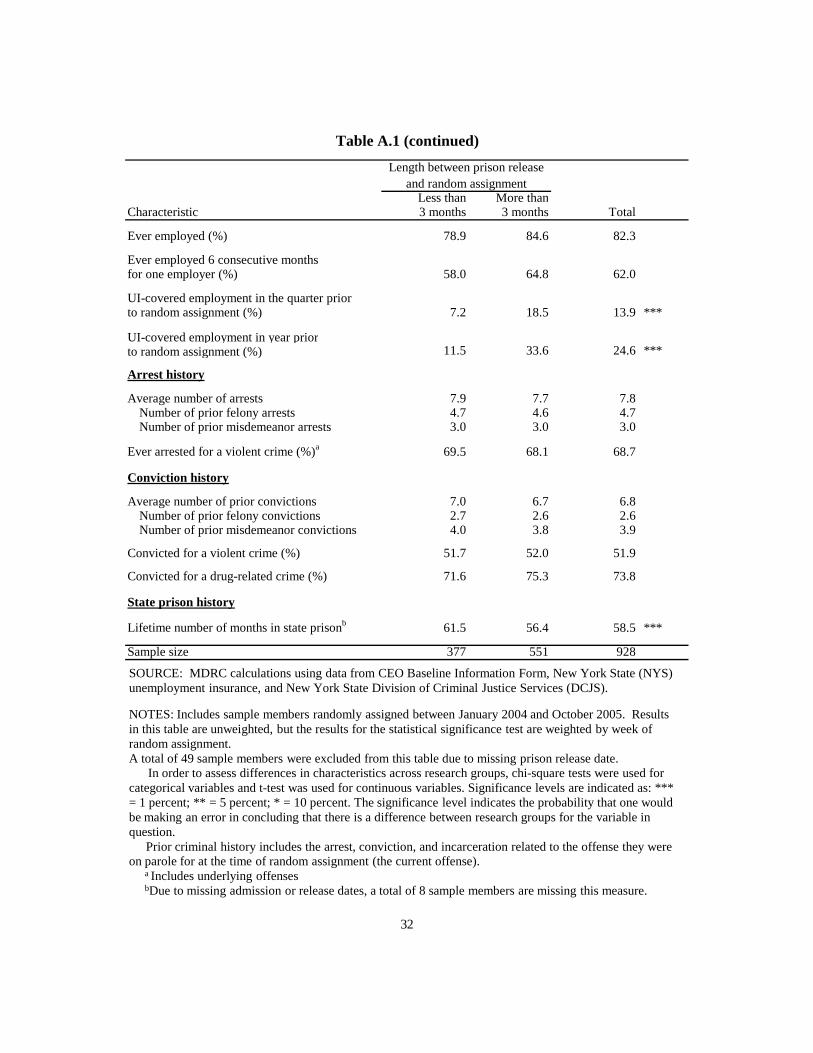
Tables 7, 8, and 9 show results for the same measures that were described above for the full sample, but focusing only on sample members who came to CEO within three months after release — that is, the “recently released” group.4 There is more uncertainty about these results because of the relatively small sample size, but the general pattern of results appears to be more positive than for the full sample, particularly with respect to recidivism outcomes. Results for the rest of the sample — those who came to CEO more than three months after release — are shown in Appendix Tables A.3-A.5, and they are less favorable.
1The status “employed and incarcerated” may seem counterintuitive. However, most of the people in this status
in Quarter 1 were released from prison and began working in an NWP job during the same calendar quarter. 2The “recently released” sample of 377 is 39 percent of the full sample of 977. However, 49 sample members
are missing the latest prison release date. Thus, as shown in Table 2, the “recently released group” accounts for 41 percent of those for whom the latest release is known.
3Appendix Table A.1 shows that the baseline characteristics of the recently released group are generally similar to those for sample members who came to CEO longer after release. However, there are some expected differences. For example, the proportion with UI-covered employment in the year prior to random assignment is 34 percent for those who came to CEO more than three months after release and only 12 percent for the recently released group. In addition, the recently released group is more likely to be living with friends or relatives and less likely to be in transitional housing. Appendix Table A.2 shows that the pattern of program participation is very similar for the two groups.
4About 43 percent of the sample members in the recently released group came to CEO within one month after release from state prison (not shown in tables).
21
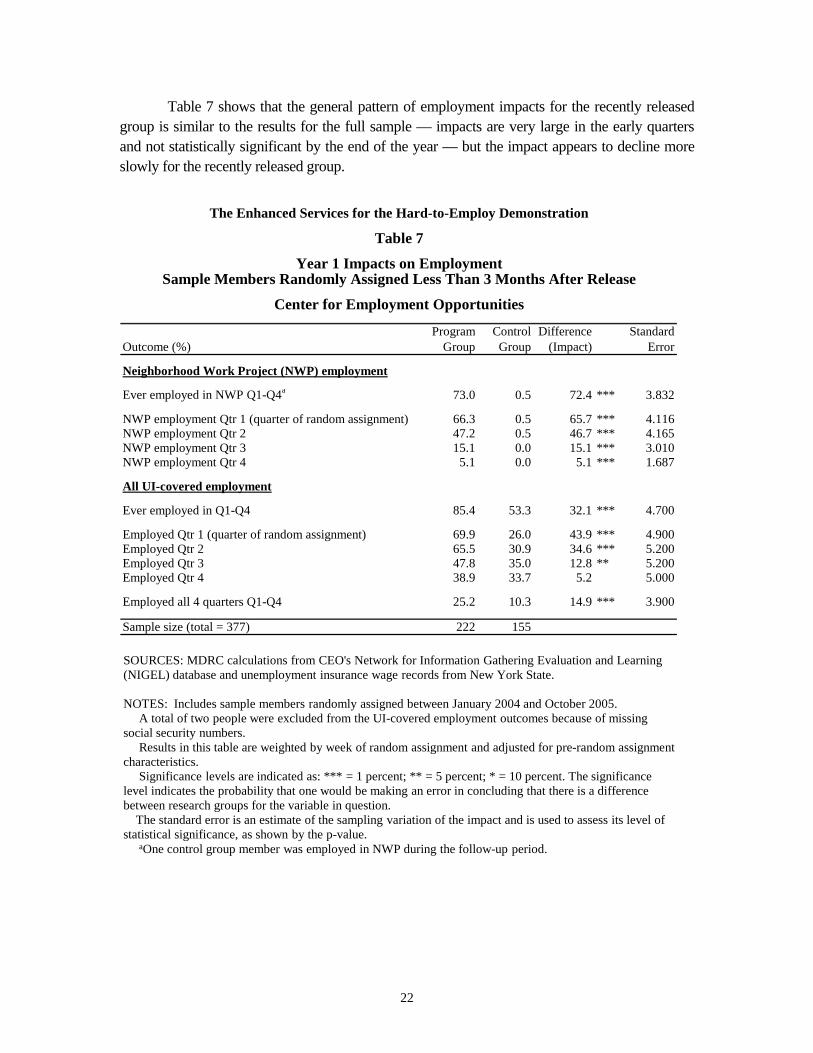
Table 7 shows that the general pattern of employment impacts for the recently released group is similar to the results for the full sample — impacts are very large in the early quarters and not statistically significant by the end of the year — but the impact appears to decline more slowly for the recently released group.
The Enhanced Services for the Hard-to-Employ Demonstration
Table 7
Year 1 Impacts on EmploymentSample Members Randomly Assigned Less Than 3 Months After Release
Center for Employment Opportunities
Program Control Difference StandardOutcome (%) Group Group (Impact) Error
Neighborhood Work Project (NWP) employment
Ever employed in NWP Q1-Q4a 73.0 0.5 72.4 *** 3.832
NWP employment Qtr 1 (quarter of random assignment) 66.3 0.5 65.7 *** 4.116NWP employment Qtr 2 47.2 0.5 46.7 *** 4.165NWP employment Qtr 3 15.1 0.0 15.1 *** 3.010NWP employment Qtr 4 5.1 0.0 5.1 *** 1.687
All UI-covered employment
Ever employed in Q1-Q4 85.4 53.3 32.1 *** 4.700
Employed Qtr 1 (quarter of random assignment) 69.9 26.0 43.9 *** 4.900Employed Qtr 2 65.5 30.9 34.6 *** 5.200Employed Qtr 3 47.8 35.0 12.8 ** 5.200Employed Qtr 4 38.9 33.7 5.2 5.000
Employed all 4 quarters Q1-Q4 25.2 10.3 14.9 *** 3.900
Sample size (total = 377) 222 155
SOURCES: MDRC calculations from CEO's Network for Information Gathering Evaluation and Learning (NIGEL) database and unemployment insurance wage records from New York State.
NOTES: Includes sample members randomly assigned between January 2004 and October 2005. A total of two people were excluded from the UI-covered employment outcomes because of missing
social security numbers. Results in this table are weighted by week of random assignment and adjusted for pre-random assignment
characteristics. Significance levels are indicated as: *** = 1 percent; ** = 5 percent; * = 10 percent. The significance
level indicates the probability that one would be making an error in concluding that there is a difference between research groups for the variable in question.
The standard error is an estimate of the sampling variation of the impact and is used to assess its level of statistical significance, as shown by the p-value.
aOne control group member was employed in NWP during the follow-up period.
22
23
The results for the recently released group are intriguing — few programs have gener-ated substantial impacts on recidivism outcomes in rigorous studies — but not yet definitive. It will be important to see whether the impacts on felony convictions and incarceration hold up
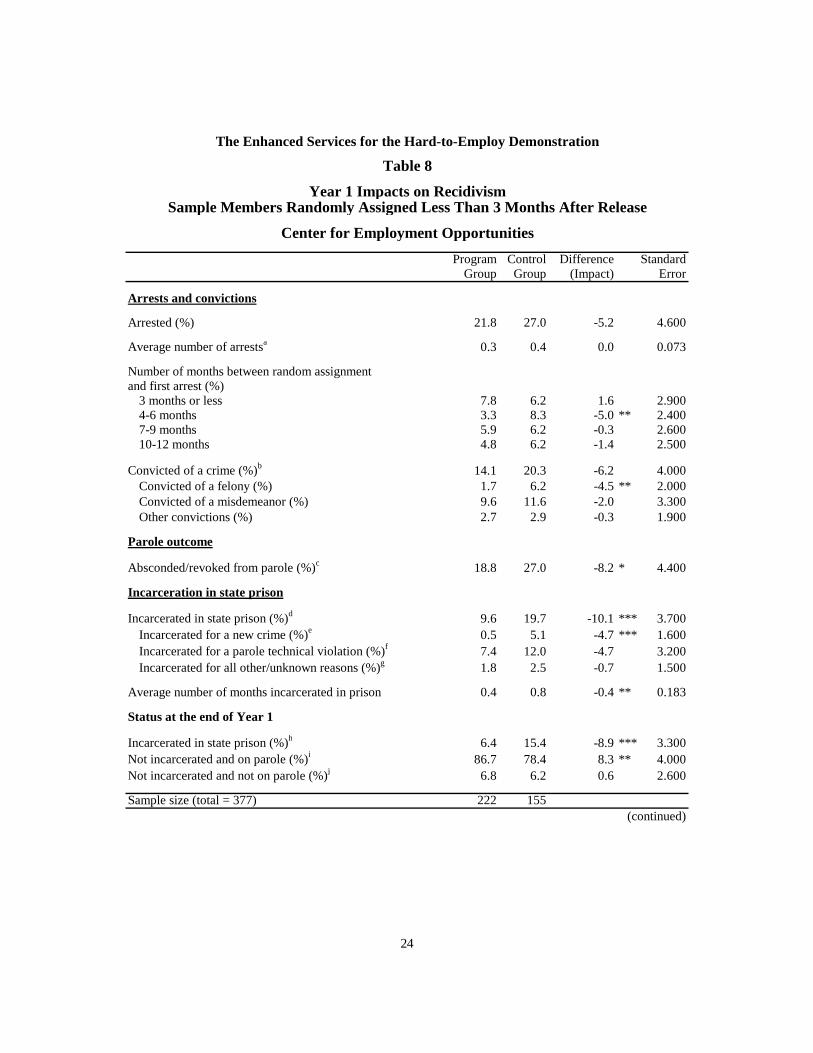
Table 8 presents recidivism measures for the recently released group. It shows that the decrease in felony convictions for the full sample, discussed earlier, is concentrated in the re-cently released group, where there is a statistically significant impact of 4.5 percentage points (though few people in either group had felony convictions). In addition, there is a statistically significant 8 percentage-point decrease in the percent of sample members whose parole status was ever classified as revoked or absconded. These two effects translate into a sizable, 10 per-centage-point decrease in overall reincarceration, as well as a 5 percentage-point decrease in the percent incarcerated for a new crime (both effects are statistically significant). There is also a decrease in the total number of months incarcerated in state prison during Year 1. Thus, at the end of Year 1, program group members in the recently released group were substantially more likely than their control group counterparts to remain under parole supervision and substantially less likely to be incarcerated.
Table 9, which combines employment and incarceration measures by quarter, shows, as expected, that CEO decreased the number of recently released people who were “not employed and incarcerated” at the end of Year 1. This table also makes clear that the impact on reincar-ceration emerged in the latter half of Year 1.
As a work program, CEO can only affect recidivism indirectly through its effects on employment. However, it is notable that a similar pattern of employment impacts for the re-cently released subgroup and for those who came to CEO later may be leading to much different patterns of impacts on recidivism. This pattern may reflect the fact that the recently released group is at higher risk of reincarceration. For example, 20 percent of control group members in the recently released group were incarcerated in state prison within one year after random as-signment, compared to 12 percent of control group members who came to CEO more than 3 months after release (see Tables 8 and A.4). Similarly, the percent incarcerated for a new crime was 5 percent for control group members in the recently released group and only 2 percent for control group members who enrolled more than three months after release. This pattern is not surprising. People who are not in the recently released group had already stayed out of prison for a lengthy period before random assignment, so one would not necessarily expect them to have a high rate of incarceration in the subsequent year. It is possible that, while both groups of participants needed assistance finding jobs, CEO’s employment help was more crucial in avoid-ing reincarceration for the group at higher risk of returning to prison. Additional analysis of this pattern of results will be included in later reports.
The Enhanced Services for the Hard-to-Employ Demonstration
Table 8
Year 1 Impacts on RecidivismSample Members Randomly Assigned Less Than 3 Months After Release
Center for Employment Opportunities
Program Control Difference StandardGroup Group (Impact) Error
Arrests and convictions
Arrested (%) 21.8 27.0 -5.2 4.600
Average number of arrestsa 0.3 0.4 0.0 0.073
Number of months between random assignment and first arres
3 mont (%)
ths or less 7.8 6.2 1.6 2.9004-6 months 3.3 8.3 -5.0 ** 2.4007-9 months 5.9 6.2 -0.3 2.60010-12 months 4.8 6.2 -1.4 2.500
Convicted of a crime (%)b 14.1 20.3 -6.2 4.000Convicted of a felony (%) 1.7 6.2 -4.5 ** 2.000Convicted of a misdemeanor (%) 9.6 11.6 -2.0 3.300Other convictions (%) 2.7 2.9 -0.3 1.900
Parole outcome
Absconded/revoked from parole (%)c 18.8 27.0 -8.2 * 4.400
Incarceration in state prison
Incarcerated in state prison (%)d 9.6 19.7 -10.1 *** 3.700Incarcerated for a new crime (%)e 0.5 5.1 -4.7 *** 1.600Incarcerated for a parole technical violation (%)f 7.4 12.0 -4.7 3.200Incarcerated for all other/unknown reasons (%)g 1.8 2.5 -0.7 1.500
Average number of months incarcerated in prison 0.4 0.8 -0.4 ** 0.183
Status at the end of Year 1
Incarcerated in state prison (%)h 6.4 15.4 -8.9 *** 3.300Not incarcerated and on parole (%)i 86.7 78.4 8.3 ** 4.000Not incarcerated and not on parole (%)j 6.8 6.2 0.6 2.600
Sample size (total = 377) 222 155(continued)
24
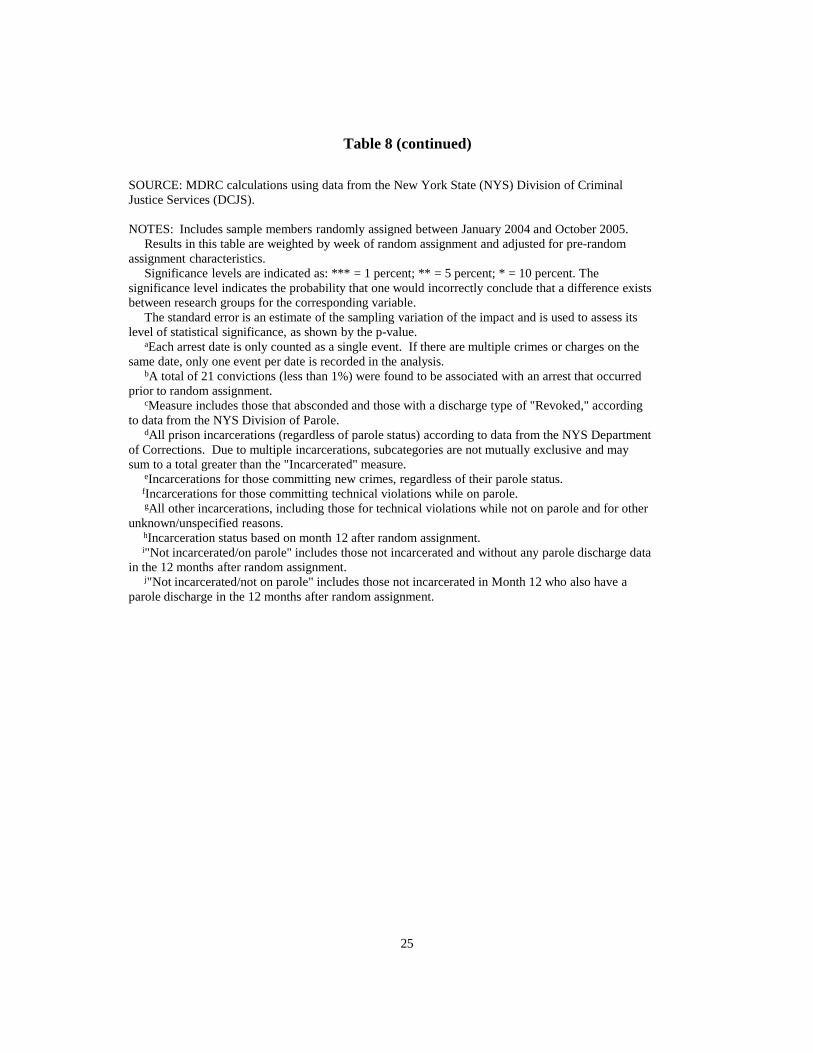
Table 8 (continued)
SOURCE: MDRC calculations using data from the New York State (NYS) Division of Criminal Justice Services (DCJS).
NOTES: Includes sample members randomly assigned between January 2004 and October 2005.Results in this table are weighted by week of random assignment and adjusted for pre-random
assignment characteristics.Significance levels are indicated as: *** = 1 percent; ** = 5 percent; * = 10 percent. The
significance level indicates the probability that one would incorrectly conclude that a difference exists between research groups for the corresponding variable.
The standard error is an estimate of the sampling variation of the impact and is used to assess its level of statistical significance, as shown by the p-value.
aEach arrest date is only counted as a single event. If there are multiple crimes or charges on the same date, only one event per date is recorded in the analysis.
bA total of 21 convictions (less than 1%) were found to be associated with an arrest that occurred prior to random assignment.
cMeasure includes those that absconded and those with a discharge type of "Revoked," according to data from the NYS Division of Parole.
dAll prison incarcerations (regardless of parole status) according to data from the NYS Department of Corrections. Due to multiple incarcerations, subcategories are not mutually exclusive and may sum to a total greater than the "Incarcerated" measure.
eIncarcerations for those committing new crimes, regardless of their parole status.fIncarcerations for those committing technical violations while on parole. gAll other incarcerations, including those for technical violations while not on parole and for other
unknown/unspecified reasons.hIncarceration status based on month 12 after random assignment. i"Not incarcerated/on parole" includes those not incarcerated and without any parole discharge data
in the 12 months after random assignment.j"Not incarcerated/not on parole" includes those not incarcerated in Month 12 who also have a
parole discharge in the 12 months after random assignment.
25
The Enhanced Services for the Hard-to-Employ Demonstration
Table 9Year 1 Impacts on Recidivism and Employment
Sample Members Randomly Assigned Less Than 3 Months After ReleaseCenter for Employment Opportunities
Program Control Difference StandardOutcome Group Group (Impact) Error
Employed and not incarcerated (%)Quarter 1 (quarter of random assignment) 48.3 22.2 26.2 *** 5.100Quarter 2 65.5 30.9 34.6 *** 5.200Quarter 3 47.7 34.3 13.5 ** 5.200Quarter 4 38.5 33.0 5.5 5.000
Employed and incarcerated (%)Quarter 1 (quarter of random assignment) 21.6 3.8 17.8 *** 3.700Quarter 2 0.0 0.0 0.0 0.000Quarter 3 0.0 0.7 -0.7 0.600Quarter 4 0.4 0.7 -0.3 0.700
Not employed and not incarcerated (%)Quarter 1 (quarter of random assignment) 12.6 40.1 -27.5 *** 4.500Quarter 2 32.0 64.0 -32.0 *** 5.200Quarter 3 46.3 54.0 -7.7 5.400Quarter 4 52.8 49.0 3.8 5.400
Not employed and incarcerated (%)Quarter 1 (quarter of random assignment) 17.5 33.9 -16.4 *** 4.600Quarter 2 2.5 5.1 -2.6 2.100Quarter 3 5.9 11.0 -5.1 * 3.000Quarter 4 8.3 17.3 -9.0 ** 3.500
Sample size (total = 375) 220 155
SOURCE: MDRC calculations using data from New York State (NYS) unemployment insurance wage records and NYS Division of Criminal Justice Services (DCJS).
NOTES: Includes sample members randomly assigned between January 2004 and October 2005. Two people were excluded from the sample due to missing social security numbers.Results in this table are weighted by week of random assignment and adjusted for pre-random
assignment characteristics.Significance levels are indicated as: *** = 1 percent; ** = 5 percent; * = 10 percent. The significance
level indicates the probability that one would incorrectly conclude that a difference exists between research groups for the corresponding variable.
The standard error is an estimate of the sampling variation of the impact and is used to assess its level of statistical significance, as shown by the p-value.
26
over a longer follow-up period (although one could argue that even a short-term delay in rein-carceration is a positive result). In addition, data on incarceration in New York City jails will provide a more complete picture of incarceration.
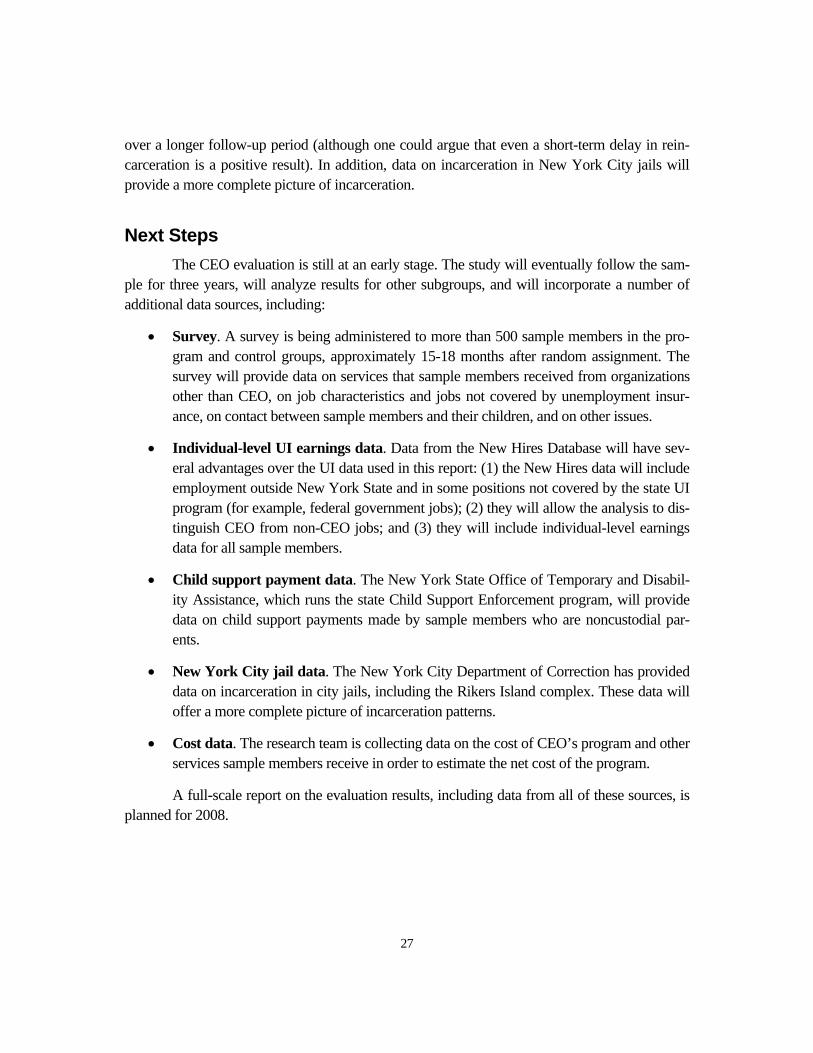
Next Steps The CEO evaluation is still at an early stage. The study will eventually follow the sam-
ple for three years, will analyze results for other subgroups, and will incorporate a number of additional data sources, including:
• Survey. A survey is being administered to more than 500 sample members in the pro-gram and control groups, approximately 15-18 months after random assignment. The survey will provide data on services that sample members received from organizations other than CEO, on job characteristics and jobs not covered by unemployment insur-ance, on contact between sample members and their children, and on other issues.
• Individual-level UI earnings data. Data from the New Hires Database will have sev-eral advantages over the UI data used in this report: (1) the New Hires data will include employment outside New York State and in some positions not covered by the state UI program (for example, federal government jobs); (2) they will allow the analysis to dis-tinguish CEO from non-CEO jobs; and (3) they will include individual-level earnings data for all sample members.
• Child support payment data. The New York State Office of Temporary and Disabil-ity Assistance, which runs the state Child Support Enforcement program, will provide data on child support payments made by sample members who are noncustodial par-ents.
• New York City jail data. The New York City Department of Correction has provided data on incarceration in city jails, including the Rikers Island complex. These data will offer a more complete picture of incarceration patterns.
• Cost data. The research team is collecting data on the cost of CEO’s program and other services sample members receive in order to estimate the net cost of the program.
A full-scale report on the evaluation results, including data from all of these sources, is planned for 2008.
27


Appendix
Supplementary Tables

The Enhanced Services for the Hard-to-Employ Demonstration
Table A.1 Baseline Characteristics by Number of Months Between
Prison Release and Random AssignmentCenter for Employment Opportunities
Less than More thanCharacteristic 3 months 3 months Total
Age (%)18 to 24 years 21.8 16.2 18.425 to 30 years 21.8 24.0 23.131 to 40 years 31.6 31.8 31.741 years or older 24.7 28.1 26.8
Race/ethnicity (%)White, non-Hispanic 1.9 1.5 1.6Black, non-Hispanic 64.2 65.4 64.9Hispanic 31.2 30.2 30.6Other 2.7 2.9 2.8
Male (%) 94.4 92.0 93.0
Lives with any children under age 18 (%) 14.8 17.2 16.2
Has a child support order (%) 14.9 22.7 19.6 *
Education (%)High school diploma 11.1 10.1 10.5 *GED 44.3 42.9 43.5Beyond high school diploma 6.0 3.0 4.3None of the above 38.6 44.0 41.7
Housing status (%)Rents or owns home 16.8 19.6 18.4 ***Lives with friends or relatives 63.4 51.4 56.3Transitional housing 8.5 15.2 12.4Emergency housing/homeless 5.0 3.8 4.3Other 6.3 10.0 8.5
Marital status (%)Married, living with spouse 10.1 7.9 8.8 **Married, living away from spouse 6.3 8.5 7.6Unmarried, living with partner 17.8 24.0 21.5Single 65.8 59.5 62.1
(continued)
Length between prison release and random assignment
31
32
Table A.1 (continued)
Less than More thanCharacteristic 3 months 3 months Total
Ever employed (%) 78.9 84.6 82.3
Ever employed 6 consecutive months for one employer (%) 58.0 64.8 62.0
UI-covered employment in the quarter prior to random assignment (%) 7.2 18.5 13.9 ***
UI-covered employment in year priorto random assignment (%) 11.5 33.6 24.6 ***
Arrest history
Average number of arrests 7.9 7.7 7.8Number of prior felony arrests 4.7 4.6 4.7Number of prior misdemeanor arrests 3.0 3.0 3.0
Ever arrested for a violent crime (%)a 69.5 68.1 68.7
Conviction history
Average number of prior convictions 7.0 6.7 6.8Number of prior felony convictions 2.7 2.6 2.6Number of prior misdemeanor convictions 4.0 3.8 3.9
Convicted for a violent crime (%) 51.7 52.0 51.9
Convicted for a drug-related crime (%) 71.6 75.3 73.8
State prison history
Lifetime number of months in state prisonb 61.5 56.4 58.5 ***
Sample size 377 551 928
Length between prison release and random assignment
SOURCE: MDRC calculations using data from CEO Baseline Information Form, New York State (NYS) unemployment insurance, and New York State Division of Criminal Justice Services (DCJS).
NOTES: Includes sample members randomly assigned between January 2004 and October 2005. Results in this table are unweighted, but the results for the statistical significance test are weighted by week of random assignment.A total of 49 sample members were excluded from this table due to missing prison release date.
In order to assess differences in characteristics across research groups, chi-square tests were used for categorical variables and t-test was used for continuous variables. Significance levels are indicated as: *** = 1 percent; ** = 5 percent; * = 10 percent. The significance level indicates the probability that one would be making an error in concluding that there is a difference between research groups for the variable in question.
Prior criminal history includes the arrest, conviction, and incarceration related to the offense they were on parole for at the time of random assignment (the current offense).
a Includes underlying offensesbDue to missing admission or release dates, a total of 8 sample members are missing this measure.
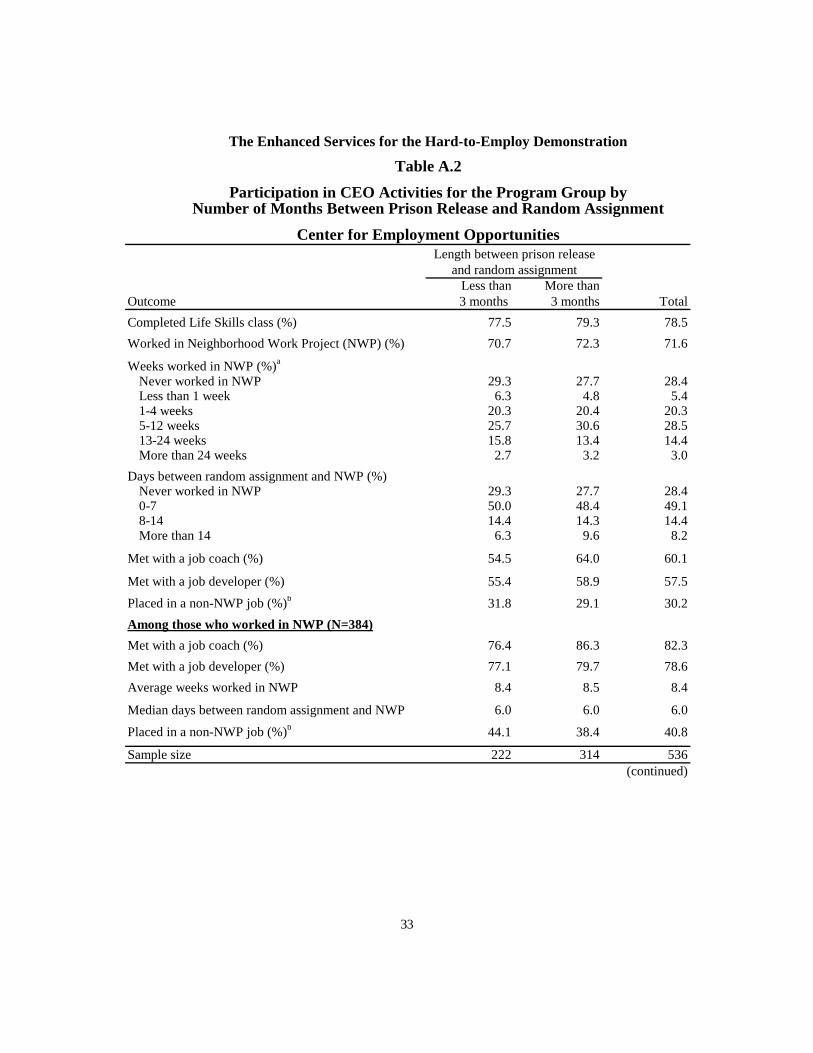
The Enhanced Services for the Hard-to-Employ Demonstration
Table A.2
Participation in CEO Activities for the Program Group byNumber of Months Between Prison Release and Random Assignment
Center for Employment Opportunities
Less than More thanOutcome 3 months 3 months TotalCompleted Life Skills class (%) 77.5 79.3 78.5Worked in Neighborhood Work Project (NWP) (%) 70.7 72.3 71.6
Weeks worked in NWP (%)a
Never worked in NWP 29.3 27.7 28.4Less than 1 week 6.3 4.8 5.41-4 weeks 20.3 20.4 20.35-12 weeks 25.7 30.6 28.513-24 weeks 15.8 13.4 14.4More than 24 weeks 2.7 3.2 3.0
Days between random assignment and NWP (%)Never worked in NWP 29.3 27.7 28.40-7 50.0 48.4 49.18-14 14.4 14.3 14.4More than 14 6.3 9.6 8.2
Met with a job coach (%) 54.5 64.0 60.1
Met with a job developer (%) 55.4 58.9 57.5
Placed in a non-NWP job (%)b 31.8 29.1 30.2Among those who worked in NWP (N=384)Met with a job coach (%) 76.4 86.3 82.3Met with a job developer (%) 77.1 79.7 78.6Average weeks worked in NWP 8.4 8.5 8.4
Median days between random assignment and NWP 6.0 6.0 6.0
Placed in a non-NWP job (%)b 44.1 38.4 40.8
Sample size 222 314 536(continued)
Length between prison releaseand random assignment
33
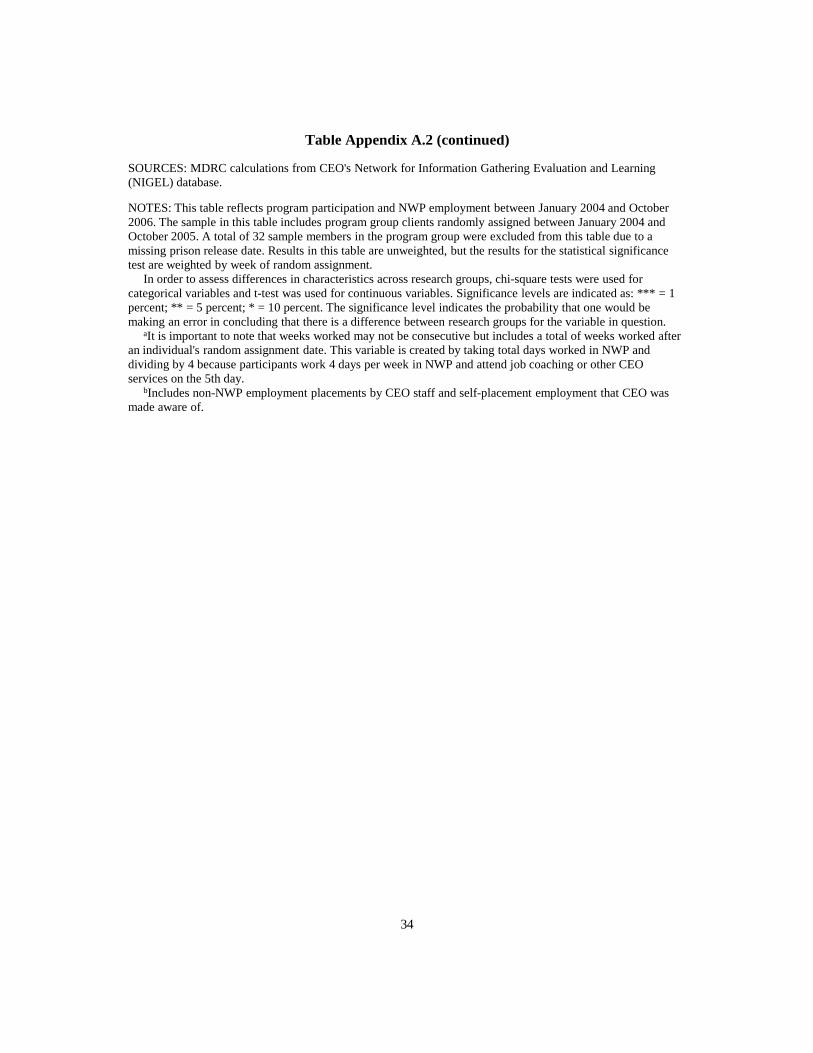
Table Appendix A.2 (continued)
SOURCES: MDRC calculations from CEO's Network for Information Gathering Evaluation and Learning (NIGEL) database.
NOTES: This table reflects program participation and NWP employment between January 2004 and October 2006. The sample in this table includes program group clients randomly assigned between January 2004 and October 2005. A total of 32 sample members in the program group were excluded from this table due to a missing prison release date. Results in this table are unweighted, but the results for the statistical significance test are weighted by week of random assignment.
In order to assess differences in characteristics across research groups, chi-square tests were used for categorical variables and t-test was used for continuous variables. Significance levels are indicated as: *** = 1 percent; ** = 5 percent; * = 10 percent. The significance level indicates the probability that one would be making an error in concluding that there is a difference between research groups for the variable in question.
aIt is important to note that weeks worked may not be consecutive but includes a total of weeks worked after an individual's random assignment date. This variable is created by taking total days worked in NWP and dividing by 4 because participants work 4 days per week in NWP and attend job coaching or other CEO services on the 5th day.
bIncludes non-NWP employment placements by CEO staff and self-placement employment that CEO was made aware of.
34

The Enhanced Services for the Hard-to-Employ Demonstration
Table A.3Year 1 Impacts on Employment
Sample Members Randomly Assigned More Than 3 Months After Release
Center for Employment Opportunities
Program Control Difference StandardOutcome (%) Group Group (Impact) Error
Neighborhood Work Project (NWP) employment
Ever employed in NWP Q1-Q4 a 67.9 3.6 64.3 *** 3.194
NWP employment Qtr 1 (quarter of random assignment) 62.1 2.3 59.8 *** 3.223NWP employment Qtr 2 41.6 2.3 39.3 *** 3.254NWP employment Qtr 3 13.2 0.1 13.1 *** 2.168NWP employment Qtr 4 5.9 0.9 5.0 *** 1.600
All UI-covered employment
Ever employed in Q1-Q4 77.7 56.2 21.5 *** 3.900
Employed Qtr 1 (quarter of random assignment) 65.4 24.7 40.7 *** 3.800Employed Qtr 2 56.9 35.5 21.4 *** 4.200Employed Qtr 3 39.2 35.1 4.1 4.200Employed Qtr 4 31.3 33.8 -2.5 4.100
Employed all 4 quarters Q1-Q4 22.2 10.5 11.7 *** 3.300
Sample size (total = 551) 314 237
SOURCES: MDRC calculations from CEO's Network for Information Gathering Evaluation and Learning (NIGEL) database and unemployment insurance wage records from New York State.
NOTES: Includes sample members randomly assigned between January 2004 and October 2005. Results in this table are weighted by week of random assignment and adjusted for pre-random
assignment characteristics. Significance levels are indicated as: *** = 1 percent; ** = 5 percent; * = 10 percent. The significance
level indicates the probability that one would be making an error in concluding that there is a difference between research groups for the variable in question.
The standard error is an estimate of the sampling variation of the impact and is used to assess its level of statistical significance, as shown by the p-value.
aNine control group members were employed in NWP during the follow-up period.
35
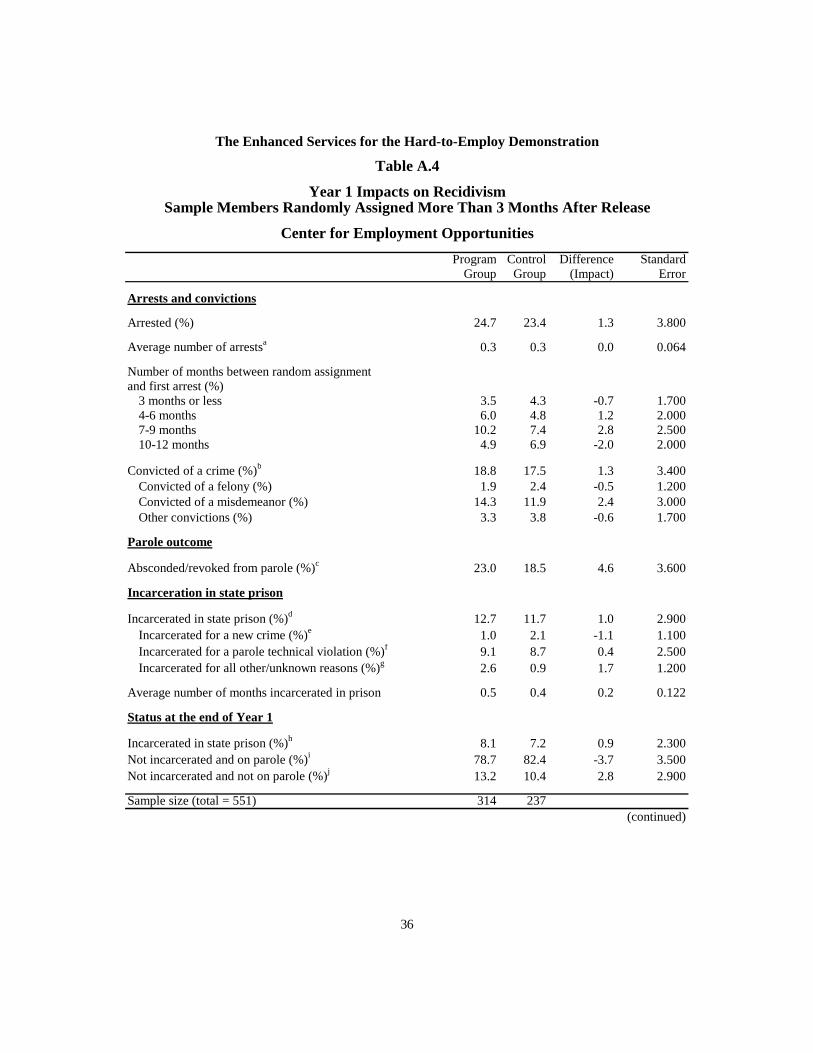
The Enhanced Services for the Hard-to-Employ Demonstration
Table A.4
Year 1 Impacts on RecidivismSample Members Randomly Assigned More Than 3 Months After Release
Center for Employment OpportunitiesProgram Control Difference Standard
Group Group (Impact) Error
Arrests and convictions
Arrested (%) 24.7 23.4 1.3 3.800
Average number of arrestsa 0.3 0.3 0.0 0.064
Number of months between random assignment and first arrest (%)
3 months or less 3.5 4.3 -0.7 1.7004-6 months 6.0 4.8 1.2 2.0007-9 months 10.2 7.4 2.8 2.50010-12 months 4.9 6.9 -2.0 2.000
Convicted of a crime (%)b 18.8 17.5 1.3 3.400Convicted of a felony (%) 1.9 2.4 -0.5 1.200Convicted of a misdemeanor (%) 14.3 11.9 2.4 3.000Other convictions (%) 3.3 3.8 -0.6 1.700
Parole outcome
Absconded/revoked from parole (%)c 23.0 18.5 4.6 3.600
Incarceration in state prison
Incarcerated in state prison (%)d 12.7 11.7 1.0 2.900Incarcerated for a new crime (%)e 1.0 2.1 -1.1 1.100Incarcerated for a parole technical violation (%)f 9.1 8.7 0.4 2.500Incarcerated for all other/unknown reasons (%)g 2.6 0.9 1.7 1.200
Average number of months incarcerated in prison 0.5 0.4 0.2 0.122
Status at the end of Year 1
Incarcerated in state prison (%)h 8.1 7.2 0.9 2.300Not incarcerated and on parole (%)i 78.7 82.4 -3.7 3.500Not incarcerated and not on parole (%)j 13.2 10.4 2.8 2.900
Sample size (total = 551) 314 237(continued)
36
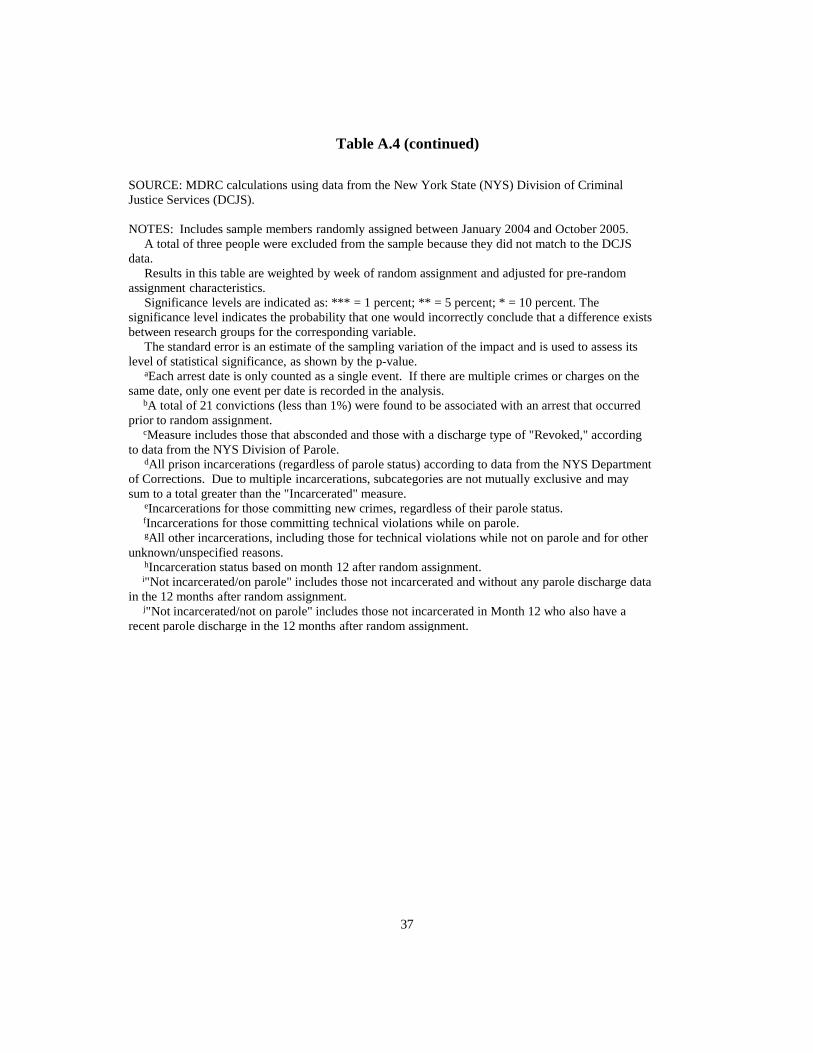
Table A.4 (continued)
SOURCE: MDRC calculations using data from the New York State (NYS) Division of Criminal Justice Services (DCJS).
NOTES: Includes sample members randomly assigned between January 2004 and October 2005.A total of three people were excluded from the sample because they did not match to the DCJS
data. Results in this table are weighted by week of random assignment and adjusted for pre-random
assignment characteristics.Significance levels are indicated as: *** = 1 percent; ** = 5 percent; * = 10 percent. The
significance level indicates the probability that one would incorrectly conclude that a difference exists between research groups for the corresponding variable.
The standard error is an estimate of the sampling variation of the impact and is used to assess its level of statistical significance, as shown by the p-value.
aEach arrest date is only counted as a single event. If there are multiple crimes or charges on the same date, only one event per date is recorded in the analysis.
bA total of 21 convictions (less than 1%) were found to be associated with an arrest that occurred prior to random assignment.
cMeasure includes those that absconded and those with a discharge type of "Revoked," according to data from the NYS Division of Parole.
dAll prison incarcerations (regardless of parole status) according to data from the NYS Department of Corrections. Due to multiple incarcerations, subcategories are not mutually exclusive and may sum to a total greater than the "Incarcerated" measure.
eIncarcerations for those committing new crimes, regardless of their parole status.fIncarcerations for those committing technical violations while on parole. gAll other incarcerations, including those for technical violations while not on parole and for other
unknown/unspecified reasons.hIncarceration status based on month 12 after random assignment.
i"Not incarcerated/on parole" includes those not incarcerated and without any parole discharge data in the 12 months after random assignment.
j"Not incarcerated/not on parole" includes those not incarcerated in Month 12 who also have a recent parole discharge in the 12 months after random assignment.
37
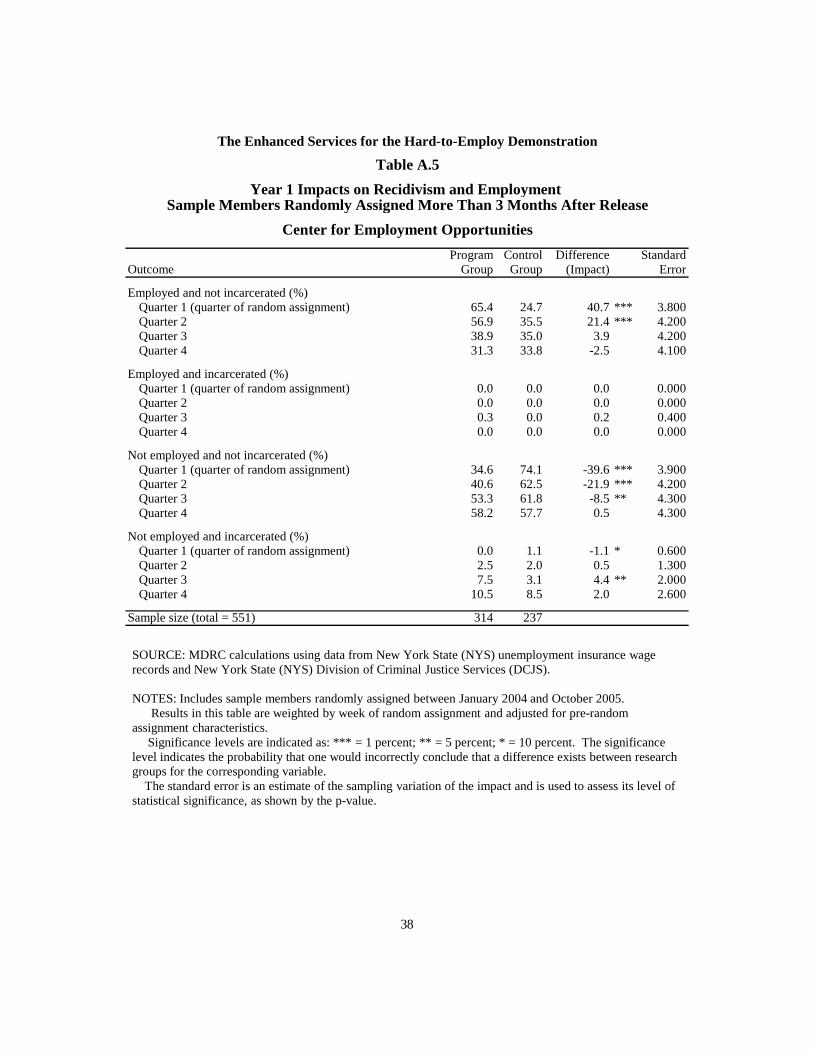
The Enhanced Services for the Hard-to-Employ Demonstration
Table A.5Year 1 Impacts on Recidivism and Employment
Sample Members Randomly Assigned More Than 3 Months After ReleaseCenter for Employment Opportunities
Program Control Difference StandardOutcome Group Group (Impact) Error
Employed and not incarcerated (%)Quarter 1 (quarter of random assignment) 65.4 24.7 40.7 *** 3.800Quarter 2 56.9 35.5 21.4 *** 4.200Quarter 3 38.9 35.0 3.9 4.200Quarter 4 31.3 33.8 -2.5 4.100
Employed and incarcerated (%)Quarter 1 (quarter of random assignment) 0.0 0.0 0.0 0.000Quarter 2 0.0 0.0 0.0 0.000Quarter 3 0.3 0.0 0.2 0.400Quarter 4 0.0 0.0 0.0 0.000
Not employed and not incarcerated (%)Quarter 1 (quarter of random assignment) 34.6 74.1 -39.6 *** 3.900Quarter 2 40.6 62.5 -21.9 *** 4.200Quarter 3 53.3 61.8 -8.5 ** 4.300Quarter 4 58.2 57.7 0.5 4.300
Not employed and incarcerated (%)Quarter 1 (quarter of random assignment) 0.0 1.1 -1.1 * 0.600Quarter 2 2.5 2.0 0.5 1.300Quarter 3 7.5 3.1 4.4 ** 2.000Quarter 4 10.5 8.5 2.0 2.600
Sample size (total = 551) 314 237
SOURCE: MDRC calculations using data from New York State (NYS) unemployment insurance wage records and New York State (NYS) Division of Criminal Justice Services (DCJS).
NOTES: Includes sample members randomly assigned between January 2004 and October 2005. Results in this table are weighted by week of random assignment and adjusted for pre-random
assignment characteristics.Significance levels are indicated as: *** = 1 percent; ** = 5 percent; * = 10 percent. The significance
level indicates the probability that one would incorrectly conclude that a difference exists between research groups for the corresponding variable.
The standard error is an estimate of the sampling variation of the impact and is used to assess its level of statistical significance, as shown by the p-value.
38
39
References
Harer, Miles. 1994. Recidivism Among Federal Prisoners Released in 1987. Washington DC: Federal Bureau of Prisons.
Hirsch, Amy, Sharon Dietrich, Rue Landau, Peter Schneider, Irv Ackelsberg, Judith Bernstein, and Joseph Hohenstein. 2002. Every Door Closed: Barriers Facing Parents with Criminal Records. Washington DC: Center for Law and Social Policy and Community Legal Ser-vices of Philadelphia.
Holzer, Harry, Steven Raphael, and Michael Stoll. 2004. “Will Employers Hire Former Offend-ers?” In Mary Pattillo, David Weiman, and Bruce Western (eds.), Imprisoning America. New York: Russell Sage Foundation.
Langan, Patrick and Daniel Levin. 2002. Recidivism of Prisoners Released in 1994. Washington DC: Bureau of Justice Statistics, U.S. Department of Justice.
National Association of State Budget Officers. 2006. State Expenditure Report: Fiscal Year 2005. Washington DC: Author.
Pager, Devah. March 2003. “The Mark of a Criminal Record.” American Journal of Sociology 108, 5: 937-75.
Petersilia, Joan. 2003. When Prisoners Come Home: Parole and Prisoner Reentry. New York: Oxford University Press.
Reentry Policy Council. 2005. Report of the Reentry Policy Council. New York: Council of State Governments.
Travis, Jeremy and Michelle Waul. 2004. Prisoners Once Removed: The Impact of Incarcera-tion and Reentry on Children, Families and Communities. Washington DC: Urban Institute.
Uggen, Christoper. 2000. “Work as a Turning Point in the Life Course of Criminals.” American Sociological Review 67: 529-546.
Visher, Christy, Vera Kachnowski, Nancy La Vigne, and Jeremy Travis. 2004. Baltimore Pris-oners’ Experiences Returning Home. Washington DC: The Urban Institute.

About MDRC
what ng of low-income people. Through its research and the ac-
edu
Fou ed in New York City and Oakland, California, MDRC is best known
Its peval mmunity initiatives. MDRC’s staff bring an unusual
tion, and management. MDRC seeks to learn not just whet
the — in order to build knowledge about what works across
tive broad audience in the policy and practitioner community as well as with the
Over ght its unique approach to an ever-growing range of policy ar-
gram lso studying public school reforms, employment programs for ex-
coll
Improving Public Education
Supporting Low-Wage Workers and Communities
Overcoming Barriers to Employment
Working in almost every state, all of the nation’s largest cities, and Canada and the United Kingdom, MDRC conducts its projects in partnership with national, state, and local govern-ments, public school systems, community organizations, and numerous private philanthropies.
MDRC is a nonprofit, nonpartisan social policy research organization dedicated to learning works to improve the well-bei
tive communication of its findings, MDRC seeks to enhance the effectiveness of social and cation policies and programs.
nded in 1974 and locatfor mounting rigorous, large-scale, real-world tests of new and existing policies and programs.
rojects are a mix of demonstrations (field tests of promising new program approaches) and uations of ongoing government and co
combination of research and organizational experience to their work, providing expertise on the latest in qualitative and quantitative methods and on program design, development, implementa-
her a program is effective but also how and why the program’s effects occur. In addition, it tries to place each project’s findings in
broader context of related researchthe social and education policy fields. MDRC’s findings, lessons, and best practices are proac-
ly shared with a general public and the media.
the years, MDRC has broueas and target populations. Once known primarily for evaluations of state welfare-to-work pro-
s, today MDRC is aoffenders and people with disabilities, and programs to help low-income students succeed in
ege. MDRC’s projects are organized into five areas:
Promoting Family Well-Being and Child Development
Promoting Successful Transitions to Adulthood