Transition probabilities and quadrupole deformations measured...
17
Nuclear Physics A568 (1994) 306-322 North-Holland NUCLEAR PHYSICS A Transition probabilities and quadrupole deformations measured in “‘Cd I. Thorslund a, C. Fahlander ‘, J. Nyberg a*b, M. Piiparinen b,c, R. Julin ‘, S. Juutinen ‘, A. Virtanen ‘, D. Miiller ‘, H. Jensen b, M. Sugawara ‘,’ a Department of Radiation Sciences and The Svedberg Laboratory, Uppsala University, Box 533, S-75121 Uppsala, Sweden b The Niels Bohr Institute, Tandem Accelerator Laboratory, University of Copenhagen, DK-4000 Roskilde, Denmark ’ Department of Physics, University of Jyviiskylii, SF-40100 Jyviiskyl~, Finland Received 15 June 1993 Abstract Mean lifetimes of 19 states have been measured in l”sCd using the recoil-distance method and the NORDBALL multi-detector array in a coincidence-plunger experiment. The reduced transition probabilities have been determined from the measured lifetimes using previously measured branching ratios, and the deformation parameter pz has been calculated for several bands. The experimental results have been compared to equilibrium deformations obtained by total routhian surface calculations. Key words: NUCLEAR REACTION ‘00Mo(‘2C,4n), E = 54 MeV, measured E,, I,, yy-coin, lifetimes 7; deduced B(E2) values, deformation &. Enriched targets, array of Compton-sup- pressed Ge-detectors, plunger, TRS calculations. 1. Introduction The important role of the neutron hi,,, negative-parity orbital in the structure of “‘Cd has recently been discussed thoroughly in ref. [l], where a level scheme is presented including an yrast band observed up to spin 24+ and nine quasi-rota- tional side bands. The interplay between the Vh11,2 orbital and the other orbitals lying close to the neutron and proton Fermi levels in “‘Cd is strongly dependent on the quadrupole deformation of the nucleus. Knowledge of this deformation is important in the understanding of the contributions from different configurations. One of the most sensitive probes of quadrupole deformation is the electric t Permanent address: Chiba Institute of Technology, Shibazono, Narashino 275, Japan. 03759474/94/$07.00 0 1994 - Elsevier Science B.V. All rights reserved SSDZ 0375-9474(93)E0451-D
Transcript of Transition probabilities and quadrupole deformations measured...
Nuclear Physics A568 (1994) 306-322 North-Holland
NUCLEAR PHYSICS A
Transition probabilities and quadrupole deformations measured in “‘Cd
I. Thorslund a, C. Fahlander ‘, J. Nyberg a*b, M. Piiparinen b,c, R. Julin ‘, S. Juutinen ‘, A. Virtanen ‘, D. Miiller ‘, H. Jensen b, M. Sugawara ‘,’
a Department of Radiation Sciences and The Svedberg Laboratory, Uppsala University, Box 533, S-75121 Uppsala, Sweden b The Niels Bohr Institute, Tandem Accelerator Laboratory, University of Copenhagen, DK-4000 Roskilde, Denmark ’ Department of Physics, University of Jyviiskylii, SF-40100 Jyviiskyl~, Finland
Received 15 June 1993
Abstract Mean lifetimes of 19 states have been measured in l”sCd using the recoil-distance method and
the NORDBALL multi-detector array in a coincidence-plunger experiment. The reduced transition probabilities have been determined from the measured lifetimes using previously measured branching ratios, and the deformation parameter pz has been calculated for several bands. The experimental results have been compared to equilibrium deformations obtained by total routhian surface calculations.
Key words: NUCLEAR REACTION ‘00Mo(‘2C,4n), E = 54 MeV, measured E,, I,, yy-coin, lifetimes 7; deduced B(E2) values, deformation &. Enriched targets, array of Compton-sup- pressed Ge-detectors, plunger, TRS calculations.
1. Introduction
The important role of the neutron hi,,, negative-parity orbital in the structure of “‘Cd has recently been discussed thoroughly in ref. [l], where a level scheme is presented including an yrast band observed up to spin 24+ and nine quasi-rota- tional side bands. The interplay between the Vh11,2 orbital and the other orbitals lying close to the neutron and proton Fermi levels in “‘Cd is strongly dependent on the quadrupole deformation of the nucleus. Knowledge of this deformation is important in the understanding of the contributions from different configurations. One of the most sensitive probes of quadrupole deformation is the electric
t Permanent address: Chiba Institute of Technology, Shibazono, Narashino 275, Japan.
03759474/94/$07.00 0 1994 - Elsevier Science B.V. All rights reserved SSDZ 0375-9474(93)E0451-D
quadrupole transition probability, which also indicates whether a state is of collective or single-particle nature. In order to deduce these values for the bands reported in ref. [l] we have performed a lifetime measurement using the recoil-dis- tance method.
2. Experimental methods
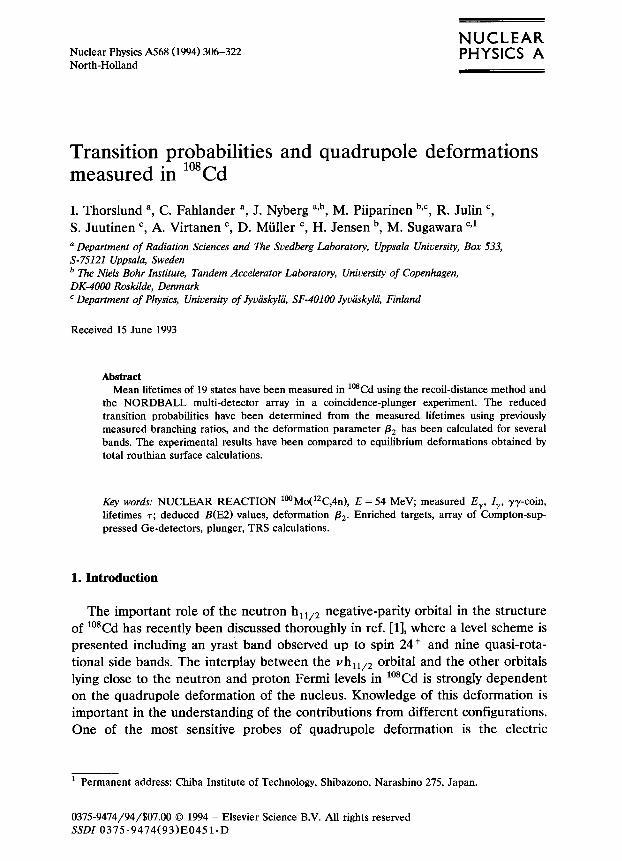
Mean lifetimes in 108Cd have been measured using the Doppler-shim recoil-dis- tance method, RDM, in a coincidence-plunger experiment at the Tandem Acceler- ator Laboratory of the Niels Bohr Institute in Denmark. A specially designed plunger, using three DC motors to control the target-stopper distance, was mounted in the NORDBALL multi-detector array [2] as shown in Fig. 1. A detailed description of the plunger and the RDM can be found in ref. [3]. NORDBALL consists of 20 ~ompton-suppressed Ge detectors situated in four rings at the angles 19 = 37”, 79”, 101’ and 143” measured relative to the beam direction, with five detectors in each ring. The detector array also included 39 BaF, detectors allowing for measurements of y-ray sum energy and multiplicity, as well as for fast timing. The states were populated in the 1ooMo(12C,4n)108Cd reaction using a i2C beam at an energy of 54 MeV and a current of N 10 pnA
The Plunger mounted in NORDBALL
actuator housing vacuum chamber
Fig. 1. A cross section of the plunger mounted in the NORIXMLL multi-detector array (from ref. [3J).

4:
mcrgy (kcv j Fig. 2. Srrm of the gates 794.0 and 955.3 keV from the forward detector ring (@ = 379) shown at three different target-stopper distances. ‘T&e shifted @I and unshifted (u) components are marked in the
figures.

0 65a MO 670 660 690 700 710
Etlergy (kav) Fig. 3. Sum of the gates 166.J and 248.4 keV from the fmward detector ring f@ = 370) shown at three different target-stopper distatxces. The shifted (S) and unshifted (WI components are marked in the
figures.

310 I. Thorslund et al. / Transition probabilities
from the tandem accelerator. The target consisted of a highly enriched (97.4%) self-supporting ““‘MO foil of thickness 0.59 mg/cm2, and the recoiling nuclei were stopped in an 8.9 mg/cm2 thick ig7Au foil. The recoil velocity, determined from
the Doppler shift of several strong y-ray lines in spectra from the forward (19 = 37”) and backward (f3 = 143”) rings, was v/c = 0.83(4)%. A total number of 284 million yy-coincidence events, distributed over 20 target-stopper distances from 6 pm to 3000 urn, were collected in the experiment. In the experiment reported on in ref. [l] the g6Zr(‘60,4n)‘08Cd reaction was used with a beam energy around 75 MeV. This reaction would have given a higher recoil velocity, and thereby a better energy separation between the shifted and unshifted peaks, but it was not possible to produce a stretched foil for plunger measurements from g6Zr. A run with a target consisting of 0.54 mg/cm 2 “‘MO evaporated on a 6.8 mg/cm2 thick lg7Au backing was also performed.
Figs. 2 and 3 show two examples of summed coincidence spectra detected in the forward ring at three different target-stopper distances. The shifted (S) and unshifted (U) components, corresponding to the decay of a level while the recoil is in flight between the target and the stopper, and at rest in the stopper, respec- tively, are marked for two transitions in each spectrum. The relation between these two components as a function of the target-stopper distance yields information about the lifetime of the decaying level. The spectra indicate that the 556.4 and 703.2 keV transitions are faster than the 469.6 and 648.6 keV transitions, respec- tively, since the unshifted peaks disappear at shorter distances for the former transitions. For levels with lifetimes longer than the flight time of the recoil between the target and the stopper, only the unshifted component will occur in the spectra as can be seen for the transitions at 456.1 and 667.6 keV. The peak at 516 keV in Fig. 2 includes two transitions depopulating levels with different lifetimes, which explains the somewhat strange shape of this peak at the different distances. The lesser energy resolution for the shifted peaks compared to the unshifted peaks is visible in the spectra.
The energy and efficiency calibrations were done using radioactive sources of 133Ba, 152E~ and 56Co.
3. Analysis and results
The collected coincidence events were sorted into six different 2k X 2k yy-
matrices for each target-stopper distance, as shown in Table 1. Only events collected in the detectors in the forward (0 = 37”) and backward (0 = 143”) rings were used in the extraction of peak areas, since the Doppler shifts in the two centre rings (0 = 79”, 101”) were too small to resolve the shifted and unshifted components. The latter rings were used only for gating purposes. In addition to the
I. Thorslund et al. / Transition probabilities 311
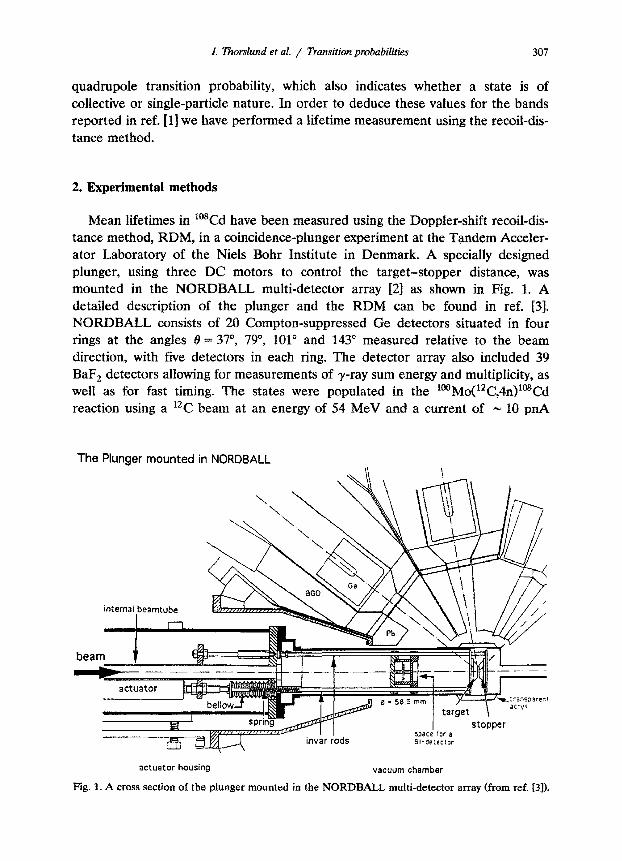
Table 1 Matrix combinations used in the sorting. The angles correspond to the &angles of the four rings in NORDBALL, each including five Ge-detectors
Matrix x-axis y-axis
1 37” 37” 2 37” 79”/101” 3 37” 143” 4 143” 143 5 143 79”/101” 6 143 37”
120 yy-matrices for the 20 distances, one symmetric matrix was created for the backed-target run.
In all of the 120 matrices energy gates, covering both the shifted and unshifted components, were put on all strong “*Cd y-ray transitions. The gates were set on the y-axis and projected onto the x-axis resulting in N 3600 coincidence spectra. A number of background spectra were produced in a similar way, added together in certain energy intervals and subtracted from the corresponding coincidence spec- tra. The spectra from the matrix combinations 1, 2 and 3 representing the same gate and distance were added together, and the same was ‘done for the spectra obtained from the matrix combinations 4, 5 and 6. As a result two spectra for each distance and gate were obtained, one for the forward and one for the backward ring. In these N 1200 spectra shifted and unshifted peak areas were fitted using a standard gaussian peak fitting program. In the fits the FWHM was fixed for the shifted and unshifted peaks separately, according to their energy dependence, and the relative position of the two peaks was fixed to a value according to the Doppler shift. The intensity of the 2++ O+ transition at 633 keV in the 876 keV gate was used to normalize between the different distances.
The code LIFETIME [4,5], designed for RDM analysis of data from compound-nucleus reactions, was used to extract lifetimes of the excited nuclear levels from the present data set. The code determines the population of each level as a function of time using Bateman’s equations [6]. Calculated values of the shifted and unshifted intensities are obtained, and a X2-minimization to the corresponding experimental values results in a determination of the lifetimes for all levels included in the fit, as well as the effective side feeding times for each level.
Each fit is done for a level, or a group of levels corresponding to a cascade of y-ray transitions. A two-step cascade feeding of variable lifetime and intensity is added to feed the studied levels. This group of known and unknown levels will in the following be referred to as a decay model. By using appropriate gates the effects from higher-lying long-lived levels can be decreased, and influences from unknown side-feeding can be excluded by for example gating above the level of interest.
312 I. Thorslund et al. / Transition probabilities
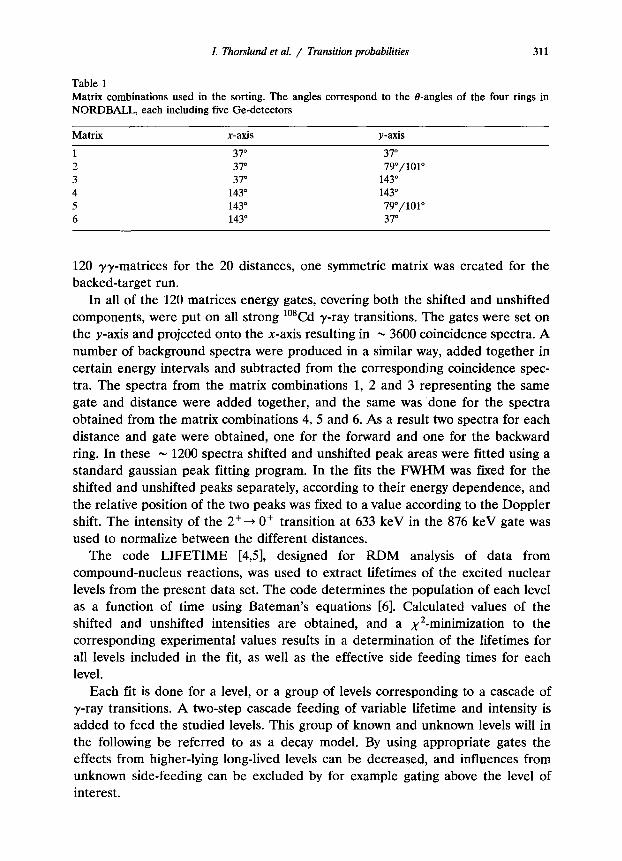
Table 2 Lifetimes of excited levels in ‘OsCd obtained in the present experiment. Previously determined lifetimes are given in the last column
Band
1
Level
(keV)
5126
I”
12-
7 7 previous
(PS) (PS)
3.1 (4) 1 2 2 2 3 3 4 4 5 5
4198 5181 4189 3486 4827 3873 4570 3739
6078 3225 3058 6460 5504 4710 4154 1509
633 3111 2976
lo- 13- 11-
9- 12- lo- ll-
9- 15- 14-
8- 7-
16+ 14+ 12+ lo+ 4+ 2+ 8+ 6-
8 (2) 1.0 (1) 5.2 (2)
68 (3) 1.6 (1) 8.3 (3) 2.4 (3) 9 (1) 300 (150) a
<3
;zI (200) b 300 (150) a 45 (35) b 140 (70) a
<2 2.2 (1)
14.6 (4)
51 (3) <5 1.3 (2) c
10.1 (8) 10.0 (2) c 400 (150) a 220 (140) a
a Centroid-shift method, ref. [81. b Estimated error, see text. ’ From B(E2), ref. [7].
The mean lifetimes of excited levels in “*Cd obtained from these fits are presented in Table 2, and in the partial level scheme shown in Fig. 4, where the labelling of the bands originates from the level scheme in ref. [l]. Two independent fits were done for each decay model, using data from the forward and backward rings, respectively, and more than one decay model has been used for some of the levels. A majority of the presented lifetimes are weighted averages from several fits. Only statistical errors are given in the table except where noted.
Fig. 5 shows examples of decay curves. The dots are the experimental peak areas corrected for y-ray efficiency, and the lines represent the fits to these points by LIFETIME. The levels at 4189, 3873 and 4710 keV decay via one strong transition of 703.2, 648.6 and 556.4 keV, respectively, and the corresponding fits are done using the intensities of these transitions taken from summed gates put below the specific level in the two first cases and above the level in the third case. The 4154 keV level decays via several strong transitions, and the fit is done using the summed intensities from the 415.2, 469.6 and 667.6 keV transitions extracted from a sum of two higher-lying gates.

I. Thorshnd et al. / Transition probabilities 313
u W

314 I. Thorslmd et al. / Transition probabilities
500 I I I I 1 500 I I I I 1
Band 2, 4189 keV level, 5 ps Bond 3. 3073 keV level, 8 ps
400- - 4al- * A
S A
’ cn 300- - 300- s-
z
ii 0 mJ- - ZOO-
100 - u- loo- * u_
l *
OO I I I I 1 I I I I I
25 50 75 100 125 Oo 25 50 75 100 125
700 I 1 I I I 1000 1 I I 1 I
Band 7, 4710 keV level, 15 ps Band 7, 4154 keV level, 51 ps 600-
50 75 100 125
target-stopper distance (pm) target-stopper distance (#ml Fig. 5. Fits done by LIFETIME to measured shifted (S) and unshifted (U) intensities.
The lifetime of the 4154 keV lO+ level is measured to 51(3) ps. Its long lifetime will dominate the decay curves for lower-lying states that are fed from this level and have much shorter lifetimes. This is particularly the case for the 8+ and 6+ states in band 7. These states decay mainly via high-energy y-rays of E2 character with very short lifetimes, and they have not been possible to measure since they are obscured by the long lifetime of the lO+ level. The same is true for the lifetime of the 8+ state in band 10. Also the 4+ state in band 7 is affected by the long lifetime of the lO+ state, and only an upper limit of the lifetime of this state was possible to determine. The lifetime of the 2+ state is however long enough to be distinguishable from the contribution from the 51 ps lifetime in the decay curve and is measured to 10.1(8) ps. The 6+ and 4+ states are fed also by transitions from the negative-parity states, but the long-lived levels at 3225 keV (700 ps> and 3058 keV (45 ps> destroy the possibilities to use these gates in determining the
I. Thorslund et al. / Transition probabilities 315
250 1 I I 1 I 250 I I 1
Band 4, 3739 keV level, 9 ps Band 4, 3739 keV level, 9 ps
target-stopper distance (pm) target-stopper distance km)
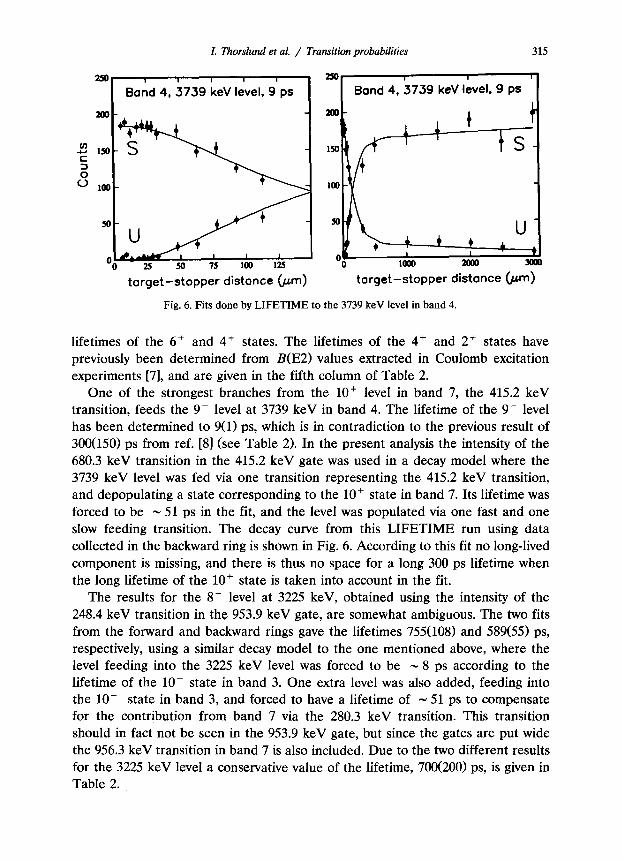
Fig. 6. Fits done by LIFETIME to the 3739 keV level in band 4.
lifetimes of the 6+ and 4+ states. The lifetimes of the 4+ and 2+ states have previously been determined from B(E2) values extracted in Coulomb excitation experiments [7], and are given in the fifth column of Table 2.
One of the strongest branches from the lO+ level in band 7, the 415.2 keV transition, feeds the 9- level at 3739 keV in band 4. The lifetime of the 9- level has been determined to 9(l) ps, which is in contradiction to the previous result of 300050) ps from ref. [8] (see Table 2). In the present analysis the intensity of the 680.3 keV transition in the 415.2 keV gate was used in a decay model where the 3739 keV level was fed via one transition representing the 415.2 keV transition, and depopulating a state corresponding to the lO+ state in band 7. Its lifetime was forced to be N 51 ps in the fit, and the level was populated via one fast and one slow feeding transition. The decay curve from this LIFETIME run using data collected in the backward ring is shown in Fig. 6. According to this fit no long-lived component is missing, and there is thus no space for a long 300 ps lifetime when the long lifetime of the lO+ state is taken into account in the fit.
The results for the 8- level at 3225 keV, obtained using the intensity of the 248.4 keV transition in the 953.9 keV gate, are somewhat ambiguous. The two fits from the forward and backward rings gave the lifetimes 755(108) and 589(55) ps, respectively, using a similar decay model to the one mentioned above, where the level feeding into the 3225 keV level was forced to be N 8 ps according to the lifetime of the lo- state in band 3. One extra level was also added, feeding into the lo- state in band 3, and forced to have a lifetime of m 51 ps to compensate for the contribution from band 7 via the 280.3 keV transition. This transition should in fact not be seen in the 953.9 keV gate, but since the gates are put wide the 956.3 keV transition in band 7 is also included. Due to the two different results for the 3225 keV level a conservative value of the lifetime, 700(200) ps, is given in Table 2.
316
40 Band 5, 6600 keV level
35- - 0.9 ps I
‘1 5 10 15 20 25 30 1 35 40 I
target-stopper distance (pm)
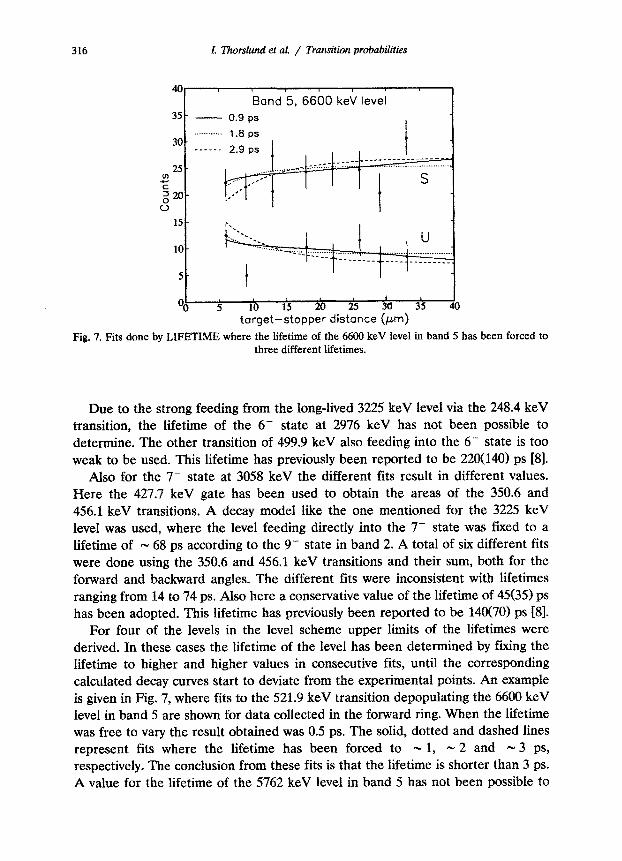
Fig. 7. Fits done by LIFETIME where the lifetime of the 6600 keV level in band 5 has been forced to three diferent lifetimes.
Due to the strong feeding from the long-lived 3225 keV level via the 248.4 keV transition, the lifetime of the 6 state at 2976 keV has not been possible to determine. The other transition of 499.9 keV also feeding into the 6- state is too weak to be used. This lifetime has previously been reported to be 22N140) ps [Sl.
Also for the 7- state at 3058 keV the different fits result in different values. Here the 427.7 keV gate has been used to obtain the areas of the 350.6 and 456.1 keV transitions. A decay model like the one mentioned for the 3225 keV level was used, where the level feeding directly into the 7- state was fixed to a lifetime of - 68 ps according to the 9- state in band 2. A total of six different fits were done using the 350.6 and 456.1 keV transitions and their sum, both for the forward and backward angles. The different fits were inconsistent with lifetimes ranging from 14 to 74 ps. Also here a conservative value of the lifetime of 45(35) ps has been adopted. This lifetime has previously been reported to be 140(701 ps [81.
For four of the levels in the level scheme upper limits of the lifetimes were derived, In these cases the lifetime of the level has been determined by fixing the lifetime to higher and higher values in consecutive fits, until the corresponding calculated decay curves start to deviate from the experimental points. An example is given in Fig. 7, where fits to the 521.9 keV transition depopulating the 6600 keV level in band 5 are shown for data collected in the forward ring. When the lifetime was free to vary the result obtained was 0.5 ps. The solid, dotted and dashed lines represent fits where the lifetime has been forced to - 1, - 2 and - 3 ps, respectively. The conclusion from these fits is that the lifetime is shorter than 3 ps. A value for the lifetime of the 5762 keV level in band 5 has not been possible to

I. Thorslund et al. / Transition probabilities 317
determine due to the low energy of the de-exciting transition (121.2 keV), giving a too small Doppler shift to resolve the shifted and unshifted components.
The lifetime of the 8+ state at 3111 keV was not possible to determine in the present experiment, but was previously measured to 400(150) ps [8].
The lifetimes measured in the present experiment have been used to determine reduced transition probabilities for all transitions involved in the de-excitations, using relative intensities reported in ref. [l]. These values are presented in Table 3, and will be discussed in the next section.
4. Discussion
4.1. Transition probabilities
The low-spin structure of i”sCd has previously been studied in detail in ref. [93. It has been described as a spherical anharmonic quadrupole vibrator co-existing with intruding deformed states [9-111. The result from the present lifetime measurement of the first 2+ state at 633 keV gives a B(E2; 2++ O+) value of 26 W.U. (see Table 3), consistent with previous experiments [7], which suggests collectivity. For the 4+ state only a lower limit of the B(E2) value is determined. However, it has previously been measured to 41 W.U. [7], which is about twice the B(E2; 2++ O+) value, consistent with the vibrational model.
The yrast band (band 7) undergoes a sharp change in structure at spin lo+, due to the alignment of two hi,,, neutrons [l]. The collective character of the rotational band on top of this lO+ state is verified by the large B(E2) values, 34, 39 and > 17 W.U., of the 12++ lo+, 14++ 12+ and 16++ 14+ transitions, deter- mined from the measured lifetimes of the corresponding high-spin states. The lO+ state decays to the negative-parity states of bands 2, 3 and 4, and to the 8+ states of bands 7 and 10, as well as to the 8+ state at 3111 keV.
Band 10 shows features of a deformed intruder band. Such low-lying intruder bands are known in the Sn isotopes [123. They have been suggested to originate from two-proton two-hole excitations across the main shell at 2 = 50 [lO,ll]. In “‘Cd a O+ state at 1721 keV and a 2+ state at 2163 keV are suggested to be the first two members of the proton intruder configuration [9]. The 4+, 6+ and 8+ states of band 10 are not the higher-spin members of this proton configuration, since they are likely to lie at a higher excitation energy as indicated by the systematics [9]. Further, the lO+ state of band 7 has a very interesting decay branch to the 8+ state of band 10. The B(E2) value for the lo&,, , + 8b+and i. transition is presently measured to be more than three times larger than the
IOLI 7 + fG”d 7 transition, 25 and 7 W.U., respectively, and it is therefore sug- gested that band 10 has a large component of the V(h11,2)2 configuration in its wave function. In recent experiments [13-1.51 a similar decay pattern has been

Table 3 Reduced transition probabilities calculated from the measured lifetimes
Band L,evel rin -+ IrW Branching a z&) (%)
Multi- HAL) b HAL) (keV) polarity (W.U.)
1
1
2 2 2
3 3 4
4
5 5
7 7 7 7
7 7
5126 4198
5182 4189 3486
4827 3873 4570
3739
6600 6078 3225
3058
6460 5504 4710 4154
1509 633
12-+ lo- 928.5 100 lo-+ 8- 721.6 69 (6)
-r9- 458.9 31 (2) 13-+ 11- 992.1 100 11-+ 9- 703.2 100 9-+ 7- 427.7 42 (3)
+8- 261.5 58 (4)
12-+ lo- 953.9 100 lo--* 8- 648.6 100 11-+9- 831.0 80 (6)
+ lo- 696.5 20 (2) g--+ 7- 680.3 50 (4)
+8- 514.0 50 (4) 15-+ 14- 521.9 100 14-+ 13- 316.0 88 (6) e 8-+ 6- 248.4 27 (2)
+7- 166.3 73 (5)
7-+5- 350.6 29 (2) *5- 456.1 47 13) +6+ 516.5 24 (2)
16++ 14+ 956.3 100 14+-P 12+ 794.0 100 12++ lo+ 556.4 100 IO++ 8’ 469.6 32 (2)
-+8’ 291.9 10 (1) -+s+ 1043.2 0.4 (2) + lo- 280.3 2.9 (2) +9- 415.2 30 (2) +9- 667.6 25 (1)
4++ 2+ 875.7 100 2++0+ 633.2 100
E2 382 (49) 13 (2) E2 360 (97) 12 (3) MIC 0.023 (6) 0.013 (3) E2 851 (85) 28 (3) E2 914 (35) 30 (1) E2 353 (30) 12 (1) Mid 0.027 (2) 0.015 (1) E2 a 23 (2) 0.74 (6) E2 647 (40) 21 (1) E2 858 (31) 28 Cl) E2 688 (101) 23 (3) Ml = 0.014 (2) 0.008 (1) E2 312 (43) 10 (1) MIC 0.023 (3) 0.013 (2) Ml > 0.132 > 0.074 Ml > 0.52 > 0.29 E2 333 (99) 11 (3) Ml f 0.013 (4) 0.007 (2) E2 f 258 (76) 8 (2) E2 995 (777) 33 (25) E2 433 (340) 14 (11) El 2.4 (19). 1O-5 1.7 (13). 10-5 E2 > 511 > 17 E2 1178 (53) 39 (2) E2 1050 (29) 34 (1) E2 225 (19) 7 (1) E2 757 (88) 25 (3) E2 0.05 0) 0.002 (1) El 1.6 (1). lo-* 1.1(l). 10-s El 5.2 (5). 10-s 3.5 (3). 10-5 El 1.0 (1) 10-5 7.1 (5). 10-6 E2 > 318 > 10 E2 795 (63) 26 (2)
a The branching is taken f?om ref. [Il. b The B(EL) and B(ML) values are in units of e2(fm)ZL and &(fm)2L-2, respectively. c The transition is mixed [I], but pure dipole transition is assumed since Sz is unknown. d 6* =‘0.004 from ref. 181. e The 6078 keV level decays also via a 1250.6 keV transition to the 12- state in band 3 111. f 6’ = 0.04 from ref. [8].
found for the yrast lO+ state of ‘l°Cd into its previously observed intruder band
[16,17]. The lo+ state of band 7 also decays to the 8+ state at 3111 keV with a weak
1043.2 keV transition. Its B(E2) value is very small, only 2 + 10e3 W.U. (Table 3), which is consistent with the suggestion that the 8+ state is dominated by the p(g,,,F2 configuration [1,181.
I. ~rs~u~d et al. / Transition prab~i~ties 319
The B(E1) values from the lO+ state to the negative-parity bands are 1.1. 10m5, 3.5 * low5 and 7.1 * 10m6 W.U. (Table 3). The B(E1) value for the 415.2 keV transition to the 9- state in band 4 is about five times larger than the B(E1) value for the 647.7 keV transition to the 9- state in band 2. Since one might expect the
“hii, to vg,/z transition (Ai = 1) to take up most of the El strength, as opposed to the ;vhll,z to vds,2 transition (Al = 3), one possibility is that band 4 has a larger g,,, component than band 2, which was already pointed out in ref. [l&j. Another possible explanation for the difference in B(E1) values may be that band 4 has a large adm~ure of an octupole band in its wave function.
The present lifetime measurement gives B(E2) values for the in-band transi- tions of bands 1, 2, 3 and 4 that lie between 10 and 30 W.U., which support the suggested collective rotational structure [ 11.
In band 5 it was possible to obtain an upper limit for the lifetimes of two of its states. Wowever, in this band the stretched E2 transitions were not observed, because of the strongly competing Ml transitions 111, and no B(E2) values could be extracted.
4.2. Quadrupole deformations
The quad~pole defo~ation parameter, p2, has been calculated for the five bands discussed above using the B(E2) values within the rotational bands. The intrinsic quadrupole moment is given by
e,=E, mw
1+2K 201fIo (1)
and by assuming an axially symmetric shape, i.e. y = O”, the deformation p2 can be deduced from
(2)
where R, = 1.20 A1/3 fm. A value of K = 0 was used in Eq. (1) for the yrast band. For a two-quasi-particle state the K-value is given by K = 10, & &I. Bands l-4 are built on two-quasi-particle states involving the Nilsson orbital [5501$ -, which mainly couple to the [411]3+ or [413]$+ orbital [l]. This gives K= 1, 2 or 3. Of course, bands 1-4 are mixtures of several K-components, but the main component is likely of low-K, and a value of K = 2 was used to calculate p2 for the negative-parity bands. The & values obtained from the present lifetime measure- ment are presented in Table 4.
The deformation parameter has not been calculated for the 2+ state of band 7, although the lifetime is measured, since it is not appropriate to apply Eq. (1) to

320 I. Thorslund et al. / Transition probabilities
Table 4 The experimentally determined quadrupole deformation, &
Band Level
CkeV) Bz exp.
1 1 2 2 3 3 4 7 7 7
5126 4198 5181 4189 4827
4570 6460 5504 4710
12-+ lo- 928.5 0.09 lo-+ 8- 721.6 0.09 13-+ 11- 992.1 0.14 11-j 9- 703.2 0.14 12-+ lo- 953.9 0.12 lo-+ 8- 648.6 0.14 11-j 9- 831.0 0.12 16++ 14+ 956.3 > 0.10 14++ 12+ 794.0 0.16 12++ lo+ 556.4 0.15
vibrational states. However, after the alignment of the h11,2 neutrons at spin lO+ a rotational band is developed, and the deformation & obtained from the lifetimes of the 12+, 14+ and 16+ states, lies around 0.16.
The deformations in the negative-parity bands 1, 2, 3 and 4 vary somewhat. For the lower spin transitions the calculated deformations are smaller than _ 0.10. For states above spin 9, where a rotational band structure has evolved, the deforma- tions & are as follows; 0.09, 0.14, 0.13 and 0.12, respectively, for the four bands. Bands 2 and 3 have the same deformation within the experimental errors, whereas band 4 has a somewhat smaller and band 1 a significantly smaller deformation than bands 2 and 3. This is not fully understood, but could be due to a different effective K-value of band 1. However, a K-value as large as 6 is required to give & _ 0.12 in band 1.
It would be very interesting to know the deformation of band 10. Unfortunately it was not possible to measure the lifetime of any of its states because of the strong feeding from the long-lived lO+ state. However, the moments of inertia of the band are determined, and found to be about 50% smaller than in the correspond- ing proton intruder bands in the Sn isotopes, which indicate a smaller deformation of the intruder band in io8Cd.
Total routhian surface (TRS) calculations [19] were done for lo8Cd in ref. [ll. They give equilibrium deformations p,“, p,” and yV as a function of rotational frequency, r?w, for specific quasi-particle configurations. In Table 5 the calculated deformation parameter @’ is given for some configurations. The vacuum and EF configurations correspond to band 7 before and after the alignment of the hi,,, neutrons. The configurations AE, BE, CE and DE are the four negative-parity bands before the alignment of the hri,* neutrons (see ref. 111). The &” value in band 7 increases from about 0.12 in the low-spin states to about 0.17 after the alignment of the h11,2 neutrons. The p,” values for the configurations AE, BE, CE
I. Thorslund et al. / Transition probabilities 321
Table 5 The quadrupole deformation p,” obtained from total routhian surface calculations. The assignment of the observed bands to the different quasi-particle configurations is given in the table
Configuration
(Tr, (Y) a,” Band
vacuum (+, O), 0.25 0.9 0.12 7 EF (+, O), 0.38 11.3 0.17 7 EF (+, O), 0.57 16.6 0.17 7 AE (-, 01, 0.31 8.8 0.14 3 AEFG (-, 01, 0.50 14.3 0.16 1 BE (-, 0, 0.31 9.5 0.14 2 BEFG (-, 11, 0.57 20.8 0.16 2
CE (-, O), 0.31 8.5 0.14 1 DE (-, 11, 0.31 8.4 0.15 4
and DE are all about 0.14, which increases to about 0.16 for the four-quasi-particle configurations AEFG and BEFG. The /3,” and yV values are small in all cases.
The deformation parameters determined in the TRS calculations reflect the deformation of the nuclear potential as indicated by the superscript V, while the & values extracted from the experimental B(E2) values are a measure of the charge distribution of the nucleus. They are related to each other according to the following relation:
p2 = l.lOP,v - 0.03( P,)’
for a Woods-Saxon potential [20]. For band 7 above the lO+ state, & is calculated to _ 0.19, which should be compared to the experimental value of N 0.16. For bands 1, 2, 3 and 4 & is calculated to u 0.16 compared to the experimental values
P2 - 0.09 for band 1 and p2 N 0.14 for bands 2 and 3. The calculated deformations are thus in agreement with the experimental values, except for the small deforma- tion of band 1.
5. Conclusion
The experimental B(E2) values determined in the present work for five of the bands in “*Cd support the interpretations made in ref. [ll. The B(E2) value for the transition from the lO+ state in band 7 to the 8+ state in band 10 is three times larger than to the 8+ state in band 7. This indicates that the VhII,2 orbital is involved in the structure of band 10. The quasi-particle interpretation of the band heads of the four negative-parity bands in terms of the cranked shell model is strengthened in a quantitative way by comparisons of quadrupole deformation parameter, p2, obtained from experiment and from total routhian surface calcula- tions.

322 I. Thorslund et al. / Transition probabilities
This work was supported by the Swedish Natural Science Research Council, NFR. We thank Lars Einarsson for preparing the targets. We are grateful to the staff at the Tandem Accelerator Laboratory at NBI for providing excellent beams and technical support. Software written by D.C. Radford was used in the data
analysis.
References
[l] I. Thorshmd, C. Fahlander, J. Nyberg, R. Julin, M. Piiparinen, R. Wyss, S. Juutinen, A. Lampinen,
T. Liinnroth, D. Miiller, S. Tijrmanen and A. Virtanen, Nucl. Phys. A564 (1992) 285
[2] G. Sletten, J. Gascon and J. Nyberg, Int. Conf. on spectroscopy of heavy nuclei, Crete, Greece,
1989, published in Int. Phys. Conf. Ser. 105 (1990) 125
[3] I. Thorshrnd, C. Fahlander, A. Blcklin, A. Virtanen, M. Piiparinen, D. Miiller, R. Julin, S.
Juutinen, A. Pakkanen and J. Hattula, Uppsala University, The Svedberg Laboratory and Depart-
ment of Radition Sciences internal report TSL/ISV-92-0063 (1992)
[4] J.C. Wells, M.P. Fewell and N.R. Johnson, LIFETIME: A computer program for analyzing
doppler shift recoil distance nuclear lifetime data, ORNL/TM9105 (1985)
[S] A. Virtanen and T. Liinnroth, Dept. of Phys., Univ. of Jyvlskyhi, Finland, Laboratory report
l/1991
[6] H. Bateman, Proc. Cambridge Phil. Sot. 15 (1910) 423
[7] J. Blachot, Nucl. Data Sheets 62 (1991) 845
[8] W. Andrejtscheff, L.K. Kostov, H. Rotter, H. Prade, F. Stary, M. Senba, N. Tsoupas, Z.Z. Ding and P. Raghavan, Nucl. Phys. A437 (1985) 167
[9] J. Kumpulainen, R. Julin, J. Kantele, A. Passoja, W.H. Trzaska, E. Verho, J. VHarHmlki, D. Cutoiu and M. Ivascu, Phys. Rev. C45 (1992) 640
[lo] K. Heyde, P. van Isacker, M. Waroquier, J.L. Wood and R.A. Mayer, Phys. Reports 102 (1983) 291
[ll] J.L. Wood, K. Heyde, W. Nazarewicz, M. Huyse and P. van Duppen, Phys. Reports 215 (1992) 101
[12] J. Bron, W.H.A. Hesselink, A. van Poelgeest, J.J.A. Zalmstra, M.J. Uitzinger, H. Verheul, K. Heyde, M. Waroquier, H. Vincx and P. van Isacker, Nucl. Phys. A318 (1979) 335
[13] S. Juutinen, R. Julin, P. Ahonen, C. Fahlander, J. Hattula, J. Kumpulainen, A. Lampinen, T. Liinnroth, D. Miiller, J. Nyberg, A. Pakkanen, M. Piiparinen, I. Thorslund, S. Tijrmlnen and A.
Virtanen, Z. Phys. A336 (1990) 475
[14] M. Piiparinen, R. Julin, S. Juutinen, A. Virtanen, P. Ahonen, C. Fahlander, J. Hattula, A. Lampinen, T. Lijnnroth, A. Maj, S. Mitarai, D. Miiller, J. Nyberg, A. Pakkanen, M. Sugawara, I.
Thorslund and S. Tiirmanen, Nucl. Phys. A565 (1993) 671
[15] S. Juutinen, R. Julin, P. Ahonen, J. Hattula, J. Kumpulainen, A. Lampinen, D. Miiller, A. Pakkanen, M. Piiparinen, S. Tiirmanen, A. Virtanen, C. Fahlander, I. Thorslund, J. Nyberg and T.
Liinnroth, to be published
[16] R.A. Meyer and L. Peker, Z. Phys. A283 (1977) 379 [17] J. Kern, A. Bruder, S. Drissi, V.A. Ionescu and D. Kusnezov, Nucl. Phys. A512 (1990) 1
[18] L.E. Samuelson, F.A. Rickey, J.A. Grau, S.I. Popik and P.C. Simms, Nucl. Phys. A301 (1978) 159
[19] W. Nazarewicz, R. Wyss and A. Johnson, Nucl. Phys. A503 (1989) 285
[ZO] J. Dudek, W. Nazarewicz and P. Olanders Nucl. Phys. A420 (1984) 285