Transit Signal Prioritization (TSP) · What is Transit Signal Priority (TSP) 3 Source: Streetsblog...
27
Transit Signal Prioritization (TSP) A Path to Successful Implementation 1 April 18, 2013
Transcript of Transit Signal Prioritization (TSP) · What is Transit Signal Priority (TSP) 3 Source: Streetsblog...

Transit Signal Prioritization (TSP)
A Path to Successful Implementation
1
April 18, 2013
OutlineWhat is Transit Signal Priority (TSP) Benefits of TSPHow TSP WorksCost of TSP ImplementationSuccessful Implementation Implementing TSP in Montgomery County Implementation Factors Implementation Schedule
2
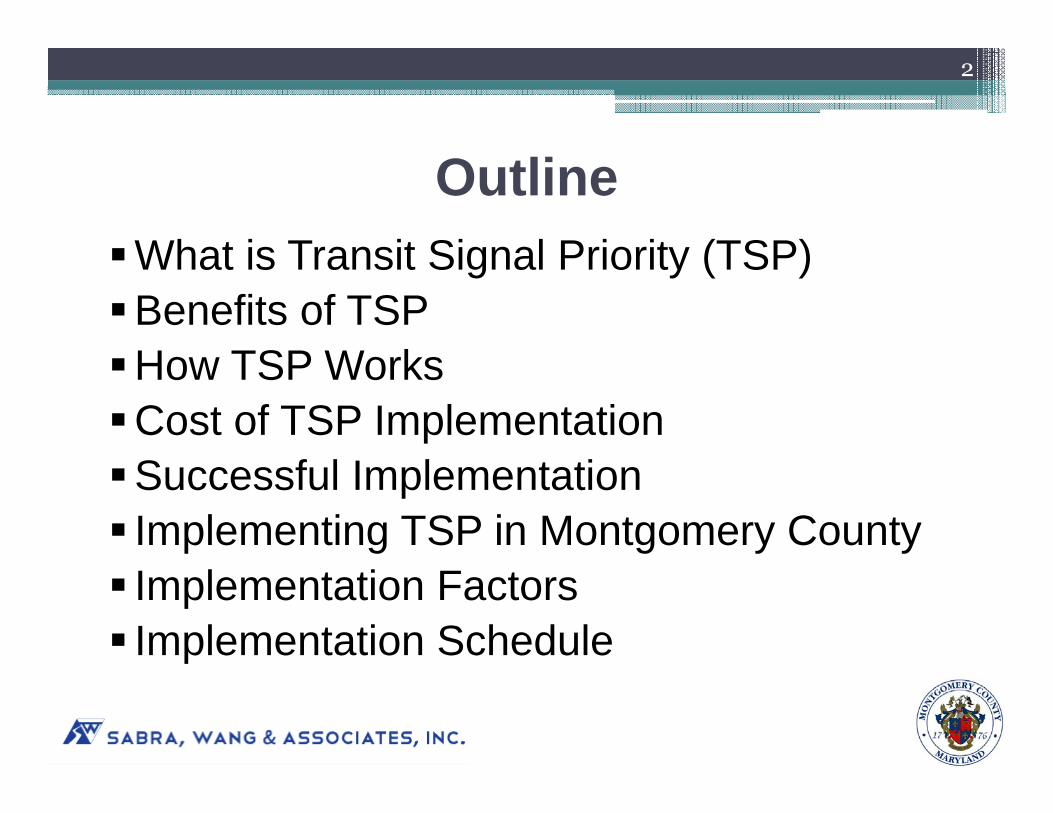
What is Transit Signal Priority (TSP)
3
Source: Streetsblog
TSP is a traffic signal operational strategy that is used selectively and conditionally to allocate priority passage for transit vehicles at signalized intersections.
TSP is conditional priority, not to be confused with Emergency Vehicle Preemption which is unconditional priority

Waiting at Traffic Signals represents an average of 15% of a bus’s trip time1. Causes of signal delay include: Pedestrians Crossing Traffic volume-related delay/ queues Accommodating side-street traffic Multiple phases (e.g. left-turns only).
4
1. (“Overview of Transit Signal Priority.” ITS America, 2004)
Benefits of TSPImproves travel time reliability and scheduling, reduces delay and emissions at traffic signals. May increase ridership and reduce transit operating costs.
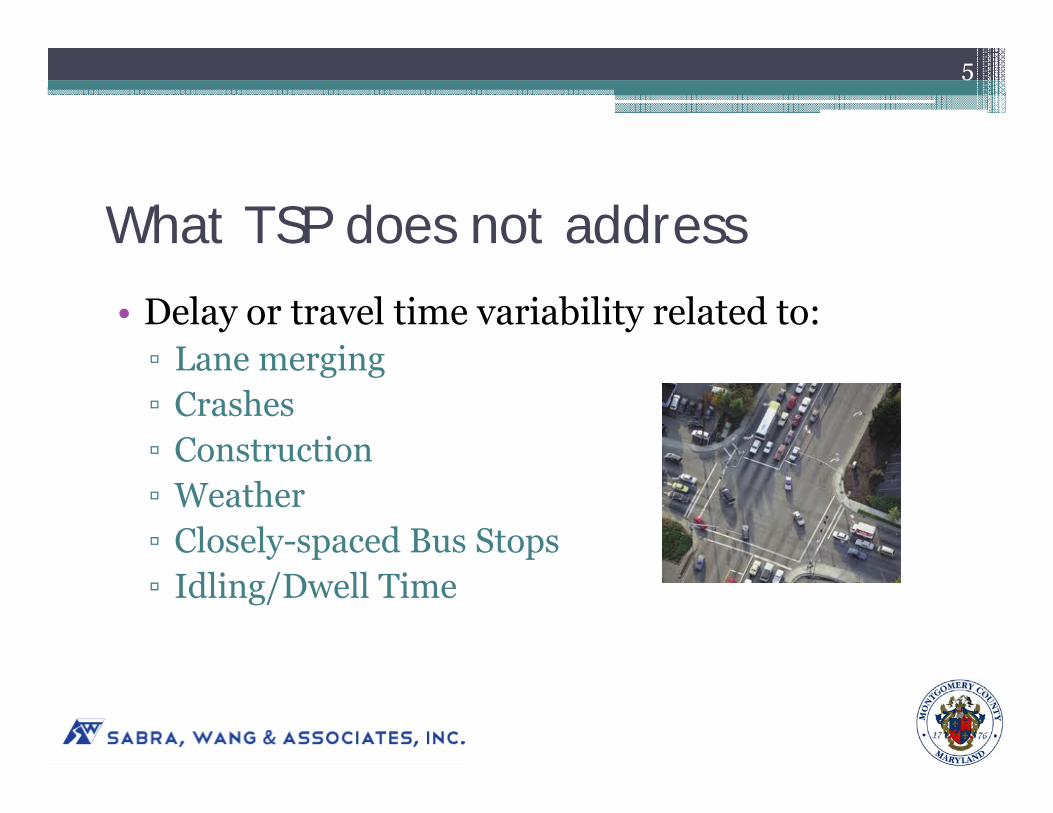
What TSP does not address
• Delay or travel time variability related to:▫ Lane merging▫ Crashes▫ Construction▫ Weather▫ Closely-spaced Bus Stops▫ Idling/Dwell Time
5
How TSP Works
6
7
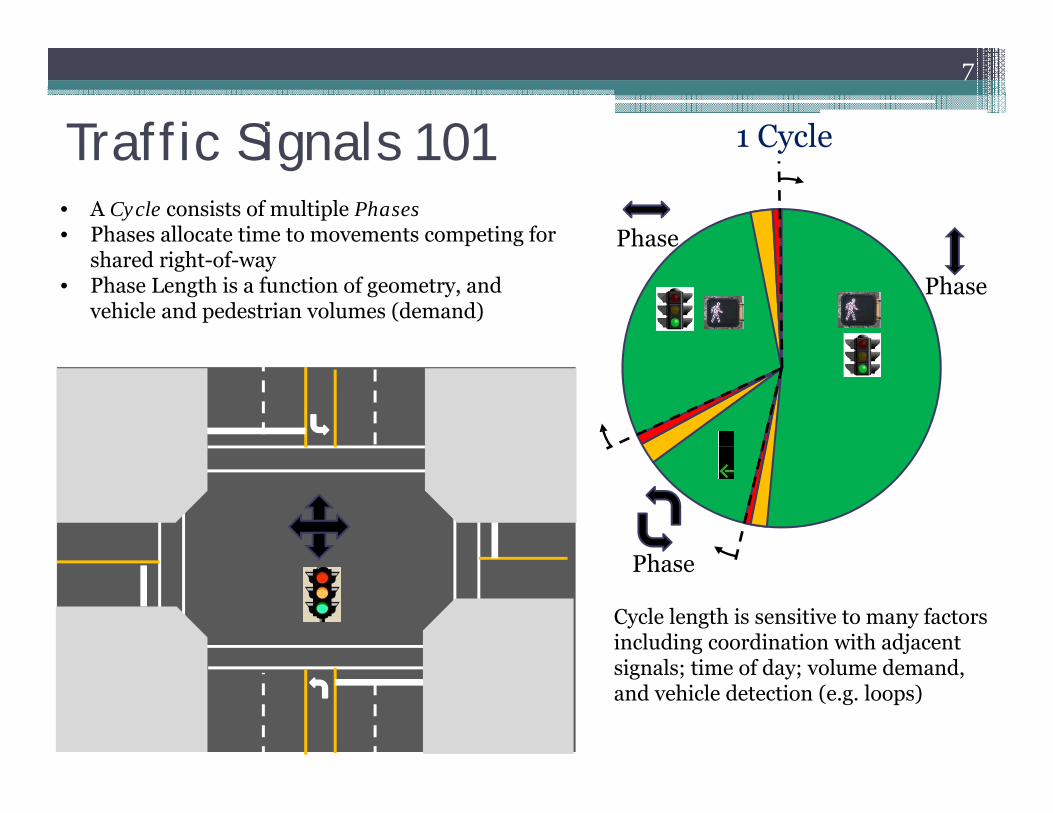
1 Cycle
Phase
Phase
Phase
Traffic Signals 101• A Cycle consists of multiple Phases• Phases allocate time to movements competing for
shared right-of-way• Phase Length is a function of geometry, and
vehicle and pedestrian volumes (demand)
Cycle length is sensitive to many factors including coordination with adjacent signals; time of day; volume demand, and vehicle detection (e.g. loops)
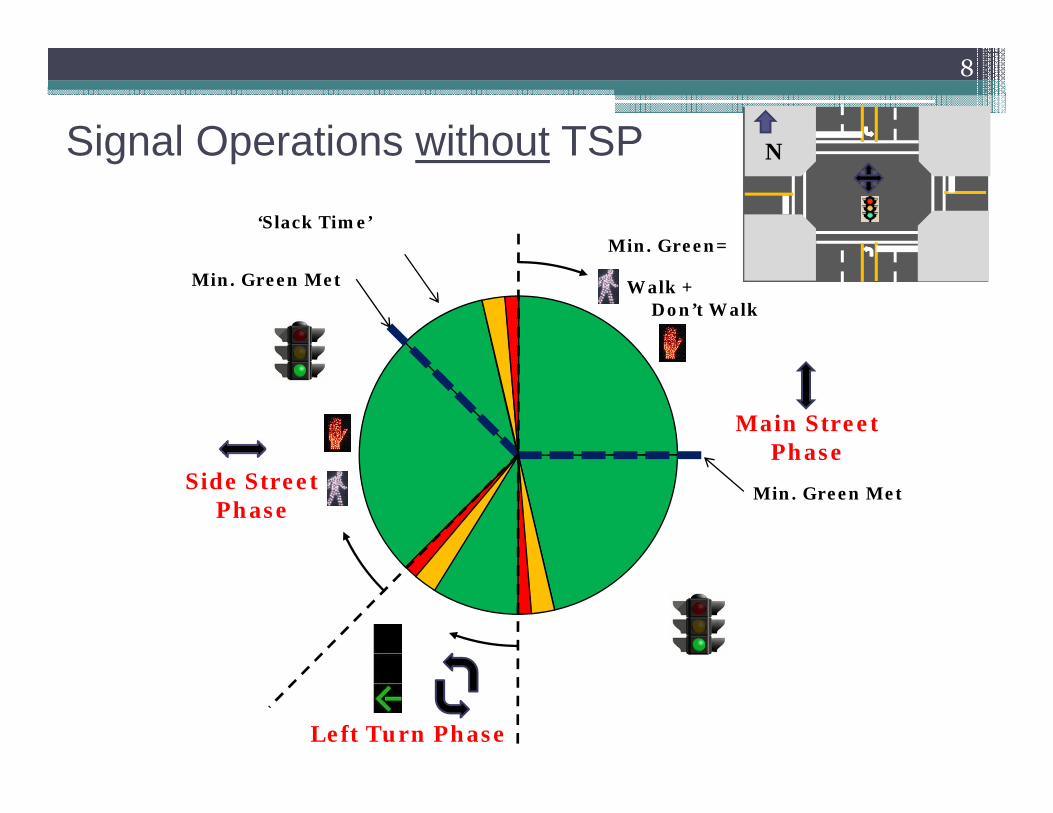
Min. Green=
Walk +
8
Side StreetPhase
Main StreetPhase
Left Turn Phase
Signal Operations without TSP
Min. Green Met
Don’t Walk
Min. Green Met
N
‘Slack Time’

9
TSP Request when Main Street is GREEN
If a bus is approaching toward the endof the Phase…
Min. Green=
Walk +
Side Street Phase
Main Street Phase
Left-Turn Phase
Min. Green Met
FDW
Min. Green Met
Extended Green(Extra Time for Bus)

10
TSP Request when the Side Street is GREEN
Min. Green=
Walk +
Side StreetPhase
Main Street Phase
Left-Turn Phase
FDWMin.Green Met
Min. Green Met
If a bus is approaching before the start of the main street green, EARLY GREEN if the side street has served the pedestrian Walk and Don’t Walk minimums
Truncated Red(Extra Time for Bus)
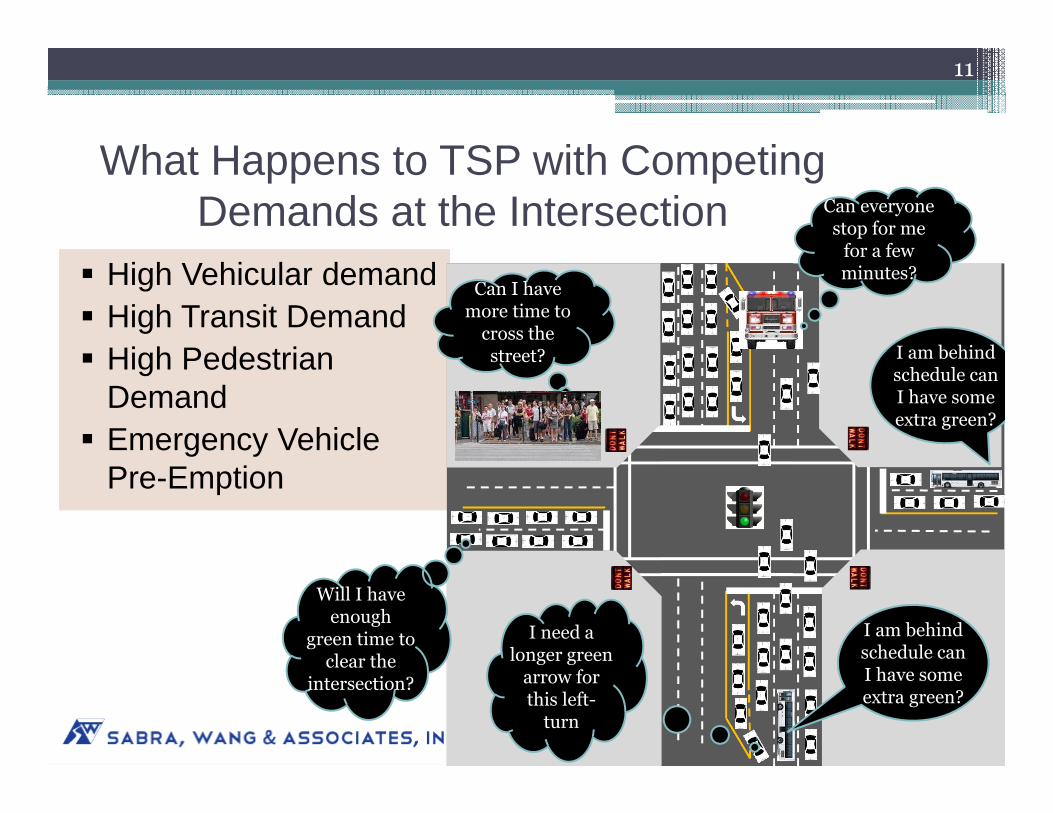
What Happens to TSP with Competing Demands at the Intersection
High Vehicular demand High Transit Demand High Pedestrian
Demand Emergency Vehicle
Pre-Emption
11
I am behind schedule can I have some extra green?
I need a longer green
arrow for this left-
turn
Can I have more time to
cross the street?
Will I have enough
green time to clear the
intersection?
I am behind schedule can I have some extra green?
Can everyone stop for me
for a few minutes?

What else is usually Implemented with TSP to Increase its effectiveness?
Geometric Improvements at intersectionsQueue jumpsExclusive Bus Lanes
Signal Timing Optimization Transit Operational Improvements Consolidation/ Relocation of bus stops Schedule optimization
Combination of above
12
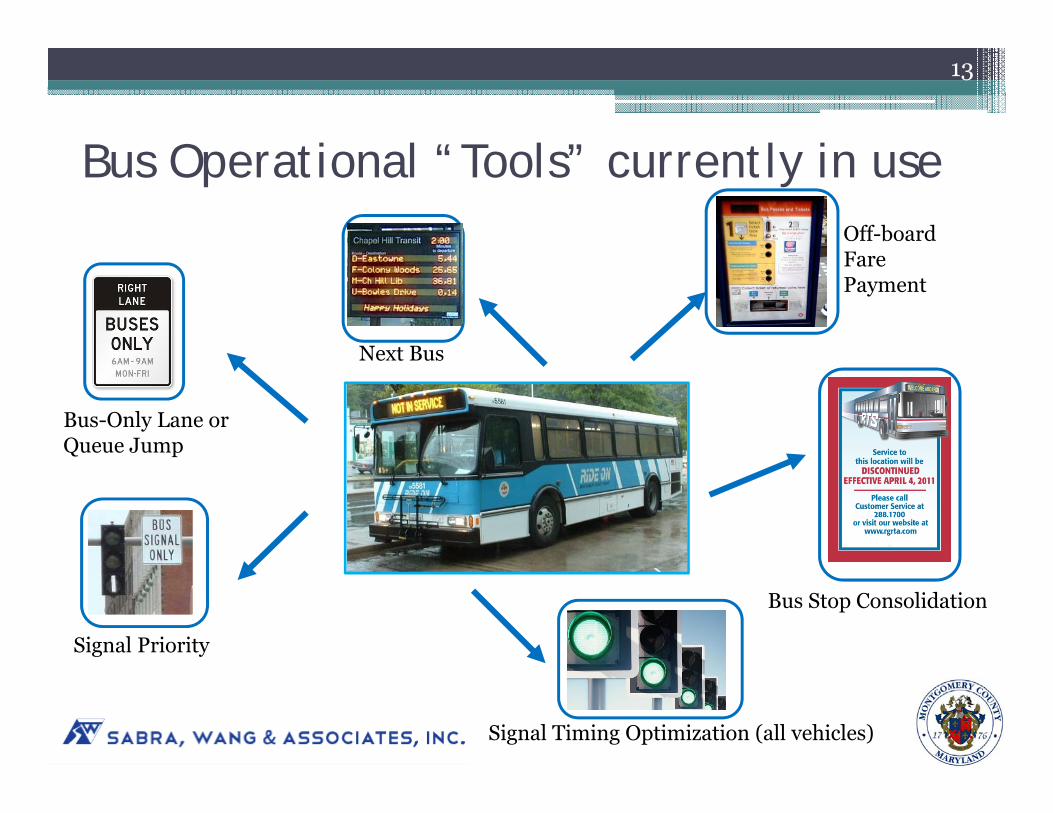
Bus Operational “Tools” currently in use
13
Signal Priority
Signal Timing Optimization (all vehicles)
Bus-Only Lane orQueue Jump
Bus Stop Consolidation
Next Bus
Off-board Fare Payment
Has TSP worked Elsewhere?
• “Yes” when a systematic proactive process is followed and optimal conditions are selected.
• Most optimal conditions focus on intersections with▫ Level of service A-D ▫ Not impacted by queues from upstream or downstream
locations.• “No” when installed without proper assessment and
analysis of optimal conditions.
14
TSP Installations
• TSP has been implemented at select locations▫ LA; Portland; NYC; Salt Lake; Washington State;
Florida; Charlotte; Atlanta; Baltimore• Most common implementation strategies▫ Early Green ▫ Green Extension▫ Exclusive Phase (e.g. Transit Vehicle Only)
15
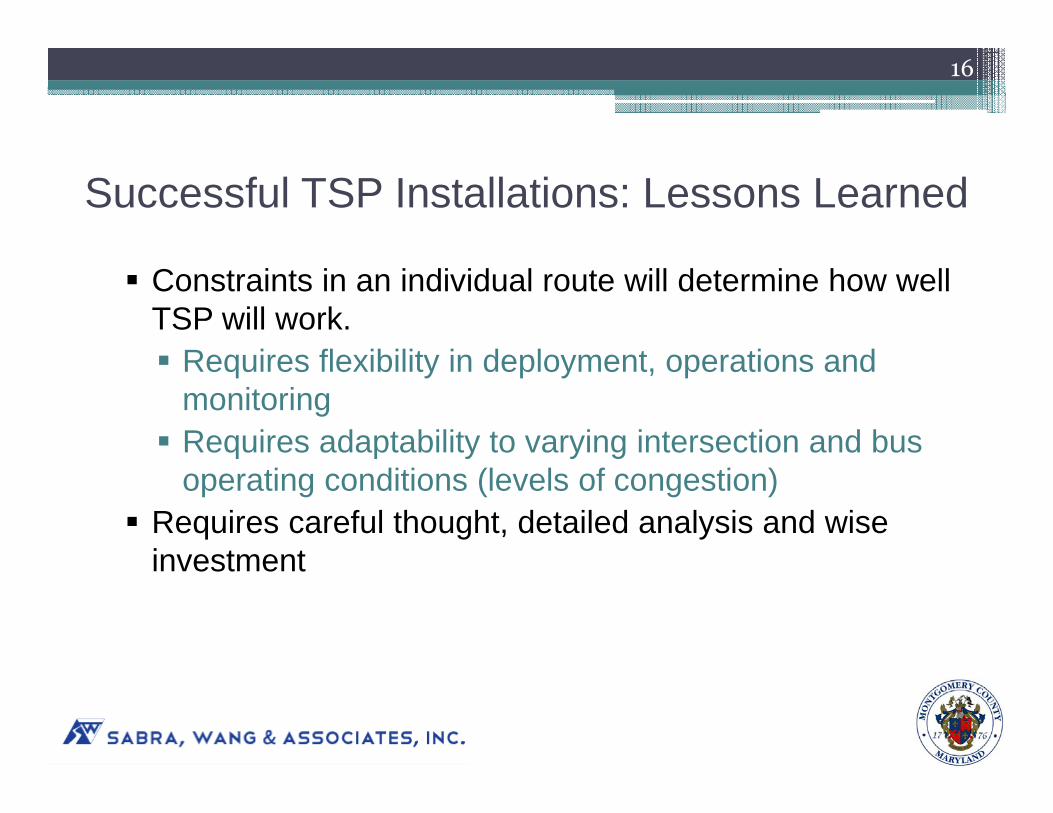
Successful TSP Installations: Lessons Learned
Constraints in an individual route will determine how well TSP will work. Requires flexibility in deployment, operations and
monitoring Requires adaptability to varying intersection and bus
operating conditions (levels of congestion) Requires careful thought, detailed analysis and wise
investment
16

TSP Components and Cost
17
$7500/ea. bus
$10,000/ea. Intersection.
$10,000 to 15,000/ea. Int.
Transmitter on Bus Receiver at Intersection, Controller Software, Wiring
TMC TSP Software Licensing and Integration
Operating and Maintenance Costs Not Shown
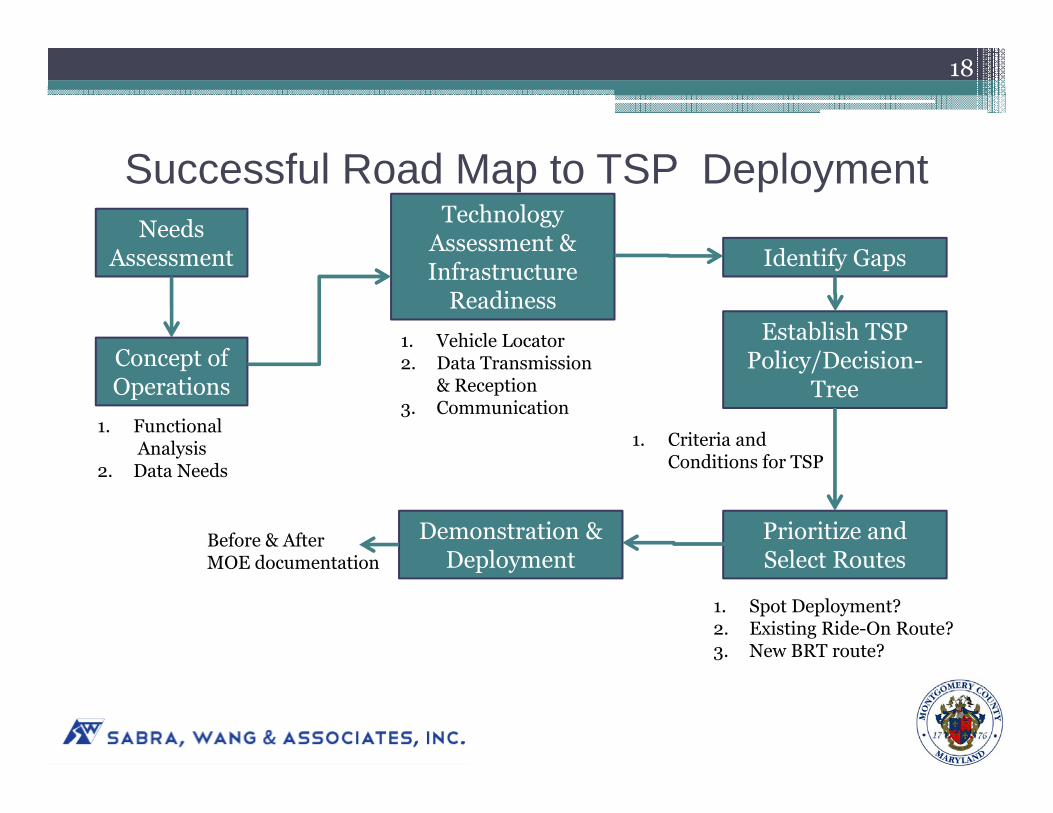
Successful Road Map to TSP Deployment
18
Concept of Operations
Technology Assessment & Infrastructure
Readiness
Identify Gaps
Establish TSP Policy/Decision-
Tree
Prioritize and Select Routes
Demonstration & Deployment
1. Vehicle Locator2. Data Transmission
& Reception3. Communication
1. FunctionalAnalysis
2. Data Needs
1. Criteria and Conditions for TSP
1. Spot Deployment?2. Existing Ride-On Route?3. New BRT route?
Before & After MOE documentation
Needs Assessment
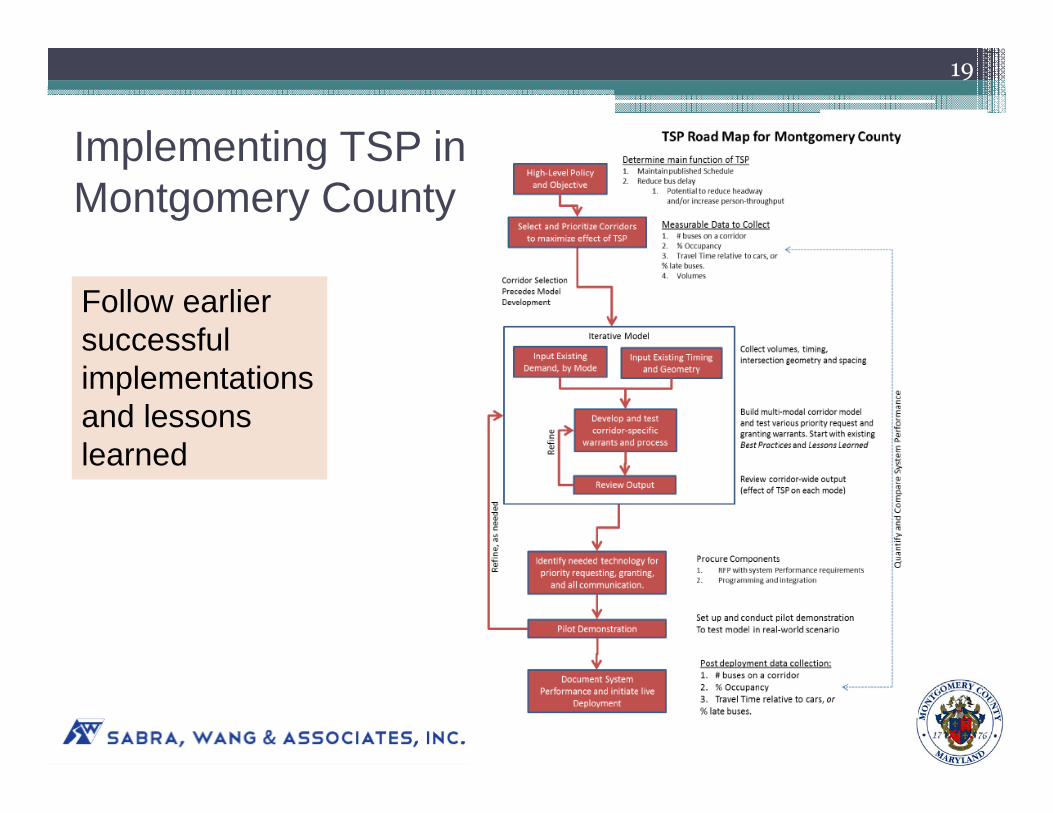
Implementing TSP in Montgomery County
19
Follow earlier successful implementations and lessons learned

Countywide TSP Study Phase I State of the Practice/ Lessons Learned Infrastructure and Communications System Readiness
Phase II Needs Assessment Concept of Operations Development Technology Assessment and Selection Data Requirement Procurement and Deployment Pilot Study Demonstration and Evaluation
Phase III Identify, Screen and Select Routes and Performance Metrics Develop TSP Policy: Warrants and Conditional Measures Coordinate with agency Stakeholders (RideOn, SHA and WMATA) Finalize Deployment Plan – costs and timeline
20
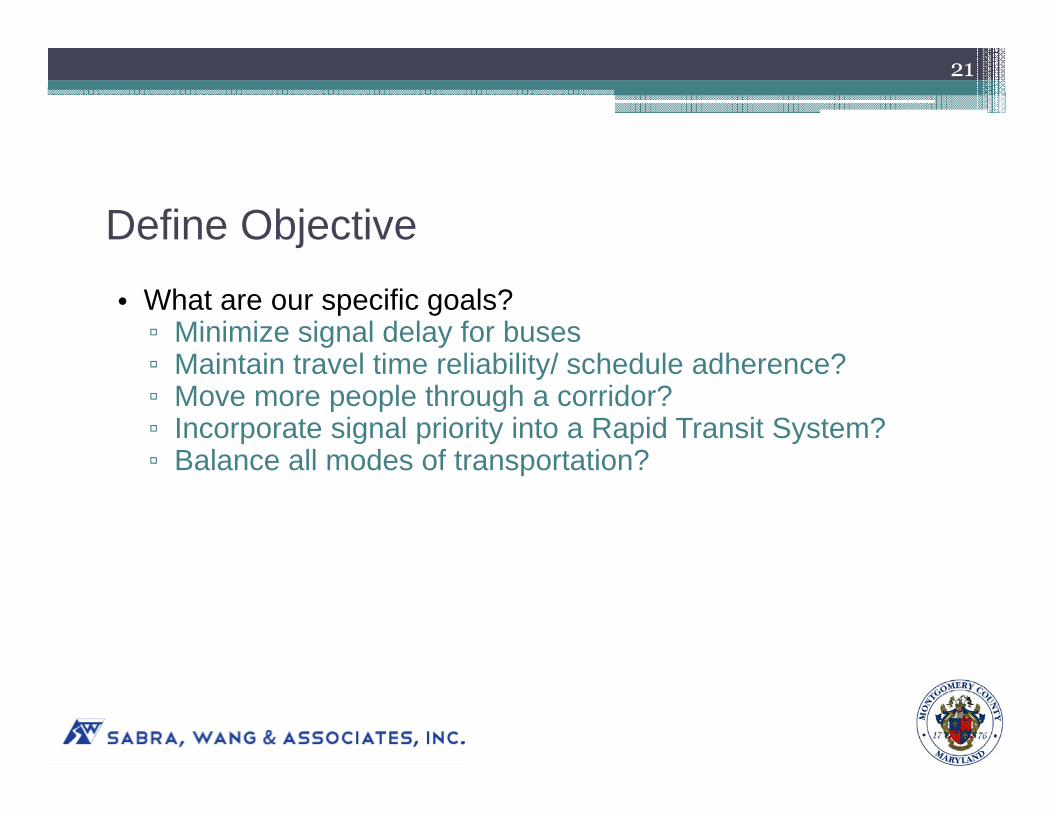
Define Objective• What are our specific goals?▫ Minimize signal delay for buses▫ Maintain travel time reliability/ schedule adherence?▫ Move more people through a corridor?▫ Incorporate signal priority into a Rapid Transit System?▫ Balance all modes of transportation?
21
Establishing Performance Metrics
Benefits and impacts can be estimated based on quantifiable data. May include: Bus travel time Total bus wait time at signalized intersections.
On-time performance Overall person throughput/ delay Pedestrian wait time Vehicle delay Number of calls/ frequency of calls
22

Establishing Policy and Warrants
Under what traffic and transit conditions will TSP be granted?• Based upon underlying data and desired
performance metrics.• Will the conditions for priority vary by time of day?
Is the reduction in bus-passenger delay (trip hours) weighed heavier than the increase in passenger cardelay?• What about delay to pedestrians? Cross-street
Buses?
23
Route Screening and Selection
Assess opportunities and constraints for each corridor and for various times of the day (AM peak, midday, PM peak and night) and service types (local, limited, express):Transit: Bus volumes, bus delay, bus ridershipTraffic: Vehicle volume, pedestrian volume, number
of signals, number of failing intersections/ level of service, signal timing (phasing and splits), cross-streets functional classificationLand use: Density, type, intermodal connections
24
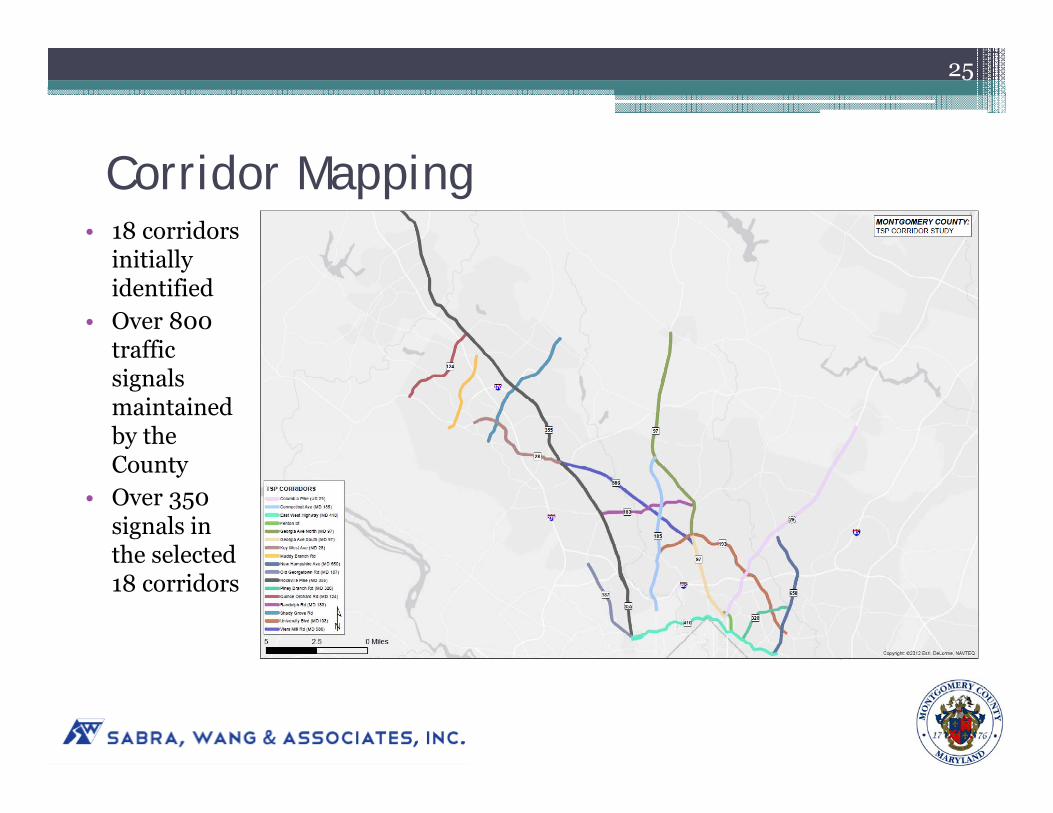
Corridor Mapping• 18 corridors
initially identified
• Over 800 traffic signals maintained by the County
• Over 350 signals in the selected 18 corridors
25
DOT Technical Assessment Status
26
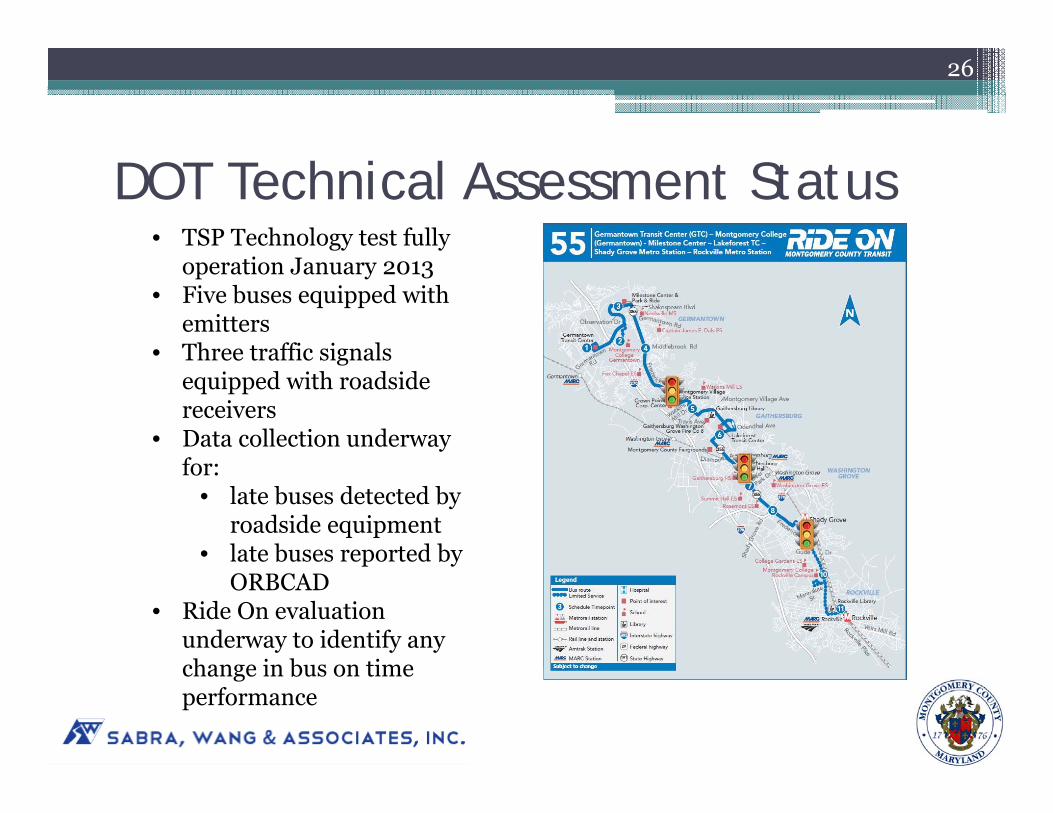
• TSP Technology test fully operation January 2013
• Five buses equipped with emitters
• Three traffic signals equipped with roadside receivers
• Data collection underway for:
• late buses detected by roadside equipment
• late buses reported by ORBCAD
• Ride On evaluation underway to identify any change in bus on time performance

Questions
27