Transit Development Plan, Annual Update 2021 – 2030
56
BCT Connected BROWARD COUNTY TRANSIT Transit Development Plan, Annual Update 2021 – 2030 Prepared by: Broward County Transit 1 N. University Drive, Suite 3100A Plantation, FL 33324 Telephone: (954) 357-8300 Website: Broward.org/BCT
Transcript of Transit Development Plan, Annual Update 2021 – 2030

BCT Connected BROWARD COUNTY TRANSIT
Transit Development Plan, Annual Update 2021 – 2030
Prepared by: Broward County Transit 1 N. University Drive, Suite 3100A Plantation, FL 33324 Telephone: (954) 357-8300 Website: Broward.org/BCT

(This page intentionally left blank.)

Table of Contents
BCT FY 2021-30 TDP Annual Update | Table of Contents i
Chapter 1: INTRODUCTION ........................................................................................................... 1 TDP Requirements ....................................................................................................... 1 TDP Annual Update Checklist ....................................................................................... 2 Organization of Report ................................................................................................. 2 Chapter 2: OVERVIEW AND ACCOMPLISHMENTS FOR FY 2020 ................................................... 3 BCT System Overview .................................................................................................. 3 BCT Fixed Route Ridership………………………………………………………………………………………… 3 BCT Community Shuttle Ridership…………………………………………………………………………….. 4 BCT System Ridership Highlights………………………………………………………………………………. 10 Broward County Transportation Surtax and the TDP……………………… ........................... 10 BCT Service and Capital Plan Accomplishments in 2020 ............................................... 11 BCT Service Plan Accomplishments in 2020 ................................................................. 11 BCT Community Shuttle Accomplishments for 2020…………………………………………………. 15 BCT Rapid Bus/BRT Plan Accomplishments for 2020………………………………………………… . 15 BCT Rail Plan Accomplishments for 2020…………………………………………………………………. . 16 Other Planning Accomplishments for 2020………………………………………………………………. 16 BCT Capital Plan Accomplishments for 2020…………………………………………………………….. 18 Transit Strategies and Partnerships: 2020 .................................................................... 20 Chapter 3: GOALS AND OBJECTIVES UPDATE AND ASSESSMENT FOR 2020 ................................. 22 Chapter 4: IMPLEMENTATION PLAN FOR FY 2021-30 ................................................................... 27 Highlights of BCT’s 2021-30 Implementation Plan ....................................................... 27 BCT Service and Planning Activities for 2021-30........................................................... 28 BCT Fixed Route Service Plan for FY 2021..................................................................... 28 BCT Community Shuttle Service Plan for FY 2021......................................................... 28 BCT Rapid Bus/Bus Rapid Transit Activities for FY 2021 ............................................... 29 BCT Rail Plan for FY 2021 .............................................................................................. 29 Other Planning Activities for FY 2021 ........................................................................... 29 Transit Capital Programs for FY 2021-30 ...................................................................... 30 FTA Grant-Funded Capital Projects .............................................................................. 30 Transit Concurrency-Funded Capital Program .............................................................. 31 Transportation Surtax Capital Program for FY 2021-30 ................................................ 31 BCT FY 2021-30 Service Plan ........................................................................................ 33 BCT FY 2021-30 Bus Service Plan .................................................................................. 33 Rapid Bus/BRT Service Implementation ....................................................................... 36

Table of Contents
BCT FY 2021-30 TDP Annual Update | Table of Contents ii
Light Rail Transit (LRT) Service Implementation ........................................................... 36 Chapter 5: FINANCIAL PLAN: FY 2021-30 ...................................................................................... 37 BCT Capital Financial Plan: FY 2021-30 ........................................................................ 37 BCT Operating Financial Plan: FY 2010-30 ................................................................... 40 Appendix A: FAREBOX RECOVERY REPORT ................................................................................... A-1
LIST OF TABLES
Table 2-1 BCT Fixed-Route Ridership ............................................................................................ 4 Table 2-2 Community Shuttle Ridership ....................................................................................... 5 Table 2-3 BCT Ridership Totals Fixed Route .................................................................................. 8 Table 2-4 BCT Community Shuttle Ridership…………………………………………………………………………… 9 Table 2-5 BCT Ridership Totals by Service Type………………………………………………………………………. 10 Table 2-6 BCT FY 2020-29 TDP Service Plan .................................................................................. 12 Table 2-7 BCT FY 2020 Service Plan Implementation .................................................................... 13 Table 2-8 BCT FY 2020 Capital Plan Implementation .................................................................... 18 Table 2-9 BCT FY 2020 Transportation Study/Committee Participation ........................................ 20 Table 3-1 Goal 1 with Objectives, Actions and Measures.............................................................. 21 Table 3-2 2020 Goal 1 Performance Assessment .......................................................................... 22 Table 3-3 Goal 2 with Objectives, Actions and Measures.............................................................. 22 Table 3-4 2020 Goal 2 Performance Assessment .......................................................................... 23 Table 3-5 Goal 3 with Objectives, Actions and Measures.............................................................. 24 Table 3-6 2020 Goal 3 Performance Assessment .......................................................................... 24 Table 3-7 Goal 4 with Objectives, Actions and Measures.............................................................. 25 Table 3-8 2020 Goal 4 Performance Assessment .......................................................................... 25 Table 3-9 Goal 5 with Objectives, Actions and Measures.............................................................. 26 Table 3-10 2020 Goal 5 Performance Assessment .......................................................................... 26 Table 4-1 BCT 2021-30 Bus Service Plan ....................................................................................... 35 Table 5-1 Transit Capital Financial Plan: 2021-25 .......................................................................... 38 Table 5-2 Transit Capital Financial Plan: 2026-30 .......................................................................... 39 Table 5-3 Transit Operating Financial Plan: 2021-25 ..................................................................... 41 Table 5-4 Transit Operating Financial Plan: 2026-30 ..................................................................... 42

Table of Contents
BCT FY 2021-30 TDP Annual Update | Table of Contents iii
LIST OF MAPS
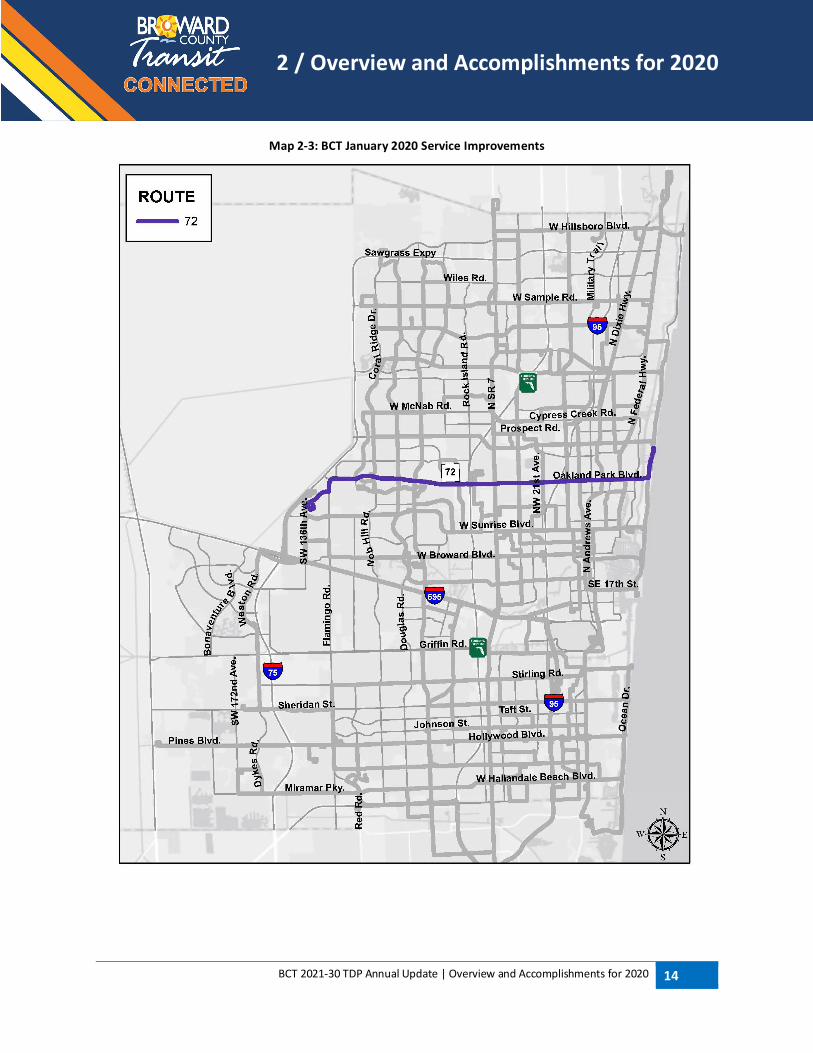
Map 2-1 BCT System Map ............................................................................................................ 6 Map 2-2 Community Shuttle System Map ................................................................................... 7 Map 2-3 BCT January 2020 Service Improvements ...................................................................... 14

1 / Introduction
BCT 2021-30 TDP Annual Update | Introduction 1
The Broward County Transit (BCT) 2019–2028 Transit Development Plan (TDP), known as BCT Connected, serves as the strategic guide for public transportation in Broward County over the next 10 years. Development of the TDP included a number of activities: documentation of study area conditions and demographic characteristics, evaluation of existing transit services in Broward County, market research and public involvement efforts, development of a situation appraisal and needs assessment, and preparation of a 10-year TDP document that provides guidance during the 10-year planning horizon. This plan was adopted by the Broward County Board of County Commissioners (BCC) on December 11, 2018. This document serves as the second annual progress report to BCT Connected. This update will identify achievements within the past fiscal year (2020), identify plans and services for the upcoming fiscal year (2021) and provide recommendations for all subsequent years, including the new tenth year (2030). TDP REQUIREMENTS BCT Connected is consistent with the requirements for the State of Florida Public Transit Block Grant (PTBG) program, a program enacted by the Florida Legislature to provide a stable source of funding for public transit. The PTBG program requires public transit service providers to develop and adopt a 10-Year TDP using the requirements formally adopted by the Florida Department of Transportation (FDOT) on February 20, 2007 (Rule 14-73.001 – Public Transit). Chief requirements of the rule include the following:
• Major updates must be completed every five years, covering a 10-year planning horizon. • A public involvement plan must be developed and approved by FDOT or be consistent with the
approved Metropolitan Planning Organization (MPO) public involvement plan. • FDOT, the Regional Workforce Development Board, and the MPO must be advised of all public
meetings where the TDP is presented and discussed, and these entities must be given the opportunity to review and comment on the TDP during the development of the mission, goals, objectives, alternatives, and 10-year implementation program.
• Estimation of the community’s demand for transit service (10-year annual projections) must be made using the planning tools provided by FDOT or a demand estimation technique approved by FDOT.
• Consistency with the approved local government comprehensive plans and the MPO’s Long Range Transportation Plans (LRTP) is required.
An additional requirement for the TDP was added by the Florida Legislature in 2007 when it adopted House Bill 985. This legislation amended Section 341.071 of the Florida Statutes (FS), requiring transit agencies to “… specifically address potential enhancements to productivity and performance which would have the effect of increasing farebox recovery ratio.” FDOT subsequently issued guidance requiring the TDP and each annual update to include a one- to two-page summary report on the farebox recovery ratio, and strategies implemented and any plans to improve (raise) the ratio (see Appendix A).

1 / Introduction
BCT 2021-30 TDP Annual Update | Introduction 2
TDP ANNUAL UPDATE CHECKLIST This TDP Annual Update meets the requirement for a major TDP update in accordance with Rule 14-73.001 – Public Transit, Florida Administrative Code (F.A.C.). Per this code, TDP Annual Updates are required to document the following:
• Past year’s accomplishments compared to the original implementation program; • Analysis of any discrepancies between the plan and its implementation for the past year and steps
that will be taken to attain original goals and objectives; • Any revisions to the implementation program for the coming year; • Revised implementation program for the tenth year; • Added recommendations for the new tenth year of the updated plan; • A revised financial plan; and • A revised list of projects or services needed to meet the goals and objectives, including projects
for which funding may not have been identified. ORGANIZATION OF REPORT The report is broken into five sections, including this one. Additional documentation (Farebox Recovery Report) is provided in Appendix A. Section 2, Overview and Accomplishments for 2020 documents BCT’s system characteristics and public transportation accomplishments since the adopted BCT TDP Major Update in 2018. Section 3, Goals and Objectives Update and Assessment for 2020, illustrates BCT’s performance and future steps in implementing the overall goals and objectives since the adopted BCT TDP Major Update in 2018. Section 4, Implementation Plan for 2021-2030, demonstrates BCT’s continued efforts and improvements in implementing the overall BCT Connected plan for the new fiscal year (2021) and the new tenth year (2030). Section 5, Financial Plan: 2021-2030, outlines BCT’s updated Financial Plan’s for 2021-30.

2 / Overview and Accomplishments for 2020
BCT 2021-30 TDP Annual Update | Overview and Accomplishments for 2020 3
The BCT Connected FY 2020-29 Annual Update, serves as the second annual progress report to the FY 2019-28 BCT Connected Major TDP effort. This section will identify achievements within the past fiscal year (2020). Plans and services for the upcoming fiscal year (2021), and recommendations for the new tenth year (2030) will be provided in Section 4. BCT SYSTEM OVERVIEW Broward County Transit (BCT) is the major public transportation provider in Broward County. BCT provides public transportation services in Broward County, with service to downtown Miami and southern Palm Beach County. Fixed-route and Express bus services include 46 weekday routes, 33 Saturday routes, and 32 Sunday routes. Fixed routes provide connections to the community’s multimodal transportation network as well as to system-wide connections at four transfer terminals: Broward Central Terminal (downtown Fort Lauderdale), West Regional Terminal (Plantation), Lauderhill Mall Transfer Facility (Lauderhill), and Northeast Transit Center (Pompano Beach). Major transfer locations can be found at Westfield Mall, Downtown Miami, Golden Glades, Aventura Mall, Young Circle, Fort Lauderdale – Hollywood International Airport, seven Tri-Rail stations, Sawgrass Mills Mall, Galt Ocean Mile, and Pompano Citi Centre (see Map 2-1). In addition to regular fixed-route bus services, BCT also operates Breeze and Express service, coordinates Community Shuttle service (see Map 2-2), and provides paratransit service. Breeze serves limited stops along the route at major intersections only, with headways of 20 minutes all day (on State Road 7/US 441 and US 1) and 30 minutes during morning and afternoon peak travel hours on University Drive and Broward Blvd. Express bus service travels along the Managed Lanes network on either I-95 or I-595 to Downtown Miami and Brickell Financial District, or I-75 to the Miami Intermodal Center (MIC) on weekdays during morning and afternoon peak travel hours. Free commuter park-and-ride locations are available for express bus customers at eight sites. BCT continues to be the major coordinator and funding source for the Community Shuttle Program, which operates in 18 municipalities in Broward County with 65 vehicles. BCT Fixed Route Ridership BCT’s fixed route system (including Breeze and Express) ridership decreased 17.4 % in the twelve-month period ending in May 2020 (see Table 2-1). It should be noted that BCT experienced a significant reduction in ridership March - May 2020 due to the COVID-19 pandemic. In late-March 2020, BCT reduced service levels by 35%. This was done by operating a “modified” Saturday schedule six (6) days a week; i.e. regular Saturday schedule M-S, no Breeze service, and 30-minute express service M-F, and a regular Sunday schedule. At the height of the pandemic, BCT lost roughly 75% of its average weekday ridership. The average weekday ridership across BCT’s system pre-pandemic was approximately 88,000. In April that dropped to approximately 22,000 daily riders. We have seen some encouraging increases since that time but expect to end FY20 with about 25% less riders than in FY19. Please note that due to normal seasonal dips we see over the summer, we do not believe that that 25% is necessarily all attributed to the pandemic; particularly when trended over the entire fiscal year. It is also important to note that in mid-September 2020, BCT suspended the I-75 Service due to low ridership.

2 / Overview and Accomplishments for 2020
BCT 2021-30 TDP Annual Update | Overview and Accomplishments for 2020 4
Table 2-1: BCT Fixed-Route Ridership
BCT Community Shuttle Ridership Ridership for BCT-subsidized Community Shuttle service decreased 18.7 % in the twelve-month period ending in May 2020 (see Table 2-2). It should be noted that BCT experienced significant reduction in ridership in April 2020 due to the COVID-19 pandemic. In late-March, BCT reduced service levels by 35%. At the same time, partnering municipalities in the Community Shuttle Program significantly reduced service levels as well that were city-specific; i.e. some cities have different service hours, service spans, and service days. Whereas some cities reduced services levels, others suspended service completely. All in all, the cities saw a 66% reduction in their average daily ridership. The average weekday ridership across the Community Shuttle Program pre-pandemic was approximately 7,600. In April that dropped to approximately 22,000 daily riders. Although the ridership for Community Shuttle is much more sensitive than the fixed routed system, we have seen some increases in recent months. It is expected that ridership in the program will be down double-digits as well for the fiscal year, but as with BCT’s fixed route service, we do not believe that the loss is attributable solely to the pandemic.
83,750 83,563 87,260 89,860 91,526 90,22885,556 87,850 90,953 87,264 87,903 86,455
79,422 79,669 81,614 84,19388,825 87,208
81,917 85,073 88,980
60,420
22,181 24,796
010,00020,00030,00040,00050,00060,00070,00080,00090,000
100,000
Fixed Route Average Weekday Ridership
FY18 - FY19 FY19 - FY20

2 / Overview and Accomplishments for 2020
BCT 2021-30 TDP Annual Update | Overview and Accomplishments for 2020 5
Table 2-2: BCT Community Shuttle Ridership
7,104 7,231 7,264 7,559 7,598 7,397 7,349 7,257 7,592 7,625 7,283 7,479
6,806 6,743 6,810 6,861 7,106 6,949 6,681 6,786 7,030
5,265
2,557 2,744
01,0002,0003,0004,0005,0006,0007,0008,0009,000
Community Shuttle Average Weekday Ridership
FY18 - FY19 FY19 - FY20

2 / Overview and Accomplishments for 2020
BCT 2021-30 TDP Annual Update | Overview and Accomplishments for 2020 6
Map 2-1: BCT System Map

2 / Overview and Accomplishments for 2020
BCT 2021-30 TDP Annual Update | Overview and Accomplishments for 2020 7
Map 2-2: Community Shuttle System Map

2 / Overview and Accomplishments for 2020
BCT 2021-30 TDP Annual Update | Overview and Accomplishments for 2020 8
Table 2-3: BCT Fixed-Route Ridership BCT Fixed Route June 2018 -
May 2019 June 2019 – May 2020 % change Notes on Major Changes
Route 1 1,470,927 1,212,102 -17.6 %
US 1 Breeze 448,628 377,563 -15.8 %
Route 2 1,394,961 1,132,243 -18.8 %
University Breeze 193,576 137,578 -28.9 % Route 4 180,075 166,736 -7.4 % Route 5 294,529 249,592 -15.3 % Route 6 387,891 315,944 -18.5 % Route 7 810,717 666,127 -17.8 % Route 8 * 58,991 * *Route started service in Sep. 2019 Route 9 368,798 294,239 -20.2 % Route 10 908,204 719,455 -20.8 % Route 11 645,704 498,191 -22.8 %
Route 12 305,989 283,258 -7.4 %
Route 14 919,541 752,011 -18.2 %
Route 15 23,833 21,826 -8.4 %
Route 16 197,991 204,543 3.3 %
Route 18 1,407,451 1,236,473 -12.1 %
Route 19 1,747,613 1,471,778 -15.8 %
441 Breeze 995,291 759,598 -23.7 %
Route 20 205,869 174,657 -15.2 %
Route 22 972,132 823,774 -15.3 % Broward Breeze 10,083 25,250 150.4 % Route 23 67,442 49,499 -26.6%
Route 28 872,732 712,506 -18.4 % Route 30 507,162 398,561 -21.4 % Route 31 685,595 597,748 -12.8 % Route 34 827,717 673,693 -18.6 %
Route 36 1,382,437 1,066,995 -22.8 %
Route 40 858,191 668,050 -22.2 % Route 42 455,159 367,093 -19.3%
Route 48 117,096 94,697 -19.1 %
Route 50 1,076,764 886,241 -17.7 %
Route 55 585,452 510,948 -12.7 %
Route 56 84,538 72,811 -13.9 %
Route 60 999,095 815,112 -18.4 % Route 62 494,396 444,918 -10.0 % Route 72 2,053,317 1,612,993 -21.4 % Route 81 870,250 744,388 -14.5 %
Route 83 269,717 219,762 -18.5 %
Route 88 154,454 165,016 6.8 %
I-95 X (106) – Mir. Reg. Park/Mia. 123,608 102,049 -17.4 %
I-95 X (107) – Pembroke/Mia. 27,814 0 -100 % *Route discontinued in Feb. 2019 I-95 X (108) – Perry Airport/Mia. 104,809 96,603 -7.8 %
I-95 X – (109) CB Smith/Mia. 146,818 119,012 -18.9 % I-595 X (110) – BB&T Ctr./Miami 101,629 82,082 -19.2 % I-595 X (114) – Westgate/Miami 103,339 91,359 -11.6 %
I-75 X (115) - 75 Express * 673 * *Route started service in Jan. 2020 Unknown 3,183 2,731 * *Route # unknown per farebox data SYSTEM TOTALS: 26,862,518 22,177,469 -17.4 %

2 / Overview and Accomplishments for 2020
BCT 2021-30 TDP Annual Update | Overview and Accomplishments for 2020 9
Table 2-4: Community Shuttle Ridership
Community Shuttle Routes Supported By BCT
June 2018 - May 2019
June 2019 - May 2020 % change Notes on Major Changes
Coconut Creek - N Route 34,188 26,191 - 23.4 %
Coconut Creek - S Route 47,856 39,631 - 17.2 %
Coral Springs - Green Route 25,160 23,349 - 7.2 %
Coral Springs - Blue Route 29,684 25,255 - 14.9 % Dania Beach - East Route (Blue) 22,061 19,963 - 9.5 % Dania Beach - West Route (Green) 19,462 14,391 - 26.1 % Davie - Green Route 25,134 18,095 - 28.0 % Davie – SFEC 71,350 59,290 - 16.9 % Davie - Blue Route 91,756 86,749 - 5.5 % Deerfield Beach - Route 1 20,725 16,018 - 22.7 % Deerfield Beach – Route 2 27,330 19,671 - 28.0 %
Ft. Lauderdale – Downtown Link 45,405 29,417 - 35.2 %
Ft. Lauderdale – Las Olas Link 23,184 12,210 - 47.3 %
Ft. Lauderdale – Beach Link 81,798 51,547 - 37.0 %
Ft. Lauderdale – Galt Ocean A NIS NIS * *BCT funding discontinued Nov. 2017 Ft. Lauderdale – Galt Ocean B NIS NIS * *BCT funding discontinued Nov. 2017 Ft. Lauderdale – Neighborhood Link 27,035 23,411 - 13.4 %
Ft. Lauderdale – NW Community Link 4,347 52,049 1,097.4 % Hallandale Beach – Route 1 98,412 69,954 - 28.9 %
Hallandale Beach – Route 2 60,381 52,613 - 12.9 %
Hallandale Beach - Route 3 65,994 54,230 - 17.8 % Hallandale Beach – Route 4 65,624 45,282 - 31.0 % Hillsboro Beach 5,956 10,342 73.6 %
Hollywood – Beach Line 7,480 NIS - 39.5 % *Svc. discontinued by City June, 2019 Hollywood – North Downtown 30,623 1,321 - 95.7 % *Svc. discontinued by City July, 2019 Hollywood – South Downtown 40,099 1,512 - 96.2 % *Svc. discontinued by City July, 2019 Lauderdale Lakes - Route 1 (East/West) 44,508 42,267 - 5.0 %
Lauderdale Lakes - Route 2 (North/Sou.) 54,768 47,604 - 13.1 %
Lauderdale By-The-Sea 32,830 25,104 - 23.5 % Lauderhill - Route 1 85,531 73,497 - 14.1 %
Lauderhill - Route 2 80,236 66,480 - 17.1 %
Lauderhill - Route 3 105,696 86,436 - 18.2 %
Lauderhill - Route 4 83,146 69,174 - 16.8 %
Lauderhill - Route 5 84,672 68,594 - 19.0 %
Lauderhill –Route 6 32,875 25,185 - 23.4 % Lauderhill – Route 7 29,223 26,495 - 9.3 % Lighthouse Point 11,514 8,679 - 24.6 % Margate - Route A 26,354 26,168 - 0.7 %
Margate - Route C 32,038 30,411 - 5.1%
Margate - Route D 31,302 29,056 - 7.2 %
Margate - Route A (Sat.) 2,787 2,910 4.4 %
Miramar - Green Route 39,377 27,275 - 30.7 % Miramar - Orange Route 25,560 20,587 - 19.5 %
Miramar – Red Route 35,192 27,568 - 21.7 % Miramar - Yellow Route 19,106 13,712 - 28.2 % Pembroke Pines - Green 48,692 43,187 - 11.3 %
Pembroke Pines – Gold East 79,936 63,643 - 20.4 % Pembroke Pines – Gold West 42,550 41,024 - 3.6 % Pembroke Pines – Blue West 8,815 8,125 - 7.8 % Pembroke Pines – Blue East 8,152 8,322 2.1 %
Pompano Beach - Blue Route 21,189 15,527 - 26.7 % Pompano Beach - Green Route 18,906 17,749 - 6.1 % Pompano Beach - Red Route 25,450 26,669 4.8 % Pompano Beach – Orange 15,662 12,672 - 19.1 %
Tamarac - Red 48,440 36,704 - 24.2 %
West Park 5,859 4,805 - 18.0 %
SYSTEM TOTALS: 2,151,410 1,748,120 - 18.7 %

2 / Overview and Accomplishments for 2020
BCT 2021-30 TDP Annual Update | Overview and Accomplishments for 2020 10
BCT System Ridership Highlights
For 2020, overall ridership on BCT’s four layers of service (Local, Breeze, Express, Community Shuttle) decreased -17.5% (see Table 2-3).
Table 2-5: BCT Ridership Totals by Service Type
BCT Service Layer
June 2018 – May 2019
June 2019 - May 2020
% change Notes
Local Routes* 24,606,923 20,385,702 - 17.2 % *All BCT local routes Breeze Routes* 1,647,578 1,299,989 - 21.1 % *All BCT Breeze routes Express Routes* 608,017 491,778 - 19.1 % *All BCT I-95, I-595 and I-75
Express routes Community Shuttle* 2,151,410 1,748,120 - 18.7 % *All BCT-funded svc. SYSTEM TOTAL: 29,013,928 23,925,589 - 17.5 %
Broward County Transportation Surtax and the TDP On November 6, 2018 Broward County voters approved a 30-year, one-cent transportation surtax for a multimodal transportation project plan. Projects funded in the plan include:
• All unfunded capital and operating needs from the BCT 2019-28 TDP • Broward County roadway, bridge, traffic signalization, school zone safety, greenway, other
multimodal needs • Full capital and operating funding of existing Community Shuttle system with 18 cities • Potential to fund over 700 municipal-based multimodal transportation projects submitted to
Broward County that met the State’s Transportation Surtax Statute With the passage of the surtax plan in November, there are many recent updates to the program:
• Collection of the surtax began on January 1, 2019, with the County receiving the first revenue distribution in mid-March 2019.
• The Appointing Authority identified in the Ordinance was seated in January and completed their nomination and selection process in March. The Independent Transportation Surtax Oversight Board held its first meeting on April 25, 2019 where it approved the FY 2019 budgetary requests and proposed projects.
• All surtax-funded BCT projects must go before the Oversight Board for review and approval, annually, to coincide with the County’s budget process.
• All BCT projects approved by the Oversight Board are then submitted to its governing board (Broward County Board of County Commissioners) for final approval (approved by Board in September 2019).
Additional information on the Surtax Plan can be found at the following link:
http://www.broward.org/PennyForTransportation/Pages/default.aspx

2 / Overview and Accomplishments for 2020
BCT 2021-30 TDP Annual Update | Overview and Accomplishments for 2020 11
BCT SERVICE AND CAPITAL PLAN ACCOMPLISHMENTS IN 2020 The following outlines BCT’s transit service and transit capital project accomplishments for 2020. This section meets the requirement of an Annual TDP Update in accordance with Rule 14-73.001 – Public Transit, Florida Administrative Code (F.A.C.), particularly the Annual Update codes that require BCT to document the following:
• Past year’s accomplishments compared to the original implementation program; • Analysis of any discrepancies between the plan and its implementation for the past year and steps
that will be taken to attain original goals and objectives. This section will review the progress on the service and capital projects that were stipulated for start or completion in last year’s 2019-28 TDP Major Update. A similar review of the Goals and Objectives will occur in Section 3.
BCT Service Plan Accomplishments in 2020 As part of BCT’s adopted 2019-28 TDP Service Plan (see Table 2-4) and surtax plan, BCT planned to focus on the following initial improvements for 2020:
1. Increase in bus frequency for better service on other local routes; 2. Implementation of two new bus routes on Rock Island Road and Nob Hill Road; and 3. Expansion of service hours to meet the needs of BCT customers and requests from the business
community However on March 9, 2020, Governor DeSantis declared a State of Emergency for the State of Florida due to the COVID-19 Pandemic. As a result, Broward County and BCT implemented the following:
• March 23, 2020- Social distancing guidelines were implemented with mandatory wearing of masks or facial coverings
• March 24, 2020- Fare collection was temporarily suspended with customers using rear door boarding
• March 28, 2020- Service reductions were implemented Due to the pandemic and its devastating effects on ridership, BCT was unable to implement the majority of the elements proposed in last year’s annual update. As also shown in last year’s annual update, BCT had plans to implement new service in May 2020 and September 2020. At the on-set of the pandemic, however those plans changed and the service planned for May was pushed to September, and the service planned for September was pushed out to the spring of 2021. However, as the conditions continued to deteriorate, those plans changed again to not implementing any new service in 2020 and pushing all new service plans for 2020 to 2021. Due to the ridership loss, the understandably slow growth once things started to re-open, and the fiscal impact due to lost revenues from the economy essentially coming to a stand-still, it was decided in the early summer of 2020 that there would be no new service or growth in BCT’s system until FY 2023.

2 / Overview and Accomplishments for 2020
BCT 2021-30 TDP Annual Update | Overview and Accomplishments for 2020 12
New service implemented in 2020 is listed in Table 2-7 and was done so, per last year’s annual update in January 2020; prior to the pandemic. Items added or changed in 2020 are noted in orange. Highlights include:
Expansion of Service Hours: 1,300 annual revenue hours of new service added for Route 72 as part of surtax-funded implementation program (see Table 2-5 for details). New service was deployed during January 2020. See Map 2-3 for details on all proposed and implemented service for 2020.
Table 2-6: BCT 2020-29 TDP Service Plan
Fiscal Year
Weekday Headway Increase
Weekend Headway Increase
Running Time Enhancements
Service Span Increase
Restored Route Service
Route Realignment &
Extensions
New Local/Breeze
Routes
New Rapid Bus- BRT Routes
2020 1,11,42 11,42 11,42,72 11,42 Rock Is land
2021 23,28 23,28 1,18,28, 36 23,28 Nob Hi l l US 441
2022 55,62 55,62 22,55,62 55,62 McNab
2023 10,14,20 10,14,20 10,14,20 10,14,20 Flamingo
2024 5,16 5,16,50,60 5,16,50,60 4,5,16 Douglas Oakland Park
2025 9,12,31,40,81 9,12,31,40,81 9,12,31, 40,81 9,12,31,40,81 Johnson
2026 36,48 34 15,34,48 Gri ffin
2027 6,56 6,56 6,7,23,56 Wi les US 1
2028 15,83,88 15,83,88 30,83,88 Palm
2029 28,81

2 / Overview and Accomplishments for 2020
BCT 2021-30 TDP Annual Update | Overview and Accomplishments for 2020 13
Table 2-7: BCT FY 2020 Service Plan Implementation
Route Corridor(s)Weekday Headway
Saturday Headway
Sunday Headway
Service Span
Increase
Running Time
Route Realignment &
Extensions
New Local or Breeze
RouteHighlights/ Notes
72Oakland Park
Blvd.Jan-20 Jan-20 Jan-20
Weekday headway increases , Sat and Sun service span increase
5* Pembroke Rd. *Postponed due to COVID-19 pandemic
11Las Olas Blvd/
Galt Mile*Postponed due to COVID-19 pandemic
13 Rock Island Rd. *Postponed due to COVID-19 pandemic
48* Hillsboro Blvd. *Postponed due to COVID-19 pandemic
9*Young Circle to
Broward Central Terminal
*Postponed due to COVID-19 pandemic
21* Nob Hill Rd *Postponed due to COVID-19 pandemic
42 Atlantic Blvd. *Postponed due to COVID-19 pandemic
JANUARY 2020
MAY 2020
SEPTEMBER 2020
Service improvement that was in original 2019-28 TDP Service Plan for 2020 implementation
Proposed new service changes for 2020.
2 / Overview and Accomplishments for 2020
BCT 2021-30 TDP Annual Update | Overview and Accomplishments for 2020 14
Map 2-3: BCT January 2020 Service Improvements

2 / Overview and Accomplishments for 2020
BCT 2021-30 TDP Annual Update | Overview and Accomplishments for 2020 15
BCT Community Shuttle Accomplishments for 2020 Since 1991, BCT has been partnering with numerous Broward cities in providing Community Shuttle Transportation Services. These services provide a key link in BCT’s regional transportation network, allowing wheelchair-accessible mini-bus circulation into city neighborhoods and destinations more difficult to serve with larger buses. By the end of FY2019 BCT continued to provide partial capital and operating/maintenance funding support for 18 cities:
• Coconut Creek • Coral Springs • Dania Beach • Davie • Deerfield Beach • Fort Lauderdale • Hallandale Beach • Hillsboro Beach • Lauderdale-by-the-Sea
• Lauderdale Lakes • Lauderhill • Lighthouse Point • Margate • Miramar • Pembroke Pines • Pompano Beach • Tamarac • West Park
In 2020, BCT finalized the process of implementing transportation surtax-specific partnerships for existing and expanded Community Shuttle services. First, BCT Community Shuttle service partnership agreements were adopted to reflect full surtax funding for the total capital and operating/maintenance costs of the existing service in operation in the 18 communities listed above. In addition, BCT continues to provide technical staff support and assistance (including training, service planning, scheduling, printing of bus schedules, and purchase of shuttle stop signs). The second major Community Shuttle activity in 2020 was to be the surtax-funded expansion of the overall Community Shuttle Program (CSP). In 2019, BCT reached out to Broward County municipalities with an invitation to apply for expanded or new service. To date, BCT has received applications for new service from North Lauderdale, Oakland Park, and Plantation. In addition, requests for expanded service were received from existing partners, including Coconut Creek, Deerfield Beach, Fort Lauderdale, and Hallandale Beach. Service applications were evaluated in 2019 with the expectations of implementation in FY20. The pandemic and its effects have postponed new service implementation until FY21 if not beyond. (see Ch. 4).
BCT Rapid Bus/Bus Rapid Transit (BRT) Plan Accomplishments for 2020 In the 2020-29 TDP and 30-year transportation surtax plan, three Rapid Bus/Bus Rapid Transit (BRT) projects were scheduled for implementation (see Table 2-4):
• State Road 7/US 441 (2021) • Oakland Park Blvd. (2024) • US 1 (2027)

2 / Overview and Accomplishments for 2020
BCT 2021-30 TDP Annual Update | Overview and Accomplishments for 2020 16
In 2020, BCT continued the planning phase for the implementation of BRT service. BCT wanted to take a fresh look at the system through recommendations from the Comprehensive Operations Analysis (COA) and System Revisioning (SR), and Transit Systemwide Study, Plan, and Preliminary Design (TSSPPD). The latter, formally known as the Transit Corridor Investment Study (TCIS), was to examine fixed guideway and mixed-traffic alternatives for the first BRT corridor and make recommendations which may or may not be SR 7/US 441 and Oakland Park Blvd. The overall goal of the TSSPPD study is to, at a minimum, examine the Rapid Bus/BRT concepts that were included in the 30-year transportation surtax plan approved by the voters. The Rapid Bus/BRT concept was assigned $2M per mile (on each corridor) in surtax capital funds and associated Operating & Maintenance funds for the following premium transit investments:
• 10/15-minute Weekday service on all corridors • Limited stop service (stops located every ½-1 mile apart) • Transit signal priority and queue jump systems • Enhanced stations and related amenities • Level boarding stations • Branded vehicles and stop locations
The Rapid Bus/BRT concept for BCT is intended, at a minimum, to meet the Federal Transit Administration (FTA) definition of Corridor-Based BRT. Where possible, additional FTA-defined Fixed Guideway BRT and Light Rail Transit (LRT) elements will be analyzed for each corridor. It is expected that the TSSPPD will begin in 2021 (see Ch. 4) and have a 12 to 14-month schedule to completion. BCT expects to award a contract for the TSSPPD in late 2020. BCT Rail Plan Accomplishments for 2020 In 2020, BCT continued with the process of initiating a rail study. The purpose of the rail study was to complete an analysis that identifies the potential 26 miles of LRT network corridors to be developed in the next thirty years per the 30-year Transportation Surtax plan. This effort was to include a robust community and public involvement process and expected to begin in 2020 (see Ch. 4) with an 18 to 24-month schedule to completion. It is key to note here that based on a reassessment of internal priorities and in the interest of leveraging resources and efforts, in 2020 the rail study effort initially called the Rail Network Corridor Study (RNCS) was combined with the TCIS to streamline the process. This combined effort is now the TSSPPD and will not only recommend a corridor(s) for BRT suitability but LRT as well. BCT expects to award a contract for the TSSPPD in late 2020. Other Planning Accomplishments for 2020 In 2020, BCT postponed the Comprehensive Operations Analysis (COA) and Service Revisioning (SR) study due to COVID. At the point it was postponed, the RFP was actually set for Board approval to advertise. The overall goal of the COA is to develop a plan that will enhance the efficiency and effectiveness of the existing and planned BCT system in an ever-changing transit market environment. The COA will provide a detailed review of BCT's existing operations and services in order to enhance service quality for existing and potential customers, provide practical strategies to increase ridership and productivity of the existing and

2 / Overview and Accomplishments for 2020
BCT 2021-30 TDP Annual Update | Overview and Accomplishments for 2020 17
projected system needs, update BCT's service and productivity standards, update BCT's route and stop-by-stop data sets, and provide strategies for financial efficiencies and operational improvements. A Service Revisioning (SR) effort will take a fresh look at Broward County’s transit system, given existing transit facilities and expanded financial resources, and design a new County transit system for existing and planned expansion of fixed route, community shuttle, express services, and planned Rapid Bus/Bus Rapid Transit (BRT) and Light Rail Transit (LRT). Additional Mobility on Demand (MOD) solutions will be analyzed and incorporated as well. The consultant team will be tasked to evaluate the current system and develop creative recommendations in the near, mid and long-term, and design a financially sustainable future transit system that will grow ridership while supporting commitments made in the 30-year transportation surtax plan. An important element for this effort will include a comprehensive on-board survey that will provide both service-related and attitudinal data. In light of the extensive public involvement and outreach as part of the COA/SR, the current operating environment would preclude that based on safety concerns. Due to the pandemic this effort has been postponed. COVID-19 Impacts As a side note, the current operating environment is unchartered territory for not only BCT but every transit operator across the country. In light of early projections and optimism that ridership would return, based on the longevity and effects for the foreseeable future, there is a lot of uncertainty. BCT feels that although we have seen some increases in ridership since our lowest point in March 2020, we expect to end the fiscal year down about 25% from FY2019. At this point, our future is uncertain with regards to service plans we initially planned to implement over the next five (5) years. We are projected to have a $600 million shortfall in surtax funding, as such we are not sure currently what the next five (5) years will mean with respect to service. Although the majority of our ridership is a captured market and the mode-split has historically been near 2% in Broward County, the number of businesses that have closed coupled with layoffs could have much longer effects than initially anticipated. Will there be a shift in demographics, jobs, or even working and commuting patterns? BCT has placed all fixed-route service expansions and new service on hold. There will be no growth in the system over the next two (2) fiscal years and then very conservative growth (3% per year) in FY23, FY24, and FY25.

2 / Overview and Accomplishments for 2020
BCT 2021-30 TDP Annual Update | Overview and Accomplishments for 2020 18
BCT Capital Plan Accomplishments for 2020 In 2019, BCT implemented many key portions of the annual Capital Plan (see Table 2-5 below) from last year’s 2019-28 TDP Annual Update. Highlights include:
Table 2-8: BCT FY 2019 Capital Plan Implementation
Planned Improvement Planned
Implementation Year
2020 Progress
Bus Shelter/Stop Replacement-Upgrades 2020 88 shelters installed in nine municipalities. Bus Stop/Pedestrian Improvements 2020 41 bus stops/bus stop pedestrian access areas improved. Bus Stop Sign Replacement Program 2020 2665 new bus stops signs installed in 2020 Bus Fleet Upgrades/Replacement 2020-21 147 new buses ordered in 2019. 139 buses delivered as of
September 2020; 115 currently in service. The balance expected to be delivered October 2020. Five (5) MCI’s ordered in March 2020 with expected delivery January
2021. Four (4) 60’ articulated buses ordered in March 2020 with an expected delivery in December 2020. 42 buses
purchased for Community Shuttle with expected delivery in spring 2021.
Paratransit Fleet Upgrades/Replacement 2010-21 146 new paratransit vehicles ordered in 2019. 60 new paratransit vehicles ordered in 2020.
Electric Buses/Infrastructure Expansion 2020-21 Twelve (12) 40’ electric buses ordered with expected delivery Summer 2021. Associated charging infrastructure to be installed by June 2021.
West Regional Terminal Access and Pedestrian Improvements
2020 Construction started in March 2020 and is expected to be complete by October 2020.
Broward Breeze Transit Signal Priority (TSP) System Implementation
2019-20 Implemented in March 2020.
B-Cycle Expansion 2020-21 No new stations were added in 2020 Fleet Wi-Fi Deployment 2020-21 BCT began Wi-Fi deployment program for all BCT buses in
2019. This deployment will continue into 2020. Powerline Rd. Median & Bus Only Signal 2020-21 Addition of new turn signal and access improvements on
Powerline Rd. for SB Rt. 14. Design complete, Construction in 2020-21 anticipated.
Sample Rd. Queue Jumper Pilot Project 2020-21 This FDOT-led Design Phase and testing of Queue Jumper technology at select intersections was constructed in 2019. This project is still in the testing phase. Implementation is
expected to be late 2020 or early 2021. Mobile Ticketing and Interoperable Fare Collection System
2019-20 BCT’s Mobile Ticketing App debuted in late 2019. On-going efforts are to optimize the system.
Miramar Park and Ride 2020-21 Construction starts September 2020. Site expected to be operation in late 2021.
Lauderhill Mall Transit Center 2019-20 Construction began in March 2020. Facility expected to be operation in March 2021.
I-75 Express Park and Ride Lot #1 2019-20 This project is no longer viable due to objections from Weston City Commission and subsequent removal of
funding from the UPWP by the BMPO. Copans Campus Rehabilitation & Upgrade 2020-21 Demolition of buildings 1 and 2. Next phase includes new
parking reconfiguration, parking garage, security improvements, paint booth/detailing station, electrical
infrastructure, 400-space parking garage, training building, renovations of buildings 2 and 4, NEPA. Major
modernization/expansion of the facility is funded by Grant and Surtax funds.
I-75 Express Park and Ride Lot #2 2024 Site in Pembroke Pines under review in 2019.

2 / Overview and Accomplishments for 2020
BCT 2021-30 TDP Annual Update | Overview and Accomplishments for 2020 19
Bus Fleet Upgrades/Replacements: In 2019, BCT ordered 147 new 40’ buses. 82 of these buses are to replace current vehicles in use. The remaining 65 buses will be used for new bus service implemented as part of the surtax implementation program. In addition, 12 electric buses for an electric bus program were also purchased. The purchase of 146 new propane-fueled paratransit vehicles was initiated in 2019 and received between October 2019 and June 2020. The purchase of an additional 60 new propane-fueled paratransit vehicles was initiated in September 2020 with an expected delivery prior to the end of the calendar year. State funded vehicles included an order of five (5) MCI’s to support the express service and four (4) articulated buses for use on some of BCT’s heaviest corridors. FDOT funds 100% of the operating and maintenance for the express service through the collection of tolls on the managed lanes and an FDOT TRIP Grant funded the purchase of the articulated buses with a match from Broward County.
Mobile Ticketing/Regional Interoperable Fare: In 2019, BCT launched it’s new Mobile Ticketing App which allows customers to access BCT fare products via their personal electronic device. In addition, BCT is working with other major public transportation providers in the region (Miami-Dade Transit, Palm Tran, SFRTA) to develop the capability of selling each of these agency’s fare products on BCT’s App. Likewise, BCT is working with these agencies to ensure that BCT’s fare products can all be purchased seamlessly on all other agency fare apps. Finally, the four agencies are also developing Regional Pass mobile fare products that will allow a passenger to ride multiple transportation systems using the same fare product. It is the agency’s plan to continue with the optimization of the platform.
Lauderhill Mall Transit Center: Construction on this facility started in March 2020 with an expected completion date of March 2021. The planned facility will serve five (5) fixed-route and three (3) community shuttle routes and feature ten (10) bus bays. The transit center will also house restrooms, ticket/pass sales, enhanced security and assistance with trip planning.
Bus Shelter/Bus Stop Upgrades: In 2020, BCT installed 118 new bus shelters throughout the BCT system. Shelters installed include the following locations: Broward College (6), Coconut Creek (8), Coral Springs (5), Deerfield Beach (1), Hollywood (11), Lauderdale Lakes (5 – Prefabricated), Lauderdale Lakes (3 – Cast-in-Place), Lauderdale by the Sea (5), Miramar (1 – Cast-in-Place), North Lauderdale (22), Plantation (3 – Cast-in-Place and 1-Cast-in-Place @ West Regional Terminal), Pompano Beach (19), Broward Municipal Services District (23) and West Park (5). With these additions, there are now 1,219 bus shelters in place throughout the BCT system. Broward B-Cycle Program: BCT’s Broward B-Cycle bike sharing program saw its largest increase in ridership in its history during State FY2020. There were 53% more annual trips in 2020 (57,625 annual trips) compared to 2019 (37,670 annual trips). Ridership actually grew during the COVID-19 pandemic, most likely due to the decrease in vehicular traffic, which is great for the riders and for the environment. Another factor may also be the popularity of the pedal-assist electric (E-Assist) bikes that were introduced in 2019. At the on-set of the pandemic, the e-scooters were taken out of Fort Lauderdale, and as a result, B-Cycle ridership saw a huge increase. Bikes and station equipment are currently being replaced as they are nine (9) years old and rusted out due to the harsh environment. Broward County recently met with the City of Fort Lauderdale in the hopes of opening more B-Cycle stations.

2 / Overview and Accomplishments for 2020
BCT 2021-30 TDP Annual Update | Overview and Accomplishments for 2020 20
Broward B-Cycle is part of the County’s transportation system, and they have not been closed at any point during the pandemic; just as we didn’t stop running our bus system. The bikes and station kiosks are disinfected every morning and when they are rebalancing the bike system, B-Cycle staff are wearing masks when servicing the bikes and stations. They have been following recommended CDC protocols for sanitizing the system and any possible touchpoints and also include information on their website and kiosk recommending users also take personal actions to protect themselves including hand washing and social distancing. TRANSIT STRATEGIES AND PARTNERSHIPS: 2020 In 2020, BCT engaged in a number of local and regional strategies and partnerships that highlight BCT’s overall goals and objectives in improving and expanding public transportation services and accessibility in BCT’s service area. Table 2-6 highlights the subcommittees and/or studies from 2020. Many of these studies/projects/committees will continue into 2021.
Table 2-9: BCT FY 2020 Transportation Study/Committee Participation Study/Project/Committee BCT Participation Community Shuttle Quarterly Forum Lead Agency
Central County Community Advisory Board Partner Agency
City of Fort Lauderdale TOD Technical Working Group Partner Agency
Next Stop Ft. Lauderdale Planning Study Partner Agency
Regional Express Bus Team Partner Agency
Broward MPO Technical Advisory Committee (TAC) Member
Broward MPO Citizen Advisory Committee (CAC) Meeting Attendee
SFRTA Planning Technical Advisory Committee (PTAC) Member
Broward County ITS Coordinating Committee (DITTO) Partner Agency
Regional TSM&O Subcommittee Partner Agency
Broward MPO Complete Streets Advisory Committee Technical Advisory Committee Member
Broward County Complete Streets Team Partner Division
Broward County Comprehensive Plan Update (Broward NEXT) Partner Agency
Broward MPO Integrated Corridor Management (ICM) Study Partner Agency
Broward MPO Mobility Hub Project Partner Agency
FDOT I-95 Corridor Mobility Planning Project Partner Agency
Southeast Florida Clean Cities Coalition Partner Agency
FDOT D4/D6 Traffic Management Incident Team (TIM) Partner Agency Southeast Florida Transportation Council (SEFTC): Regional Transportation Technical Advisory Committee (RTTAC) RTTAC Member
Multi-Modal Level of Service Technical Working Group Member
Golden Glades Park & Ride Public Outreach Advisory Committee Partner Agency
US-1 South Transit Signal Priority (TSP) Implementation Partner Agency
Aerial Connectivity Study along I-595 Corridor Project Advisory Committee (PAC) Partner Agency
FDOT Non-Motorized Data Collection Project Partner Agency

3 / Goals and Objectives Update and Assessment for 2020
BCT 2021-30 TDP Annual Update | Goals and Objectives Update and Assessment for 2019 21
The following section describes BCT's progress in June 2019 – May 2020 with the Goals and Objectives developed and adopted in the major TDP update, BCT Connected (2019-28). The five Goals and Objectives described below were developed and adopted in order for BCT to best implement the overall transit vision of BCT Connected. This section meets the requirement of an Annual TDP Update in accordance with Rule 14-73.001 – Public Transit, Florida Administrative Code (F.A.C.), particularly the Annual Update codes that require BCT to document the following:
• Past year’s accomplishments compared to the original implementation program; • Analysis of any discrepancies between the plan and its implementation for the past year and steps
that will be taken to attain original goals and objectives Goal 1: Promote and Advocate Economic Development and Livability Through Transit Investments Public transportation is a critical component in the support of both regional economic vitality and growth and livability principles. Transit services can help support increased economic activity by providing mobility for an expanded workforce while also working in conjunction with local area land use regulations (in the form of planning, zoning, and design standards) to encourage high density, mixed use development around transit nodes. Broward County is especially interested in this last concept and is implementing Complete Streets enhancements and transit-supportive land use changes and development on major corridors, which can help provide economic benefit by promoting infill/redevelopment and by enhancing the value of existing land uses. This goal seeks to ensure that BCT continues to coordinate with the County and other partners in supporting the ongoing economic development and livability activities in the region.
Table 3-1: Goal 1 with Objectives, Actions and Measures Goal 1: Promote and Advocate Economic Development and Livability Through Transit Investments
Objective 1.1 Advocate regional connectivity by promoting BCT’s role as a transit service provider Objective 1.2 Coordinate to link multimodal transportation and land use decisions. Objective 1.3 Integrate BCT’s service planning efforts with other local and regional plans Objective 1.4 Develop long-range transportation services beneficial to the region
Action 1.1 Promote transit as a benefit to the business community Action 1.2 Become an active participant in organizations with local and regional partners with a focus on economic
development and livability Action 1.3 Actively work with local communities to ensure that transit is an integral part of the comprehensive
Planning process Action 1.4 Monitor development for new transit markets in coordination with local and regional organizations Performance Measures: • Community Shuttle Ridership
• Community Shuttle Partners • B-Cycle Trips and Stations • Passenger Transfers Accepted from Other Transit Agencies • Meetings and Presentations to the Community

3 / Goals and Objectives Update and Assessment for 2020
BCT 2021-30 TDP Annual Update | Goals and Objectives Update and Assessment for 2019 22
For Goal 1, BCT continued to meet with members of the community and public as demonstrated in the number of meetings/presentations made. Due to poor ridership and the inability to maintain 7.1 passengers per hour, the City of Hollywood, per the Inter-Local Agreement, lost County funding on two (2) of their community shuttle routes. As ridership on the 3rd ride started to decline, the City elected to leave the Community Shuttle Program and opting instead to pursue Micro-Transit as an option. Broward B-Cycle Program: BCT’s Broward B-Cycle bike sharing program saw its largest increase in ridership in its history during State FY2020. There were 53% more annual trips in 2020 (57,625 annual trips) compared to 2019 (37,670 annual trips). Ridership grew during the COVID-19 pandemic, most likely due to the decrease in vehicular traffic, which is great for the riders and for the environment. Another factor may also be the popularity of the pedal-assist electric (E-Assist) bikes that were introduced in 2019. Finally, transfer activity with surrounding systems (Tri-Rail, Palm Tran, Miami-Dade Transit) declined as overall systemwide ridership had declined.
Table 3-2: 2020 Goal 1 Performance Assessment
Goal 1: Promote and Advocate Economic Development and Livability Through Transit Investments
Performance Measure 2020 Target 2020 Performance Status
Community Shuttle Ridership 2,546,690 Annual Ridership 1.75M trips Community Shuttle Partners Maintain 19 Partners 18 Partners
B-Cycle Trips Annual Increase in Trips 19,955 more trips in 2019-20 B-Cycle Stations 1 New Station Annually No New Stations
Transfers Accepted Growth Annually -21.7% Less Transfers Accepted
Public Meetings/Presentations Minimum of 70 Annually 75 Meetings/Presentations Goal 2: Make BCT a Transportation Provider of Choice for Current and Potential Customers This goal focuses on the delivery of high-quality transit services to all existing and potential transit customers (see Table 3-3 below). In order to meet this goal, BCT has focused on many important areas of service delivery such as improved On-Time Performance (OTP), upgraded bus stops/improvements, more/upgraded supportive amenities and increasing outreach to customers via social media.
Table 3-3: Goal 2 with Objectives, Actions and Measures
Goal 2: Make BCT a Transportation Provider for Current and Potential Customers Objective 2.1 Increase frequency of service to meet customer demand Objective 2.2 Expand coverage of services to meet customer demand Objective 2.3 Improve productivity of services Objective 2.4 Improve customer service Objective 2.5 Maintain proactive communication with customers and stakeholders Objective 2.6 Improve the perception of public transportation
Action 2.1 Monitor customer complaints on a regular basis and determine trends Action 2.2 Monitor and improve on-time performance Action 2.3 Enhance marketing and community involvement campaigns Action 2.4 Monitor low-performing routes against performance standards Action 2.5 Invest in capital projects that will improve customer satisfaction and convenience Action 2.6 Coordinate with regional partners to create an interoperable fare collection system Performance Measures: • System Enhancements • Website Visits
• On-Time Performance • MyRide App Usage • Total Passengers per Revenue Hour • Number of Customer Service Calls Answered • Transit Market Share • Fixed Route Complaints • Transit Amenities • Paratransit Complaints

3 / Goals and Objectives Update and Assessment for 2020
BCT 2021-30 TDP Annual Update | Goals and Objectives Update and Assessment for 2019 23
Many targets were met or exceeded during 2019 - 2020 for this goal (see Table 3-4 below). The addition of 1300 new service hours system-wide in January 2020 allows us to meet our goal but is substantially less than what was planned and funded (see Ch. 2). In addition, Broward County’s total Transit Market Share (% of total commuters who utilize public transportation) remains above the set target. Finally, BCT improved a larger number of bus stop areas for enhanced pedestrian access and comfort. For other measures, BCT fell short on targets. It should be noted that OTP has trended upwards over the last two Quarters (68.3%, 74.1%), demonstrating some consistent improvement. We think this is due in part to reduced traffic associated with the pandemic. The remainder of the measures and targets were missed relating to customer service and complaints and will be closely monitored in 2021. Finally, the use of BCT’s MyRide website declined. App usage wasn’t calculated because BCT has not been able to track app usage since October 2019 due to a technical update associated with the platform vendor. In spite of that, there would have certainly been pandemic related impacts as well.
Table 3-4: 2020 Goal 2 Performance Assessment
Goal 2: Make BCT a Transportation Provider of Choice for Current and Potential Customers
Performance Measure 2020 Target 2020 Performance Status
Service Enhancements Annual Increase in New Rev. Hrs. 1,300 New Hrs. On-Time Performance (OTP) Maintain 73.0% OTP or Above 70.4% OTP avg.
Total Pass. Per Rev. Hour (PPH) 25.5 PPH Minimum 17.9 PPH Transit Market Share 2.0% ACS Commuter Market Share 2.7 % Share Bus Stop Upgrades Annual Increase 100 Bus Stops
Website Visits Avg. 410,000 Visits per Month 194,029 mon. avg. MyRide App Usage % Increase in MyRide Webpage Visits 10.6% Decrease
No. of Customer Svc. Calls Answered 400,000 Annually 350,811 answered Fixed Route Complaints 16.5 or less per 100K passengers 37.9 /100K Paratransit Complaints 4,000 Annually 5,303 Complaints
Goal 3: Achieve Financial Stability and Efficiency The focus of this goal is to maintain BCT's financial stability and efficiency (see Table 3-5 below). Critical to achieving this goal is to maintain and improve the operations that increase financial efficiency for the existing system, securing matching new funding for all system needs, and continuing to expand fares and bus pass sales.

3 / Goals and Objectives Update and Assessment for 2020
BCT 2021-30 TDP Annual Update | Goals and Objectives Update and Assessment for 2019 24
Table 3-5: Goal 3 with Objectives, Actions and Measures Goal 3: Achieve Financial Stability and Efficiency
Objective 3.1 Work with community stakeholders and partner agencies to identify and secure new matching funding sources for transit Objective 3.2 Ensure business practices provide funding partners and stakeholders with the maximum benefit for their investment Objective 3.3 Increase farebox recovery and ridership
Action 3.1 Present frequently updated reports on BCT's unfunded programs Action 3.2 Work with community stakeholders to develop a coordinated approach to seeking and/or maintaining a
dedicated funding source for transit Action 3.3 Actively seek additional and sustainable funding and policy opportunities for new and expanded services Performance Measures: • Ridership
• Cost per Fixed Route Passenger • Cost per Paratransit Passenger • Farebox Recovery • Subsidy per Fixed Route Passenger • Bus Pass Sales
For Goal 3, BCT had significant challenges that resulted in inefficiencies and a disappointing year overall. Ridership, Farebox Recovery, as well as Bus Passes Sold all decreased, while all the Cost measures increased with the exception of “Paratransit Cost per Passenger”. This is no doubt due to COVID-19 and its negative impact on ridership as well as BCT temporarily suspending fares at the end of March. Although BCT expects to resume fare collection and return to a “full-service” schedule eventually, the foreseeable future remains unclear with respect to both. It is expected that coming studies will provide direction and make recommendations to assist with both.
Table 3-6: 2020 Goal 3 Performance Assessment
Goal 3: Achieve Financial Stability and Efficiency
Performance Measure 2020 Target 2020 Performance Status
Ridership 27.5M Annual Ridership 22.2M trips Cost per Fixed Route Passenger $3.75 / Passenger Trip $4.98 / Passenger Trip Cost per Paratransit Passenger $28.21 / Passenger Trip $27.25 / Passenger Trip
Farebox Recovery 27 % Farebox Recovery 15.7 % Farebox Recovery Subsidy per Fixed Route Passenger $2.85 / Passenger Trip $4.24 / Passenger Trip
Bus Pass Sales 430,000 Annually 246,776 passes sold Goal 4: Develop a BCT Workforce that is Highly Qualified, Efficient, Productive, and Motivated to Customer Service Excellence BCT is dedicated to remaining an exemplary employer that continues to hold its staff to the highest standards. It is important for BCT to continue to develop a culture of accountability that is demanded at all levels of employment. This goal statement includes safety and security to better reflect BCT’s operating policies and align with the County’s goals and federal guidelines.

3 / Goals and Objectives Update and Assessment for 2020
BCT 2021-30 TDP Annual Update | Goals and Objectives Update and Assessment for 2019 25
Table 3-7: Goal 4 with Objectives, Actions and Measures
Goal 4: Develop a BCT Workforce that is Highly Qualified, Efficient, Productive, and Motivated to Customer Service Excellence
Objective 4.1 Attract, recruit, and retain professional, diverse, and skilled employees Objective 4.2 Promote opportunities for continuous training to support workforce development Objective 4.3 Promote accountability with a focus on customer service and safety as a culture
Action 4.1 Present frequently updated reports on BCT's unfunded programs Action 4.2 Work with community stakeholders to develop a coordinated approach to seeking and/or maintaining a
Dedicated funding source for transit Action 4.3 Actively seek additional and sustainable funding and policy opportunities for new and expanded services Action 4.4 Provide opportunities for supplemental training and employee recognition Performance Measures: • Preventable Accidents
• Employee Workdays Lost to Injury • Number of FTA Random Drug Tests • Number of FTA Random Alcohol Tests
For Goal 4, BCT has seen some progress in safety including a reduction in Preventable Accidents and an increase in Random Drug Tests and Alcohol Tests (see Table 3-8 below).
Table 3-8: 2020 Goal 4 Performance Assessment Goal 4: Develop a BCT Workforce that is Highly Qualified, Efficient, Productive, and to Customer Service Excellence
Performance Measure 2020 Target 2020
Performance Status
Preventable Accidents 0.90 / 100K Miles 0.77 / 100K Miles Employee Workdays Lost to Injury .80 /No. of Injuries per 100K trips 0.85 / 100K Trips
FTA Random Drug Tests 320 Annually 361 Tests Taken FTA Random Alcohol Tests 120 Annually 154 Tests Taken
Goal 5: Implement Capital Program Plan to Maintain State of Good Repair and Introduce New Technologies BCT is dedicated to maintaining its capital assets in good operating condition in order to provide for a safe and pleasant experience by the passenger. Capital assets include rolling stock, facilities, and Information Technology (IT) equipment. For rolling stock, this goal includes a commitment to maintain a younger average fleet age.

3 / Goals and Objectives Update and Assessment for 2020
BCT 2021-30 TDP Annual Update | Goals and Objectives Update and Assessment for 2019 26
Table 3-9: Goal 5 with Objectives, Actions and Measures
Goal 5: Implement Capital Program Plan to Maintain State of Good Repair and Introduce New Technologies Objective 5.1 Replace vehicles according to established life cycles Objective 5.2 Maintain all vehicles and facilities in a state of good repair Objective 5.3 Practice and promote the enhancement of environmental sustainability as a culture Objective 5.4 Implement new Information Technologies (IT) to enhance provision of customer service
Action 4.1 Manage the average age of vehicles within FTA guidelines Action 4.2 Improve system reliability by improving mean distance between road failures Action 4.3 Develop and implement a 10-year capital improvement plan Action 4.4 Create a schedule for capital asset inspections and ensure that critical inspection recommendations are
Completed in a timely manner Action 4.5 Construct all new facilities to "green building" standards for energy efficiency and sustainable design Performance Measures: • Distance Between Mechanical Failures
• Preventable Maintenance Inspections • Average Age of Rolling Stock • Alternative Fuel / Hybrid Fleet
For Goal 5, BCT trended upward by performing above the target for Preventive Maintenance Inspections (PMI), but declined slightly with the percentage of the fixed route fleet that is of hybrid technology. It is notable that the Age of Rolling Stock figure should continue to trend down in the next few years as BCT began delivery of 147 new fixed route buses in 2020. In addition, many aging buses will be retired from the active fleet. Please note, the age of rolling stock has not accounted for the new vehicles received as of yet because of NTD guidelines to reporting inventory.
Table 3-10: 2020 Goal 5 Performance Assessment
Goal 5: Implement Capital Program Plan to Maintain State of Good Repair and Introduce New Technologies
Performance Measure 2020 Target 2020 Performance Status
Distance Between Mechanical Failures Minimum of 6.050 Miles 2.416 Miles Preventable Maintenance Inspections Minimum of 2,900 Annually 3,096 Inspections
Age of Rolling Stock Maintain 7 Year Avg. Age 7.78 Years Alternative Fuel / Hybrid Fleet Maintain 25% Hybrid Fleet 23.0 %

4 / Implementation Plan for 2021-30
BCT 2021-30 TDP Annual Update | Implementation Plan for 2021-30 27
The following outlines BCT’s transit service and transit capital development project implementation program for 2021-30, including the upcoming fiscal year (2021) and for the new tenth year (2030). This section meets the requirement of an Annual TDP Update in accordance with Rule 14-73.001 – Public Transit, Florida Administrative Code (F.A.C.), particularly the Annual Update codes that require BCT to document the following:
• Any revisions to the implementation program for the coming year; • Revised implementation program for the tenth year; • Added recommendations for the new tenth year of the updated plan; • A revised financial plan; and • A revised list of projects or services needed to meet the goals and objectives, including projects
for which funding may not have been identified. HIGHLIGHTS OF BCT’S 2021-30 IMPLEMENTATION PLAN In the 2019-28 TDP, BCT’s Implementation Plan was divided into a Status Quo Plan and Vision Plan needs sections. Status Quo needs were defined as needs critical to keeping buses on schedule and capital facilities in a State of Good Repair. Over time, BCT projected that existing funding sources would not keep up with the cost and number of Status Quo needs in the system, causing funding shortfalls over the life of the plan if new funding was not identified. For the Vision Plan component, the 2019-28 TDP identified numerous service and capital needs that go beyond State of Good Repair and scheduled maintenance. The Vision Plan identified the following expansion needs:
• BCT Fixed Route Bus Service Expansion • Community Shuttle Service - Full Funding of Existing Program and Service Expansion • New Light Rail Transit (LRT) Infrastructure and Service • New Rapid Bus/BRT Infrastructure and Service • New Planning Studies • New Fixed Route Buses and Paratransit Vehicles • New Transit Infrastructure
With the passage of the transportation surtax plan by voters in 2018, funding has now become available for BCT to implement all aspects of the previously unfunded Status Quo and Vision Plan needs identified in the 2019-28 TDP. The following sections will highlight BCT’s transit service and transit capital development project implementation program for 2021-30, including the upcoming year (2021), and the new tenth year (2030).

4 / Implementation Plan for 2021-30
BCT 2021-30 TDP Annual Update | Implementation Plan for 2021-30 28
BCT SERVICE AND PLANNING ACTIVITIES FOR 2021-30 The following section provides updates on service and capital projects that are funded and planned for 2021-30. Key service and capital projects that are funded for the new fiscal year (2021) are noted. BCT Fixed Route Service Plan for FY 2021 There will be no new service improvements in FY 2021. As mentioned in other chapters of this update, the effects of the pandemic have been devastating to BCT’s ridership and revenues. The intent behind the new service and service expansion was to grow ridership. BCT has not fully recovered its existing ridership base, and with no definitive timeline on how long the pandemic will be a part of the operating environment, we have no clear picture of the future at this point. There are simply too many unknown variables. BCT will use this time to plan and prepare. BCT Community Shuttle Service Plan for FY 2021
As detailed in Ch. 2, BCT will continue to partner with the municipalities to provide community shuttle service. In addition to 100% operations and maintenance funding, BCT will provide technical staff support and assistance (including training, service planning, scheduling, printing of bus schedules, and purchase of shuttle stop signs) and municipalities will continue to either directly operate or contract to operate the service.
BCT invited Broward County municipalities in 2019 to apply for expanded or new Community Shuttle service. BCT received applications for service from potential new municipal partners North Lauderdale, Oakland Park, and Plantation. Proposed service includes:
1. North Lauderdale – East and West routes 2. Oakland Park – Route 1 3. Plantation – East Route, Mid-Town Route, West Route
In addition, requests for expanded service were received in 2019 from several existing Community Shuttle partners, including Coconut Creek, Deerfield Beach, Fort Lauderdale, and Hallandale Beach. Proposed service includes:
1. Coconut Creek – Butterfly Express 2. Deerfield Beach – Express 1 3. Fort Lauderdale – Beach Link, Downtown Link, Las Olas Link, Neighborhood Link, Airport Link, Galt
Link 4. Hallandale Beach – Route 1, Route 2, Route 3, Route 4
A new element for BCT will include Micro-Transit as BCT plans to initiate a Micro-Transit Pilot Program in partnership with three communities in FY 2021. Micro-Transit is generally defined as a Demand Response Transit service that allows customers to have flexible mobility options within a given zone or service area. Communities where Micro-Transit will be developed include:

4 / Implementation Plan for 2021-30
BCT 2021-30 TDP Annual Update | Implementation Plan for 2021-30 29
1. Broward Municipal Services District – Central County and Broadview Park 2. Hillsboro Beach 3. West Park
The pandemic delayed both the review process and finalization of service plans in addition to the capital (bus) needs to support the new service requests. It is expected that the review of these service proposals will conclude in FY21 with service to possibly start in FY21 as well.
BCT Rapid Bus/Bus Rapid Transit (BRT) Activities for FY 2021
The BCT-led Transit Corridor Implementation Study (TCIS) will examine fixed guideway and mixed-traffic BRT and LRT alternatives for two corridors. It is expected that the TCIS will begin in early 2021 and has an 18-24-month schedule to completion.
BCT Rail Plan for FY 2021
The BCT-led Rail Corridor Study will provide an analysis that identifies the potential 26 miles of LRT network corridors to be developed in the next thirty years per the surtax plan (see Ch. 2). This effort will include a robust community and public involvement process. It is expected that the study will begin in 2021 and continue to completion into 2022. Other Planning Activities for FY 2021
Due to the COVID-19 pandemic, the Comprehensive Operations Analysis (COA) and Service Revisioning (SR) has been postponed, and a new date to start has not been set at this time. The overall goal of the COA/SR is to develop a plan that will enhance the efficiency and effectiveness of the existing and planned BCT system in an ever-changing transit market environment. The COA will provide a detailed review of BCT's existing operations and services in order to enhance service quality for existing and potential customers, provide practical strategies to increase ridership and productivity of the existing and projected system needs, update BCT's service and productivity standards, update BCT's route and stop-by-stop data sets, and provide strategies for financial efficiencies and operational improvements. An important element for this effort will include a comprehensive on-board survey that will provide both service-related and attitudinal data. The SR effort will take a fresh look at Broward County’s transit system, given existing transit facilities and expanded financial resources, and design a new County transit system for existing and planned expansion of fixed route, community shuttle, express services, and planned Rapid Bus/BRT and LRT. Additional Micro-Transit and other Mobility on Demand (MOD) solutions will be analyzed and incorporated as well. The consultant team will be tasked to evaluate the current system and develop creative recommendations in the near, mid and long-term, and design a financially sustainable future transit system that will grow ridership while supporting commitments made in the 30-year transportation surtax plan.

4 / Implementation Plan for 2021-30
BCT 2021-30 TDP Annual Update | Implementation Plan for 2021-30 30
In 2020 BCT started efforts to hire a general planning consultant; a first for BCT. This GPC will allow the agency to be flexible, more efficient, and expedient by having access to resources and subject matter experts that 1)BCT does currently have on staff or 2)BCT has on staff but due to competing priorities is not able to complete work or take on new tasks. This contract will select two (2) firms and will provide support to the agency in:
1. Capital Project Planning/Development 2. Transportation Planning/Analysis 3. Environmental Planning 4. Economic Development Planning 5. Public Involvement/Outreach 6. Marketing 7. Grants Compliance/Monitoring/Development 8. Organizational Assessment/Development 9. Security/Safety Planning/Assessments
This contract is currently in procurement and expected to be awarded in late 2020. It is funded $2 million annually for five (5) years.
TRANSIT CAPITAL PROGRAMS FOR FY 2021-30
The following sections highlight BCT’s Capital Budget priorities for 2021-30. This includes capital projects funded by existing funds (Federal Transit Administration, Broward County Transportation Concurrency) and new projects funded entirely by new surtax funds (see Table 5-1 and 5-2 in next Section for details). Despite the fact that service expansion has been placed on hold for the next two (2) fiscal years, Broward County is continuing to move forward with many of the capital projects funded by the surtax. In addition to putting money into the local economy many of these projects were needed for SOGR and to better position the existing BCT system to be more efficient. In addition, some of these projects will be needed when the agency begins to grow service.
FTA Grant-Funded Capital Projects
One of BCT’s critical sources of funding for the FY 2021-30 Transit-Grant-Funded Program comes from Section 5307 grant agreements with the Federal Transit Administration (FTA). Projects expected to be funded and active in FY 2021-30 include:
1. Bus and Vehicle Acquisition/Replacement/Maintenance Program New fixed route buses New transit support vehicles Capital and preventative maintenance Tire leasing
2. Infrastructure Improvement/Maintenance Programs Countywide bus stop infrastructure improvements

4 / Implementation Plan for 2021-30
BCT 2021-30 TDP Annual Update | Implementation Plan for 2021-30 31
3. Security-Related Programs Capital program for maintenance and replacement of security cameras and vehicle
surveillance systems 4. Information Technology Programs Maintenance and licensing of software and hardware including mobile radio
communications systems 5. Administrative and Contractual Costs Planning studies Project management expenses, IT support, and miscellaneous capital items.
Transit Concurrency-Funded Capital Program
The Transit Concurrency Program is funded with fees collected from developers that are transferred to the County Transportation Trust Fund. Capital projects with Concurrency funding in 2021-30 include:
1. Lauderhill Transit Center (Construction) 2. Bus Stop and Shelter Improvements 3. New Buses (Grant Match) 4. Construction Management Division Project Managers 5. Copans Rd. Maintenance Building HVAC Renovation/Design 6. Copans Rd. Operations Building Restroom Expansion
Transportation Surtax Capital Program for FY 2021-30 Funding for this section of BCT’s FY 2021-30 Capital Program comes from transportation surtax revenue (see Table 5-1 and 5-2 in next Section 5 for Capital Financial Plan details). Surtax-funded capital projects approved for 2021-30 include:
1. New Transit Infrastructure
• IT Enhancements Funds are programmed for In-Bus Signage, On-Board Contactless Payments
(Credit/Debit Cards and Smartphones), Tablets for inventory management, Power Business Reporting Systems, Radio System Digital Upgrade Analysis, Microsoft Portfolio Project Management Services, Large Monitor Enhancements, Mobile Workforce Laptops.
• Security Enhancements Funds are programmed for Apollo Bus Video Refit and Video Storage System, Security
Gate Software, Switch Hardware Replacement, Antivirus for Network Attached Storage, Peripheral Device Management, and Orion Secured Socket Layer.
• Local Bus Infrastructure Funds are programmed for construction/installation of new bus stops and stop-area
access for two (2) new local bus routes. • Bus Shelters
For FY 2021, funds are programmed for the installation of 107 new bus shelters in the BCT system. This includes the 75 programmed for FY21 in addition to 32 locations

4 / Implementation Plan for 2021-30
BCT 2021-30 TDP Annual Update | Implementation Plan for 2021-30 32
that were not installed in FY20 due to the pandemic and associated permitting delays. Shelters are planned for installation in the following communities: Coconut Creek (4), Cooper City (10), Coral Springs (10), Dania Beach (12), Hollywood (10), Lauderdale-by-the-Sea (2), Pembroke Pines (15) and Tamarac (12). Once the 75 shelters are installed, BCT will have 1,294 (1,326 including the 32 from FY20) bus shelters throughout the BCT system. Funds for additional shelters (location and amount TBD) are also programmed for FY 2022-30.
• Park and Ride Lots Funds are programmed for new Park and Ride Lots, locations TBD.
• Third Maintenance Facility Funds are programmed for a new Operations/Maintenance facility to support new
surtax-funded service. • Downtown Intermodal Center
Funds are programmed for a new Downtown Intermodal Center. • Other Intermodal Centers
Funds are programmed for new Regional Transit Centers. Locations TBD. 2. New Light Rail Transit (LRT) Infrastructure
• Rail System Planning and Study/Rail Corridor Construction Phase I Funds are programmed for a corridor study as part of Phase 1.
• Rail System Planning and Study/Rail Corridor Construction Phase II Funds are programmed for Phase II of LRT development.
• New LRT Vehicles Funds are programmed for the purchase of New LRT Vehicles.
3. New Bus Rapid Transit (BRT)/Rapid Bus Infrastructure • New BRT Planning and Study/Rapid Bus Construction Phase I
Funds are programmed for the Transit Corridor Implementation Study (TCIS) as part of Phase I.
• New BRT Planning and Study/Rapid Bus Construction Phase II Funds are programmed for Phase II of BRT implementation.
4. Bus and Other Vehicles • Fixed Route Buses (for new service and replacement needs) • Paratransit Vehicle Acquisition
5. Planning Studies • Funds are programmed for the Service Revisioning/Comprehensive Operational Analysis
(COA) and General Planning Consultant (GPC) planning studies. 6. Community Shuttle Capital and Operating
• Capital and operating funding is programmed for all existing and new Community Shuttle service.

4 / Implementation Plan for 2021-30
BCT 2021-30 TDP Annual Update | Implementation Plan for 2021-30 33
BCT FY 2021-30 SERVICE PLAN
The following section provides updates on the remaining service projects planned for the timeframe of the 2021-30 TDP Annual Update.
BCT Bus Service Plan for 2021-30 For 2021-30, many system-wide bus service improvements were planned and fully funded by transportation surtax revenue (see Table 4-2 below). Service planned for FY 2021-30 included:
• 7 new Local Bus Routes* • 4 new Rapid Bus/BRT routes* • Weekday Headway expansion on 27 Local Bus Routes* • Weekend Headway increases on twenty-five Local Bus Routes* • Service Span increase on 36 Local Bus Routes* • Realignment or Extension of 16 Local Bus Routes*
*Please note: This includes service that was not implemented in FY20, service that will not be implemented in FY21-FY22, and service that is unknown for FY23-FY25. Seeing that BCT did not implement the majority of the new service planned for FY20, Map 4-1 represents BCT’s service network as it was initially planned in March 2020. It also acknowledges, as stated on page 26, there will be no new service for FY21. The decision to move forward with the infrastructure to support the service initiatives served two (2) purposes; 1)support the local economy in light of the pandemic induced unemployment and 2)position BCT and the system to be ready to move forward with future service increases. Likewise, with regard to Map 4-2, it represents corridors for Rapid Bus Routes as identified in the original Transportation Surtax Plan in addition to BCT’s Express Network. It is key to note here that the TSSPPD will vet all corridors identified in the Transportation Surtax Plan for suitability before financial investments are made and then make recommendations. Oakland Park Blvd and SR7 were initially identified as the potential first two (2) corridors for BRT service. As mentioned in Ch. 2, the expectation is for the TCIS to make the recommendations for the corridors to receive BRT service. COVID-19 Impacts The current operating environment is unchartered territory for not only BCT but every transit operator across the country. In light of early projections and optimism that ridership would return, based on the longevity and effects for the foreseeable future, there is real uncertainty. BCT feels that although we have seen some increases in ridership since our lowest point in March 2020, we expect to end the fiscal year down about 25% from FY2019. At this point, our future is uncertain with regards to service plans we initially planned to implement over the next five (5) years. We are projected to have a $600 million shortfall in surtax funding, as such we are

4 / Implementation Plan for 2021-30
BCT 2021-30 TDP Annual Update | Implementation Plan for 2021-30 34
not sure currently what the next five (5) years will mean with respect to service. Although the majority of our ridership is a captured market and the mode-split has historically been near 2% in Broward County, the number of businesses that have closed coupled with layoffs could mean many things good and bad. Will there be a shift in demographics, jobs, or even working and commuting patterns? BCT has placed all fixed-route service expansions and new service on hold. There will be no growth in the system over the next two (2) fiscal years and then very conservative growth in FY23, FY24, and FY25. In the fall of 2019, Broward County decided to present the Transportation Surtax Oversight Board (TSOB) a Five Year Plan for project approval and then make annual updates as needed over that period. The Five-Year Plan that was presented to and approved by the TSOB on August 13, 2020 included funding for service at FY21-No Growth, FY22-No Growth, FY23-3% Growth, FY24-3% Growth, and FY25-3% Growth. This is considered very conservative and a significant service reduction from what was initially placed, programmed, and approved by voters in the Surtax Plan. In terms of overall service, this represents approximately 40,000 hours of service annually. The new local bus routes alone have service hours between 40,000 and 60,000. What becomes clear with the approved budget is that unless ridership and revenues rebound, BCT may have to make hard decisions in FY23, FY24, and FY225; i.e. take care of needs in the existing system or plan and implement growth. These are very hard decisions to make as the maintenance for the existing system will require additional investments. These needs were represented in the past in BCT’s Vision Plan. In the original Surtax Plan as approved by the voters, BCT planned for significant service growth in addition to maintaining the existing system over the next 10 years. The current environment has dictated a total growth of 9% over the next five (5) years. BCT remains hopeful though that these programmed and funded investments will be productive as the long-term effects of the pandemic are still fluid and yet to be seen. Years FY26-FY30 have been left as originally planned for no other reason than 1)too much is unknown at this point and 2)it was the plan as approved by voters. It is expected, though that one (1) LRT corridor will be identified in FY21 at which time BCT will begin efforts for a both BRT and LRT implementation. The planning efforts/studies BCT plans to implement in FY21 are expected to provide direction for how and where our system should grow and at what rate. We believe that a certain percentage of our ridership may never return and those that do return may not use the system in the same manner. We believe that the need for transit still exists and are hopeful that the planning efforts will yield a blueprint to successfully serve new markets, operate, and grow in the post-COVID world.

4 / Implementation Plan for 2021-30
BCT 2021-30 TDP Annual Update | Implementation Plan for 2021-30 35
Table 4-1: BCT 2021-30 Service Plan
Fiscal Year
Weekday Headway Increase
Weekend Headway Increase
Running Time Enhancements
Service Span
Increase
Restored Route Service
Route Realign & Extensions
New Local Routes
New Rapid Bus/BRT or
Express Routes
2021 No Expansion
No Expansion No Expansion No
Expansion No
Expansion No
Expansion No
Expansion No
Expansion
2022 No Expansion
No Expansion
No Expansion No
Expansion No
Expansion No
Expansion No
Expansion No
Expansion
2023 TBD TBD TBD TBD TBD TBD TBD TBD
2024 TBD TBD TBD TBD TBD TBD TBD TBD
2025 TBD TBD TBD TBD TBD TBD TBD TBD
2026 36,48 34 15,34,48 Griffin
2027 6,56 6,56 6,7,23,56 Wiles US 1
2028 15,83,88 15,83,88 30,83,88 Palm
2029 28,81
2030
Pines/Hollywood

4 / Implementation Plan for 2021-30
BCT 2021-30 TDP Annual Update | Implementation Plan for 2021-30 36
Rapid Bus/BRT Service Implementation The demand for Rapid Bus/BRT services on BCT’s priority corridors remains in the Service Plan (see Table 4-3). Rapid Bus is characterized by having a higher level of service than current BCT Breeze routes (including 10 or 15-minute frequencies), less bus stops, real-time information signage, Transit Signal Priority (TSP), branding, upgraded stations and additional station-area amenities. Rapid Bus services would replace Breeze routes operating in the corridor, although local fixed route service will continue in each corridor (see Map 4-4 for the Rapid Bus/BRT Network).
As detailed in Ch. 2, BCT began the planning phase for the implementation of the Rapid Bus/BRT service in 2019 and continued into 2020. The initial planning effort was called the Transit Corridor Implementation Study (TCIS). That effort is now called the Transit Systemwide Study, Plan, and Preliminary Design (TSSPPD). The goal is the same; i.e. to examine fixed guideway and mixed-traffic alternatives for the first alternatives for the first BRT corridor and make recommendations. The Rapid Bus/BRT concept for BCT is intended, at a minimum, to meet the FTA definition of Corridor-Based BRT. Where possible, additional FTA-defined Fixed Guideway BRT and Light Rail Transit (LRT) elements will be analyzed for each corridor. It is expected that the new effort will begin in 2021 and have a 12 to 14-month schedule to completion. Light Rail Transit (LRT) Service Implementation As detailed in Ch. 2, BCT began the process of initiating a Rail Network Corridor Study (RNCS) in 2019. Although initially called the RNCS, this effort has been combined with the TSSPPD. There will be an analysis that identifies the potential 26 miles of LRT network corridors to be developed in the next thirty years per the 30-year Transportation Surtax Plan. This effort will include a robust community and public involvement process and expected that to begin in 2020 (see Ch. 4) with an 18 to 24-month schedule to completion. It is key to note here that based on a reassessment of internal priorities and in the interest of leveraging resources and efforts, in 2020 the RNCS was combined with the TCIS to streamline the process. The result is the TSSPPD which will not only recommend corridors for BRT suitability but LRT as well. In addition, the corridors will be prioritized with recommendations for one (1) BRT corridor and one (1) LRT to move forward to 30% design and associated environmental.

5 / Financial Plan: FY 2021-30
BCT 2021-30 TDP Annual Update | Financial Plan: 2021-30 37
BCT FINANCIAL PLAN: FY 2021-30 The following section outlines BCT’s capital and operating financial plans for the upcoming year (2021), and all subsequent years, including the new tenth year (2030). Transit Capital Financial Plan: 2021-30 Funding for BCT’s FY 2021-30 Transit Capital Program is detailed in Table 5-1 and Table 5-2. This Financial Plan details the costs and revenues associated with the 2021-30 Implementation Plan, which was detailed in the previous Chapter (Ch. 4). Highlights of the FY 2021-30 Transit Capital Financial Plan include:
• Capital Costs for 2021-30 are approximately $3.9B. Capital Program investment highlights include:
o $313.4M for the Bus and Vehicle Acquisition/Replacement/Maintenance Program o $33.0M for New Vehicles for New Service o $1.6B for New Light Rail Transit (LRT) Infrastructure and Vehicles o $181.3M for Bus Rapid Transit (BRT)/Rapid Bus Infrastructure o $394.8M for New Transit Infrastructure o $16.7M for Existing Community Shuttle Vehicle replacements o $1.2B for Transfer to Transit Operating Fund
• Capital Revenues for FY 2021-30 are approximately $3.9B. Capital Program Revenue highlights
include:
o Nearly $3.0B in transportation surtax revenue o $16.7M in transportation surtax revenue applied to Community Shuttle Vehicles for
Existing and New Service o $284.6M from BCT’s existing formula-based Federal Transit Administration (FTA) Grant
Funding o $46.6M from the Broward County Transportation Concurrency Fund o $651.8M in future Non-Local Match Funds

5 / Financial Plan: FY 2021-30
BCT 2021-30 TDP Annual Update | Financial Plan: 2021-30 38
Table 5-1: Transit Capital Financial Plan: 2021-25
Capital Plan Element 2021 2022 2023 2024 2025
Capital Costs
Bus and Vehicle Acquisition/Replacement/Maintenance Program 24,112,962$ 25,047,037$ 33,450,458$ 38,335,878$ 37,737,833$
Infrastructure Improvement/Maintenance Programs 716,896 624,275 731,876 639,704 724,275
Security Program 485,861 500,436 507,533 522,759 530,524
Information Technology Program 3,147,921 2,291,892 2,462,545 2,045,241 2,234,268
Administrative and Contractual Costs - - - - -
Non-Grant and Concurrency Projects 4,500,340 4,411,850 4,475,206 4,540,462 4,607,676
Paratransit Vehicles 6,114,106 3,958,510 3,770,471 3,863,138 6,064,319
New 30-yr. Bus Service Plan (New Vehicles) -
New LRT Infrastructure 31,406,888 94,220,665 94,220,665 110,611,570 42,877,879
New LRT Vehicles - 34,420,901 - - -
New BRT/Rapid Bus Infrastructure 3,000,000 3,000,000 19,000,000 20,500,000 39,000,000
New BRT Vehicles - - - 33,000,000 -
New Transit Infrastructure (IT/Sec./Maint. Fac./Shelters/NTCs/P-R/Land) 69,432,240 42,402,997 84,624,116 50,843,964 48,243,666
Planning Studies/Passenger Surveys 2,000,000 2,700,000 2,000,000 2,000,000 4,000,000
Transfer to Transit Operating Fund 45,194,800 80,254,286 77,455,105 79,096,242 84,023,214
Total BCT Capital Costs 190,112,014 293,832,849 322,697,975 345,998,958 270,043,654
Capital Revenues
Transportation Surtax Revenue 157,148,034 195,136,579 233,148,799 230,939,066 196,033,398
Federal Transit Administration 28,463,640 28,463,640 28,463,640 28,463,640 28,463,640
Transfer from Concurrency 4,500,340 4,411,850 4,475,206 4,540,462 4,607,676
Non-Local Match - 65,820,780 56,610,330 82,055,790 40,938,940
Total BCT Capital Revenues 190,112,014 293,832,849 322,697,975 345,998,958 270,043,654
BCT Capital Revenues Minus Capital Costs - - - - -
Total BCT Capital Surplus/(Deficit) -$ -$ -$ -$ -$
Community Shuttle 2021 2022 2023 2024 2025
Capital Costs
Community Shuttle - Existing 2,852,000$ - - 2,016,770 2,076,420
Community Shuttle - New - - - - - Total Community Shuttle Transportation Surtax Capital Costs 2,852,000 - - 2,016,770 2,076,420
Capital Revenues
Transportation Surtax Revenue 2,852,000 - - 2,016,770 2,076,420
Total Community Shuttle Transportation Surtax Capital Revenues 2,852,000 - - 2,016,770 2,076,420
Community Shuttle Transportation Surtax Capital Revenues Minus Capital Costs - - - - -
Total Community Shuttle Transportation Surtax Capital Surplus/(Deficit) -$ -$ -$ -$ -$
Grand Total Capital Costs BCT and Community Shuttle Transportation Surtax 192,964,014$ 293,832,849$ 322,697,975$ 348,015,728$ 272,120,074$
Grand Total Capital Revenues BCT and Community Shuttle Transportation Surtax 192,964,014 293,832,849 322,697,975 348,015,728 272,120,074
Grand Total Capital Revenues Minus Capital Costs - - - - -

5 / Financial Plan: FY 2021-30
BCT 2021-30 TDP Annual Update | Financial Plan: 2021-30 39
Table 5-2: Transit Capital Financial Plan: 2026-30
Capital Plan Element 2026 2027 2028 2029 2030 10 -Year Total
Capital Costs
Bus and Vehicle Acquisition/Replacement/Maintenance Program 32,204,141$ 43,313,553$ 30,921,849$ 24,262,062$ 24,044,759$ 313,430,532$
Infrastructure Improvement/Maintenance Programs 724,275 831,876 639,704 747,768 656,073 7,036,722
Security Program 546,440 562,833 579,718 597,110 615,023 5,448,237
Information Technology Program 2,446,406 2,609,600 2,795,651 2,856,700 3,147,785 26,038,009
Administrative and Contractual Costs -
Non-Grant and Concurrency Projects 4,676,791 4,746,943 4,818,147 4,890,419 4,963,776 46,631,610
Paratransit Vehicles 8,771,760 4,108,160 4,005,980 4,166,219 4,332,868 49,155,531
New 30-yr. Bus Service Plan (New Vehicles) - - - - 15,261,123 15,261,123
New LRT Infrastructure 124,832,404 124,832,404 336,728,196 238,382,766 269,712,593 1,467,826,030
New LRT Vehicles 46,489,232 - 98,640,853 - - 179,550,986
New BRT/Rapid Bus Infrastructure 22,137,730 15,201,241 15,657,278 16,126,997 27,684,677 181,307,923
New BRT Vehicles - - - - - 33,000,000
New Transit Infrastructure (IT/Sec./Maint. Fac./Shelters/NTCs/P-R/Land) 36,480,924 17,130,861 17,687,797 13,781,862 14,195,318 394,823,745 Planning Studies/Passenger Surveys 2,798,236 2,882,183 2,968,649 3,057,708 3,149,439 27,556,215 Transfer to Transit Operating Fund 149,767,974 158,663,200 168,553,492 177,399,221 177,944,968 1,198,352,502 Total BCT Capital Costs 431,876,313 374,882,854 683,997,314 486,268,832 545,708,402 3,945,419,165
Capital Revenues
Transportation Surtax Revenue 353,837,166 293,672,270 527,715,527 372,914,773 401,780,986 2,962,326,598
Federal Transit Administration 28,463,641 28,463,641 28,463,640 28,463,640 28,463,640 284,636,402
Transfer from Concurrency 4,676,791 4,746,943 4,818,147 4,890,419 4,963,776 46,631,610
Non-Local Match 44,898,715 48,000,000 123,000,000 80,000,000 110,500,000 651,824,555
Total BCT Capital Revenues 431,876,313 374,882,854 683,997,314 486,268,832 545,708,402 3,945,419,165
BCT Capital Revenues Minus Capital Costs - - - - - -
Total BCT Capital Surplus/(Deficit) -$ -$ -$ -$ -$ -$
Community Shuttle 2026 2027 2028 2029 2030 10 -Year Total
Capital Costs
Community Shuttle - Existing 2,411,288 2,638,853 - 2,305,519 2,374,685 16,675,535$
Community Shuttle - New - - - - - - Total Community Shuttle Transportation Surtax Capital Costs 2,411,288 2,638,853 - 2,305,519 2,374,685 16,675,535
Capital Revenues
Transportation Surtax Revenue 2,411,288 2,638,853 - 2,305,519 2,374,685 16,675,535
Total Community Shuttle Transportation Surtax Capital Revenues 2,411,288 2,638,853 - 2,305,519 2,374,685 16,675,535
Community Shuttle Transportation Surtax Capital Revenues Minus Capital Costs - - - - - -
Total Community Shuttle Transportation Surtax Capital Surplus/(Deficit) -$ -$ -$ -$ -$ -$
Grand Total Capital Costs BCT and Community Shuttle Transportation Surtax 434,287,601$ 377,521,707$ 683,997,314$ 488,574,351$ 548,083,087$ 3,962,094,700$
Grand Total Capital Revenues BCT and Community Shuttle Transportation Surtax 434,287,601 377,521,707 683,997,314 488,574,351 548,083,087 3,962,094,700
Grand Total Capital Revenues Minus Capital Costs - - - - - -
Grand Total Capital Surplus/(Deficit) -$ -$ -$ -$ -$ -$

5 / Financial Plan: FY 2021-30
BCT 2021-30 TDP Annual Update | Financial Plan: 2021-30 40
BCT Operating Financial Plan: 2021-30 BCT’s Operating Financial Plan for 2021-30 is detailed in Table 5-3 and 5-4 below. This Financial Plan details the costs and revenues associated with the 2021-30 Implementation Plan, which was detailed in the previous Chapter (Ch. 4). Highlights of the plan include:
• Operating Costs for FY 2021-30 are approximately $2.8B. Operating investment highlights include:
o $1.6B for Existing Transit Operations o $451.4M for Paratransit Operations o $514.8M for New Bus Service (including BRT) o $62.3M for New LRT Service o $44.8M for New Transit Security o $167.5M for Community Shuttle Operations
$126.2M for Existing Community Shuttle Operations $41.3M for New Community Shuttle Operations
• Operating Revenues for FY 2021-30 are approximately $2.8B. Operating Revenue highlights
include:
o $1.2B in transportation surtax revenue o $1.1B from Existing Transit Operations revenue (including fares, advertising, State Block
Grants) o $52.7M in State Transportation Disadvantaged Program Grants for Paratransit
Operations o $56.2M in State Block Grants for new BRT and LRT service o $51.6M from All Other New Revenue (mostly from New Advertising for new services and
facilities) o $152.1M in estimated Farebox Revenue for new BRT and LRT Service o $167.5M in transportation surtax revenue for Existing and New Community Shuttle
Service Operations

5 / Financial Plan: FY 2021-30
BCT 2021-30 TDP Annual Update | Financial Plan: 2021-30 41
Table 5-3: Transit Operating Financial Plan: 2021-25
Operating Plan Element 2021 2022 2023 2024 2025
Operating Costs
Existing Transit Operations 101,764,790$ 145,038,455$ 149,389,609$ 153,404,054$ 157,538,934$
Paratransit Operations 29,602,050 36,644,581 38,880,586 41,272,626 43,831,698
New Service Plan - - 3,897,520 4,014,446 4,134,880
New Light Rail Transit (LRT) - - - 8,138,104 8,382,247
Transit Security - Operations 3,908,370 4,025,621 4,146,390 4,270,781 4,398,905
Total BCT Operating Costs 135,275,210 185,708,657 196,314,104 211,100,012 218,286,663
Operating Revenues
Transfer from Transportation Surtax Capital Fund 45,194,800 80,254,286 77,455,105 79,096,242 84,023,214
Existing Transit Operations 85,486,500 97,372,899 102,439,271 112,600,077 112,939,349
Paratransit Operations (State Transportation Disadvantaged Program Grants) 4,593,910 4,731,727 4,873,679 5,019,889 5,170,486
State Block Grants - New Bus - 2,528,145 3,012,885 3,869,809 4,681,817
State Block Grants - New LRT - - 427,975 440,814 454,038
All Other New Revenue - 821,600 3,311,240 4,118,149 4,884,076
Farebox Revenues - New Bus - - 4,793,950 4,937,769 5,085,902
Farebox Revenues - New LRT - - - 1,017,263 1,047,781
Total BCT Operating Revenues 135,275,210 185,708,657 196,314,105 211,100,012 218,286,663
BCT Operating Revenues Minus Operating Costs - - - - -
Total BCT Operating Surplus/(Deficit) -$ -$ -$ -$ -$
Community Shuttle 2021 2022 2023 2024 2025
Operating Costs
Community Shuttle - Existing 11,054,304$ 11,385,933$ 11,727,511$ 12,079,337$ 12,365,204$
Community Shuttle - New 3,603,844 3,711,960 3,823,318 3,938,018 4,056,159 Total Community Shuttle MAP Operating Costs 14,658,148 15,097,893 15,550,829 16,017,355 16,421,363 Capital Revenues
Transportaion Surtax Revenue 14,658,148 15,097,893 15,550,829 16,017,355 16,421,363
Total Community Shuttle Operating Revenues 14,658,148 15,097,893 15,550,829 16,017,355 16,421,363
Community Shuttle Operating Revenues Minus Operating Costs - - - - -
Total Community Shuttle Operating Surplus/(Deficit) -$ -$ -$ -$ -$
Grand Total Operating Costs BCT and Community Shuttle 149,933,358$ 200,806,550$ 211,864,933$ 227,117,367$ 234,708,026$
Grand Total Operating Revenues BCT and Community Shuttle 149,933,358 200,806,550 211,864,934 227,117,367 234,708,026
Grand Total Operating Revenues Minus Operating Costs - - - - -
Grand Total Operating Surplus/(Deficit) -$ -$ -$ -$ -$

5 / Financial Plan: FY 2021-30
BCT 2021-30 TDP Annual Update | Financial Plan: 2021-30 42
Table 5-4: Transit Operating Financial Plan: 2026-30
Operating Plan Element 2026 2027 2028 2029 2030 10 -Year Total
Operating Costs
Existing Transit Operations 161,797,860$ 166,651,796$ 171,651,350$ 176,800,890$ 182,104,917$ 1,566,142,654$
Paratransit Operations 46,578,665 49,551,063 52,523,664 55,678,645 56,847,897 451,411,475
New Service Plan 80,629,668 95,290,129 103,798,953 110,339,050 112,656,170 514,760,816
New Light Rail Transit (LRT) 8,633,715 8,892,726 9,159,508 9,434,293 9,632,413 62,273,007
Transit Security - Operations 4,530,872 4,666,798 4,806,802 4,951,006 5,099,536 44,805,082
Total BCT Operating Costs 302,170,780 325,052,512 341,940,277 357,203,885 366,340,933 2,639,393,033
Operating Revenues
Transfer from Transportation Surtax Capital Fund 149,767,974 158,663,200 168,553,492 177,399,221 177,944,968 1,198,352,502
Existing Transit Operations 116,327,529 119,817,355 123,411,876 127,114,232 130,927,659 1,128,436,745
Paratransit Operations (State Transportation Disadvantaged Program Grants) 5,325,601 5,485,369 5,649,930 5,819,428 5,994,011 52,664,030
State Block Grants - New Bus 5,240,927 6,193,858 6,746,932 7,172,039 7,972,595 47,419,007
State Block Grants - New LRT 467,660 1,679,737 1,730,130 1,782,033 1,835,494 8,817,881
All Other New Revenue 5,417,051 7,419,947 7,981,552 8,426,566 9,219,729 51,599,910
Farebox Revenues - New Bus 18,544,824 21,916,730 23,873,759 25,377,982 28,210,722 132,741,638
Farebox Revenues - New LRT 1,079,214 3,876,316 3,992,606 4,112,384 4,235,756 19,361,320
Total BCT Operating Revenues 302,170,780 325,052,512 341,940,276 357,203,885 366,340,933 2,639,393,033
BCT Operating Revenues Minus Operating Costs - - - - - -
Total BCT Operating Surplus/(Deficit) -$ -$ -$ -$ -$ -$
Community Shuttle 2026 2027 2028 2029 2030 10 -Year Total
Operating Costs
Community Shuttle - Existing 12,736,160$ 13,118,245$ 13,511,792$ 13,917,146$ 14,334,660$ 126,230,293
Community Shuttle - New 4,177,844 4,303,179 4,432,274 4,565,243 4,702,200 41,314,039
Total Community Shuttle MAP Operating Costs 16,914,004 17,421,424 17,944,067 18,482,389 19,036,860 167,544,332 Capital Revenues
Transportaion Surtax Revenue 16,914,004 17,421,424 17,944,067 18,482,389 19,036,860 167,544,332
Total Community Shuttle Operating Revenues 16,914,004 17,421,424 17,944,067 18,482,389 19,036,860 167,544,332
Community Shuttle Operating Revenues Minus Operating Costs - - - - - -
Total Community Shuttle Operating Surplus/(Deficit) -$ -$ -$ -$ -$ -$
Grand Total Operating Costs BCT and Community Shuttle 319,084,784$ 342,473,936$ 359,884,344$ 375,686,273$ 385,377,794$ 2,806,937,365$
Grand Total Operating Revenues BCT and Community Shuttle 319,084,784 342,473,936 359,884,343 375,686,274 385,377,793 2,806,937,365
Grand Total Operating Revenues Minus Operating Costs - - - - - -
Grand Total Operating Surplus/(Deficit) -$ -$ -$ -$ -$ -$

APPENDIX A

(This page intentionally left blank.)
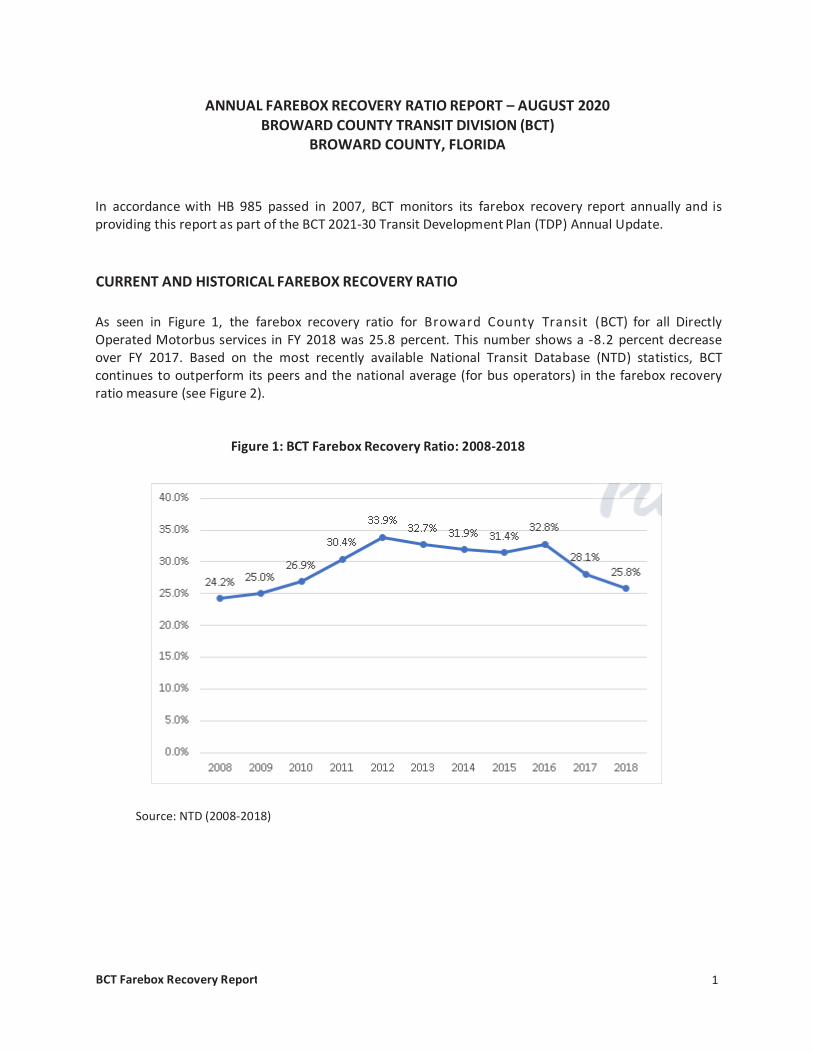
BCT Farebox Recovery Report 1
ANNUAL FAREBOX RECOVERY RATIO REPORT – AUGUST 2020 BROWARD COUNTY TRANSIT DIVISION (BCT)
BROWARD COUNTY, FLORIDA
In accordance with HB 985 passed in 2007, BCT monitors its farebox recovery report annually and is providing this report as part of the BCT 2021-30 Transit Development Plan (TDP) Annual Update.
CURRENT AND HISTORICAL FAREBOX RECOVERY RATIO
As seen in Figure 1, the farebox recovery ratio for Broward County Transit (BCT) for all Directly Operated Motorbus services in FY 2018 was 25.8 percent. This number shows a -8.2 percent decrease over FY 2017. Based on the most recently available National Transit Database (NTD) statistics, BCT continues to outperform its peers and the national average (for bus operators) in the farebox recovery ratio measure (see Figure 2).
Figure 1: BCT Farebox Recovery Ratio: 2008-2018
Source: NTD (2008-2018)

BCT Farebox Recovery Report 2
Figure 2: Peer Agency Farebox Recovery
Source: NTD, 2018 (latest NTD data set available for BCT’s Peer agencies). Table 1 provides an overview of the year-to-year percent change in farebox recovery. Between 2008 and 2018, overall farebox recovery appears to be trending downward overall. The decline for 2013-15 was due to additional O&M expenditures from Board-approved service enhancements combined with fare increases. Declines in FY 2017 & FY 2018 are attributed to system-wide ridership decline. It is key to note that the ridership decline for those years were felt across the country in all transit systems.
Table 1: BCT Farebox Recovery Ratio Trends (FY 2008-2018)
FY Farebox Recovery Change from Previous Year 2008 24.2% - 2009 25.0% 3.3% 2010 26.9% 7.6% 2011 30.4% 13.0% 2012 33.9% 11.5% 2013 32.7% -3.5% 2014 31.9% -2.4% 2015 31.4% -1.6% 2016 32.8% 4.5%

BCT Farebox Recovery Report 3
2017 28.1% -14.3% 2018 25.8% -8.2%
Source: NTD MB Data for BCT (2008-2018)

BCT Farebox Recovery Report 4
PRIOR YEAR FARE STUDIES AND CHANGES From April 1995 to October 2007, a one-way fare ticket on BCT remained at $1.00. Between October 2007 and October 2010, the cost of a one-way fare was increased to $1.75. The increase was in response to the weakening economy, rise in fuel/O&M costs, and preference from our riders to increase fares in lieu of additional service cuts. In November 2014, the first step in a two-step fare increase was implemented. The second step of fare increases went into effect October 1, 2015 which increased the cost of a one-way fare to $2.00. In January 2010, BCT began operation of its I-95 express service between Broward County and Downtown Miami, with a cost of $2.35 one-way and $85.00 for a monthly pass. Premium Express fares increased in November 2014 to $2.65 one-way and $95.00 for a monthly pass. In January 1991, BCT began offering paratransit services starting at $1.00 per trip. Currently, Paratransit service is offered at $3.50 per trip. After extensive outreach, budgetary review, and analysis of Title VI impacts to low-income and minority passengers, the Broward County Board of County Commissioners (BOCC) approved a new 3-day pass as an additional fare option. The 3-Day Pass went into effect on July 1, 2016 and can be purchased for $12. The pass allows for unlimited rides during any three (3) consecutive transit service days.
As of August 2019, BCT’s one-way fare remains $2.00. Currently, BCT offers multiple transit pass options for its riders, which include an unlimited daily pass for $5, an unlimited 7-Day pass for $20, a 10-Ride pass for $20, and a 31-Day unlimited pass for $70. Table 2 displays all current fares. Table 3 displays all mobile fares.
Table 2: BCT Current Fare Structure: FY 2019
Source: BCT (FY 2019)
Fare Type Current Cost NotesOne-way Cash Fare $2.00 ….......3-Day Bus Pass $12.00 Unlimited rides for 3 consecutive days.7-Day Bus Pass $20.00 Unlimited rides for 7 consecutive days.10-Ride Bus Pass $20.00 Expires after the 10th ride is taken.All-Day Pass $5.00 Unlimited rides all day on BCT fixed routes.31-Day Adult Bus Pass $70.00 Unlimited rides for 31 consecutive days.Premium Express one-way cash fare $2.65 ….......Premium Express 10-Ride Bus Pass $26.50 ….......Premium Express 31-Day Bus Pass $95.00 ..........
Fare Type Current Cost NotesOne-Way Cash Fare Reduced $1.00All-Day Bus Pass Reduced $4.0031-Day Bus Pass Reduced $40.00
Premium Express One-Way Cash Fare Reduced
$1.30
Fare Type Current Cost NotesOne-Way Cash Fare Reduced $1.00 ..........All-Day Bus Pass Reduced $4.00 ..........31-Day Bus pass Reduced $40.00 ..........Premium Express One-Way Cash Fare Reduced $1.30 ..........
Fare Type Current Cost Notes31-Day College Bus Pass $50.00 ..........
Adult Fares
Senior, Medicare, and Disability Fares
Senior Fares - 65 and older, proof of age required.
Medicare or Disability Fares - Proof of disability required.
Youth Fares
College Bus Pass

BCT Farebox Recovery Report 5
Table 3: BCT Current Mobile Fare Structure: FY 2019
Source: BCT (FY 2019)
SCHEDULED FARE CHANGES No fare changes occurred in FY 2020. There are no fare changes scheduled for FY 2021. However, BCT is considering hiring a consultant for a fare study in FY21.
STRATEGIES THAT WILL AFFECT THE FAREBOX RECOVERY RATIO
The 2021-2030 TDP update identifies strategies that will be used to maintain a high farebox recovery ratio, including the following:
• Continued optimization of mobile device ticketing and payment app/system in FY 2021. • Monitor key performance measures for individual fixed routes. • Ensure that BCT serves major activity centers, potentially increasing the effectiveness of service. • Increase ridership through enhanced marketing and community relations activities, including with

BCT Farebox Recovery Report 6
major employers, schools, and homeowner associations. • Minimize costs required to operate and administer BCT services. • Determine the most cost-effective service type on all major corridors given demand, routings, and
coverage areas. • Increase ridership by improving and/or increasing the use of technology to enhance the passenger
experience. This includes possible autonomous vehicles. • Increase ridership by offering more services and new services; i.e. Micro-Transit.
**Please note: It is expected that the effects of the pandemic will have some effects in BCT’s overall efficiency until public confidence has been restored and ridership increases. As will be noted in another section in this update, BCT stopped collecting fares in response to safety concerns surrounding the pandemic in March 2020. For the foreseeable future, this policy will remain in place. In addition, the drop in ridership and high unemployment rates will also negatively affect some efficiencies for BCT. BCT has temporarily suspended the collection of fares to reduce crowding at the farebox to limit the exposure of COVID-19 to its bus operators. Customers are asked to use the rear door of the bus to get on or off.

(This page intentionally left blank.)