Transit Asset Management (TAM) Final Rule... · Transit Asset Management (TAM) ... Current Annual...
59
Updated 11/18/16 Transit Asset Management (TAM) Final Rule July/August 2016 Presenter: Mshadoni Smith
Transcript of Transit Asset Management (TAM) Final Rule... · Transit Asset Management (TAM) ... Current Annual...

Updated 11/18/16
Transit Asset Management (TAM)
Final Rule July/August 2016
Presenter: Mshadoni Smith

Today’s Presentation • Transit Asset Management Background • Final Rule Provisions • Implementation • Technical
Assistance
2

What is Transit Asset Management?
Transit Asset Management (TAM) is a business model that uses the condition of assets to guide the optimal prioritization of funding at transit properties in order to keep our transit networks in a State of Good Repair (SGR).
Transit Asset Management Background • • • • • • • • 4

Current Backlog ($85.9 B)Current Annual
SGR Investment
($10.3 B)
$0
$20
$40
$60
$80
$100
$120
$140
$160
$180
$200
2030
Sta
teof
Goo
dR
epai
r B
ackl
og
(Bill
ions
in 2
010
Dol
lars
)
$0
$20
$40
$60
$80
$100
$120
$140
$160
$180
$200
2030
Sta
te o
f Goo
d R
epai
r B
ackl
og
(Bill
ions
in 2
010
Dol
lars
)
Current Backlog ($85.9 B)
$8$8 $10$10 $12$12 $14$14 $16$16 $18$18 $20$20
AAnnnnuualal ExpExpeennddiituturreess forfor PPrreesseerrvativationon ((BBillioillionnss inin 2010 D2010 Dololllararss))
Transit Asset Management: Background
Transit Asset Management Background • • • • • • • • 4

$0
$20
$40
$60
$80
$100
$120
$140
$160
$180
$200
2030
Sta
te o
f Goo
d R
epai
r B
ackl
og
(Bill
ions
in 2
010
Dol
lars
)
Current Backlog ($85.9 B) Current Annual
SGR Investment
($10.3 B)
Backlog in 2030
$8 $10 $12 $14 $16 $18 $20
Annual Expenditures for Preservation (Billions in 2010 Dollars)
Transit Asset Management: Background
Transit Asset Management Background • • • • • • • • 5

$0
$20
$40
$60
$80
$100
$120
$140
$160
$180
$200
2030
Sta
te o
f Goo
d R
epai
r B
ackl
og
(Bill
ions
in 2
010
Dol
lars
)
Current Backlog ($85.9 B) Current Annual
SGR Investment
($10.3 B)
Backlog in 2030
Maintain Backlog ($12.7 B)
$8 $10 $12 $14 $16 $18 $20
Annual Expenditures for Preservation (Billions in 2010 Dollars)
Transit Asset Management: Background
Transit Asset Management Background • • • • • • • • 6

$0
$20
$40
$60
$80
$100
$120
$140
$160
$180
$200
2030
Sta
te o
f Goo
d R
epai
r B
ackl
og
(Bill
ions
in 2
010
Dol
lars
)
Current Backlog ($85.9 B) Current Annual
SGR Investment
($10.3 B)
Backlog in 2030
Maintain Backlog ($12.7 B)
Eliminate Backlog ($18.5 B)
$8 $10 $12 $14 $16 $18 $20
Annual Expenditures for Preservation (Billions in 2010 Dollars)
Transit Asset Management: Background
Transit Asset Management Background • • • • • • • • 7

$0
$20
$40
$60
$80
$100
$120
$140
$160
$180
$200
2030
Sta
te o
f Goo
d R
epai
r B
ackl
og
(Bill
ions
in 2
010
Dol
lars
)
Current Backlog ($85.9 B) Current Annual
SGR Investment
($10.3 B)
$8.2 billion gap Backlog in 2030
Maintain Backlog ($12.7 B)
Eliminate Backlog ($18.5 B)
$8 $10 $12 $14 $16 $18 $20
Annual Expenditures for Preservation (Billions in 2010 Dollars)
Transit Asset Management: Background
Transit Asset Management Background • • • • • • • • 8

Anticipated Benefits of TAM
1. Improved transparency and accountability
2. Optimized capital investment and maintenance decisions
3. More data-driven maintenance decisions
4. Potential safety benefits
9

MAP-21 Performance Management Framework FTA FHWA
Transit Asset Management National Public Transit Safety
Plan Public Transportation Agency
Safety Plan
Safety Performance Pavement and Bridge
Condition System Performance & CMAQ Highway Safety Improvement
Program Highway Asset Management
Plan Statewide and Metropolitan Planning
Transit Asset Management Background • • • • • • • • 10

11Transit Asset Management Background • • • • • • • •
Linking Proposed Regulations Public Transportation Agency Safety
SMS Hazard Identification/Risk
Assessment
Establish Safety Targets
Hazard, Control, and Monitoring Strategy
Public Transportation Agency Safety Plan
Transit Asset Management
Submit Annual Report
Asset Inventory/ Condition Assessment
Establish SGR Targets
Transit Asset Management Plan
Prioritize Investments/ Program of Projects
Program Formula Funds
Transportation Planning
MPO and State Performance Targets
Integrate Performance -Based Plans
Metropolitan and Statewide Long -Range
Plans
Adopt TIP/STIP
1111
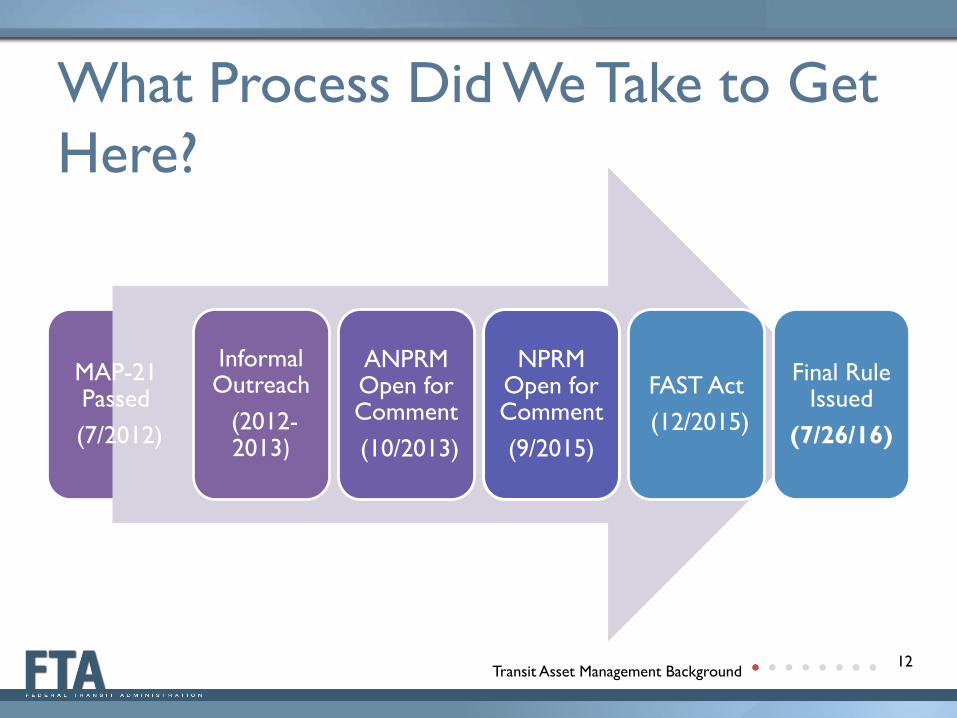
What Process Did We Take to Get Here?
MAP-21 Passed (7/2012)
Informal Outreach
(2012-2013)
ANPRM Open for Comment (10/2013)
NPRM Open for Comment (9/2015)
FAST Act (12/2015)
Final R ule Issued
(7/26/16)
Transit Asset Management Background • • • • • • • • 12
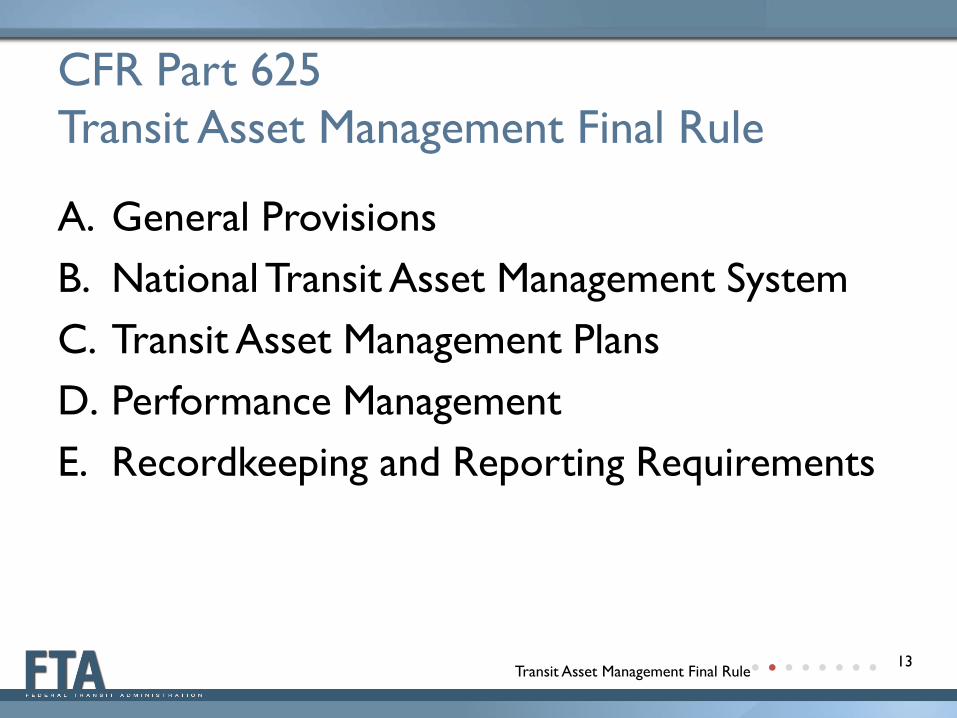
CFR Part 625 Transit Asset Management Final Rule
A. General Provisions B. National Transit Asset Management System C. Transit Asset Management Plans D. Performance Management E. Recordkeeping and Reporting Requirements
Transit Asset Management Final Rule• • • • • • • • 13

Changes from NPRM to Final Rule Δ
• Definitions Tier II Provider
• Asset Tracking Equipment Third party assets
• 5310 Applicability • Group Plans • Performance Targets
Transit Asset Management Final Rule• • • • • • • • 14

A. General Pr ovisions
Final Rule: General Provisions • • • • • • • • 15

A. General Pr ovisions Δ
• Purpose To help achieve and maintain a state of good repair
for the nation’s public transportation systems
• Applicability All recipients or subrecipients of Federal financial
assistance under 49 U.S.C. Chapter 53 that own, operate, or manage capital assets used in the provision of public transportation
• Definitions
Final Rule: General Provisions • • • • • • • • 16

The term "public transportation" is defined at 49 U.S.C. 5302 and means regular, continuing shared-ride surface transportation services that are open to the general public or o pen to a segment of th e general public defined by age, disability, or low income.
Definition of ‘Public Transportation’ Δ
Final Rule: General Provisions • • • • • • • • 17

B. National Transit Asset Management System
Final Rule: National Transit Asset Management System • • • • • • • • 18

National Transit Asset Management System
Define state of good repair
Require TAM Plans for all recipients and sub-recipients
Establish SGR performancemeasures
Report data to the NTD
Receivetechnical assistancfrom FTA
e
Final Rule: National Transit Asset Management System • • • • • • • • 19
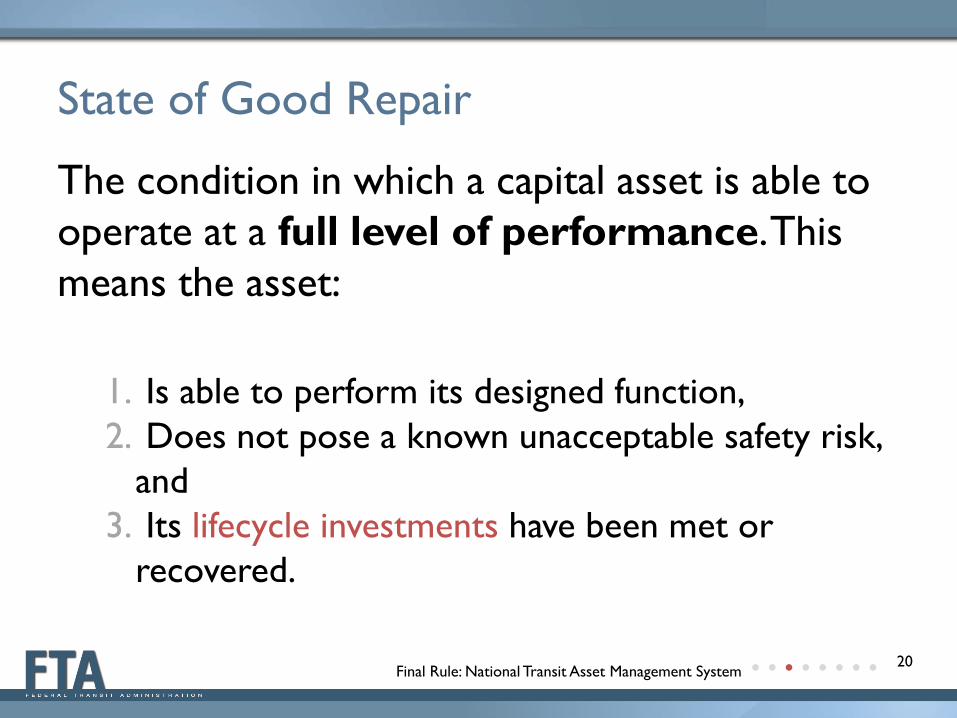
State of Good Repair
The condition in which a capital asset is able to operate at a full level of performance.This means the asset:
1. Is able to perform its designed function, 2. Does not pose a known unacceptable safety risk,
and 3. Its lifecycle investments have been met or
recovered.
Final Rule: National Transit Asset Management System • • • • • • • • 20

TAM and State of Good Repair
• The purpose of the National TAM System is to keep our Nation’s assets in a State of Good Repair (SGR)
• Consequences of not being in a S GR include: • Safety risks, • Decreased system reliability, • Higher maintenance costs, and • Lower system performance
Final Rule: National Transit Asset Management System • • • • • • • • 21

C.Transit Asset Management Plans
Final Rule:Transit Asset Management Plans • • • • • • • • 22

ΔApplicability – Tier I or Tier II
Tier
Operates Rail OR
≥ 101 vehicles across all fixed route modes
OR ≥ 101 vehicles in one non-fixed route mode
Tier
Sub-recipient of 5311 Funds
OR
American Indian Tribe
OR ≤ 100 vehicles across all fixed route modes
OR ≤ 100 vehicles in one non-fixed route mode
23

Responsibility for TAM Plan Development Δ • Each transit provider must designate an
Accountable Executive • Plan Coordination A Tier I provider must develop its own TAM Plan
A Tier II provider may participate in a single Group Plan or opt out and develop its own TAM Plan A Group Plan participant must collaborate with the
sponsor in the development of the plan
• Eligible activity under §5337, §5307 & §5311
Final Rule:Transit Asset Management Plans • • • • • • • • 24

Group Plans Δ
• Group Plans compiled by a sponsor – Generally the State DOT or Designated/Direct
Recipient – Sponsor is not the Accountable Executive for its
Group TAM Plan participants – Small urban operators (5307 Recipients) are not
required to be offered a group plan but CAN be based on mutual agreement between sponsor and operator.
Final Rule:Transit Asset Management Plans • • • • • • • • 25

TAM Plan Elements
Tier I only
All Providers (Tier I & II)
1. Inventory of Capital Assets 2. Condition Assessment 3. Decision Support Tools 4. Investment Prioritization 5. TAM and SGR Policy 6. Implementation Strategy 7. List of Key Annual Activities 8. Identification of Resources 9. Evaluation Plan
Final Rule:Transit Asset Management Plans • • • • • • • • 26

1. Inventory of Capital Assets Δ
• A listing of all capital assets: Owned by the transit provider Equipment: Non service vehicles & equipment > $50,000
Include third-party exclusive-use non-equipment Level of detail is same as in Capital Program of
Projects
• May use existing inventories already collected E.g., existing rolling stock and equipment reports
• Include assets acquired without FTA funds Final Rule:Transit Asset Management Plans • • • • • • • • 27

Category Class
Equipment Construction Service Vehicles
Maintenance
Rolling Stock Railcars Buses Other Passenger Vehicles
Ferries
Infrastructure Fixed Guideway Signal Systems Structures
Power
Facilities Support Facilities Passenger Facilities
Parking Facilities
Examples of Asset Categories and Classes Δ
Final Rule:Transit Asset Management Plans • • • • • • • • 28

2. Condition Assessment Δ
• A rating of the inventoried assets E.g., age; good/fair/poor; percentage of residual life
• Ratings should be sufficiently detailed to monitor performance and plan capital investment
• Condition assessments may be collected at the individual or asset class level
• Condition assessments may include vulnerabilities to natural/climate hazards
• Condition assessments are only required for assets withdirect capital responsibility
Final Rule:Transit Asset Management Plans • • • • • • • • 29

Category Asset Inventory Assessing Condition
Equipment All non-revenue service vehicles
and equipment > $50K used in the provision of public transit, except
3rd-party equipment assets
Only equipment with direct capital responsibility,
no third party assets
Rolling Stock All revenue vehicles used in the provision of public transit
Only revenue vehicles with direct capital responsibility
Infrastructure All infrastructure used in
the provision of public transit Only infrastructure with
direct capital responsibility
Facilities All facilities used in the
provision of public transit (excluding bus shelters)
Only facilities with direct capital responsibility
(excluding bus shelters)
Assessing Condition by Asset Class
Final Rule:Transit Asset Management Plans • • • • • • • • 30
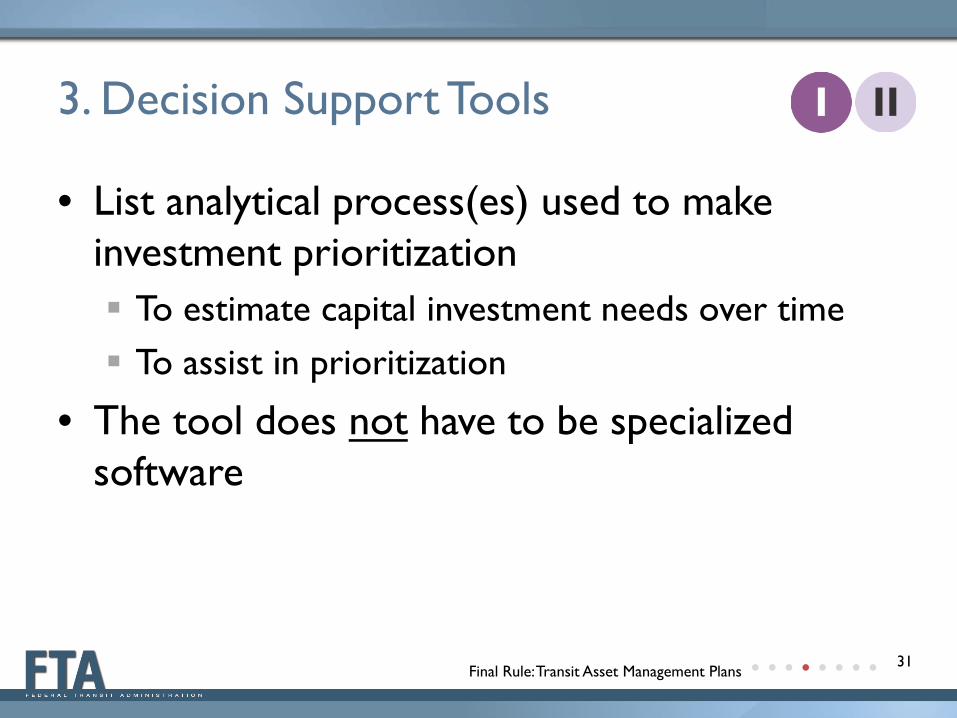
3. Decision Support Tools
• List analytical process(es) used to make investment prioritization To estimate capital investment needs over time To assist in prioritization
• The tool does not have to be specialized software
Final Rule:Transit Asset Management Plans • • • • • • • • 31

4. Investment Prioritization
• A ranked listing of proposed projects and programs ordered by year of planned implementation
• Prioritization locally determined based on policy and need
• Must adequately consider Identified unacceptable safety risks Accessibility requirements
• Fiscally constrained based on estimated funding levels
Final Rule:Transit Asset Management Plans • • • • • • • • 30

5.TAM and SGR Policy
• Transit provider’s vision • Executive-level direction to support
the goals of the TAM program • Documented commitment to
achieving SGR Specific Measurable Attainable Relevant Temporally constrained
• Defined TAM objectives • Defined and assigned roles an d
responsibilities Final Rule:Transit Asset Management Plans • • • • • • • • 33

6. Implementation Strategy • Operational level process for
implementing TAM Plan
7. List of Key Annual Activities • Description of actions needed to
implement TAM Plan for each year of the plan’s horizon E.g., software development,
coordination between maintenance and finance offices
Final Rule:Transit Asset Management Plans • • • • • • • • 34

8. Identification of Resources • E.g., staff time, technology requirements,
funding, etc.
9. Evaluation Plan • How TAM activities will be monitored,
evaluated, and updated to ensure the continuous improvement of TAM practices
Final Rule:Transit Asset Management Plans • • • • • • • • 35

TAM Plan Timeframes
• Plans would be updated in their entirety at least every 4 years Coincide with relevant (Statewide) Transportation
Improvement Program Cover at least 4 years Should be amended during the horizon period
when there is a significant change
• Initial TAM Plans completed no later than 2 years after effective date (October 2018)
Final Rule:Transit Asset Management Plans • • • • • • • • 36
D. Performance Management
Final Rule: Performance Management • • • • • • • • 37

Category Assessing Condition Performance Targets Measure
Equipment Age based Only non-revenue service vehicles %
Rolling Stock Age based Only revenue vehicles by vehicle class/mode
%
Infrastructure
Facilities
Only infrastructure with direct capital responsibility
Only facilities with direct capital
responsibility (not bus shelters)
Only fixed rail guideway, track, signals,
and systems
Maintenance and Administrative and
Passenger Stations and Parking Facilities
%
TERM
Analyzing Assets
Final Rule: Performance Management • • • • • • • • 38

Targets for Performance Measures
• Set targets annually for each asset class • Supported by data Most recent condition data Reasonable financial projections
• Targets for Group Plans apply to the group as a whole
• Reported annually to National Transit Database (NTD) www.transit.dot.gov/ntd/ntd-asset-inventory-
modules-and-information Final Rule: Performance Management • • • • • • • • 39

Useful Life Benchmark (ULB)
• ULB ≠ Useful life for FTA grant programs • Useful Life Benchmark is defined as the expected
lifecycle of a capital asset for a particular Transit Provider’s operating environment, or the acceptable period of use in service for a particular Transit Provider’s operating environment.
• ULB takes into account a provider’s unique operating environment (i.e., geography, service frequency, etc.)
• There are default ULB values, but agencies are welcome to develop their own
Final Rule: Performance Management • • • • • • • • 40

Revenue Vehicle Type Default Useful
Life Benchmark
Useful Life in Grant Programs
Automated Guideway Vehicle (AG) 31 12
Bus (BU) 14 12
Cutaway Bus (CU) 10 10
Ferryboat (FB) 42 25
Heavy Rail Passenger Car (HR) 31 30
Light Rail Vehicle (LR) 31 25
Commuter Rail Locomotive (RL) 39 30
Trolleybus (TB) 14 12
Van (VN) 8 7
Sample Default ULBs
Final Rule: Performance Management • • • • • • • • 41

Performance Measures • Equipment Age Percentage of vehicles that have met or exceeded their Useful
Life Benchmark (ULB) • Rolling Stock Age Percentage of revenue vehicles within a particular asset class
that have met or exceeded their ULB • Infrastructure Performance Percentage of track segments with performance restrictions
by class • Facilities Condition Percentage of facilities with a condition rating below 3.0 on
the FTA Transit Economic Requirements Model (TERM) scale (1=Poor to 5=Excellent)
Final Rule: Performance Management • • • • • • • • 42

E. Recordkeeping and Reporting Requirements Including the role of th e National Transit Database
Final Rule: Recordkeeping and Reporting Requirements • • • • • • • • 43
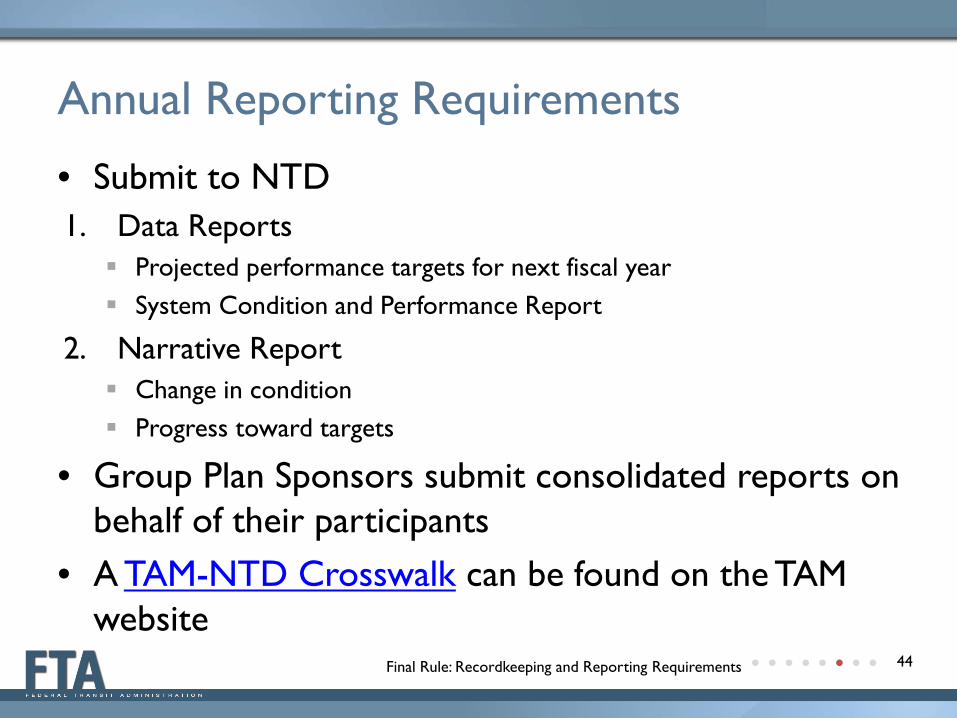
Annual Reporting Requirements
• Submit to NTD 1. Data Reports Projected performance targets for next fiscal year System Condition and Performance Report
2. Narrative Report Change in condition Progress toward targets
• Group Plan Sponsors submit consolidated reports on behalf of their participants
• A TAM-NTD Crosswalk can be found on the TAM website
Final Rule: Recordkeeping and Reporting Requirements • • • • • • • • 44

https://www.transit.dot.gov/ntd/ntd-asset-inventory-modules-and-information
ΔNational Transit Database Webpage
Asset Module Reporting Template
Final Rule: Recordkeeping and Reporting Requirements • • • • • • • • 45

Recordkeeping Requirements
• Maintain records supporting TAM Plan • Share with State and metropolitan planning
organization (MPO) planning agencies TAM Plan Performance targets Investment strategies Annual condition assessments
Final Rule: Recordkeeping and Reporting Requirements • • • • • • • • 46

Certification • TAM Plans are Self-Certified by the
Accountable Executive
• FTA will update Certifications and Assurances to reflect TAM Plan requirements
• FTA will review Plans and Progress during Triennial and State Management Reviews, as well as during MPO Certification Reviews
Final Rule: Recordkeeping and Reporting Requirements • • • • • • • • 47
Implementation
Implementation • • • • • • • • 48
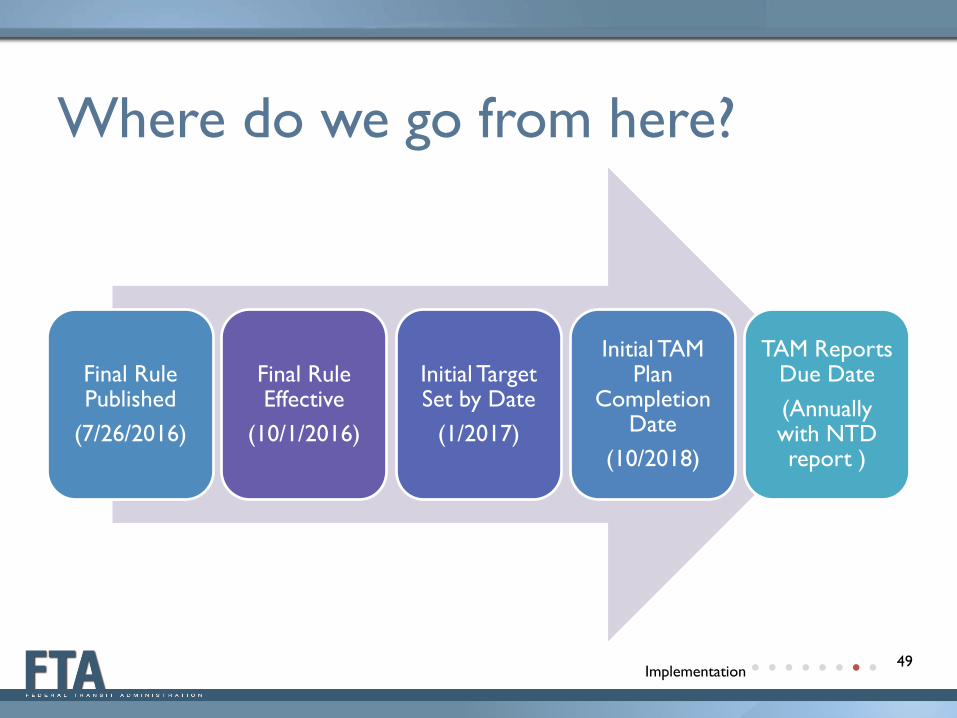
Where do we go from here?
Final Rule Published
(7/26/2016)
Final Rule Effective
(10/1/2016)
Initial Target Set by Date
(1/2017)
Initial TAM Plan
Completion Date
(10/2018)
TAM Reports Due D ate (Annually with NTD report )
Implementation • • • • • • • • 49

Activity Initial Due Date Ongoing Submittal Frequency
Final Rule Effective Date October 1, 2016 n/a
SGR Targets Set by 1/31/17 (do not need to be reported to NTD)
Annually within 4 months of end of provider’s FY as part of NTD Report
TAM Plan October 1, 2018 Every 4 years
Asset Inventory and Condition Reporting
Within 4 months of end of provider’s FY 2018
As part of NTD Report
Narrative Report Within 4 months of end of provider’s FY 2019
Annually within 4 months of end of provider’s FY
TAM Timelines Items in blue Submitted to NTD
Implementation • • • • • • • • 50

TAM Plan Example
What type of TAM plan do I need to develop?
1. Is this rule applicable to me? 2. Am I Tier I or Tier II? 3. Can I participate in a Group Plan?
Implementation • • • • • • • • 51

TAM Plan Example
1. Inventory Capital Assets
Six 30-foot buses 2. Assess Condition Age/ULB:
Bus Bus 1 Bus 2 Bus 3 Bus 4 Bus 5 Bus 6 Age 17 15 15 7 7 2
ULB 12
3 of 6 buses are below the useful life benchmark
Implementation • • • • • • • • 52

TAM Plan Example
3. Decision Support Tools Criteria Weight Bus 1 Bus 2 Bus 3 Bus 4 Bus 5 Bus 6 Poses safety risk (0-5) 8 5 0 1 2 4 0 Age (years) .5 17 15 15 7 7 Poor reliability (0-5) 5 2 3 3 4 2 1
4. Investment Prioritization
Poor appearance (0-5) 1 1 3 2 4 2 1 Totals 59.5 25.5 32.5 43.5 47.5 7
Score ≥ 50………. Replace this year 30 ≤ Score < 50… Replace in year 3 Score < 30………. No immediate remedial action
Implementation • • • • • • • • 53
2

TAM Plan Example
5. TAM and SGR Policy “We have 2 objectives: To ensure all vehicles are no more than
6 months behind in deferred maintenance
Zero transit deaths
Roles & Responsibilities: Chief of Maintenance – keeps asset
condition inventory up to date
Chief Financial Officer – provides cost estimates for …
Implementation • • • • • • • •
I, the accountable executive, am committed to achieving a state of good repair. Our agency’s goal is …
54

Budget Analyst
Operations Analyst
Director
General Manager
Planner
TAM Plan Example
6. Implementation Strategy
7. Key TAM Activities
1. Link asset inventory to decision support tool (Due: May)
2. Improve coordination between maintenance and finance staff (meet quarterly)
Implementation • • • • • • • • 55

Timelines Goals
Evaluation Plan
Milestones Tracking
Challenge Mitigation
TAM Plan Example
8. Identify Resources Finance Planning Operations
Staff needs .25 FTE .5 FTE .25 FTE
Total $25K $15K $20K
Total = $60K
9. Develop Evaluation Plan
Implementation • • • • • • • • 56

ULB Bus 1 Bus 2
Bus 3
Bus 4
Bus 5
Bus 6
Bus 7
Exceed ULB
Year 1 12 17 15 15 7 7 2 50% Year 2 12 retired 16 16 8 8 3 1 33%
Reporting Requirements
Performance Measures and Targets a) Calculate condition information b) Set targets for next fiscal year
35% of 30-foot buses will exceed the 12-year ULB.
Implementation • • • • • • • • 57

Technical Assistance from FTA
TCRP Products
Training & Webinars
TAM News & Noteworthy
Practices
Facility Condition &
Rail Guideway
Guidebooks
Transit Asset Management
Guide
Asset Inventory
Development & Integration
Guide
TERM-Lite
Small Provider
Guide and Template
https://www.transit.dot.gov/TAM Technical Assistance • • • • • • • • 58

Next Steps
• Draft condition guidebooks available and open for comment
• Next webinars: Guidebooks Aug. 11th and NTD Asset Inventory Aug. 16th 2pm EDT
• If you have questions, where do you go? Website: www.transit.dot.gov/TAM Regional Staff Mshadoni Smith
[email protected] 202-366-1651 Next Steps • • • • • • • • 59